
Submitted:
08 August 2025
Posted:
11 August 2025
You are already at the latest version
Abstract
This study evaluated the effects of two therapeutic approaches using a Bovine Collagen Matrix (BCM) and an innovative Amniotic Membrane Dressing (hAM-pe) in wound healing, integrating both clinical and mechanistic perspectives. Both treatments are collagen-based biomaterials, which play a crucial role in modulating the wound mi-croenvironment, supporting cellular adhesion, and delivering bioactive molecules. While collagen-based therapies have been extensively studied in vitro and in small animal models, clinical translation remains limited. This study’s approach involved the simul-taneous application of both treatments within a single patient, allowing a direct com-parison of therapeutic outcomes.
Clinically, hAM-pe demonstrated superior outcomes, accelerating wound closure, re-ducing inflammation, and eliminating the need for surgical intervention. Its practical advantages, including ease of application in outpatient settings, further enhance its translational potential. Mechanistically, hAM-pe treatment was associated with reduced expression of inflammatory markers (IL-1β, TNF-α, and CXCL-10), enhanced vascular-ization (VEGF, CD34), and a shift toward a regenerative macrophage phenotype (Ar-ginase-1 expression). Conversely, BCM treatment led to prolonged inflammation, de-layed tissue remodeling, and an adverse granulomatous response.
These findings underscore the potential of hAM-pe as an alternative, non-invasive therapy for chronic wounds. Further investigations into its immunoregulatory mecha-nisms, particularly its influence on macrophage subsets and extracellular matrix re-modeling, will provide valuable insights for optimizing regenerative wound care strategies.
Keywords:
amniotic membrane dressings
; wound healing
; collagen
; immunomodulation
; angiogenesis
1. Introduction
The skin is a multilayered organ that defines the body’s boundaries and constantly interacts with microorganisms and external factors. It is composed of the epidermis, a stratified squamous epithelium, which provides a barrier to traumatic external penetration; the dermis, a connective tissue matrix that helps keep the skin elastic and resistant to deformation; and the hypodermis or subcutaneous tissues, that provides insulation and cushioning. Its integrity and functionality are essential for maintaining body homeostasis.
Skin wounds, meant as damage or disruption of the organ, activate immediate repair mechanisms aimed at restoring the skin’s structure and function [1,2]. Human wound healing is a complex and highly efficient process that involves the interaction and coordination of multiple cell types and biochemical and physiological events during the sequential wound-healing steps: hemostasis, inflammation, angiogenesis, cell growth and proliferation and remodeling. In response to tissue damage, the initial intervening macrophages typically display an M1 inflammatory phenotype releasing proinflammatory factors which trigger antimicrobial mechanisms. In chronic wounds, the healing process is disturbed by factors such as infection, hypoxia, necrosis and excessive levels of inflammatory cytokine secretion, that prolong one or more of the stages, leading to a continuous state of inflammation in the wound. This, in turn, perpetuates a non-healing state, with sustained polarization toward an M1 phenotype being a key factor driving the development of chronic wounds [3].
During wound repair, granulation tissue, a premature form of scar tissue, serves to protect the underlying structures [4,5]. The outcome can be either scar formation or tissue regeneration [6]. Scar formation involves rapid extracellular matrix (ECM) deposition during the proliferative phase, primarily driven by fibroblasts, which may result in a less functional seal. In sharp contrast, tissue regeneration occurs over a longer period, requiring not only ECM deposition but also the remodeling of tissue architecture, a process guided by M2 macrophages with an anti-inflammatory and tissue regenerative profile.
Collagen is a structural component of many tissues and organs, including skin. Fibrillar collagen in the dermis contributes to the skin’s elasticity and mechanical strength. It also serves as a natural substrate for cellular proliferation, attachment, and differentiation, and plays a key role in angiogenesis and epithelialization during the later stages of the healing process, ensuring tissue integrity and strength. The type, quantity, and organization of collagen fibers are crucial in wound healing, ultimately determining the tensile strength of the resulting scar. Fibrotic tissue exhibits an increased presence of type III collagen. Collagen fiber ratio can provide information not only about its strength but also about its influence as a stimulus for other regenerative pathways [7].
In the Western hemisphere, an estimated number of 100 million patients develop scars each year. Scarring represents a pressing clinical-medical challenge and a significant economic burden to the global healthcare system. The management of complex wounds, particularly in Latin America, poses a significant economic burden, with rising costs due to prolonged treatment and the need for specialized care [8]. In addition, to date, the underlying pathomechanisms of scar formation are only fragmentarily understood, offering limited options for targeted therapies. Consequently, clinical translation is lagging, while scar patients continue to seek therapeutic remedies [9].
Numerous strategies and biomaterials have been applied to repair skin damage. The ideal material for skin restoration should be biocompatible, biodegradable and it should promote and support cell adhesion and proliferation [10]. Since 1940, the human amniotic membrane (hAM) has been widely used in wound healing and various areas of tissue engineering and regenerative medicine. The hAM has shown great potential as an ideal biomaterial due to its growth factors and biological structure, which contains appropriate microarchitecture, epithelialization stimulation capacity, antibacterial properties and low immunogenicity. There are different presentations of hAM used in the treatment of chronic ulcers. The fresh and cryopreserved forms require cold storage and their preparation needs the use of antibiotic solutions to prevent tissue contamination. The lyophilized form has several advantages: a low probability of contamination, ease of storage at room temperature without the need for freezers or liquid nitrogen and proper preservation of the tissue’s physical properties [11]. Additionally, acellular fresh hAM has also shown to improve the healing process.. This is so through the bioinductive properties of bioactive factors, proteases, cytokines and anti-inflammatory proteins, which remain after the decellularization process. The acellular membrane may also promote epithelialization while suppressing inflammation and scarring [12].
We have developed an innovative strategy employing lyophilized homogenized human amniotic membrane dressings sterilized by gamma radiation, named hAM-pe, applying it at 48–72-hour intervals. This novel approach enables a controlled and sustained delivery of biological factors inherent to hAM into wounds and the simplicity of its application facilitates its use in diverse healthcare settings, including the medical office or even within a patient’s home environment, outperforming the fresh version of hAM in these aspects.
In this study, we present a case that involves the simultaneous treatment of a large ulcer employing two different biomaterials: a commercially available bovine collagen matrix (BCM) and hAM-pe. The wound healing process under both treatments was analysed through histological evaluations and molecular biology methodologies.
2. Materials and Methods
2.1. Patient and Skin Samples
This study was approved by the Ethics Committee for Research of the Hospital El Cruce, Argentina. The patient agreed to participate in this study, as well as to have its results published, and written informed consent was obtained from him. The study has been developed in compliance with the regulations concerning current legal aspects in the Argentine Republic, adhering to requirements regarding respect for patients’ rights, and without violating any national or international ethical guidelines, as reflected in the approval by the institution's Human Research Review Committee.
A male adult patient was referred with a one-month history of fasciitis in the superolateral gluteal region, caused by an intramuscular injection. Upon admission, the patient had already had a VAC device applied for one month, with the fasciitis resolved but with a residual irregular ulcer of 60 cm2 (longest length of 11 cm and widest perpendicular width of 8 cm). A skin graft was recommended as the initial treatment approach. The patient was undergoing weekly chemotherapy for multiple myeloma. Considering the patient’s initial physical weakness and his expressed wish to forgo surgery, the medical decision was to defer skin grafting until he was deemed fit to undergo the procedure. Meanwhile, an alternative treatment strategy was proposed: while preparing part of the ulcer bed for a skin graft using a commercial BCM, Nevelia ®, a simultaneous treatment with hAM-pe was applied to another part of the wound. The BCM matrix was secured with sutures, and after 15 days, the silicone layer was removed, as recommended by the manufacturer. Biopsies for histological and molecular analyses were collected from the areas designated for each treatment using a 0.5 cm punch on day 0. After 49 days of treatment, a second set of biopsies was taken following the same procedure.
During the clinical wound healing follow-ups, photographic records were taken. Graphical comparisons employing Image J were made that enabled the closure rate estimation for each area of the ulcer.
2.2. Treatments
The BCM employed is Nevelia ®, a commercial product described as a three-dimensional porous bi-layer sterile matrix consisting of a type I, purified, stabilized, freeze-dried bovine collagen and a polyester-reinforced silicone layer acting as a pseudo-epidermis [13].
hAM-pe are obtained by homogenizing, lyophilizing and sterilizing human amniotic membranes for which extensive donor screening is performed to ensure donor suitability. Material is obtained from the placenta of mothers after cesarean delivery, following informed consent. Together with placentas, a blood sample of the mother is provided and assessed for human immunodeficiency virus (HIV), hepatitis B virus, hepatitis C virus, cytomegalovirus, human T lymphotropic virus, Treponema pallidum, Brucella spp, Trypanosoma cruzi, and Toxoplasma gondii. The placenta is placed in 4 °C sterile containers with saline solution and transported to the AMNIOS BMA Tissue Bank maintaining the cold chain using refrigerants and special containers allowing temperature control between 2 °C and 8 °C. Primary processing is done within 24 hours of the cesarean and involves manually separating the AM from the placenta under a Class 100 biological safety cabinet. The hAM is homogenized with a handheld homogenizer and transferred to circular molds of 5.5 and 6.0 cm diameter for the lyophilization process, using a BK-FD 10P lyophilizer. Then, the hAM-pe is packed inside 2 bags under a class 100 biological safety cabinet. After that, hAM-pe is sterilized through gamma radiation. The dressings were provided in circular shapes of 5.5 and 6.0 cm in diameter and 1.2±0.1 mm in thickness. All processes are carried out following Good Manufacturing Practices approved by the National Administration of Drugs, Foods and Medical Technology (ANMAT, Argentina) and AMNIOS BMA Tissue Bank approved by the National Institute for Ablation and Implant (INCUCAI, Argentina). Furthermore, control samples are sent to the microbiology service to determine the bioburden and to ensure sterilization was achieved with the range of gamma radiation employed (15-25 kGy). hAM-pe remains in quarantine until all controls are completed. If stored at room temperature and away from direct light, this hAM-pe has a shelf life of 3 years [14].
2.3. Histological Analysis
Four skin biopsies were formalin fixed, paraffinized and 5 µm cut in a microtome. The samples were provided with numerical labels, without identification regarding treatment or time.
Hematoxylin & Eosine stained sections were examined in a blind manner by a specialist in histopathology.
Samples were stained with Sirius Red according to the Picrosirius red technique [15]. Stained sections were analyzed using an Olympus BX53 microscope equipped with an Olympus DP73 camera and polarizing filters, enabling the differentiation of collagen types based on birefringence properties. Under polarized light, collagen type I was visualized red-yellow, whereas type III fibers appeared green. For quantitative analysis, ten non-overlapping regions of interest (ROIs) were selected at 20X magnification, from specific regions. ROIs were obtained either from the superficial region referred to as REGION 3 (Figure 2) or from deeper dermal layers located 50-100 µm below the surface, referred to as REGION 4 (Figure 2). Additionally, full-section scans were performed at 20X magnification to assess collagen distribution across broader tissue areas, designated as REGION 1 and 2 (Figure 2). Collagen I and III areas were quantified using the open-source software ImageJ Version: 2.14.0/1.54f, employing threshold-based segmentation and area measurements, followed by Collagen I to III ratio calculation. Statistical analysis was conducted to evaluate differences in collagen content among the defined regions. A two-way analysis of variance (ANOVA) was performed followed by Bonferroni post hoc tests for comparisons relative to the control group, assuming ɑ=0.05. Data analysis and graphical representations were carried out using GraphPad Prism software for MacOS, version 8.2.1.
CD34 immunohistochemical (IHC) staining was performed on skin biopsy sections to identify endothelial cells. Sections were deparaffinized, rehydrated, and subjected to antigen retrieval in citrate buffer (pH 6.0) at 95°C for 20 minutes. After blocking, sections were incubated with anti-CD34 antibody (Leica, 1:50) for 1 hour at room temperature, then with an HRP-conjugated secondary antibody and developed using DAB substrate. Hematoxylin counterstaining was applied before mounting. For the quantification of CD34+ area, 10 ROIs, each with an area of 0.01 mm², no deeper than 200 µm, were captured at 2X magnification. Images were processed in ImageJ, converted to 8-bit, and background-subtracted. Thresholding was applied to quantify positive IHC areas as a percentage of the total ROI area. An ANOVA followed by Tukey’s post hoc test for multiple mean comparisons (α = 0.05) was performed. Subsequently, for vessel number and diameter quantification, manual counting of CD34-positive ring-like structures, corresponding to transverse vessel sections, was performed on three of these ROIs. The area of each vessel was measured as well. Finally, to assess superficial angiogenesis, the vessel survey was repeated at 10X magnification, employing the Hot Spot technique for morphometric analysis [16]. Three 0.01 mm² ROIs were selected per biopsy within the superficial 200 µm, including only connective or granulation tissue, avoiding epithelium. An unpaired two-tailed t-test with Welch’s correction (α = 0.05) was applied to compare vascular cross-section results.
2.4. Molecular Biology Analysis
Four biopsies were maintained in RNA later at -20ºC until processed for RNA extraction. Each biopsy was homogenized using an Ultraturrax blender, in tissue lysis buffer.
RNA extraction was performed using Tiangen columns according to manufacturer instructions, followed by RNA retrotranscription with iScript kit. This step was performed 3 times to obtain at least 3 independent RT-qPCR results from each biopsy. Finally, quantitative gene expression relative to Actin levels was assessed in each biopsy using iQ BIO-RAD reaction kit under a classical 3 steps + Melting, qPCR protocol, in a CFX96 BIO-RAD RT System. PCR reactions were performed for 2 minutes at 50°C and for 10 minutes at 95°C, followed by 40 amplification cycles with 1 minute annealing/extension at 60°C and 15 seconds denaturation at 95°C. The identity of PCR amplicons was verified through melting curve analysis.
The results of this study, expressed as the Fold Increase in mRNA expression, were analyzed by comparing the threshold cycles (Ct) of specific genes relative to β-actin as the reference gene (ΔCt). The comparisons were made between biopsies obtained at initial and final time points under each treatment, or under different treatments at the same time point (ΔΔCt). The formula 2-ΔΔCt was used for Fold Increase calculation. The primer sequences are shown in Table 1 [17].
2.5. Statistical Analysis
Statistical analyses were performed using GraphPad Prism Software. Group comparisons were analyzed using two-way analysis of variance (ANOVA) followed either by Tuckey’s or Sidak’s multiple comparisons tests. Two tailed unpaired t-tests were performed to compare molecular biology results. All graphical representations show the mean and standard deviation of at least 3 independent samples. A level of p < 0.05 was considered statistically significant for all analyses. To represent the significance level (p-value) of a result, the standard representation is as follows: *: p ≤ 0.05, **: p ≤ 0.01, ***: p ≤ 0.001, ****: p ≤ 0.0001.
3. Results
3.1. The Evolution of the Wound Treated with hAM-pe is Associated with a Faster Progression of the Re-Epithelialization Front and a Reduced Local Inflammatory Activity
The clinical approach employed in this study aimed to evaluate the effectiveness of BCM and hAM-pe treatment of the wound. Both BCM and hAM-pe were simultaneously applied to different parts of the ulcer bed (Figure 1B) to initially prepare it for skin grafting. The BCM dressing was secured with sutures, and after 15 days, the silicone layer was removed (Figure 1C).
Both hAM-pe and BCM are typically used to prepare the wound bed for potential skin grafting. However, these regeneration matrices are expected to support and promote natural re-epithelialization, as described by Tchero et al. (2017) [10]. In this context, while both matrices were used to promote wound bed preparation, the hAM-pe-treated area showed clinical improvement and spontaneous epithelialization by day 50, before a graft could be considered. As a result, and considering the patient’s ongoing decision to avoid surgery, hAM-pe treatment was expanded to the remaining area. Skin grafting was found to be unnecessary and hAM-pe treatment was extended until complete re-epithelialization was achieved, five months from treatment initiation (Figure 1 F-H).
After 49 days of treatment, the clinical evolution of the skin ulcer treated simultaneously with hAM-pe and BCM showed noticeable differences in the tissue response of each treated zone. In the portion of the ulcer treated with BCM, prominent, irregular granulations were observed, accompanied by whitish secretion consistent with fibrin deposits (Figure 1,ψ) and signs of edema (Figure 1, ε). This suggests increased vascular permeability, accumulation of interstitial fluid, and the presence of cellular debris indicative of the formation of inflammatory granulation tissue. In contrast, the portion treated with hAM-pe exhibited a more controlled and favorable progression. The wound edge in this zone showed significant advancement in the re-epithelialization process. Clinically, the re-epithelialized edge is evidenced by a glossy surface (Figure 1,*), suggesting the presence of an incipient keratin layer. Unlike the zone treated with BCM, no whitish secretion or noticeable edema was observed, which may reflect the reduced local inflammatory activity.
Between days 0 and 49, a 71% closure was achieved in the area treated with hAM-pe, compared to 32% in the area treated with BCM. The daily percentage closure rate from day 0 to day 49 was 1.46% for hAM-pe treatment versus 0.66% for BCM. The reduced presence of inflammatory signs and the progression of re-epithelialization suggest a more favorable response in the zone treated with hAM-pe.
As a complementary parameter of clinical evolution, a histological evaluation was performed on biopsies taken from the zones treated with BCM and hAM-pe, which encompassed various layers of skin tissue (Figure 2). To perform a detailed and structured analysis of tissue organization and clarify potential changes in the regeneration processes of each of them, we defined four regions: REGION 1: Marked with a dashed line, corresponding to the base of the dermis, serving as a reference point for the underlying tissue structure. REGION 2: Delineated by a dash-dot line, representing the newly formed dermis, indicative of tissue regeneration and remodeling. REGION 3: Situated above the bold solid line, which demarcates the boundary of granulation tissue or the papillary dermis when covered by epithelium (re-epithelialization tongue, highlighted with a dotted line). REGION 4: Located immediately beneath the bold boundary, this region provides insight into the deeper layers relative to the granulation tissue or papillary dermis (Figure 2, panels B & C).
In the histological observation, we considered processes involving re-epithelialization and inflammation. Biopsies were taken from both areas at an equivalent distance from the initial wound margin (Figure 2, Panel A, arrows). In the zone treated with hAM-pe, a tongue of re-epithelialization was evident, which was absent in the biopsy from the zone treated with BCM (Figure 2, B,b; Figure 3). Therefore, it can also be inferred histologically that there is a faster progression of the re-epithelialization front after hAM-pe treatment. An important issue to analyse through tissue imaging is the elucidation of cellular processes, in which cell density, arrangement, and organization provide clues about them. In this regard, a structure formed by immune cells (epithelioid cells and multinucleated giant cells) consistent with a foreign body granulomatous reaction, was observed in REGION 2, between 250 to 400 µm in depth, in the zone treated with BCM. This type of structure, which isolates the foreign body to reduce damage to the surrounding tissue, was not observed in the zone treated with hAM-pe (Figure 3).
3.2. The Treatment with hAM-pe Improves the Deposition and Organization of the Extracellular Matrix
The overall organization of the dermal ECM under BCM treatment, as observed in Hematoxylin & Eosin-stained biopsy sections, appears disorganized, with diffuse unstained white areas indicative of unstructured, edematous connective tissue. In contrast, the area under hAM-pe treatment, both beneath the reepithelialization tongue and in the surrounding tissue, exhibits homogeneous staining with no signs of extravascular erythrocytosis (Figure 3).
To assess the composition and spatial arrangement of collagen fibers deposited within the tissue, histological analyses were performed on biopsy samples stained with Picrosirius red (Figure 4) [18,19]. Assuming that the healing process occurs from the deepest layers of the ulcer toward the surface, in successive layers, the most recently synthesized tissue would be the one closest to the surface (REGION 3 in Figure 2, panels B and C), in which the alignment of these sections highlights their spatial relationship, referenced to the original ulcer bed, where treatments were applied. The ratio between type I and type III collagen fibers provides insight into whether the tissue has a normal composition or presents alterations. Figure 4 shows that this newly formed, most superficial tissue in REGION 3, has equal collagen type I/III ratios under both treatments, with an abundance of type III collagen, a hallmark of granulation tissue itself. No differences were observed in this provisional matrix. However, in REGION 4, located deeper than REGION 3, the hAM-pe zone treated exhibits a higher collagen I/III ratio, indicative of ECM maturation.
Further supporting the idea that tissue reconstruction occurs from the ulcer base toward the surface, a 400-µm-thick layer of tissue, designated as REGION 2 (Figure 2, B and C), was synthesized over the ulcer bed where the treatments were applied. Under BCM treatment, although this region exhibits a higher collagen I/III ratio, collagen deposition was focal and displayed an irregular organization, particularly in areas of granulomatous foreign body reaction at a depth of 200 to 300 µm—approximately the same depth at which the treatments were applied (Figure 5, sample d, arrows). In contrast, hAM-pe dressings induced a fibrillar-like collagen organization, appearing as parallel red/yellow lines in Figure 5 sample b, dashed line. Meanwhile, the tissue beneath the original bed ulcer continued to mature under the effects induced by each treatment. Thus, REGION 1 in the biopsies taken on day 49 evolved from what was designated as REGION 1 in the biopsies taken on day 0. In order to analyze changes in the architecture of these deepest regions, comparative analyses were made between these six regions (Figure 5). In both original tissues on top of which treatments were applied (REGION 1, day 0) the collagen type I/III ratio reveals equal proportions, with type III predominance. After 49 days of treatment, the ratio was higher in REGION 1, the deepest one, for the zone treated with hAM-pe. As mentioned earlier, the more organized pattern of red fibers (collagen I) observed in this deeper and older region, together with the elevated collagen I-to-III ratio compared to the more superficial and immature neighboring REGION 2, suggests the progression of a remodeling process, which appeared more advanced under hAM-pe treatment.
Since many of the aforementioned estimates are based on distinguishing collagen fiber types using Picrosirius red staining, and considering that this methodology has been reported to have certain inaccuracies [20], it was deemed appropriate to further investigate these hypotheses through the evaluation of molecular markers. The results of these analyses are presented in the following sections.
3.3. The hAM-pe Treatment Promotes Angiogenesis and Vascularization in the Repair Tissue
In order to analyze the vascularization state of the new tissue in the wound under both treatments, the cell surface marker CD34 was analyzed on biopsy sections. CD34 is a robust and functional marker of vascularization because its detection reflects the presence and activity of key cells involved in vascular formation and remodeling [16]. When analysing the initial biopsies, no differences were identified in the number of vessels present in the superficial region of the two biopsies (Figure 6D, day 0). No differences were observed in their calibre either (additional data). Both observations support an equivalent vascularization between the areas set to receive the two treatments. After 49 days of treatment, images were significantly different under each treatment (Figure 6A,B). The zone treated with hAM-pe exhibited a larger CD34-reactive area (Figure 6C) along with an increased count of CD34-positive circular structures indicative of blood vessels (Figure 6D, day 49). Additionally, a larger vessel diameter was observed in the same zone, as revealed by the microvascular sections of all detected structures examined at higher magnification (Figure 6E). These findings indicate that hAM-pe treatment significantly enhanced both the number and calibre of newly formed blood vessels over time, compared to BCM treatment.
3.4. Tissues Repaired Under the Action of hAM-pe Are Likely in a More Advanced Stage of Wound Healing
In the preceding sections, we demonstrated that treatment with sterilized, processed human amniotic membranes (hAM-pe) significantly accelerates re-epithelialization, reduces local inflammatory activity, enhances the organization of the extracellular matrix, and promotes angiogenesis and vascularization within the repairing tissue. These clinical and histological findings provide a foundation for investigating the expression of associated molecular markers, thereby offering deeper insights into the underlying mechanisms driving these reparative processes.
At the molecular level, we focused on analyzing key markers of interest, categorized into three groups based on the wound healing process they are involved in: inflammation, chemotaxis and angiogenesis, and extracellular matrix synthesis and remodeling.
As previously described, the results of this study were analyzed by comparing the expression levels of specific genes relative to Actin, which was used as a reference gene (ΔCt). These comparisons were made across different zones (ΔΔCt) in biopsies collected at two time points under both treatments, allowing comparisons either within treatments or between them (Figure 7). The Fold Increase (FI) within treatments for all evaluated markers, except for MMP-1, whose expression was undetectable in the initial biopsies but was observed in the biopsies collected on day 49, are plotted in Figure 8. Alternatively, the FI values were compared across biopsies collected at each time point under each treatment. It is important to note that with this technique, a FI of 1 indicates equivalent expression between the biopsies analyzed.
For the markers related to inflammation (Figure 8, panel A), a decrease in the expression of TNF-α to one-fifth of its initial value was observed using hAM-pe, while it was stable under BCM treatment. Also, a more than 60-fold increase in the expression of IL-1β was noted with the use of BCM, while it was stable under hAM-pe treatment. These findings suggest that BCM induced a sustained inflammatory state, while hAM-pe exerted a negative modulatory effect on inflammation. Although M2 associated cytokine TGF-β expression slightly and equally increased under both treatments, ARG-1 expression, also related to M2 profiling, showed a significantly higher rise under treatment with hAM-pe compared to the zone treated with BCM.
Also, chemotaxis and vascularization biomarkers (Figure 8, panel B), which are expected to increase during the proliferative stage and decrease afterwards, were studied. A marked decrease in VEGF expression was identified on day 49 under BCM treatment compared to its initial expression. In contrast, during treatment with hAM-pe, a stable expression of the vascular endothelial growth factor was observed, consistent with a successfully achieved angiogenesis process. CCL2, IL-8 and CXCL-10 were overexpressed by day 49 regarding their initial expression under BCM treatment, while they were underexpressed by hAM-pe, which indicates that hAM-pe dampened chemotaxis of monocytes, T cells and neutrophils, respectively promoting evolution to the remodeling phase.
Finally, panel C on Figure 8 summarizes biomarkers regarding deposition and remodeling of the ECM. One of the most abundant protein components of the ECM is collagen, whose deposition is fulfilled by activated α-SMA myofibroblasts. No differences were detected between treatments in α-SMA expression, consistent with transition from the proliferation phase to the remodeling stage. It is important to recall that during the proliferative phase, the space created by the wound is progressively filled with a provisional matrix primarily composed of type III collagen, a homotrimer encoded by the col3a1 gene. While the granulation tissue matures into newly synthesized dermis, type III collagen is enzymatically removed and replaced by type I collagen, which is a heterotrimer composed of two chains encoded by the col1a1 gene and a third chain encoded by the col1a2 gene. An increase in COL1A1 expression was observed throughout the treatment with hAM-pe, while its expression decreased in the final biopsy compared to the initial one in the area treated with BCM, and the same tendency, but without statistical significance was observed for COL1A2. Besides, the expression changes in both type I collagen chains within hAM-pe treatment were equal. No differences in COL3A1 expression were observed between either treatment. In order to evaluate the enzymatic degradation of protein components of granulation tissue required to advance ECM remodeling, the expression of the metalloproteinases MMP-1 and MMP-2, their inhibitor TIMP-1, and the transmembrane serine protease expressed in fibroblasts and myofibroblasts, FAP, were analyzed. MMP-1 expression was undetectable in the initial biopsies but became detectable in those collected on day 49, being-10 fold higher in the BCM treated zone than under hAM-pe treatment. After 49 days of BCM treatment, FAP expression was fourfold higher than the one on day 0 (p ≤ 0.01), and MMP-2 expression was doubled (p ≤ 0.01). Additionally, no increase in MMP-2 inhibition would be expected, as TIMP-1 expression in the BCM-treated area remained unchanged, showing a higher expression of the inhibitor than in the area treated with hAM-pe (p ≤ 0.0001).
4. Discussion
While rapid advances are being made in the development of customized collagen scaffolds, research translating these innovations into clinical practice remains limited [2]. In this context, the simultaneous application of both treatments in a single patient, and even within different zones of the same wound, provides a unique clinical approach to evaluate their effectiveness and derive conclusions with translational relevance. hAM-pe has demonstrated favorable clinical outcomes in previously reported cases [14], with no adverse effects and successful wound closure in large diabetic foot ulcers (DFUs). Although this study focuses on a single clinical case and therefore lacks interindividual heterogeneity, this limitation also serves as a strength. Applying both treatments to the same patient reduces variability associated with heterogeneous populations, allowing for a more controlled assessment of treatment effects. By adopting a rigorous methodological approach that acknowledges these limitations while emphasizing the consistency observed across multiple analyzed variables, the study is able to support robust and meaningful conclusions. hAM-pe therapy demonstrated several advantages as a scaffold to prepare the ulcer bed for skin grafting against BCM: it does not require an operating room or specialized personnel and does not need suture. Moreover, when used in long-term treatments, the room-temperature stability of hAM-pe facilitates its easy transportation and enables its application in outpatient settings or even at the patient’s home, either by the patient themselves or by trained caregivers under medical supervision. These characteristics simplify the management of chronic wounds, as previously observed in DFU treatment [14]. In this case, the clinical evolution under hAM-pe treatment was so favorable, with a faster wound closure rate, absence of edema and diminished inflammation signs such as fibrin deposition, that the therapeutic decision was made to continue its use until complete wound closure, allowing the patient to avoid surgical intervention for a skin autograft. This approach did not only prevent the need for surgery, postoperative recovery and associated costs but it also had a direct positive impact on the patient’s well-being and significantly improved quality of life by enabling home-based recovery.
These findings set the stage for the subsequent discussion, which will focus on elucidating the underlying molecular, cellular, and tissue-level mechanisms.
A critical process during healing and favorable wound closure is the formation of granulation tissue, where cell migration, ECM deposition, angiogenesis, and vascularization play essential roles [22]. In complex wounds, dysfunctional angiogenesis can lead to edema and inadequate tissue oxygenation, ultimately compromising the healing process [23]. Under hAM-pe treatment, an enhanced number of blood vessels was positively observed at molecular, histological and clinical levels. VEGF plays important roles in neovascularization, increasing vascular permeability, and generally promoting wound healing [24,25]. VEGF underexpression under BCM treatment, together with CD34 IHC findings, would indicate impaired angiogenesis. On the other hand, there is a positive correlation in both methods that reinforces the hypothesis that hAM-pe promoted and achieved a stable vascularization process.
While initial inflammation is crucial to prevent infection and promote tissue repair, persistent infiltration might lead to excessive inflammation and delayed healing [26]. The evidence of our study indicates a persistence of the inflammatory state, after 49 days of BCM treatment while being resolved under hAM-pe treatment. This was confirmed at the molecular level, with a high expression of the chemoattractants CXCL-10, IL-8 and CCL-2, under BCM treatment, while dampened under hAM-pe. For inflammation-related markers, TGF-β, often considered a pro-resolutive mediator of inflammation [26], does not appear to play a central role in this context. However, significant changes between treatments were observed in other pro-inflammatory mediators, specifically IL-1β and TNF-α. We observed an increased IL-1β expression only under BCM treatment, while a downregulated expression of TNF-ɑ was found only under hAM-pe treatment. These findings suggest that BCM induces a sustained inflammatory state, associated to M1 profiling, which impedes dermal substructure formation and re-epithelialization [27], while hAM-pe exerts a negative modulatory effect on inflammation promoting wound healing evolution into the remodeling stage. M2 macrophages regulate wound healing by modulating extracellular matrix turnover through MMPs and TIMPs, clearing debris via phagocytosis, and secreting chemokines that recruit fibroblasts and immune cells [28,29]. They simultaneously shape an immunoregulatory environment with the expression of anti-inflammatory mediators such as Arginase 1, which helps limit fibrosis, reduce inflammation, and enhance tissue repair [3,30]. In our study, we observed an upregulated MMP-2 expression under BCM treatment, together with an unchanged expression of TIMP-1, both indicative of an ECM degradation persistent process at this late stage of wound progression. On the contrary, hAM-pe treatment showed a favorable correlation in the decrease of both MMP proteases and their inhibitor, characteristic of an advanced remodeling stage. Finally, the marked increase in Arg-1 expression under hAM-pe treatment suggests both fibroblast activation and a macrophage metabolic shift toward an M2-like profile—a hypothesis that requires further investigation, particularly given the cellular complexity of the biopsies analyzed [31]. These findings lead us to conclude that there should be different mechanisms triggered either by BCM to induce the persistent inflammatory signaling observed, or by hAM-pe to resolve the initial inflammation and proliferation. The promotion of tissue-resident fibroblasts and macrophages, along with the induction of efferocytosis, may help explain the effects observed under hAM-pe treatment and are worth further investigating [29,32,33,34,35].
Collagen type I provides tensile strength and regulates mesenchymal stem cell behavior, while collagen type III, present in early granulation tissue, plays a key role in tissue regeneration [36,37,38,39]. In our study, superficial granulation tissue (REGION 3) was similar across both treatments while the superficial reticular dermis (REGION 4) exhibited a higher collagen I/III ratio with hAM-pe treatment. This evidence indicates that hAM-pe accelerates the remodeling process, finding more mature architectures in deeper layers of the dermis. As the proliferative phase ends, wound healing enters the remodeling phase, marked by collagen III removal, collagen I deposition, and a gradual decline in protease expression. Consequently, FAP, MMP-1 and MMP-2 expressions should decline to prevent excessive ECM degradation. In our study, FAP expression remained stable after 49 days of hAM-pe treatment, whereas it markedly increased under BCM treatment. This may reflect a hypoxic and poorly vascularized environment under BCM, which is known to induce FAP expression [40]. IL-1β and TNF-α can also regulate the expression of FAP in activated fibroblasts [41]. In the early stages, inflammation promotes fibroblast activation and FAP expression, creating an environment conducive to the initiation of the proliferative phase. However, its constitutive expression might impede moving into the remodeling phase. The increased FAP expression during BCM treatment, along with its higher expression in this zone compared to the area treated with hAM-pe, correlates with the BCM-treated zone being at an earlier stage of wound progression, more characteristic of the inflammation/proliferation phase, with active fibrosis and granulation tissue degradation. This interpretation is further supported by an increase in metalloproteinase expression. In contrast, in the hAM-pe-treated area, fibroblast activity has already been moderated, reflecting the remodeling phase, where fibroblast and metalloproteinase activity is maintained but at a more controlled level [42]. Overall, the results from the hAM-pe treatment indicate a controlled balance between ECM synthesis and degradation. Notably, the use of the BCM, a commercial product composed of a bi-layer sterile matrix with purified and stabilized type I bovine collagen, led to the induction of a granulomatous foreign-body reaction. Such reactions are commonly associated with the use of xenogeneic-derived scaffolds and may compromise tissue integration. In contrast, hAM-pe, derived from the human amniotic membrane, offers a biocompatible alternative [43]. The presence of both epithelial and mesenchymal cells in hAM results in the production of collagen types I, III, and V, immunomodulatory molecules characteristic of the embryonic environment, contributing to tissue regeneration [44].
5. Conclusions
The results observed in this patient’s extensive ulcer simultaneously treated with BCM and hAM-pe address hAM-pe to be an innovative, well-tolerated dressing that accelerated healing, promoted inflammation resolution, and restored tissue functionality in a practical way. The new strategy eased treatment, improved patient outcome, optimized recovery time, and reduced costs or complications, which might eventually have a direct impact on the healthcare system and mainly, on patients’ life quality.
Supplementary Materials
The following supporting information can be downloaded at the website of this paper posted on Preprints.org. Figure S1. Comparison of microvessels density in the superficial region (number of microvessels/mm2) between treatments, at both timepoints, at 2X magnification. Statistical analysis was performed using ANOVA followed by Tukey's post hoc test for multiple mean comparisons (α = 0.05) was performed.
Author Contributions
“Conceived and designed the analysis, María X. Guerbi, Alejandro Berra, Griselda N. Moreno and Flavia M. Michelini; Collected the data, María X. Guerbi Jimena M. del P. Rodrigo, Matías F. Rotela and Rocío A. Comito; Contributed data or analysis tools María X. Guerbi, Jimena M. del P. Rodrigo, Esteban Vogel and Enrique L. Portiansky; Performed the analysis, María X. Guerbi; Wrote the paper and other contributions, María X. Guerbi, Matías F. Rotela, Rocío A. Comito, Alejandro Berra, Griselda N. Moreno and Flavia M. Michelini. All authors have read and agreed to the published version of the manuscript.”.
Funding
“All the studies involved in the work to be submitted were funded by the Agencia Nacional para la Promoción Científica y Tecnológica (ANPCyT, National Government of Argentina), Consejo Nacional de Investigaciones Científicas y Técnicas (Conicet, National Government of Argentina), Universidad de Buenos Aires (UBA, National Government of Argentina), Universidad Nacional Arturo Jauretche (UNAJ, National Government of Argentina), through the following grants: PICTA 2021 0125, Préstamo BID-PICTO -2021-UTCH-00005, PIP 2022-2024 No 112202101 00799CO, UNAJ Investiga 2023-Modalidad 1-Tipo A 80020200300012UJ”.
Institutional Review Board Statement
“The study was conducted in accordance with the Declaration of Helsinki, and approved by the Ethics Committee of Hospital de Alta Complejidad en Red El Cruce. The study has been developed in compliance with the regulations concerning current legal aspects in the Argentine Republic, adhering to requirements regarding respect for patients' rights, and without violating any national or international ethical guidelines, as reflected in approval by the institution’s human research review committee, dated September 12th, 2024”.
Informed Consent Statement
“Informed consent was obtained from all subjects involved in the study. Written informed consent has been obtained from the patient to publish this paper”.
Data Availability Statement
Research data is available and will be submitted upon request.
Conflicts of Interest
“The authors declare no conflicts of interest.”.
Abbreviations
The following abbreviations are used in this manuscript:
| α-SMA | Alpha-Smooth Muscle Actin |
| ANMAT | National Administration of Drugs, Food, and Medical Technology (Argentina) |
| ANOVA | Analysis of Variance |
| APCs | Antigen-Presenting Cells |
| Arg-1 | Arginase-1 |
| BCM | Bovine Collagen Matrix |
| CCL2 | C-C Motif Chemokine Ligand 2 (Monocyte Chemoattractant Protein-1, MCP-1) |
| CD34 | Cluster of Differentiation 34 (marker of hematopoietic and endothelial progenitor cells) |
| col1a1 | Collagen Type I Alpha 1 Chain |
| col1a2 | Collagen Type I Alpha 2 Chain |
| col3a1 | Collagen Type III Alpha 1 Chain |
| Ct | Threshold Cycles |
| CXCL-10 | C-X-C Motif Chemokine Ligand 10 (Interferon gamma-induced protein 10) |
| DAMPs | Damage-Associated Molecular Patterns |
| DFU | Diabetic Foot Ulcer |
| ECM | Extracellular Matrix |
| FAP | Fibroblast Activation Protein |
| hAM | Human Amniotic Membrane |
| hAM-pe | Lyophilized homogenized human amniotic membrane dressings sterilized by gamma radiation |
| HIV | Human Immunodeficiency Virus |
| IL-1β | Interleukin 1 beta |
| IL-8 | Interleukin 8 |
| INCUCAI | National Central Unique Institute for Ablation and Implant Coordination (Argentina) |
| MMP-1 | Matrix Metalloproteinase-1 |
| MMP-2 | Matrix Metalloproteinase-2 |
| RNA | Ribonucleic Acid |
| ROI | Region of Interest |
| RT-qPCR | Reverse Transcription Quantitative Polymerase Chain Reaction |
| TGF-β | Transforming Growth Factor Beta |
| TIMP-1 | Tissue Inhibitor of Metalloproteinases-1 |
| TNF-α | Tumor Necrosis Factor alpha |
| VAC | Vacuum-Assisted Closure |
| VEGF | Vascular Endothelial Growth Factor |
References
- Robson MC, Steed DL, Franz MG. Wound healing: biologic features and approaches to maximize healing trajectories. Curr Probl Surg. 2001, 38, 72–140. [Google Scholar]
- Dai, C. , Shih, S., & Khachemoune, A. Skin substitutes for acute and chronic wound healing: an updated review. Journal of Dermatological Treatment 2020, 31, 639–648. [Google Scholar] [CrossRef]
- Murray, P. J. , & Wynn, T. A. Protective and pathogenic functions of macrophage subsets. Nature reviews immunology 2011, 11, 723–737. [Google Scholar] [PubMed]
- Velnar, T. , Bailey, T., & Smrkolj, V. The wound healing process: an overview of the cellular and molecular mechanisms. Journal of international medical research 2009, 37, 1528–1542. [Google Scholar] [PubMed]
- de Souza, I. C. , Takejima, A. L., Simeoni, R. B., Gamba, L. K., Ribeiro, V. S. T., Foltz, K. M.,... & Guarita-Souza, L. C. Acellular biomaterials associated with autologous bone marrow-derived mononuclear stem cells improve wound healing through paracrine effects. Biomedicines 2023, 11, 1003. [Google Scholar] [CrossRef]
- Hesketh, M. , Sahin, K. B., West, Z. E., & Murray, R. Z. Macrophage phenotypes regulate scar formation and chronic wound healing. International journal of molecular sciences 2017, 18, 1545. [Google Scholar] [PubMed]
- Gardeazabal, L. , & Izeta, A. Elastin and collagen fibres in cutaneous wound healing. Experimental Dermatology 2024, 33, e15052. [Google Scholar] [CrossRef]
- Gauglitz, G. G. , Korting, H. C., Pavicic, T., Ruzicka, T., & Jeschke, M. G. Hypertrophic scarring and keloids: pathomechanisms and current and emerging treatment strategies. Molecular medicine 2011, 17, 113–125. [Google Scholar] [CrossRef]
- Knoedler, S. , Broichhausen, S., Guo, R., Dai, R., Knoedler, L., Kauke-Navarro, M.,... & Rinkevich, Y. Fibroblasts–The cellular choreographers of wound healing. Frontiers in Immunology 2023, 14, 1233800. [Google Scholar] [CrossRef]
- Tchero, H. , Herlin, C., Bekara, F., Kangambega, P., Sergiu, F., & Teot, L. Failure rates of artificial dermis products in treatment of diabetic foot ulcer: A systematic review and network meta-analysis. Wound Repair and Regeneration 2017, 25, 691–696. [Google Scholar] [CrossRef]
- Leal-Marin, S. , Kern, T., Hofmann, N., Pogozhykh, O., Framme, C., Börgel, M.,... & Gryshkov, O. Human Amniotic Membrane: A review on tissue engineering, application, and storage. Journal of Biomedical Materials Research Part B: Applied Biomaterials 2021, 109, 1198–1215. [Google Scholar] [CrossRef]
- Khosravimelal, S. , Momeni, M., Gholipur, M., Kundu, S. C., & Gholipourmalekabadi, M. Protocols for decellularization of human amniotic membrane. Methods in Cell Biology 2020, arXiv:10.1016/bs.mcb.2019.11.004157, 37–47. [Google Scholar]
- De Angelis, B. , Orlandi, F., Morais D’Autilio, M. F. L., Di Segni, C., Scioli, M. G., Orlandi, A.,... & Gentile, P. Vasculogenic chronic ulcer: tissue regeneration with an innovative dermal substitute. Journal of Clinical Medicine 2019, 8, 525. [Google Scholar] [PubMed]
- Carro, G. V. , Guerbi, X., Berra, M., Rodriguez, M. G., Noli, M. L., Fuentes, M.,... & Berra, A. Homogenized and Lyophilized Amniotic Membrane Dressings for the Treatment of Diabetic Foot Ulcers in Ambulatory Patients. Foot & Ankle International 2024, 10711007241243373. [Google Scholar]
- Stringa P, Romanin D, Lausada N, Papa Gobbi R, Zanuzzi C, Martín P, Abate JC, Cabanne A, Arnal N, Vecchio L, Milesi V, Portiansky E, Gondolesi G, Rumbo M. Gut Permeability and Glucose Absorption Are Affected at Early Stages of Graft Rejection in a Small Bowel Transplant Rat Model. Transplant Direct. 2017, 3, e220. [Google Scholar] [CrossRef]
- Adamska, A. , Pilacinski, S., Zozulinska-Ziolkiewicz, D., Gandecka, A., Grzelka, A., Konwerska, A.,... & Araszkiewicz, A. An increased skin microvessel density is associated with neurovascular complications in type 1 diabetes mellitus. Diabetes and Vascular Disease Research 2019, 16, 513–522. [Google Scholar] [PubMed]
- Rumbo, M. , Sierro, F., Debard, N., Kraehenbuhl, J. P., & Finke, D. Lymphotoxin β receptor signaling induces the chemokine CCL20 in intestinal epithelium. Gastroenterology 2004, 127, 213–223. [Google Scholar] [CrossRef]
- Campelo, M. B. D. , Santos, J. D. A. F., Maia Filho, A. L. M., Ferreira, D. C. L., Sant’Anna, L. B., Oliveira, R. A. D.,... & Arisawa, E. Â. L. Effects of the application of the amniotic membrane in the healing process of skin wounds in rats. Acta cirurgica brasileira 2018, 33, 144–155. [Google Scholar] [PubMed]
- Junqueira, L. C. U. , Bignolas, G., & Brentani, R. R. Picrosirius staining plus polarization microscopy, a specific method for collagen detection in tissue sections. The Histochemical Journal 1979, 11, 447–455. [Google Scholar] [CrossRef]
- López De Padilla, C. M. , Coenen, M. J., Tovar, A., De la Vega, R. E., Evans, C. H., & Müller, S. A. Picrosirius red staining: revisiting its application to the qualitative and quantitative assessment of collagen type I and type III in tendon. Journal of Histochemistry & Cytochemistry 2021, 69, 633–643. [Google Scholar]
- Mathew-Steiner, S. S. , Roy, S., & Sen, C. K. Collagen in wound healing. Bioengineering 2021, 8, 63. [Google Scholar] [CrossRef]
- Jain, R. K. K. Molecular regulation of vessel maturation. Nature medicine 2003, 9, 685–693. [Google Scholar] [PubMed]
- Veith, A. P. , Henderson, K., Spencer, A., Sligar, A. D., & Baker, A. B. Therapeutic strategies for enhancing angiogenesis in wound healing. Advanced drug delivery reviews 2019, 146, 97–125. [Google Scholar] [PubMed]
- Shams, F. , Moravvej, H., Hosseinzadeh, S. et al. Overexpression of VEGF in dermal fibroblast cells accelerates the angiogenesis and wound healing function: in vitro and in vivo studies. Sci Rep 2022, 12, 18529. [Google Scholar] [CrossRef]
- Bao, P. , Kodra, A., Tomic-Canic, M., Golinko, M. S., Ehrlich, H. P., & Brem, H. The role of vascular endothelial growth factor in wound healing. Journal of Surgical Research 2009, 153, 347–358. [Google Scholar] [CrossRef]
- Zhao, Y. , Li, M., Mao, J., Su, Y., Huang, X., Xia, W.,... & Zan, T. Immunomodulation of wound healing leading to efferocytosis. Smart Medicine 2024, 3, e20230036. [Google Scholar] [CrossRef]
- Guo, S. A. , & DiPietro, L. A. Factors affecting wound healing. Journal of dental research 2010, 89, 219–229. [Google Scholar]
- Chen, L. , Wang, J., Li, S., Yu, Z., Liu, B., Song, B., & Su, Y. The clinical dynamic changes of macrophage phenotype and function in different stages of human wound healing and hypertrophic scar formation. International wound journal 2019, 16, 360–369. [Google Scholar] [CrossRef]
- Roberts AB, Sporn MB, Assoian RK, Smith JM, Roche NS, Wakefield LM, Heine UI, Liotta LA, Falanga V, Kehrl JH, et al. Transforming growth factor type beta: rapid induction of fibrosis and angiogenesis in vivo and stimulation of collagen formation in vitro. Proc Natl Acad Sci USA 1986, 83, 4167–4171. [Google Scholar] [CrossRef]
- Pesce, J. T. , Ramalingam, T. R., Mentink-Kane, M. M., Wilson, M. S., El Kasmi, K. C., Smith, A. M.,... & Wynn, T. A. Arginase-1–expressing macrophages suppress Th2 cytokine–driven inflammation and fibrosis. PLoS pathogens 2009, 5, e1000371. [Google Scholar] [CrossRef]
- Mantovani, A. , Biswas, S. K., Galdiero, M. R., Sica, A., & Locati, M. Macrophage plasticity and polarization in tissue repair and remodelling. The Journal of pathology 2013, 229, 176–185. [Google Scholar] [CrossRef]
- Rauchenwald, T. , Handle, F., Connolly, C. E., Degen, A., Seifarth, C., Hermann, M.,... & Ploner, C. Preadipocytes in human granulation tissue: role in wound healing and response to macrophage polarization. Inflammation and Regeneration 2023, 43, 53. [Google Scholar]
- Forde, A. J. , & Kolter, J. (2023). Isolation and Flow Cytometry Analysis of Macrophages from the Dermis. In Tissue-Resident Macrophages: Methods and Protocols (pp. 159–169). New York, NY: Springer US.
- Jenkins, S. J. , Ruckerl, D., Cook, P. C., Jones, L. H., Finkelman, F. D., Van Rooijen, N.,... & Allen, J. E. Local macrophage proliferation, rather than recruitment from the blood, is a signature of TH2 inflammation. Science 2011, 332, 1284–1288. [Google Scholar] [PubMed]
- Maschalidi, S. , Mehrotra, P., Keçeli, B.N. et al. Targeting SLC7A11 improves efferocytosis by dendritic cells and wound healing in diabetes. Nature 2022, 606, 776–784. [Google Scholar] [CrossRef] [PubMed]
- Wang, JH. Mechanobiology of tendon. J Biomech. 2006, 39, 1563–1582. [Google Scholar] [CrossRef]
- Somaiah C, Kumar A, Mawrie D, Sharma A, Patil SD, Bhattacharyya J, Swaminathan R, Jaganathan BG. Collagen promotes higher adhesion, survival and proliferation of mesenchymal stem cells. PLoS ONE. 2015, 10, e0145068. [Google Scholar] [CrossRef]
- Merkel JR, DiPaolo BR, Hallock GG, Rice DC. Type I and type III collagen content of healing wounds in fetal and adult rats. Proc Soc Exp Biol Med. 1988, 187, 493–497. [Google Scholar] [CrossRef]
- Volk SW, Wang Y, Mauldin EA, Liechty KW, Adams SL. Diminished type III collagen promotes myofibroblast differentiation and increases scar deposition in cutaneous wound healing. Cells Tissues Organs. 2011, 194, 25–37. [Google Scholar] [CrossRef]
- Kraman, M. , Bambrough, P.J., Arnold, J. N., Roberts, E. W., Magiera, L., Jones, J. O.,... & Fearon, D. T. Suppression of antitumor immunity by stromal cells expressing fibroblast activation protein–α. Science 2010, 330, 827–830. [Google Scholar] [CrossRef]
- Fitzgerald, A. A. , & Weiner, L. M. The role of fibroblast activation protein in health and malignancy. Cancer and Metastasis Reviews 2020, 39, 783–803. [Google Scholar]
- Roman, J. Fibroblasts—Warriors at the Intersection of Wound Healing and Disrepair. Biomolecules 2023, 13, 945. [Google Scholar] [CrossRef] [PubMed]
- García, M. G. S. , Díaz, N. F., López, G. G., Maya, I. Á., Jimenez, C. H., Maldonado, Y. R.,... & Martínez, N.E.D. Evaluation methods for decellularized tissues: A focus on human amniotic membrane. Sci Rep 2024. [Google Scholar] [CrossRef]
- Mogami, H. , Hari Kishore, A., Akgul, Y., & Word, R. A. Healing of preterm ruptured fetal membranes. Scientific reports 2017, 7, 13139. [Google Scholar] [CrossRef]
Figure 1.
Sequential photographs of the ulcer at various stages of treatment: (A) Day 0, at the time of biopsy collection, prior to initiating both treatments; (B) during the first application of hAM-pe in the lower left area and BCM in the upper right area of the ulcer; (C) on day 15, after removing the silicone layer covering the BCM; (D) and (E) Day 39 during one of the hAM-pe reapplications performed every 72 hours; (F) and (G) Day 49, at the time of comparative biopsy collection and the initiation of hAM-pe as the sole treatment until discharge (H). * indicates re-epithelialized areas, ψ indicates fibrine depositions and ε indicates edematous regions.
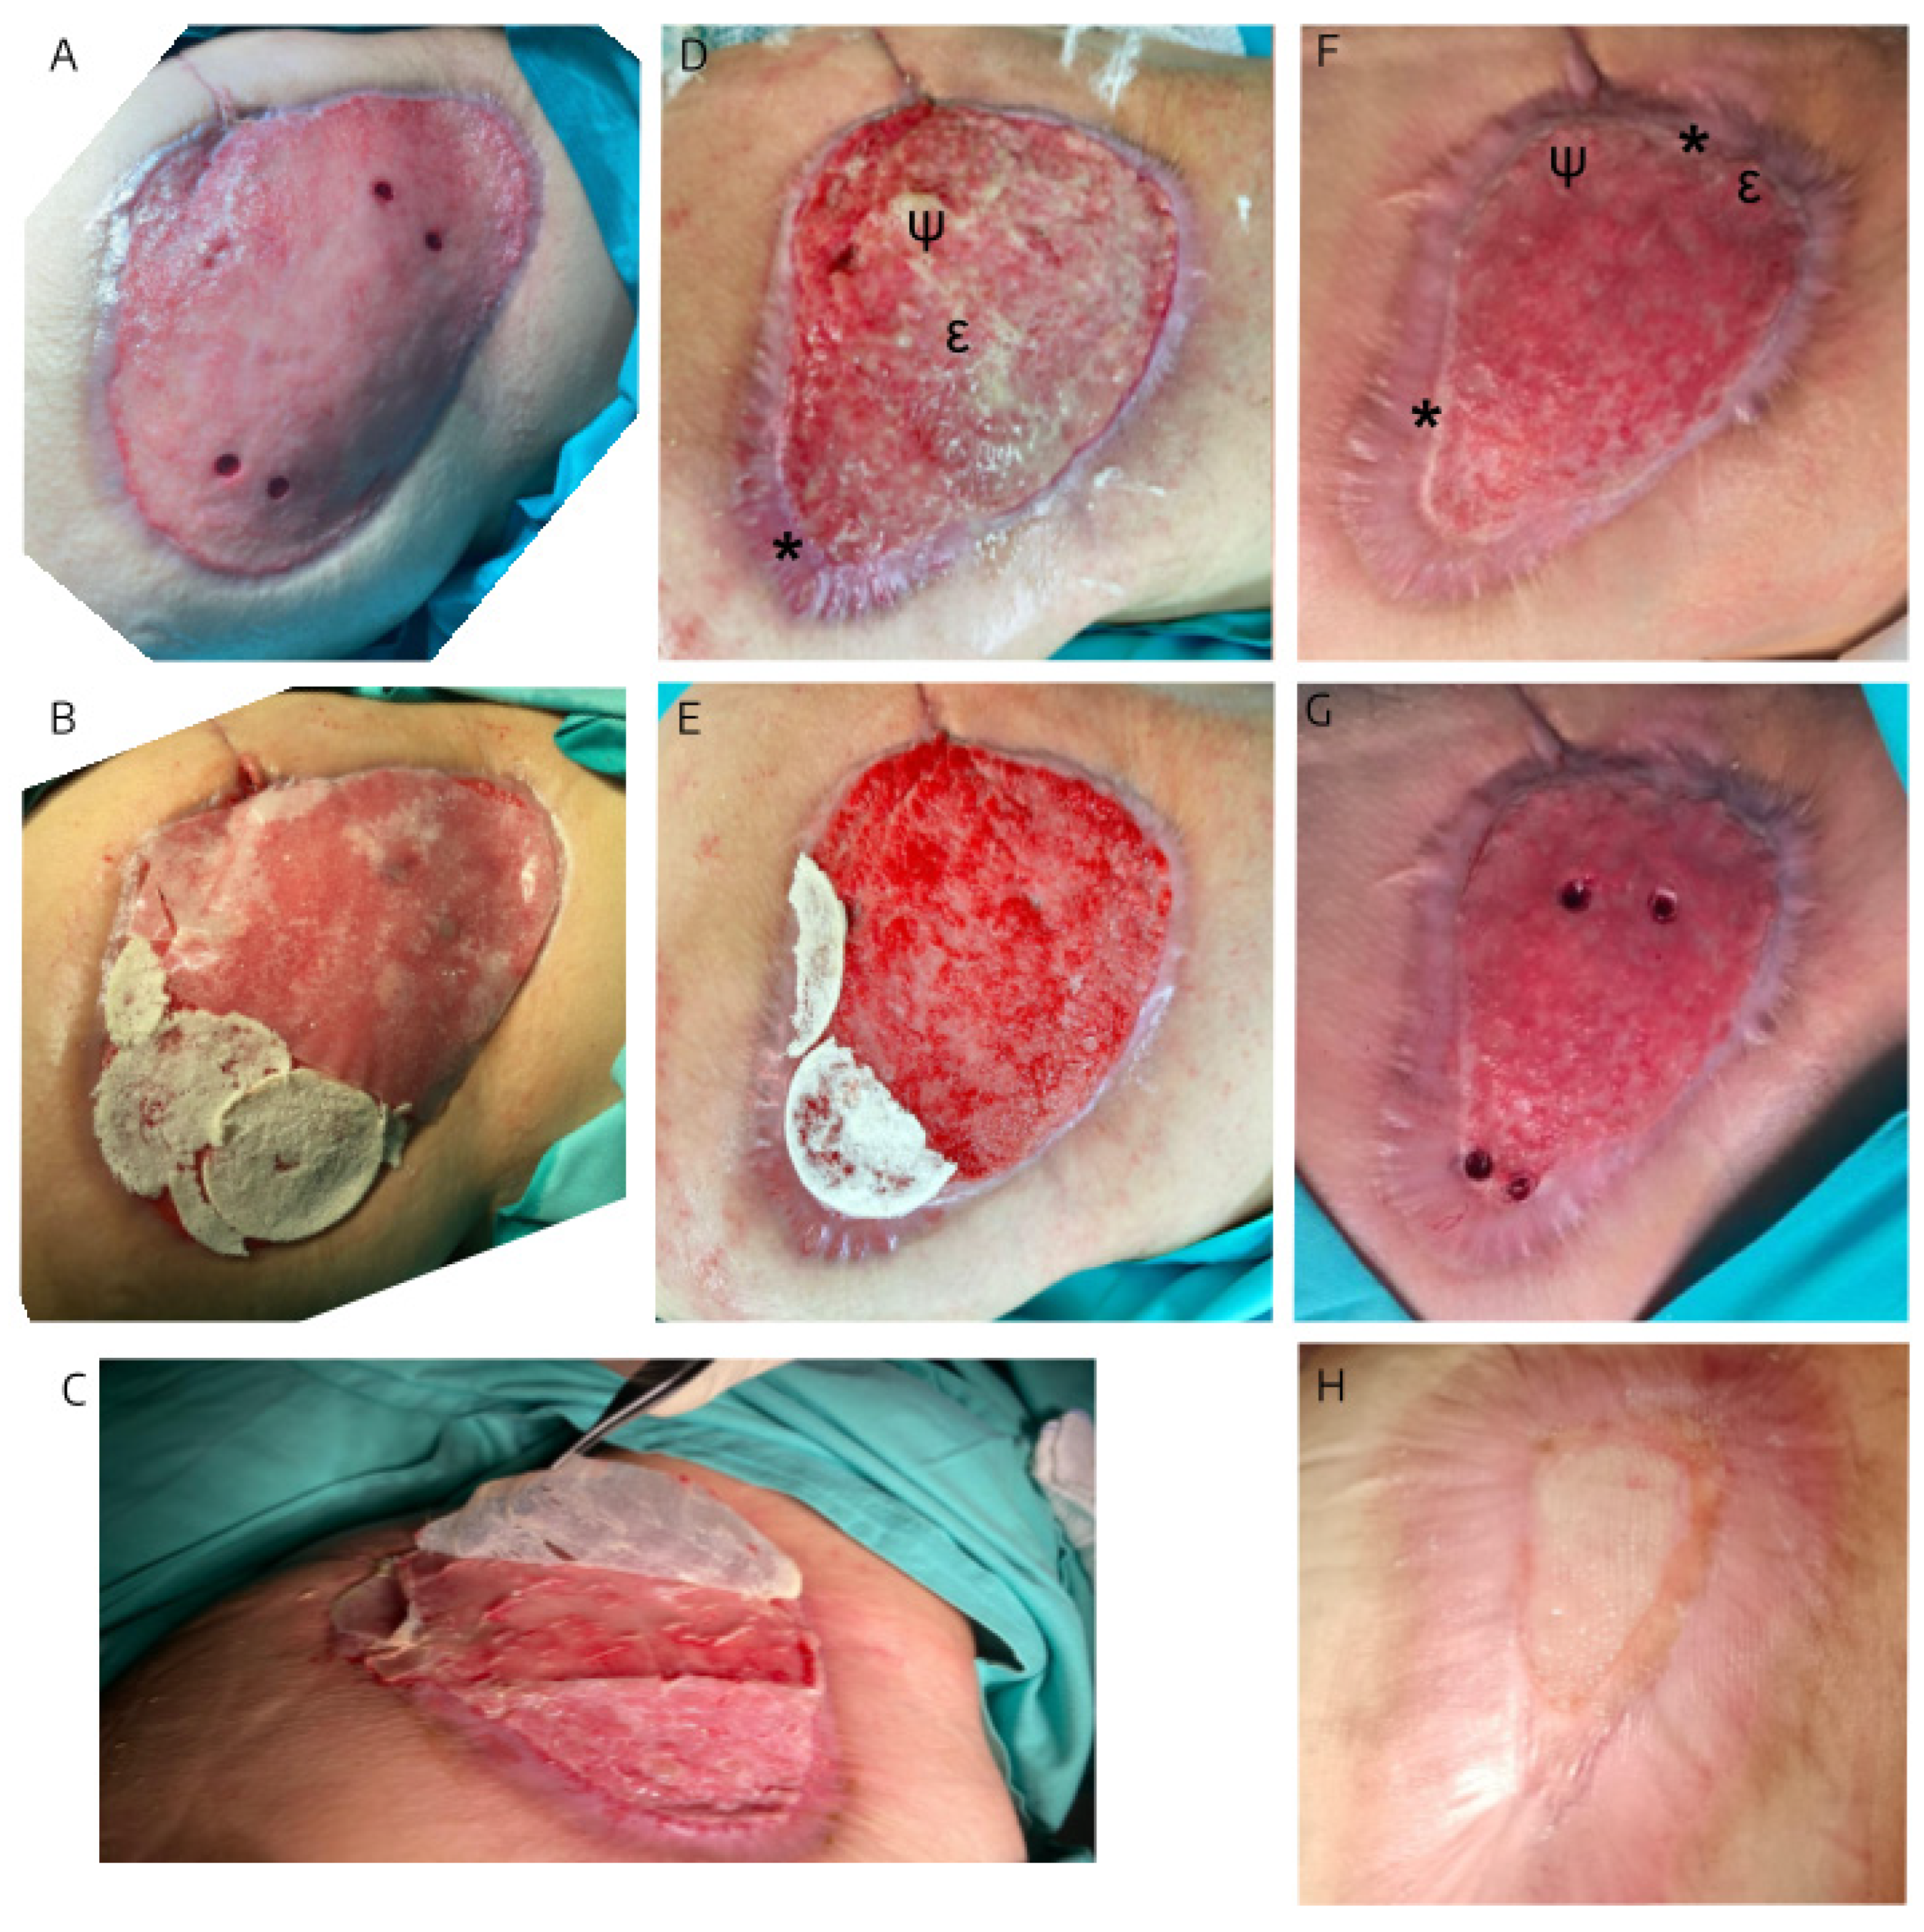
Figure 2.
Panel A: Diagrams in superior view (left) and transversal view (right) illustrating the overlap of ulcer edges on day 0 (solid line) and day 49 (dotted line). Blue references correspond to hAM-pe treatment, while red references indicate BCM treatment. Light circles and cylinders (a, c) represent biopsy sites collected before treatment and dark ones (b, d) refer to biopsies taken on day 49. Arrows indicate the consistent distance maintained for histological sampling, while molecular biology samples were collected closer to the ulcer center (not represented in the diagram on the right). Panels B and C: Microphotographs, of Hematoxylin & Eosin-stained biopsy sections, from zones treated with hAM-pe (B, blue panel) and BCM (C, red panel). Images corresponding to samples obtained on day 0 (left), and day 49 (right). The alignment of these sections, as well as cylinders on diagrams, representing punch biopsies, highlights their spatial relationship to the original ulcer bed. The depth of the treatment application is marked by bold lines in panel A: blue for hAM-pe dressing and red for BCM layer. To enhance clarity, key regions are highlighted as follows: REGION 1: Base of the dermis (dashed line). REGION 2: Newly formed dermis (dash-dot line). REGION 3: Above the bold solid line which marks the boundary of granulation tissue or papillary dermis, if covered by epithelium. REGION 4: Immediately beneath the aforementioned bold black boundary. 2X magnification.
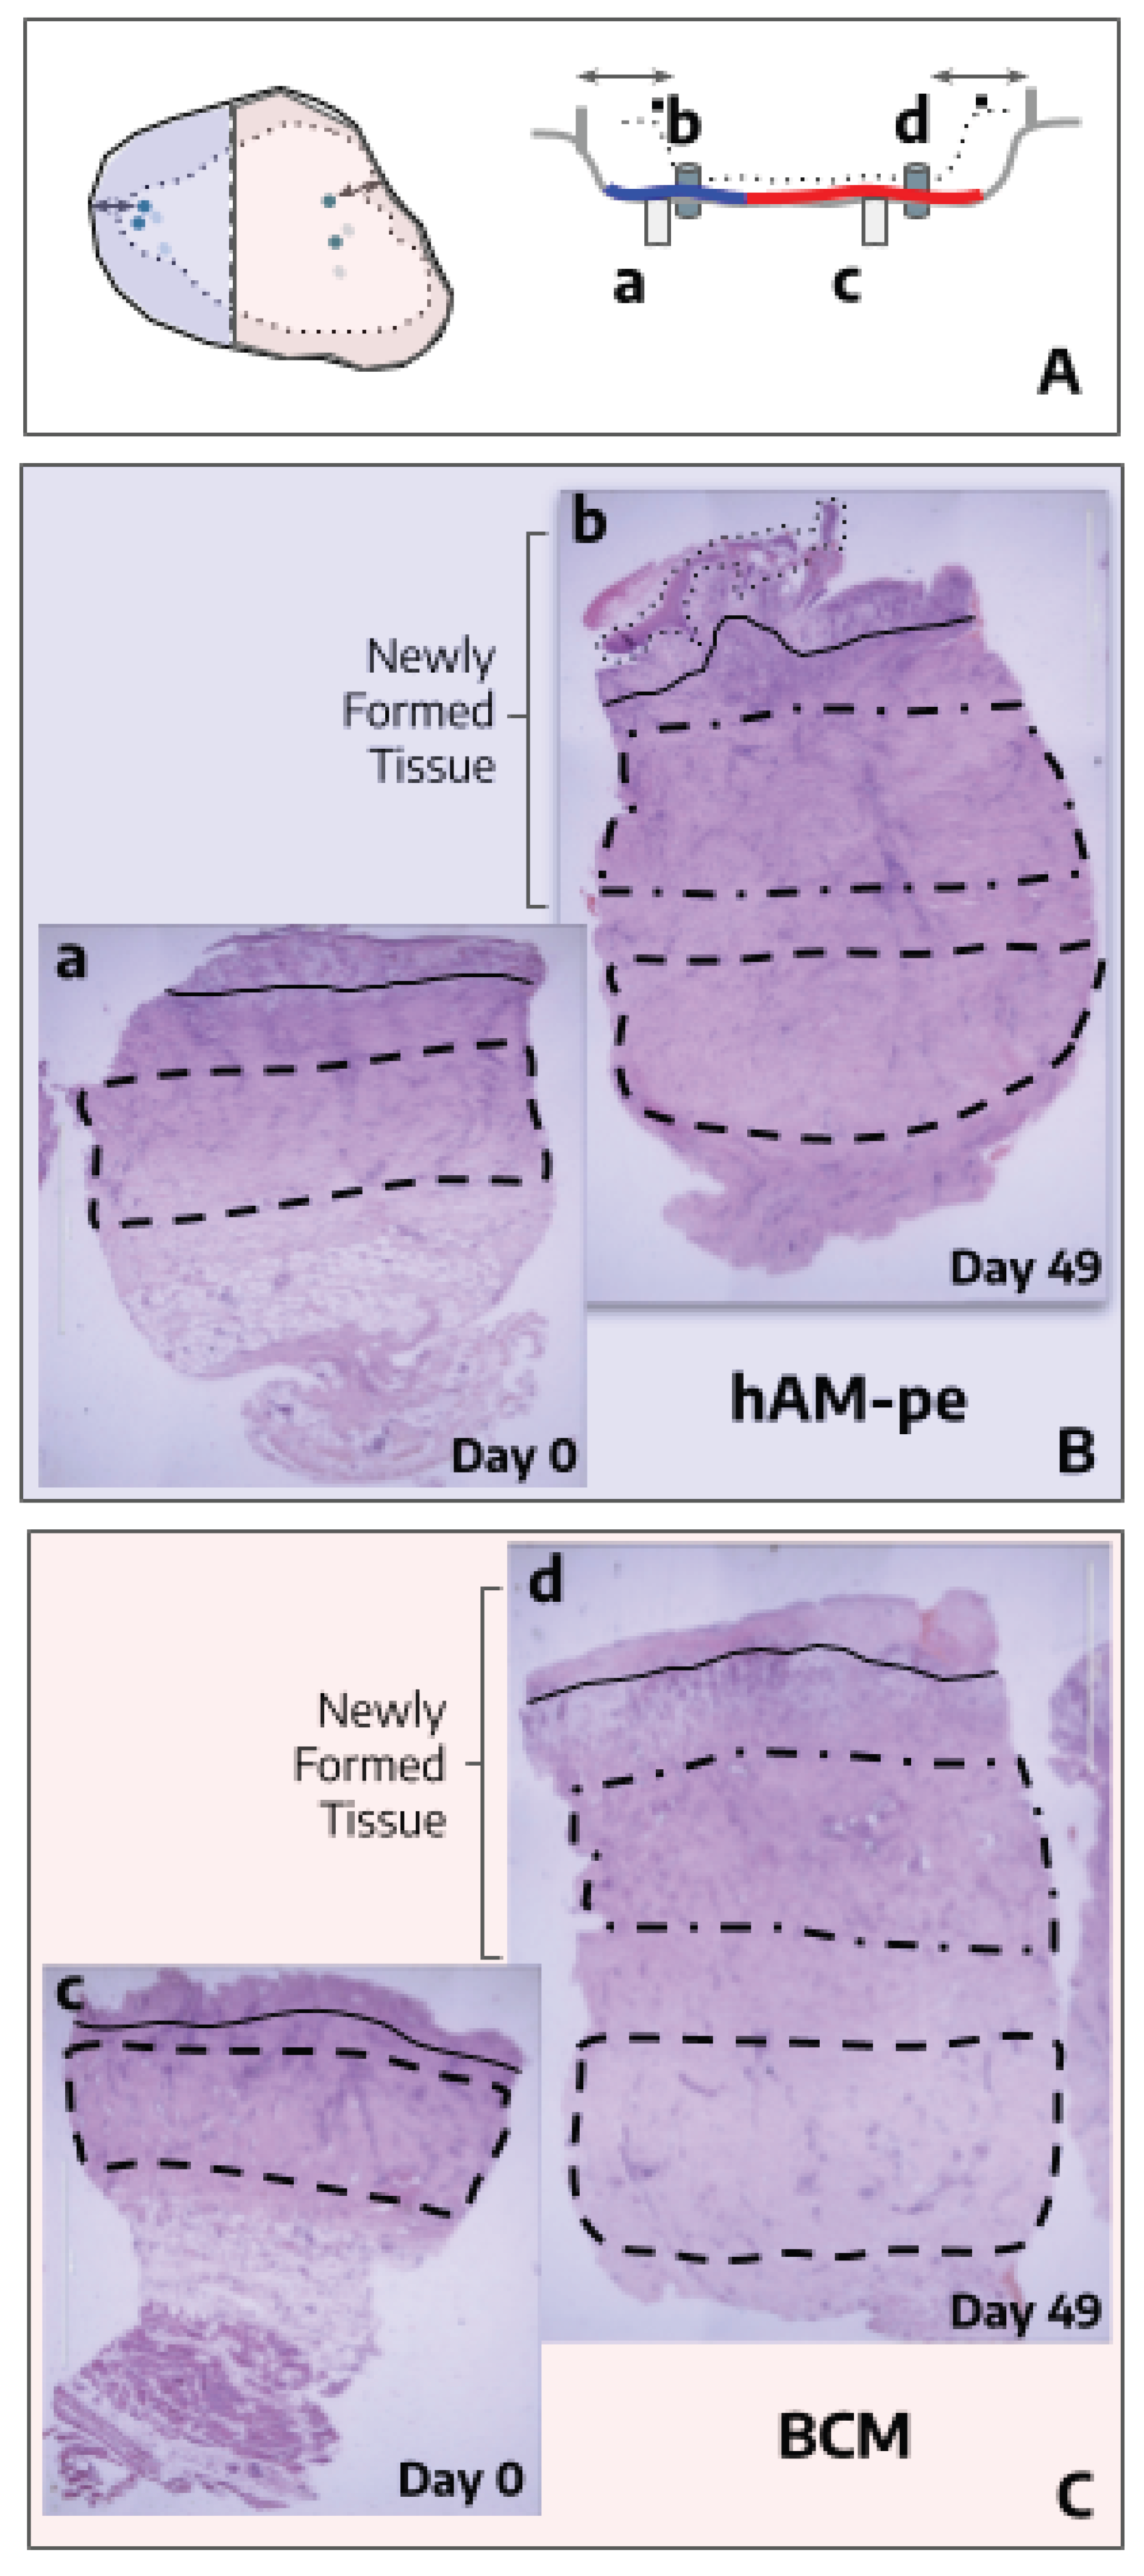
Figure 3.
Hematoxylin & Eosin-stained biopsy sections from the hAM-pe and BCM-treated zones, collected on day 49. 2X magnification.
Figure 3.
Hematoxylin & Eosin-stained biopsy sections from the hAM-pe and BCM-treated zones, collected on day 49. 2X magnification.
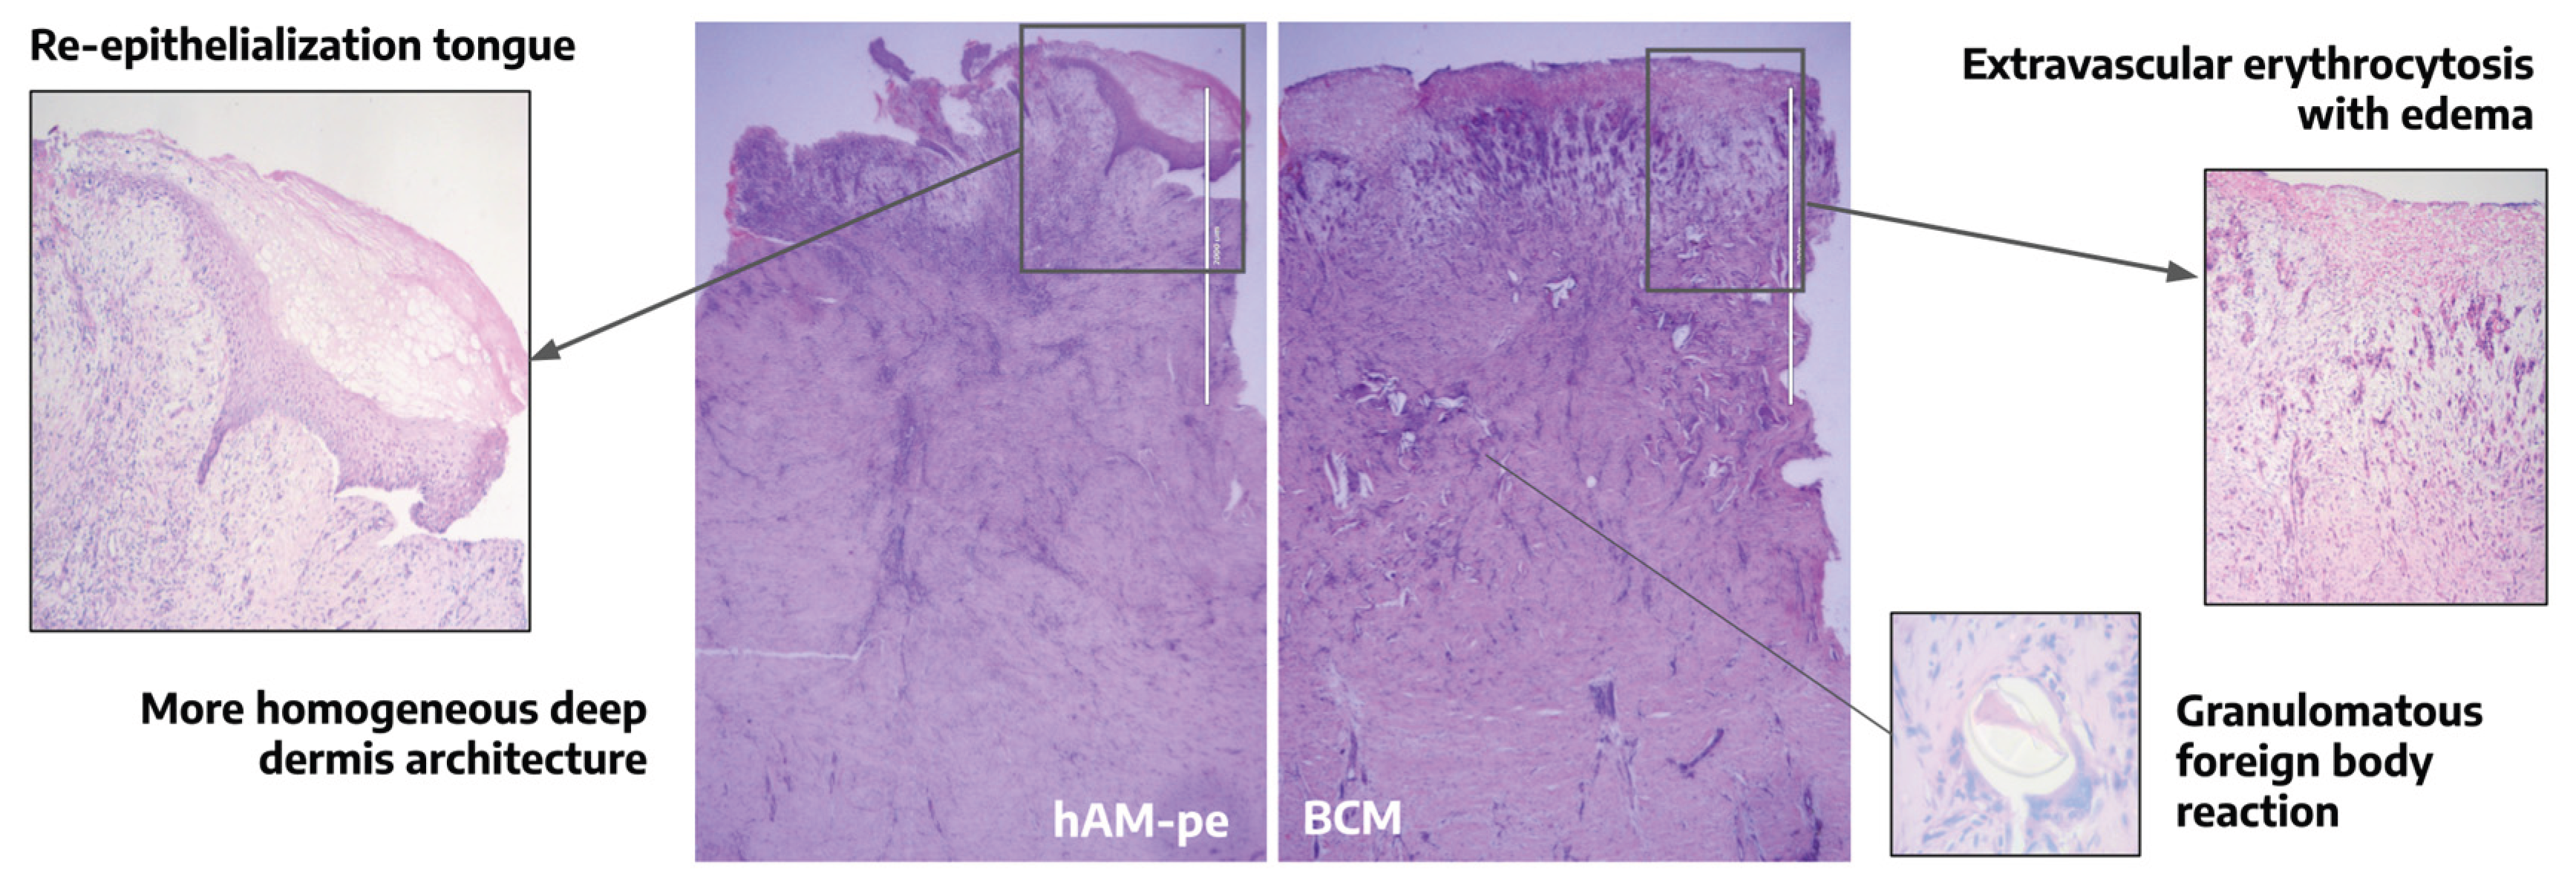
Figure 4.
(A) Bar graph depicting the ratio of type I (red area) to type III (green area) collagen fibers in newly formed tissue quantified in REGIONS 3 and 4 as indicated in Figure 2. Quantification was performed using 10 representative regions of interest (ROIs) from each region, at 20X magnification. Statistical analysis was conducted using a one-way ANOVA followed by Bonferroni’s post-hoc test. (B-C) Sirius Red staining of histological sections from biopsies collected from zones treated with hAM-pe (B) and BCM (C) after 49 days of treatment. Images on the right show the staining observed under brightfield microscopy, and on the left, the stains observed under polarized light. Type III collagen fibers are identified in green, and type I collagen fibers are in red/orange. 1.25X magnification.
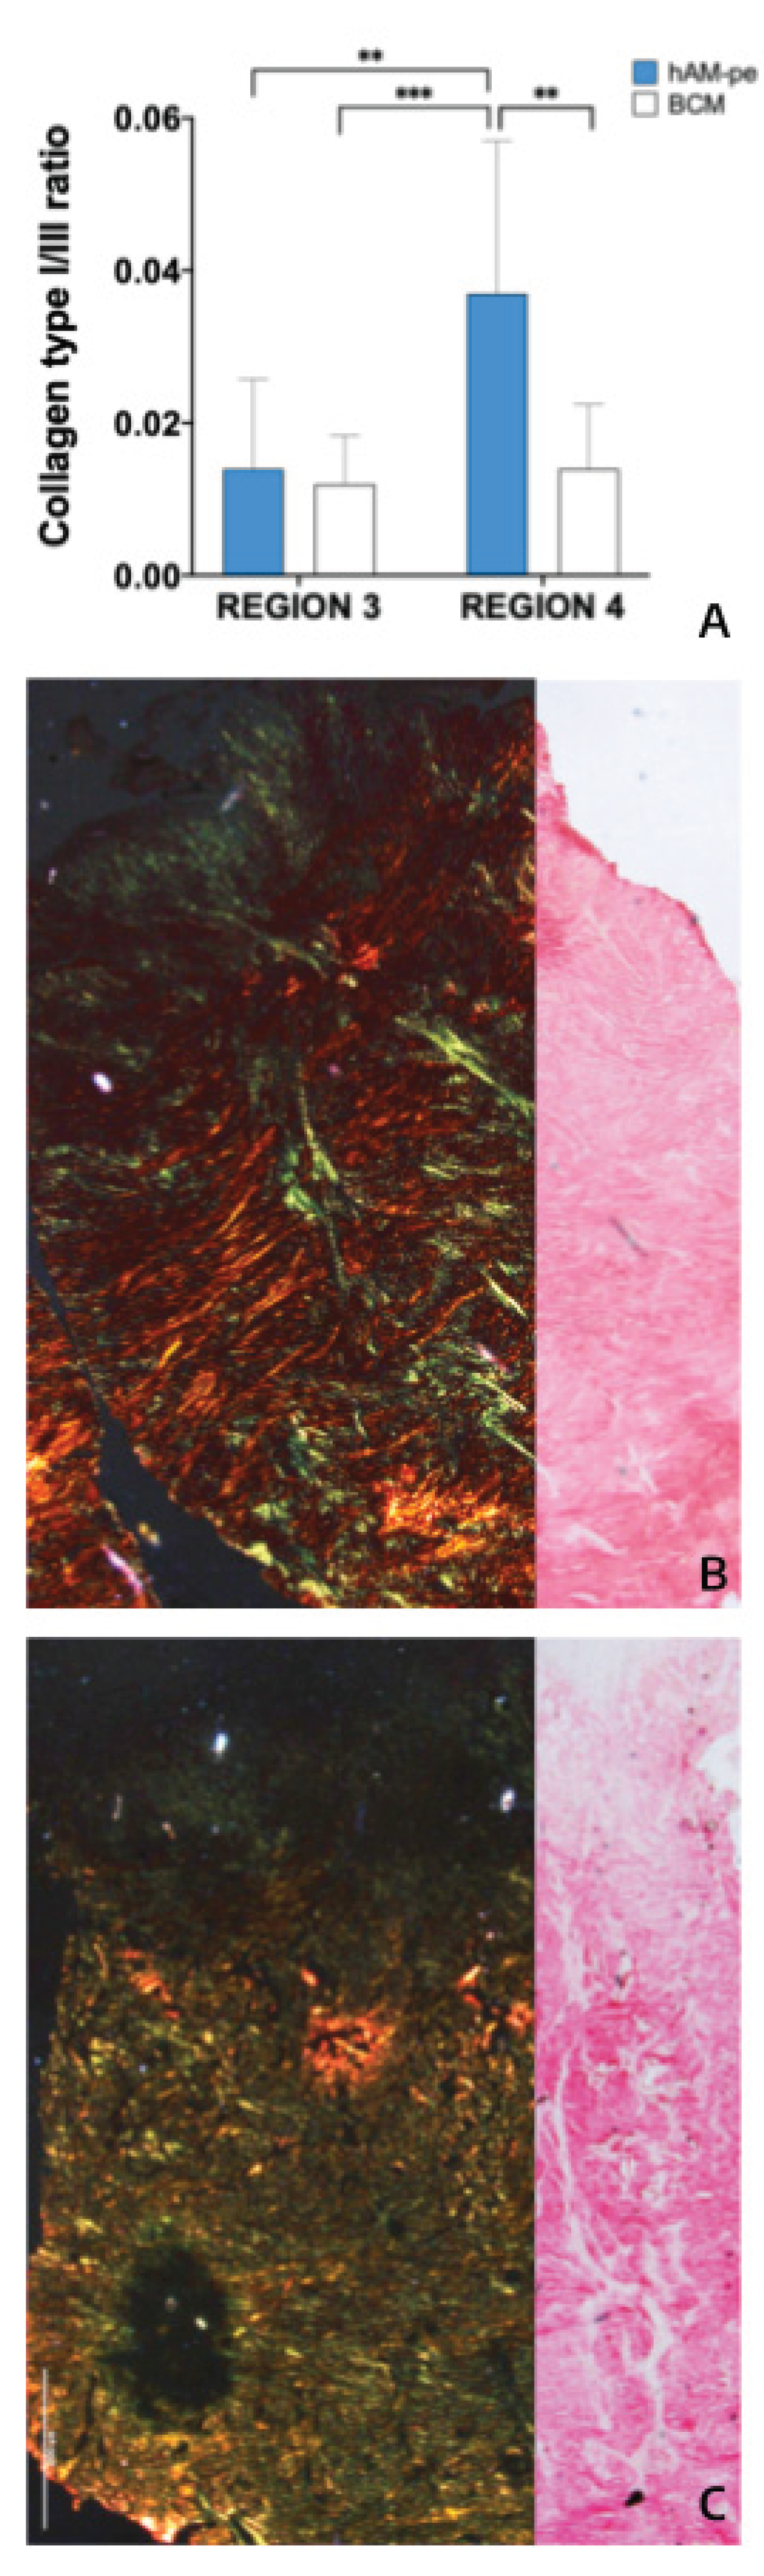
Figure 5.
Top left: The bar graph represents the ratio of type I to type III collagen fibers quantified in a complete 20X magnification scan of REGIONS 1 and 2 as indicated in Figure 2 and replicated in the histology map on the right. No statistical comparison was performed. Bottom: Microphotographs of the dermis base (REGION 2 and 1) from biopsies taken after 49 days of treatment: BCM (d) and hAM-pe (b), at 20X magnification. Arrows point to focal areas of collagen deposition while dashed lines highlight the arrangement of type I collagen fibers.
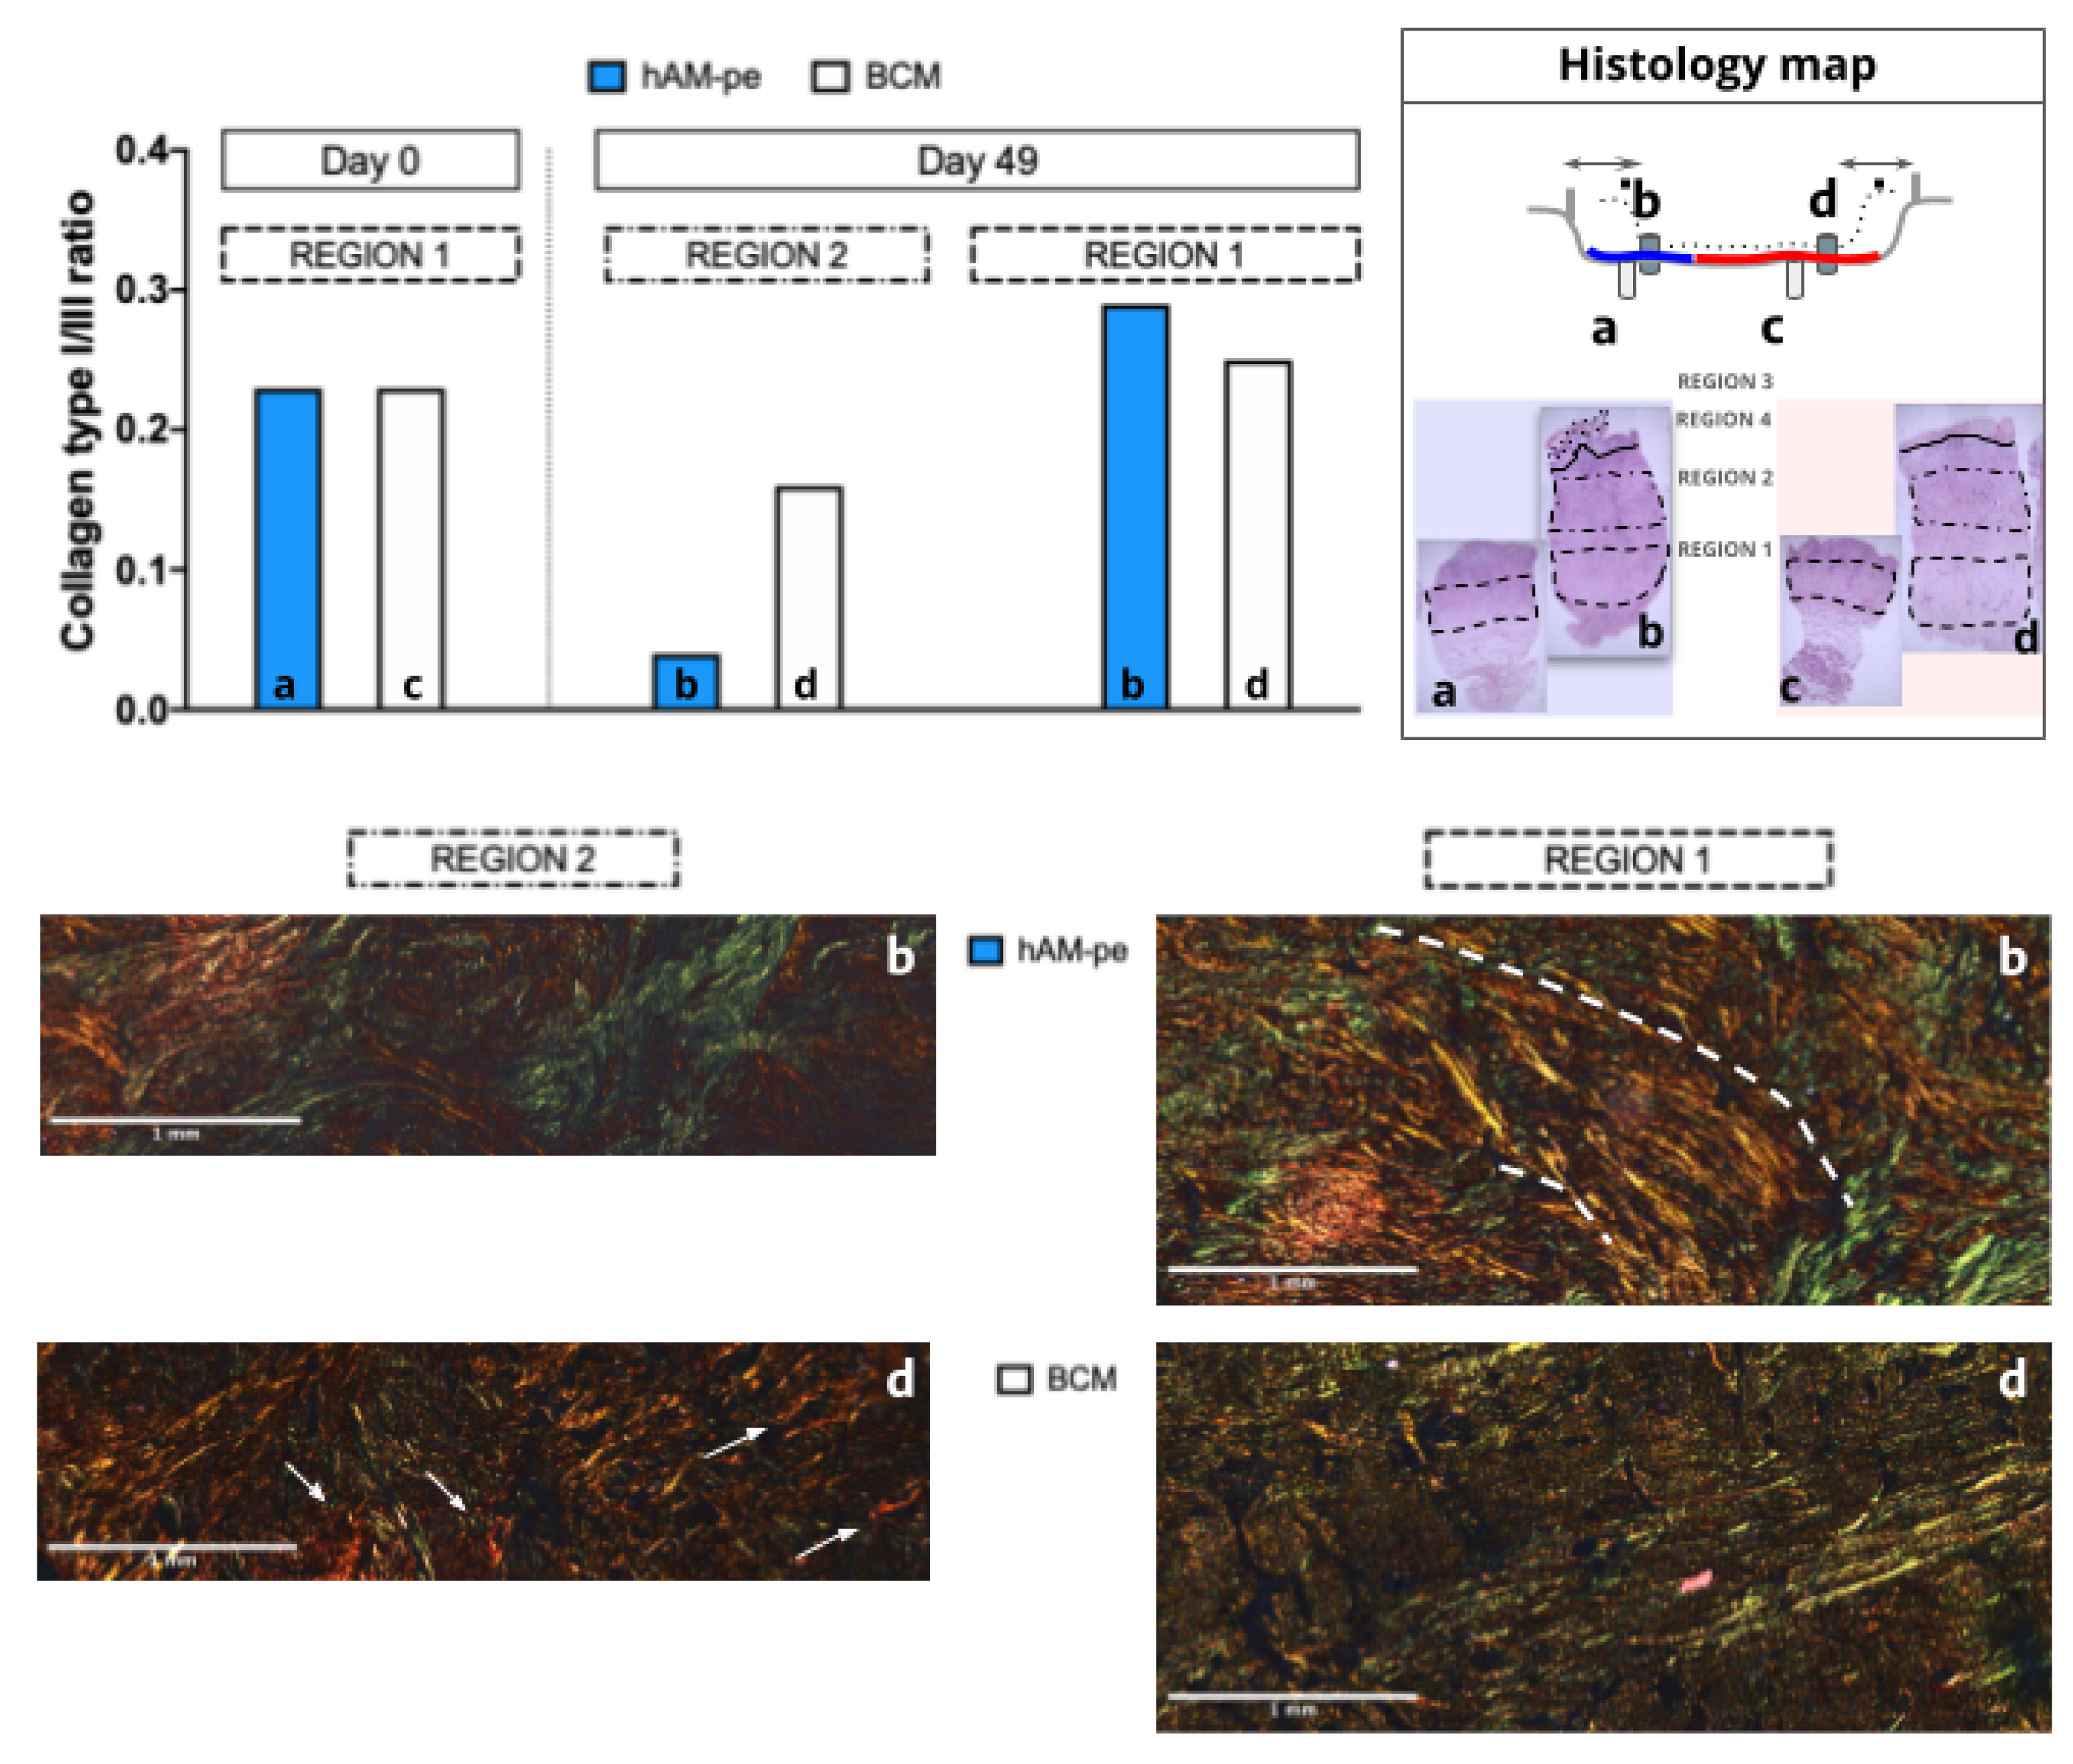
Figure 6.
CD34+ Area: (A-B) CD34 immunohistochemistry: Representative images, at 2X magnification, of sections under hAM-pe (A) and BCM (B) treatments, at day 49 show three structures fulfilling the criteria for vascular identification, marked with red arrows. An unpaired two-tailed t-test with Welch’s correction (α = 0.05) was applied to compare vascular cross-section results. (C) Quantification of the area, expressed as a percentage, corresponding to the positive signal of the CD34 marker in biopsies from regions treated with both therapies, by day 49. The quantification of CD34+ area in regions treated with hAM-pe and BCM was performed using immunohistochemistry (IHC). Student’s t-test, p < 0.001. (D) Comparison of microvessels density (number of microvessels/mm2) between treatments, at both timepoints, at 2X magnification. Statistical analysis was performed using ANOVA followed by Tukey’s post hoc test for multiple mean comparisons (α = 0.05) was performed. Significant differences are indicated as follows: # for comparisons between treatments, and * for comparisons between time points. (E) Comparison of microvascular cross-sectional area in both zones at the end of each treatment, at 10X magnification. Two tailed, Welch´s t test for unequal size and SD was applied to compare group means, p<0.0001.
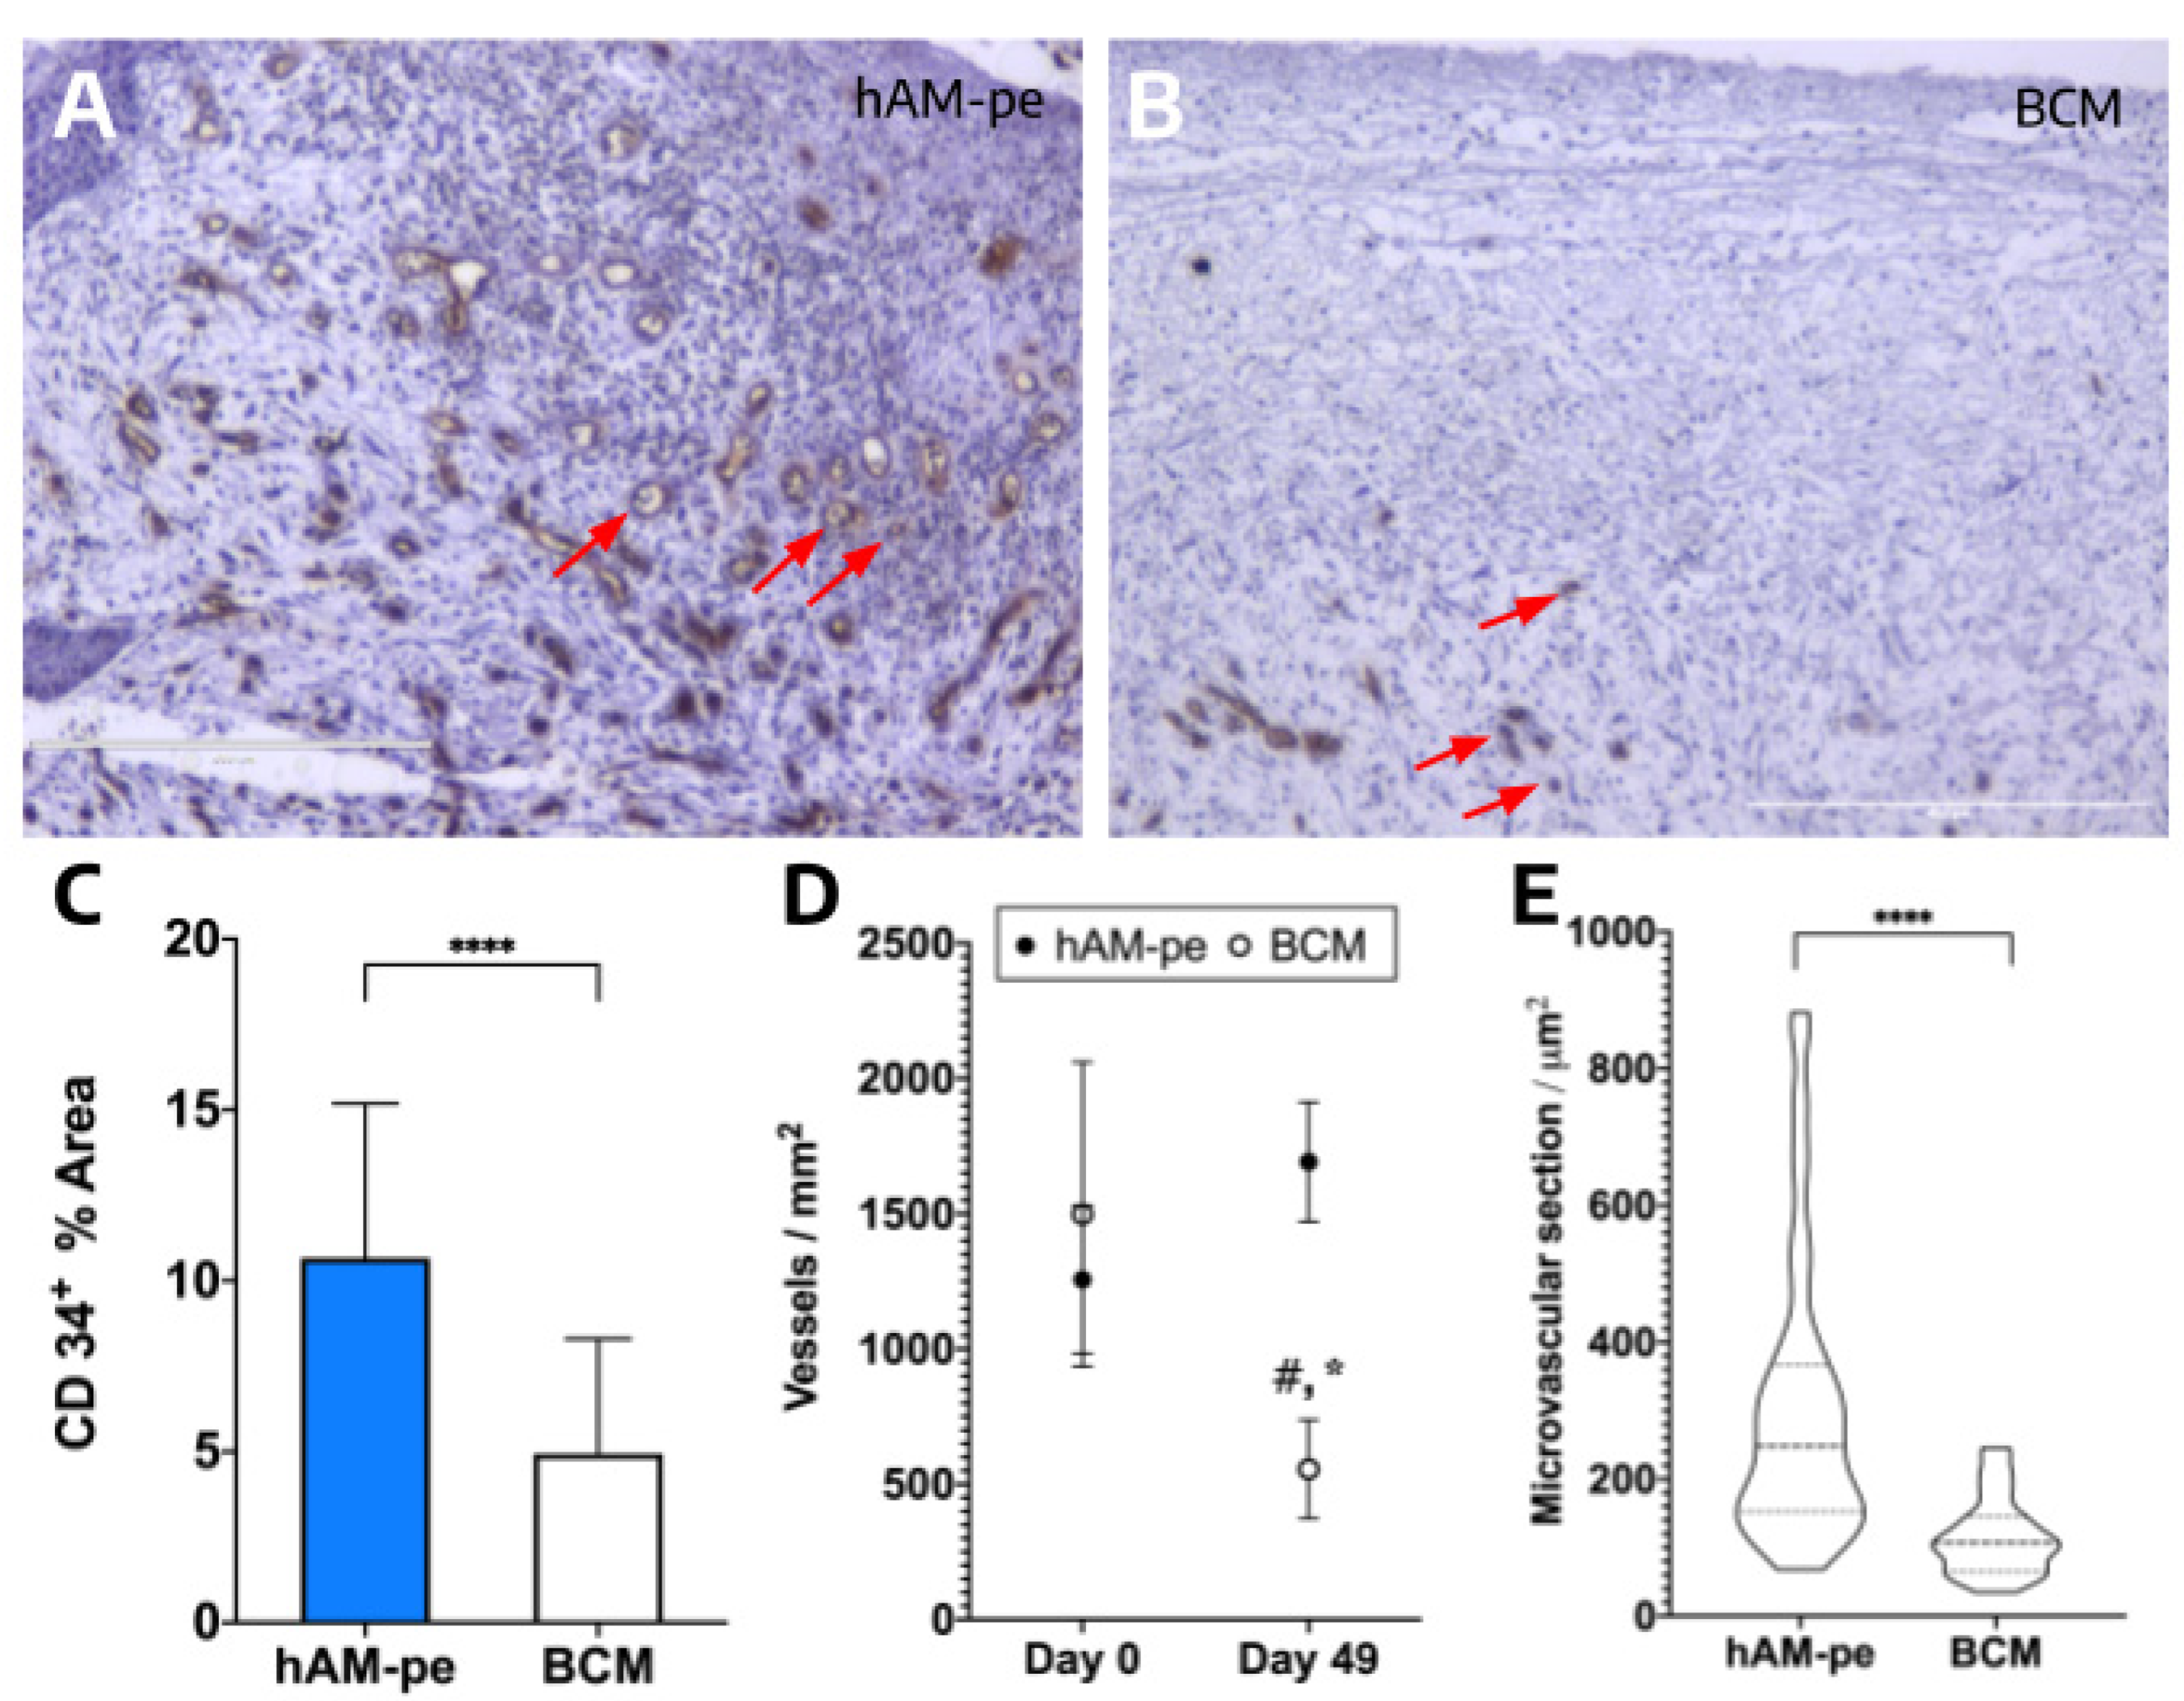
Figure 7.
Schematic representation of the strategy used for the comparative analysis of treatments based on the following criteria: Dashed, vertical arrows indicate expression changes between biopsies from different treatments at the initial (a - c) or final (b - d) time points. Bold horizontal arrows represent comparisons within treatments, between biopsies obtained at the final and initial time points for hAM-pe (b-a) and BCM (d-c), respectively. Letters a to d correspond to those used in figure 2 to identify each biopsy.
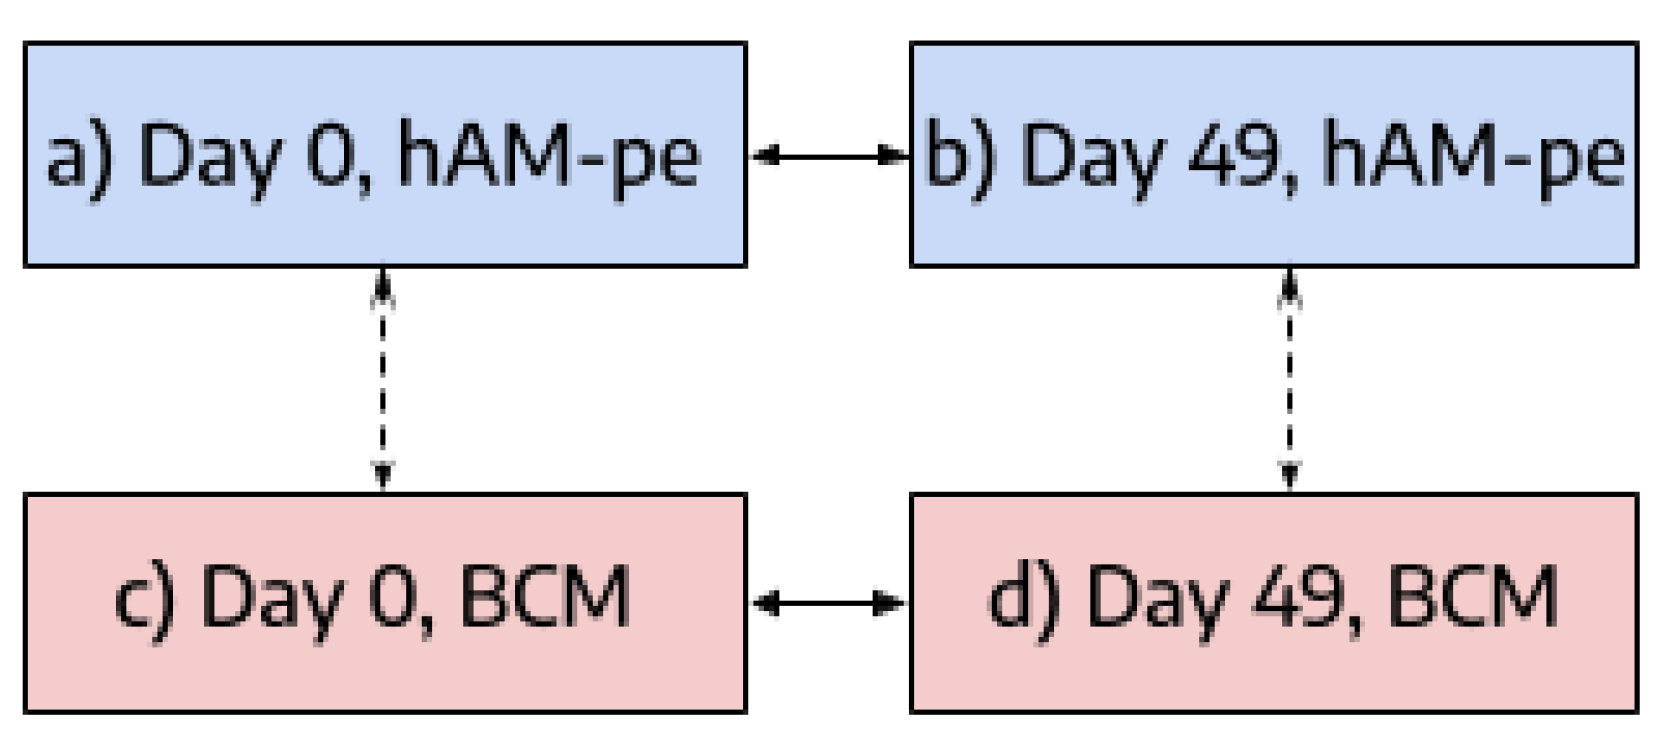
Figure 8.
Gene expression analysis of inflammatory, pro-regenerative, and extracellular matrix-related markers in different treatment conditions. (A) Expression levels of inflammatory cytokines (IL1β, TNFα) and immunomodulatory markers (TGFβ, ARG-1). (B) Angiogenic and chemotactic factors (VEGF, CCL2, IL-8, CXCL-10). (C) Extracellular matrix components (COL1A1, COL1A2, COL3A1) and fibroblast activation markers (FAP, α-SMA, MMP-2, TIMP-1). In this figure, each bar represents comparisons within treatment, between biopsies obtained at the final and initial time points for hAM-pe (blue) and BCM (white) treatments. Gene expression levels are presented as fold increase relative to the control condition (dashed line). Statistical significance was determined by two-tailed unpaired t-tests. All graphical representations show the mean and standard deviation of at least 3 independent RT-PCR experiments. Significance levels indicated as follows: *p < 0.05, **p < 0.01, ***p < 0.001, ****p < 0.0001.
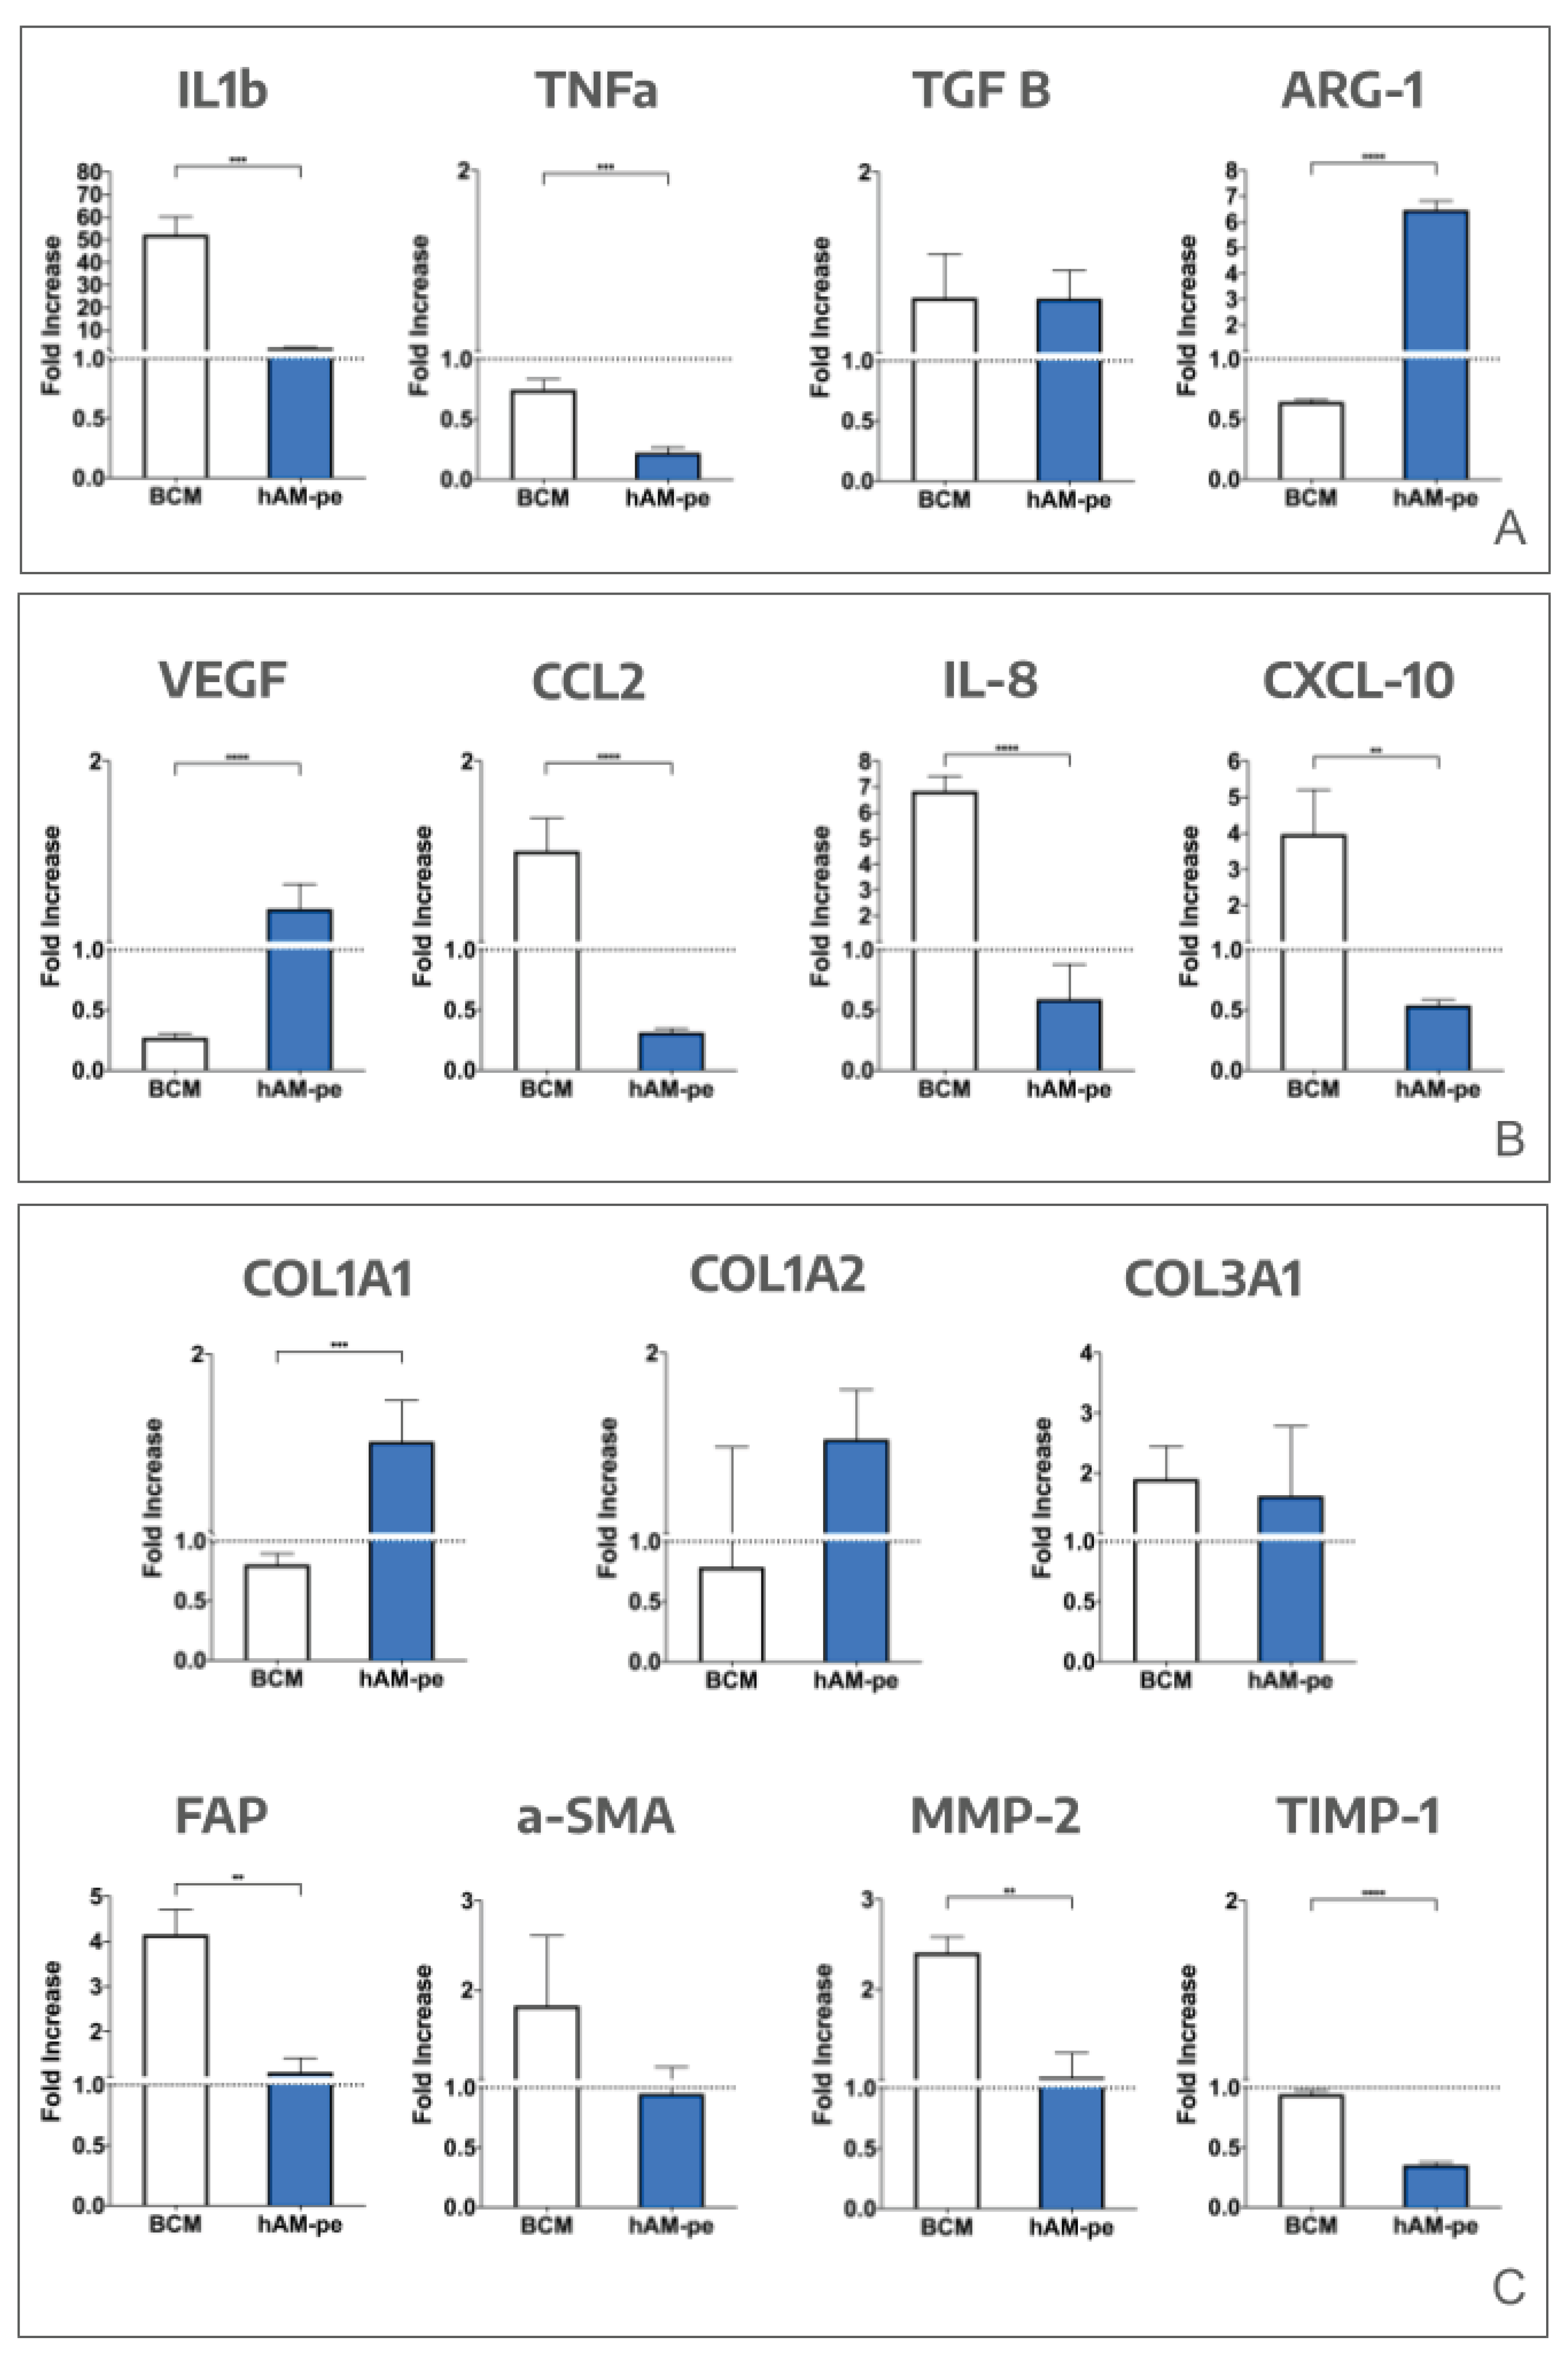

Table 1.
Primer sequences used for qPCR analysis.
| Amplicon | Forward primer | Reverse primer |
| β-actin | CCT GGC ACC CAG CAC AAT | GCC GAT CCA CAC GGA GTA CT |
| IL-1β | TAC GAA TCT CCG ACC ACC ACT ACA G | TGG AGG TGG AGA GCT TTC AGT TCA TAT G |
| TNF-ɑ | AAC CTC CTC TCT GCC ATC AA | CCA AAG TAG ACC TGC CCA GA |
| TGF-β | ACC CAC AAC GAA ATC TAT GAC | GCT CCA CTT TTA ACT TGA GCC |
| Arginase 1 | GTT TCT CAA GCA GAC CAG CC | GCT CAA GTG CAG CAA AGA GA |
| VEGF | CAC TGC CTG GAA GAT TCA | TGG TTT CAA TGG TGT GAG GA |
| CCL-2 | CGC CTC CAG CAT GAA AGT CT | ATG AAG GTG GCT GCT ATG AGC |
| IL-8 | CAC CGG AAG GAA CCA TCT CA | GGA AGG CTG CCA AGA GAG C |
| CXCL-10 | TCC ACG TGT TCA GAT CAT TGC | TGA TGG CCT TCG ATT CTG G |
| COL1A1 | CGA AGA CAT CCC ACC AAT CAC | TCA TCG CAC AAC ACC TTG C |
| COL1A2 | ACC TCA GGG TGT TCA AGG TG | CTT CTC CAG CGG TAC CAG AG |
| COL3A1 | CTG GTC CTG TTG GTC CAT CT | ACC TTT GTC ACC TCG TGG AC |
| FAP | ATG AGC TTC CTC GTC CAA TTC A | AGA CCA CCA GAG AGC ATA TTT TG |
| ɑ-SMA | AGG GAG TAA TGG TTG GAA TGG | TGA TGA TGC CGT GTT CTA TCG |
| MMP-1 | TCG CTG GGA GCA AAC ACA | TTG GCA AAT CTG GCG TGA A |
| MMP-2 | CCT CTC CAC TGC CTT CGA TA | GCC TGG GAG GAG TAC AGT CA |
| TIMP-1 | CGC TGA CAT CCG GTT CGT | GTG GAA GTA TCC GCA GAC ACT CT |
Disclaimer/Publisher’s Note: The statements, opinions and data contained in all publications are solely those of the individual author(s) and contributor(s) and not of MDPI and/or the editor(s). MDPI and/or the editor(s) disclaim responsibility for any injury to people or property resulting from any ideas, methods, instructions or products referred to in the content. |
© 2025 by the authors. Licensee MDPI, Basel, Switzerland. This article is an open access article distributed under the terms and conditions of the Creative Commons Attribution (CC BY) license (http://creativecommons.org/licenses/by/4.0/).
Copyright: This open access article is published under a Creative Commons CC BY 4.0 license, which permit the free download, distribution, and reuse, provided that the author and preprint are cited in any reuse.


