
Submitted:
14 April 2025
Posted:
15 April 2025
You are already at the latest version
Abstract
Wildfire activity has increased across the Great Plains in recent decades, raising concerns about the effectiveness and safety of prescribed fire as a land management tool. This study analyzes wildfire records from 1992 to 2020 to assess spatiotemporal patterns in wildfire risk and evaluate the role of prescribed fires. Results show a threefold increase in both wildfire frequency and area burned, with fire size increasing from east to west and frequency rising from north to south. Seasonal fire activity has shifted earlier in the year, especially in northern and high-elevation states. Drought severity, measured by the Keetch-Byram Drought Index, explained over half of the interannual variation in area burned, while grass curing accounted for 60% of monthly wildfire activity in grasslands. Prescribed fire had limited correlation with wildfire occurrence in spring but was associated with reduced wildfire activity in the following summer. The ratio of wildfire area burned to total area burned (dominated by prescribed fires) declined from over 20% in early March to below 1% by early April. These findings highlight the need for integrated risk assessment tools that account for long-term, mid-term, and short-term factors and support more effective fire management decisions across fire-prone landscapes.
Keywords:
WUI
; KBDI
; grass curing
; prescribed fire
; fire danger index
1. Introduction
Fire is a naturally occurring process in the prairie-grassland ecosystems of the U.S. Great Plains. Due to the region’s semi-arid climate, these ecosystems are inherently fire-prone [1], with wildfires typically occurring during extended dry periods [2]. Lightning is responsible for the majority (60–90%) of these wildfires, followed by human activities such as negligence and accidents [3]. While fire can play a beneficial ecological role, unplanned wildfires often result in adverse impacts and are among the most destructive natural hazards to human communities. These risks are particularly pronounced in the wildland–urban interface (WUI)—the transitional zone between undeveloped natural areas and human-built environments—where homes are increasingly built near flammable vegetation. As WUI areas continue to expand and the climate becomes hotter and drier [1], the frequency and severity of catastrophic wildfires are projected to rise, posing greater threats to livelihoods in these regions [4]. Understanding wildfire risk is essential for guiding the strategic allocation of resources to mitigate wildfire hazards [5].
Given that eliminating fire from fire-prone ecosystems is not realistic, prescribed fire has been used as a tool for maximizing socio-ecological benefits while minimizing the harmful impacts of uncontrolled wildfire [6]. Historically, Indigenous peoples frequently used deliberate fire to manage prairie landscapes, with such practices often exceeding the frequency of lightning-induced wildfires [7]. Unlike unplanned wildfires, prescribed fires are intentionally planned and conducted under controlled conditions to achieve specific land management objectives. They offer a cost-effective and indispensable method for reducing fuel loads, mitigating wildfire risk [8], and dealing with a fire deficit [9]. Amid rising wildfire threats, there is increasing advocacy for the expanded use of prescribed fire [10]. However, perceived risks and concerns about legal liability continue to hinder its widespread adoption, particularly among private landowners [11,12]. As the need for prescribed fire grows and more novice landowners and stakeholders engage in decision-making [9], it is crucial to reduce the barriers to safe, effective, and collaborative implementation of prescribed fires [6]. A deeper understanding of both wildfire and prescribed fire risks can provide valuable insights into these barriers [11]. Furthermore, for landowners to use prescribed fire effectively, they must be aware of seasonal windows for safe application and how these windows are shifting in response to climate change [13,14,15].
Our overarching goal is to develop a localized fire risk index through a data-driven modeling approach to support the planning and implementation of prescribed fire in the Great Plains. The specific objective of this study is to characterize and quantify wildland fire risks by synthesizing data from both prescribed fires and wildfires. We will evaluate long-term, mid-term, and short-term risk factors to support the development of a fire risk quantification tool that assists wildfire and prescribed fire management in this region.
2. Materials and Methods
2.1. Wildfire Data
Wildfire data were obtained from the Fire Program Analysis Fire Occurrence Database, which is managed by the U.S. Forest Service. This dataset consolidates wildfire records from federal, state, and local fire reporting systems and is standardized according to National Wildfire Coordinating Group protocols, including updated wildfire cause classifications [16]. For this study, we extracted all geo-referenced wildfire records across the ten states comprising the U.S. Great Plains from 1992 to 2020. Although the source dataset had undergone basic error-checking, we conducted an additional round of data cleaning to improve data reliability. Duplicate records were identified and removed, resulting in a refined dataset of 497,749 wildfire incidents spanning a total burned area of over 18 million hectares across 29 years. From the more than fifty available variables, we focused on key attributes including the fire start date (reported as the discovery date), final fire size (in hectares), and geospatial location—accurate to at least the Public Land Survey System section level, approximately one square mile. Geospatial processing was performed using the Tigris and sf packages in R. This included reading spatial location data, importing county shapefiles, and subsetting fire records based on geographic coordinates to improve spatial precision for subsequent analysis.
2.2. Prescribed Fire Data
Prescribed fire is a long-established land management practice in the Flint Hills region, which spans much of eastern Kansas and Oklahoma. On average, approximately 0.8 million hectares are intentionally burned in the region each year, with most prescribed fires occurring during April. To quantify prescribed fire activity, we used a remotely sensed burned area dataset derived from the Moderate Resolution Imaging Spectroradiometer (MODIS) onboard NASA’s Terra and Aqua satellites [17]. This dataset, which covers the 17 Flint Hills counties from 2003 to 2019, was generated using a supervised minimum distance classification of bi-spectral MODIS imagery. It provides daily burned area estimates at a 250-meter spatial resolution and captures both prescribed and unplanned fire events across the region. For our analysis, we integrated the MODIS-based daily burned area data with reported wildfire burned area data to enable comparative assessments of prescribed fire and wildfire trends.
2.3. Long-Term and Mid-Term Risk Factors
To characterize long-term and mid-term fire risk factors, we included data from the Keetch–Byram Drought Index (KBDI) and grassland curing levels. The KBDI is a slow-response drought index developed by the USDA Forest Service to quantify seasonal soil moisture depletion, particularly in forested ecosystems [18]. Over the past five decades, KBDI has become one of the most widely used indicators for wildfire monitoring and prediction [19,20]. However, given that it was originally designed for forest landscapes, its applicability to grassland ecosystems—such as those in the Great Plains—requires further evaluation. Grassland curing, defined as the proportion of dead material within a grassland fuel complex, is a critical factor in grassland fire behavior. Fires typically do not spread at curing levels below 50%, but can spread rapidly when curing exceeds 90% [21]. Therefore, it is an important factor for determining fire danger levels in grasslands [22]. Grassland curing can be estimated from satellite-derived vegetation greenness metrics, particularly the Normalized Difference Vegetation Index (NDVI) [23]. We obtained KBDI and grassland curing data from the Oklahoma Mesonet network for the years 2006 to 2019. These variables were included in our analysis as proxies for long-term and mid-term fire risk, respectively.
3. Results
3.1. General Trends of Wildfires in the Great Plains
Between 1992 and 2020, the Great Plains experienced approximately 498,000 wildfires, burning a cumulative area of about 18 million hectares (ha). On average, this equates to roughly 17,000 wildfires and 0.6 million ha burned per year. The mean wildfire size across the ten Great Plains states was approximately 36 ha per incident. The average wildfire size per burn was notably larger in Montana, Wyoming, and New Mexico (Figure 1a). This pattern is likely due to the greater prevalence of woody vegetation in these mountainous western states, which is more conducive to extreme wildfire behavior compared to other land-use types in the region [24]. As also reported by Scasta et al. [25], wildfire frequency generally increases from north to south, driven by rising temperatures. Texas, in particular, exhibits the highest wildfire frequency. As a result, both the western and southern Great Plains states tend to have larger annual burned areas (Figure 1b).
Both the total number of wildfires and the annual burned area in the Great Plains increased approximately threefold from 1992 to 2020 (Figure 2). This trend is consistent with Donovan et al. [26], who reported a fourfold increase in the area burned by large wildfires (>400 ha) between 1985 and 2014 using hurdle models. These results also align with recent findings based on satellite observations [27,28], wildfire reports [29], and simulation models [30], all of which suggest an upward trend in wildfire activity across the western United States. While Yu et al. [31] noted that the increase in total burned area has outpaced the rise in wildfire frequency—implying larger average fire sizes—the data for the Great Plains do not show a significant increase in mean fire size. However, substantial increases in maximum fire size were observed during major drought years, including 2000, 2006, and 2011–2012. During these periods, both the number of wildfires and the total area burned surged, while year-to-year variability in area burned was higher (lower R²) compared to variability in the number of fire incidents (Figure 2).
The increasing trend in wildfire activity is likely driven by multiple factors. Climate change—particularly warmer and drier conditions—has contributed to drier vegetation and extended fire seasons [6,32]. The increasing frequency and size of large wildfires have been linked to intensifying drought severity [27,33]. Human factors, such as population growth near wildland areas [34] and fire suppression policies that lead to fuel accumulation [35], may also play a role in escalating wildfire risks.
3.2. Interannual Variability of Wildfire Risks and the KBDI
Interannual variability in wildfires is closely linked to the severity of drought conditions in a given year. The KBDI, which reflects soil moisture deficit, serves as a strong indicator of drought severity. A higher annual average KBDI generally corresponds to larger average wildfire sizes and greater wildfire frequency, resulting in a greater total area burned (Figure 3). This trend highlights the positive correlation between drought severity and wildfire potential. While both wildfire frequency and wildfire size increase with rising KBDI, comparing to wildfire frequency, wildfire size is more sensitive to drought conditions. For example, as the annual average KBDI increases from 150 to 350, the number of wildfires rises by approximately 25%, while average wildfire size doubles, from around 30 ha to 60 ha. Consequently, total area burned at a KBDI of 350 is 2.5 times greater than at a KBDI of 150. Overall, the annual average KBDI explains 51% of the interannual variability in total area burned, making it a critical long-term risk factor for wildfires.
KBDI has been widely used to model wildfire potential [36,37]. Abatzoglou and Williams [38] reported R² values ranging from 0.6 to 0.8 between KBDI and area burned across southwestern U.S. forests, compared to 0.51 in this study of the Great Plains. However, other factors—such as fuel accumulation—also contribute to wildfire variability. Fuel accumulation is influenced by the timing and amount of precipitation during the growing season, regardless of the current drought severity. Scasta et al. [25] found that in Oklahoma and Wyoming, the most severe wildfire seasons often followed years with average or above-average precipitation, while in Nevada, wildfire activity was linked to precipitation from the previous year. These dynamics may explain why the relationship between KBDI and area burned tends to be more robust at broader spatial scales [31]. The R² between KBDI and area burned across the entire Great Plains is stronger than the correlations found within individual states, suggesting that localized differences in fuel conditions introduce uncertainty in smaller-scale assessments.
3.3. Seasonal Pattern of Wildfires
Seasonal wildfire patterns in the Great Plains vary geographically and are influenced by differences in land cover. In the western Great Plains, wildfire occurrences typically peak in summer, whereas in the eastern states, peak wildfire activity occurs in spring (Figure 4a). This contrast likely reflects differences in dominant vegetation types—woody vegetation in the west versus grasslands in the east. Yu et al. [31] identified a bimodal seasonal distribution of wildfires across the U.S., with a primary peak in August and a secondary peak in April, a pattern consistent with findings from this study. The summer wildfire peak is likely driven by convective storms and frequent lightning strikes [39]. In contrast, in grassland regions, the wildfire peak often occurs in spring before grass green up, as dormant grasses are more flammable than actively growing grasses. Wildfire size also exhibits distinct seasonal patterns by region. In the southern Great Plains states (Texas, New Mexico, Oklahoma, and Kansas), wildfires are largest in spring—about 1 to 2 times larger than in other seasons (Figure 4b). In contrast, northern states such as Wyoming and Montana see peak wildfire sizes in summer. Notably, in Oklahoma and Kansas, both wildfire numbers and sizes peak in spring, indicating that wildfire risk is highest during that season. In Texas, while most wildfires occur in summer, the largest total area burned is recorded in spring.
From 1992 to 2020, seasonal trends in wildfire activity have shifted. In Montana and Wyoming, the peak month for area burned has moved from August to July, as evidenced by increasing trends in July and declining trends in August. Similarly, in Colorado and New Mexico, the peak shifted from July to June. In Oklahoma and Kansas, wildfire activity increased in February and March while remaining relatively stable in April, suggesting a gradual shift of the wildfire season toward earlier months. These changes likely reflect the effects of climate change, which has resulted in earlier onset of hot and dry conditions. As also noted by Scasta et al. [25], such seasonal shifts are especially apparent in cooler, high-latitude and high-elevation regions like Montana and Wyoming.
3.4. Seasonal Wildfire Risk and Grass Curing
Monthly wildfire numbers in Oklahoma are positively correlated with average grass curing levels (Figure 5). Regression analysis indicates that grass curing explains approximately 60% of the variability in monthly wildfire occurrences, highlighting its role as a significant mid-term fire risk factor in grassland ecosystems. However, grass curing alone does not fully explain seasonal wildfire patterns. For instance, wildfire numbers in July and August are substantially higher than in May and June, despite all four months exhibiting similarly low grass curing levels (<20%). This discrepancy is likely due to additional short-term risk factors, such as higher temperatures and increased lightning activity during midsummer. Conversely, December through February experience significantly fewer wildfires than March, even though all these months exhibit similarly high grass curing levels (>80%). This is likely due to lower winter temperatures, which reduce ignition potential despite high fuel dryness. These observations suggest that while grass curing is a strong predictor of wildfire likelihood, temperature, lightning, and potentially wind also play crucial roles in determining actual fire activity. Additionally, the sharp increase in wildfire numbers in March raises questions about the influence of prescribed fire practices, which are commonly conducted in early spring. Further investigation is warranted to determine the extent to which these prescribed fires contribute to wildfire statistics during that period.
3.5. Prescribed Fires vs. Wildfires
Figure 6a compares the total area burned and the wildfire area burned during spring in the Flint Hills region. On average, wildfires accounted for only about 1% of the total burned area in spring. The weak positive correlation between wildfire area burned and total area burned in spring suggests that prescribed fire activity explains only 8% of the variation in wildfire activity. This finding aligns with Reid [3], who reported that prescribed fire ignitions contribute the least among known ignition sources, ranging from 0 to 13.2%. Similarly, Toledo et al. [40] found that wildfire risk was only marginally associated with prescribed fire use, based on a structural equation model. Figure 6b illustrates the relationship between the total area burned in spring and the wildfire area burned in the following summer. Generally, years with larger spring burn areas—primarily due to prescribed fires—corresponded to reduced wildfire activity in summer, with the exception of 2007 and 2013. In both years, fires were limited in both seasons, likely due to fuel shortages from preceding severe droughts. In most other years, a negative relationship (R² = 0.26) was observed between the total area burned in spring and the wildfire area burned in summer, indicating that prescribed fires in spring may help mitigate summer wildfire risk. Figure 6a,b also reveal a seasonal shift in wildfire activity after 2013, with more wildfires occurring in spring rather than summer. This is consistent with earlier findings that wildfire activity has gradually moved earlier in the year—from April to March and February—in Kansas and Oklahoma. To assess fire risk during the spring prescribed fire season, the ratio of wildfire area burned to total area burned was calculated. As shown in Figure 6c, this ratio displayed an increasing trend from 2003 to 2019, suggesting rising fire risk in the Flint Hills region, which could make the implementation of prescribed fires more challenging due to growing safety concerns.
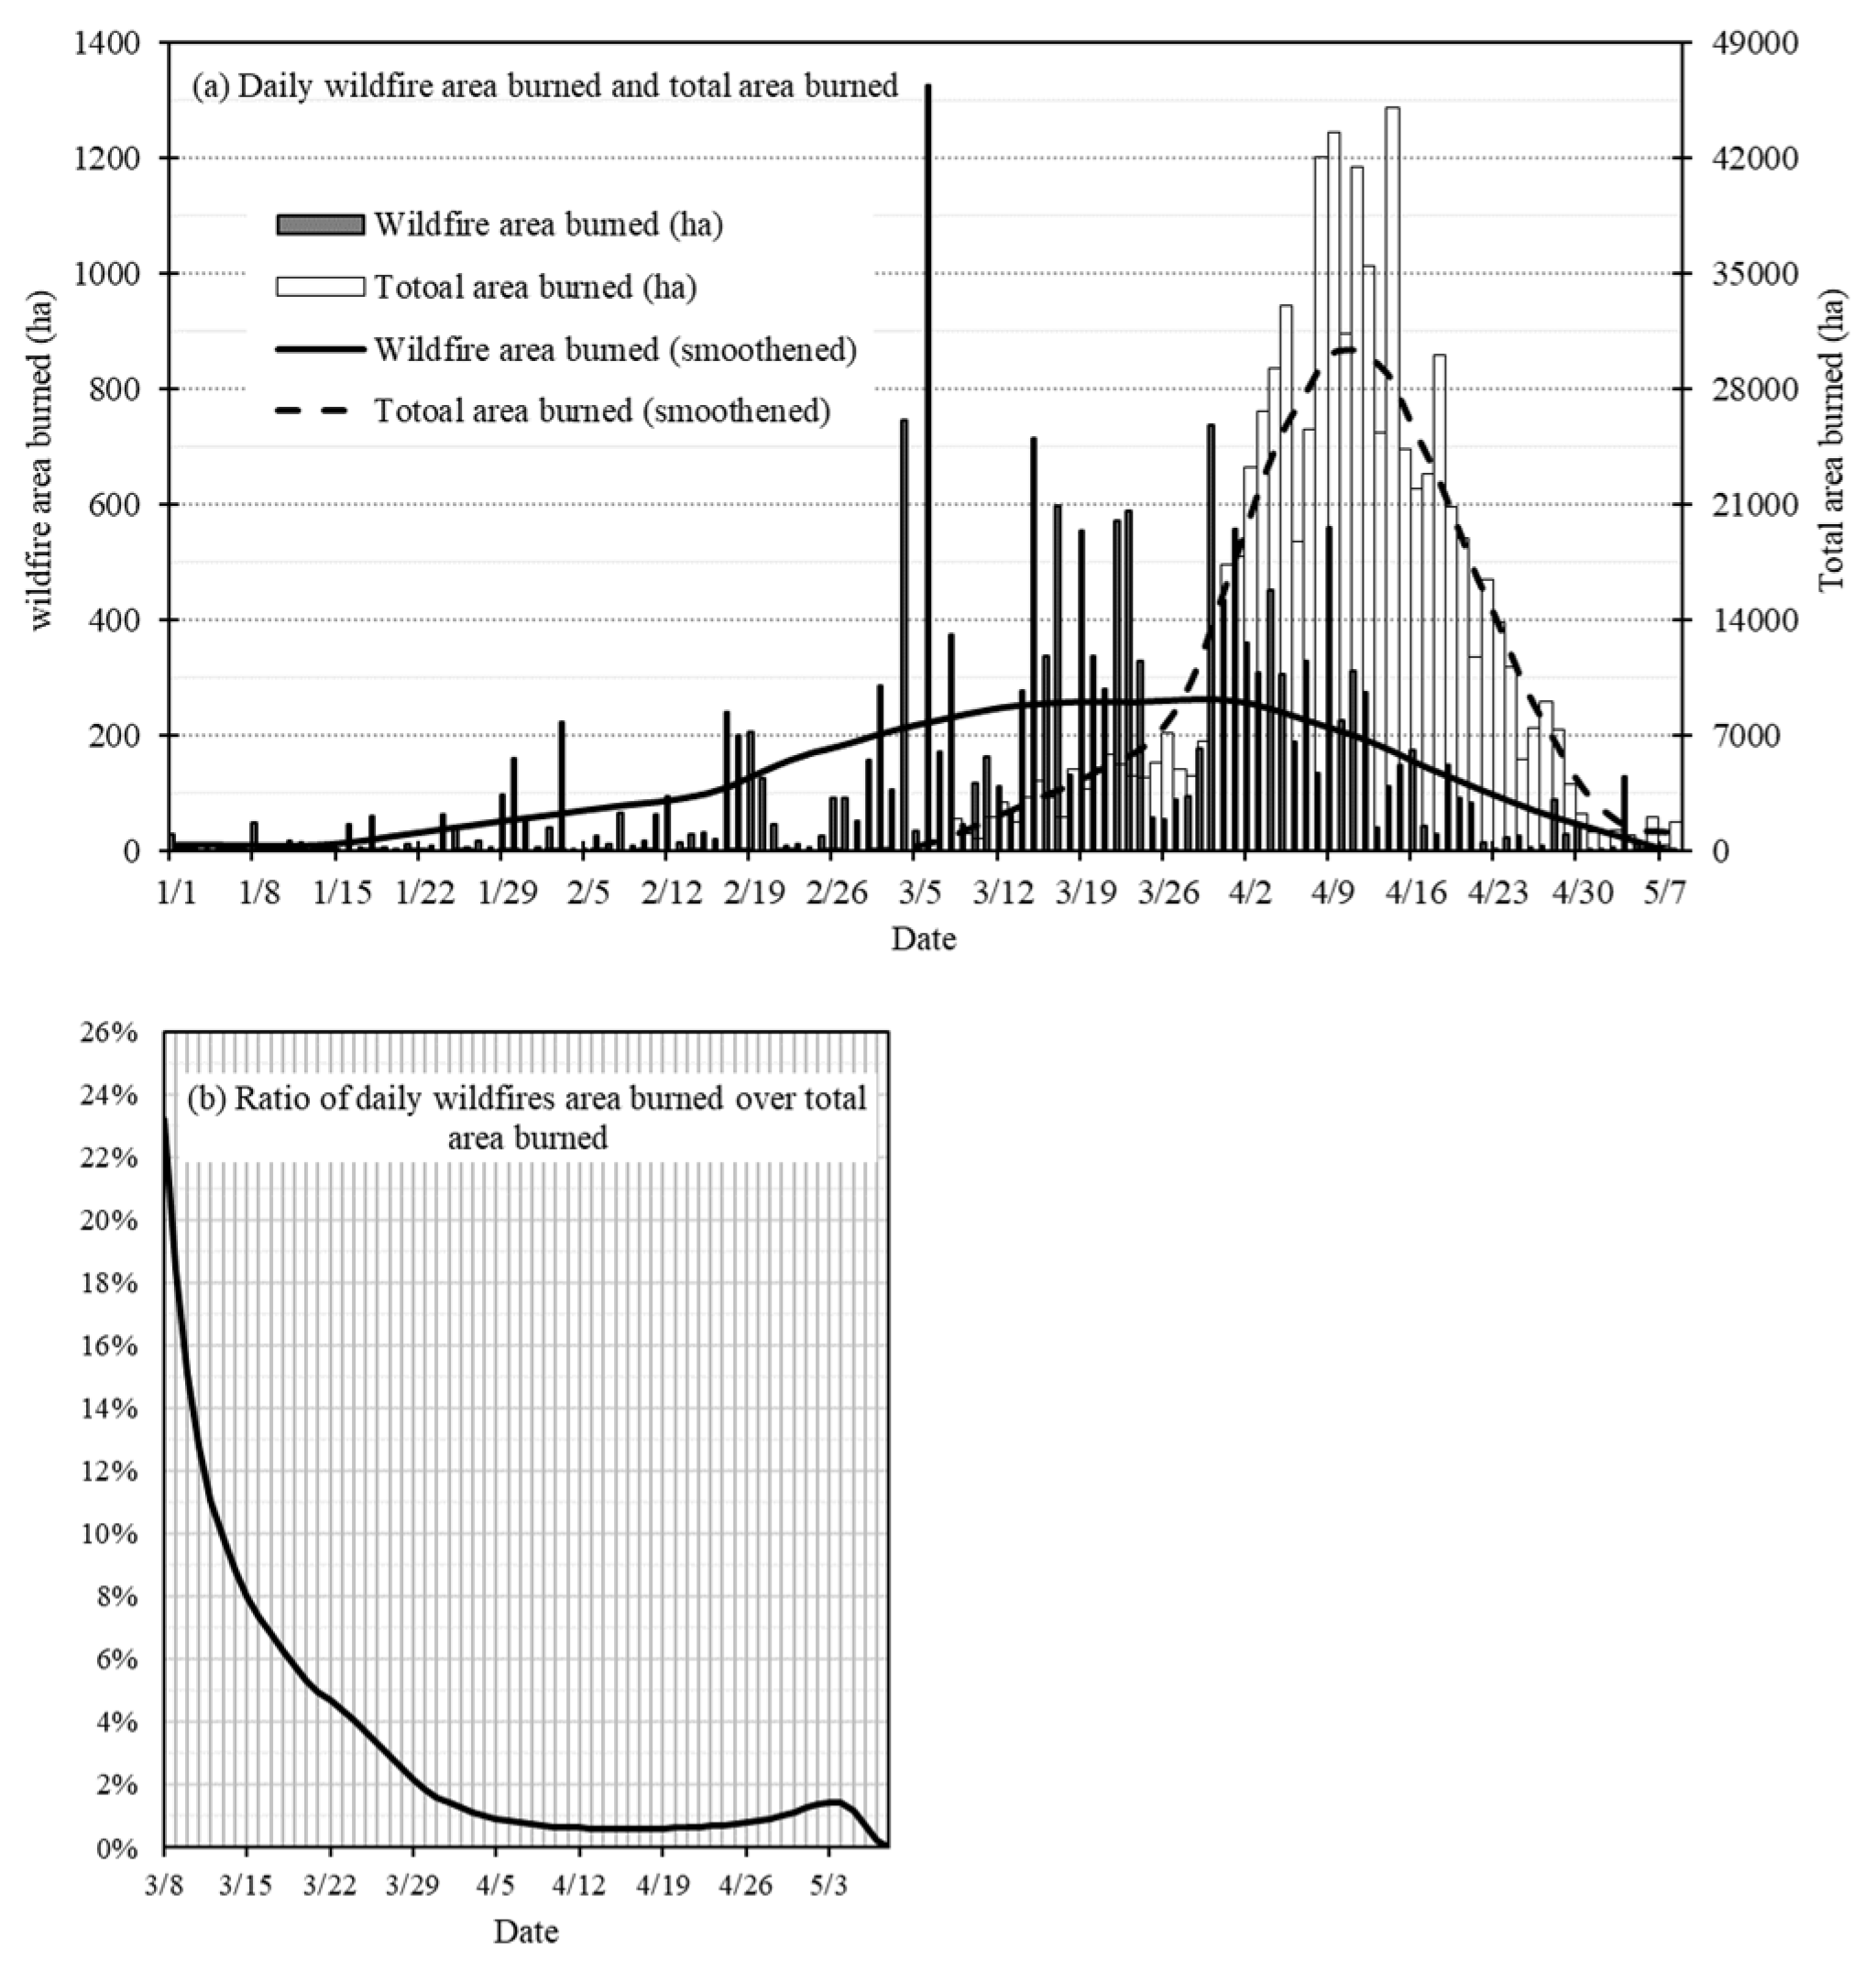
Figure 7a presents the multi-year average of daily wildfire and total area burned. Both metrics followed a bell-shaped distribution, with wildfire activity peaking around March 22 and total burn area peaking around April 10. March experienced significantly more wildfire activity than April, even though prescribed fire activity peaked in April, as also shown in Figure 5. This suggests that wildfire occurrence is more strongly influenced by grass curing status than by prescribed fire operations. Typically, more prescribed fires usually indicate weather and fuel conditions with lower fire risks, while more wildfires usually indicate conditions with higher fire risks. The ratio of wildfire area burned to total area burned varied by day of year. Figure 7b shows the ratio of daily wildfire area burned to total area burned throughout the spring season. The ratio declines steadily over time—from more than 20% in early March to less than 1% by early April—highlighting a sharp decrease in fire risk as spring progresses. This decline is most likely linked to the gradual reduction in grass curing, which typically drops from 100% in winter to 0% in summer. Interestingly, the ratio begins to rise again in early May, when grass curing is at its minimum and relatively stable. This secondary rise in fire risk could be attributed to short-term weather factors such as increased thunderstorm activity, lightning frequency, or stronger wind speeds in late spring.
4. Discussion and Conclusions
This study analyzed historical wildfire data from 1992 to 2020 to characterize wildfire risk across the Great Plains. The results show that wildfire frequency generally increases from north to south, likely driven by increasing temperature, while average wildfire size increases from east to west due to differences in dominant land cover types (i.e., grasslands vs. woody vegetation). Both wildfire frequency and total area burned exhibited clear upward trends during the study period, consistent with findings from other regions in the western United States [17,28,29,30].
The increasing trend in wildfire activity is likely influenced by multiple factors, including climate change—leading to drier vegetation and extended fire seasons [6,27,32,33]—as well as human expansion into WUI areas [34] and long-term fire suppression, which promotes fuel accumulation [35]. Correlation analysis further revealed that severe droughts had a stronger effect on increasing fire size than fire frequency.
One notable impact of climate change is a temporal shift in the wildfire season across the Great Plains. In northern states, the peak fire season has gradually moved from August to July, while in southern states, the peak has shifted from July to June. This evolving pattern is important for strategic wildfire preparedness, resource allocation, and planning prescribed fire windows.
Wildfire activity is influenced by risk factors operating on multiple timescales. Annual average KBDI explained 51% of interannual variability in wildfire area burned, highlighting its importance as a long-term risk indicator. Grass curing, a mid-term risk factor, explained 60% of monthly wildfire variability in grasslands. Short-term risk factors, such as wind speed and dead fuel moisture—largely determined by daily relative humidity and temperature fluctuations—also play a critical role in fire ignition and spread [41]. Ongoing research aims to integrate these factors into a comprehensive fire risk assessment tool for both wildfire response and prescribed fire planning.
Prescribed fire is a well-established land management practice in the Great Plains, crucial for reducing fuel loads and mitigating wildfire risk. As wildfire occurrence and WUI expansion increase, the importance of prescribed fire continues to grow. In the Flint Hills region of eastern Kansas and Oklahoma, spring serves as the primary seasonal window for prescribed fires. Since prescribed fires typically occur during periods of lower fire risk, while wildfires tend to emerge under higher-risk conditions, to better quantify fire risk during the spring burning season, this study calculated the ratio of wildfire area burned to total area burned (dominated by prescribed fires) for the springs of 2003–2019. On average, this ratio declined from more than 20% in early March to less than 1% by early April, mirroring the seasonal decline in grass curing and corresponding fire risk. The fear related to fire risk is the main reason that hinder the use of prescribed fire by landowners. Quantification of the risk is the first step to manage the risk and to lower the barriers for use of prescribed fire.
Although the correlation between prescribed fire activity and wildfires in spring was weak (R² = 0.08), prescribed burning in spring showed a stronger negative relationship with wildfire activity in summer (R² = 0.26), indicating potential long-term benefits. These findings support previous studies [40] emphasizing that while prescribed fire alone does not eliminate wildfire risk, it can play a meaningful role in risk reduction when applied effectively.
The limited use of prescribed fire is often attributed to resource constraints and a lack of confidence among landowners. Expanding the use of prescribed fire will require accessible, science-based tools for assessing and managing fire risk. By improving understanding of when and where prescribed fire can be safely used, landowners—especially those with less experience—can adopt this practice with greater confidence. Ultimately, proactive and informed prescribed fire use holds promise for enhancing landscape resilience and reducing wildfire risk in the Great Plains.
Funding
This research was funded by National Science Foundation, grant number 2306603 (SCC-IRG Track 1: Smart and Safe Prescribed Burning for Rangeland and Wildland Urban Interface Communities).
Data Availability Statement
The raw data supporting the conclusions of this article will be made available by the authors on request.
Acknowledgments
This is contribution # from the Kansas Agricultural Experiment Station. The study is also supported by Grassland Heritage Foundation scholarship as a partial source of funds.
Conflicts of Interest
The authors declare no conflicts of interest. The funders had no role in the design of the study; in the collection, analyses, or interpretation of data; in the writing of the manuscript; or in the decision to publish the results.
Abbreviations
The following abbreviations are used in this manuscript:
| WUI | wildland–urban interface |
| MODIS | Moderate Resolution Imaging Spectroradiometer |
| KBDI | Keetch–Byram Drought Index |
| NDVI | Normalized Difference Vegetation Index |
| ha | hectares |
References
- Ojima, D.S.; Conant, R.T.; Parton, W.J.; Lackett, J.M.; Even, T.L. Recent climate changes across the Great Plains and implications for natural resource management practices. Rangeland Ecol. Manag. 2021, 78, 180–190. [CrossRef]
- Stubbendieck, J.; Volesky, J.D.; Ortmann, J. Grassland management with prescribed fire. Publ. Nebr. For. Serv. 2007, 42. https://digitalcommons.unl.edu/nebforestpubs/42.
- Reid, A.M. Conservation and Fire Management of Great Plains Landscapes; Doctoral Thesis, Oklahoma State University, Stillwater, OK, USA, 2009.
- Brunson, M. Public perceptions and tradeoffs in using prescribed fire to reduce wildfire risk. West. Econ. Forum 2023, 16(1), 53–64. [CrossRef]
- Yu, G.; Feng, Y.; Wang, J.; Wright, D.B. Performance of fire danger indices and their utility in predicting future wildfire danger over the conterminous United States. Earth’s Future 2023, 11(11), e2023EF003823. [CrossRef]
- Russell, A.; Fontana, N.; Hoecker, T.; Kamanu, A.; Majumder, R.; Stephens, J.; Young, A.M.; Cravens, A.E.; Giardina, C.; Hiers, K.; Littell, J. A fire-use decision model to improve the United States’ wildfire management and support climate change adaptation. Cell Rep. Sustain. 2024, 1(6), 100125. [CrossRef]
- Higgins, K.F.; Kruse, A.D.; Piehl, J.L. Prescribed burning guidelines in the Northern Great Plains, version 16JUL97. USDA Coop. Ext. Serv., S. Dak. State Univ. 1989, EC-760. http://openprairie.sdstate.edu/extension_circ/430.
- Leis, S.A. Fuels management in the Great Plains. GPE Publ. 2013, 28. https://gpfirescience.org/wp-content/uploads/2022/05/GPEFuelsManLeis201328-3.pdf.
- Watts, M.; Russell, A.; Adhikari, S.; Weir, J.; Joshi, O. Analysis of the cost and cost components of conducting prescribed fires in the Great Plains. Rangeland Ecol. Manag. 2024, 92, 146–153. [CrossRef]
- Kreuter, U.P.; Treadwell, M.L.; Wonkka, C.L.; Toledo, D.; Stroman, D.L.; Twidwell, D. Fighting wildfire with prescribed fire in the Southern Great Plains, USA: Liability, regulatory and social factors. IGC Proceedings (1989-2023). 2021, 28.
- Clark, A.S.; McGranahan, D.A.; Geaumont, B.A.; Wonkka, C.L.; Ott, J.P.; Kreuter, U.P. Barriers to prescribed fire in the US Great Plains, Part I: systematic review of socio-ecological research. Land 2022, 11(9), 1521. [CrossRef]
- Hanberry, B.; Reeves, M.C.; Brischke, A.; Hannemann, M.; Hudson, T.; Mayberry, R.; Ojima, D.; Prendeville, H.R.; Rangwala, I. Managing effects of drought in the Great Plains. In Effects of Drought on Forests and Rangelands in the United States: Translating Science into Management Responses, Vose, J.M., Peterson, D.L., Luce, C.H., Patel-Weynand, T., Eds.; USDA Forest Service: Washington, DC, USA, 2019; Gen. Tech. Rep. WO-98, pp. 141–164.
- Huffman, M.R. Making a world of difference in fire and climate change. Fire Ecol. 2014, 10, 90–101. [CrossRef]
- Chiodi, A.M.; Larkin, N.S.; Varner, J.M. An analysis of Southeastern US prescribed burn weather windows: seasonal variability and El Niño associations. Int. J. Wildl. Fire 2018, 27(3), 176–189. [CrossRef]
- Yurkonis, K.A.; Dillon, J.; McGranahan, D.A.; Toledo, D.; Goodwin, B.J. Seasonality of prescribed fire weather windows and predicted fire behavior in the northern Great Plains, USA. Fire Ecol. 2019, 15, 7. [CrossRef]
- Short, K.C. Spatial wildfire occurrence data for the United States, 1992–2020 [FPA FOD 20221014]. For. Serv. Res. Data Arch. 2022. [CrossRef]
- Akinbile, D.S.; Liu, Z.; Lin, X.; Moore, T.; Song, W. Optimum weather conditions for prescribed burning in the Flint Hills Region. J. ASABE 2023, 66(3), 647–656. [CrossRef]
- Keetch, J.J.; Byram, G.M. A drought index for forest fire control. USDA Forest Service Research Paper SE-38, Southeastern Forest Experiment Station, Asheville, NC, USA, 1968.
- Krueger, E.S.; Levi, M.R.; Achieng, K.O.; Bolten, J.D.; Carlson, J.D., Coops, N.C.; Holden, Z.A.; Magi, B.I.; Rigden, A.J. and Ochsner, T.E. Using soil moisture information to better understand and predict wildfire danger: a review of recent developments and outstanding questions. Int. J. Wildl. Fire. 2022. 32(2), pp.111–132. [CrossRef]
- Plucinski, M.P.; Tartaglia, E.; Huston, C.; Stephenson, A.G.; Dunstall, S.; McCarthy, N.F. and Deutsch, S. Exploring the influence of the Keetch–Byram Drought Index and McArthur’s Drought Factor on wildfire incidence in Victoria, Australia. Int. J. Wildl. Fire. 2023. 33(1). [CrossRef]
- Sullivan, A.L. Grassland fire management in future climate. Adv. Agron. 2010. 106, pp.173-208. United_Nation_2021_Wildfires—a growing concern for sustainable development. [CrossRef]
- Anderson, S.A.; Anderson, W.R.; Hollis, J.J.; Botha, E.J. A simple method for field-based grassland curing assessment. Int. J. Wildl. Fire 2011, 20(6), 804–814. [CrossRef]
- Newnham, G.J.; Verbesselt, J.; Grant, I.F. and Anderson, S.A. Relative Greenness Index for assessing curing of grassland fuel. Remote Sens. Environ. 2011.115(6), pp.1456–1463. [CrossRef]
- Donovan, V. M.; Wonkka, C. L.; Wedin, D. A. and Twidwell, D. Land-use type as a driver of large wildfire occurrence in the US Great Plains. Remote Sens. 2020, 12(11), 1869; [CrossRef]
- Scasta, J.D.; Weir, J.R.; Stambaugh, M.C. Droughts and wildfires in western U.S. rangelands. Rangelands 2016, 38, 197–203. [CrossRef]
- Donovan, V.M.; Wonkka, C.L.; Twidwell, D. Surging wildfire activity in a grassland biome. Geophys. Res. Lett. 2017, 44, 5986–5993. [CrossRef]
- Dennison, P.E.; Brewer, S.C.; Arnold, J.D.; Moritz, M.A. Large wildfire trends in the western United States, 1984–2011. Geophys. Res. Lett. 2014, 41, 2928–2933. [CrossRef]
- Iglesias, V.; Balch, J.K.; Travis, W.R. U.S. fires became larger, more frequent, and more widespread in the 2000s. Sci. Adv. 2022, 8, eabc0020. [CrossRef]
- Westerling, A.L. Increasing western U.S. forest wildfire activity: sensitivity to changes in the timing of spring. Philos. Trans. R. Soc. B Biol. Sci. 2016, 371, 20150178. [CrossRef]
- Boisramé, G.F.; Brown, T.J.; Bachelet, D.M. Trends in western USA fire fuels using historical data and modeling. Fire Ecol. 2022, 18, 8. [CrossRef]
- Yu, G.; Feng, Y.; Wang, J.; Wright, D.B. Performance of fire danger indices and their utility in predicting future wildfire danger over the conterminous United States. Earth’s Future 2023, 11, e2023EF003823. [CrossRef]
- Lang, Y.; Moeini-Meybodi, H. Wildfires—a growing concern for sustainable development. United Nations Department of Economic and Social Affairs, 2021 https://www.un.org/development/desa/dpad/wp-content/uploads/sites/45/publication/PB_111.pdf.
- Gamelin, B.L.; Feinstein, J.; Wang, J.; Bessac, J.; Yan, E.; Kotamarthi, V.R. Projected U.S. drought extremes through the twenty-first century with vapor pressure deficit. Sci. Rep. 2022, 12, 8615. [CrossRef]
- Cooke, B.; Williams, D.; Paveglio, T.; Carroll, M. Living with fire: How social scientists are helping wildland-urban interface communities reduce wildfire risk. Sci. You Can Use Bull. 2016, 19, 9.
- Brotons, L.; Aquilué, N.; De Cáceres, M.; Fortin, M.J.; Fall, A. How fire history, fire suppression practices and climate change affect wildfire regimes in Mediterranean landscapes. PLoS ONE 2013, 8, e62392. [CrossRef]
- Dolling, K.; Chu, P.S.; Fujioka, F. A climatological study of the Keetch/Byram drought index and fire activity in the Hawaiian Islands. Agric. For. Meteorol. 2005, 133, 17–27. [CrossRef]
- Brown, E.K.; Wang, J.; Feng, Y. U.S. wildfire potential: a historical view and future projection using high-resolution climate data. Environ. Res. Lett. 2021, 16, 034060. [CrossRef]
- Abatzoglou, J.T.; Williams, A.P. Impact of anthropogenic climate change on wildfire across the western U.S. forests. Proceedings of the National Academy of sciences. 2016. 113(42), pp 11770–11775. [CrossRef]
- Balch, J.K.; Bradley, B.A.; Abatzoglou, J.T.; Nagy, R.C.; Fusco, E.J.; Mahood, A.L. Human-started wildfires expand the fire niche across the United States. Proc. Natl. Acad. Sci. USA 2017, 114, 2946–2951. [CrossRef]
- Toledo, D.; Kreuter, U.P.; Sorice, M.G.; Taylor, C.A., Jr. The role of prescribed burn associations in the application of prescribed fires in rangeland ecosystems. J. Environ. Manag. 2014, 132, 323–328. [CrossRef]
- Wade, D. Fuel moisture and prescribed burning. South. Fire Exch. Fact Sheet 2013, 5, 5–8. https://southernfireexchange.org/wp-content/uploads/2013-5.pdf.
Figure 1.
Average wildfire size per incident (a) and average annual burned area (b) across the Great Plains, 1992–2020.
Figure 1.
Average wildfire size per incident (a) and average annual burned area (b) across the Great Plains, 1992–2020.
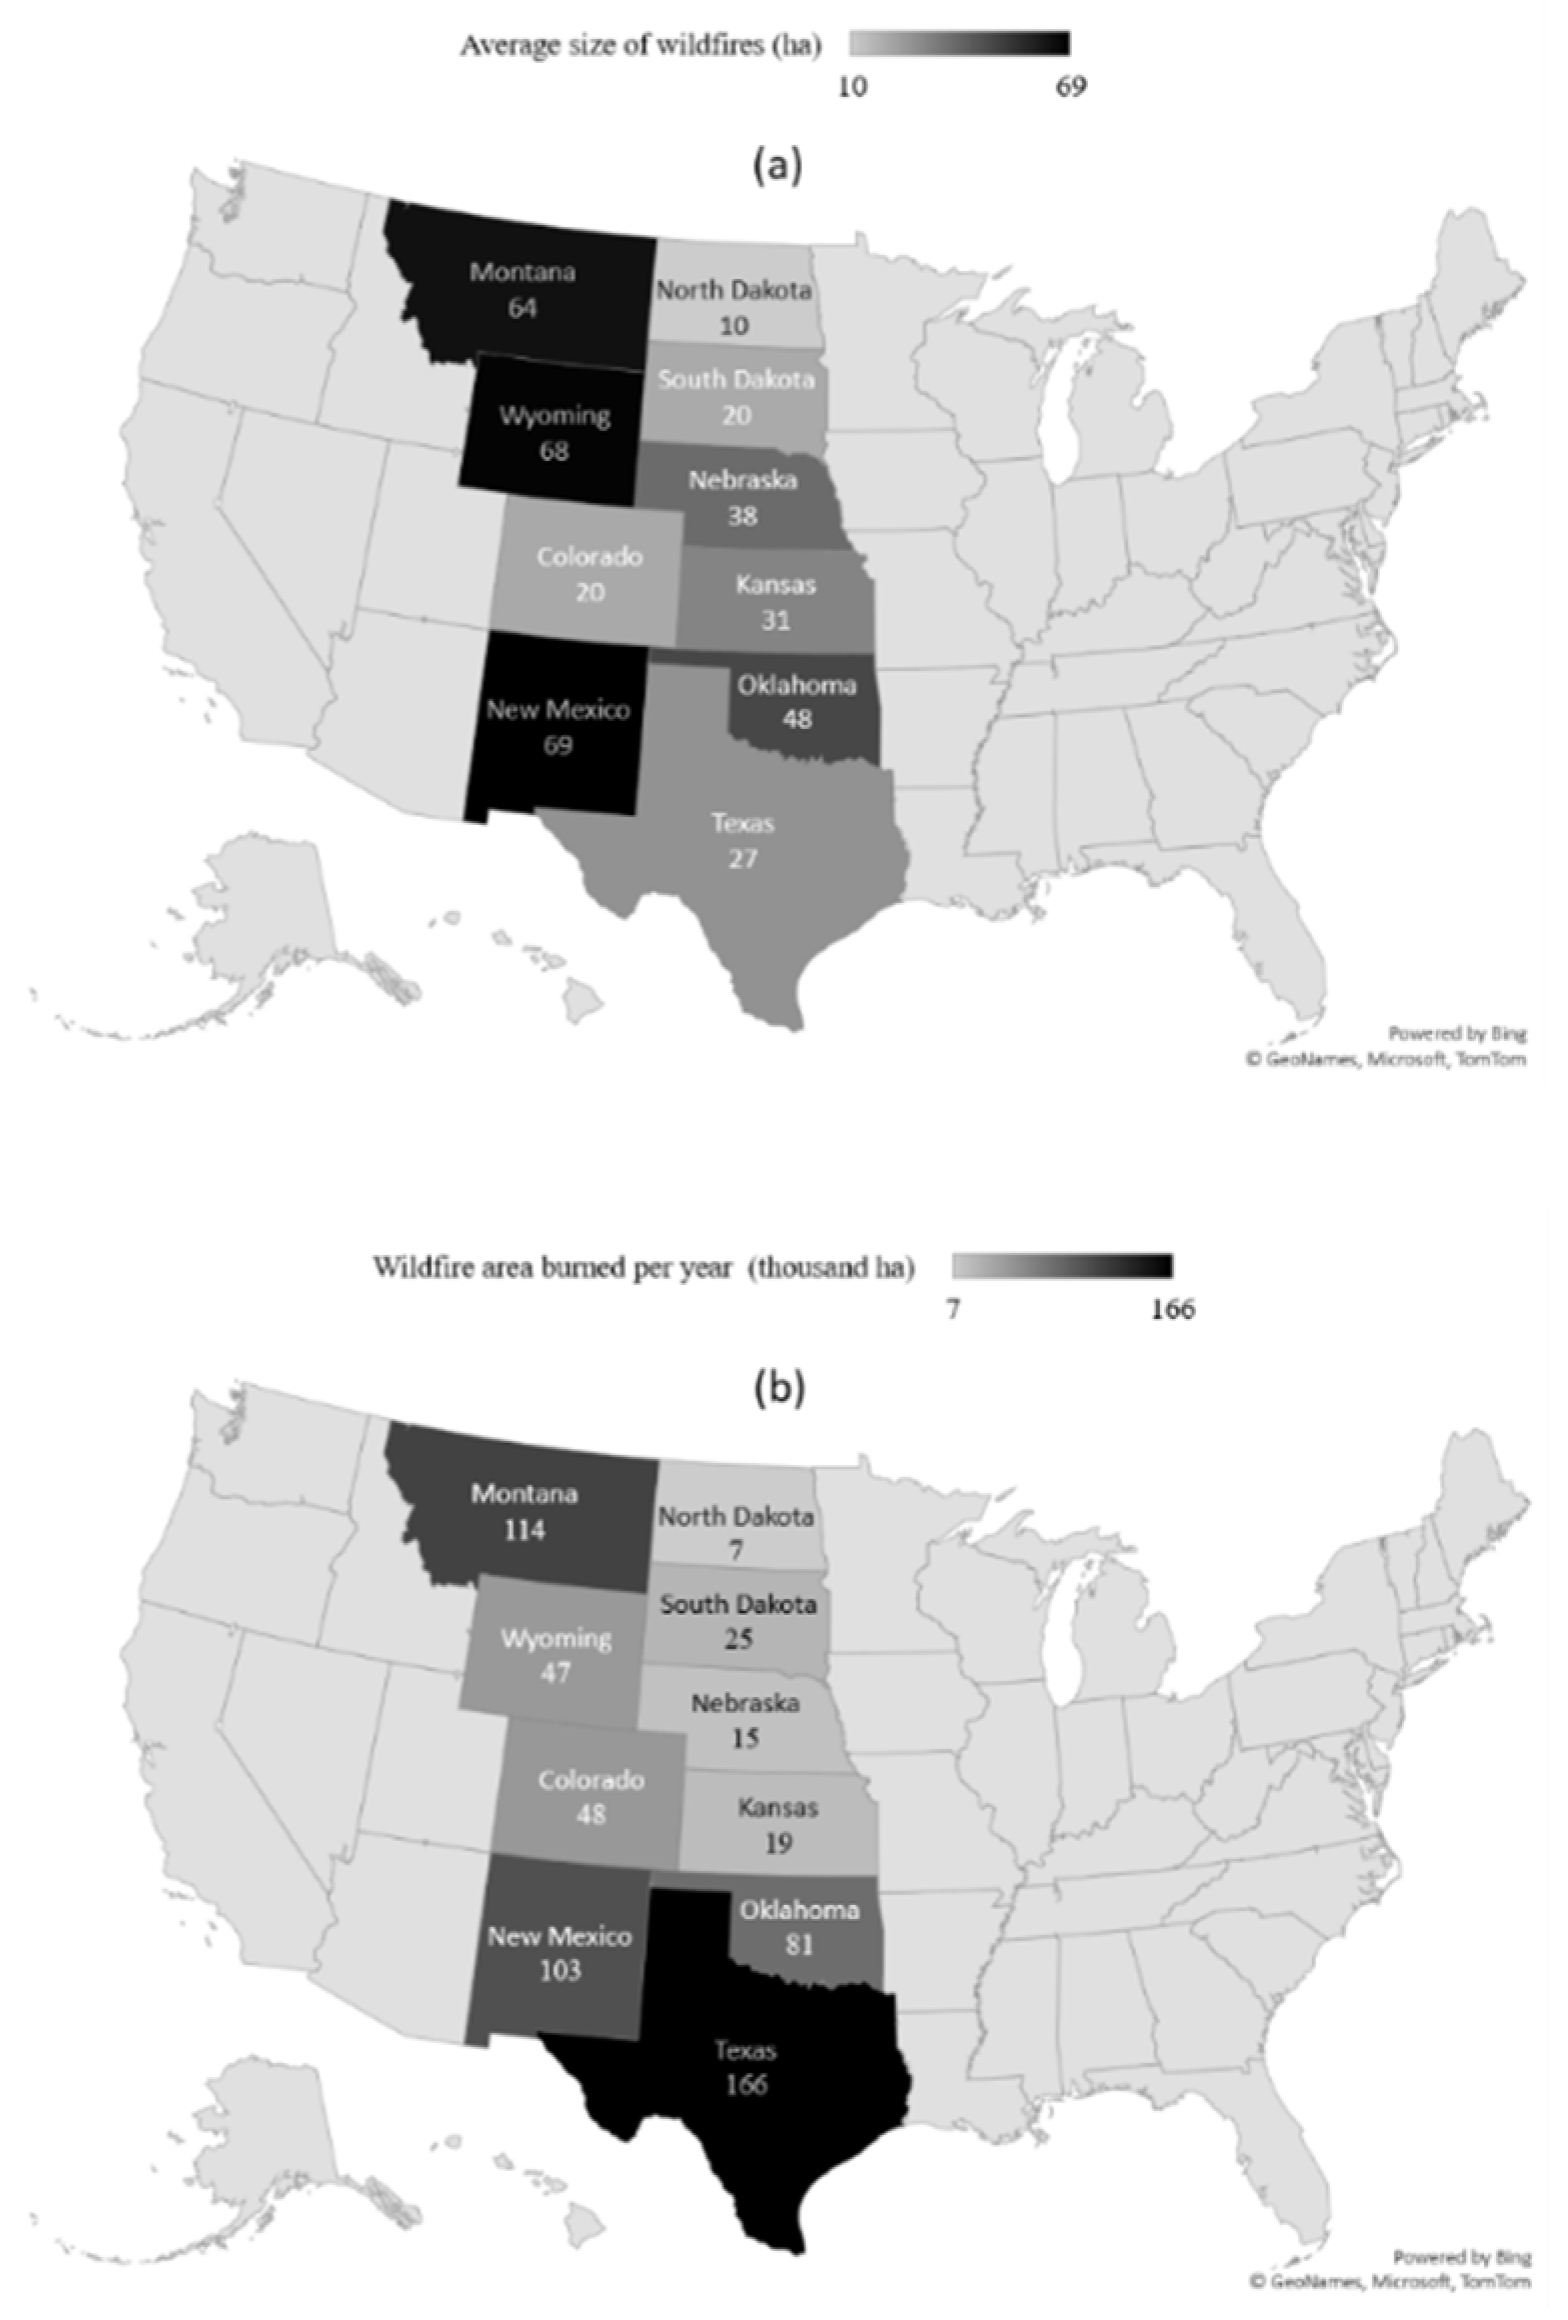
Figure 2.
Trends in wildfire frequency and burned area in the Great Plains, 1992–2020.
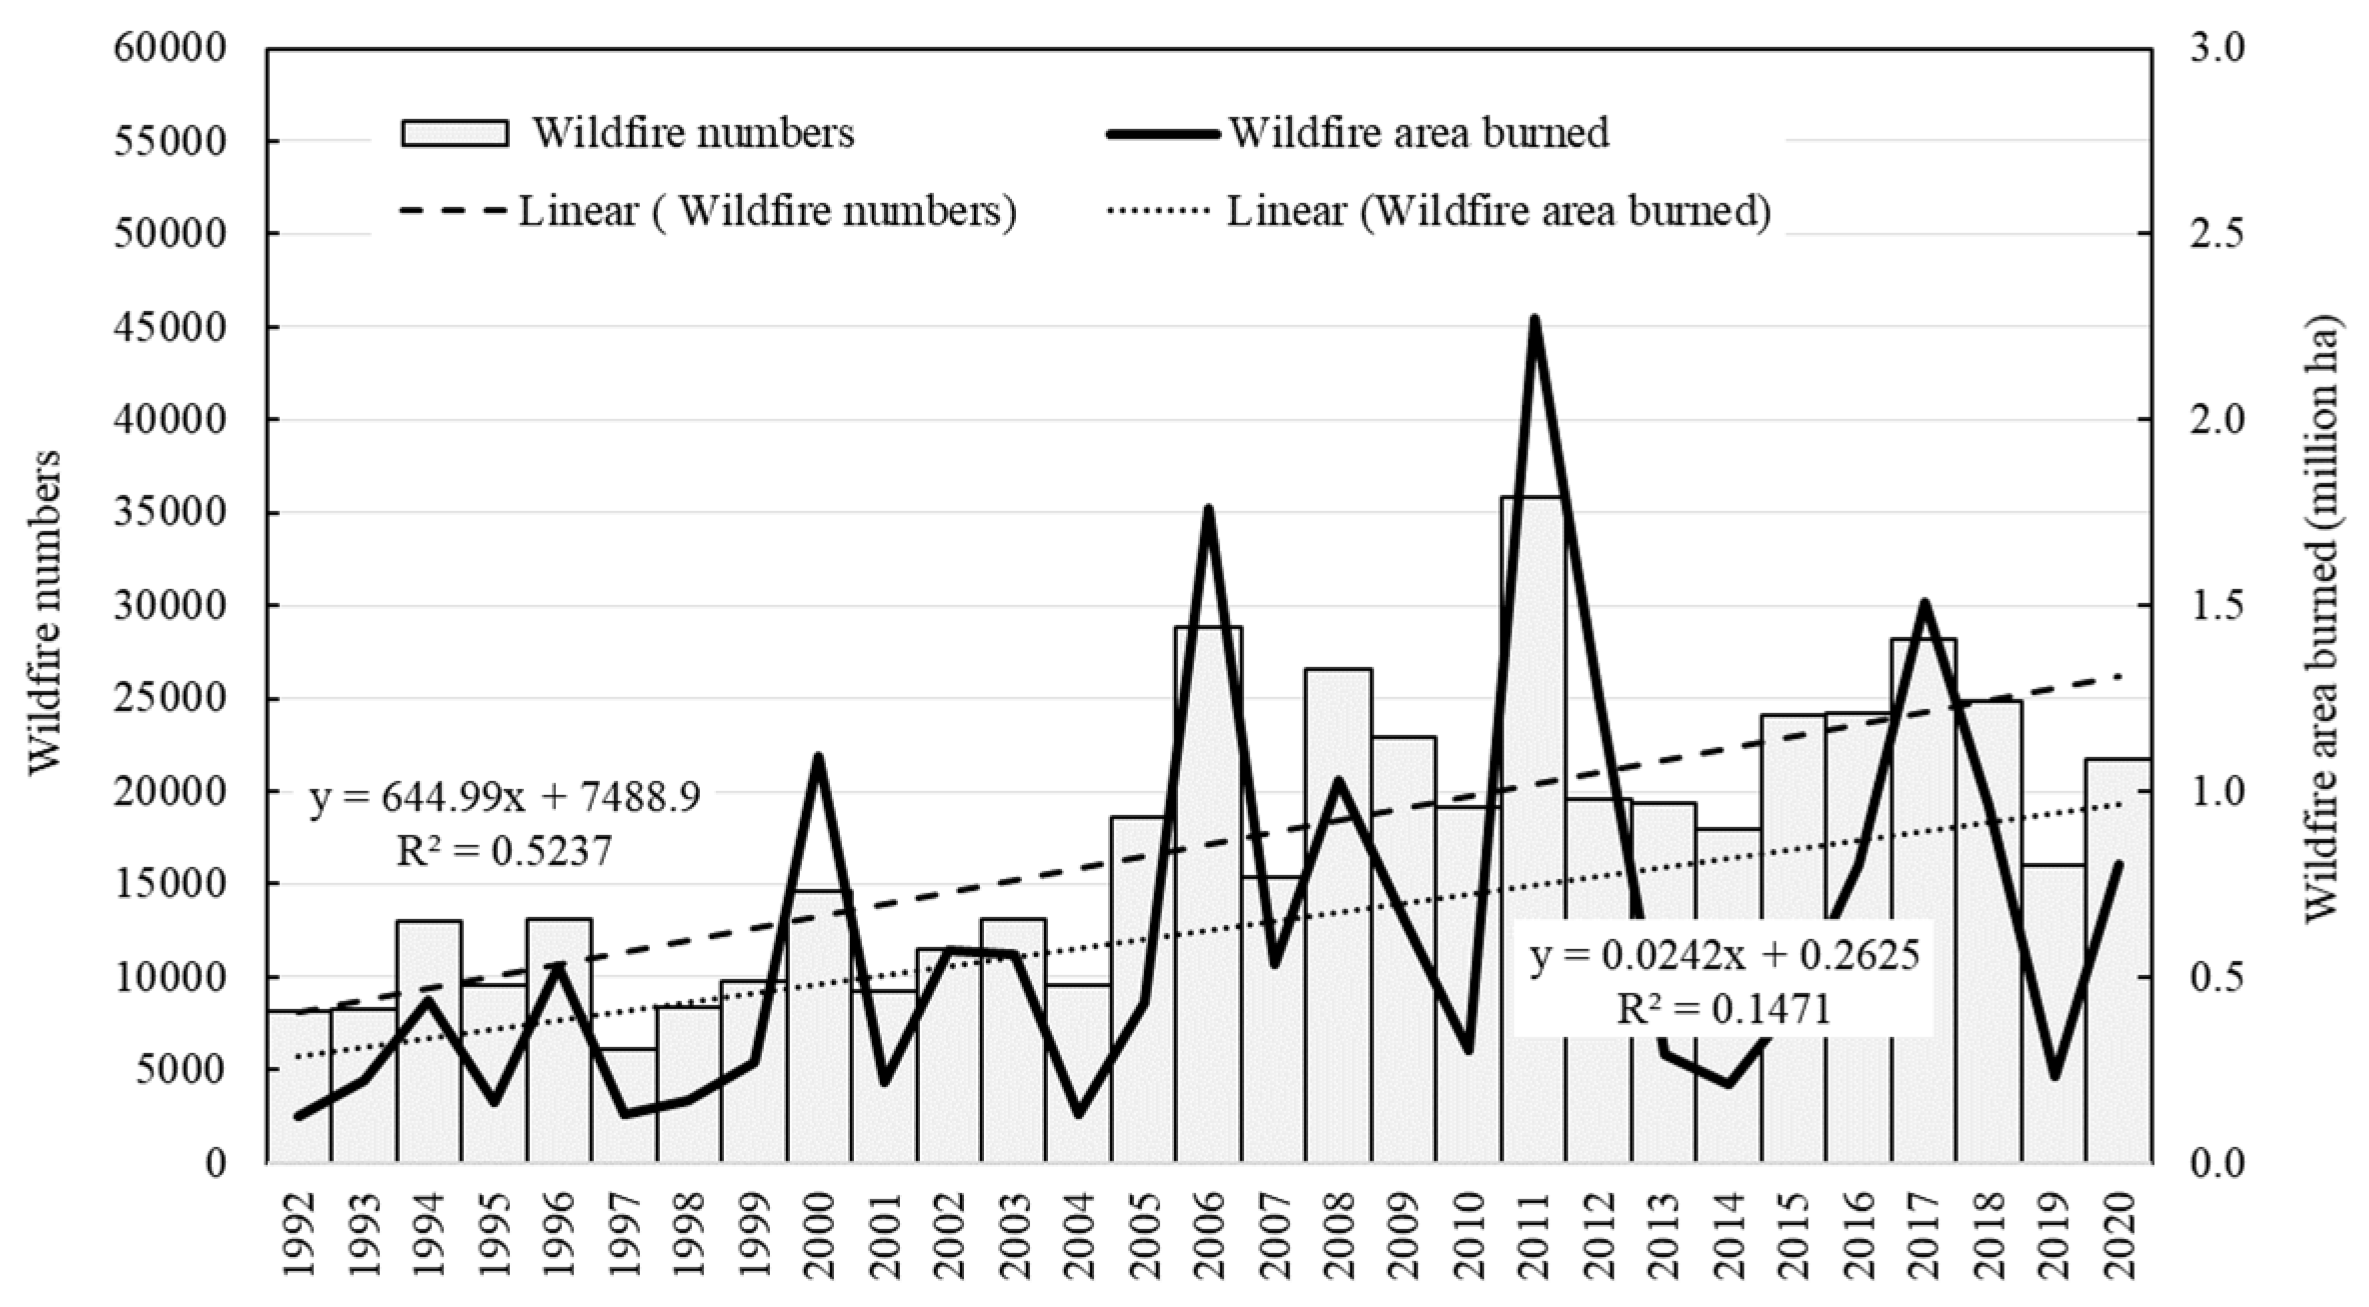
Figure 3.
Annual wildfires vs. annual average KBDI, 2006-2019 (Wildfire numbers, area burned, and average sizes are for the 10 Great Plains states. The annual average KBDI was from Oklahoma Mesonet stations).
Figure 3.
Annual wildfires vs. annual average KBDI, 2006-2019 (Wildfire numbers, area burned, and average sizes are for the 10 Great Plains states. The annual average KBDI was from Oklahoma Mesonet stations).
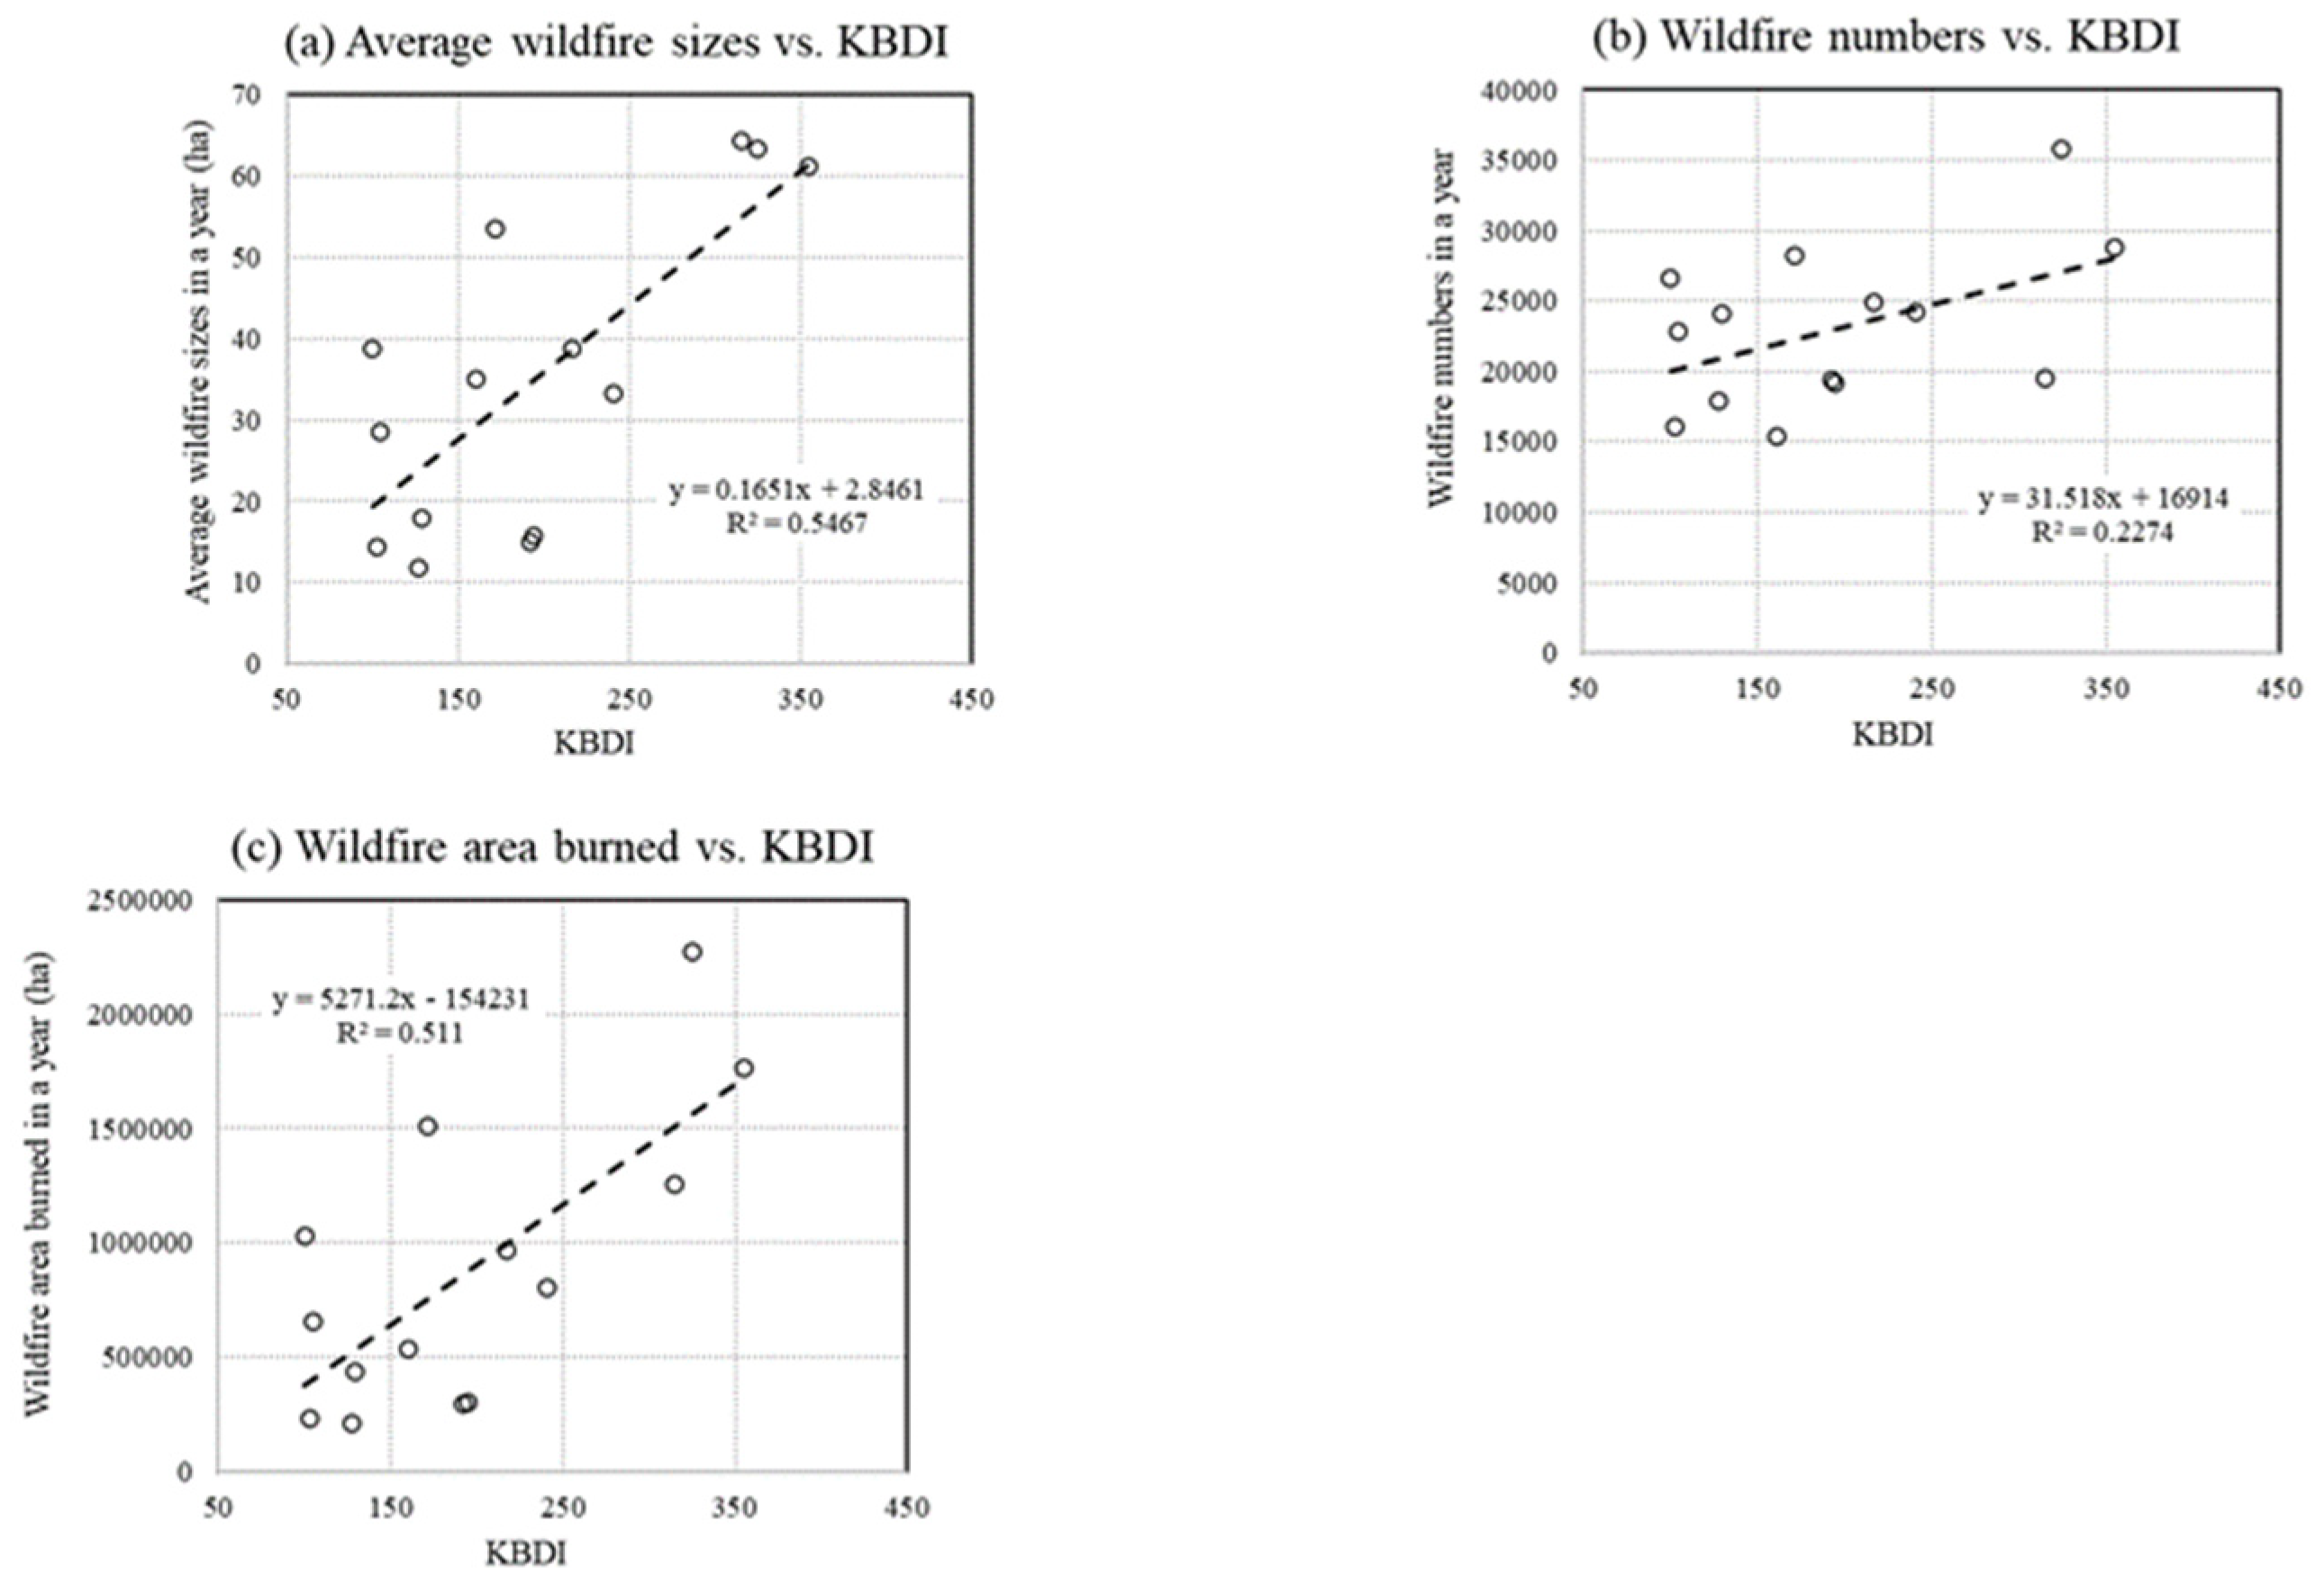
Figure 4.
Seasonal pattern of wildfire numbers and average wildfire sizes per incident in the Great Plains, 1992-2020.
Figure 4.
Seasonal pattern of wildfire numbers and average wildfire sizes per incident in the Great Plains, 1992-2020.
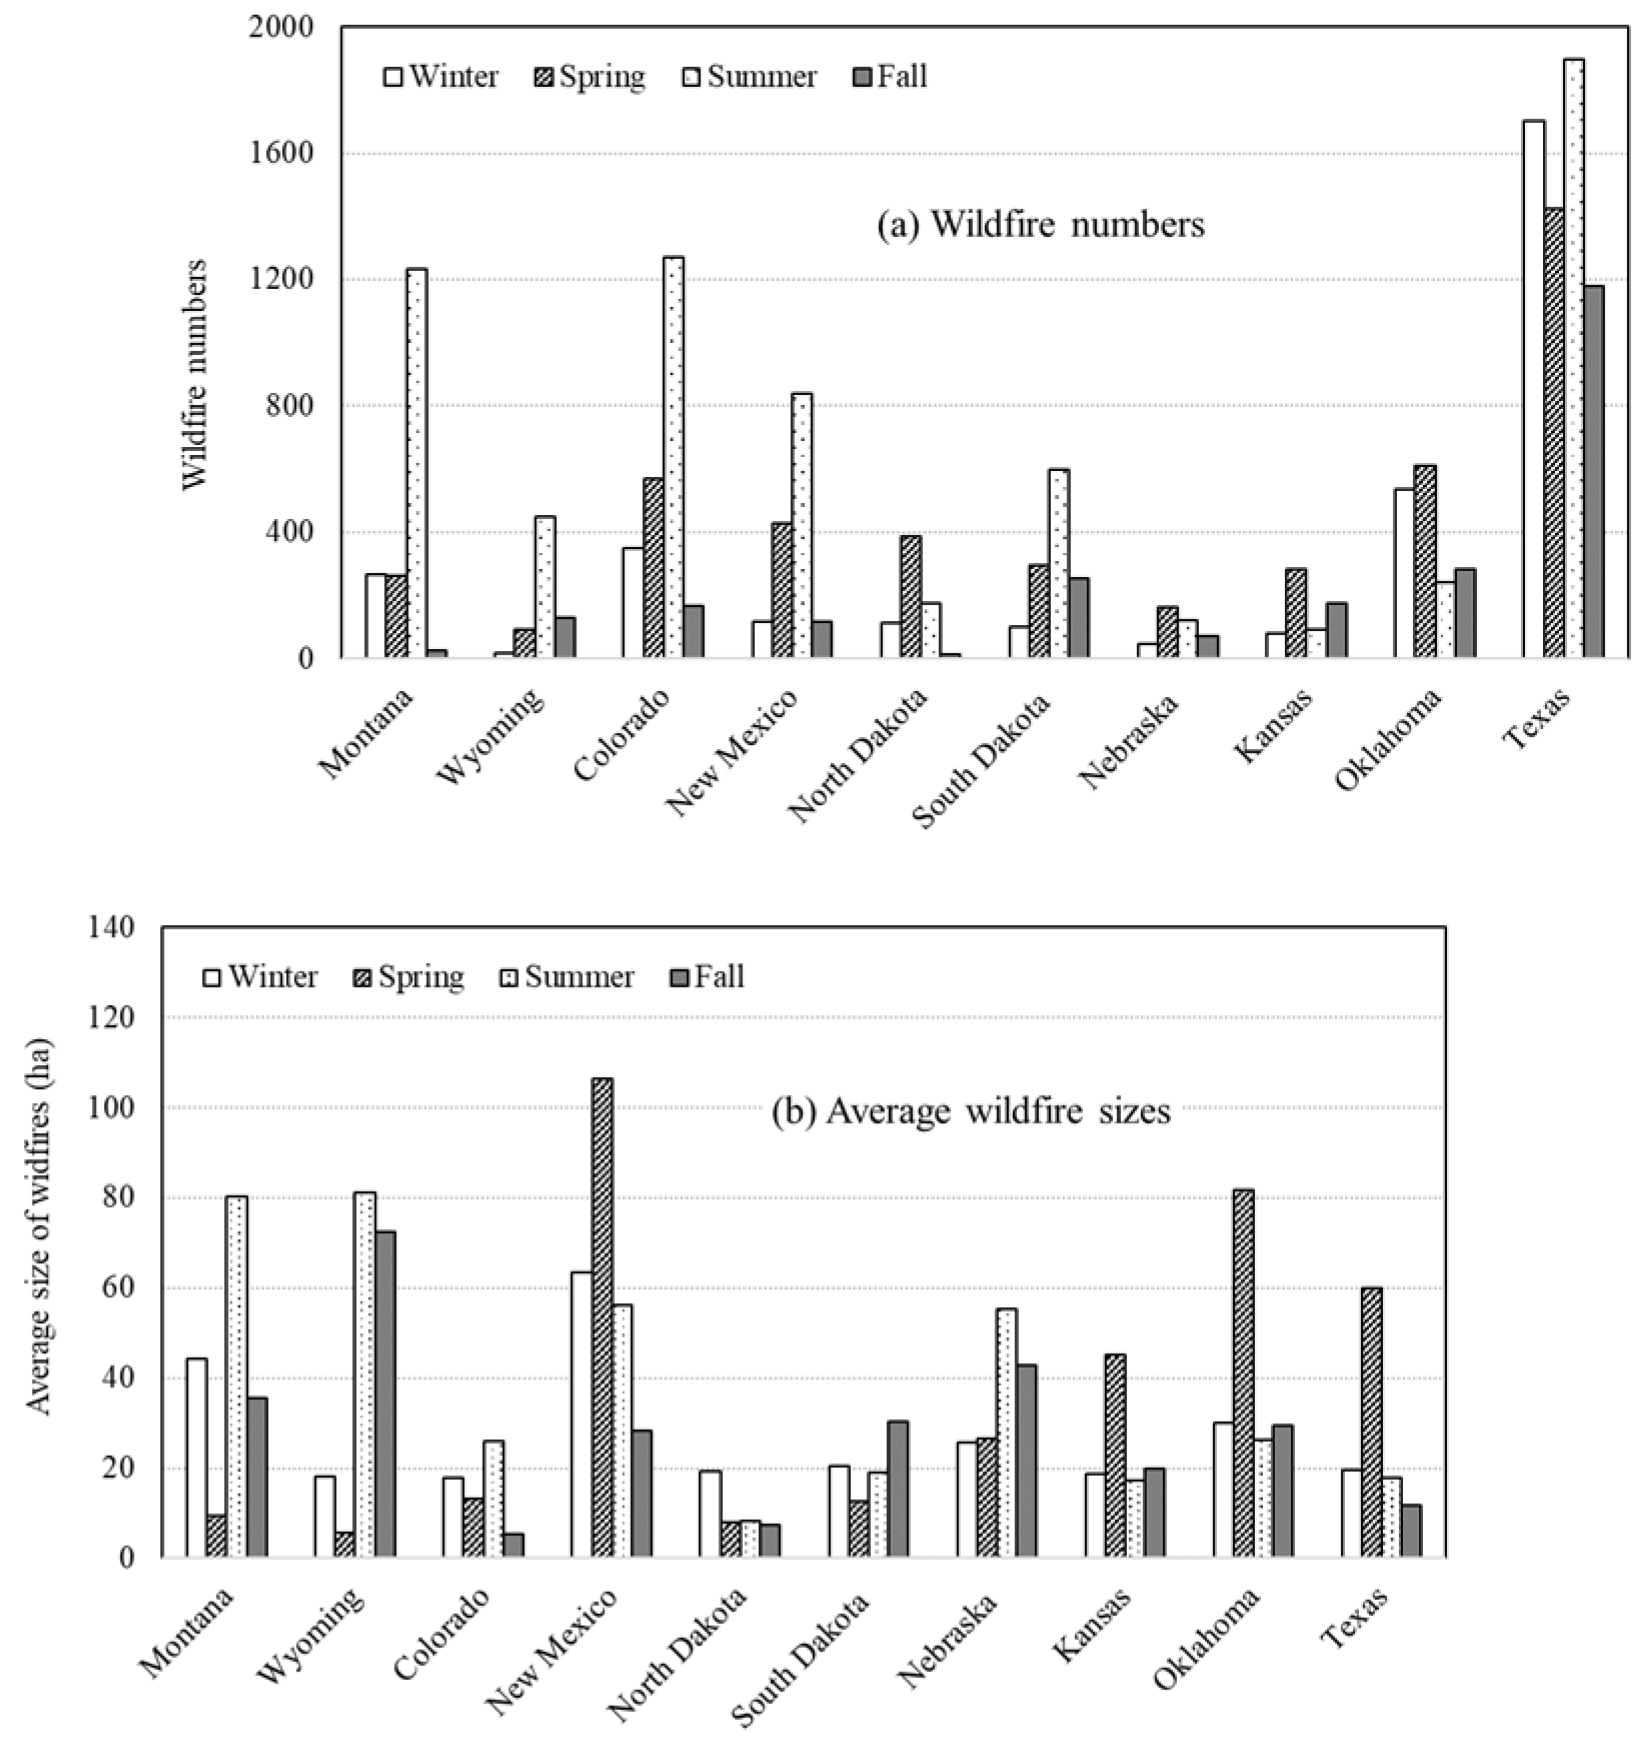
Figure 5.
Wildfire numbers and grass curing in Oklahoma.
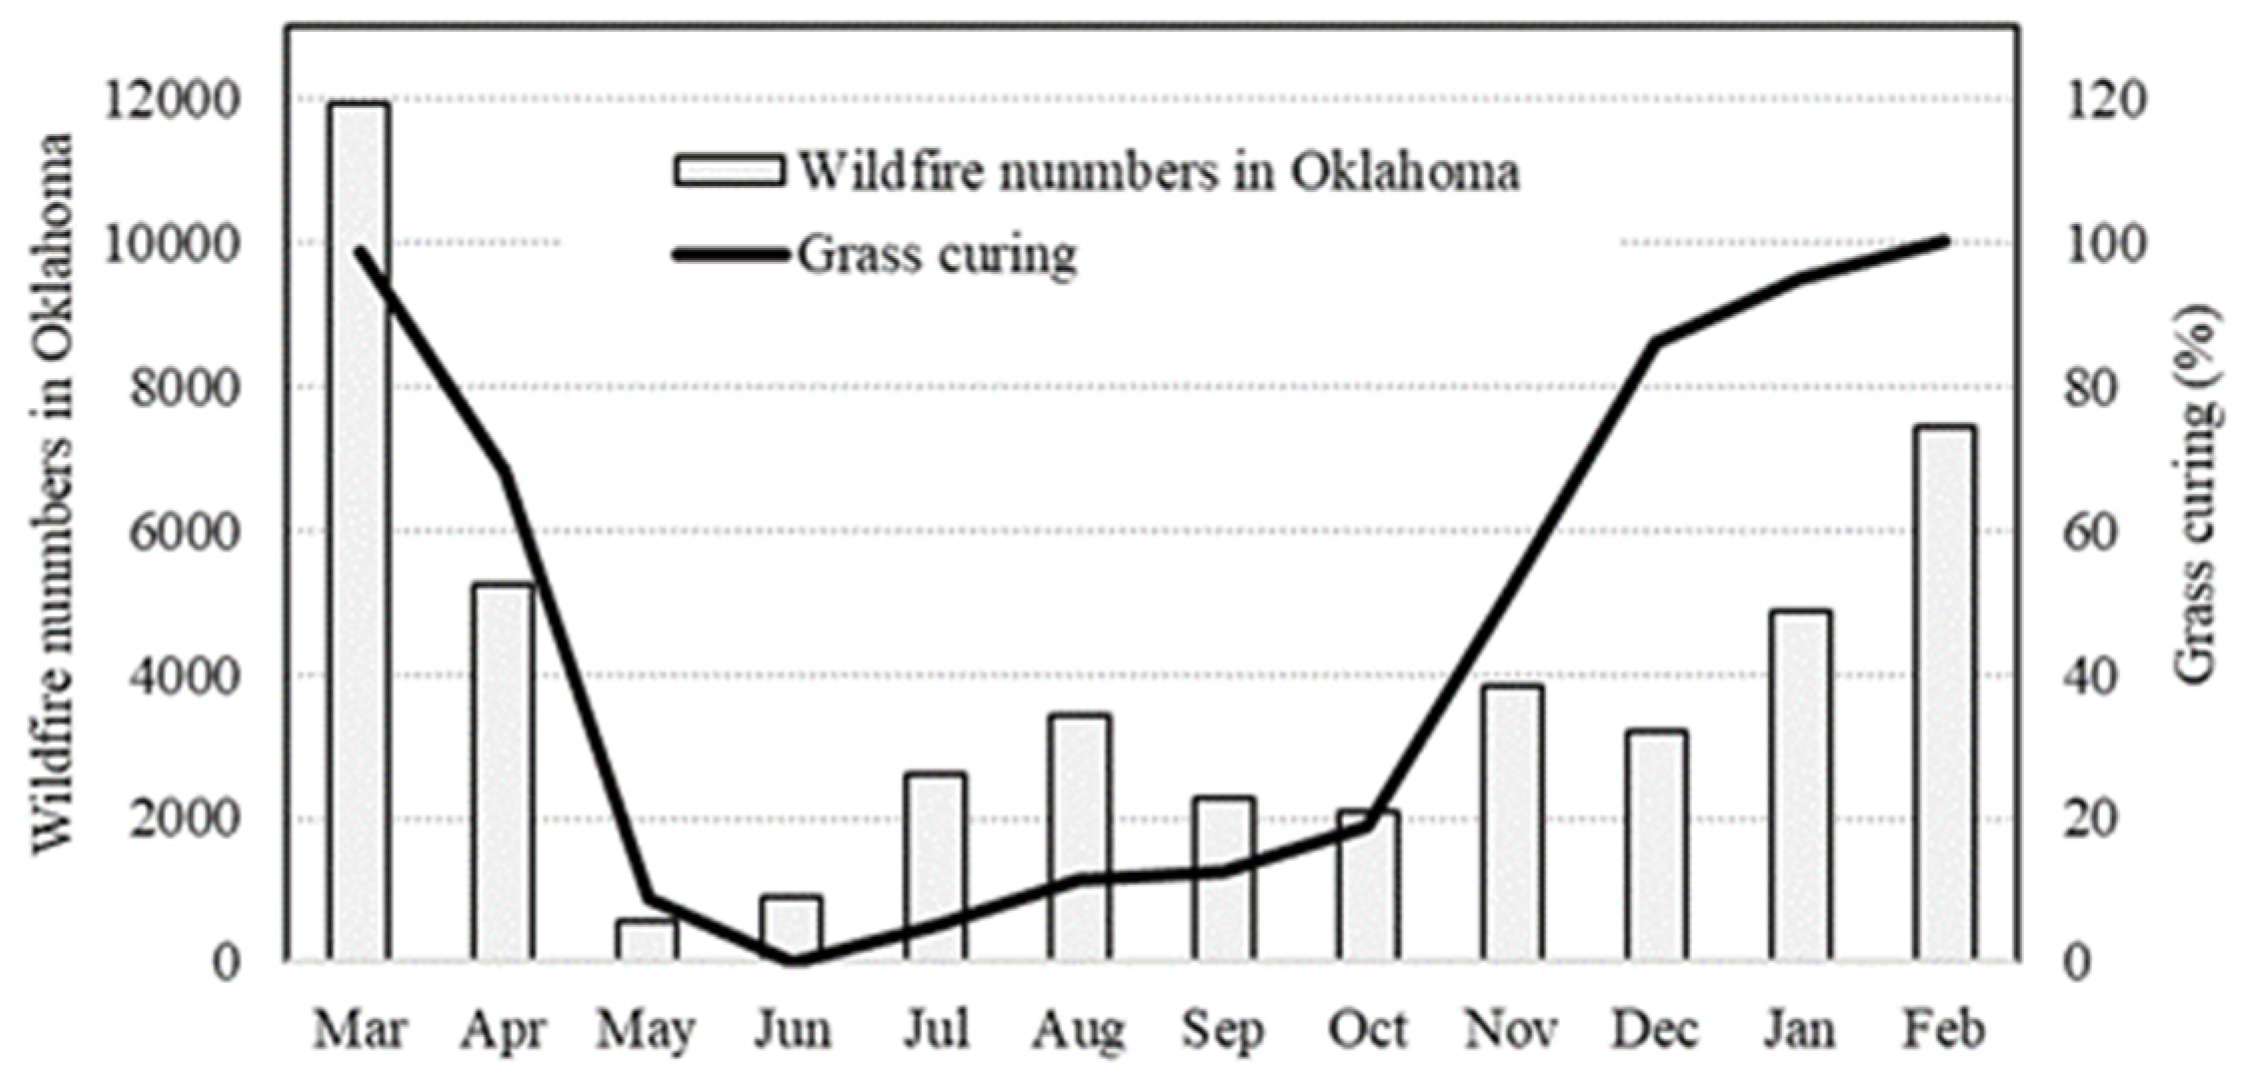
Figure 6.
Comparison of the total area burned and the wildfire area burned in the Flint Hills region.
Figure 6.
Comparison of the total area burned and the wildfire area burned in the Flint Hills region.
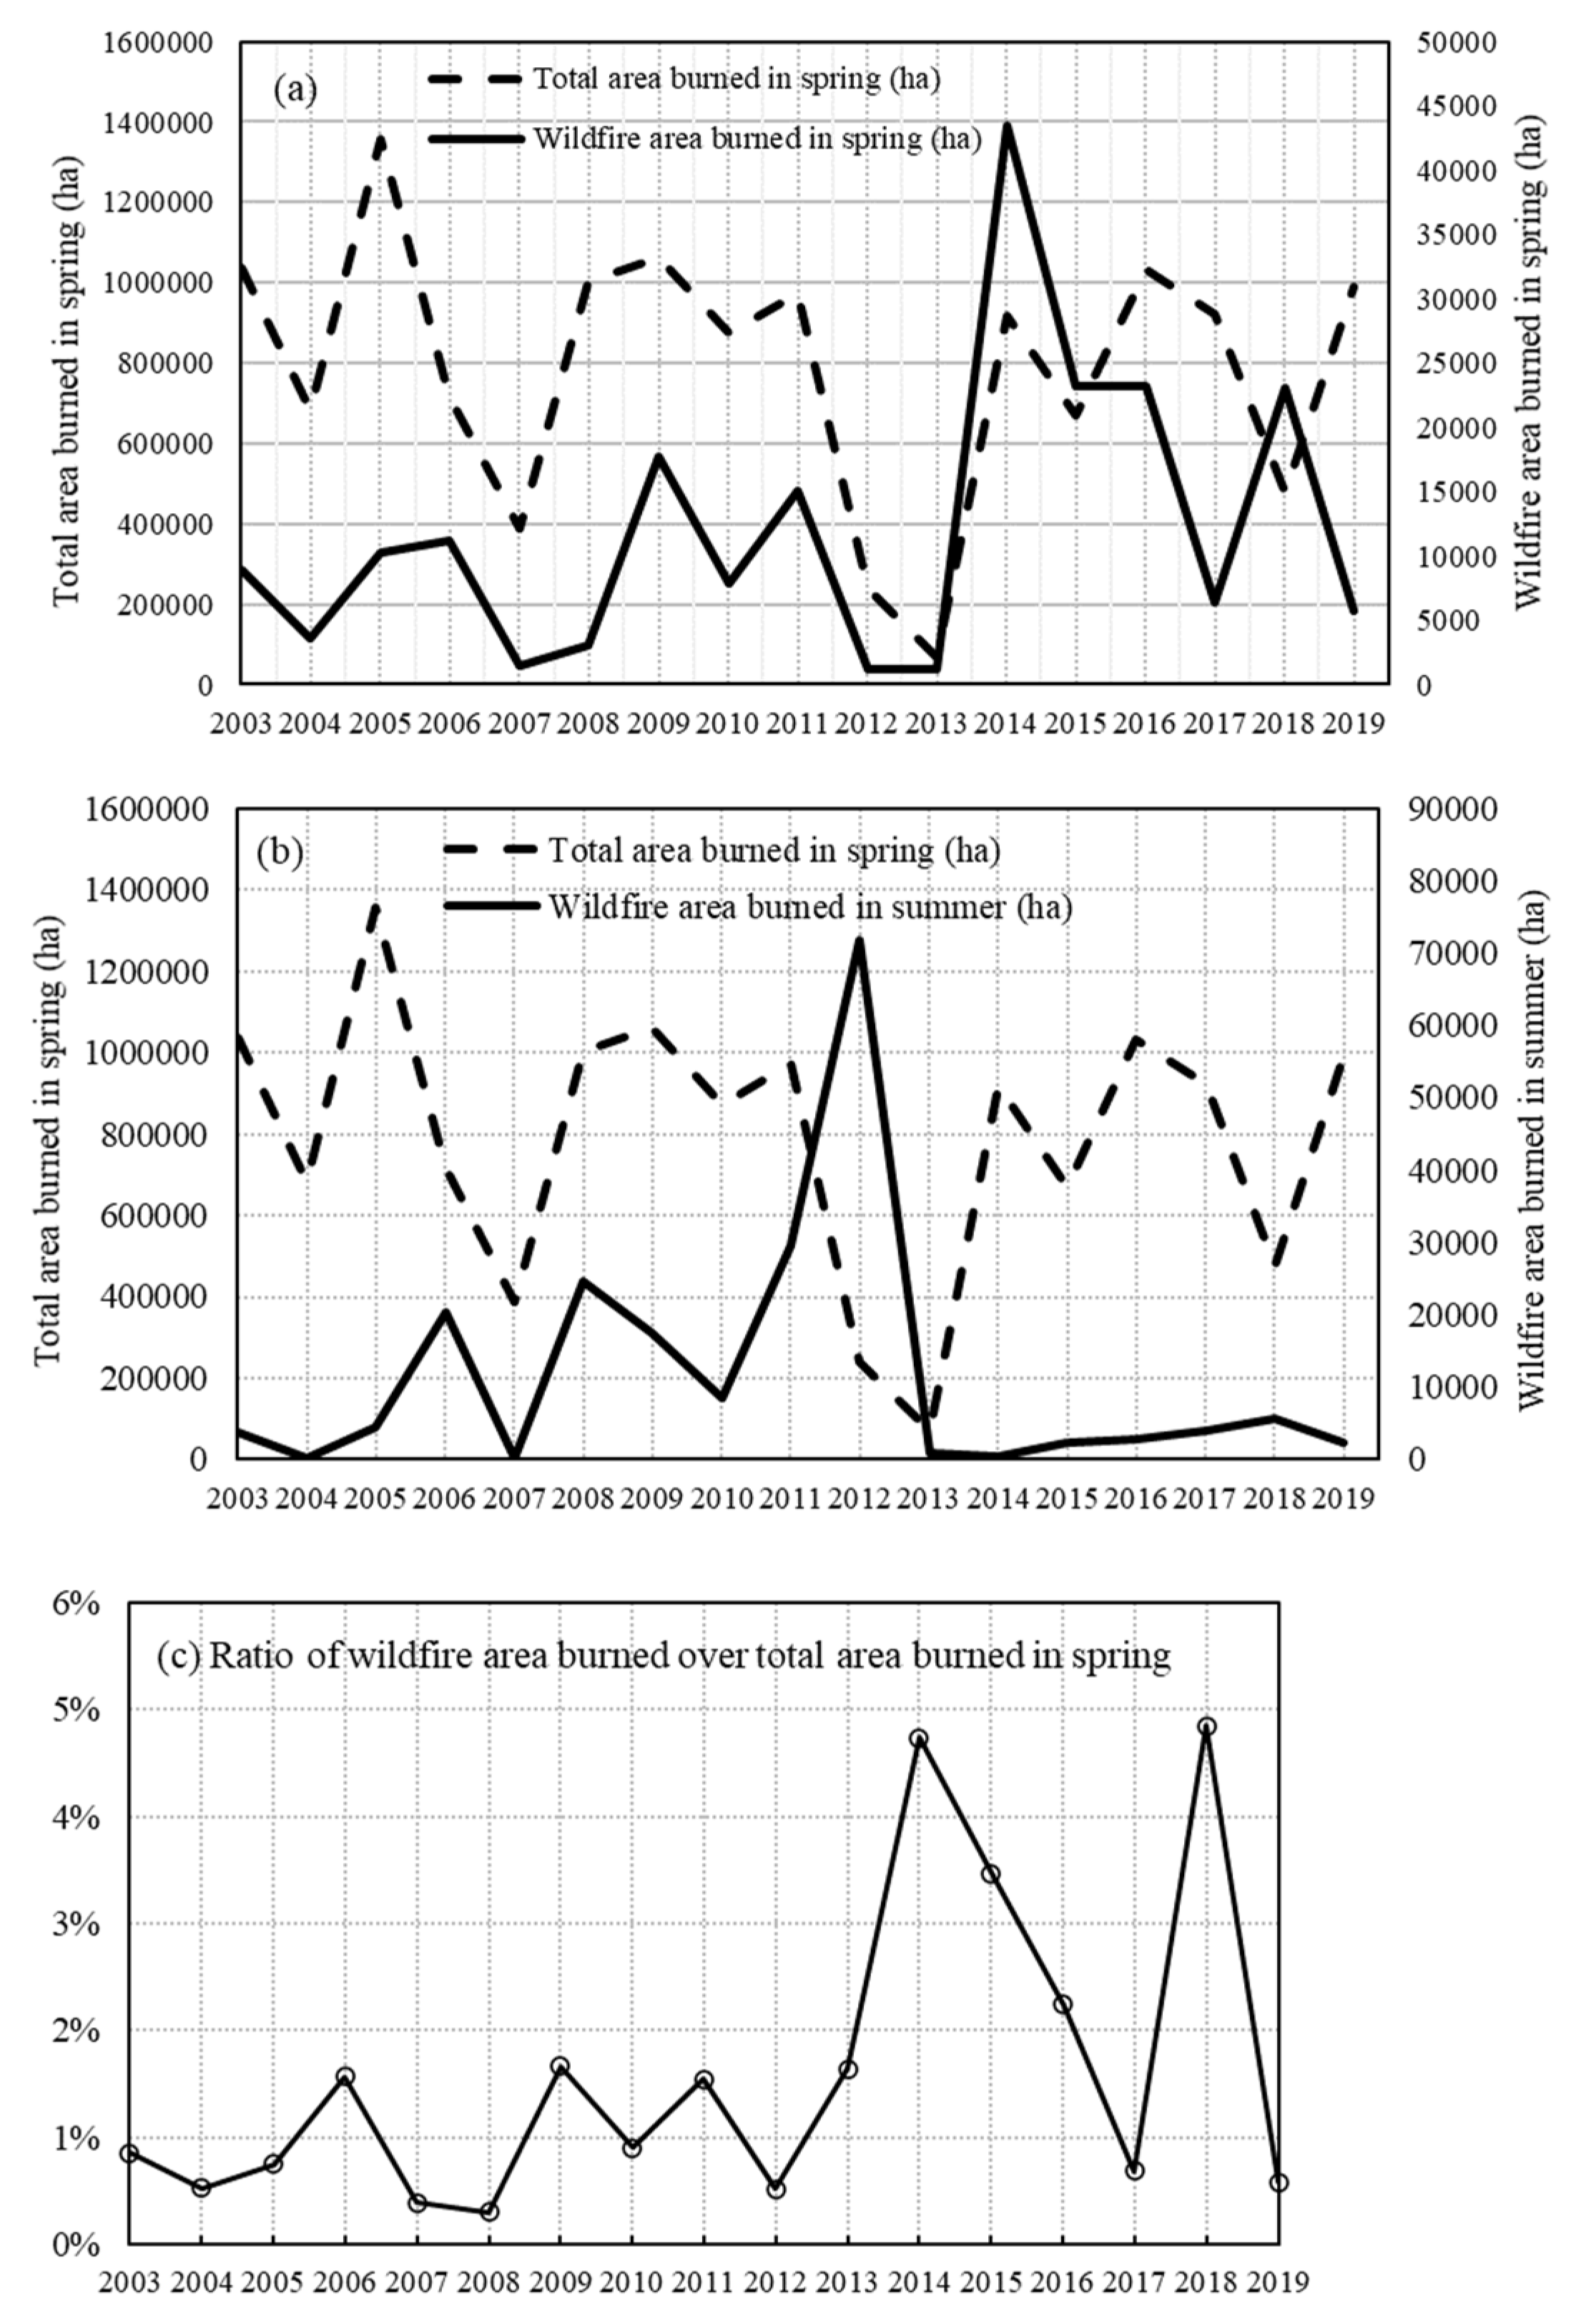
Figure 7.
(a) Multi-year average daily wildfire area burned and total area burned on different date in the Flint Hills region. (b) The ratio of multi-year average daily wildfire area burned (smoothened data) over total area burned (smoothened data) on different date.
Figure 7.
(a) Multi-year average daily wildfire area burned and total area burned on different date in the Flint Hills region. (b) The ratio of multi-year average daily wildfire area burned (smoothened data) over total area burned (smoothened data) on different date.
Disclaimer/Publisher’s Note: The statements, opinions and data contained in all publications are solely those of the individual author(s) and contributor(s) and not of MDPI and/or the editor(s). MDPI and/or the editor(s) disclaim responsibility for any injury to people or property resulting from any ideas, methods, instructions or products referred to in the content. |
© 2025 by the authors. Licensee MDPI, Basel, Switzerland. This article is an open access article distributed under the terms and conditions of the Creative Commons Attribution (CC BY) license (http://creativecommons.org/licenses/by/4.0/).
Copyright: This open access article is published under a Creative Commons CC BY 4.0 license, which permit the free download, distribution, and reuse, provided that the author and preprint are cited in any reuse.


