

Submitted:
12 April 2025
Posted:
14 April 2025
You are already at the latest version
Abstract
This study explores the potential of biogas production from organic waste generated at Dilla University, Southern Ethiopia, through anaerobic digestion. Five treatments were formulated using different ratios of cow dung, café leftovers, fruit peels, and human excreta to evaluate the effect of substrate composition on digestion efficiency and biogas generation. Experimental digesters were monitored over a 60-day period, and samples were analyzed for key physical and chemical parameters including total solids (MTS), total suspended solids (MTSS), ash content (MA), and fresh mass (MFS). Results showed that co-digestion significantly improved substrate degradation compared to mono-digestion. Treatment 2 (6% organic waste, 24% cow dung, 7.5% human excreta) demonstrated the highest reduction in solids, indicating efficient microbial activity and favorable biogas conversion. Estimated methane yields, derived from MTSS values, ranged from 0.244 to 0.470 liters, with Treatment 5 exhibiting the highest theoretical output despite lower digestion efficiency. The findings confirm that integrating food-based organic waste with manure and inoculum enhances biogas production and waste stabilization. The study recommends scaling up the optimized treatment in a pilot biogas plant for educational and community demonstration purposes, while incorporating direct gas monitoring tools in future research.
Keywords:
Biogas production
; Anaerobic digestion
; Organic waste
; Co-digestion
; Methane yield
1. Introduction
With the rapid expansion of educational institutions, the volume of solid waste generated within university campuses has significantly increased. Daily activities such as food preparation and consumption in student cafeterias, staff residences, and on-campus shops result in large quantities of biodegradable waste, including food scraps, fruit peels, and organic residues. If not properly managed, such waste contributes to environmental pollution, health hazards, and greenhouse gas emissions (Khan et al., 2016). However, these organic waste streams also present a valuable opportunity for resource recovery through environmentally friendly and economically viable technologies.
Anaerobic digestion (AD) is a well-established biological process that decomposes organic matter in the absence of oxygen. The process yields biogas—a mixture primarily composed of methane (CH₄) and carbon dioxide (CO₂)—which can be used as a clean and renewable source of energy (Appels et al., 2008). In addition to energy production, AD offers several benefits: it reduces waste volume, stabilizes organic matter, produces nutrient-rich digestate suitable for use as fertilizer, and mitigates environmental and public health risks associated with unmanaged waste disposal (Mata-Alvarez et al., 2014).
Globally, there has been a growing interest in promoting biogas technology as a sustainable solution for waste-to-energy conversion, particularly in developing countries where access to modern energy services remains limited (Bond & Templeton, 2011). Ethiopia, with its large rural population and high dependence on traditional biomass for cooking, stands to benefit immensely from the promotion of biogas systems. Moreover, the adoption of biogas technology aligns with the country’s Climate-Resilient Green Economy (CRGE) strategy, which aims to reduce greenhouse gas emissions while promoting economic development (Federal Democratic Republic of Ethiopia, 2011).
Dilla University, located in southern Ethiopia, generates substantial volumes of organic waste daily from its student cafeterias, staff quarters, research farms, and sanitation facilities. Despite the availability of such biodegradable material, waste management practices on campus remain inefficient, relying primarily on open dumping and burning. These practices not only pose environmental and health concerns but also represent a missed opportunity for sustainable energy generation and nutrient recycling (Tadesse et al., 2021).
This study was therefore initiated to explore the biogas production potential of commonly available campus waste streams at Dilla University, namely food leftovers (injera, bread), fruit peels (avocado, banana, mango), dairy manure, and human excreta. The investigation focuses on both mono-digestion and co-digestion approaches, assessing how various combinations of these substrates affect biogas yield and substrate degradation efficiency. Furthermore, the study aims to identify the optimal substrate mix, composition ratios, and conditions for enhanced biogas production. The findings are expected to inform the design of a model biogas system that can serve both as a practical teaching tool for students and a demonstration site for promoting biogas technology within the surrounding community.
By evaluating and optimizing the biogas potential of campus-generated organic waste, this study contributes to the broader goals of sustainable waste management, renewable energy promotion, and climate-smart innovation in higher education institutions in Ethiopia and beyond.
2. Objectives
-
General Objective:
- To evaluate the biogas potential of major waste types at Dilla University.
-
Specific Objectives:
- To evaluate the individual biogas potential of key organic wastes.
- To assess the co-digestion potential of different waste combinations.
- To optimize waste composition, volume, and concentration for digestion.
- To investigate optimal C/N ratios using mixed substrates.
- To establish a model biogas plant for community demonstration and student training.
3. Materials and Methods
3.1. Study Site Description
The experiment was conducted at the Botanical Garden of Dilla University, located in Dilla town, which is the administrative center of the Gedeo Zone in Southern Ethiopia. The university is situated approximately 360 kilometers south of the capital, Addis Ababa, along the main road to Kenya. Geographically, the site lies at an altitude of around 1,570 meters above sea level, within a subtropical highland climate zone.
The Dilla University Botanical Garden spans over 130 hectares and serves multiple functions, including biodiversity conservation, research, environmental education, and community engagement. It is an ideal location for field-based experiments due to its secure environment, accessibility to various organic waste sources from university facilities, and proximity to laboratory infrastructure for sample analysis.
The area experiences a bimodal rainfall pattern, with the main rainy season occurring between June and September and a shorter rainy season from March to May. Annual rainfall averages 1,200–1,600 mm, and the mean annual temperature ranges from 15°C to 25°C. These moderate climatic conditions are suitable for anaerobic digestion processes, as microbial activity involved in biogas production tends to perform well under mesophilic temperature ranges.
The Botanical Garden provided a controlled and practical setting for setting up biogas digesters and monitoring their performance, making it not only a research site but also a demonstration hub for sustainable waste-to-energy technologies relevant to both academic and community stakeholders.
3.2 Digester Design
To evaluate the biogas production potential of selected organic waste types, five experimental anaerobic digesters were designed and constructed using high-density polyethylene (HDPE) plastic barrels. Each barrel measured approximately 1.5 meters in height, with a circumference of 6 meters, giving a total volume of about 150 liters (Figure 1).
Each digester was filled with 100 liters of prepared slurry, while the remaining 50 liters of headspace was reserved for biogas accumulation. This design ensured adequate space for gas expansion while maintaining an optimal slurry volume for microbial digestion.
To facilitate input and output operations, two holes (one at the top and one at the bottom) with a diameter of 3.75 centimeters were drilled into each barrel. These served as the inlet for feeding fresh substrate and the outlet for discharging digested slurry (digestate). Both openings were fitted with PVC pipes, and control valves and elbow joints were attached to the outlet lines to regulate the flow of digestate and prevent air infiltration.
A third hole was drilled at the top center of each digester and fitted with a gas outlet pipe. This pipe was connected to a gas line system, which included a gas pressure gauge and a biogas burner (stove) for testing the combustibility and energy usability of the produced gas. To ensure gas-tightness, all pipe joints were thoroughly sealed using a combination of super glue and sand, forming a durable and airtight barrier that minimized leakage and external contamination.
This simple, low-cost, and replicable design was chosen to reflect real-world conditions, particularly in rural and semi-urban settings in Ethiopia where resources may be limited. The digesters were positioned in a secure, well-ventilated area of the Dilla University Botanical Garden, enabling safe operation and continuous monitoring throughout the digestion period.
3.3. Substrate Preparation
The selection and preparation of substrates are critical steps in optimizing the anaerobic digestion (AD) process. For this study, four categories of organic waste materials were sourced from different units within Dilla University, including student cafeterias, staff kitchens, and sanitation facilities. The substrates were selected based on their local availability, biodegradability, and relevance to typical university waste streams.
The substrates used were as follows:
-
Primary substrate:
- o
- Dairy manure – collected from the university’s livestock unit, this was used as the main feedstock due to its high microbial activity, balanced carbon-to-nitrogen (C/N) ratio, and known biogas yield potential.
-
Secondary substrates:
- o
- Café leftovers – primarily composed of injera and bread, rich in carbohydrates and readily degradable.
- o
- Fruit peels – including banana, avocado, and mango peels, these are high in fermentable sugars and organic acids that enhance microbial digestion.
-
Inoculum:
- o
- Human excreta (15-day-old slurry) – collected from sealed sanitation units, this was used to inoculate the digesters and catalyze the anaerobic digestion process. As a microbial-rich input, it played a key role in seeding the digesters and accelerating the start-up phase of biogas production.
Before use, all collected substrates were pre-treated to improve digestibility and ensure uniformity across treatments (Figure 2). Non-biodegradable and undesirable materials such as bones, plastics, and inorganic contaminants were carefully sorted and removed. The remaining biodegradable waste was manually chopped, crushed, and homogenized to a particle size range of 1 to 4 millimeters. This size reduction was essential to increase the surface area available for microbial attack, thereby enhancing the hydrolysis phase of the digestion process.
The substrates were then mixed according to predefined treatment combinations (see Table 1), with cow dung as the constant base component and varying proportions of café leftovers and fruit peels. The homogenized mixtures were used to prepare slurry for loading into the digesters, ensuring consistency across all experimental units.
This methodical approach to substrate preparation not only facilitated efficient microbial degradation but also simulated a replicable model for decentralized biogas production systems using locally available organic waste.
3.4. Treatment Setup
To investigate the effect of varying feedstock compositions on biogas production, five distinct treatments were formulated by altering the ratios of organic waste (composed of café leftovers and fruit peels), cow dung, and human excreta. These treatments were designed to simulate different co-digestion scenarios, allowing for the evaluation of individual and synergistic effects of substrate combinations on biogas yield and substrate degradation.
In all treatments, human excreta (15-day-old slurry) was used at a constant rate of 7.5% across all combinations, serving as the microbial inoculum. Cow dung was used as the primary substrate due to its proven effectiveness in anaerobic digestion, while organic waste—including injera, bread, banana peels, avocado peels, and mango peels—was varied incrementally to assess its contribution to gas production and digestion performance.
Each treatment was prepared by thoroughly mixing the appropriate ratios of substrates with water to form a uniform slurry. The mixtures were then loaded into the digesters for anaerobic fermentation.
This treatment setup provided a structured framework for identifying the optimal combination of substrates for biogas production. By incrementally increasing the proportion of organic waste while reducing cow dung, the experiment was able to evaluate the digestibility, methane potential, and system stability of diverse substrate blends.
3.5. Digestion Process
The anaerobic digestion process was carried out over a period of 60 days, a duration selected to ensure sufficient time for the breakdown of complex organic materials and the production of biogas under mesophilic conditions. The prepared slurry for each treatment—formulated according to the ratios detailed in Section 3.4—was thoroughly mixed to ensure homogeneity and then poured into the designated digesters.
Each digester was filled with 100 liters of slurry, leaving a 50-liter headspace for gas accumulation. The digesters were sealed immediately after loading to create an anaerobic environment, essential for the microbial activity responsible for biogas production. The digesters were kept at ambient environmental temperatures, which in Dilla typically range between 20°C and 28°C—a range favorable for mesophilic bacteria involved in the anaerobic degradation process.
During the digestion period, the digesters were left undisturbed to allow for uninterrupted microbial activity. However, to monitor the progress of the digestion and to evaluate the efficiency of the treatments, two sampling points were established:
- Mid-digestion (Day 30)
- End of digestion (Day 60)
At each sampling point, the digesters were briefly opened, and representative slurry samples were taken using sterilized sampling equipment. Great care was taken to minimize oxygen exposure and contamination during this process.
3.6. Analytical Parameters
To evaluate the efficiency of the anaerobic digestion process and the influence of different substrate combinations, laboratory analysis was conducted on samples collected at mid-digestion and post-digestion stages. The samples were carefully transported to the laboratory under controlled conditions to ensure the integrity of the physical and chemical properties being assessed (Figure 3).
The following key analytical parameters were measured:
- Total Solids (TS): This parameter indicates the total amount of solid material present in the sample, including both organic and inorganic matter. It is an essential indicator of the concentration of digestible material.
- Volatile Solids (VS): Representing the organic portion of the total solids, VS is directly linked to the material's potential to produce biogas, as it reflects the biodegradable fraction.
- Total Suspended Solids (TSS): TSS measures the amount of solid particles suspended in the slurry, which can influence the flow characteristics and microbial accessibility in the digester.
- Ash Content: This is the inorganic, non-combustible residue remaining after the sample is burned at high temperatures. Ash content provides insights into the mineral content of the feedstock and digestate.
- Fresh Mass and Residuals: The mass of the feedstock before and after digestion was recorded to assess the reduction in biomass and the efficiency of organic matter degradation.
These parameters were used as indicators of waste breakdown efficiency and biogas generation potential. Significant reductions in total and volatile solids after digestion suggest effective microbial degradation and successful conversion of organic matter into biogas.
Biogas yield and quality were evaluated using basic visual flame tests, whereby the combustibility of the gas was observed using a biogas burner. Gas pressure gauges were also employed to monitor pressure changes within each digester. While these methods provided useful qualitative insights, the study acknowledges that more precise instrumentation—such as gas chromatography—would be beneficial in future research to quantify methane concentration and assess the energy potential of the produced biogas with higher accuracy.
All experimental data collected from the laboratory analyses were subjected to statistical analysis using SAS software. This enabled the identification of significant differences between treatments, as well as trends and correlations between substrate composition and digestion efficiency. The analytical and statistical results provided a scientific basis for evaluating the performance of the different treatments and informed conclusions regarding optimal substrate combinations.
3.7. Statistical Analysis
Key physical and chemical parameters including total solids (TS), total suspended solids (TSS), ash content (MA), and fresh mass (MFS) were compared across treatments using descriptive statistics. These included calculations of means and graphical comparisons of values before and after digestion for each treatment. The trends observed were used to qualitatively assess the effect of substrate composition on anaerobic digestion performance and biogas generation potential.
The changes in solids and ash content were interpreted as indicators of substrate degradation, while variations in fresh mass and suspended solids provided additional insight into digestion efficiency. Although no statistical significance could be determined, the visual trends and percentage reductions offered a preliminary understanding of treatment effectiveness.
4. Results and Discussion

Table 2.
Laboratory Results Before and After Digestion.
| Trt | Time | Fresh Mass (g) | Total Solids (g) | Suspended Solids (g) | Ash (g) |
| 1 | Before | 15.124 | 2.171 | 0.853 | 0.619 |
| 1 | After | 22.858 | 2.072 | 0.589 | 0.601 |
| 2 | Before | 14.383 | 2.362 | 1.226 | 0.476 |
| 2 | After | 13.812 | 1.199 | 0.543 | 0.450 |
| 3 | Before | 13.920 | 2.442 | 0.779 | 0.353 |
| 3 | After | 14.635 | 1.062 | 0.749 | 0.342 |
| 4 | Before | 13.758 | 1.668 | 0.938 | 0.271 |
| 4 | After | 13.733 | 1.579 | 0.948 | 0.371 |
| 5 | Before | 13.165 | 1.307 | 1.435 | 0.215 |
| 5 | After | 15.546 | 3.190 | 1.045 | 0.393 |
Key Observations:
- There was a general reduction in total solids and suspended solids post digestion, indicating effective degradation of organic matter.
- Treatment 5 (with the highest organic waste ratio) showed the highest post-digestion TS, suggesting a slower degradation or accumulation of undigested matter.
- The decrease in ash content was more evident in treatments with higher fruit/vegetable content.
4.1. Fresh Mass (MFS)
The fresh mass (MFS) of the digestate was recorded both before and after anaerobic digestion to evaluate the overall reduction in substrate volume as a result of microbial breakdown and biogas production.
In Treatment 1, MFS increased from 15.124 g before digestion to 22.858 g after digestion. This unusual increase may indicate accumulation of undigested material or moisture influx during the process. In contrast, Treatment 2 showed a decrease from 14.383 g to 13.812 g, reflecting slight substrate reduction. Similarly, Treatment 3 experienced a minor increase from 13.920 g to 14.635 g, which could suggest limited digestion or inconsistent sampling.
Treatment 4 showed negligible change in MFS (from 13.758 g before to 13.733 g after), indicating minimal degradation or mass balance changes during the process. Interestingly, Treatment 5 showed an increase from 13.165 g to 15.546 g, which, like Treatment 1, could imply water absorption, sampling error, or accumulation of partially degraded residues.
Overall, the trends in fresh mass were inconsistent across treatments. Unlike expected reductions due to microbial consumption of organic matter, some treatments displayed increased mass, possibly due to moisture retention, gas entrapment, or accumulation of resistant fractions. These variations suggest that while biogas production occurred, physical reduction of substrate mass was not always directly proportional and should be interpreted with caution. More precise measurement methods, including moisture content and mass balance tracking, would be useful in future studies.
4.2. Mass of Total Solids (MTS)
The mass of total solids (MTS) was measured before and after the 60-day anaerobic digestion period for each of the five treatments. The results revealed distinct changes in solid content, reflecting the degradation efficiency of the substrates used (Figure 4).
In Treatment 1, which included only cow dung and human excreta (no additional organic waste), the MTS decreased slightly from 2.171 g to 2.072 g, indicating moderate degradation of solids. Similarly, Treatment 2, which included 6% organic waste, showed a substantial reduction from 2.362 g to 1.199 g, suggesting improved breakdown efficiency with the addition of food-based organic matter.
Treatment 3, with 12% organic waste, exhibited a strong reduction in MTS from 2.442 g before to 1.062 g after digestion, highlighting the enhanced microbial activity and conversion efficiency when a balanced mix of carbohydrate-rich waste was introduced.
Interestingly, Treatment 4, which had 18% organic waste and less cow dung, showed a relatively minor decrease from 1.668 g to 1.579 g, suggesting that the degradation rate may plateau or become less efficient at higher concentrations of organic waste without sufficient buffering capacity from cow dung.
In contrast, Treatment 5 displayed an unexpected result, where the MTS increased from 1.307 g to 3.190 g after digestion. This anomaly may indicate either an experimental inconsistency or accumulation of non-degraded or secondary reaction products in the digester due to an imbalanced C/N ratio or microbial inhibition at higher organic loading.
Overall, the results suggest that Treatments 2 and 3 offered the most favorable conditions for organic matter degradation, reflected by the greatest reduction in MTS. These treatments likely provided an optimal balance of readily digestible substrates and buffering agents (cow dung and inoculum), fostering efficient microbial activity.
4.3. Total Suspended Solids (MTSS) and Ash Content (MA)
The results of total suspended solids (MTSS) before and after digestion across the five treatments revealed varying degrees of substrate breakdown and suspended particle reduction. In Treatment 1, where only cow dung and human excreta were used, MTSS decreased from 0.853 g to 0.589 g, indicating effective degradation of suspended organic material. Treatment 2, which included 6% organic waste, showed the most significant reduction in MTSS—from 1.226 g before digestion to 0.543 g after—demonstrating improved microbial activity and solid breakdown in the presence of a moderate amount of easily degradable food waste.
Treatment 3, which had 12% organic waste, exhibited a slight reduction in suspended solids from 0.779 g to 0.749 g. The minimal change suggests either a balance between digestion and suspended residue formation or a slowed degradation rate at this composition. Interestingly, Treatment 4 showed a small increase in MTSS from 0.938 g to 0.948 g, indicating a possible accumulation of particulate matter or slight measurement variability. Treatment 5, with the highest organic waste content (24%), displayed a moderate decline in MTSS from 1.435 g to 1.045 g, suggesting that although the digester still processed suspended solids, the high organic load may have affected overall degradation efficiency.
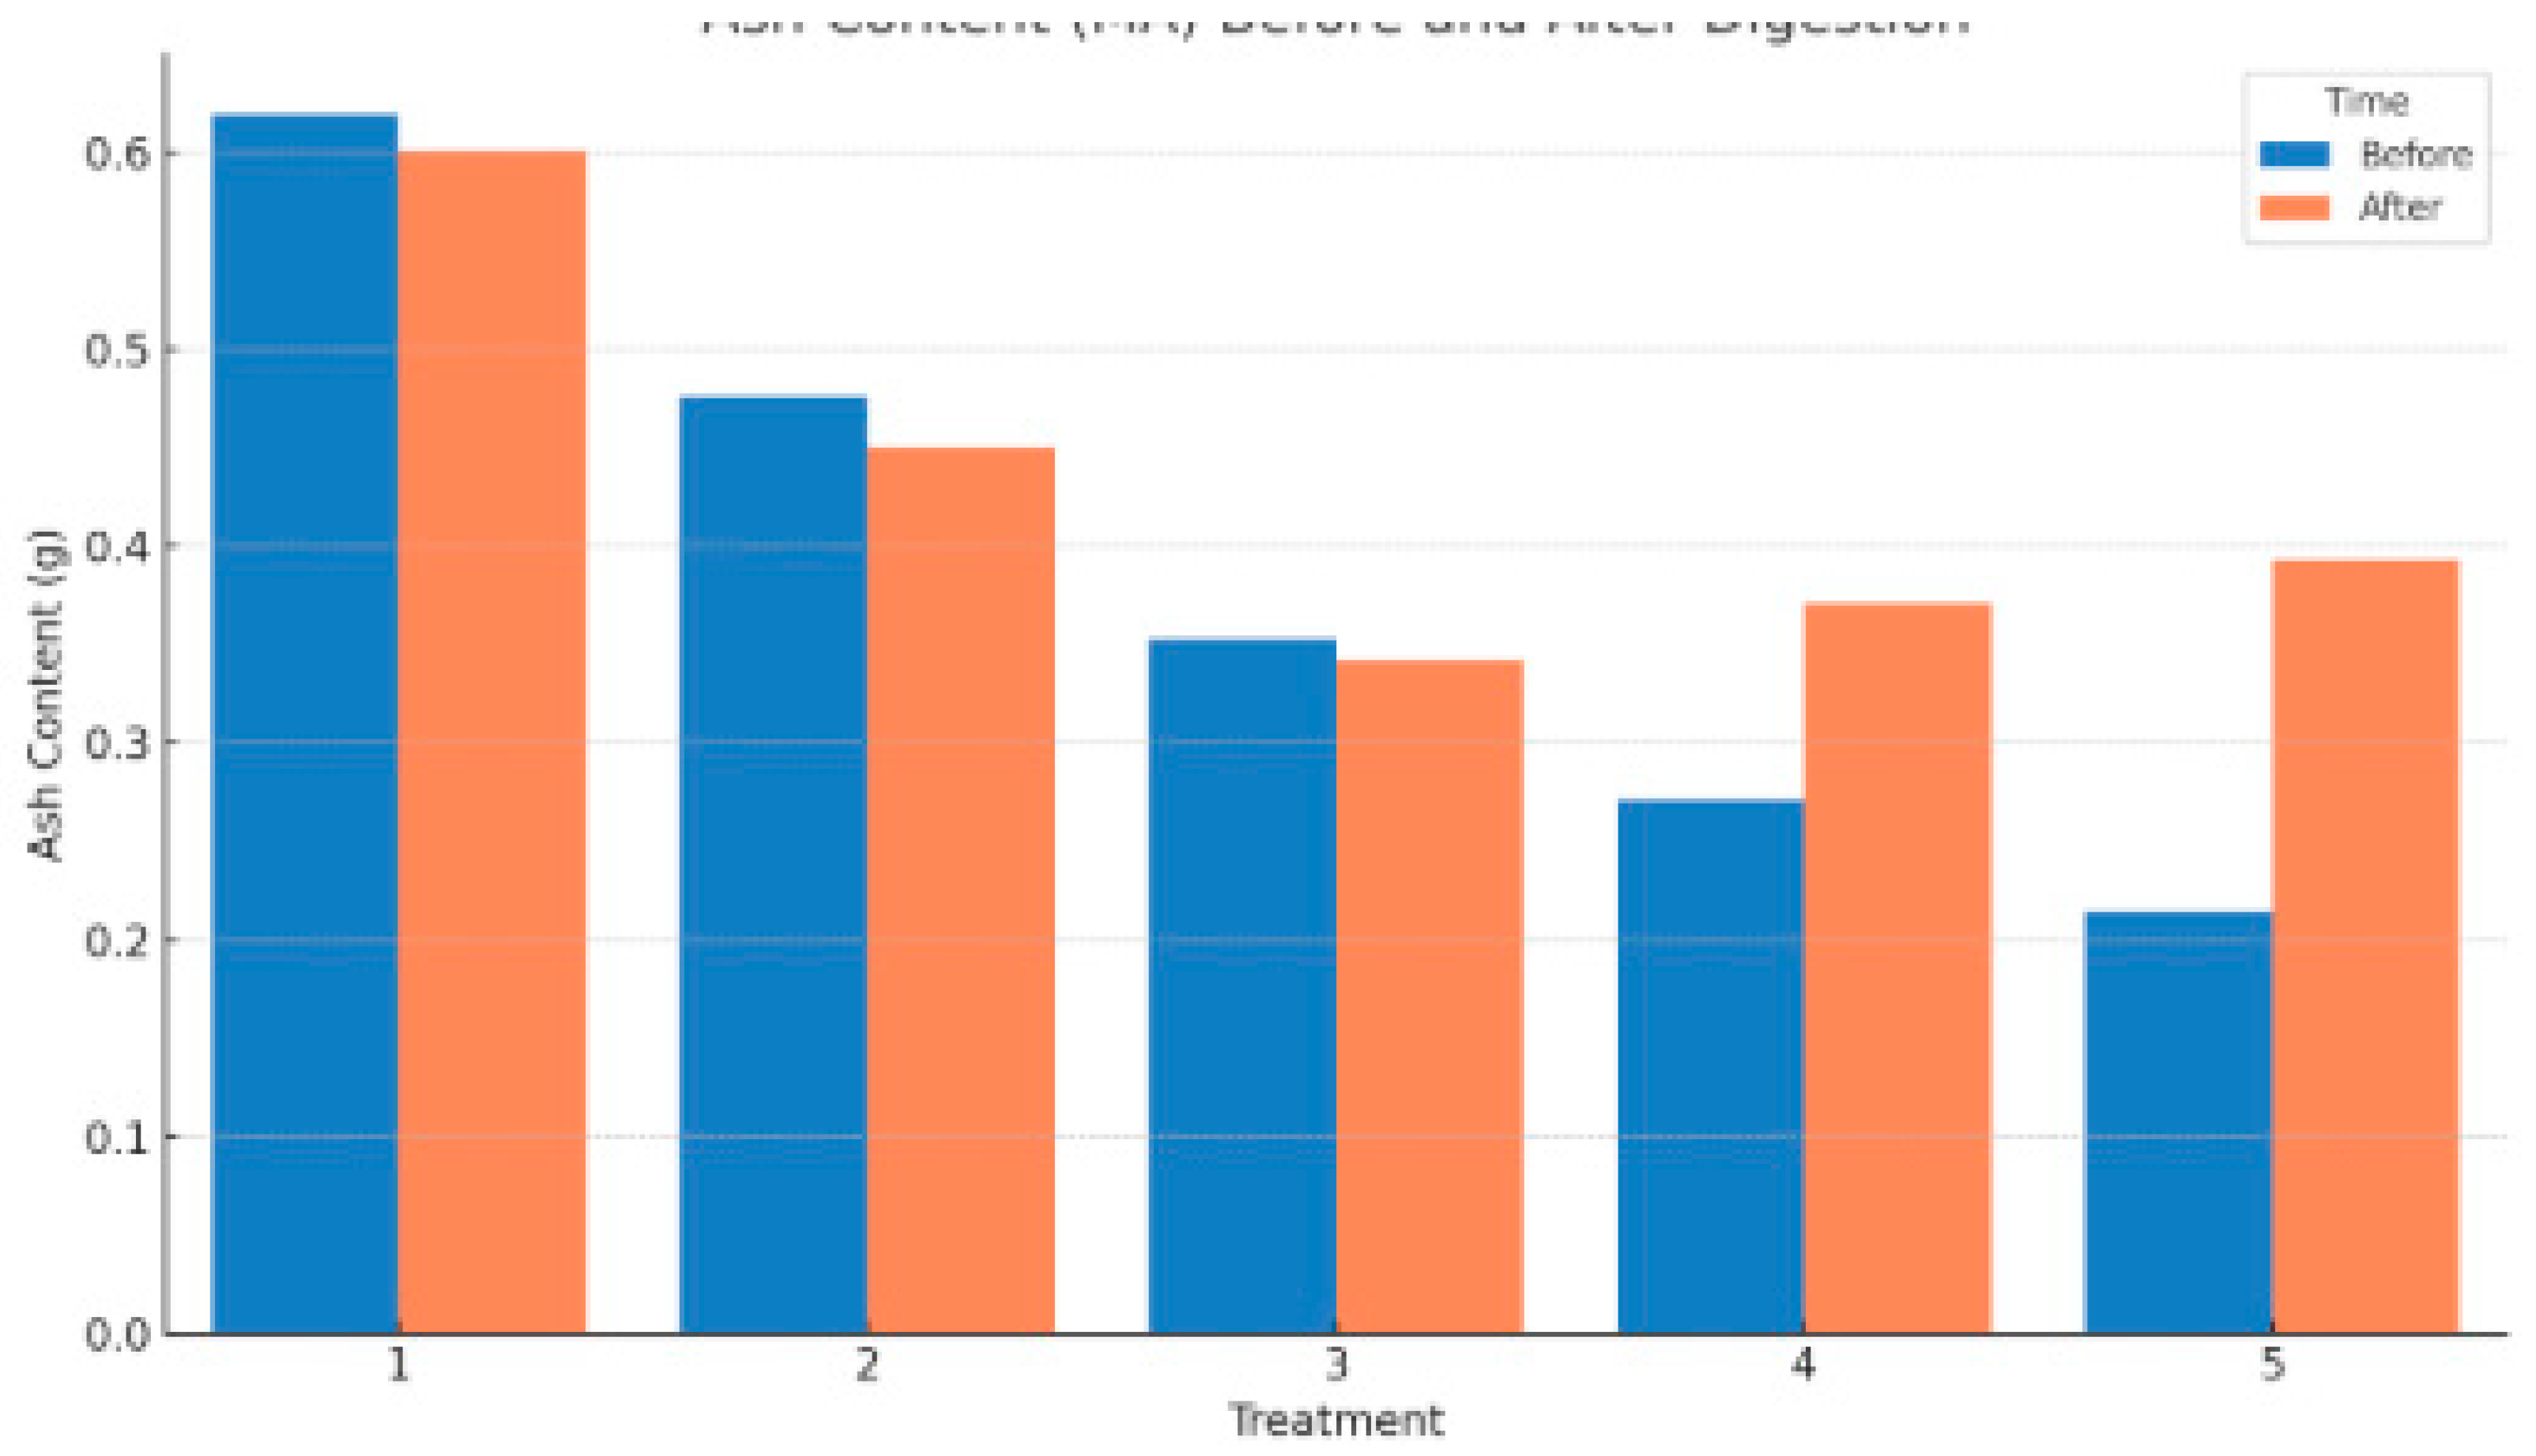
In terms of ash content (MA), which reflects the inorganic residue remaining after combustion, only slight variations were observed across treatments. Treatment 1 showed a negligible decrease from 0.619 g to 0.601 g, indicating a relatively stable mineral composition before and after digestion. Treatment 2 experienced a small drop in ash content from 0.476 g to 0.450 g, while Treatment 3 decreased from 0.353 g to 0.342 g. These reductions suggest a slight loss of ash-associated organics during digestion or dilution effects.
Conversely, Treatments 4 and 5 experienced increases in ash content. In Treatment 4, ash content rose from 0.271 g to 0.371 g, and in Treatment 5, it increased from 0.215 g to 0.393 g. These increases could be attributed to the concentration of mineral residues as organic matter was degraded, particularly under conditions of high organic loading where microbial activity may have been partially inhibited or substrate degradation was incomplete. The rise in ash content in these treatments also aligns with the increased post-digestion total solids observed, suggesting that a significant portion of the digestate remained undegraded or mineral-rich.
Overall, the trends in both MTSS and MA highlight the impact of substrate composition on the digestion process. Treatments 1 and 2 showed the most effective breakdown of suspended solids with stable mineral content, while higher organic loading in Treatments 4 and 5 may have led to suboptimal digestion and accumulation of residual matter.
Figure 6.
Ash content Before and After Digestion.
4.4. Digestion Efficiency and Substrate Degradation
The efficiency of anaerobic digestion was evaluated based on the reduction of total solids (MTS), total suspended solids (MTSS), changes in ash content (MA), and variations in fresh mass (MFS). Collectively, these parameters provide insights into how effectively organic matter was broken down and transformed into biogas.
Treatment 2 demonstrated the highest overall digestion efficiency. It showed a substantial reduction in both MTS (from 2.362 g to 1.199 g) and MTSS (from 1.226 g to 0.543 g), indicating strong microbial activity and effective degradation of both dissolved and suspended solids. A slight decrease in ash content (from 0.476 g to 0.450 g) and fresh mass (from 14.383 g to 13.812 g) further support the efficiency of substrate conversion and organic matter loss during digestion.
Treatment 3 also showed good performance, with a significant drop in MTS and moderate reductions in MTSS and MA. However, the slight increase in fresh mass (13.920 g to 14.635 g) may suggest some inconsistency in sample moisture or the retention of semi-digested material.
In contrast, Treatment 1—which lacked supplementary organic waste—had a minimal reduction in solids and an increase in fresh mass, indicating lower degradation efficiency. This could be due to a lack of fermentable carbon sources, which are critical for stimulating microbial activity and biogas formation.
Treatments 4 and 5, which contained the highest proportions of organic waste, presented mixed results. Although Treatment 5 showed a relatively high post-digestion MTS (3.190 g) and an increase in ash and fresh mass, the digestion was likely suboptimal due to overloading, leading to incomplete degradation. The increase in ash content suggests that mineral residues became more concentrated as organics were only partially digested. Similarly, Treatment 4 showed negligible changes in most parameters, pointing to a plateau in degradation or microbial inhibition at higher waste concentrations.
Overall, the results highlight that balanced substrate composition—particularly the right mix of cow dung (as buffer and microbial carrier), food waste (as carbon source), and human excreta (as inoculum)—is key to optimizing digestion efficiency. Moderate levels of organic waste, as seen in Treatment 2, support better degradation dynamics than either high or low organic loading. These findings underscore the importance of substrate synergy and proportion optimization in small-scale biogas systems.
4.5. Gas Yield Interpretation and Methane Estimation Assumptions
Although direct measurements of biogas volume and methane concentration were not conducted in this study due to equipment limitations, meaningful inferences about gas production can be drawn from the degradation patterns of solids in the digesters. Treatments that exhibited significant reductions in total solids (MTS) and volatile fractions such as total suspended solids (MTSS) are assumed to have yielded higher volumes of biogas. In particular, Treatment 2, which showed a reduction of over 49% in MTS and 56% in MTSS, likely generated the highest volume of biogas among all treatments.
Based on existing literature, the theoretical methane potential (TMP) of organic waste can be estimated using standard values. For instance, 1 gram of volatile solids (VS) typically yields approximately 0.35 to 0.50 liters of methane under standard temperature and pressure (STP) conditions, depending on the composition and digestibility of the substrate (Appels et al., 2008; Angelidaki & Ellegaard, 2003). In this study, even though VS values were not directly measured, the substantial loss in MTS and MTSS can be taken as a proxy for volatile matter degradation. Therefore, it is reasonable to assume that treatments with greater reductions in solids had higher methane production.
Moreover, the visual observation of a sustained blue flame in digesters connected to gas stoves confirms the presence of combustible gas—primarily methane. This qualitative validation supports the assumption that microbial activity led to methane formation, especially in treatments with optimized C/N ratios and balanced substrate inputs.
Future studies are encouraged to integrate biogas collection systems with gas meters or water displacement setups to quantify total gas volume. Additionally, methane content analysis using gas chromatography or portable biogas analyzers would provide a more accurate assessment of energy potential. For now, the trends observed in substrate degradation, combined with qualitative flame tests, offer a strong preliminary indication of biogas and methane generation potential from Dilla University’s organic waste streams.
4.6. Methane Yield Estimation and Interpretation
Although biogas volume and methane concentration were not measured directly in this study, an estimation of methane yield was performed using the total suspended solids (MTSS) as a proxy for volatile solids (VS). Based on standard conversion values from the literature—where 1 gram of volatile solids typically yields approximately 0.45 liters of methane under ideal anaerobic digestion conditions (Appels et al., 2008; Angelidaki & Ellegaard, 2003)—theoretical methane outputs were calculated for each treatment.
The highest estimated methane yield was observed in Treatment 5, with approximately 0.470 liters of CH₄, followed by Treatment 4, which produced an estimated 0.427 liters (Table 3). These treatments had the highest MTSS values after digestion (1.045 g and 0.948 g, respectively), suggesting that while biogas production was ongoing, a significant portion of digestible solids remained in the system. This could indicate either a delayed degradation phase or a build-up of partially digested material due to high organic loading.
Treatment 3 presented a more balanced scenario, with an estimated 0.337 liters of methane and moderate residual solids, pointing to efficient conversion with less accumulation of undigested matter. Meanwhile, Treatments 1 and 2—which had lower MTSS values after digestion—produced the least methane, with estimated yields of 0.265 liters and 0.244 liters, respectively. However, these treatments also demonstrated the highest reductions in solids, suggesting that much of the biodegradable content had already been digested, and that gas production may have peaked earlier in the cycle.
Overall, the methane yield estimates reflect not only the substrate degradation patterns but also the interaction between organic loading, microbial activity, and retention time. While high post-digestion MTSS can indicate potential for continued gas production, it may also reflect suboptimal digestion efficiency if much of the material remains undegraded. In contrast, lower MTSS levels paired with solid reduction suggest more complete digestion and earlier methane release.
To improve future assessments, integrating real-time biogas collection systems and methane sensors is highly recommended. Such tools would enable accurate tracking of gas production trends and provide a more detailed understanding of the energy recovery potential of different waste compositions.
5. Conclusion and Recommendations
5.1. Conclusion
This study evaluated the biogas production potential of organic waste generated at Dilla University through anaerobic digestion. The experiment tested five treatments with varying proportions of cow dung, café leftovers, fruit peels, and human excreta, assessing their impact on substrate degradation and biogas potential. Key physicochemical parameters—including total solids (MTS), total suspended solids (MTSS), ash content (MA), and fresh mass (MFS)—were analyzed before and after digestion.
Among the treatments, Treatment 2 (6% organic waste, 24% cow dung, and 7.5% human excreta) demonstrated the highest digestion efficiency, with significant reductions in MTS and MTSS, suggesting optimal substrate conversion into biogas. Treatment 3 also showed good performance, offering a balance between degradation efficiency and biogas yield. In contrast, Treatment 5, with the highest organic load (24%), resulted in high residual solids and estimated methane content, but lower digestion efficiency, likely due to overloading or microbial inhibition.
Theoretical methane yield estimates, based on MTSS as a proxy for volatile solids, aligned with the solid degradation trends and confirmed the energy generation potential of co-digestion systems using university-generated waste. Visual flame tests further validated the presence of combustible gas. However, the absence of direct gas volume and composition measurements limited the full quantification of biogas output.
5.2. Recommendation
- Pilot Implementation: A pilot-scale biogas digester using the optimal substrate ratio (as seen in Treatment 2 or 3) should be developed at Dilla University Botanical Garden as a demonstration and training facility.
- Real-Time Gas Monitoring: Future experiments should integrate biogas collection units equipped with gas flow meters and methane analyzers (e.g., gas chromatography or portable biogas kits) for accurate measurement of biogas and methane yields.
- Increased Replication: To strengthen statistical reliability, future studies should incorporate multiple replicates for each treatment and include longer retention times to evaluate methane potential over time.
- C/N Ratio Analysis: Detailed analysis of the carbon-to-nitrogen (C/N) ratio for each substrate mix is recommended to better understand microbial dynamics and digestion performance.
- Community Engagement: The model biogas system should be promoted among local communities and schools to raise awareness of sustainable waste management and renewable energy technologies.
- Policy and Research Integration: The findings can inform institutional policies on waste management and support the integration of renewable energy education into academic programs.
By converting campus-generated organic waste into renewable energy, Dilla University can serve as a model for environmentally responsible waste management and contribute to broader sustainable development goals in Ethiopia.
Author Contributions
We confirm that this manuscript is our original work and that all sources and materials used have been properly cited. The manuscript has been submitted solely to this publisher and is currently under consideration. It has not been previously published, nor is it under review elsewhere. Upon acceptance, the final version will be made publicly available in accordance with the publisher’s guidelines.
Funding
The research work were financially supported by Dilla University.
Conflicts of Interest
The authors have no conflicts of interest to declare.
References
- Appels, L., Lauwers, J., Degrève, J., Helsen, L., Lievens, B., Willems, K., ... & Van Impe, J. (2008). Anaerobic digestion in global bio-energy production: Potential and research challenges. Renewable and Sustainable Energy Reviews, 13(9), 2083–2090.
- Bond, T., & Templeton, M. R. (2011). History and future of domestic biogas plants in the developing world. Energy for Sustainable Development, 15(4), 347–354.
- Federal Democratic Republic of Ethiopia. (2011). Ethiopia’s Climate-Resilient Green Economy: Green Economy Strategy. Addis Ababa, Ethiopia.
- Khan, M. U., Ahsan, A., Maalouf, C., & Kaledin, N. (2016). Sustainable organic waste management for energy recovery: A review. Renewable and Sustainable Energy Reviews, 54, 939–951.
- Mata-Alvarez, J., Dosta, J., Macé, S., & Astals, S. (2014). Codigestion of solid wastes: A review of its uses and perspectives including modeling. Critical Reviews in Biotechnology, 31(2), 99–111.
- Tadesse, E., Woldemariam, D., & Alemu, G. (2021). Waste management challenges and prospects in Ethiopian universities. Journal of Environmental Health Science and Engineering, 19, 1889–1898.
Figure 1.
Plastic barrels used for digestion.
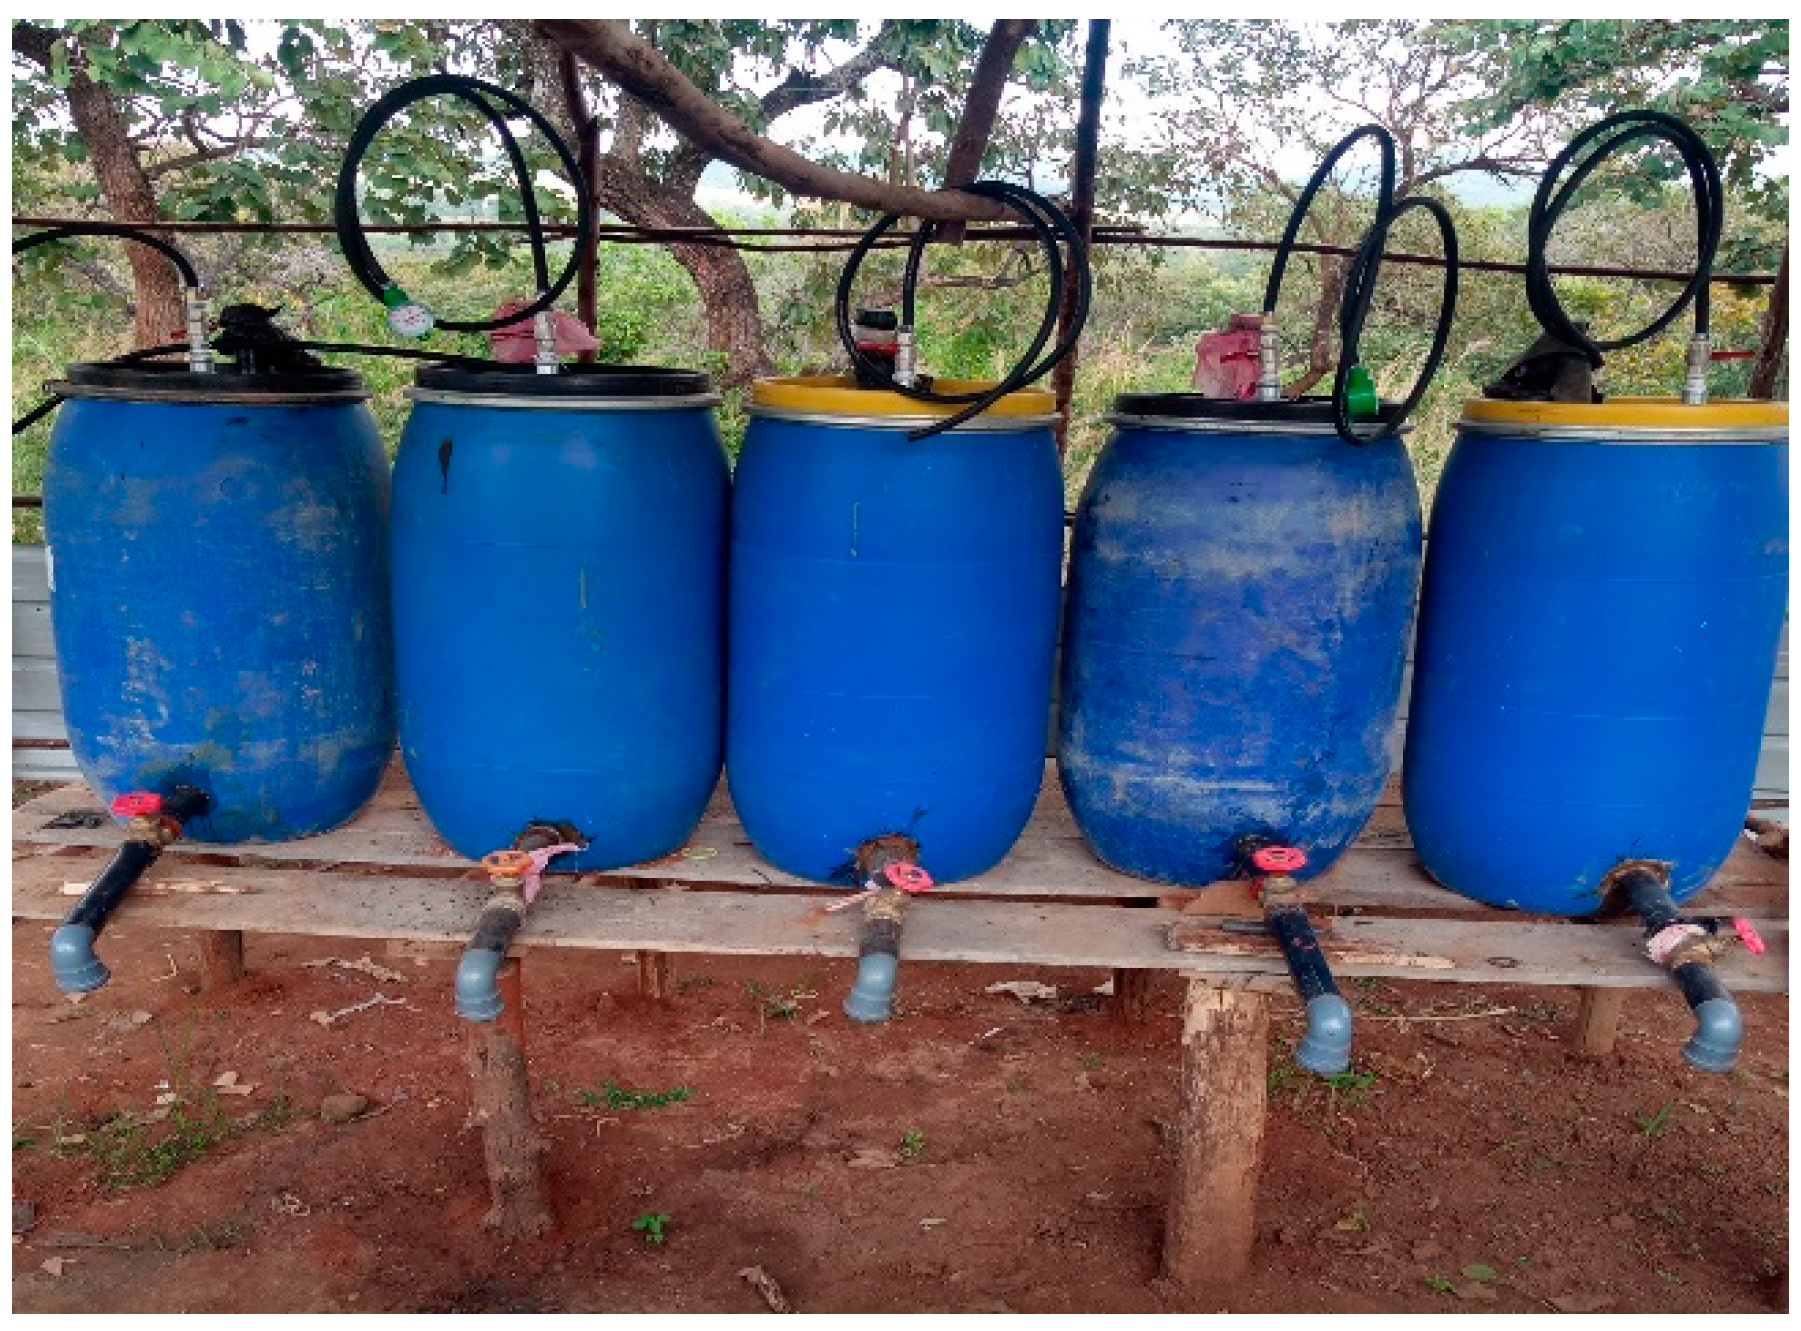
Figure 2.
Substrate preparation.
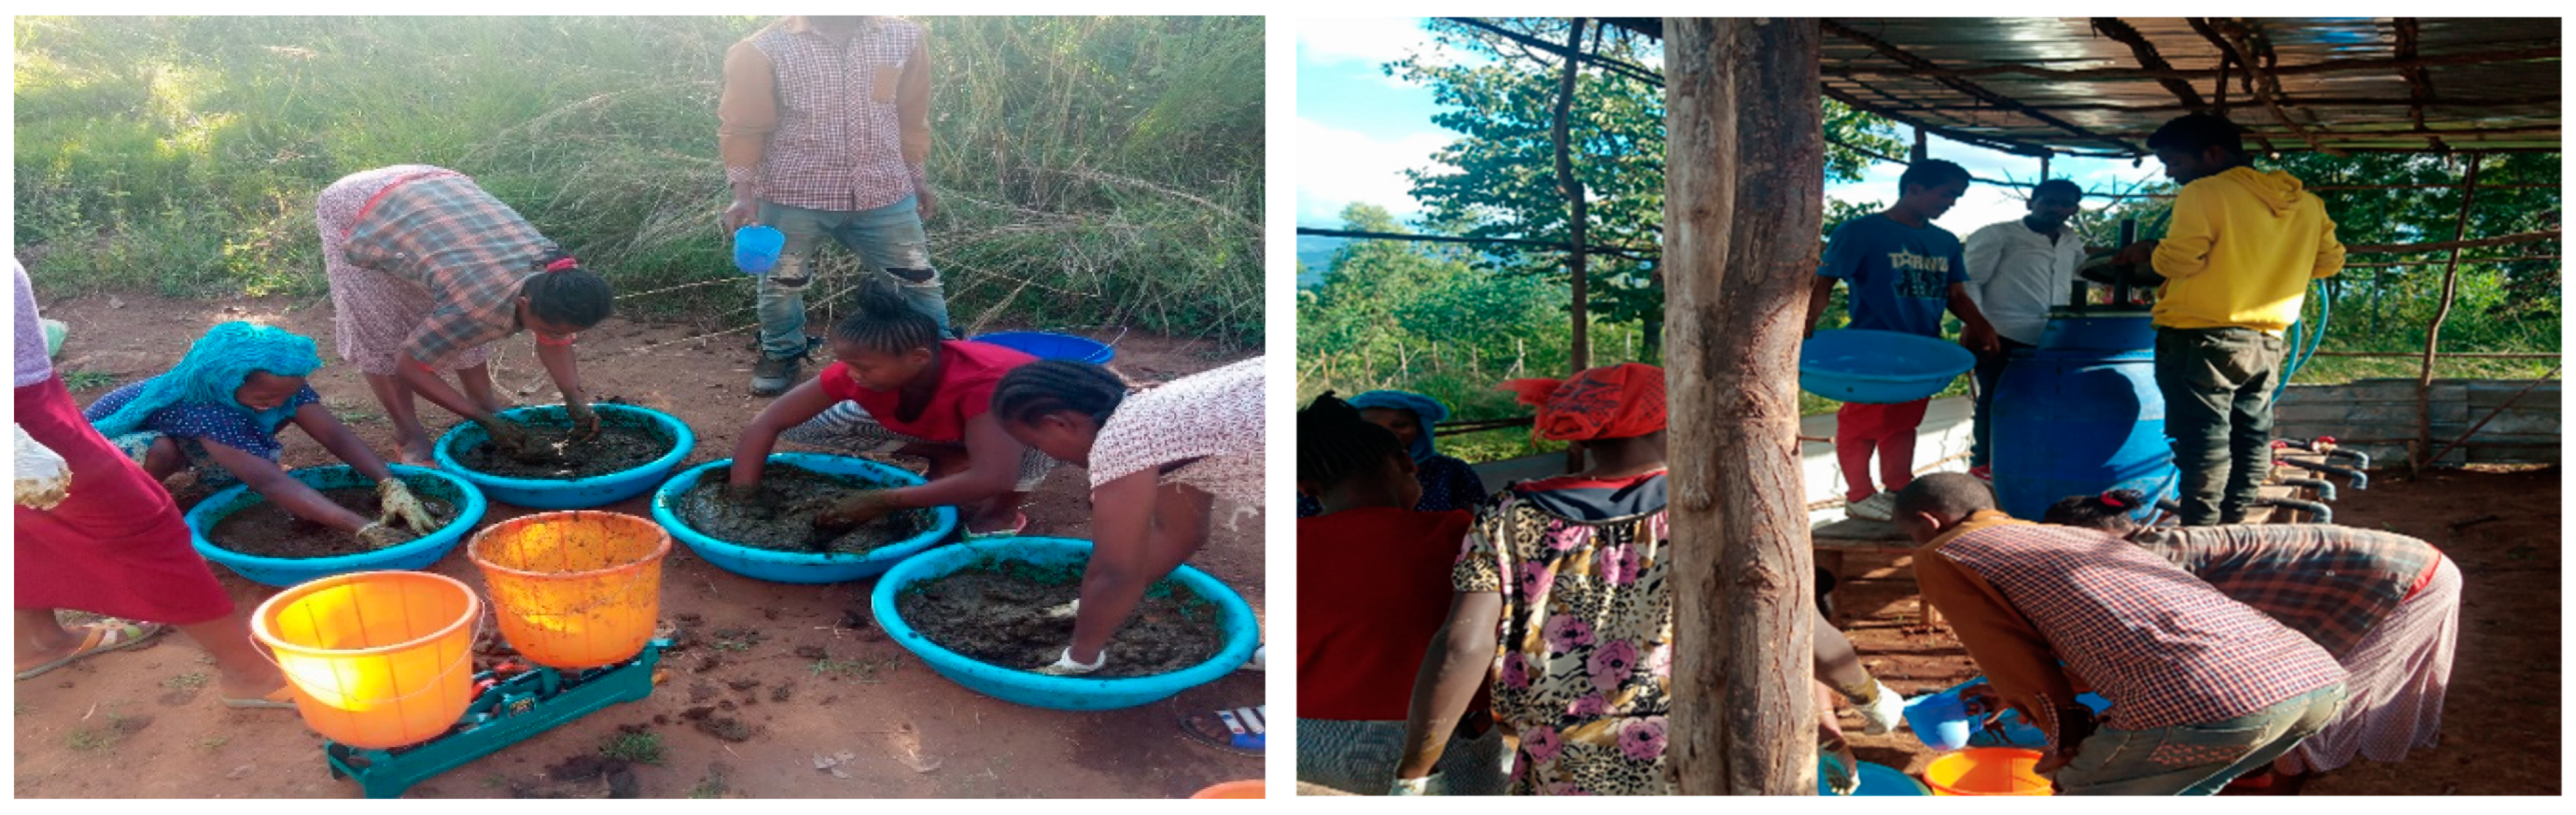
Figure 3.
Sample taken for laboratory analysis.
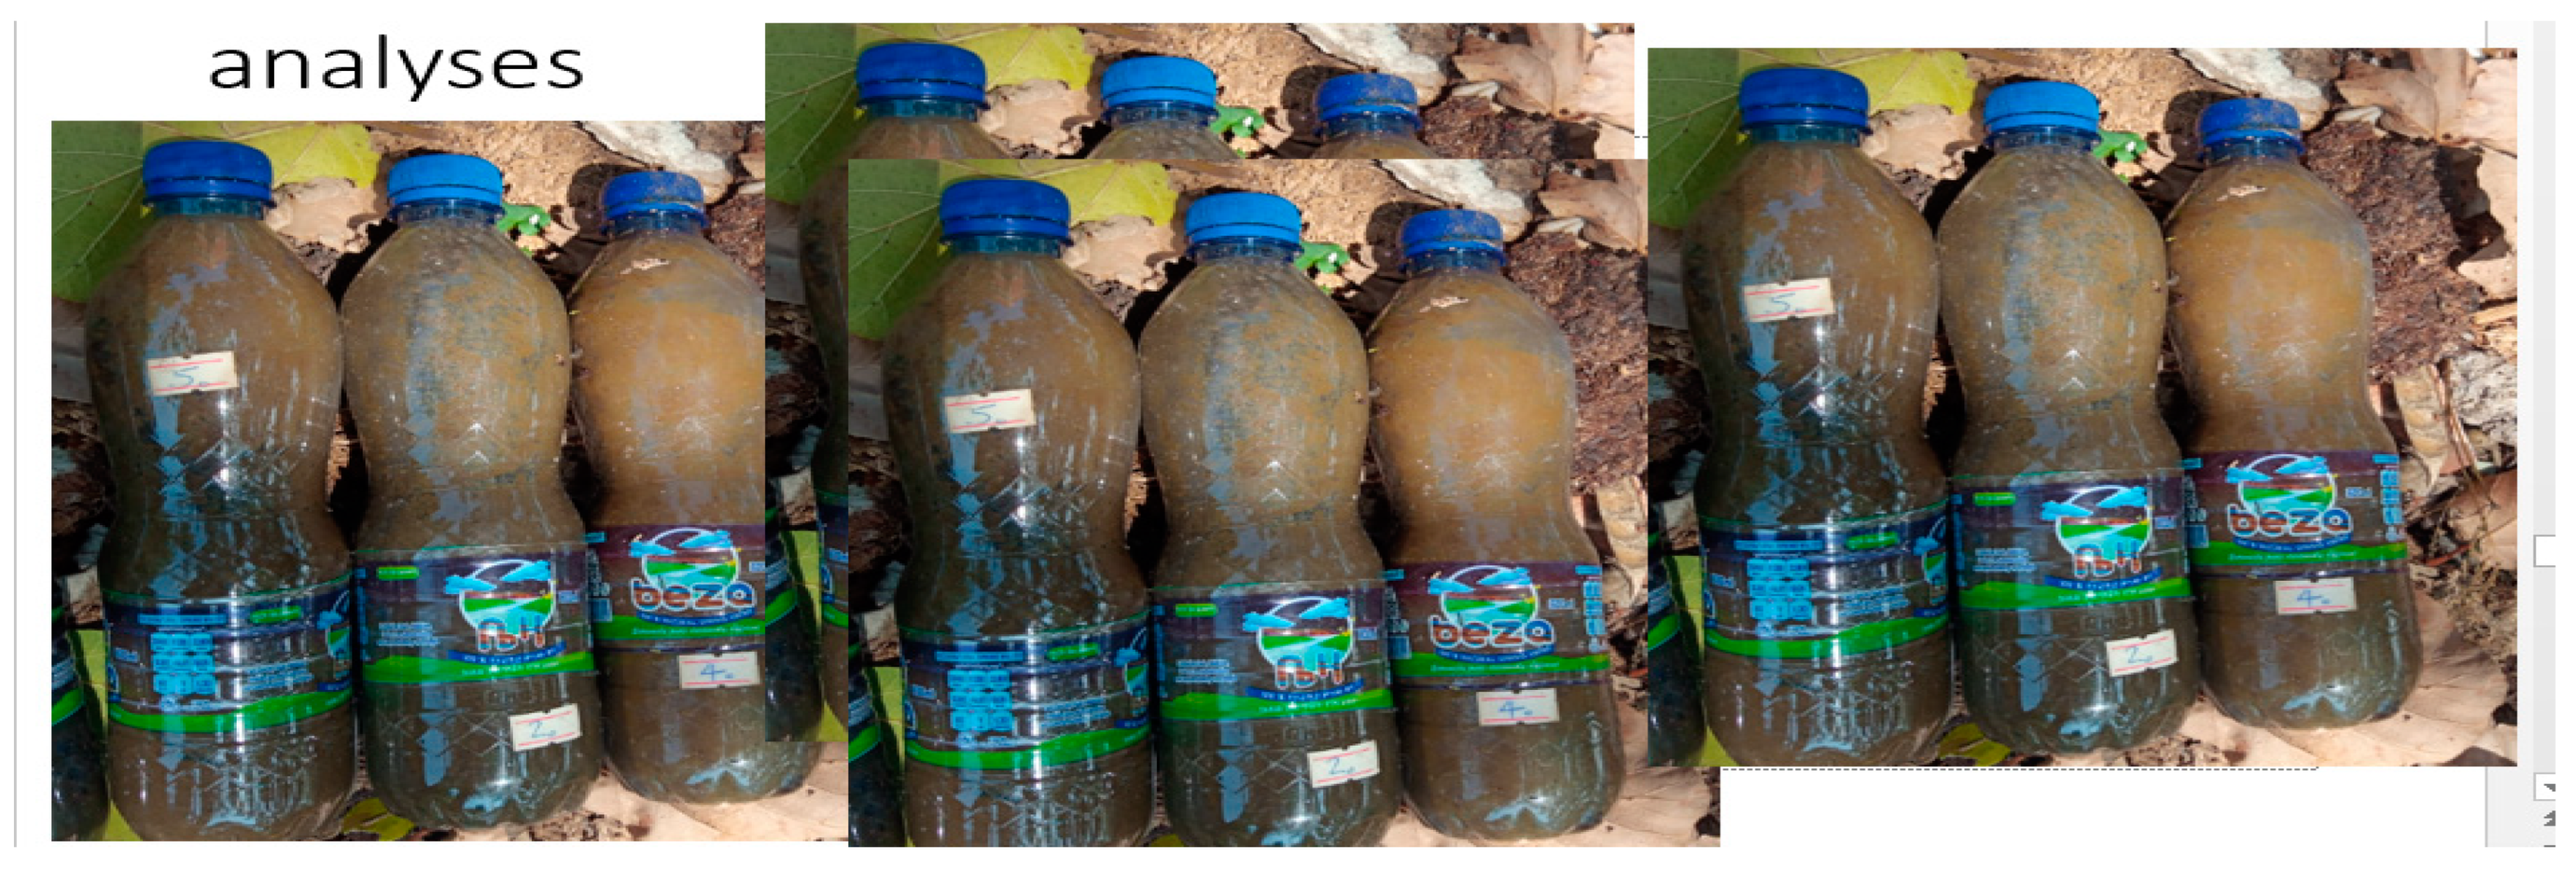
Figure 4.
Mass of Total solid(MTS) Before and After Digestion.
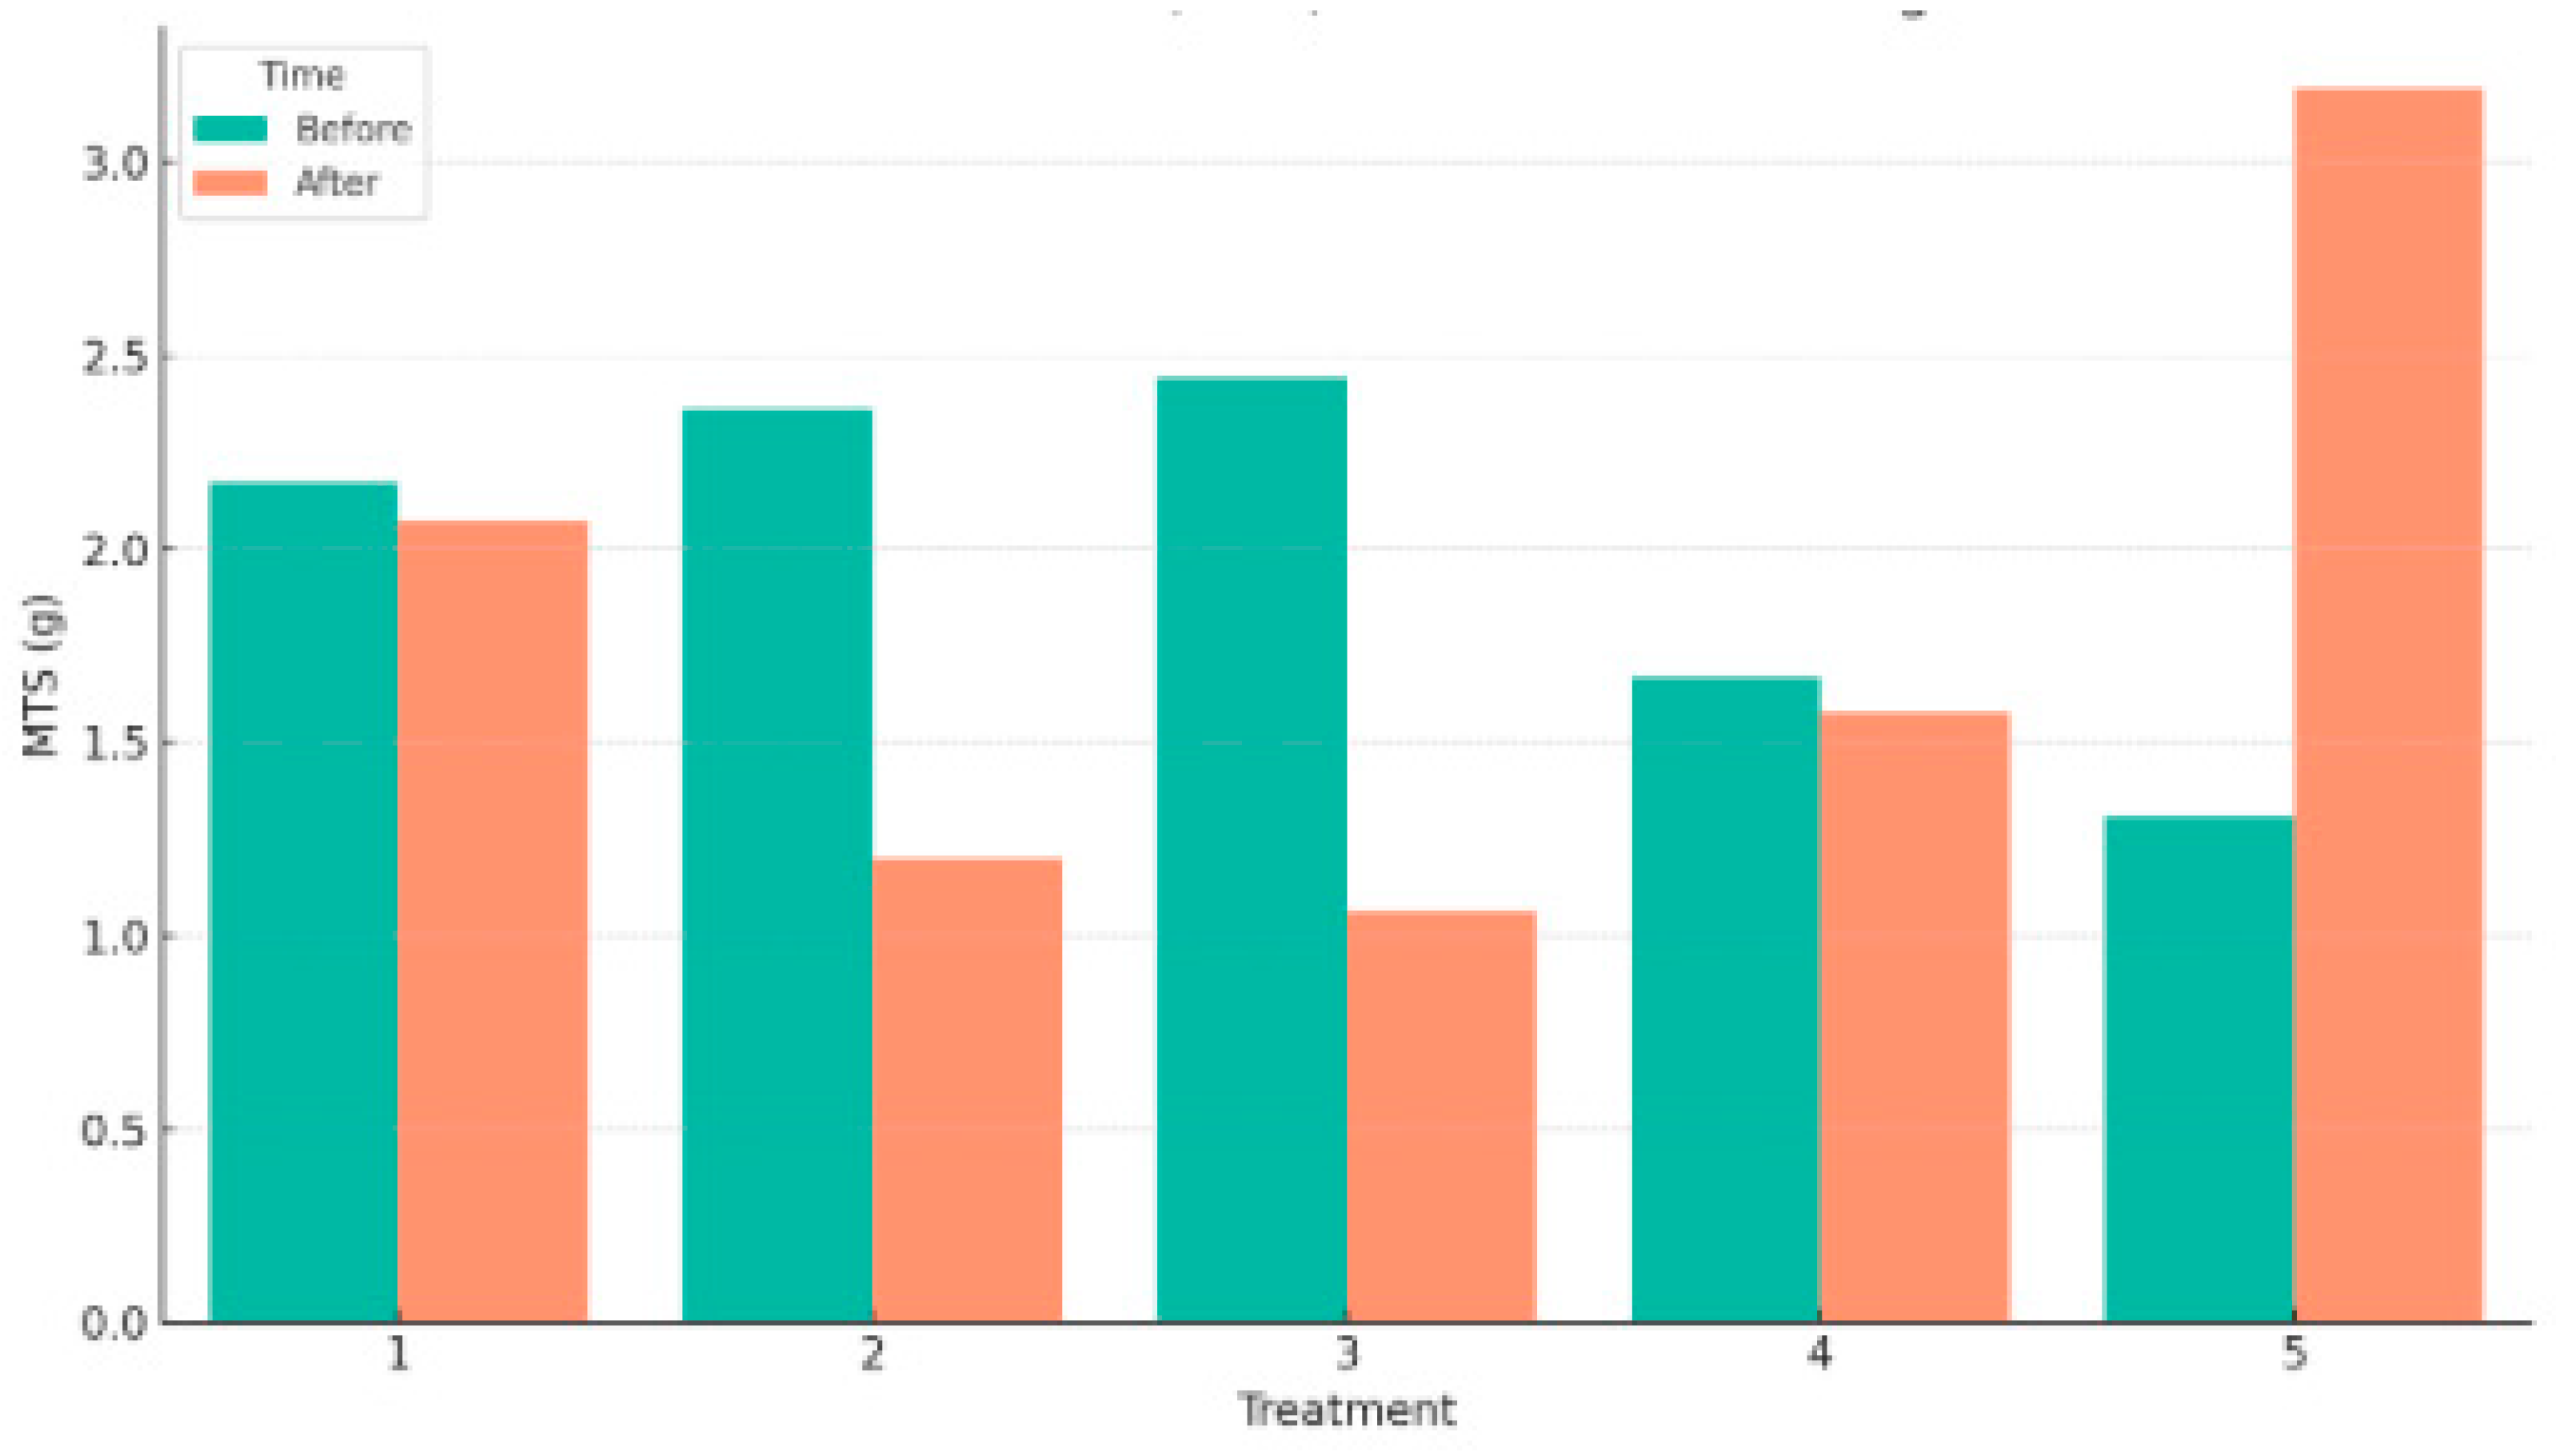
Figure 5.
Mass of Total suspended Solids(MTS) Before and After Digestion.
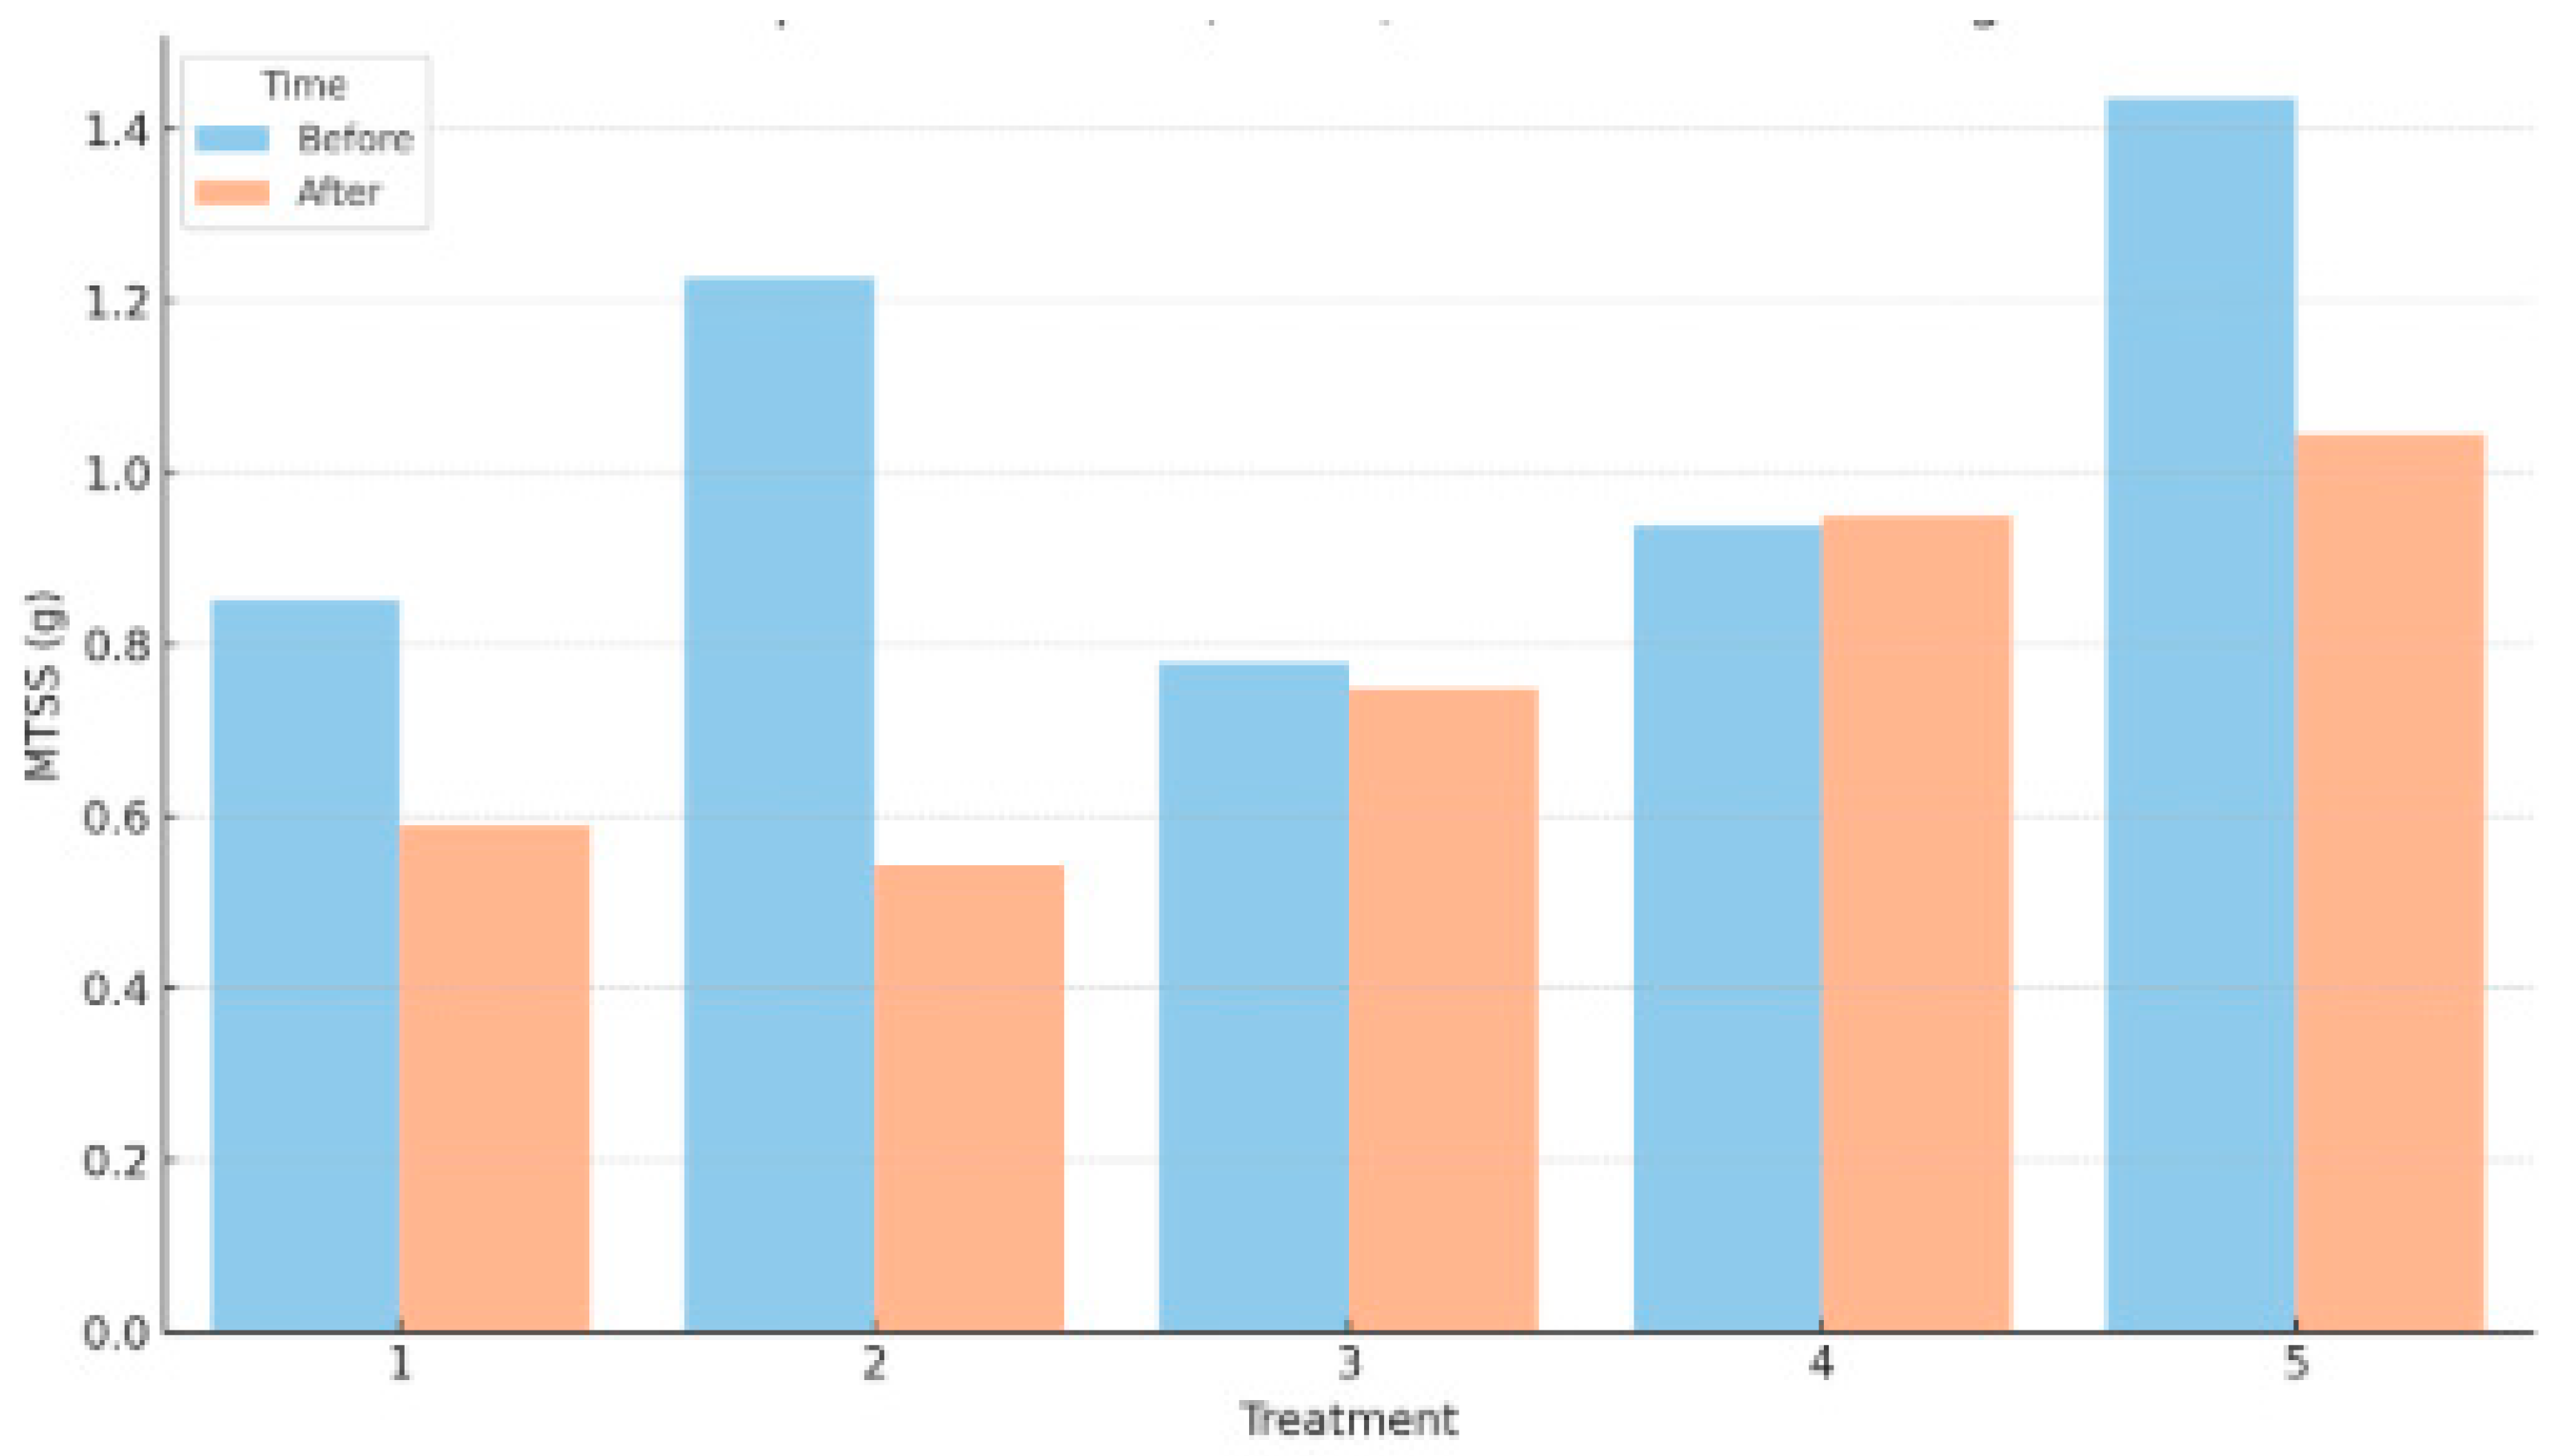
Table 1.
Composition of Treatments by Waste Type (% by volume).
| Treatment | Organic Waste | Cow Dung | Human Excreta |
| 1 | 0 | 30 | 7.5 |
| 2 | 6 | 24 | 7.5 |
| 3 | 12 | 18 | 7.5 |
| 4 | 18 | 12 | 7.5 |
| 5 | 24 | 6 | 7.5 |
Table 3.
Estimated Methane Yield (After Digestion). Estimated CH₄ (L) = MTSS × 0.45 (assuming MTSS ≈ Volatile Solids and 0.45 L CH₄ per gram VS).
Table 3.
Estimated Methane Yield (After Digestion). Estimated CH₄ (L) = MTSS × 0.45 (assuming MTSS ≈ Volatile Solids and 0.45 L CH₄ per gram VS).
| Treatment | MTSS (g) | Estimated CH₄ (L) |
| 1 | 0.589 | 0.265 |
| 2 | 0.543 | 0.244 |
| 3 | 0.749 | 0.337 |
| 4 | 0.948 | 0.427 |
| 5 | 1.045 | 0.470 |
Disclaimer/Publisher’s Note: The statements, opinions and data contained in all publications are solely those of the individual author(s) and contributor(s) and not of MDPI and/or the editor(s). MDPI and/or the editor(s) disclaim responsibility for any injury to people or property resulting from any ideas, methods, instructions or products referred to in the content. |
© 2025 by the authors. Licensee MDPI, Basel, Switzerland. This article is an open access article distributed under the terms and conditions of the Creative Commons Attribution (CC BY) license (http://creativecommons.org/licenses/by/4.0/).
Copyright: This open access article is published under a Creative Commons CC BY 4.0 license, which permit the free download, distribution, and reuse, provided that the author and preprint are cited in any reuse.


