
Submitted:
25 September 2025
Posted:
26 September 2025
You are already at the latest version
Abstract
The tannery industry faces a serious challenge in managing solid waste sustainably. The most hazardous form of solid waste is chromium-tanned solid waste, mainly consisting of leather shavings with high chromium content. This study utilized laboratory-scale reactors to develop a suitable technology for producing biogas from leather shavings while ensuring safe disposal. Tannery waste, specifically leather shavings, has a low carbon-to-nitrogen ratio (C/N) of 3.01 and an acidic pH of 4.51 ± 0.42, challenging for anaerobic digestion. The research focused on the anaerobic co-digestion (i.e. AcoD) of leather shavings (LS) with cow dung (CD), sawdust (SD), and food waste (FW), optimizing the process across a range of C/N ratios and pH levels to maximize biogas yield. The results indicated that a reactor with a 1:1:1 ratio of LS:CD:FW achieved the best performance in terms of cumulative biogas production (5895.2 ml/kg solid feed), methane content (53.63%), total organic carbon (TOC) reduction (47.55%), volatile solids (VS) reduction (51.99%), and chemical oxygen demand (COD) removal efficiency (53.8%) when operated with a residence time of 40 days. This AcoD process not only produce biogas but also offers an alternative for reducing landfill use and minimizing the environmental risks associated with tannery waste disposal.
Keywords:
anaerobic co-digestion
; biogas
; chromium-tanned solid waste
; leather shavings
; sawdust
Introduction
The tannery industry is a major contributor to Bangladesh’s economic activity. It consistently produces substantial export earnings, making it one of the nation’s top ten sources of foreign currency (Shahriar et al. 2021). Despite the tannery industry’s significant contribution to export earnings and foreign exchange, it faces major environmental challenges, specifically in managing solid waste from processing and sludge from effluent treatment plants. The Savar Tannery Industrial Estate struggles to manage the large amounts of solid waste generated during Eid-ul-Azha festival, primarily due to inadequate and ineffective waste management systems (Verma and Sharma 2023). Consequently, harmful chemicals are discharged into the Dhaleshwari River, causing severe environmental damage. For many years, the tannery industry has had a detrimental impact on the Buriganga River, and it is now causing similar harm to the Dhaleshwari River (Ishraq et al. 2023). Its failure to comply with regulations, including the safe disposal of toxic waste, continues to limit its export potential. The industry now faces certification issues, preventing many companies from securing good prices for their products (The Daily Star 2024). The Leather Working Group (LWG), a membership organization comprising stakeholders throughout the leather supply chain, grants this certification based on leather manufacturers’ adherence to environmental compliance and performance standards. Due to non-compliance, the leather sector in Bangladesh cannot fully exploit its potential or expand in the international market, despite having ample local raw materials. As a result, Shipments from Bangladesh to the international market fell by 1.74% to $1.22 billion in the 2022-23 fiscal year, marking a downturn in its international trade (Export Promotion Bureau (EPB) 2023).
A total of 220 tanneries of different sizes currently exist, but only 113 tanneries are truly operational, producing 232 tons of solid waste daily (Ahmed et al. 2016; Saha et al. 2021). Rawhide serves as the primary material for the tannery industry (Shaibur 2023). For every ton of raw hide processed, approximately 250 kg of finished leather is produced, accompanied by a considerable amount of waste, including 15 to 50 tons of liquid effluent and 450 to 730 kg of solid waste (Simioni et al. 2020). The tannery industry uses approximately 4,000 to 6,000 tons of basic chromium (Cr) annually, discharging about 20 to 40 percent of it as waste (Shaibur 2023; Sharaf et al. 2013). Solid waste from the tannery industry is composed of 57-60% leather fleshing, 35-40% leather shavings, 5-7% skin trimmings, and 2-5% hair (Ijaz et al. 2020; Zupančič et al. 2010). Solid waste that has been chromium-tanned, which is primarily made up of leather shavings (LS) with a Cr content of 2.5–5%, is the most hazardous type of waste and is mostly dumped outside of the tannery’s premises and allowed to dry (Saha et al. 2021; Sharaf et al. 2013). During the tanning process, LS are scraped from the reverse side of the hides to adjust thickness (Shaibur 2023). When LS are disposed of through landfill or incinerator practices, trivalent chromium (Cr3+) may oxidize into hexavalent chromium (Cr6+), which is carcinogenic (Bakshi and Panigrahi 2022; Makkar et al. 1988; Sundar et al. 2011). Cr6+ is more poisonous and more mobile than Cr3+ which consequently contaminates groundwaters and degrades the quality of soil (Bakshi and Panigrahi 2022; Makkar et al. 1988; Sharaf et al. 2013). Unfortunately, the disposal of tannery waste products in Bangladesh is poorly managed. Tannery waste, both liquid and solid, is dumped illegally at night into wetlands and rivers, severely harming aquatic life (Shaibur 2023). A field visit to the Savar Tannery Industrial Estate showed a temporary dumping site overflowing with solid waste in the open air. The strong smell emanating from the site raised concerns about potential environmental and health risks. A new, sustainable solid waste management system is urgently needed. This system should be both affordable and environmentally friendly, utilizing appropriate technologies. With the rapid depletion of conventional energy sources, there is a growing need to tap into alternative sources. Waste itself can become a useful resource for generating offering a renewable energy.
The primary objective of this research is to manage chromium-tanned solid waste, especially LS. The controlled decomposition of LS employing microorganisms focusing on biogas production through anaerobic digestion is therefore a more environmentally friendly disposal method than landfilling. Anaerobic digestion is a complex biochemical process that takes place in four stages: hydrolysis, acidogenesis, acetogenesis, and methanogenesis, each of which is closely related to the other stages (Abbas et al. 2021; Yun et al. 2023). Each stage is facilitated by different microorganisms, including hydrolytic bacteria, acidogens, acetogens, and methanogens. These microorganisms work together to break down complex organic materials, ultimately producing biogas (Abbas et al. 2021). Anaerobic digestion not only offers biogas production but also tackles environmental pollution by converting waste into a valuable bio-slurry. This nutrient-rich byproduct can be utilized as a fertilizer, promoting sustainable waste management practices (Berhe and Leta 2018; Oladejo et al. 2020). Biogas comprises 55–70% methane (CH4), 30–45% carbon dioxide (CO2), and traces of other gases (Agustini et al. 2018a, 2020). It is good to use LS in the generation of biogas because of its high organic content (about 61%) (Ijaz et al. 2020). Notable results were achieved by co-digesting tannery solid waste (shavings and sludge) with tannery raw wastewater (Agustini et al. 2020), LS and sludge from tannery wastewater treatment plants (Agustini et al. 2018c; Priebe et al. 2016; Simioni et al. 2020), LS with organic substrates (soybean meal, hydrolyzed collagen, hide powder) (Priebe et al. 2016), shavings and fats (Ijaz et al. 2020), LS and sludge with the addition of cattle hair waste, microalgae biomass, or commercial silicone (Agustini et al. 2018d). However, leather shaving’s low carbon-nitrogen ratio (C/N) frequently leads to ammonia formation, which significantly slows the anaerobic digestion process. Ideal C/N ratios for anaerobic digestion lie between 20 and 30 (Hakimi et al. 2023; Wang et al. 2012). Previous co-digestion studies involving LS and wastewater treatment sludge (Agustini et al. 2018a; Agustini et al. 2020; Priebe et al. 2016) identified that the C/N ratios of shavings (2.8) and sludge (1.8) fell outside the optimal range for anaerobic digestion. As a consequence, the digester might experience an accumulation of ammonia nitrogen and volatile fatty acids (VFAs) (Simioni et al. 2020). To achieve the appropriate C/N ratio for anaerobic digestion, this problem could be resolved by mixing the chromium-tanned solid waste with other kinds of organic substrates, like cow dung (CD), sawdust (SD), and food waste (FW). This mixing of several organic materials (more than one) in anaerobic digestion is called the anaerobic co-digestion (AcoD). The better nutritional distribution, proper C/N ratio, promotion of microbial activity, reduced levels of toxic compounds (including heavy metals), safe and superior digestate for agricultural use, and potential for increased methane (CH₄) production make it an appealing method (Agustini et al. 2018a; Agustini et al. 2020; Chuenchart et al. 2024; Wang et al. 2014). According to Zhang et al. (2022), CH4 production can be enhanced by 5.2%–99.4% when cattle manure, corn stover, or food waste are co-digested, as opposed to mono-digestion. Moreover, AcoD helps mitigate the carbon and nitrogen imbalance typically associated with anaerobic digestion (Liu et al. 2023).
The present study evaluates biogas production through AcoD of LS, SD, FW, and CD, focusing on energy efficiency (biogas yield) and waste treatment efficiency (reduction of organic matter). CD and FW are well-established organic feedstocks for biogas production (Oladejo et al. 2020). CD can increase CH₄ production in anaerobic digestion by facilitating the direct exchange of electrons between acetogens and methanogens (Li et al. 2021; Wang et al. 2019). In this study, the materials were selected with consideration of the local context in Bangladesh. The livestock population in the country is steadily increasing, leading to a rise in manure production (Chowdhury et al. 2020). Farm owners struggle with the management of the substantial amounts of waste generated each day (Saha et al. 2024).In Bangladesh, CD is already widely used as a feedstock for biogas production (Shaibur et al. 2021). Due to technological limitations in Bangladesh, household-level biogas plants typically rely primarily on CD (Bedana et al. 2022).FW also constitutes a major portion (68.3% to 81.1%) of municipal solid waste in Bangladesh, contributing significantly to environmental pollution (Hossain et al. 2021). Among various waste-to-energy technologies, anaerobic digestion has proven highly effective and is one of the oldest technologies for treating FW globally (Grando et al. 2017; Hossain et al. 2021). Co-digestion enables the full capture and efficient use of CH₄ gas generated from FW (Nghiem et al. 2017). However, lignocellulosic materials like SD, a by-product of wood processing, are gaining increasing interest due to their high availability and their high C/N ratio, which can be strategically utilized to adjust the overall C/N ratio for optimal anaerobic digestion (Hakimi et al. 2023). On the other hand, the Central Effluent Treatment Plant (CETP) at Savar Tannery Estate has faced operational challenges since its inauguration in 2021 (The Financial Express 2023). AcoD of LS with sludge from effluent treatment plants can effectively produce optimal biogas yields (Agustini et al. 2018b; Agustini et al. 2018c). Unfortunately, due to technical problems of CETP, the sludge is not reliably available. Additionally, it is important to recognize households will prioritize a consistent and affordable supply of raw materials when considering the adoption of a biogas plant (Bedana et al. 2022). Given this context, this study prioritized the selection of materials like CD, FW, and SD which are abundant and easily accessible in Bangladesh. Therefore, these substrates were chosen not only for their potential in biogas production but also for their alignment with local resource availability and waste management challenges. To the best of the authors’ knowledge, no studies have explored the co-digestion of LS with CD, FW, and SD. This research introduces a novel co-digestion approach incorporating CD, FW, and SD alongside LS for the first time.
Materials and Methods
Sample Collection
Leather shavings (LS) were collected from Fancy Leather Enterprise, Savar Tannery Estate, Hemayetpur, Savar, Dhaka (23°46ʹ44.05ʹʹN, 90°14ʹ39.34ʹʹE), where basic chromium sulfate is used as a tanning agent. SD was collected from Ghosh Para saw meal, Santosh, Tangail. The fresh CD was collected from the Bangladesh Agricultural Development Corporation (BADC) farm of Tangail Sadar Upazila. FW (i.e. Peels of vegetables, waste of raw meat, stale food) was collected from the cafeteria of Mawlana Bhashani Science and Technology University at five-hour intervals. The collected waste was then pooled and transported to the laboratory for further processing. A wet grinder (10 L) was used for mechanical homogenization to achieve a uniform mixture with particles smaller than 3 mm. Chromium-tanned LS underwent pre-treatment via autoclaving at 121°C and 1 atm pressure for 5 minutes to improve biodegradability (Agustini et al., 2018a). Samples were stored at ambient temperature before use. All experiments were conducted in the laboratories of MBSTU, Tangail, and the Institute of Mining, Mineralogy, and Metallurgy, BCSIR, Joypurhat, Bangladesh.
Preparation of Slurry
Co-digestion tests were conducted with various substrate mixtures of LS, CD, FW, and SD, as shown in Table 1. Raw materials were mixed with water in a 1:1 ratio to prepare the slurry. Due to LS’s hygroscopic nature, the slurry was further diluted with tap water at a 1:4 ratio. Each reactor was supplied with 500 g of raw material, except R2, which received 450 g, and 1 liter of the final slurry. CD served as an inoculum in R1, R3, and R4 because of its high moisture content and microbial load, eliminating the need for additional inoculum (Agustini et al. 2020). In R2, where CD was absent, digestate from an operational biogas plant at MBSTU (previously fed with CD and FW) was used as inoculum. This highly active digestate was directly added to the reactors without acclimation.
Twelve laboratory-scale reactors were prepared with various proportions of LS, CD, FW, and SD mixtures (Table 1) for anaerobic co-digestion (AcoD) in batch mode over 40 days. Each reactor, a 2-liter aspirator glass bottle, was connected to a gas collector and water collector using a plastic pipe and rubber cork (Figure 1). This setup, based on previous studies (Lawal-Akinlami et al. 2017; Shanmugam 2021), allowed biogas production and collection. The principle of water displacement was used to measure the amount of biogas produced each day, where the displaced water volume equaled the generated gas, recorded daily at 4 p.m. using a measuring cylinder. The hydraulic retention time (HRT) was 40 days, with digestion conducted under anaerobic conditions at 28 ± 3°C. pH was measured only at the start and end of digestion, as continuous monitoring was not feasible.
Analytical Methods
Sample parameters such as pH, electrical conductivity (EC), total organic carbon (TOC), moisture content, C/N ratio, total solids (TS), volatile solids (VS), ash content, and Cr concentration were analyzed to assess substrate suitability for anaerobic digestion. Process efficiency was evaluated using key response variables (Agustini et al. 2018a 2018b): biogas production, CH₄ yield, VSS variation, dissolved BOD (Biological oxygen demand), TOC (Total organic carbon) variation, and pH. Chemical Oxygen Demand (COD) destruction assessed the breakdown of organic matter (Held et al. 2002), while VS destruction measured the efficiency of organic material reduction. Gas composition, particularly CH₄ content, provided insights into the bioconversion process efficiency (Berhe and Leta 2018).
The pH value was determined using a digital pH meter (DM-22). Drying samples at 70oC for three days allowed for the gravimetric analysis of moisture contents. According to the APHA 2540 G method, TS and VS were determined (APHA 2000). Volatile fatty acid (VFA) concentrations were measured using a gas chromatograph (Clarus 580GC, PerkinElmer, USA) equipped with a flame ionization detector. Ash content was measured by using the method of Helrich (1990). The EC was determined using a digital EC meter (HANNA H198304). The values of total organic carbon were obtained by using the Walkley and Black wet oxidation method. The Kjeldahl method was used to determine total Kjeldahl nitrogen (TKN) (Kjeldahl 1883). By multiplying the nitrogen content by 6.25, the protein content was calculated. The C/N ratio was obtained by dividing TOC (%) by TKN (%). Cr concentration of LS was measured by Atomic Absorption Spectrophotometer (Agilent, 200 series AA) after digestion of samples with perchloric-nitric acid following the procedure recommended by Helrich (1990). VSS were determined gravimetrically using an analytical balance (Edutec EEQ9003F-B), and a muffle furnace (GWL-XA). BOD5 was determined using a manometric method with the VELP Scientifica BOD Sensor System 6. Biogas composition was analyzed using gas-liquid chromatography (HP5890) with a molecular sieve column measuring 30 x 0.320m (Agilent catalog number 19091P). The carrier gas flow rate was set at 6 ml/min, and the temperatures for the column, detector, and injector were 60°C, 200°C, and 200°C, respectively. A TCD detector was used to identify the biogas components.
Statistical Analysis
Statistical analysis was performed using Microsoft Excel 2013 software. Data are presented as mean ± standard deviation. One-way ANOVA with a post-hoc Tukey’s test was employed to assess the significance of differences between means. A p-value of less than 0.05 was considered statistically significant.
Result and Discussion
Characteristics of Raw Material
Table 2 summarizes the physicochemical properties of the substrates (LS, FW, CD, and SD) and the inoculum. LS from the tannery showed high VS content (92.5%), indicating a high organic load due to its origin from cow skin, making it suitable for AcoD. CD, FW, and SD also exhibited high VS values (>80%) and TOC (>45%) as organic materials (Agustini et al. 2018b). LS and other wastes, except CD, had low moisture content. LS had acidic pH and high Cr concentrations due to the Cr-tanning process (Agustini et al. 2018b; Piccin et al. 2016). Its pH was adjusted to 7.7 using a 6% NaOH solution. LS showed higher TKN (12.7 ppm) and protein content (70.37%), supporting biogas production (Ijaj et al. 2020; Priebe et al. 2016). However, the C/N ratio of LS (3.01) was much lower than the optimal range (20–30) for anaerobic digestion (Simioni et al. 2020). The C/N ratios of SD and CD were within the desirable range. Blending LS with CD, FW, and SD improved the C/N ratio, enhancing slurry effectiveness for anaerobic digestion (Hakimi et al. 2023).
Table 3 highlights the benefits of pre-digestion substrate mixing for anaerobic digestion. The pH of mixed substrates (6.8 ± 0.22 to 7.61 ± 1.15) remained within the optimal range (6.8–7.5) for anaerobic digestion (Jia et al. 2020; Khalid et al. 2021). Mixing significantly improved the C/N ratio, a key factor for efficient digestion, ranging from 16.1 (LS + FW) to 25.64 (LS + CD + SD), with the latter being optimal for preventing ammonia inhibition and enhancing CH₄ production (Oladejo et al. 2020). TS and VS contents across mixtures indicate consistent organic matter for biodegradation, while high moisture content (77.4%–79.99%) supports microbial activity.
The daily biogas production curve (Figure 2) illustrates the performance of reactors (R1, R2, R3, and R4) over 40 days. Initially, biogas production was low, gradually increasing by day 5. Two distinct peaks were observed. The first peak, occurring between days 13 and 15, is attributed to the degradation of simpler organic compounds such as carbohydrates. During this period, reactor R4 produced the highest daily biogas volume (335.6 ml on day 13), closely followed by R1 (309.2 ml on day 14). The second peak, between days 23-30, occurred due to the breakdown of more complex organic materials such as cellulose and proteins, with R4 again leading (404 ml on day 23), followed by R1 (382 ml on day 25). Biogas production gradually declined after day 30, indicating the digestion process was nearing completion by day 40.
Figure 3 shows cumulative biogas production over 40 days, with reactor R4 achieving the highest yield (5895.2 ±24.1 ml/kg), followed by R1 (5361.1 ±12.1 ml/kg), R2 (4638.22 ±28.6 ml/kg), and R3 (3910.31 ±18 ml/kg). All reactors experienced a lag phase during the initial 5–6 days due to microbial limitations, followed by rapid cumulative growth until day 25. Reactors with diverse feedstocks, such as R4 and R1, demonstrated superior biogas yields, highlighting the importance of balanced feedstock combinations in enhancing anaerobic digestion.
Table 4 shows the CH₄ and CO₂ composition in biogas from different reactors during digestion. CH₄ consistently increased, while CO₂ decreased, indicating the progression of anaerobic digestion. Reactor R1’s CH₄ rose from 41.87% to 52.63%, with CO₂ dropping from 54.2% to 38.2%. Reactor R2 showed a similar trend, with CH₄ increasing from 45.87% to 51.73%, and CO₂ decreasing from 50.1% to 37.2%. Reactor R3’s CH₄ rose from 41.23% to 51.2%, while CO₂ decreased from 52% to 37.5%. Reactor R4, co-digesting LS, CD, and FW, achieved the highest CH₄ (53.63%) and the lowest CO₂ (37.2%). The CH₄ content in R4 (53.50%) was higher than the 33% reported by Agustini et al. (2020). CD and FW’s high biodegradability and nutrient content enhanced the anaerobic digestion process, increasing CH₄ production. During the first seven days of digestion, CH₄ levels were lower than CO₂ due to the breakdown of long-chain polymers into smaller molecules, which produce CO₂. CO₂ is also generated during the conversion of acetate to CH₄. After 10 days, CH₄ content increased significantly. Only CH₄ and CO₂ were measured due to lab limitations. Higher CH₄ content was linked to reactions where CO₂ dissolves in water, forming ammonium carbonate (NH₄)₂CO₃, which reduces free CO₂ and increases CH₄.
NH3+ H2O=NH4OH…………………………………
NH4OH + CO2= (NH4)2CO3…………………………
The study’s findings on CO₂ reduction in anaerobic digestion could inform the development of electrocatalytic CO₂ conversion systems (Zhang et al. 2020). Overall, Reactor R4 exhibited the most efficient performance in both CH₄ content and daily biogas volume, making it the most effective configuration among the four. Reactor R4’s cumulative biogas production of 5895.2 ml/kg solid feed was higher than the yields reported by Priebe et al. (2016) and Agustini et al. (2018d). CD provided essential microbial inoculum, and FW offered a readily available source of organic carbon, enhancing the overall biogas yield. Reactor R3, with SD, showed the least output due to SD’s high lignocellulose content, which hinders digestion (Pečar et al. 2021). Pretreatment of SD, such as alkali treatment, could improve yields (Hendriks and Zeeman 2009) but was not considered in this study due to cost and complexity concerns in Bangladesh’s resource-limited settings.
Efficient waste treatment during anaerobic digestion is essential, as remaining substrates require proper disposal (Simioni et al. 2020). Table 5 shows changes in key parameters before and after anaerobic digestion across four reactors. VS reduction ranged between 38.6% and 51.99%, with R3 (33.3% SD) showing the lowest reduction and R4 the highest at 51.99%. These findings align with previous studies (Song et al. 2004; Thangamani et al. 2010), indicating LS with SD is less effective for biogas production than LS with FW or CD. COD removal rates reflect biodegradation efficiency. Reactor R4 had the highest COD removal (53.8%), followed by R1 (44.01%). R2 and R3 showed lower rates (39.41% and 40.96%, respectively), consistent with findings by Oladejo et al. (2020) and Xu et al. (2020). pH stability is critical for anaerobic digestion, as it influences microbial activity (Jia et al. 2020; Xu et al. 2020). The optimal range is 6.5–7.5 (Jia et al. 2020; Khalid et al. 2021). Reactors R1 and R4 showed stable pH increases (6.8 to 7.53 and 7.2, respectively), attributed to alkaline byproducts and VFA consumption. In contrast, R2 and R3 experienced pH drops (7.5 to 6.4 and 7.61 to 6.48), likely due to VFA accumulation during hydrolysis and acidogenesis. Organic matter degradation was assessed using BOD₅, TOC, and VSS (Table 6). Effective digestion was marked by significant reductions in these parameters (Agustini et al. 2018a; Dhayalan et al. 2007; Simioni et al. 2020). Reactor R4 achieved the highest reductions in BOD₅ (50.26%), TOC (47.55%), and VSS (24%), reflecting selective degradation of organic carbon. R1 showed moderate reductions (BOD₅: 38.3%, TOC: 34.69%, VSS: 17.30%). R2 and R3 exhibited lower reductions, with R3 having the lowest efficiency (BOD₅: 13.4%, TOC: 25.27%, VSS: 9.83%). TOC reductions observed in this study were slightly lower than those reported by Agustini et al. (2020) and Simioni et al. (2020) (66% and 64%, respectively). These studies utilized nutrient-enriched solutions, enhancing microbial activity. However, LS, despite containing complex compounds like Cr, did not inhibit digestion, as co-substrates balanced the C/N ratio and supported microbial activity. VFA concentrations initially ranged from 2750–3000 mg/L, declining to 1600 mg/L (R4) and 2200 mg/L (R3) by the end, indicating methanogenic activity (Table 6). This reduction in VFAs corresponded to increased CH₄ production, consistent with typical anaerobic digestion processes.
Potential Utilization of Digestate
The presence of LS in digestate can pose significant environmental and health risks when used as a fertilizer or soil amendment due to the potential presence of Cr. Cr contamination in the soil can lead to plant uptake, soil acidification, and microbial inhibition (Shahid et al., 2017). In this study, Cr concentrations were significantly higher in the digestate from the R1 reactor (137.25 ± 2.23 mg/kg) compared to other reactors. The lowest concentration was found in the digestate from the R3 reactor (79.88 ± 2.43 mg/kg). Given that the regulatory limit for Cr in soil is 100 ppm (Ahemad, 2015; Salt et al., 1995), the Cr content in the digestates from the R1 and R2 reactors (129.25 ± 1.02 mg/kg) exceeds safe levels. In contrast, the digestates from the R3 reactor (79.88 ± 2.43 mg/kg) and the R1 reactor (88.13 ± 1.45 mg/kg) remained below this regulatory limit, suggesting a safer profile for potential agricultural use. However, the presence of Cr levels above the regulatory limit in the R1 and R2 digestates raises environmental concerns, as these residues may not be suitable for agricultural applications without further treatment to lower Cr concentrations. The digestate stability and the total nutrient content of digestates should also be investigated to evaluate the possibility of digestate utilization. Exploring the economic feasibility and nutrient enhancement of the digestates is essential. Zhang et al. (2018) identified that the use of low-cost accelerants, such as urea and plant ash, enhanced the degradation of organic matter during anaerobic digestion, leading to increased availability of essential nutrients like nitrogen, phosphorus, and potassium. The resulting digestates had enhanced nutrient contents (4.95-5.66%) comparable to commercial bio-organic fertilizers, thereby affirming their potential for agricultural applications. Moreover, Xu et al. (2020) highlighted the role of vermiculite as an additive in improving both the performance of AcoD and the phosphorus content of the digestates. The thermal and fertility analyses conducted in their study revealed that digestates containing vermiculite showed superior stability and excellent total phosphorus content (11.44–13.29 g/kg), positioning them as viable options for fertilization. These findings suggest that similar strategies could be explored to enhance the safety and effectiveness of digestates from the co-digestion of LS, thereby improving their viability for agricultural applications
Conclusion
This study utilized laboratory reactors to develop a method for recovering biogas from LS and then safely disposing of the resulting residue. LS, with their high protein and VS content, and CD, with its favorable C/N ratio and microbial inoculum were identified as particularly effective components. The initial C/N ratio of LS (3.01) was significantly lower than the optimal range for anaerobic digestion (20-30). However, blending LS with other substrates effectively increased the C/N ratio, enhancing the anaerobic digestion process. This study investigated the effectiveness of co-digesting tannery waste anaerobically by analyzing VS destruction, TOC reduction, biogas production, and CH₄ content. This study found that the highest biogas production (5895.2 ml per kg of solid feed), with a CH₄ concentration of 53.63%, was achieved using the feed composition of LS: CD: FW in a 1:1:1 ratio (Reactor R4) over a residence period of 40 days. The significant reductions in VS (51.99%) and TOC (47.55%) highlight the system’s efficiency in organic matter degradation and waste treatment. Reactor R3 showed the lowest cumulative biogas output (3910.31 ml/kg solid feed) due to the high lignocellulose content in SD, which hinders the biogas production process. Pretreatment methods, such as alkali treatment, are recommended to improve the biogas yield from SD. This study not only offers a suitable alternative for managing tannery solid waste but also reduces the environmental risks posed by conventional disposal methods, such as landfilling and water contamination. To maximize biogas production from LS, future studies should explore improvements in reactor design, substrate mixing ratios, organic loading rates, the addition of inoculum like wastewater sludge, and the potential benefits of pre-treating the LS. The findings of this study underscore the practical applications of co-anaerobic digestion for tannery waste management in industrial settings, providing a dual benefit of renewable energy (i.e. biogas) production and waste minimization.
Funding
This work was supported by Ministry of Science and Technology, Bangladesh, through project ID#SRG-22351.
Data Availability Statement
The data that support the findings of this study are available on request from the corresponding author.
Acknowledgments
The authors wish to thank Institute of Mining, Mineralogy and Metallurgy, (IMMM), BCSIR (Bangladesh Council of Scientific and Industrial Research), Joypurhat, Bangladesh for laboratory support.
Conflicts of Interest
The authors declare that there is no conflict of interest.
Notes on Contributors
Credit authorship contribution statement: Shamim Al Mamun: Supervision, Project Administration, Writing-review and editing Sowmik Das Sowmya: Conceptualization, Data curation, Methodology, Formal analysis, Writing – original draft. Ommay Hany Ria: Formal analysis, Funding acquisition, Writing review and editing. Keya Akter: Visualization, Formal analysis
References
- Abbas, Y.; Yun, S.; Wang, Z.; Zhang, Y.; Zhang, X.; Wang, K. Recent advances in bio-based carbon materials for anaerobic digestion: A review. Renewable and Sustainable Energy Reviews 2021, 135, 110378. [Google Scholar] [CrossRef]
- Agustini, C. B.; da Costa, M.; Gutterres, M. Tannery wastewater as nutrient supply in production of biogas from solid tannery wastes mixed through anaerobic co-digestion. Process Safety and Environmental Protection 2020, 135, 38–45. [Google Scholar] [CrossRef]
- Agustini, C. B.; Spier, F.; da Costa, M.; Gutterres, M. Biogas production for anaerobic co-digestion of tannery solid wastes under presence and absence of the tanning agent. Resources, Conservation and Recycling 2018a, 130, 51–59. [Google Scholar] [CrossRef]
- Agustini, C.; da Costa, M.; Gutterres, M. Biogas production from tannery solid wastes–scale-up and cost saving analysis. Journal of Cleaner Production 2018b, 187, 158–164. [Google Scholar] [CrossRef]
- Agustini, C. B.; Meyer, M.; Da Costa, M.; Gutterres, M. Biogas from anaerobic co-digestion of chrome and vegetable tannery solid waste mixture: Influence of the tanning agent and thermal pretreatment. Process Safety and Environmental Protection 2018c, 118, 24–31. [Google Scholar] [CrossRef]
- Agustini, C. B.; da Fontoura, J. T.; Mella, B.; Gutterres, M. Evaluating co-substrates to supplement biogas production from tannery solid waste treatment–cattle hair, microalgae biomass, and silicone. Biofuels, Bioproducts and Biorefining 2018d, 12(6), 1095–1102. [Google Scholar] [CrossRef]
- Ahemad, M. Enhancing phytoremediation of chromium-stressed soils through plant-growth-promoting bacteria. Journal of Genetic Engineering and Biotechnology 2015, 13(1), 51–58. [Google Scholar] [CrossRef]
- Ahmed, T.; Chowdhury, Z. U. M. Environmental burden of tanneries in Bangladesh. AIA16 Conference Proceedings, 36th Annual Conference of the International Association for Impact Assessment, Nagoya, Japan; 2016. [Google Scholar]
- Ahmed, T.; Chowdhury, Z. U. M. Environmental burden of tanneries in Bangladesh. AIA16 Conference Proceedings, 36th Annual Conference of the International Association for Impact Assessment, Nagoya, Japan; 2016; Vol. 2. [Google Scholar]
- APHA. Standard methods for the examination of water and wastewater; American Public Health Association; Washington DC, 2000. [Google Scholar]
- Bakshi, A.; Panigrahi, A. K. Chromium contamination in soil and its bioremediation: an overview. In Principles, Monitoring and Remediation; Advances in Bioremediation and Phytoremediation for Sustainable Soil Management, 2022; pp. 229–248. [Google Scholar] [CrossRef]
- Basak, S. R. Anaerobic digestion of tannery solid waste by mixing with different substrates. Bangladesh Journal of Scientific and Industrial Research 2012a, 49(2), 119–124. [Google Scholar] [CrossRef]
- Basak, S. R. Anaerobic digestion of tannery solid waste by mixing with different substrates. MS diss., Bangladesh University of Engineering and Technology, Dhaka, Bangladesh, 2012b. [Google Scholar]
- Bedana, D.; Kamruzzaman, M.; Rana, M. J.; Mustafi, B. A. A.; Talukder, R. K. Financial and functionality analysis of a biogas plant in Bangladesh. Heliyon 2022, 8(9). [Google Scholar] [CrossRef]
- Berhe, S.; Leta, S. Anaerobic co-digestion of tannery waste water and tannery solid waste using two-stage anaerobic sequencing batch reactor: focus on performances of methanogenic step. Journal of Material Cycles and Waste Management 2018, 20, 1468–1482. [Google Scholar] [CrossRef]
- Bond, T.; Templeton, M. R. History and future of domestic biogas plants in the developing world. Energy for Sustainable Development 2011, 15(4), 347–354. [Google Scholar] [CrossRef]
- Chen, B. Y.; Chen, S. W.; Wang, H. T. Use of different alkaline pretreatments and enzyme models to improve low-cost cellulosic biomass conversion. Biomass and Bioenergy 2012, 39, 182–191. [Google Scholar] [CrossRef]
- Chowdhury, T.; Chowdhury, H.; Hossain, N.; Ahmed, A.; Hossen, M. S.; Chowdhury, P.; Saidur, R. Latest advancements on livestock waste management and biogas production: Bangladesh’s perspective. Journal of Cleaner Production 2020, 272, 122818. [Google Scholar] [CrossRef]
- Chuenchart, W.; Surendra, K. C.; Khanal, S. K. Understanding Anaerobic Co-digestion of Organic Wastes through Meta-Analysis. ACS ES&T Engineering 2024, 4(5), 1177–1192. [Google Scholar] [CrossRef]
- Dhayalan, K.; Fathima, N. N.; Gnanamani, A.; Rao, J. R.; Nair, B. U.; Ramasami, T. Biodegradability of leathers through anaerobic pathway. Waste Management 2007, 27(6), 760–767. [Google Scholar] [CrossRef]
- Export Promotion Bureau (EPB). Export data. 2023. Available online: http://epb.gov.bd/site/view/epb_export_data/ (accessed on May 16, 2024).
- Grando, R. L.; De Souza Antune, A. M.; Da Fonseca, F. V.; Barrena Gómez, R.; Sanchez, A.; Font i Segura, X. Technology overview of biogas production in anaerobic digestion plants. 2017. [Google Scholar] [CrossRef]
- Hakimi, M.; Manogaran, M. D.; Shamsuddin, R.; Johari, S. A. M.; Hassan, M. A. M.; Soehartanto, T. Co-anaerobic digestion of sawdust and chicken manure with plant herbs: Biogas generation and kinetic study. Heliyon 2023, 9(6). [Google Scholar] [CrossRef] [PubMed]
- Han, F.; Yun, S.; Zhang, C.; Xu, H.; Wang, Z. Steel slag as accelerant in anaerobic digestion for nonhazardous treatment and digestate fertilizer utilization. Bioresource Technology 2019, 282, 331–338. [Google Scholar] [CrossRef]
- Held, C.; Wellacher, M.; Robra, K. H.; Gübitz, G. M. Two-stage anaerobic fermentation of organic waste in CSTR and UFAF-reactors. Bioresource Technology 2002, 81(1), 19–24. [Google Scholar] [CrossRef] [PubMed]
- Helrich, K. Official methods of analysis of the Association of Official Analytical Chemists; Association of official analytical chemists, 1990. [Google Scholar]
- Hendriks, A. T. W. M.; Zeeman, G. Pretreatments to enhance the digestibility of lignocellulosic biomass. Bioresource Technology 2009, 100(1), 10–18. [Google Scholar] [CrossRef]
- Hossain, M. S.; Das, B. K.; Das, A.; Roy, T. K. Investigating the techno-economic and environmental feasibility of biogas-based power generation potential using food waste in Bangladesh. Renewable Energy 2024, 232, 121017. [Google Scholar] [CrossRef]
- Huang, X.; Yun, S.; Zhu, J.; Du, T.; Zhang, C.; Li, X. Mesophilic anaerobic co-digestion of aloe peel waste with dairy manure in the batch digester: Focusing on mixing ratios and digestate stability. Bioresource Technology 2016, 218, 62–68. [Google Scholar] [CrossRef]
- Ijaz, M.; Tabinda, A. B.; Ahmad, S. R.; Khan, W. U.; Yasin, N. A. Biogas synthesis from leather industry solid waste in Pakistan. Polish Journal of Environmental Studies 2020, 29(5), 3621–3628. [Google Scholar] [CrossRef]
- Ishraq, R.; Nehal, K. A.; Urbi, F. B. S.; Almas, M. M. U. Current Scenario of Buriganga And Dhaleswari Rivers After The Shiftment of the Tannery Industry: A WQI Study. PhD diss., Department of Civil and Environmental Engineering (CEE), Islamic University of Technology (IUT), Board Bazar, Gazipur-1704, Bangladesh, 2023. [Google Scholar]
- Islam, M. S.; Al-Amin, A. Q.; Sarkar, M. S. K. Energy crisis in Bangladesh: Challenges, progress, and prospects for alternative energy resources. Utilities Policy 2021, 71, 101221. [Google Scholar] [CrossRef]
- Jia, B.; Yun, S.; Shi, J.; Han, F.; Wang, Z.; Chen, J.; Xing, T. Enhanced anaerobic mono-and co-digestion under mesophilic condition: Focusing on the magnetic field and Ti-sphere core–shell structured additives. Bioresource Technology 2020, 310, 123450. [Google Scholar] [CrossRef]
- Kafle, G. K.; Kim, S. H. Effects of chemical compositions and ensiling on the biogas productivity and degradation rates of agricultural and food processing by-products. Bioresource Technology 2013, 142, 553–561. [Google Scholar] [CrossRef] [PubMed]
- Kampmann, K.; Ratering, S.; Baumann, R.; Schmidt, M.; Zerr, W.; Schnell, S. Hydrogenotrophic methanogens dominate in biogas reactors fed with defined substrates. Systematic and Applied Microbiology 2012, 35(6), 404–413. [Google Scholar] [CrossRef] [PubMed]
- Khairuddin, N.; Abd Manaf, L.; Halimoon, N.; Ghani, W. A. W. A. K.; Hassan, M. A. High solid anaerobic co-digestion of household organic waste with cow manure. Procedia Environmental Sciences 2015, 30, 174–179. [Google Scholar] [CrossRef]
- Khalid, A.; Arshad, M.; Anjum, M.; Mahmood, T.; Dawson, L. The anaerobic digestion of solid organic waste. Waste Management 2011, 31(8), 1737–1744. [Google Scholar] [CrossRef] [PubMed]
- Kjeldahl, J. G. C. T. Neue methode zur bestimmung des stickstoffs in organischen körpern. Zeitschrift für analytische Chemie 1883, 22(1), 366–382. [Google Scholar] [CrossRef]
- Kwietniewska, E.; Tys, J. Process characteristics, inhibition factors and methane yields of anaerobic digestion process, with particular focus on microalgal biomass fermentation. Renewable and Sustainable Energy Reviews 2014, 34, 491–500. [Google Scholar] [CrossRef]
- Lawal-Akinlami, H. A.; Shanmugam, P. Comparison of biochemical methane potential and methanogen morphology of different organic solid wastes co-digested anaerobically with treatment plant sludge. Process Safety and Environmental Protection 2017, 107, 216–226. [Google Scholar] [CrossRef]
- Li, B.; Yun, S.; Xing, T.; Wang, K.; Ke, T.; An, J. A strategy for understanding the enhanced anaerobic co-digestion via dual-heteroatom doped bio-based carbon and its functional groups. Chemical Engineering Journal 2021, 425, 130473. [Google Scholar] [CrossRef]
- Liu, L.; Yun, S.; Wang, K.; Ke, T.; Liu, J.; Gao, Y.; Zhang, X. Enhanced anaerobic co-digestion under a magnetic field by a synergistic host–guest strategy: focusing on accelerant, biogas yield, fertilization and coupled effect. Chemical Engineering Journal 2023, 476, 146508. [Google Scholar] [CrossRef]
- Makkar, H. P.; Singh, B.; Dawra, R. K. Effect of tannin-rich leaves of oak (Quercus incana) on various microbial enzyme activities of the bovine rumen. British Journal of Nutrition 1988, 60(2), 287–296. [Google Scholar] [CrossRef]
- Mhlanga, P.; Marenya, M. O.; Tavengwa, N. T.; Tinarwo, D. Anaerobic co-digestion of canteen food waste and cow dung. Energy Sources, Part A: Recovery, Utilization, and Environmental Effects 2023, 45(4), 11341–11348. [Google Scholar] [CrossRef]
- Nghiem, L. D.; Koch, K.; Bolzonella, D.; Drewes, J. E. Full scale co-digestion of wastewater sludge and food waste: Bottlenecks and possibilities. Renewable and Sustainable Energy Reviews 2017, 72, 354–362. [Google Scholar] [CrossRef]
- Oladejo, O. S.; Dahunsi, S. O.; Adesulu-Dahunsi, A. T.; Ojo, S. O.; Lawal, A. I.; Idowu, E. O.; Evbuomwan, I. Energy generation from anaerobic co-digestion of food waste, cow dung and piggery dung. Bioresource Technology 2020, 313, 123694. [Google Scholar] [CrossRef]
- Pečar, D.; Smerkolj, J.; Pohleven, F.; Goršek, A. Anaerobic digestion of chicken manure with sawdust and barley straw pre-treated by fungi. Biomass Conversion and Biorefinery 2021, 11, 2089–2094. [Google Scholar] [CrossRef]
- Piccin, J. S.; Gomes, C. S.; Mella, B.; Gutterres, M. Color removal from real leather dyeing effluent using tannery waste as an adsorbent. Journal of Environmental Chemical Engineering 2016, 4(1), 1061–1067. [Google Scholar] [CrossRef]
- Priebe, G. P. S.; Kipper, E.; Gusmão, A. L.; Marcilio, N. R.; Gutterres, M. Anaerobic digestion of chrome-tanned leather waste for biogas production. Journal of Cleaner Production 2016, 129, 410–416. [Google Scholar] [CrossRef]
- Ruffino, B.; Fiore, S.; Roati, C.; Campo, G.; Novarino, D.; Zanetti, M. Scale effect of anaerobic digestion tests in fed-batch and semi-continuous mode for the technical and economic feasibility of a full scale digester. Bioresource Technology 2015, 182, 302–313. [Google Scholar] [CrossRef]
- Saha, B.; Azam, F. A. B. Probable ways of tannery’s solid and liquid waste management in Bangladesh‒An overview. Textile & Leather Review 2021, 4(2), 76–95. [Google Scholar] [CrossRef]
- Saha, C. K.; Nandi, R.; Rahman, M. A.; Alam, M. M.; Møller, H. B. Biogas technology in commercial poultry and dairy farms of Bangladesh: present scenario and future prospect. Biomass Conversion and Biorefinery 2024, 14(7), 8407–8418. [Google Scholar] [CrossRef]
- Salt, D. E.; Blaylock, M.; Kumar, N. P.; Dushenkov, V.; Ensley, B. D.; Chet, I.; Raskin, I. Phytoremediation: a novel strategy for the removal of toxic metals from the environment using plants. Nature Biotechnology 1995, 13(5), 468–474. [Google Scholar] [CrossRef] [PubMed]
- Shahid, M.; Shamshad, S.; Rafiq, M.; Khalid, S.; Bibi, I.; Niazi, N. K.; Rashid, M. I. Chromium speciation, bioavailability, uptake, toxicity and detoxification in soil-plant system: A review. Chemosphere 2017, 178, 513–533. [Google Scholar] [CrossRef]
- Shahriar, S.; Kea, S.; Abdullahi, N. M.; Rahman, R.; Islam, R. M. Determinants of Bangladesh’s leather exports to its major trade partners: a panel gravity model approach. Global Business Review 2021, 09721509211036288. [Google Scholar] [CrossRef]
- Shaibur, M. R.; Husain, H.; Arpon, S. H. Utilization of cow dung residues of biogas plant for sustainable development of a rural community. Current Research in Environmental Sustainability 2021, 3, 100026. [Google Scholar] [CrossRef]
- Shaibur, M. R. Heavy metals in chrome-tanned shaving of the tannery industry are a potential hazard to the environment of Bangladesh. Case Studies in Chemical and Environmental Engineering 2023, 7, 100281. [Google Scholar] [CrossRef]
- Shanmugam, P.; Horan, N. J. Optimising the biogas production from leather fleshing waste by co-digestion with MSW. Bioresource Technology 2009, 100(18), 4117–4120. [Google Scholar] [CrossRef]
- Shanmugam, P. Correlation between empirical formulae based stoichiometric and experimental methane potential and calorific energy values for vegetable solid wastes. Energy Reports 2021, 7, 19–31. [Google Scholar] [CrossRef]
- Sharaf, S. A.; Gasmeleed, G. A.; Musa, A. E. Extraction of chromium six from chrome shavings. JFPI 2013, 2, 21–26. [Google Scholar]
- Simioni, T.; Agustini, C. B.; Dettmer, A.; Gutterres, M. Nutrient balance for anaerobic co-digestion of tannery wastes: Energy efficiency, waste treatment and cost-saving. Bioresource Technology 2020, 308, 123255. [Google Scholar] [CrossRef] [PubMed]
- Song, Y. C.; Kwon, S. J.; Woo, J. H. Mesophilic and thermophilic temperature co-phase anaerobic digestion compared with single-stage mesophilic-and thermophilic digestion of sewage sludge. Water Research 2004, 38(7), 1653–1662. [Google Scholar] [CrossRef] [PubMed]
- Sri Bala Kameswari, K.; Kalyanaraman, C.; Umamaheswari, B.; Thanasekaran, K. Enhancement of biogas generation during co-digestion of tannery solid wastes through optimization of mix proportions of substrates. Clean Technologies and Environmental Policy 2014, 16, 1067–1080. [Google Scholar] [CrossRef]
- Sundar, V. J.; Raghavarao, J.; Muralidharan, C.; Mandal, A. B. Recovery and utilization of chromium-tanned proteinous wastes of leather making: a review. Critical Reviews in Environmental Science and Technology 2011, 41(22), 2048–2075. [Google Scholar] [CrossRef]
- Thangamani, A.; Rajakumar, S.; Ramanujam, R. A. Anaerobic co-digestion of hazardous tannery solid waste and primary sludge: biodegradation kinetics and metabolite analysis. Clean Technologies and Environmental Policy 2010, 12, 517–524. [Google Scholar] [CrossRef]
- The Daily Star. Leather sector stymied by mismanagement. Last Modified May 15, 2024. 2024. Available online: https://www.thedailystar.net/news/bangladesh/news/leather-sector-stymied-mismanagement-3610166 (accessed on May 15, 2024).
- The Financial Express. CETP woes continue unabatedly. Last Modified April 11, 2023. 2023. Available online: https://thefinancialexpress.com.bd/views/opinions/cetp-woes-continue-unabatedly (accessed on May 15, 2024).
- Verma, S. K.; Sharma, P. C. Current trends in solid tannery waste management. Critical Reviews in Biotechnology 2023, 43(5), 805–822. [Google Scholar] [CrossRef]
- Wang, X.; Yang, G.; Feng, Y.; Ren, G.; Han, X. Optimizing feeding composition and carbon–nitrogen ratios for improved methane yield during anaerobic co-digestion of dairy, chicken manure and wheat straw. Bioresource Technology 2012, 120, 78–83. [Google Scholar] [CrossRef]
- Wang, M.; Sun, X.; Li, P.; Yin, L.; Liu, D.; Zhang, Y.; Zheng, G. A novel alternate feeding mode for semi-continuous anaerobic co-digestion of food waste with chicken manure. Bioresource Technology 2014, 164, 309–314. [Google Scholar] [CrossRef]
- Wang, Z.; Yun, S.; Xu, H.; Wang, C.; Zhang, Y.; Chen, J.; Jia, B. Mesophilic anaerobic co-digestion of acorn slag waste with dairy manure in a batch digester: Focusing on mixing ratios and bio-based carbon accelerants. Bioresource Technology 2019, 286, 121394. [Google Scholar] [CrossRef] [PubMed]
- Wang, C.; Yun, S.; Xu, H.; Wang, Z.; Han, F.; Zhang, Y.; Sun, M. Dual functional application of pomelo peel-derived bio-based carbon with controllable morphologies: An efficient catalyst for triiodide reduction and accelerant for anaerobic digestion. Ceramics International 2020, 46(3), 3292–3303. [Google Scholar] [CrossRef]
- Xu, H.; Yun, S.; Wang, C.; Wang, Z.; Han, F.; Jia, B.; Li, B. Improving performance and phosphorus content of anaerobic co-digestion of dairy manure with aloe peel waste using vermiculite. Bioresource Technology 2020, 301, 122753. [Google Scholar] [CrossRef]
- Yang, Y.; Zhang, Y.; Li, Z.; Zhao, Z.; Quan, X.; Zhao, Z. Adding granular activated carbon into anaerobic sludge digestion to promote methane production and sludge decomposition. Journal of Cleaner Production 2017, 149, 1101–1108. [Google Scholar] [CrossRef]
- Yun, S.; Xing, T.; Wang, Y.; Chen, R.; Han, F.; Zhang, C.; Zou, M. Mineral residue accelerant-enhanced anaerobic digestion of cow manure: an evaluation system of comprehensive performance. Science of The Total Environment 2023, 858, 159840. [Google Scholar] [CrossRef]
- Zhang, C.; Yun, S.; Li, X.; Wang, Z.; Xu, H.; Du, T. Low-cost composited accelerants for anaerobic digestion of dairy manure: Focusing on methane yield, digestate utilization and energy evaluation. Bioresource Technology 2018, 263, 517–524. [Google Scholar] [CrossRef]
- Zhang, S.; Fan, Q.; Xia, R.; Meyer, T. J. CO2 reduction: from homogeneous to heterogeneous electrocatalysis. Accounts of Chemical Research 2020, 53(1), 255–264. [Google Scholar] [CrossRef] [PubMed]
- Zhang, W.; Kong, T.; Xing, W.; Li, R.; Yang, T.; Yao, N.; Lv, D. Links between carbon/nitrogen ratio, synergy and microbial characteristics of long-term semi-continuous anaerobic co-digestion of food waste, cattle manure and corn straw. Bioresource Technology 2022, 343, 126094. [Google Scholar] [CrossRef]
- Zupančič, G. D.; Jemec, A. Anaerobic digestion of tannery waste: semi-continuous and anaerobic sequencing batch reactor processes. Bioresource Technology 2010, 101(1), 26–33. [Google Scholar] [CrossRef]
Figure 1.
A diagram illustrating the experimental setup.
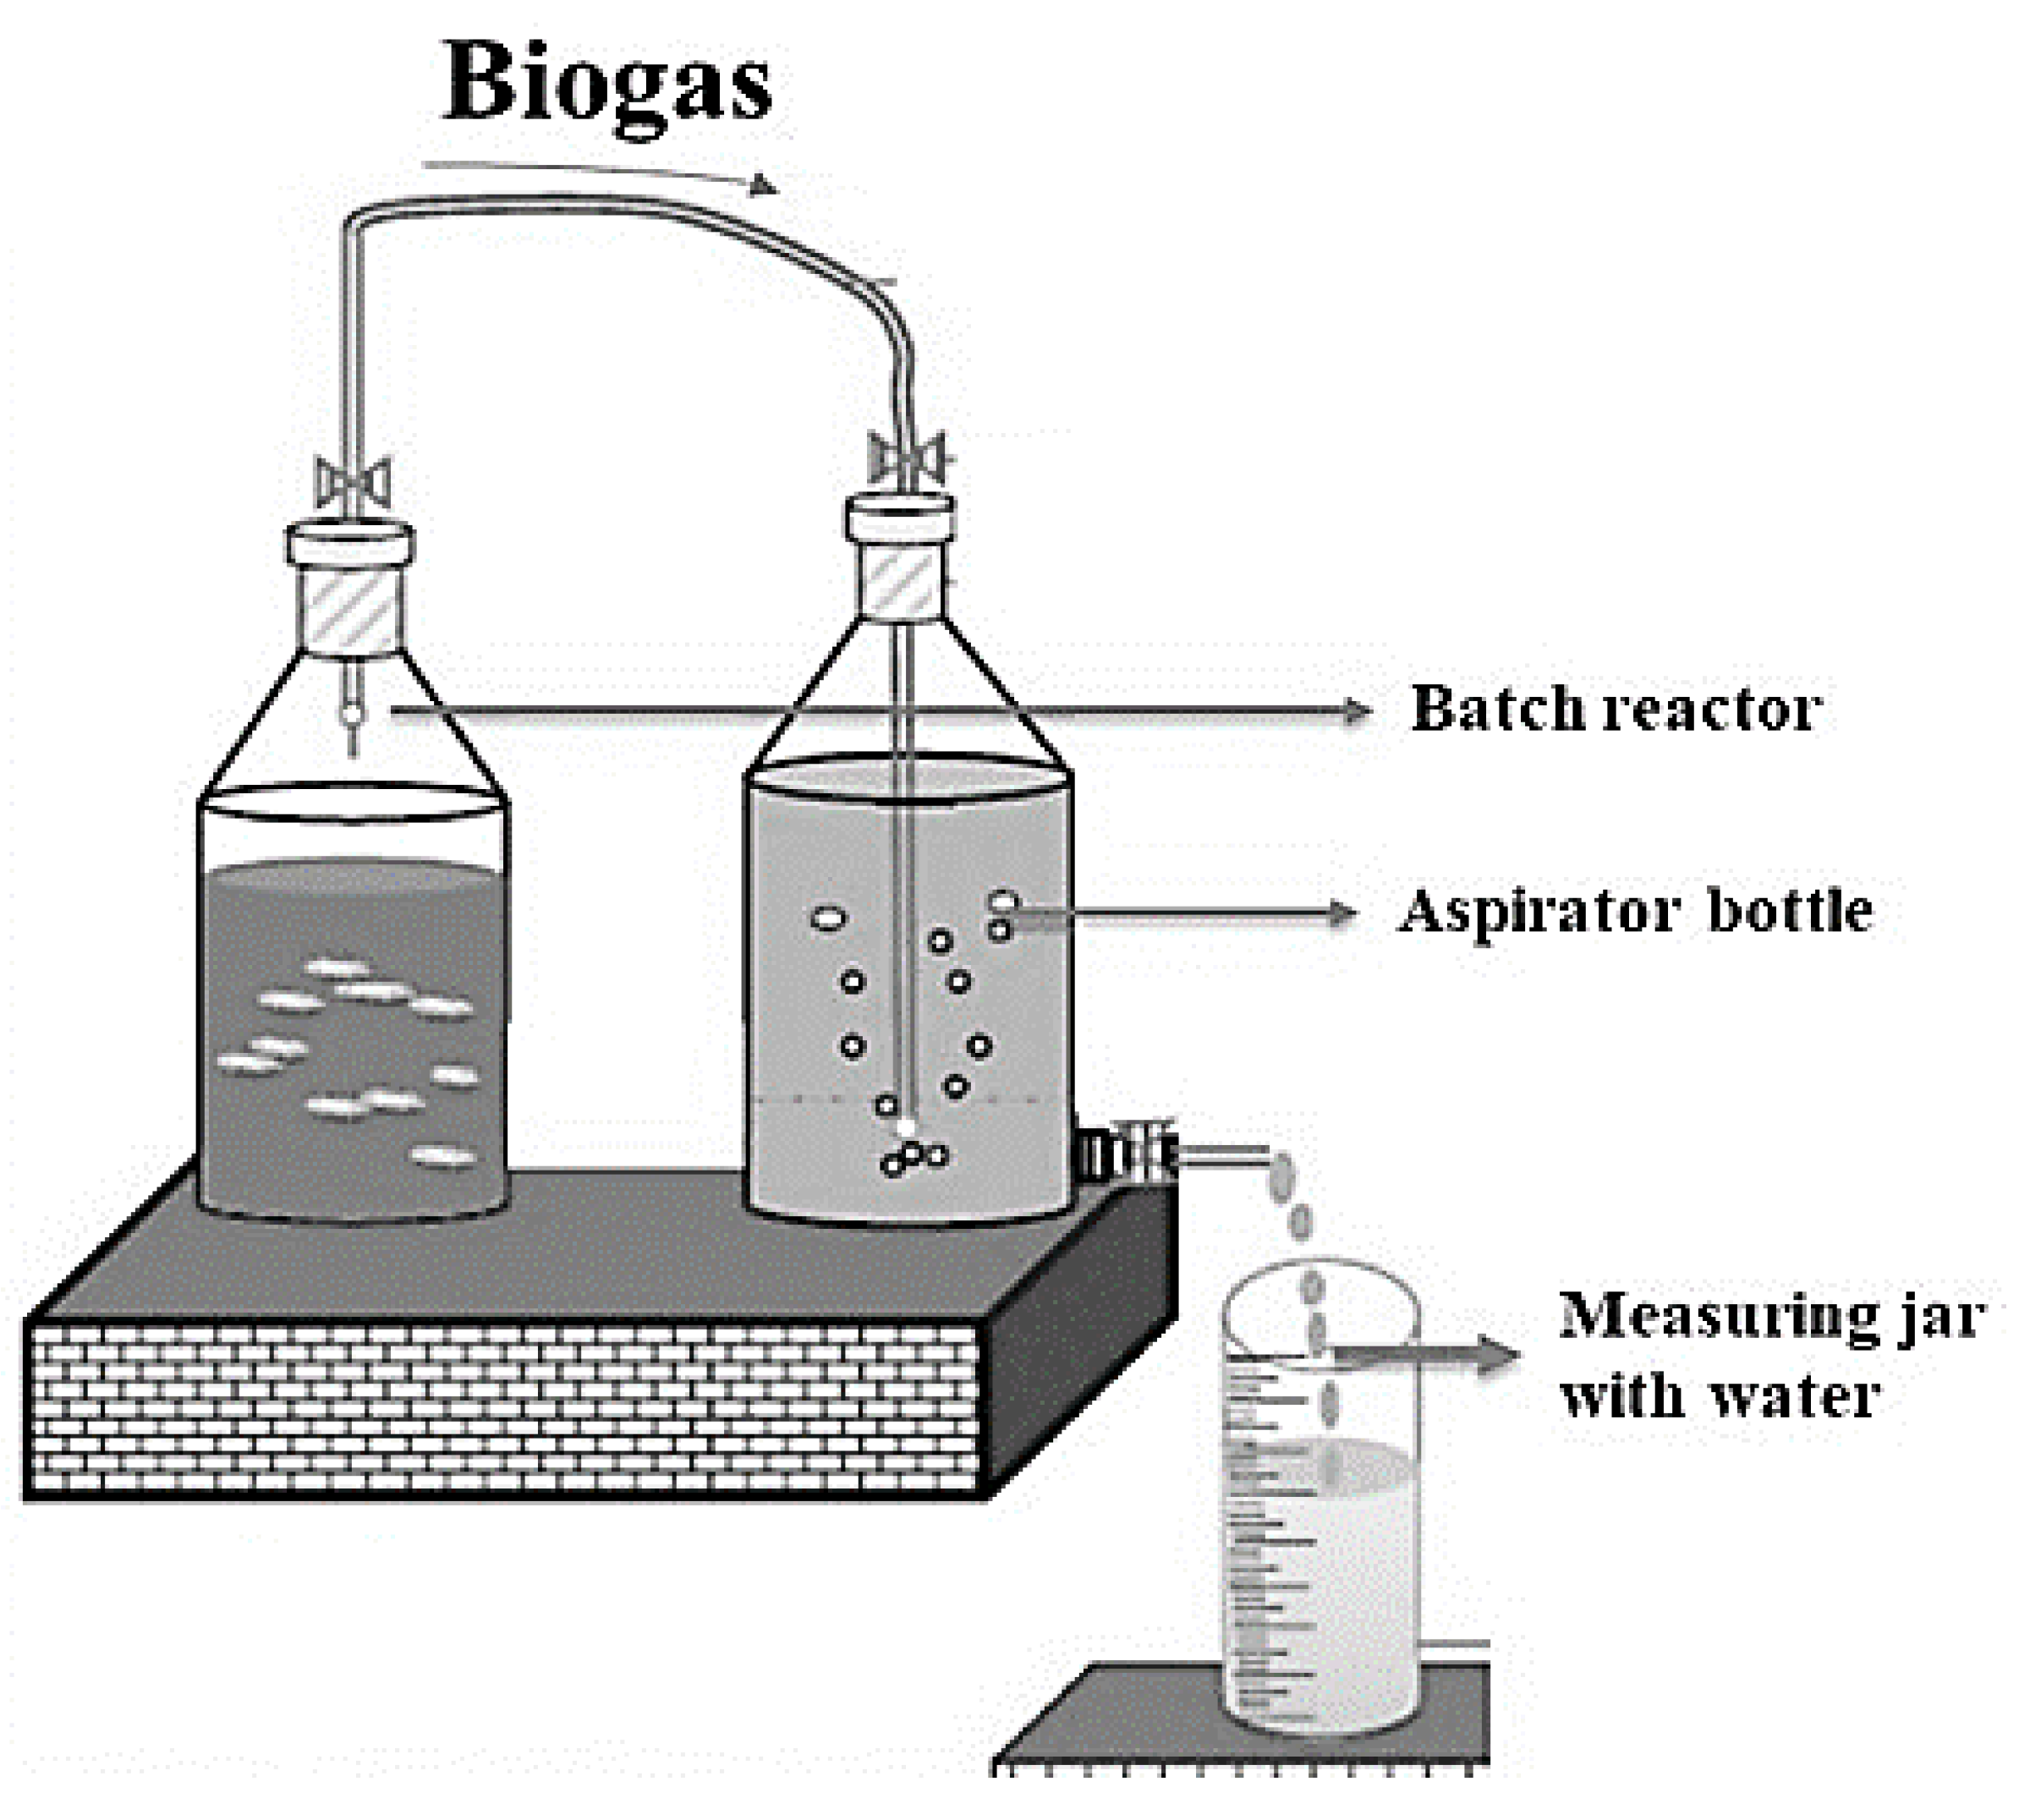
Figure 2.
Daily biogas production.
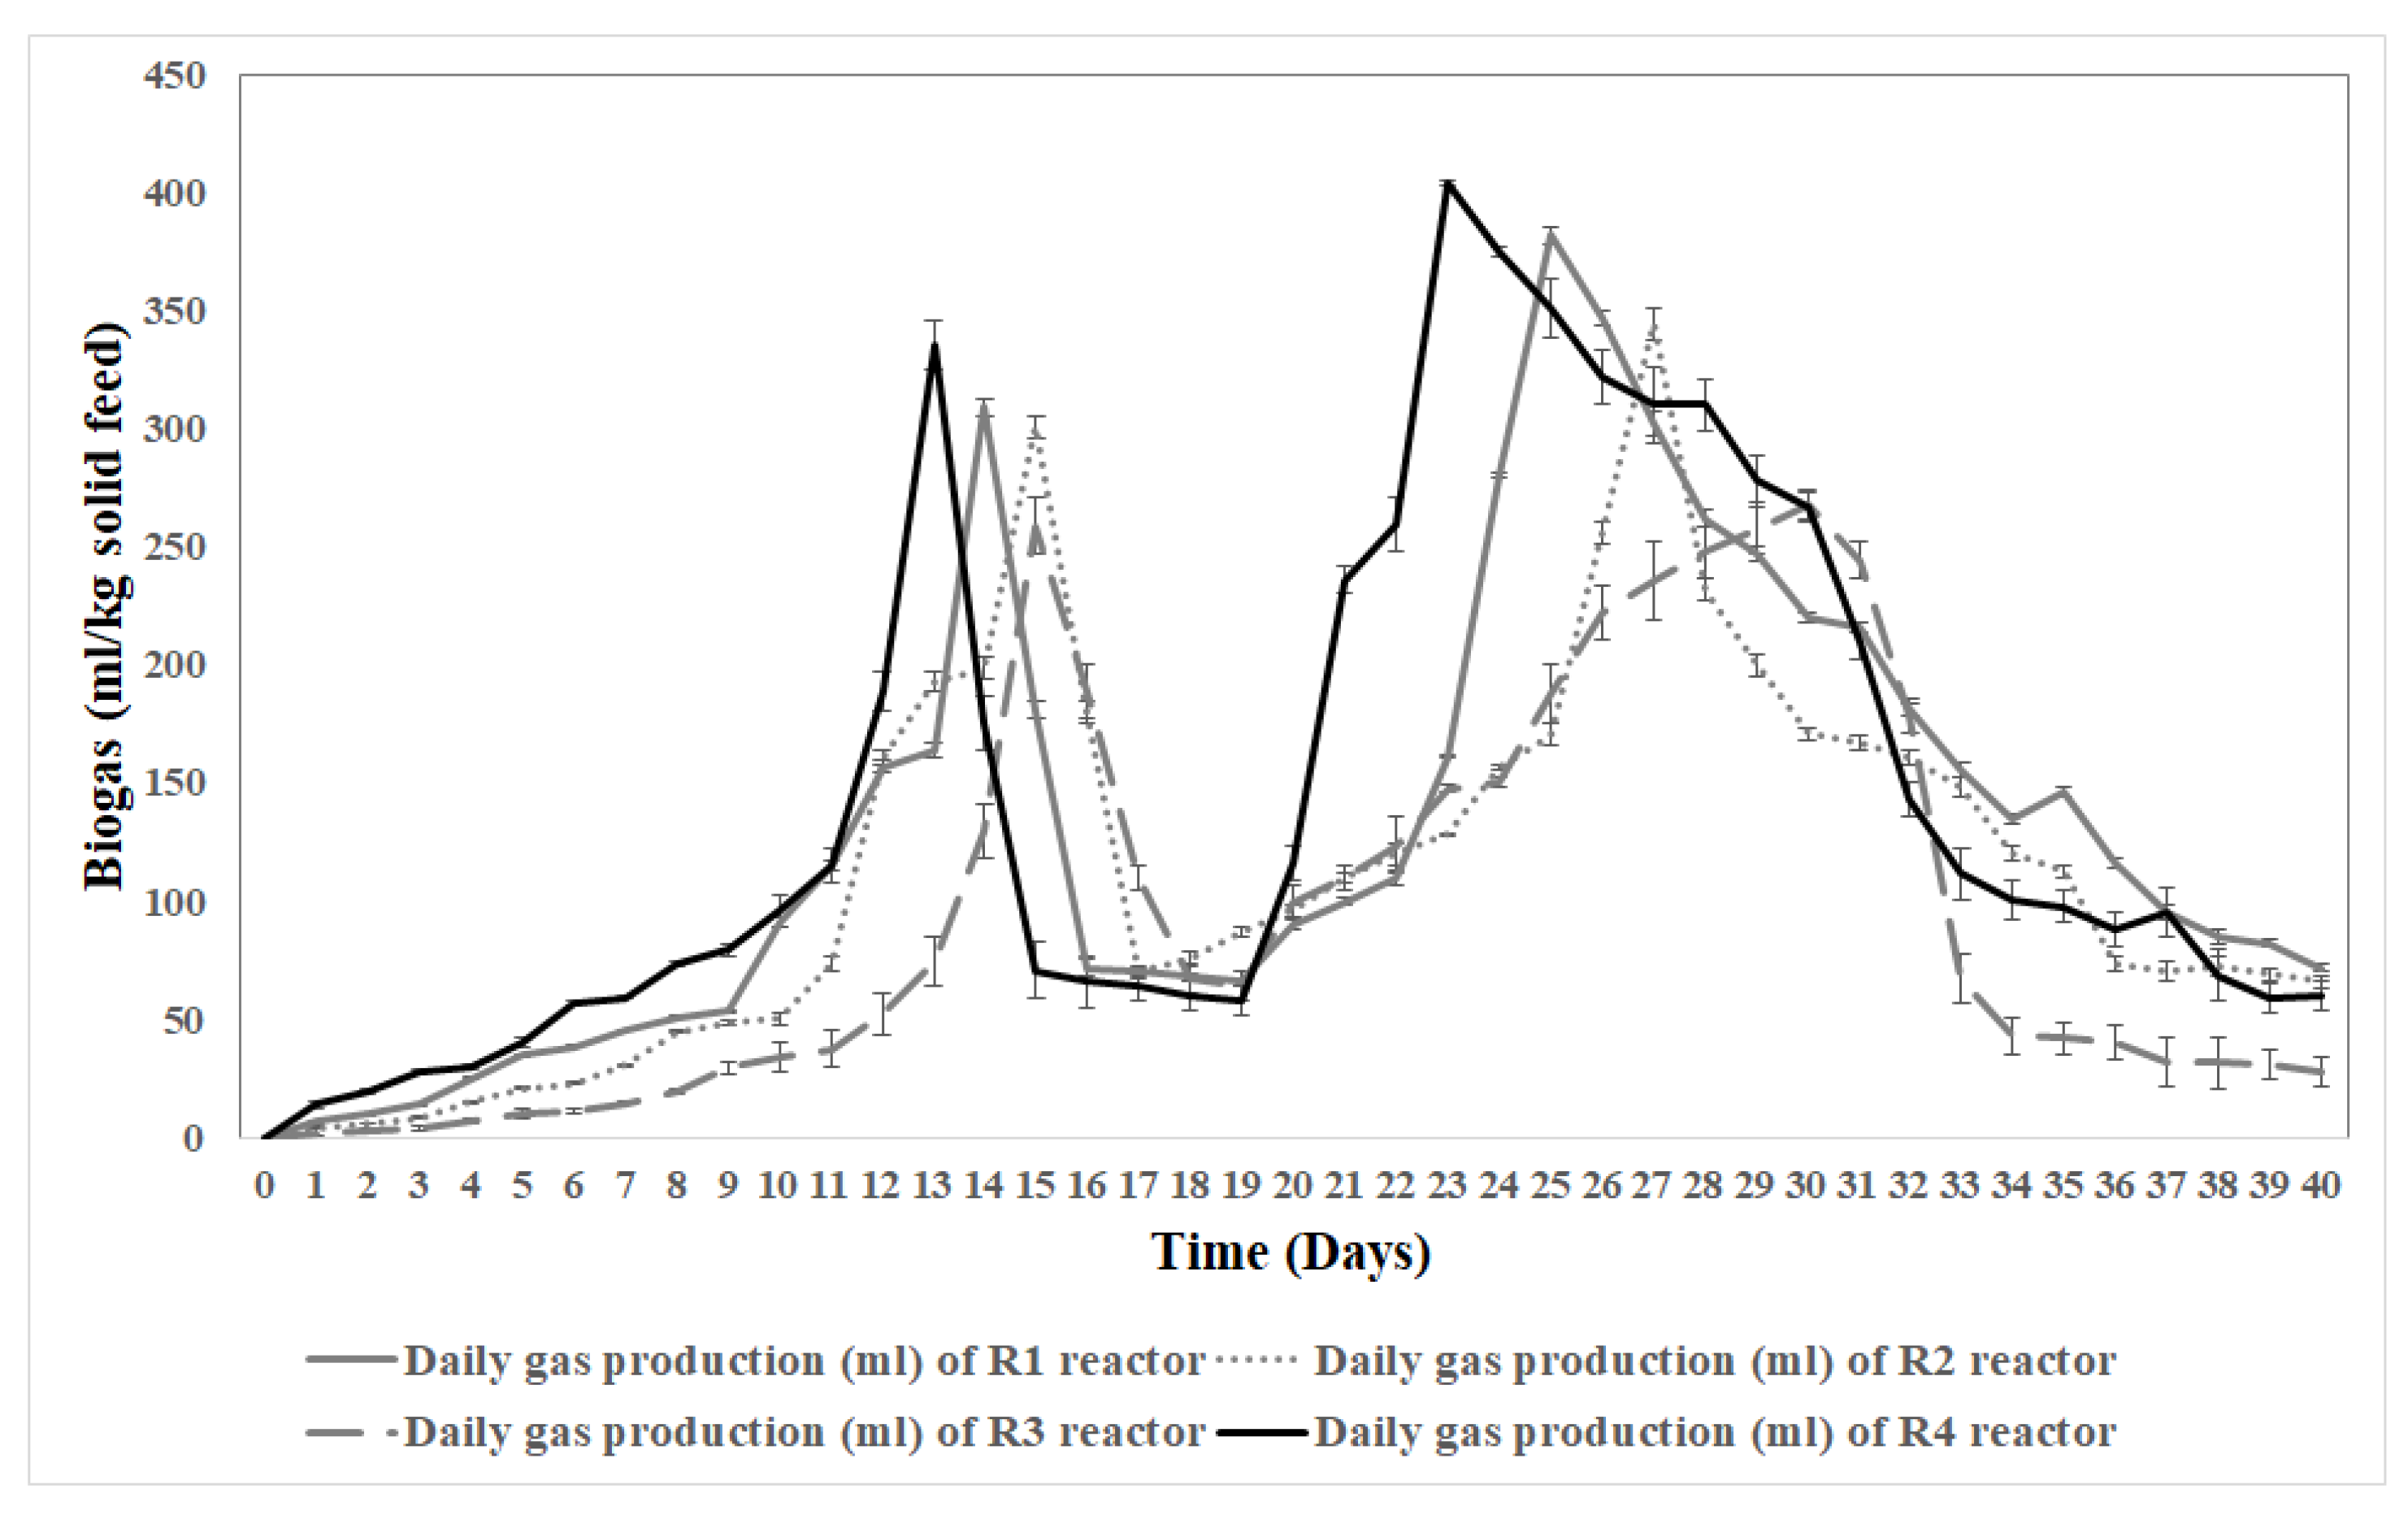
Figure 3.
Cumulative biogas production (ml/kg solid feed) from LS, CD, FW, and SD.
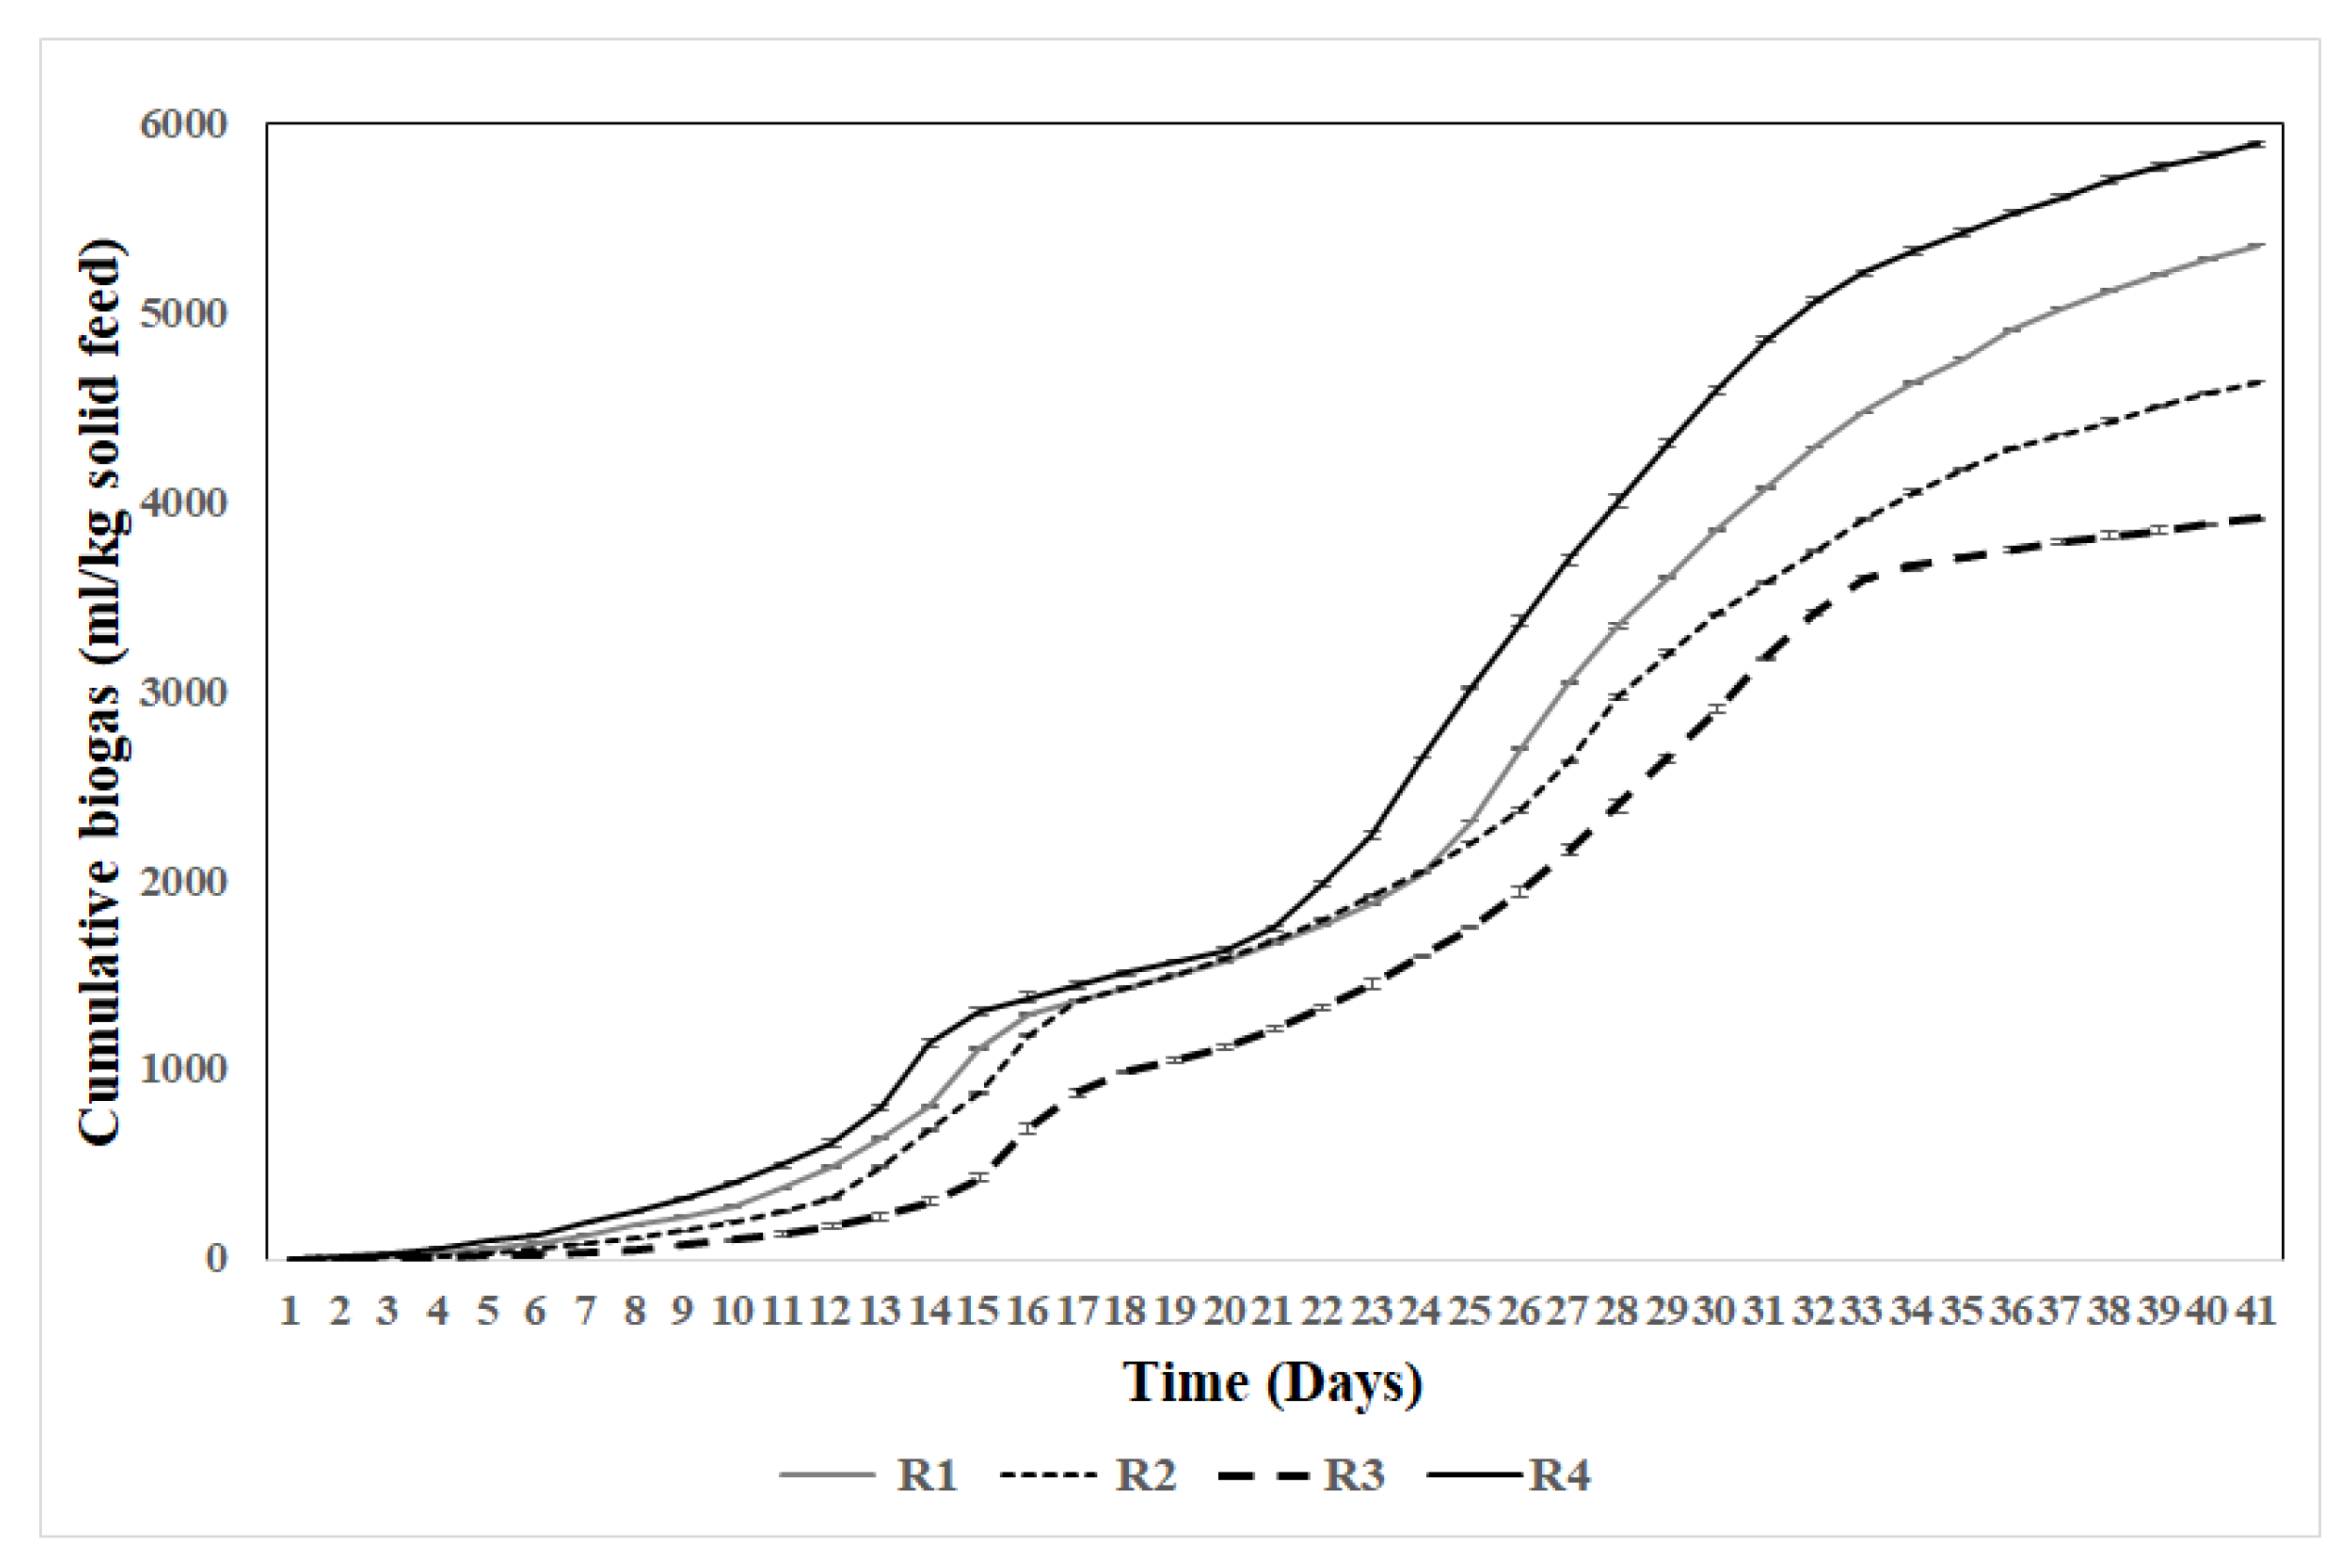

Table 1.
Composition of feed materials.
| Reactor No. | Treatment | LS (g) | CD (g) | FW (g) | SD(g) | Tap water (ml) | Inoculum (g) | Total volume of slurry (ml) |
| R1 | LS + CD (1:1) | 250 | 250 | - | - | 500 | - | 1000 |
| R2 | LS + FW (1:1) | 225 | - | 225 | - | 500 | 50 | 1000 |
| R3 | LS + CD + SD (1:1:1) | 166 | 167 | - | 167 | 500 | - | 1000 |
| R4 | LS + CD + FW (1:1:1) | 166 | 167 | 167 | - | 500 | - | 1000 |
LS = Leather shavings; CD = Cow dung; SD = Sawdust, FW = Food waste.
Table 2.
Characteristics of substrates and inoculum.
| Parameter | Mean value ± standard deviation | ||||
| LS | CD | SD | FW | Inoculum | |
| pH | 4.51 ± 0.42a | 8.05 ± 0.27b | 7.63 ± 0.15b | 7.31 ± 1.01b | 7.3 ± 0.64b |
| EC (mS/cm) | 23.4 ± 1.21a | 3.54 ± 0.02b | 2.29 ± 0.24b | 1.54 ± 1.04b | 1.44 ± 1.24b |
| TS (%) | 59.98 ± 0.88a | 15.32 ± 0.64b | 70.8 ± 0.55c | 49.23 ± 1.22d | 12.8 ± 0.4b |
| VS (%) | 92.5 ± 1.35a | 78.6 ± 0.30b | 83.03 ± 1.05b | 82.2 ± 4.10b | 5.00 ± 0.02c |
| Ash content (% TS) | 8.4 ± 0.43a | 31.96 ± 1.36b | 1.56 ± 0.40c | 22.13± 1.33d | *nd |
| TOC (%) | 38.3 ± 1.51a | 46.4 ± 0.49b | 46.5 ± 0.47b | 52.71 ± 0.1c | 43.4 ± 0.24b |
| Total nitrogen (%) | 12.7 ± 0.26a | 2.1 ± 0.20b | 0.81 ± 0.02c | 3.3 ± 2.02d | 1.95 ± 0.02b |
| Protein content (%) | 79.375 ± 0.26a | 13.12 ± 0.20b | 5.06 ± 0.02c | 20.62 ± 2.02d | 12.5 ± 0.02b |
| Moisture content (%) | 40 ± 0.02a | 84.68 ± 0.15b | 28 ± 1.20c | 48.80 ± 1.67d | *nd |
| C/N ratio | 3.01 | 22.09 | 57.4 | 15.97 | 22.2 |
| Cr (mg/kg) | 329.84 ± 5.23 | *nd | *nd | *nd | *nd |
Values shown in table are means of triplicate analyses; superscripts with same letters are statistically the same by the Tukey’s test at 5%.
Table 3.
Physicochemical characteristics of combined substrates before AcoD.
| Parameter | Mean value ± standard deviation | |||
| LS + CD | LS + FW | LS + CD + SD | LS + CD + FW | |
| pH | 6.8 ± 0.22a | 7.5 ± 1.27a | 7.51 ± 1.15a | 6.66 ± 1.01a |
| Total solids (TS) (%) | 22.6 ± 1.13a | 20.9 ± 2.01a | 20.12 ± 1.02a | 21.81 ± 2.02a |
| Volatile solids (VS) (%) | 86 ± 4.11a | 88.6 ± 3.01a | 90.5 ± 4.10a | 82.9 ± 4.10a |
| Moisture content (%) | 77.4 ± 0.02a | 79.1 ± 0.15a | 79.99 ± 1.20b | 78.19 ± 1.67c |
| C/N ratio | 18.8 | 16.1 | 25.64 | 22.9 |
Values shown in table are means of triplicate analyses; superscripts with same letters are statistically the same by the Tukey’s test at 5%.
Table 4.
Composition of biogas of different reactors. Values are the average of triplicate analyses.
Table 4.
Composition of biogas of different reactors. Values are the average of triplicate analyses.
| Digestion time (day) | R1 | R2 | R3 | R4 | ||||
| CH₄ (%) | CO2 (%) | CH₄ (%) | CO2 (%) | CH₄ (%) | CO2 (%) | CH₄ (%) | CO2 (%) | |
| 7 | 41.87 | 54.2 | 45.87 | 50.1 | 41.23 | 52 | 41.4 | 53.2 |
| 14 | 47.87 | 43.78 | 45.62 | 42 | 43.56 | 44 | 50 | 41 |
| 21 | 48.8 | 43 | 47.8 | 42.6 | 45.43 | 43.34 | 50.8 | 39.8 |
| 28 | 50.8 | 41 | 49.8 | 40 | 49.8 | 42 | 51.9 | 39.6 |
| 35 | 52.1 | 39.4 | 51.7 | 38.9 | 49 | 36.3 | 53.1 | 38.4 |
| 40 | 52.63 | 38.2 | 51.73 | 37.2 | 51.2 | 37.5 | 53.63 | 37.2 |
Table 5.
Parameter changes before and after AcoD.
| Reactor | Initial TS (g) | Final TS (g) | TS reduction (%) | Initial VS (g) | Final VS (g) | VS reduction (%) | Initial COD (mg/L) | Final COD (mg/L) | COD reduction (%) | Initial pH | Final pH |
| R1 | 22.6 ± 1.13 | 4.08 ± 1.27 | 81.95 ± 7.52 | 86 ± 4.11 | 45.2 ± 3.11 | 47.44 ± 5.99 | 41741 ± 240.23 | 23370 ± 118.45 | 44.01 ± 0.64 | 6.8 ± 0.22 | 7.53 ± 0.03 |
| R2 | 20.9 ± 2.01 | 5.52 ± 2.04 | 73.59 ± 13.70 | 88.6 ± 3.01 | 44.75 ± 2.21 | 49.49 ± 4.21 | 41878 ± 240.23 | 25370 ± 113.15 | 39.41 ± 0.63 | 7.5 ± 1.27 | 6.4 ± 0.67 |
| R3 | 20.12 ± 1.02 | 8.9 ± 3.12 | 55.77 ± 16.31 | 90.5 ± 4.10 | 55.57 ± 4.32 | 38.6 ± 6.58 | 47016 ± 240.23 | 27756 ± 125.44 | 40.96 ± 0.58 | 7.61 ± 1.15 | 6.48 ± 0.1 |
| R4 | 21.81 ± 2.02 | 3.56 ± 1.02 | 83.68 ± 10.38 | 82.9 ± 4.10 | 39.8 ± 1.11 | 51.99 ± 5.12 | 50161 ± 240.23 | 23138 ± 118.45 | 53.8 ± 0.53 | 6.66 ± 1.01 | 7.2 ± 0.01 |
Table 6.
Mean values of organic matter (BOD5, TOC and VSS) and VFA concentrations in reactors before and after biodegradation.
Table 6.
Mean values of organic matter (BOD5, TOC and VSS) and VFA concentrations in reactors before and after biodegradation.
| Reactor |
BOD5 (ppm) | TOC (ppm) | VSS (%) | VFA (mg/L) | ||||||||
| Before | After | Variation | Before | After | Variation | Before | After | Variation | Initial | Final | Maximum in the 1st 2 weeks | |
| R1 | 1655 ± 158 | 1020 ± 430 | -38.3% | 1637 ± 147 | 1069 ± 171 | -34.69% | 52 ± 3 | 43 ± 1 | -17.30% | 2,800 ± 150 | 1,900 ± 130 | 3100 ± 110 |
| R2 | 2905 ± 30 | 2245 ± 45 | -22.7% | 3014 ± 164 | 2205 ± 125 | -26.84% | 65 ± 5 | 56 ± 9 | 13.84% | 2,790 ± 140 | 1,800 ± 120 | 5210 ± 160 |
| R3 | 2403 ± 220 | 2079 ± 199 | -13.4% | 1456 ± 131 | 1088 ± 12 | 25.27% | 61 ± 7 | 55 ± 6 | -9.83% | 3,000 ± 160 | 2,200 ± 140 | 3790 ± 112 |
| R4 | 2043 ± 110 | 1016 ± 10 | 50.26% | 2517 ± 331 | 1320 ± 27 | 47.55% | 50 ± 3 | 38 ± 1 | -24% | 2,750 ± 130 | 1,600 ± 110 | 4300 ± 125 |
Disclaimer/Publisher’s Note: The statements, opinions and data contained in all publications are solely those of the individual author(s) and contributor(s) and not of MDPI and/or the editor(s). MDPI and/or the editor(s) disclaim responsibility for any injury to people or property resulting from any ideas, methods, instructions or products referred to in the content. |
© 2025 by the authors. Licensee MDPI, Basel, Switzerland. This article is an open access article distributed under the terms and conditions of the Creative Commons Attribution (CC BY) license (http://creativecommons.org/licenses/by/4.0/).
Copyright: This open access article is published under a Creative Commons CC BY 4.0 license, which permit the free download, distribution, and reuse, provided that the author and preprint are cited in any reuse.


