
Submitted:
11 April 2025
Posted:
15 April 2025
You are already at the latest version
Abstract
Exposing insects to mild and/or severe heat can protect them from future heat stress by regulating the expression of certain stress markers. In this study, 60 queen larvae, one day old, were divided into two groups: a control group of non-heat-treated mother queens (nH-T MQ), kept for 15 min at 34.5 °C and 70% relative humidity (RH), and a pre-heat-treated mother queen group (pH-T MQ) that were kept for 15 min at 41 °C and 70% RH. 500 daughter workers were collected from brood combs of each group and incubated at room temperature (22 °C) for 30 min, then divided into five groups (n=100), each was incubated for one hour at one of the following temperatures: 35, 40, 45, 50, and 55 °C. The expression levels in ten workers of each treatment were assessed by relative quantitative Real-Time qPCR and/or ELISA done on several antioxidant genes and markers. The pH-T MQ showed improved basal and dynamic expression of several genes and enzymes, which indicated a protective response against heat stress and the effectiveness of tissue hardening in oxidative stress and antioxidant activity response. These recorded changes may have global implications by improving thermotolerance acquisition during heat stress conditions.
Keywords:
honeybee
; rapid heat hardening
; global warming
; heat stress
; tolerance
; expression
1. Introduction
Change in external or internal optimal conditions can lead to stress, and the organism can modulate its physiological function to retain homeostasis [1]. Also, the organism may respond to stressors by changing some metabolic processes, however, the adverse effect of stress on productive and reproductive ability in honeybees is still a challenge [2].
Commercial honeybee production can be affected by several stressors that affect their reproduction and production capabilities as well as their health status. These stressors could be external stressors including biotic such as pathogens, predators, and parasitoids [3,4], and abiotic i.e. high CO2 concentration [5], low temperature [6], nutritional (habitat depletion) [7], UV radiation, chemicals [8], or internal stressors such as biological production of reactive oxygen species (ROS), which form during the reduction of O2 [9]. Biological molecules such as lipids, proteins, and nucleic acids can be damaged by ROS compounds [9], and a great mass of data indicates that bees, like other organisms, have developed during the evolution process protective responses to detoxify ROS compounds [10] to maintain cell homeostasis and regulate cell biological processes [11].
Generally, antioxidant systems work through both enzymes and non-enzymatic low molecular-weight antioxidants to reduce ROS levels during stress [12]. The first group is the primary antioxidant enzymes interacting directly with ROS molecules. Enzymes that play an important role in antioxidant protection are superoxide dismutase 1 (SOD 1), catalase (Cat), and peroxidases such as Thioredoxin Peroxidase 4 (Tpx 4), and Glutathione Peroxidase-like 1 (Gtpx 1). As a result of these enzymes, superoxide radicals (O−2) are converted to oxygen (O2) and hydrogen peroxide (H2O2), and by the end of this process, both CAT and POX have converted the H2O2 into oxygen and water (H2O) [9,12]. The second one is the secondary antioxidant enzymes that interact indirectly with ROS molecules [11]. The secondary enzymes include Thioredoxin reductase 1 (Trxr 1), and Methionine sulphoxide reductase A (MsrA) [11]. Trxr 1 is involved in thioredoxin (TRX) and glutathione (GSH) recycling [13], while MsrA has a critical role in protein restoration [14].
In previous studies, the honeybee genome (Apis mellifera L.) sequence was used to determine the defense system components used to diminish the adverse effects of free radicals [11]. Apis mellifera L cells can reduce the harmful effects of reactive oxygen species (ROS) by their specified lines of defense; the first line includes several enzymes like superoxide dismutase in both mitochondria and cytoplasm, catalase, glutathione peroxidase, and the reduced glutathione tripeptide (GSH) that detoxify the free radicals and prevent their harmful cellular effects [15]. The second line includes free radical scavenging which plays a crucial role in reducing the imbalance between the level of free radical production and antioxidant level [16]. Moreover, the honeybees (Apis mellifera) can produce Vitellogenin (Vg), one of the non-enzymatic antioxidants that scavenge ROS and reduce the oxidative stress within honeybees consequently increasing the lifespan for both workers and queens [17,18].
Although the honeybees (Apis mellifera) are known to have a limited ability to control their body temperature according to climate temperature change at the individual level, they act as endothermic superorganism due to their thermoregulatory adaptation at the colony level [19]. The increased temperature is one of the oxidative stressors that enhance the production of ROS, so the increased temperature can affect honeybees’ reproduction and production ability and ultimately can affect their survival ability [20]. The concept of adaptive homeostasis mechanisms explains the development of various protective mechanisms in the organism upon exposure to environmental stress like oxidative and heat stress, taking into consideration the variants of exposure according to the type of stressor, time, and intensity of exposure [21]. For example, experiencing oxidative stress with a low/basal level can improve adaptive mechanisms and in turn the ability of cells to survive in such stressful conditions [22]. During larval development, abnormal temperatures can result in altered behaviors, phenotypes malformations, and reduced survival rates [23]. A further consequence is that it can dramatically affect honeybees' ability to learn, dance, and division of labor [24,25,26], color of emerging bees [27], wing morphology [28], expression of heat shock protein [29], and oxidative stress [30].
Insects can be pre-heat-treated with a mild heat stressor to protect them from future stressors by induction of antioxidant gene expression. This phenomenon is known as rapid heat hardening, [31]. Prior environmental experiences can allow some insects to adapt to high ambient temperatures [32] as it was reported that experiencing certain sublethal stressors can increase the concentrations of cellular stress proteins and improve survival ability even in the presence of other subsequent stressors [33]. Heat hardening (Heat pre-treatment) is one type of mechanism that is associated with potential molecules, physiological changes, or differential gene expression, such as genes of the antioxidant system [34,35]. It is used to improve resistance experimentally in Drosophila melanogaster, as it promotes a rapid induction of protective biochemical and physiological mechanisms that significantly improve heat resistance [36].
According to pre-heat treatment effects on improving thermotolerance responses, the transcription levels of certain antioxidant genes including SOD 1, POD, and CAT, (GST), GR genes were reported to be upregulated in comparison with insects control groups, and this indicates the increase in antioxidant activity is one of the defense responses when suffering from heat stress [37,38,39]. However, the effect of pre-heat treatment may be either beneficial or harmful according to the degree and duration of heat stress. Many studies reported that mild exposure to a high temperature may increase the level of organism thermotolerance [40]. Interestingly, different organisms have similar mechanisms as a response to ultimately different low or moderate levels of stress, and short-term exposure to high levels of heat stress can help the organisms in increasing other stress tolerances known as cross-tolerance [40].
In this study, we provided evidence that heat pre-treatment (heat hardening) of honeybee queens during the larval stage does not only alter the basal expression of antioxidant proteins of their daughter workers during thermoneutral conditions but also alters the dynamics of their expression during heat stress.
2. Results
2.1. Temperature Tolerance and Mortality
nH-T MQ and pH-T MQ groups had 100% survival at 40 and 45 °C. However, the survival of the daughter workers of the nH-T MQ at 50 °C significantly dropped to 40% and at 55 °C none of the workers survived (p < 0.05). Surprisingly, the daughter workers of the pH-T MQ had 97% survival at 50 °C which dropped to 47% at 55 °C.
2.2. mRNA Expression Levels of Antioxidants
2.2.1. Catalase
Figure 1A shows that Cat mRNA levels in the head tissues at the basal level (35 °C) were not significantly different between nH-T MQ and pH-T MQ groups (p < 0.05). However, after heat stress at 40 °C, the nH-T MQ groups exhibited higher Cat mRNA levels. The pH-T MQ group heads had significantly higher Cat mRNA levels at 45°C (p < 0.05). The nH-T MQ group displayed significantly higher levels of Cat mRNA in the heads at 55 °C (p < 0.05). It is noteworthy that the highest levels of Cat mRNA expression were detected in the heads of workers in the nH-T MQ and pH-T MQ groups after heat stress at 55 and 45 °C, respectively.
2.2.2. Glycoxylase Domain-Containing Protein 4 (GLOD 4)
A higher level of mRNA for GLOD 4 was observed in the heads of the nH-T MQ groups at basal temperature (35°C) (Figure 1B). As the temperature was raised to 40 °C, mRNA levels of GLOD 4 increased in both bee worker groups with significantly higher levels in the nH-T MQ group (p < 0.05). However, neither group's mRNA levels were significantly different after exposure to heat stress at 45, 50 or 55 °C (p < 0.05).
2.2.3. Superoxide Dismutase 1 (SOD 1)
The mRNA levels of SOD 1 were higher in the pH-T MQ heads at basal temperature (35 °C) than in the nH-T MQ heads (Figure 1C). Increasing the temperature to 40 °C resulted in a significantly higher level of SOD 1 mRNA levels in the heads of nH-T MQ compared to pH-T MQ group (p < 0.05). However, the pH-T MQ group had a significantly higher level of mRNA SOD 1 expression after heat stress at 45 °C (p < 0.05). Moreover, exposure to 50 °C resulted in approximately the same levels of mRNA expression in both nH-T MQ and pH-T MQ groups. The highest level of mRNA expression for SOD 1 was observed in the head of nH-T MQ workers after heat stress at 40 and 55 °C. On the other hand, the highest level of mRNA expression for SOD 1 was observed in the head of pH-T MQ workers after heat stress at 45 °C.
2.2.4. Thioredoxin-2 (TrX 2)
TrX 2 levels in the head tissues of nH-T MQ were significantly higher than pH-T MQ groups of the basal temperature (35 °C), 40, 50, and 55 °C (p < 0.05; Figure 1D). Significantly higher mRNA levels of thioredoxin-2 were detected in the pH-T MQ groups at 45 °C compared to the nH-T MQ group (p < 0.05). Heat exposure to 40 and 45 °C produced the highest levels of TrX 2 mRNA expression in the head in pH-T MQ workers and nH-T MQ workers, respectively.
2.2.5. Thioredoxin Reductase-1 (TrxR 1)
Both nH-T MQ and pH-T MQ groups expressed similar mRNA levels of TrxR 1 at basal temperatures (35°C, Figure 1E). However, the mRNA levels of TrxR 1 were higher in the nH-T MQ group following heat stress at 40 and 55 °C. While at 45 and 50 °C, the TrxR 1 levels were significantly higher in the pH-T MQ groups (p < 0.05). Interestingly, nH-T MQ workers showed the highest levels of TrxR 1 mRNA expression in the head after heat stress at 55°C, while pH-T MQ workers showed the highest levels of mRNA expression of TrxR 1 after heat stress at 45 and 50 °C.
2.2.6. Vitellogenin (Vg)
The mRNA levels of Vg were higher in the nH-T MQ groups at all temperatures except for the basal 35°C group, at which pH-T MQ workers significantly produced higher levels of Vg (p < 0.05; Figure 1F). Workers from nH-T MQ showed the highest mRNA expression of Vg after heat stress at 40, 50, and 55 °C, whereas workers pH-T MQ at 35 °C showed the highest mRNA expression of Vg.
2.2.7. Methionine Sulfoxide Reductase (MsrA)
At basal temperature (35 °C), there were no differences between the pH-T MQ workers and nH-T MQ workers groups in MsrA mRNA levels (Figure 1G). A significantly higher mRNA level of MsrA was observed in the pH-T MQ group after heat stress at 40 °C (p < 0.05). With an increase of exposure temperature to 45 and 50 °C, the nH-T MQ group showed higher mRNA levels of MsrA. Heat stress at 45 was associated with the highest mRNA expression of MsrA in the head of nH-T MQ workers, while in the pH-T MQ workers heat stress at 40, 45, and 55 °C was associated with the highest mRNA expression of MsrA.
2.2.8. Thioredoxin Peroxidase 4 (Tpx 4)
Temperatures 35, 40, and 45 °C induced significantly higher Tpx 4 levels in the pH-T MQ than the nH-T MQ groups (p < 0.05; Figure 1H). A contrast was observed at 50 and 55 °C, where Tpx 4 levels were significantly higher in the nH-T MQ groups compared to pH-T MQ workers (p < 0.05). The highest mRNA expression levels of Tpx 4 in the head were observed for both the nH-T MQ and pH-T MQ were after heat stress at 40, 45 and 50 °C.
2.2.9. Glutathione Peroxidase Like 1 (Gtpx 1)
When the workers of pH-T MQ groups were kept at 35, 45, and 50 °C, mRNA levels of Gtpx 1 were significantly higher than in the nH-T MQ group (p < 0.05; Figure 1I). While the levels of Gtpx 1 were significantly higher in the nH-T MQ group after exposure to 40 and 55 °C (p < 0.05). Heat stress at 40°C and 45°C resulted in the highest mRNA expression levels of Gtpx 1in the head of nH-T MQ and pH-T MQ workers, respectively.
2.3. Antioxidants Concentration
2.3.1. Superoxide Dismutase 1 (SOD 1)
During basal conditions (35 °C), SOD 1 concentrations were significantly higher in nH-T MQ groups compared to pH-T MQ group (p < 0.05; Figure 2A). Moreover, the concentration of SOD 1 detected in the heads at 40 and 55 °C was approximately the same in both groups, while at 50 °C the concentrations of SOD 1 were significantly higher in pH-T MQ groups (p < 0.05). The highest concentrations of SOD 1 were observed in the heads of nH-T MQ and pH-T MQ workers following heat stress at 45 and 50°C, respectively.
2.3.2. Peroxidase (POD)
POD concentrations were higher in pH-T MQ than in the nH-T MQ groups at 35 and 40 °C (Figure 2B). However, the POD concentrations of the nH-T MQ and the pH-T MQ workers did not differ significantly when exposed to the different temperatures (p < 0.05).
2.3.3. Acetylcholinesterase (AChE)
There were no differences in the concentrations of AChe between the workers of two groups (nH-T MQ and pH-T) and within the same groups when they were exposed to 35, 40, and 45 °C (Figure 2C). The concentration of AChe was significantly higher in pH-T MQ groups at 50 and 55 °C compared to that of the nH-T MQ group and peaking at 50 °C (p < 0.05).
2.3.4. Cytochrome P450 (CYTP450)
There were no differences in CYTP450 concentrations between the nH-T MQ and the pH-T MQ groups at 35, 40, and 55 °C (Figure 2D). Workers of the nH-T MQ group exhibited significantly higher CYTP450 concentration during heat stress at 45 °C than the pH-T MQ group (p < 0.05), while the pH-T MQ group exhibited significantly higher CYTP450 concentration at 50 °C than the nH-T MQ group (p < 0.05).
2.3.5. Glutathione Peroxidase (GPX)
The pH-T MQ group had higher concentrations of GPX than the nH-T MQ group at all temperatures except 45 °C (Figure 2E). The highest concentration of GPX in the head was observed at 50 °C in pH-T MQ workers.
2.3.6. Glutathione Reductase (GSR)
The concentration of GSR was significantly higher in the pH-T MQ than in the nH-T MQ groups at 35, 40, and 50 °C (p < 0.05), whereas the nH-T MQ group had higher GSR concentrations at 45 and 55 °C. (Figure 2F). The highest concentration of GSR in the head was observed at 45, 50, and 55 °C in the nH-T, and at 50 °C in the pH-T MQ workers.
2.3.7. Catalase (Cat)
Cat concentrations did not differ significantly between the nH-T MQ and the pH-T MQ groups, at all stress temperatures except at 45 and 50°C (p < 0.05), where higher Cat levels were observed in the nH-T MQ and pH-T MQ groups, respectively (Figure 2G). The highest concentration of Cat in the head was detected at 50 °C in pH-T MQ workers.
3. Discussion
The results of this experiment showed that the daughter workers of the pH-T MQ exhibited higher survival rates at elevated temperatures than those of the nH-T MQ. Accordingly, the prospective effects of global warming could be on the odds of the honeybees. This has been currently detected by the evident improvement of the basal and dynamic expression of several of the tested genes on the pH-T MQ, which likely indicated a protective response against heat stress and the effectiveness of tissue hardening in oxidative stress and antioxidant activity response. It was also reported that the antioxidants and enzyme detoxification activities are significantly higher in bees exposed to higher temperature stress [20].
The current mRNA results in the nH-T MQ showed a general trend of gradual increase of expression levels with two peaks at 40 °C and at 55 °C in most of the enzymes studied, except in MSR A and TP 4 enzymes. Whereas for the pH-T MQ the mRNA showed a general trend of gradual increase of the expression levels with one peak at 40 °C and/or at 50 °C in most of the enzymes studied, except in Vg and MSR A enzymes. The first trend of increasing the expression of the enzymes in response to heat stress in pH-T MQ workers may be attributed to its improved thermotolerance responses due to the adaptive effect of heat hardening [41,42]. Later, by increasing heat stress temperatures the expression levels started to decrease, probably indicating a recovery pattern and the ability of the pH-T MQ groups to tolerate heat stress due to tissue hardening [43]. The presence of a second peak of increased expression in nH-T MQ may indicate cellular instability upon exposure to high levels of heat stress, which is supported by the decreased survival of this group at such higher temperatures [38]. Such decrease in enzyme expression between the peaks could be regarded as enzyme denaturation because of heat stress in the nH-T MQ [42].
The expression levels of the mRNA of Vg and MSR A enzymes followed different dynamics that that found in the other enzymes. The currently reported expression levels of the MsrA gene were approximately the same at basal temperatures for both groups, then increased at 40 °C. Later, the highest expression levels were recorded at 45 °C for the nH-T MQ group with subsequent decline but then increased again at 55°C. As noted, before, this instability of mRNA level can be related to temperature fluctuation as the stability of the translation of mRNA may decrease due to heat stress [44]. This decline of gene expression at higher temperatures can be in response to thermal stress sensitivity [45]. The maintained stable levels of Vg in pH-T MQ workers despite increasing stress temperatures may be due to different cooling mechanisms used in the heads of the honeybees [41]. The decreased Vg concentration levels in nH-T MQ workers has been previously linked to decreased stability of the Vg mRNA as a result of heat stress [44].
The ELISA results exhibited different dynamics of enzyme concentrations. This disagreement between the mRNA expression levels and the ELISA concentration can be explained by the difference in time intervals needed to translate the mRNA to give the protein product. The mRNA expression may have increased at certain temperatures but detecting the increased concentrations of the product enzyme at later time when bees were exposed to the higher temperatures. As discussed before, studies have shown that the combined results of mRNA translation, protein degradation, and mRNA stability depicted a high translation level of SOD 1 enzyme as a response to heat stress [46].
In the nH-T MQ, the concentration of the studied enzymes had one peak at 45 °C except for GSR, which maintained its high concentration after the peak. On the other hand, the enzyme concentrations in pH-T MQ peaked at 50 °C except for the peroxidase enzyme, which had almost a stable concentration at the different exposure temperatures. The GSR enzyme plays a major role in the regulation and maintenance of redox homoeostasis in the cells as it is responsible for the continuous supply of the reduced glutathione that has a crucial role in ROS control in the cells [47]. In insects’ overexpression of GSR genes under oxidative stress can be indicated as a protective response against ROS that may result from external or internal stress conditions [11].
The currently recorded changes in the expression and concentrations of enzymes incorporated in the mechanisms of stress tolerance may improve the thermotolerance acquisition during heat stress conditions and render the bees more adapted to it. Thermal manipulation of honeybees can though be practiced in the production fields as a protective measurement against heat waves to produce progenies that are more tolerant of such waves. Nonetheless, the effects of such thermal manipulation on morphology, reproductivity, and productivity of the mother queens and daughter workers need further investigation.
4. Materials and Methods
4.1. Queen Rearing
The experiment was conducted at the apiary of the Faculty of Agriculture, Jordan University of Science and Technology, Irbid, Jordan. All experimental queens came from the same source colony headed by a naturally mated Syrian honeybee (Apis mellifera L.) queen and, thus, were sisters to each other. All queens reared in 2020 were grafted from worker larvae in April, the prime month for open mating in the Jordan Valley area of Jordan [48]. A queen was confined in a queen excluding cage with a single frame for 12 hours to produce eggs of nearly a similar age. As the eggs began to hatch, first instar worker larvae were transferred to queen cups to be raised in queenless hives, following standard apicultural procedures [49].
4.2. Pre-Heat Treatment-Queen Larval Stage
Sixty queen larvae at the age of seven days were randomly selected and divided into two incubation treatment groups (n = 30). The non-heat-treated mother queens (nH-T MQ) were kept for 15 min at 34.5 °C and 70% relative humidity (RH), and the pre-heat-treated mother queens (pH-T MQ) group was subjected for 15 min to 41 °C and 70% RH. This temperature was chosen because previous research showed that exposing queens to 40 – 42 °C was the maximum tolerable temperature by honeybees [50,51]. After treatments, both groups were returned to their incubator hives, and 24 hours before hatching plastic-mesh cages were fitted over the occupied pupal queen cells of both groups to retain the emergence of virgin queens and to exclude any differences in honeybee body temperature. Emerged virgin queens of both groups were removed from the plastic mesh cages and introduced to queenless five-frame standard-sized mating mini hives. The hives were inspected two weeks later to ensure the successful introduction and the onset of oviposition. Four months later, the experimental colonies should become well established, and the bees should occupy 8-10 frames.
4.3. Rapid Heat Treatment and Heat Stress
500 workers were collected from brood combs of each treatment group and incubated at room temperature (22 °C) for half an hour to exclude any differences in honeybee body temperature. The workers were equally divided into five groups (n=100). The worker bees in their cages were incubated in digitally controlled thermo-incubators (Mermmet, IPP 110, USA) for one hour at one of the following temperatures: 35, 40, 45, 50, and 55 °C at 70% RH. Bees had access to 50% sugar syrup (w/v) in water. All cages of both groups were inspected every 30 minutes to confirm the number of dead bees. At each temperature, 12 living workers were taken randomly and killed by placing them in a glass jar containing few drops of Ethyle acetate. Heads and thoraces were removed immediately, snap-frozen in liquid nitrogen, and stored at -80 °C for RNA and protein analyses.
4.4. RNA Isolation and cDNA Synthesis
Heads of bees were homogenized using a Bead Ruptor Elite-Bead Mill homogenizer (OMNI International, Kennesaw, GA, USA). The total RNA was extracted from the heads (n = 12) individually for each group using TRI Reagent® (Zymo Research, Irvine, USA). The extracted RNA was cleaned and concentrated by the RNA clean-up and concentration kit (Norgen Biotek, Thorold, Ontario, Canada). The RNA was quantified and qualified using a Biotek PowerWave XS2 spectrophotometer (BioTek Instruments, Inc., Winooski, VT, USA), Qubit 4 fluorometer (Thermo Fisher Scientific, MA, USA), and 1% agarose gel. cDNA synthesis for each sample was accomplished using a high-capacity cDNA reverse transcription kit (Applied Biosystems, Foster City, CA, USA), using 2 µg of RNA for each reaction.
4.5. Relative Quantitative Real-Time qPCR (RT-qPCR)
RT-qPCR was performed using a TB Green™ Premix Ex Taq™ II kit (Takara Bio Inc, Kusatsu, Shiga, Japan) incubated in a Rotor-Gene Q MDx 5-plex instrument (Qiagen, Hilden, Germany). All primers were designed using IDT PrimerQuest software (http://eu.idtdna.com/PrimerQuest/Home/Index). The sequences of the primers are listed in Table 1. The cDNA sequence used in the primer design for each gene was taken from the NCBI’s nucleotide database (https://www.ncbi.nlm.nih.gov/nucleotide/). Briefly, the 20 µl reaction mix was prepared from 10 µl of the master mix; 2 µl forward primer (2 pmol); 2 µl reverse primer (2 pmol) (Table 1); 2 µl cDNA of the sample; and 4 µl of nuclease-free water. Cycling parameters were 95 °C for 5 min, 40 cycles of 95 °C for 10 s followed by 30 s at 57 °C and 72 °C for 10 s, with final melting at 95 °C for 20 s. Duplicates from each cDNA were analyzed, fluorescence emission was detected, and relative quantification was calculated automatically. Glyceraldehyde-3-phosphate dehydrogenase 2 (GAPDH) and β-Actin related protein 1 (β-actin) were used as internal controls to which the fold changes in gene expression were normalized. The melting curve was assessed to approve the specificity of the single-target amplification.
4.6. ELISA
The activities of Gtpx 1, SOD 1, Cat, CYP450, POD, Acetylcholinesterase (AChE), and Glutathione reductase (GSR) were determined using commercial ELISA kits (Shanghai Future Industry Co, Shanghai, China). SOD 1 activity was determined using the nitrite coloration method with absorbance at 550 nm. Cat activity was measured using the ammonium molybdate method with spectrophotometric determination of absorbance at 405 nm. Gtpx 1 activity was measured at 412 nm by quantifying the rate of oxidation of reduced GSH to oxidized glutathione.
4.7. Statistical Analysis
The survival rate of the bees was calculated after 15 min of exposure to the different temperatures while the sampling for molecular and ELISA analyses was performed one hour after exposure. All statistical analyses were performed using IBM SPSS statistics software v.25 (IBM Software, Chicago, USA). mRNA levels of expressed genes were presented as means ± Standard deviation (SD). The student’s t-test (nH-T MQ vs. pH-T MQ) followed by an all-pairs Bonferroni correction on the t test values was employed to compare different parameters in all treatment groups (35 °C vs. 40, 45, 50, and 55 °C). Parametric differences were considered statistically significant at p < 0.05.
Author Contributions
Conceptualization, resources, visualization, supervision, funding acquisition, S.Z., A.A., and M.B.A.; methodology, validation, formal analysis, investigation, S.Z., A.A., M.B.A., and I.M.A.; data curation, S.Z., A.A., M.B.A., I.M.A., and M.N.S.A; writing—original draft preparation, writing—review and editing, S.Z., A.A., I.M.A., and M.N.S.A. All authors have read and agreed to the published version of the manuscript.
Funding
This study was funded by the Deanship of Research, Jordan University of Science & Technology for its financial support of this work (Grant#: 56/2022 & Grant#: 396/2021).
Data Availability Statement
The original data presented in the study are openly available in [once the article is accepted for publishing].
Acknowledgments
We thank Al-Balqa Applied University, Al-salt for their support.
Conflicts of Interest
The authors declare no conflicts of interest.
Abbreviations
The following abbreviations are used in this manuscript:
| nH-T MQ | non-heat-treated mother queens |
| pH-T MQ | pre-heat-treated mother queen group |
| RHH | Rapid heat hardening |
| SD | Standard deviation |
References
- Modell, H.; Cliff, W.; Michael, J.; McFarland, J.; Wenderoth, M.P.; Wright, A. A Physiologist's View of Homeostasis. Adv Physiol Educ 2015, 39, 259–266. [Google Scholar] [CrossRef] [PubMed]
- Belsky, J.; Joshi, N.K. Impact of Biotic and Abiotic Stressors on Managed and Feral Bees. Insects 2019, 10, 233. [Google Scholar] [CrossRef] [PubMed]
- Genersch, E. Honey Bee Pathology: Current Threats to Honey Bees and Beekeeping. Appl Microbiol Biotechnol 2010, 87, 87–97. [Google Scholar] [CrossRef] [PubMed]
- Ratnieks, F.L.; Carreck, N.L. Ecology. Clarity on Honey Bee Collapse? Science 2010, 327, 152–153. [Google Scholar] [CrossRef]
- Chen, Y.L.; Hung, Y.S.; Yang, E.C. Biogenic Amine Levels Change in the Brains of Stressed Honeybees. Arch Insect Biochem Physiol 2008, 68, 241–250. [Google Scholar] [CrossRef]
- Nurnberger, F.; Hartel, S.; Steffan-Dewenter, I. The Influence of Temperature and Photoperiod on the Timing of Brood Onset in Hibernating Honey Bee Colonies. PeerJ 2018, 6, e4801. [Google Scholar] [CrossRef]
- Branchiccela B, Castelli, L. ; Corona, M.; Diaz-Cetti, S.; Invernizzi, C.; Martinez de la Escalera, G.; Mendoza, Y.; Santos, E.; Silva, C.; Zunino, P.; Antunez, K. Impact of Nutritional Stress on the Honeybee Colony Health. Sci Rep 2019, 9, 10156. [Google Scholar]
- Zhao, L.; Jones, W.A. Expression of Heat Shock Protein Genes in Insect Stress Responses. Invertebrate Surviv J 2012, 9, 93–101. [Google Scholar]
- Felton, G.W.; Summers, C.B. Antioxidant Systems in Insects. Arch Insect Biochem Physiol 1995, 29, 187–197. [Google Scholar] [CrossRef]
- Li-Byarlay, H.; Huang, M.H.; Simone-Finstrom, M.; Strand, M.K.; Tarpy, D.R.; Rueppell, O. Honey Bee (Apis mellifera) Drones Survive Oxidative Stress Due to Increased Tolerance Instead of Avoidance or Repair of Oxidative Damage. Exp Gerontol 2016, 83, 15–21. [Google Scholar] [CrossRef]
- Corona, M.; Robinson, G.E. Genes of the Antioxidant System of the Honey Bee: Annotation and Phylogeny. Insect Mol Biol 2006, 15, 687–701. [Google Scholar] [CrossRef] [PubMed]
- Dmochowska-Ślęzak, K.; Giejdasz, K.; Fliszkiewicz, M.; Żółtowska, K. Variations in Antioxidant Defense During the Development of the Solitary Bee Osmia bicornis. Apidologie 2015, 46, 432–444. [Google Scholar] [CrossRef]
- Ren, X.; Zou, L.; Zhang, X.; Branco, V.; Wang, J.; Carvalho, C.; Holmgren, A.; Lu, J. Redox Signaling Mediated by Thioredoxin and Glutathione Systems in the Central Nervous System. Antioxid Redox Signal 2017, 27, 989–1010. [Google Scholar] [CrossRef] [PubMed]
- Kumar, R.A.; Koc, A.; Cerny, R.L.; Gladyshev, V.N. Reaction Mechanism, Evolutionary Analysis, and Role of Zinc in Drosophila Methionine-R-Sulfoxide Reductase. J Biol Chem 2002, 277, 37527–37535. [Google Scholar] [CrossRef]
- Santos, D.E.; Souza, A.O.; Tiberio, G.J.; Alberici, L.C.; Hartfelder, K. Differential Expression of Antioxidant System Genes in Honey Bee (Apis mellifera L.) Caste Development Mitigates Ros-Mediated Oxidative Damage in Queen Larvae. Genet Mol Biol 2020, 43, e20200173. [Google Scholar] [CrossRef]
- Dzugan, M.; Tomczyk, M.; Sowa, P.; Grabek-Lejko, D. Antioxidant Activity as Biomarker of Honey Variety. Molecules 2018, 23, 2069. [Google Scholar] [CrossRef]
- Aurori, C.M.; Buttstedt, A.; Dezmirean, D.S.; Marghitas, L.A.; Moritz, R.F.; Erler, S. What Is the Main Driver of Ageing in Long-Lived Winter Honeybees: Antioxidant Enzymes, Innate Immunity, or Vitellogenin? J Gerontol A Biol Sci Med Sci 2014, 69, 633–639. [Google Scholar] [CrossRef]
- Paleolog, J.; Wilde, J.; Miszczak, A.; Gancarz, M.; Strachecka, A. Antioxidation Defenses of Apis Mellifera Queens and Workers Respond to Imidacloprid in Different Age-Dependent Ways: Old Queens Are Resistant, Foragers Are Not. Animals (Basel) 2021, 11, 1246. [Google Scholar] [CrossRef]
- Stabentheiner, A.; Kovac, H.; Brodschneider, R. Honeybee Colony Thermoregulation--Regulatory Mechanisms and Contribution of Individuals in Dependence on Age, Location and Thermal Stress. PLoS One 2010, 5, e8967. [Google Scholar] [CrossRef]
- Li, X.; Ma, W.; Shen, J.; Long, D.; Feng, Y.; Su, W.; Xu, K.; Du, Y.; Jiang, Y. Tolerance and Response of Two Honeybee Species Apis cerana and Apis mellifera to High Temperature and Relative Humidity. PLoS One 2019, 14, e0217921. [Google Scholar] [CrossRef]
- Pomatto, L.C.D.; Davies, K.J.A. Adaptive Homeostasis and the Free Radical Theory of Ageing. Free Radic Biol Med 2018, 124, 420–430. [Google Scholar] [CrossRef] [PubMed]
- Yan, L.J. Positive Oxidative Stress in Aging and Aging-Related Disease Tolerance. Redox Biol 2014, 2, 165–169. [Google Scholar] [CrossRef] [PubMed]
- Medina, R.G.; Paxton, R.J. De Luna, E.; Fleites-Ayil F.A.; Medina L.A.M.; Quezada-Euán J.J.G. Developmental Stability, Age at Onset of Foraging and Longevity of Africanized Honey Bees (Apis mellifera L.) under Heat Stress (Hymenoptera: Apidae). J. Thermal Biol 2018, 74, 214–225. [Google Scholar] [CrossRef] [PubMed]
- Groh, C.; Tautz, J.; Rössler, W. Synaptic Organization in the Adult Honey Bee Brain Is Influenced by Brood-Temperature Control During Pupal Development. PNAS 2004, 101, 4268–4273. [Google Scholar] [CrossRef]
- Tautz, J.; Maier, S.; Groh, C.; Rössler, W.; Brockmann, A. Behavioral Performance in Adult Honey Bees Is Influenced by the Temperature Experienced During Their Pupal Development. PNAS 2003, 100, 7343–7347. [Google Scholar] [CrossRef]
- Becher, M.A.; Scharpenberg, H.; Moritz, R.F. Pupal Developmental Temperature and Behavioral Specialization of Honeybee Workers (Apis mellifera L.). J Comp Physiol A Neuroethol Sens Neural Behav Physiol 2009, 195, 673–679. [Google Scholar] [CrossRef]
- Spivak, M.; Zeltzer, A.; Degrandi-Hoffman, G.; Martin, J.H. Influence of Temperature on Rate of Development and Color Patterns of Queen Honey Bees (Hymenoptera: Apidae). Environ Entomol 1992, 21, 364–370. [Google Scholar] [CrossRef]
- Ken, T.; Bock, F.; Fuchs, S.; Streit, S.; Brockmann, A.; Tautz, J. Effects of Brood Temperature on Honey Bee Apis mellifera Wing Morphology. Acta Zool Sin 2005, 51, 768–771. [Google Scholar]
- Elekonich, M.M. Extreme Thermotolerance and Behavioral Induction of 70-Kda Heat Shock Proteins and Their Encoding Genes in Honey Bees. Cell Stress Chaperon 2009, 14, 219–226. [Google Scholar] [CrossRef]
- Ward, K.; Cleare, X.; Li-Byarlay, H. The Life Span and Levels of Oxidative Stress in Foragers between Feral and Managed Honey Bee Colonies. J Insect Sci 2022, 22, 20. [Google Scholar] [CrossRef]
- Farahani, S.; Bandani, A.R.; Alizadeh, H.; Goldansaz, S.H.; Whyard, S. Differential Expression of Heat Shock Proteins and Antioxidant Enzymes in Response to Temperature, Starvation, and Parasitism in the Carob Moth Larvae, Ectomyelois ceratoniae (Lepidoptera: Pyralidae). PLoS One 2020, 15, e0228104. [Google Scholar] [CrossRef] [PubMed]
- Wos, G.; Willi, Y. Thermal Acclimation in Arabidopsis Lyrata: Genotypic Costs and Transcriptional Changes. J Evol Biol 2018, 31, 123–135. [Google Scholar] [CrossRef] [PubMed]
- Even, N.; Devaud, J.M.; Barron, A.B. General Stress Responses in the Honey Bee. Insects 2012, 3, 1271–1298. [Google Scholar] [CrossRef] [PubMed]
- Willot, Q.; Gueydan, C.; Aron, S. Proteome Stability, Heat Hardening and Heat-Shock Protein Expression Profiles in Cataglyphis Desert Ants. J Exp Biol 2017, 220(Pt 9), 1721–1728. [Google Scholar] [CrossRef]
- Borchel, A.; Komisarczuk, A.Z.; Rebl, A.; Goldammer, T.; Nilsen, F. Systematic Identification and Characterization of Stress-Inducible Heat Shock Proteins (Hsps) in the Salmon Louse (Lepeophtheirus Salmonis). Cell Stress Chaperones 2018, 23, 127–139. [Google Scholar] [CrossRef]
- Malmendal, A.; Overgaard, J.; Bundy, J.G.; Sorensen, J.G.; Nielsen, N.C.; Loeschcke, V.; Holmstrup, M. Metabolomic Profiling of Heat Stress: Hardening and Recovery of Homeostasis in Drosophila. Am J Physiol Regul Integr Comp Physiol 2006, 291, R205–12. [Google Scholar] [CrossRef]
- Khurshid, A.; Inayat, R.; Tamkeen, A.; Ul Haq, I.; Li, C.; Boamah, S.; Zhou, J.J.; Liu, C. Antioxidant Enzymes and Heat-Shock Protein Genes of Green Peach Aphid (Myzus persicae) under Short-Time Heat Stress. Front Physiol 2021, 12, 805509. [Google Scholar] [CrossRef]
- Miao, Z.Q.; Tu, Y.Q.; Guo, P.Y.; He, W.; Jing, T.X.; Wang, J.J.; Wei, D.D. Antioxidant Enzymes and Heat Shock Protein Genes from Liposcelis Bostrychophila Are Involved in Stress Defense Upon Heat Shock. Insects 2020, 11, 839. [Google Scholar] [CrossRef]
- Ju, R.T.; Wei, H.P.; Wang, F.; Zhou, X.H.; Li, B. Anaerobic Respiration and Antioxidant Responses of Corythucha ciliata (Say) Adults to Heat-Induced Oxidative Stress under Laboratory and Field Conditions. Cell Stress Chaperones 2014, 19, 255–262. [Google Scholar] [CrossRef]
- Gu, X.; Tian, S.; Wang, D.; Gao, F.; Wei, H. Interaction between Short-Term Heat Pretreatment and Fipronil on 2 Instar Larvae of Diamondback Moth, Plutella xylostella (Linn). Dose Response 2010, 8, 331–346. [Google Scholar] [CrossRef]
- Al-Ghzawi A.A.A.;, Al-Zghoul M.B.; Zaitoun S.; Al-Omary I.M.; Alahmad N.A. Dynamics of Heat Shock Proteins and Heat Shock Factor Expression During Heat Stress in Daughter Workers in Pre-Heat-Treated (Rapid Heat Hardening) Apis mellifera Mother Queens. J Therm Biol 2022, 104, 103194. [CrossRef] [PubMed]
- Harvey, J.A.; Heinen, R.; Gols, R.; Thakur, M.P. Climate Change-Mediated Temperature Extremes and Insects: From Outbreaks to Breakdowns. Glob Chang Biol 2020, 26, 6685–6701. [Google Scholar] [CrossRef] [PubMed]
- Panchuk, I.I.; Volkov, R.A.; Schoffl, F. Heat Stress- and Heat Shock Transcription Factor-Dependent Expression and Activity of Ascorbate Peroxidase in Arabidopsis. Plant Physiol 2002, 129, 838–853. [Google Scholar] [CrossRef] [PubMed]
- Jaquet, V.; Wallerich, S.; Voegeli, S.; Turos, D.; Viloria, E.C.; Becskei, A. Determinants of the Temperature Adaptation of Mrna Degradation. Nucleic Acids Res 2022, 50, 1092–1110. [Google Scholar] [CrossRef]
- Koo, H.N.; Lee, S.G.; Yun, S.H.; Kim, H.K.; Choi, Y.; S; Kim, G.H. Comparative Analyses of Cu-Zn Superoxide Dismutase (Sod1) and Thioredoxin Reductase (Trxr) at the Mrna Level between Apis mellifera L. And Apis cerana F. (Hymenoptera: Apidae) under Stress Conditions. J Insect Sci 2016, 16, 4. [CrossRef]
- de Sousa Abreu, R.; Penalva, L.O.; Marcotte, E.M.; Vogel, C. Global Signatures of Protein and Mrna Expression Levels. Mol Biosyst 2009, 5, 1512–1526. [Google Scholar] [CrossRef]
- Couto, N.; Wood, J.; Barber, J. The Role of Glutathione Reductase and Related Enzymes on Cellular Redox Homoeostasis Network. Free Radic Biol Med 2016, 95, 27–42. [Google Scholar] [CrossRef]
- Al-Ghzawi, A.A.A.; Zaitoun, S. Origin and Rearing Season of Honeybee Queens Affect Some of Their Physiological and Reproductive Characteristics. Entomol Res 2008, 38, 139–148. [Google Scholar] [CrossRef]
- Laidlaw, H.; Page, R. Queen Rearing and Bee Breeding. 1st edn. 1997, Vol. MI, p. 224. Wicwas Press, Kalamazoo.
- Pettis, J.S.; Rice, N.; Joselow, K.; vanEngelsdorp, D.; Chaimanee, V. Colony Failure Linked to Low Sperm Viability in Honey Bee (Apis mellifera) Queens and an Exploration of Potential Causative Factors. PLoS One 2016, 11, e0147220. [Google Scholar]
- McAfee, A.; Pettis, J.S.; Tarpy, D.R.; Foster, L.J. Feminizer and Doublesex Knock-Outs Cause Honey Bees to Switch Sexes. PLoS Biol 2019, 17, e3000256. [Google Scholar] [CrossRef] [PubMed]
Figure 1.
The expression levels (+ Standard Deviation) in ten non-heat-treated mother queens (nH-T MQ), kept for 15 min at 34.5 °C and 70% relative humidity (RH), and a pre-heat-treated mother queen group (pH-T MQ), kept for 15 min at 41 °C and 70% RH. The assessment was done by relative quantitative Real-Time qPCR (RT-qPCR) done on several antioxidant genes.
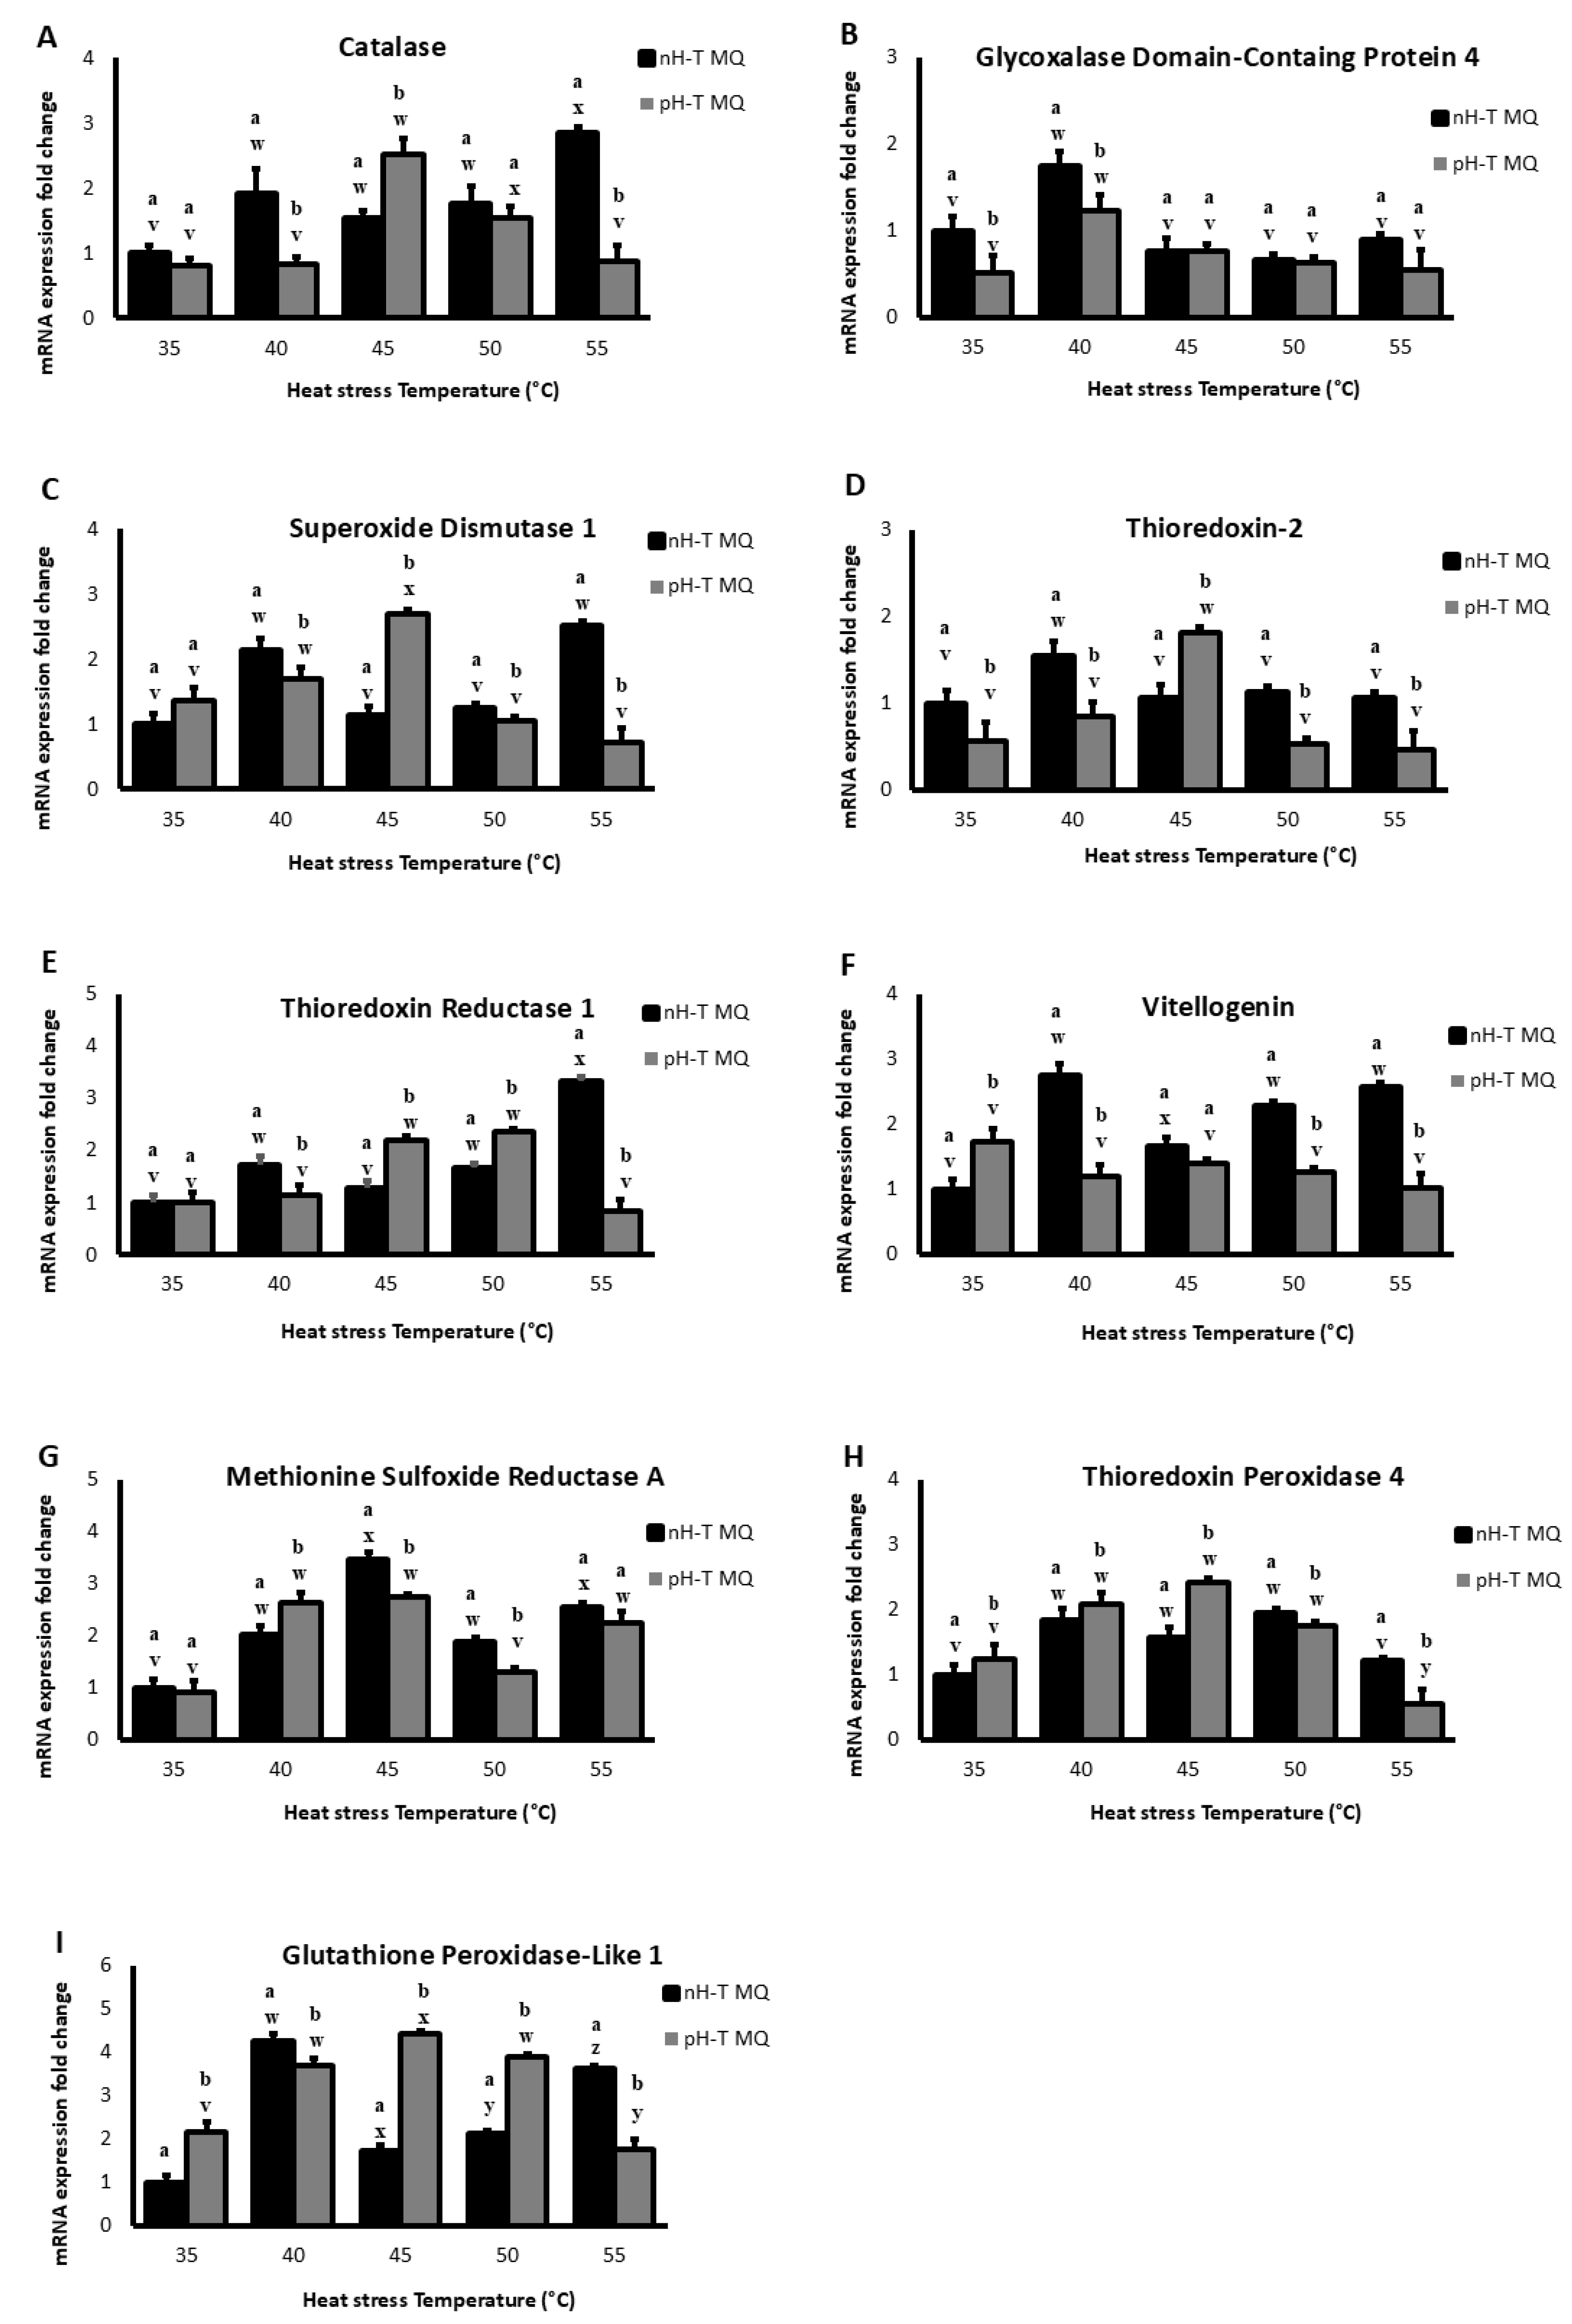
Figure 2.
The expression levels in ten non-heat-treated mother queens (nH-T MQ), kept for 15 min at 34.5 °C and 70% relative humidity (RH), and a pre-heat-treated mother queen group (pH-T MQ), kept for 15 min at 41 °C and 70% RH. The assessment was done by ELISA done on several antioxidant genes.
Figure 2.
The expression levels in ten non-heat-treated mother queens (nH-T MQ), kept for 15 min at 34.5 °C and 70% relative humidity (RH), and a pre-heat-treated mother queen group (pH-T MQ), kept for 15 min at 41 °C and 70% RH. The assessment was done by ELISA done on several antioxidant genes.
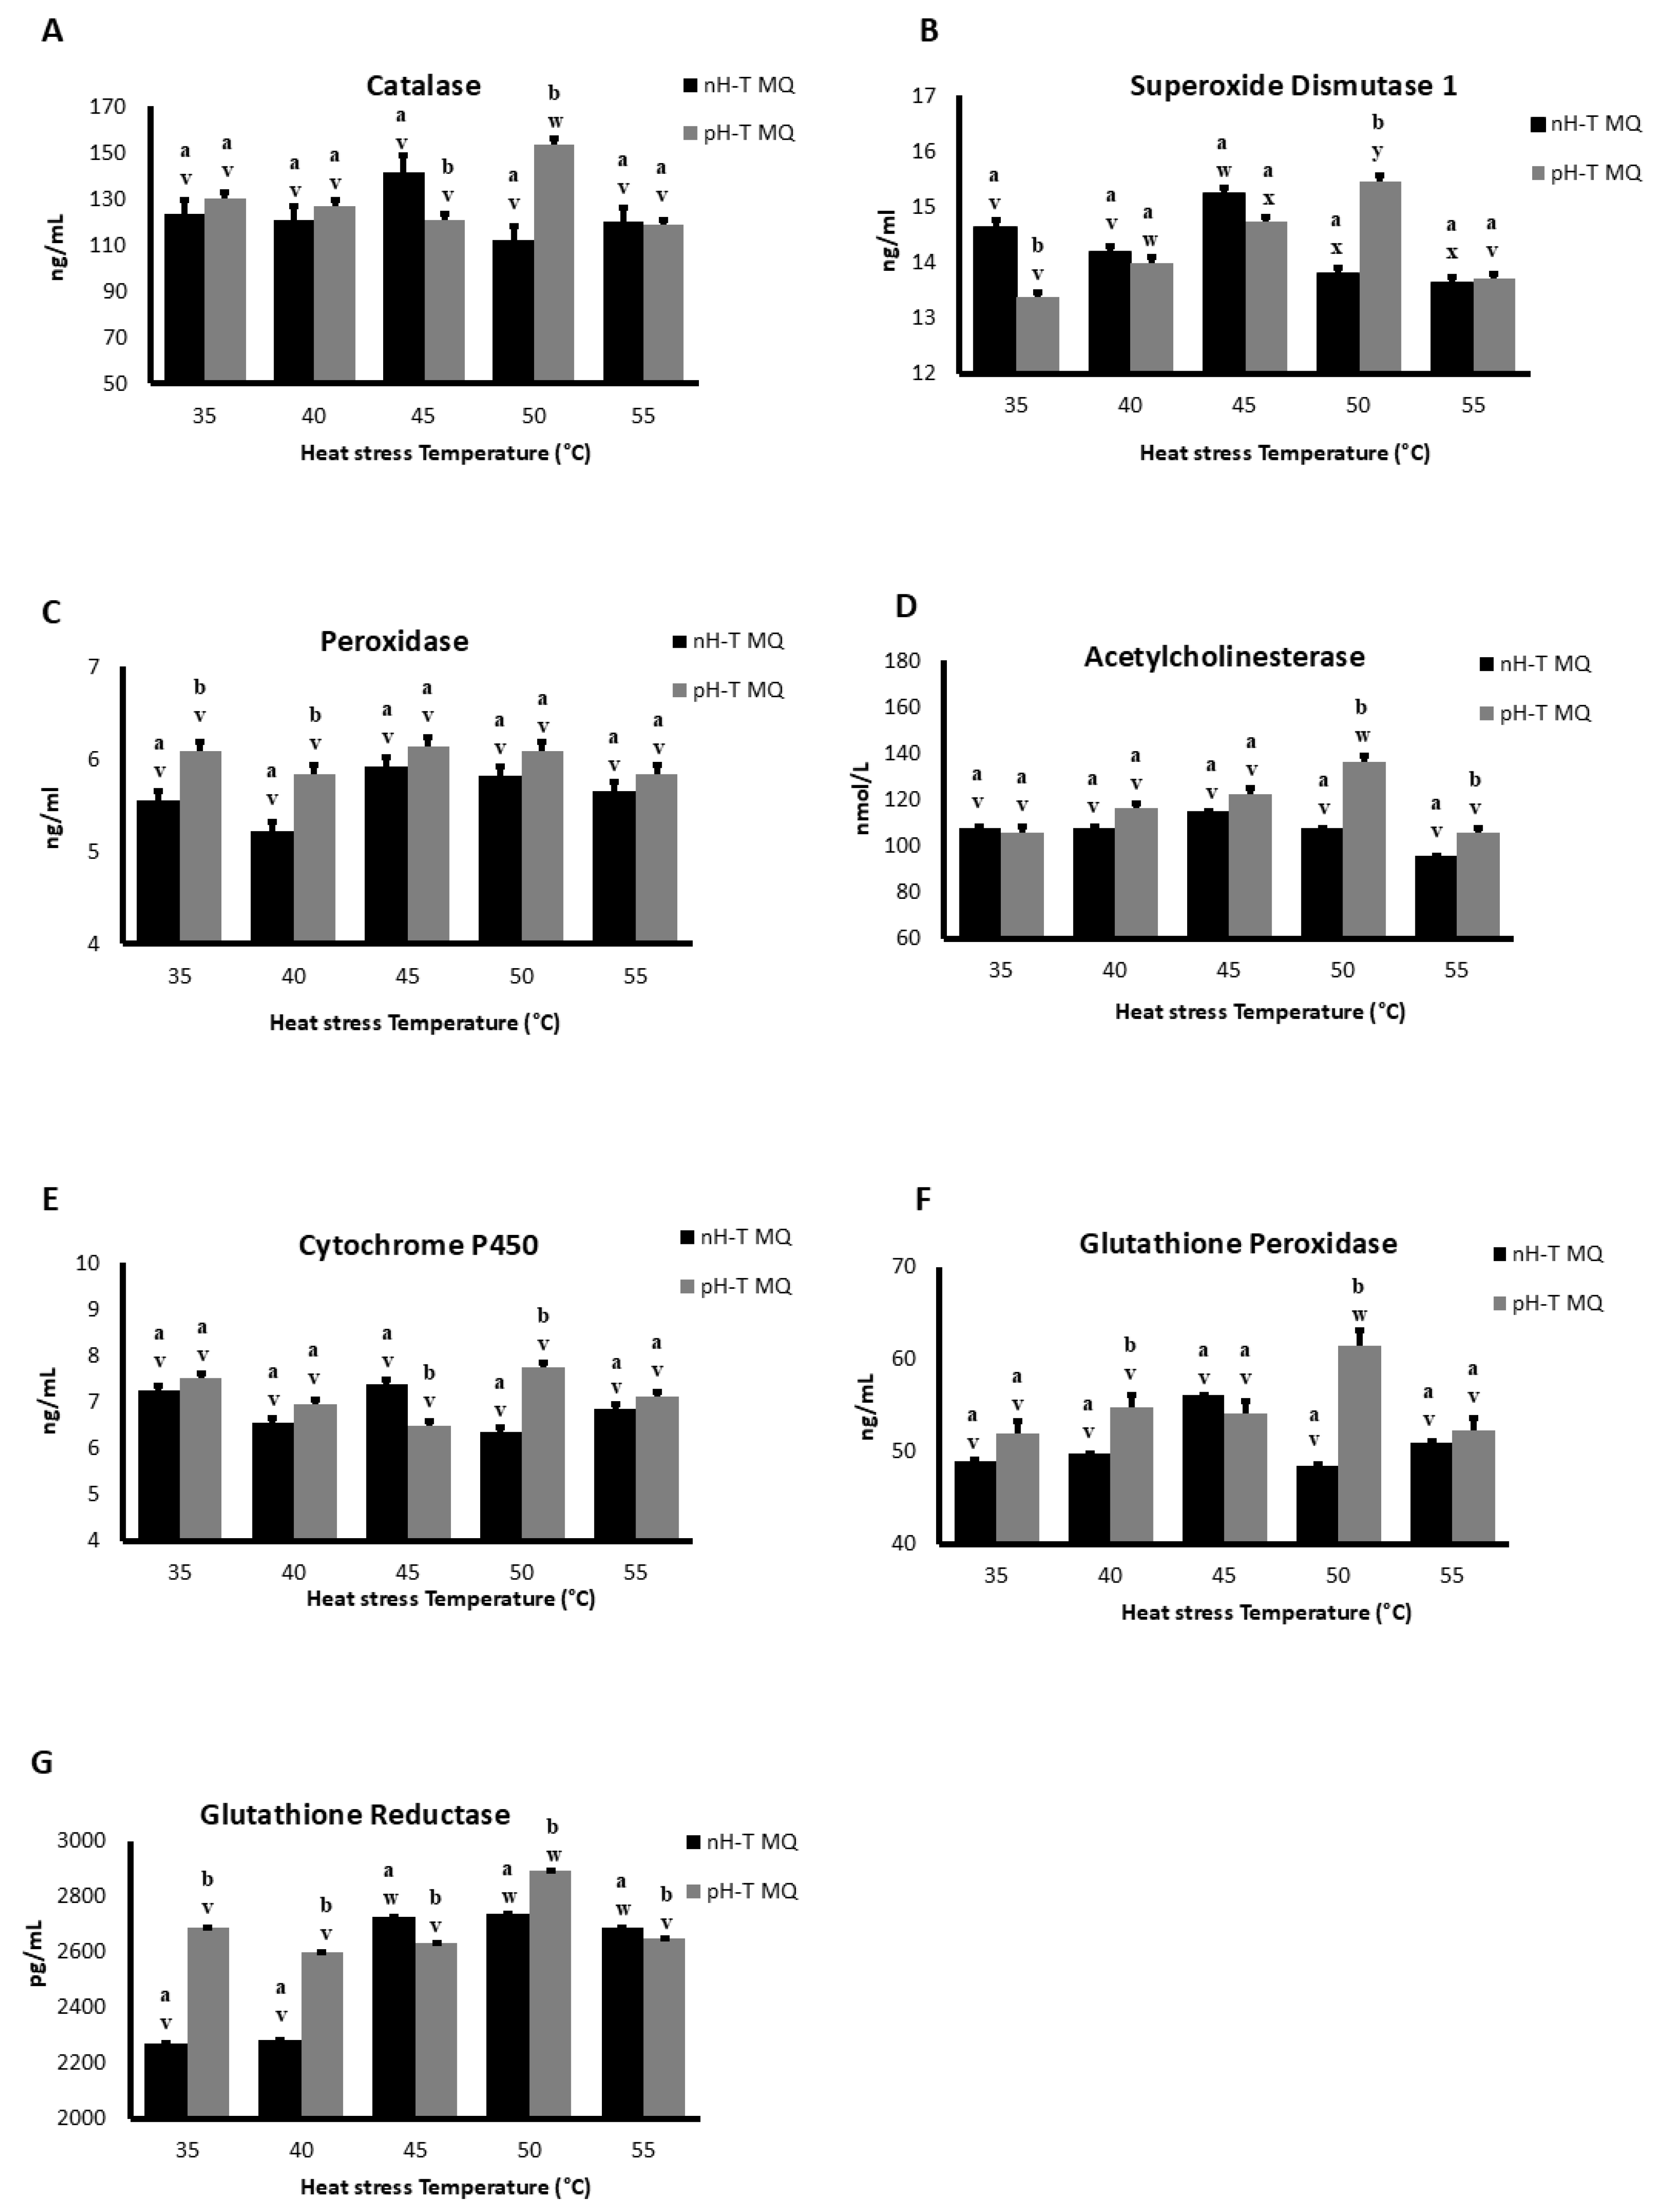

Table 1.
Primer sequences for genes related to oxidative stress response in honeybees.
| Gene | Forward (5’-3’) | Product size | Accession # |
|---|---|---|---|
| atalase (Cat) | F: ACGAAATCCTTCCGCTGACC R: AGCATGGACTACACGTTCCG |
106 | AF436842.1 |
| Glycosylase Domain-Containing Protein 4 (GLOD 4) | F: GGAATTTGCTGAAGGTTGCG R: TGAGTATCTTCTGTTCCATATCCTATC |
94 | XM_625097.3 |
| Superoxide Dismutase 1 (SOD 1) | F: CGTTCCGTGTAGTCGAGAAAT R: GGTACTCTCCGGTTGTTCAAA |
133 | NM_001178027.1 |
| Thioredoxin 2 (TrX 2) | F: GGTTTACCAAATTAAGAATGCCAGT R: GACCACACCACATAGCAAAGA |
98 | XM_003250360 |
| Thioredoxin Reductase 1 (TrxR 1) | F: CTGATTGCTGTAGGTGGTAGAC R: CCAGCACATTCTAAACCAATATATCC |
149 | NM_001178025 |
| Vitellogenin (Vg) | F: GAACCTGGAACGAACAAGAATG R: CGACGATTGGATGGTGAAATG |
98 | NM_001011578.1 |
| Methionine Sulfoxide Reductase (MsrA) | F: GGGCCGGTGATTGTTTATTTG R: CAACGACTTCTGTATGATCACCT |
113 | AY329360.1 |
| Thioredoxin Peroxidase 4 (Tpx 4) | F: ACCTGGAGCATTTCCTTATCC R: CGCTTGTTCTGGATCATCTTTG |
103 | NM_001170973.1 |
| Glutathione Peroxidase-like 1 (Gtpx 1) | F: ATGGTCAAGAACCGGGAAATAG R: GGATGCGCAGAATCTCCATTA |
109 | NM_001178022.1 |
| Glyceraldehyde-3-phosphate dehydrogenase 2 (GAPDH) | F: TGGCAAAGGTGCAGACTATAAA R: TGGCATGGTCATCACCAATAA |
131 | XM_393605.7 |
| β-Actin related protein 1 (β-Actin) | F: CTAGCACCATCCACCATGAAA R: AGGTGGACAAAGAAGCAAGAA |
97 | NM_001185146.1 |
Disclaimer/Publisher’s Note: The statements, opinions and data contained in all publications are solely those of the individual author(s) and contributor(s) and not of MDPI and/or the editor(s). MDPI and/or the editor(s) disclaim responsibility for any injury to people or property resulting from any ideas, methods, instructions or products referred to in the content. |
© 2025 by the authors. Licensee MDPI, Basel, Switzerland. This article is an open access article distributed under the terms and conditions of the Creative Commons Attribution (CC BY) license (http://creativecommons.org/licenses/by/4.0/).
Copyright: This open access article is published under a Creative Commons CC BY 4.0 license, which permit the free download, distribution, and reuse, provided that the author and preprint are cited in any reuse.


