
Submitted:
11 April 2025
Posted:
11 April 2025
You are already at the latest version
Abstract
Background/Objectives: Probiotics may be a promising strategy for treating metabolic disorders and obesity. This study aims to explore useful lactic acid bacteria with anti-obesity effects from grains. Methods: Three lactic acid bacterial strains with anti-adipogenic effects in C3H10T1/2 cells and possessing useful probiotic properties were administrated to mice on a high-fat diet. Lactiplantibacillus plantarum RP12 exhibiting a more pronounced anti-obesity effect was utilized for further studies. Results: Oral administration of Lactiplantibacillus plantarum RP12 resulted in reduced body weight gain and epididymal fat mass. Significant reductions in serum total cholesterol, triglycerides and blood glucose were observed in the group treated with Lactiplantibacillus plantarum RP12. This strain was found to regulate the expression of genes related to lipid metabolism in epididymal adipose tissue and liver, and induced changes in the composition of fecal microbiota. Notable differences in the compositions at the family, genus and species levels were evident between the HFD and RP12 groups. Specially, differences in proportions of some taxa reported to have association with obesity were observed between the two groups. Fecal analyses demonstrated that Lactiplantibacillus plantarum RP12 diminishes lipid absorption and augment the production of short-chain fatty acids in the intestine. Lactiplantibacillus plantarum RP12 mitigated damage to the morphology of the ileum and colon caused by a high-fat diet and promoted the expression of Claudin-1 and Muc2. Conclusions: Lactiplantibacillus plantarum RP12 has potential as a therapeutic probiotic to address metabolic disorders as well as obesity, substantiating the positive in vivo indicators and modulation of gut microbiota in a high-fat diet-induced obese mouse model.
Keywords:
Latilactobacillus plantarum
; probiotics
; obesity
; lipid metabolism
; microbiome
1. Introduction
Obesity is a complex disorder influenced by abnormal metabolism, which is shaped by genetic, environmental and psychosocial factors [1,2]. The rapid increase in obesity over decades poses a substantial threat to public health, leading to the development of metabolic syndrome, diabetes, fatty liver disease, cardiovascular diseases and other conditions [3,4]. Various approaches, including dietary, pharmacological and surgical strategies, have been deployed to manage obesity, and new drugs have recently garnered considerable attention [5,6]. Many recent studies have robustly linked obesity with alterations in the gut microbiome, characterized by specific bacterial compositions and functional changes [7,8,9]. Obesity-induced alterations in the gut microbial community are associated with enhanced dietary energy extraction [10] and modifications in fatty acid metabolism in adipose tissues and the liver [11,12]. Therefore, modulating the composition of gut microbiota could be a promising strategy for treating metabolic disorders and obesity [8,13,14].
Probiotics are live microorganisms that confer health benefits to the host when consumed adequately and are known to improve or restore the gut microbiota [15]. These benefits include reducing blood cholesterol and hypertension, modulating the immune system, and managing intestinal inflammatory diseases [15,16]. Several studies have demonstrated that probiotics also possess anti-adipogenic potential or prevent enhanced lipid accumulation [12,17,18]. Probiotics hold promise as an effective alternative for preventing metabolic diseases including obesity, and their mode of action potentially involves the modulation of the gut microbiota composition, thereby inducing beneficial changes in the intestinal environment [15,19]. The abilities to inhibit fatty acid synthesis, reduce inflammation in vivo and produce short-chain fatty acids are also key functions of probiotics in preventing or treating metabolic diseases [12,14,20]. Nevertheless, there is still a need to develop new probiotics with greater benefits for improving the intestinal environment and addressing gut microbiota dysbiosis.
Grains include fiber and oligosaccharides, making them excellent sources of prebiotics [21]. Grains are the most consumed staple food in Asia, indicating their importance as source of prebiotics for Asians. Lactic acid bacteria (LAB) inhabiting in grains may be the most beneficial in utilizing carbohydrates as prebiotics present in these grains, and several LAB species have been identified within them [21,22]. However, limited research has been conducted on the anti-obesity effects of LAB isolated from grains.
In our recent study, LAB strains were isolated from four types of grains and certain strains demonstrated enhanced anti-adipogenic effects in C3H10T1/2 cells, alongside fundamental probiotic properties such as viability in acid and bile salts and strong adhesion to Caco-2 cells [22]. This study aims to explore the anti-obesity effects of three LAB strains using various biomarkers in a high-fat diet mouse model. From the findings, Lactiplantibacillus plantarum RP12 has been confirmed as a potential therapeutic probiotic agent due to its ability to inhibit adipogenesis, modulate the gut microbiome and other beneficial properties.
2. Materials and Methods
2.1. Bacterial Strain Preparation and Growth Conditions
Pediococcus pentosaceus K28, Lactiplantibacillus plantarum RP12, Levilactobacillus brevis RP21 and Lacticaseibacillus rhamnosus GG were obtained from our previous study22 and routinely cultivated on De Man-Rogosa-Sharpe (MRS, BD Difco, Sparks, MD, USA) agar at 30°C for 24 h. They were maintained at −80°C in 20% glycerol (v/v; Georgiachem, GA, USA) for long-term cryopreservation.
2.2. Animals, Diets and Experimental Design
The animal care and studies of the experimental mice were conducted in accordance with the guidelines and approval of the Animal Care and Use Committee of the College of Biotechnology at Sungkyunkwan University (approval date: 07-09-2019, approval number: SKKUIACUC-20-02-10-2) and reported in accordance with ARRIVE guidelines. For the pilot experiment, male C57BL/6J mice aged 5 weeks were procured from RaonBio Inc (Yongin, Republic of Korea) and housed under controlled conditions of temperature and humidity (24 ± 2°C, 50 ± 10%) with a 12 h light/dark cycle. Following a 1-week acclimation period, 5-week-old mice were randomly assigned to 5 groups (n = 3/group): high-fat diet (HFD), high-fat diet plus Lacticaseibacillus rhamnosus GG (LGG), high-fat diet plus Pediococcus pentosaceus K28 (K28), high-fat diet plus Lactiplantibacillus plantarum RP12 (RP12) and high-fat diet plus Levilactobacillus brevis RP21 (RP21). The HFD group received a high-fat diet (HFD, 60% of energy from fat, 21.9 kJ, RaonBio Inc) for 7 weeks. Concurrently, the LGG, K28, RP12 and RP21 groups received the same HFD for 7 weeks and received daily oral doses of Lacticaseibacillus rhamnosus GG, Pediococcus pentosaceus K28, Lactiplantibacillus plantarum RP12 and Levilactobacillus brevis RP21, respectively. Food and water were provided ad libitum.
In a subsequent experiment using Lactiplantibacillus plantarum RP12, male C57BL/6J mice aged 5 weeks were purchased from RaonBio Inc (Yongin, Republic of Korea) and maintained in conditions controlled for temperature and humidity (24 ± 2°C, 50 ± 10%) with a 12 h light/dark cycle. After a 1-week acclimation period, these 5-week-old mice were randomly divided into 2 groups (n = 7/group): high-fat diet (HFD) and high-fat diet plus Lactiplantibacillus plantarum RP12 (RP12). The HFD group received a high-fat diet (HFD, 60% of energy from fat, 21.9 kJ, RaonBio Inc) for 10 weeks. The RP12 group, likewise on an HFD for 10 weeks, received Lactiplantibacillus plantarum RP12 through daily oral administration.
Live LAB cells were administered daily via oral gavage at a concentration of 109 CFU per 200 μL 0.85% saline, as recommended by the WHO and the Korea Food and Drug Administration. Throughout the experiment, food intake and body weight were monitored weekly. Fecal samples were collected after 10 weeks and stored at −80°C. The food efficiency ratio (FER) was calculated as the total body weight gain from the diet divided by the total diet consumed during the animal experiments. For the glucose tolerance test (GTT), mice were fasted for 12 hours in the 9th week. Blood glucose levels were assessed from tail vein blood at intervals of 0, 15, 30, 60, 90, 120, 150 and 180 min following intraperitoneal glucose injection (2 g/Kg). At the conclusion of the experiment, the mice were fasted for 16 h and euthanized. Following euthanasia, the visceral organs (liver, spleen, kidney, colon and ileum) and the epididymal fat pad were collected and weighed. Epididymal fat pad, liver, colon and ileum were preserved by freezing in liquid nitrogen for subsequent genetic analysis. Blood was drawn via cardiac puncture and centrifuged for 10 min at 3,000 rpm to separate serum.
2.3. Serum Analysis
Levels of alanine transaminase (ALT), aspartate transaminase (AST), total cholesterol, glucose, triglyceride (TG), high-density lipoprotein (HDL) and low-density lipoprotein (LDL) were measured using a biochemical automatic analyzer (AU480, Beckman Coulter Inc., Brea, CA, USA) following the manufacturer’s instructions.
2.4. RNA Extraction and Quantitative Real-Time Polymerase Chain Reaction (RT-PCR)
Total RNA was extracted from epididymal fat tissue, liver, ileum and colon using an RNeasy Mini Kit (Qiagen, Hilden, Germany) and TRIzol (Invitrogen, Carlsbad, CA, USA) according to the manufacturer’s protocol. First-strand complementary DNA was synthesized using a Veriti™ 96-Well Thermal Cycler machine (Thermo Scientific, Waltham, MA, USA) by mixing the extracted total RNA with ReverTra Ace Master Mix (Toyobo, Osaka, Japan). A mixture of Power SYBR Premix ExTaq (RP041A; Takara, Shiga, Japan), primers and cDNA was employed for amplification using a thermal cycler machine (Takara). Gene expression was normalized to a house-keeping gene, 36B4. The primer sequences for the genes Scd1, Ucp2, Aox1, Acot1, Claudin-1 and Muc2 are listed in previous studies [23,24,25,26,27,28]. The primer sequences for other genes are detailed in an earlier study [12].
2.5. 16S rRNA Gene Sequence Analysis of Gut Microbiota and Bioinformatics
For microbiome analysis, total genomic DNA was extracted from fecal samples using a QIAamp DNA Stool Mini Kit (Qiagen) following the manufacturer’s protocol. The initial amplification off the total genomic DNA was conducted in the V3 to V4 regions with primer sequences of the 16S rRNA gene, as previously reported [12,29]. Subsequently, a second amplification was performed by attaching an Illumina NexTera barcode to the product of first amplification. The sequencing was carried out according to the method of Chunlab Inc. (Seoul, Republic of Korea) using an Illumina MiSeq sequencing system (Illumina, San Diego, CA, USA). Taxonomic profiling and sequencing data analysis were performed using the Illumina platform (Chunlab Inc.) and as previously described [30]. Alpha diversity was assessed using OTU information and is expressed via the Chao 1 and Shannon index. The structure of the microbiota across different groups was analyzed using principal coordinate analysis (PCoA) at the genus level utilizing the beta diversity index. The linear discriminant analysis effect size (LEfSe) technique was implemented using a Latent Dirichlet Allocation (LDA) score threshold of 3.0 and a p-value < 0.05. The relative abundance (%) of bacteria at various taxonomic levels was quantified and compared.
2.6. Quantitative Analyses of Lipids and Short-Chain Fatty Acids
2.7. Histological Analysis of Colon and Ileum
Tissues from the colon and ileum were stained with hematoxylin and eosin (H&E) as according to methods described earlier in reference [32].
2.8. Statistical Analysis
Statistical analyses were performed using SPSS ver. 19.0 (SPSS Inc., Chicago, IL, USA). Data are presented as mean ± SEM. Statistical significance in gene expression differences between experimental groups in animals was determined by an unpaired Student’s t-test. For relative abundance analysis of the gut microbiome, significant differences between groups were assessed using the Wilcoxon rank-sum test. Values were considered statistically significant when p < 0.05.
3. Results
3.1. Effects of Lacticaseibacillus rhamnosus GG, Pediococcus pentosaceus K28, Lactiplantibacillus plantarum RP12 and Levilactobacillus brevis RP21 on Body
Over a period of 7 weeks, variations in body weight were monitored across different groups of mice. The group fed an HFD exhibited a more rapid weight gain (Figure S1A). After 7 weeks, the average weight gain in the HFD group was 14.21 ± 1.83 g, whereas those in the LGG, K28, RP12 and RP21 groups were 12.70 ± 1.64 g, 11.88 ± 3.01 g, 10.43 ± 0.73 g and 11.97 ± 1.75 g, respectively (Figure S1B). Relative to the HFD group, the weight gains in the LGG, K28, RP12 and RP21 groups decreased by 10.6, 16.4, 26.6 and 15.8 %, respectively (Figure S1B). No significant differences in FER were observed between the LGG, K28.RP12 and RP21 groups compared to the HFD group (data not shown). After 60 min, blood glucose levels were significantly lower in the RP12 and RP21 groups compared to the HFD group (p < 0.001 or 0.01) (Figure S1C). The areas under the blood glucose response curve (AUC) for the LGG, RP12 and RP21 groups were significantly lower than that of the HFD group (p < 0.05 or 0.001) (Figure S1D).
3.2. Effects of Lactiplantibacillus plantarum RP12 on Body, Visceral Organs and Fat Tissue Weight
In another experiment lasting 10 weeks and involving only HFD and RP12 groups, body weight changes were observed. After 10 weeks, the average weights of the HFD and RP12 groups were 36.59 ± 0.76 g and 31.57 ± 0.52 g, respectively (Figure 1A). Starting from week 4, substantial weight differences between the HFD and RP12 groups were noted, with significant levels noted (p < 0.05, 0.01 or 0.001) (Figure 1A). The average weight gain after 10 weeks in the RP12 group was significantly less, at 12.64 ± 0.53 g compared to 17.54 ± 0.55 g in the HFD group (p < 0.001) (Figure 1B). No significant difference was observed in food intake between the two groups (Figure 1C). The FER significantly decreased in the RP12 group as compared to the HFD group (Figure 1D). After 60 min, blood glucose levels in the RP12 group were significantly lower compared to the HFD group (p < 0.05), and the area under the blood glucose response curve (AUC) for the RP12 group was significantly lesser than that of the HFD group (p < 0.01) (Figs. 1E and 1F). No significant changes were observed in the weights of organs including liver, spleen and kidney between the HFD and RP12 groups (Figure 1G). However, the epididymal fat mass significantly decreased in the RP12 group compared to the HFD group (p < 0.01) (Figure 2G).
3.3. Effects of Lactiplantibacillus plantarum RP12 on Serum Biochemical Parameters
The serum concentrations of total cholesterol and glucose in the RP12 group were significantly lower (p < 0.05) than those in the HFD group (Table 1). Compared with the HFD group, serum levels of TG, LDL, AST and ALT were reduced in the RP12 group (Table 1; Figure S2). Total cholesterol decreased by 7.9% (p < 0.05) and glucose decreased by 35.9% (p < 0.05) in the RP12 group. Relative to the HFD group, there was a 3% increase in HDL and reductions of 11.4% in TG and 17.2% in LDL in the RP12 group, although these differences were not statistically significant. Both ALT and AST levels decreased in the RP12 group, but the differences were not significant between the two groups (Figure S2).
3.4. Effects of Lactiplantibacillus plantarum RP12 on Genes Involved in Lipid Metabolism in Epididymal Fat Tissue and Liver
The results for the mRNA expression of genes involved in lipid metabolism in epididymal fat tissue and liver are presented in Figure 2. In the epididymal fat tissue of the RP12 group, there was a decrease in expression of certain genes associated with lipid metabolism compared to the HFD group (Figure 2A). When compared to the HFD group, the administration of Lactiplantibacillus plantarum RP12 significantly down-regulated (p < 0.01 or 0.05) fatty acid synthetase (Fas), stearoyl-Coenzyme A desaturase 1 (Scd1) and CCAAT-enhancer-binding protein-α (Cebpα) which are genes related to fatty acid synthesis (Figure 2A). In the RP12 group, there was a significant decrease (p < 0.01 or 0.05) in the expression of genes for lipoprotein-lipase (Lpl) and cluster of differentiation 36 (Cd36) which are related to membrane transport (Figure 2A). Additionally, expressions of adipocyte protein 2 (aP2) and sterol regulatory element-binding protein-1C (Srebp-1C) were also reduced in the RP12 compared to the HFD (Figure 2A). The expressions of tumor necrosis factor-alpha (Tnfα) (p < 0.01), monocyte chemoattractant protein-1 (Mcp1) (p < 0.05), and interleukin 6 (Il-6) (p < 0.05), associated with pro-inflammatory cytokines, were significantly reduced in the RP12 group compared to the HFD group (Figure 2B). To explore the effects of Lactiplantibacillus plantarum RP12 on lipid metabolism in the liver, a comprehensive analysis of related gene expressions was conducted (Figure 2C). In comparison with HFD, the expressions of genes associated with lipid production, Srebp1C (p < 0.01), Fas (p < 0.01) and Scd1 (p < 0.05), were notably decreased in the RP12 group (Figure 2C). In addition, there was a significant increase (p < 0.05) in the expressions of β-oxidation-related genes, including carnitine palmitoyltransferase1 alpha (Cpt1α), uncoupling protein (Ucp2), acyl coenzyme A oxidase 1 (Aox1) and acyl coenzyme A thioesterase 1 (Acot1), in the RP12 group (Figure 2D).
3.5. Effects of Lactiplantibacillus plantarum RP12 on Changes in Ratio and Composition of Fecal Microbiota
The alpha diversity indices (Shannon and Chao1) and beta diversity index (PCoA) between HFD and RP12 groups were calculated. No significant changes in alpha diversity were observed between the two groups (Figures S3A & S3B). PCoA analysis using generalized UniFrac distances clearly demonstrated spatial separation between the microbial communities of the HFD and RP12 groups (Figure S3C).
Fecal compositions of the two dominant phyla, Bacillota and Bacteroidota, from the HFD and RP12 groups were compared after 10 weeks. The ratio of Bacillota and Bacteroidota was similar in both groups (data not shown). No significant differences were observed in the relative abundances of Bacillota and Bacteroidota between the HFD and RP12 groups (Figure 3A). However, significant differences were found in the compositions of families, genera, and species between the two groups. Specifically, significant reductions (p < 0.05) were observed in the levels of Streptococcaceae and Peptostreptococcaceae in the RP12 group, whereas levels of Coriobacteriaceae (p < 0.09) and Lactobacillaceae (p < 0.01) increased in the RP12 group, as compared to the HFD group (Figure 3B).
LEfSe analysis was performed to identify specific bacterial genera and species that were dominant in the HFD and RP12 groups (Figure S4). Consequently, significant differences in the compositions of major genera and species were observed between the two groups (Figure S4). Specifically, the proportions of genera Anaerotruncus, Romboustia, Lactococcus, Harryflintia, Enterorhabdus and Gemella were significantly higher in the HFD group than in the RP12 group (Figure 4). Conversely, the proportions of genera Lactobacillus, Olsenella and Clostridium were significantly higher in the RP12 group than in the HFD group (Figure 4; Figure S4). Significant decreases (p < 0.01 or 0.05) in levels of Streptococcus acidominimus and Romboutsia timonensis and significant increases (p < 0.01 or 0.05) in levels of Olsenella PAC001059_s, Clostridium cocleatum, Bacteroides faecichinchillae, Lactobacillus brevis and Lactiplantibacillus plantarum were observed in the RP12 group (Figure 5). The elevated abundance of Lactiplantibacillus plantarum in the RP12 group might be attributed to the administration of Lactiplantibacillus plantarum RP12 followed by its colonization in the intestine.
3.6. Concentrations of Lipids and Short-Chain Fatty Acids in Feces
The lipids and three short-chain fatty acids (acetic acid, propionic acid and butyric acid) were quantitatively analyzed in the feces collected from mice after 10 weeks. The fecal lipid content (21.74 ± 0.26 mg/g) in the RP12 group was 41.5% higher than that (15.36 ± 0.30 mg/g) in the HFD group (Figure 6). The RP12 group demonstrated only a minor increase in acetic acid levels compared to the HFD group (Figure 6). Levels of butyric acid and propionic acid were significantly higher (p < 0.05) in the RP12 group than in the HFD group (Figure 6).
3.7. Histological Assessment of Colon and Ileum
The effects of administering Lactiplantibacillus plantarum RP12 on the intestine were evaluated by hematoxylin and eosin staining of the colon and the ileum, with histological parameters displayed in Figure 7A & Figure 7B. The findings indicated that the villi in both the ileum and colon of the HFD group were damaged and shortened, whereas in the RP12 group, the villi morphology in these structures was well preserved. The mRNA expression levels of two genes, Claudin-1 and Muc2, in the colon and ileum are depicted in Figure 7C & Figure 7D. In comparison to the HFD group, the group treated with Lactiplantibacillus plantarum RP12 exhibited significant increases (p < 0.05 or p = 0.05 - 0.07) in the expression of Claudin-1 and Muc2 (Figure 7C & Figure 7D).
4. Discussion
Probiotics have been garnering attention as alternatives to pharmacological drugs, which may lead to serious side effects in the treatment of obesity [14,33,34]. The metabolic alleviation of obese phenotypes by probiotics has been shown to be induced mainly through host metabolism and gut microbiota modulation [12,35,36]. Lactic acid bacteria with anti-obesity effects have been isolated from various habitats including intestines, kimchi, breast milk and fermented foods [30,34,37,38]. In our previous study, numerous lactic acid bacteria were isolated from grains and subjected to an anti-adipogenic assay using C3H10T1/2 cells [22]. Of these, three lactic acid bacterial strains, Pediococcus pentosaceus K28, Lactiplantibacillus plantarum RP12 and Levilactobacillus brevis RP21, were identified as potential probiotic candidates due to their useful probiotic properties and anti-adipogenic effects in in vitro assays. The current study evaluated the anti-obesity effects of these three LAB strains in an obese mouse model. In mice experiments involving the three LAB strains, Pediococcus pentosaceus K28, Lactiplantibacillus plantarum RP12 and Levilactobacillus brevis RP21, there was a significant decrease in weight gain compared with the LGG and HFD group (Figures S1A & S1B). Specifically, Lactiplantibacillus plantarum RP12 exhibited a more pronounced anti-obesity effect than the other two strains, leading to further investigations including a second mouse experiment for 10 weeks. After 10 weeks, the average weight gain of the RP12 group decreased significantly (p < 0.001) by 27.9% compared with the HFD group (Figure 1B). Lactiplantibacillus plantarum RP12 significantly (p < 0.01) reduced epididymal fat mass and slightly the liver weight (Figure 2G). These results confirm that Lactiplantibacillus plantarum RP12 exhibits significant anti-obesity effects. Several studies have demonstrated that lactic acid bacteria influence lipid metabolism in adipose tissue by regulating the expression of lipid metabolism-related enzymes [12,39,40]. A reduction in gene expressions related to lipid metabolism in epididymal adipose tissue and a decrease in pro-inflammatory gene expression in the same tissue were also observed in this study, corroborating previous findings (Figure 2A & Figure 2B). Although no significant weight change was observed in the liver between the HFD and RP12 groups, significant decreases in the expression of genes related to lipid production and significant increases in the expression of β-oxidation-related genes were observed in the liver of the RP12 group (Figure 2C and Figure 2D). These outcomes in the liver, treated with LAB, have also been documented previously [12]. Accordingly, Lactiplantibacillus plantarum RP12 is anticipated to exhibit anti-obesity effects by reducing lipid accumulation in adipose tissue and alleviating chronic hypo-inflammation in the same tissue (Figure 2). Lactiplantibacillus plantarum RP12 decreased levels of total blood cholesterol, LDL and blood glucose. Elevated levels of total blood cholesterol and blood glucose have consistently been linked to obesity and dyslipidemia in the obesity-induced model [41]. Several LAB strains have been discovered to lower blood cholesterol levels [42,43,44]. It has been demonstrated that cholesterol not absorbed in the small intestine may be transformed into other compounds by gut microbes, thereby reducing cholesterol levels in the body [45]. In this study, it is proposed that the gut microbiota, modulated by Lactiplantibacillus plantarum RP12, may contribute to lower blood cholesterol levels.
Changes in the gut microbiota profile may control obesity by affecting energy harvesting and storage [34]. Many studies have confirmed changes in the diversity and composition of gut microbiota in obesity states [46,47]. In this study, no significant differences in diversity indices and richness estimators of the fecal microbiota were found between the RP12 and HFD groups, although clear differences in the composition of the dominant microbial community in the feces were observed between the two groups (Figure 3, Figure 4 and Figure 5). After long-term administration of a high-fat diet, dysbiosis of the gut microbiota was observed, contrasting with the RP12 group (Figure 3, Figure 4 and Figure 5). Although there was no clear difference in the proportions of the phyla Bacillota and Bacteroidota between the RP12 and HFD groups, the two groups exhibited distinct differences in the relative abundances of certain taxa at lower taxonomic levels. At more detailed taxonomic levels, both the HFD and RP12 groups showed alterations in several bacterial taxa associated with obesity-related dysbiosis (Figure 3, Figure 4 and Figure 5). The proportions of two families Streptococcaceae and Peptostreptococcaceae were shown to increase in mice fed a high-fat diet [48,49]. Specifically, the increase in the family Streptococcaceae is known to be associated with the development of obesity, metabolic disorders and diabetes [50,51]. The proportion of the genus Lactocccus, belonging to the family Streptococcaceae, is significantly correlated with inflammation and insulin resistance, and a reduction in Streptococcaceae/Lactococcus may play a crucial role in preventing metabolic disorders [51]. The family Coriobacteriaceae is reported to produce short-chain fatty acids, particularly butyric acid [52,53,54], and is considered a potential contributor to various beneficial functions, such as glucose homeostasis and bile acid and lipid metabolism, in the host [55]. Accordingly, differences in the abundance of several families between the HFD and RP12 groups might influence to metabolic properties, consistent with previous findings. The differences in the composition of major bacterial genera and species between the HFD and RP12 groups were evident from LEfSe analysis (Figure S4). The genus Anaerotruncus, which is prevalent in the HFD group, is known to be associated with obesity [56,57]. It is significantly positively correlated with liver weight gain and the accumulation of epididymal or perirenal fat, and significantly negatively correlated with fecal SCFA levels [58]. The genus Romboutsia was found to be significantly increased in the obese group and was positively associated with blood glucose levels, fat intake ratios and BMI [59,60]. A Romboutsia-enriched microbiota displayed dysbiosis-like features, unlike the commensal group [59]. Additionally, Enterorhabdus and Gemella have also been reported to be positively associated with the prevalence of obesity [61,62]. The genus Olsenella, abundant in the RP12 group, is known to be diminished in patients with inflammatory bowel disease (IBD) and in high fat-diet induced groups, and serves as beneficial bacteria for SCFA production [63,64]. Clostridium cocleatum, also abundant in the RP12 group, showed a significant increase following metformin treatment in HFD mice and was positively correlated with several metabolic biomarkers [65]. Bacteroides faecichinchillae is commonly found in non-obese individuals compared to obese individuals and has a significant association with a lean body type [30,66]. The findings from this study demonstrate that changes in specific gut microbiota are correlated with biomarker outcomes in our mouse model, confirming the mechanism of obesity inhibition.
In this study, the fecal lipid content of the RP12 group was analyzed to be higher than that of the HFD group (Figure 6A). Differences in intestinal lipid absorption are considered as possible mechanism for the decreased weight gain [67]. It is possible that Lactiplantibacillus plantarum RP12 can suppress obesity induced by a high-fat diet by inhibiting lipid absorption. Short-chain fatty acids (SCFAs) have been shown to prevent body weight gain induced by a high-fat diet through the modulation of gut microbiota and their beneficial roles in host health [68,69]. Changes were observed in the concentrations of SCFAs such as acetic acid, propionic acid and butyric acid in feces between the RP12 and HFD groups (Figure 6B). Certain gut microbes are capable of producing SCFAs through the digestion of various types of carbohydrates [70,71]. It has been reported that Lactobacillus species can indirectly enhance the production of SCFAs through modulation of the gut microbiota as demonstrated in this study [30,72]. Researches have indicated that butyric acid and propionic acid reduce food intake and obesity induced by a high-fat diet, and help prevent glucose intolerance [73,74,75]. Our findings suggest that the modulation of gut microbiota by Lactiplantibacillus plantarum RP12 may influence the production of SCFAs as well as changes in microbial taxa. An increased proportion of Clostridia, an important producer of butyric acid in the intestine [30,76], was observed in the RP12 group, suggesting that Lactiplantibacillus plantarum RP12 plays a role in this increase of Clostridia. It has also been shown that intake of Lactiplantibacillus plantarum RP12 could mitigate damage to the intestinal barrier caused by a high-fat diet (Figure 7). A high-fat diet may influence intestinal permeability by affecting bacterial overgrowth in the small intestine and impacting nervous and metabolic processes [77]. Gene expression of Claudin-1 and Muc2 in the colon and ileum tended to increase in the RP12 group compared to the HFD group (Figure 7). Claudin-1 is one of the tight junction proteins that regulate permeability in the intestine, and its expression has been associated with a reduction in colon cancer [78]. Muc2 is mucin secreted from the ileum and colon and its deficiency is associated with disruption of epithelial homeostasis and the development of colon cancer [79,80]. Based on the findings of this study, Lactiplantibacillus plantarum RP12 is concluded to mitigate obesity by lowering the metabolic disturbances through alterations in biomarkers in obese mouse model and modulation of the gut microbiota.
5. Conclusions
In this study, three lactic acid bacterial strains were used to investigate the anti-obesity effect in a high-fat diet mouse model, and Lactiplantibacillus plantarum RP12 was selected for the various studies including additional mouse experiment. Lactiplantibacillus plantarum RP12 was found to inhibit adipogenesis by regulating the gene expressions related to lipid metabolism in the epididymal adipose tissue and liver of high-fat diet mice. Fecal analyses indicated that Lactiplantibacillus plantarum RP12 could exert its anti-obesity effects through the modulation of gut microbiota and by reducing lipid absorption and enhancing SCFA production in the intestine. It may be a viable alternative for alleviating metabolic disorders and obesity caused by dysbiosis. Further research and clinical studies are necessary to assess its applicability and efficacy in humans.
Supplementary Materials
The following supporting information can be downloaded at website of this paper post on Preprints.org, Figure S1: Effects of Lacticaseibacillus rhamnosus GG, Pediococcus pentosaceus K28, Lactiplantibacillus plantarum RP12 and Levilactobacillus brevis RP21 on high fat diet-induced obese mouse model; Figure S2: Effects of Lactiplantibacillus plantarum RP12 on serum AST and serum ALT; Figure S3: Alpha diversity indexes and PCoA between HFD and RP12 groups; Figure S4: Differentially represented genus and species between RP12 and HFD groups through linear discriminant analysis effect size (LEfSe) analysis.
Author Contributions
Conceptualization, J.H.Y.; methodology, C.W.J., H.Y.L., H.S.K. and M.J.S.; software, C.W.J. and M.J.S.; validation, H.Y.L.; formal analysis, M.J.S.; investigation, H.S.K.; resources, M.J.S.; data curation, J.H.Y.; writing—original draft preparation, J.H.Y.; writing—review and editing, C.W.J., H.Y.L. and J.H.Y.; visualization, M.J.S.; supervision, K.W.P. and J.H.Y.; project administration, J.H.Y.; funding acquisition, J.H.Y. All authors have read and agreed to the published version of the manuscript.
Funding
This research was funded by the project on survey of indigenous species of Korea of the National Institute of Biological Resources (NIBR) under the Ministry of Environment, “Cooperative Research Program for Agriculture Science and Technology Development (project no. RS-2024-00435566)” of the Rural Development Administration, and the BK21 Program of the Ministry of Education, Republic of Korea.
Institutional Review Board Statement
The animal study protocol was approved by Animal Care and Use Committee of the College of Biotechnology at Sungkyunkwan University (date of approval: 07-09-2019, approval number: SKKUIACUC-20-02-10-2) and reported in accordance with ARRIVE guidelines.
Informed Consent Statement
Not applicable.
Data Availability Statement
The original contributions presented in this study are included in the article/supplementary material. Further inquiries can be directed to the corresponding author.
Conflicts of Interest
The authors declare no conflicts of interest.
Abbreviations
The following abbreviations are used in this manuscript:
| LAB | Lactic acid bacteria |
| HFD | High-fat diet |
| FER | Food efficiency ratio |
| GTT | Glucose tolerance test |
| ALT | Alanine transaminase |
| AST | Aspartate transaminase |
| TG | Triglyceride |
| HDL | High-density lipoprotein |
| LDL | Low-density lipoprotein |
| RT-PCR | Real-Time Polymerase Chain Reaction |
| SCFA | Short-chain fatty acid |
| AUC | Area under curve |
References
- Sharma, A.M.; Padwal, R. Obesity is a sign - over-eating is a symptom: an aetiological framework for the assessment and management of obesity. Obes. Rev. 2010, 11, 362–370. [Google Scholar] [CrossRef] [PubMed]
- Blüher, M. Obesity: global epidemiology and pathogenesis. Nat. Rev. Endocrinol. 2019, 15, 288–298. [Google Scholar] [CrossRef]
- Malik, V.S.; Popkin, B.M.; Bray, G.A.; Després, J.-P.; Willett, W.C.; Hu, F.B. Sugar-sweetened beverages and risk of metabolic syndrome and type 2 diabetes: a meta-analysis. Diabetes Care 2010, 33, 2477–2483. [Google Scholar] [CrossRef] [PubMed]
- Bastien, M.; Poirier, P.; Lemieux, I.; Després, J.-P. Overview of epidemiology and contribution of obesity to cardiovascular disease. Prog. Cardiovasc. Dis. 2014, 56, 369–381. [Google Scholar] [CrossRef]
- Ruban, A.; Stoenchev, K.; Ashrafian, H.; Teare, J. Current treatments for obesity. Clin. Med. 2019, 19, 205–212. [Google Scholar] [CrossRef]
- Ryan, D.H.; Lingvay, I.; Deanfield, J.; et al. Long-term weight loss effects of semaglutide in obesity without diabetes in the SELECT trial. Nat. Med. 2024, 30, 2049–2057. [Google Scholar] [CrossRef] [PubMed]
- Ridaura, V.K.; Faith, J.J.; Rey, F.E.; et al. Gut microbiota from twins discordant for obesity modulate metabolism in mice. Science 2013, 341, 1241214. [Google Scholar] [CrossRef]
- Geng, J.; Ni, Q.; Sun, W.; Li, L.; Feng, X. The links between gut microbiota and obesity and obesity related diseases. Biomed. Pharmacother. 2022, 147, 112678. [Google Scholar] [CrossRef] [PubMed]
- Vallianou, N.G.; Kounatidis, D.; Tsilingiris, D.; Panagopoulos, F.; Christodoulatos, G.S.; Evangelopoulos, A.; Karampela, I.; Dalamaga, M. The role of next- generation probiotics in obesity and obesity-associated disorders: current knowledge and future perspectives. Int. J. Mol. Sci. 2023, 24, 6755. [Google Scholar] [CrossRef]
- Turnbaugh, P.J.; Ley, R.E.; Mahowald, M.A.; Magrini, V.; Mardis, E.R.; Gordon, J.I. An obesity-associated gut microbiome with increased capacity for energy harvest. Nature 2006, 444, 1027–1031. [Google Scholar] [CrossRef]
- Velagapudi, V.R.; Hezaveh, R.; Reigstad, C.S.; Gopalacharyulu, P.; Yetukuri, L.; Islam, S.; Felin, J.; Perkins, R.; Borén, J.; Orešič, M.; Bäckhed, F. The gut microbiota modulates host energy and lipid metabolism in mice. J. Lipid Res. 2010, 51, 1101–1112. [Google Scholar] [CrossRef]
- Won, S.-M.; Seo, M.J.; Kwon, M.J.; Park, K.W.; Yoon, J.-H. Oral administration of Latilactobacillus sakei ADM14 improves lipid metabolism and fecal microbiota profile associated with metabolic dysfunction in a high-fat diet mouse model. Front. Microbiol. 2021, 12, 746601. [Google Scholar] [CrossRef]
- Yadav, H.; Lee, J.-H.; Lloyd, J.; Walter, P.; Rane, S.G. Beneficial metabolic effects of a probiotic via butyrate-induced GLP-1 hormone secretion. J. Biol. Chem. 2013, 288, 25088–25097. [Google Scholar] [CrossRef]
- Torres, B.; Sánchez, M.C.; Virto, L.; Llama-Palacios, A.; Ciudad, M.J.; Collado, L. Use of probiotics in preventing and treating excess weight and obesity. A systematic review. Obes. Sci. Pract. 2024, 10, E759. [Google Scholar] [CrossRef] [PubMed]
- Chandrasekaran, P.; Weiskirchen, S.; Weiskirchen, R. Effects of probiotics on gut microbiota: An overview. Int. J. Mol. Sci. 2024, 25, 6022. [Google Scholar] [CrossRef]
- Susanti, I.; Setiarto, R.H.B.; Kahfi, J.; Giarni, R.; Muhamaludin; Ramadhaningtyas, D. P.; Randy, A. The mechanism of probiotics in preventing the risk of hypercholesterolemia. Rev. Agric. Sci. 2023, 11, 156–170. [Google Scholar] [CrossRef] [PubMed]
- Jiang, J.; Feng, N.; Zhang, C.; Liu, F.; Zhao, J.; Zhang, H.; Zhai, Q.; Chen, W. Lactobacillus reuteri A9 and Lactobacillus mucosae A13 isolated from Chinese superlongevity people modulate lipid metabolism in a hypercholesterolemia rat model. FEMS Microbiol. Lett. 2019, 366, fnz254. [Google Scholar] [CrossRef] [PubMed]
- Guha, D.; Mukherjee, R.; Aich, P. Effects of two potential probiotic Lactobacillus bacteria on adipogenesis in vitro. Life Sci. 2021, 278, 119538. [Google Scholar] [CrossRef]
- Yoo, J.; Kim, S. Probiotics and prebiotics: Present status and future perspectives on metabolic disorders. Nutrients 2016, 8, 173. [Google Scholar] [CrossRef]
- Yoo, S.-R.; Kim, Y.-J.; Park, D.-Y.; Jung, U.-J.; Jeon, S.-M.; Ahn, Y.-T.; Huh, C.-S.; McGregor, R.; Choi, M.S. Probiotics L. plantarum and L. curvatus in combination alter hepatic lipid metabolism and suppress diet-induced obesity. Obesity 2013, 21, 2571–2578. [Google Scholar] [CrossRef]
- Panghal, A.; Janghu, S.; Virkar, K.; Gat, Y.; Kumar, V.; Chhikara, N. Potential non-dairy probiotic products - A healthy approach. Food Biosci. 2018, 21, 80–89. [Google Scholar] [CrossRef]
- Seo, M.J.; Won, S.-M.; Kwon, M.J.; Song, J.H.; Lee, E.B.; Cho, J.H.; Park, K.W.; Yoon, J.-H. Screening of lactic acid bacteria with anti adipogenic efect and potential probiotic properties from grains. Sci. Rep. 2023, 13, 11022. [Google Scholar] [CrossRef] [PubMed]
- Wu, Z.; Li, D.; Gou, K. Overexpression of stearoyl-CoA desaturase-1 results in an increase of conjugated linoleic acid (CLA) and n-7 fatty acids in 293 cells. Biochem. Biophys. Res. Commun. 2010, 398, 473–476. [Google Scholar] [CrossRef]
- Do, M.-S.; Kim, J.-B. ; Yoon, T,-J.; Park, C.-H.; Rayner, D.V.; Trayhurn, P. Induction of pncoupling protein-2 (UCP2) gene expression on the differentiation of rat preadipocytes to adipocytes in primary culture. Mol. Cell. 1999, 9, 20–24. [Google Scholar] [CrossRef]
- Neumeier, M.; Weigert, J.; Schäffler, A.; Weiss, T.S.; Schmidl, C.; Büttner, R.; Bollheimer, C.; Aslanidis, C.; Schölmerich, J.; Buechler, C. Aldehyde oxidase 1 is highly abundant in hepatic steatosis and is downregulated by adiponectin and fenofibric acid in hepatocytes in vitro. Biochem. Biophys. Res. Commun. 2006, 350, 731–735. [Google Scholar] [CrossRef] [PubMed]
- Dongol, B; Shah, Y. ; Kim, I.; Gonzalez, F.J.; Hunt, M.C. The acyl-CoA thioesterase I is regulated by PPARα and HNF4α via a distal response element in the promoter. J. Lipid Res. 2007, 48, 1781–1791. [Google Scholar] [CrossRef] [PubMed]
- Shiozaki, A.; Bai, X.; Shen-Tu, G.; Moodley, S.; Takeshita, H.; Fung, S.-Y.; Wang, Y.; Keshavjee, S.; Liu, M. Claudin 1 mediates TNFα-induced gene expression and cell migration in human lung carcinoma cells. PloS One 2012, 31, e38049. [Google Scholar] [CrossRef]
- Guzman, K.; Gray, T.E.; Yoon, J.H.; Nettesheim, P. Quantitation of mucin RNA by PCR reveals induction of both MUC2 and MUC5AC mRNA levels by retinoids. Am. J. Physiol. 1996, 271, L1023–1028. [Google Scholar] [CrossRef]
- Fadrosh, D.W.; Ma, B.; Gajer, P.; Sengamalay, N.; Ott, S.; Brotman, R.M.; Ravel, J. An improved dual-indexing approach for multiplexed 16S rRNA gene sequencing on the Illumina MiSeq platform. Microbiome 2014, 2, 6. [Google Scholar] [CrossRef]
- Won, S.-M.; Chen, S.; Lee, S.Y.; Lee, K.E.; Park, K.W.; Yoon, J.-H. Lactobacillus sakei ADM14 induces anti-obesity effects and changes in gut microbiome in high-fat diet-induced obese mice. Nutrients 2020, 12, 3703. [Google Scholar] [CrossRef]
- Kraus, D.; Yang, Q.; Kahn, B.B. Lipid extraction from mouse feces. Bio Protoc. 2015, 5, 1–5. [Google Scholar] [CrossRef]
- Lao, L.; Yang, G.; Zhang, A.; Liu, L.; Guo, Y.; Lian, L.; Pan, D.; Wu, Z. Anti-inflammation and gut microbiota regulation properties of fatty acids derived from fermented milk in mice with dextran sulfate sodium-induced colitis. J. Dairy Sci. 2022, 105, 7865–7877. [Google Scholar] [CrossRef] [PubMed]
- Bessesen, D.H.; Van Gaal, L.F. Progress and challenges in anti-obesity pharmacotherapy. Lancet Diabetes Endocrinol. 2018, 6, 237–248. [Google Scholar] [CrossRef]
- Kadooka, Y.; Sato, M.; Imaizumi, K.; Ogawa, A.; Ikuyama, K.; Akai, Y.; Okano, M.; Kagoshima, M.; Tsuchida, T. Regulation of abdominal adiposity by probiotics (Lactobacillus gasseri SBT2055) in adults with obese tendencies in a randomized controlled trial. Eur. J. Clin. Nutr. 2010, 64, 636–643. [Google Scholar] [CrossRef] [PubMed]
- Cani, P.D.; Delzenne, N.M. The role of the gut microbiota in energy metabolism and metabolic disease. Curr. Pharm. Des. 2009, 15, 1546–1558. [Google Scholar] [CrossRef]
- Tilg, H.; Kaser, A. Gut microbiome, obesity, and metabolic dysfunction. J. Clin. Investig. 2011, 121, 2126–2132. [Google Scholar] [CrossRef] [PubMed]
- Shen, Y.-L.; Zhang, L.-Q.; Yang, Y.; Yin, B.-C.; Ye, B.-C.; Zhou, Y. Advances in the role and mechanism of lactic acid bacteria in treating obesity. Food Bioeng. 2022, 1, 1101–1115. [Google Scholar] [CrossRef]
- Won, S.-M.; Chen, S.; Park, K.W.; Yoon, J.-H. Isolation of lactic acid bacteria from kimchi and screening of Lactobacillus sakei ADM14 with anti-adipogenic effect and potential probiotic properties. LWT-Food Sci. Technol. 2020, 126, 109296. [Google Scholar] [CrossRef]
- Cui, C.; Shen, C.J.; Jia, G.; Wang, K.N. Effect of dietary Bacillus subtilis on proportion of Bacteroidetes and Firmicutes in swine intestine and lipid metabolism. Genet. Mol. Res. 2013, 12, 1766–1776. [Google Scholar] [CrossRef]
- Kim, B.; Park, K.-Y.; Ji, Y.; Park, S.; Holzapfel, W.; Hyun, C.-K. Protective effects of Lactobacillus rhamnosus GG against dyslipidemia in high-fat diet-induced obese mice. Biochem. Biophys. Res. Commun. 2016, 473, 530–536. [Google Scholar] [CrossRef]
- Do, G.-M.; Oh, H.Y.; Kwon, E.; Cho, Y.; Shin, S.; Park, H.; Jeon, S.; Kim, E.; Hur, C.; Park, T.; Sung, M.; McGregor, R.A.; Choi, M. Long-term adaptation of global transcription and metabolism in the liver of high-fat diet-fed C57BL/6J mice. Mol. Nutr. Food Res. 2011, 55, S173–S185. [Google Scholar] [CrossRef]
- Pereira, D.I.A.; Gibson, G.R. Effects of consumption of probiotics and prebiotics on serum lipid levels in humans. Crit. Rev. Biochem. Mol. Biol. 37, 259-281 (2002). [CrossRef]
- Wang, J.; Zhang, H.; Chen, X.; Chen, Y.; Menghebilige; Bao, Q. Selection of potential probiotic lactobacilli for cholesterol-lowering properties and their effect on cholesterol metabolism in rats fed a high-lipid diet. J. Dairy Sci. 2012, 95, 1645–1654. [Google Scholar] [CrossRef]
- Wang, Y.; Xu, N.; Xi, A.; Ahmed, Z.; Zhang, B.; Bai, X. Effects of Lactobacillus plantarum MA2 isolated from Tibet kefir on lipid metabolism and intestinal microflora of rats fed on high-cholesterol diet. Appl. Microbiol. Biotechnol. 2009, 84, 341–347. [Google Scholar] [CrossRef] [PubMed]
- Gérard, P.; Béguet, F.; Lepercq, P.; Rigottier-Gois, L.; Rochet, V.; Andrieux, C.; Juste, C. Gnotobiotic rats harboring human intestinal microbiota as a model for studying cholesterol-to-coprostanol conversion. FEMS Microbiol. Ecol. 2004, 47, 337–343. [Google Scholar] [CrossRef] [PubMed]
- Payne, A.N.; Chassard, C.; Lacroix, C. Gut microbial adaptation to dietary consumption of fructose, artificial sweeteners and sugar alcohols: Implications for host-microbe interactions contributing to obesity. Obes. Rev. 2012, 13, 799–809. [Google Scholar] [CrossRef]
- Wang, H.; Wei, C.X.; Min, L.; Zhu, L.Y. Good or bad: Gut bacteria in human health and diseases. Biotechnol. Biotechnol. Equip. 2018, 32, 1075–1080. [Google Scholar] [CrossRef]
- Matsushita, N.; Osaka, T.; Haruta, I.; Ueshiba, H.; Yanagisawa, N.; Omori-Miyake, M.; Hashimoto, E.; Shibata, N.; Tokushige, K.; Saito, K.; Tsuneda, S.; Yagi, J. Effect of lipopolysaccharide on the progression of non-alcoholic fatty liver disease in high caloric diet-fed mice. Scand. J. Immunol. 2016, 83, 109–118. [Google Scholar] [CrossRef]
- Schulz, M.D.; Atay, Ç.; Heringer, J.; Romrig, F.K.; Schwitalla, S.; Aydin, B.; Ziegler, P.K.; Varga, J.; Reindl, W.; Pommerenke, C.; Salinas-Riester, G.; Böck, A.; Alpert, C.; Blaut, M.; Polson, S.C.; Brandl, L.; Kirchner, T.; Greten, F.R.; Polson, S.W.; Arkan, M.C. High-fat-diet-mediated dysbiosis promotes intestinal carcinogenesis independently of obesity. Nature 2014, 514, 508–512. [Google Scholar] [CrossRef]
- Zeng, H.; Ishaq, S.L.; Zhao, F.-Q.; Wright, A.-D.G. Colonic inflammation accompanies an increase of β-catenin signaling and Lachnospiraceae/Streptococcaceae bacteria in the hind gut of high-fat diet-fed mice. J. Nutr. Biochem. 2016, 35, 3036. [Google Scholar] [CrossRef]
- Chen, G.; Chen, D.; Zhou, W.; Peng, Y.; Chen, C.; Shen, W.; Zeng, X.; Yuan, Q. Improvement of metabolic syndrome in high-fat diet-induced mice by yeast β-glucan is linked to inhibited proliferation of Lactobacillus and Lactococcus in gut microbiota. J. Agric. Food Chem. 2021, 69, 7581–7592. [Google Scholar] [CrossRef]
- Hu, P.; Chen, X.; Chu, X.; Fan, M.; Ye, Y.; Wang, Y.; Han, M.; Yang, X.; Yuan, J.; Zha, L.; Zhao, B.; Yang, C.-X.; Qi, X.-R.; Ning, K.; Debelius, J.; Ye, W.; Xiong, B.; Pan, X.-F.; Pan, A. Association of gut microbiota during early pregnancy with risk of incident gestational diabetes mellitus. J. Clin. Endocrinol. Metab. 2021, 106, e4128–e4141. [Google Scholar] [CrossRef]
- Su, Z.; Lu, L.; Chen, F.; Chen, J.; Chen, X. Gut microbiota and sunitinib-induced diarrhea in metastatic renal cell carcinoma: A pilot study. Cancer Manag. Res. 2021, 13, 8663–8672. [Google Scholar] [CrossRef] [PubMed]
- Ye, J.; Lv, L.; Wu, W.; Li, Y.; Shi, D.; Fang, D.; Guo, F.; Jiang, H.; Yan, R.; Ye, W.; Li, L. Butyrate protects mice against methionine-choline-deficient diet-induced non-alcoholic steatohepatitis by improving gut barrier function, attenuating inflammation and reducing endotoxin levels. Front. Microbiol. 2018, 9, 1967. [Google Scholar] [CrossRef] [PubMed]
- Kim, M.-H.; Yun, K.E.; Kim, J.; Park, E.; Chang, Y.; Ryu, S.; Kim, H.-L.; Kim, H.-N. Gut microbiota and metabolic health among overweight and obese individuals. Sci. Rep. 2020, 10, 19417. [Google Scholar] [CrossRef] [PubMed]
- Evgenia, N.; Natalia, B.; Anna, P.; Anastasia, R.; Tatyana, B.; Lyubov, R. Dysbiosis in the gut microbiota of adolescents with obesity. Cogn. Sci. Genome Bioinform. 2020, 110–113. [Google Scholar] [CrossRef]
- Kaplan, R.C.; Wang, Z.; Usyk, M.; et al. Gut microbiome composition in the Hispanic community health study/study of Latinos is shaped by geographic relocation, environmental factors, and obesity. Genome Biol. 2019, 20, 219. [Google Scholar] [CrossRef]
- Wang, Y.; Yao, W.; Li, B.; Qian, S.; Wei, B.; Gong, S.; Wang, J.; Liu, M.; Wei, M. Nuciferine modulates the gut microbiota and prevents obesity in high-fat diet-fed rats. Exp. Mol. Med. 2020, 52, 1959–1975. [Google Scholar] [CrossRef]
- Therdtatha, P.; Song, Y.; Tanaka, M.; Mariyatun, M.; Almunifah, M.; Manurung, N.E.P.; Indriarsih, S.; Lu, Y.; Nagata, K.; Fukami, K.; Ikeda, T.; Lee, Y.-K.; Rahayu, E.S.; Nakayama, J. Gut microbiome of indonesian adults associated with obesity and type 2 diabetes: A cross-sectional study in an Asian city, Yogyakarta. Microorganisms 2021, 9, 897. [Google Scholar] [CrossRef]
- Zeng, Q.; Li, D.; He, Y.; et al. Discrepant gut microbiota markers for the classification of obesity-related metabolic abnormalities. Sci. Rep. 2019, 9, 13424. [Google Scholar] [CrossRef]
- Molinari, R.; Merendino, N.; Costantini, L. Polyphenols as modulators of pre-established gut microbiota dysbiosis: State-of-the-art. BioFactors 2022, 48, 255–273. [Google Scholar] [CrossRef]
- Yang, Y.; Cai, Q.; Zheng, W.; Steinwandel, M.; Blot, W.J.; Shu, X.-O.; Long, J. Oral microbiome and obesity in a large study of low-income and African-American populations. J. Oral Microbiol. 2019, 11, 1650597. [Google Scholar] [CrossRef]
- Kong, C.; Gao, R.; Yan, X.; Huang, L.; Qin, H. Probiotics improve gut microbiota dysbiosis in obese mice fed a high-fat or high-sucrose diet. Nutrition 2019, 60, 175–184. [Google Scholar] [CrossRef] [PubMed]
- Zhang, W.; Zou, G.; Li, B.; Du, X.; Sun, Z.; Sun, Y.; Jiang, X. Fecal microbiota transplantation (FMT) alleviates experimental colitis in mice by gut microbiota regulation. J. Microbiol. Biotechnol. 2020, 30, 1132–1141. [Google Scholar] [CrossRef] [PubMed]
- Lee, H.; Ko, G. Effect of metformin on metabolic improvement and gut microbiota. Appl. Environ. Microbiol. 2014, 80, 5935–5943. [Google Scholar] [CrossRef]
- Kasai, C.; Sugimoto, K.; Moritani, I.; Tanaka, J.; Oya, Y.; Inoue, H.; Tameda, M.; Shiraki, K.; Ito, M.; Takei, Y.; Takase, K. Comparison of the gut microbiota composition between obese and non-obese individuals in a Japanese population, as analyzed by terminal restriction fragment length polymorphism and next-generation sequencing. BMC Gastroenterol. 2015, 15, 1–10. [Google Scholar] [CrossRef] [PubMed]
- Li, J.; Song, J.; Zaytseva, Y.; et al. An obligatory role for neurotensin in high-fat-diet-induced obesity. Nature 2016, 533, 411–415. [Google Scholar] [CrossRef]
- Arpaia, N.; Campbell, C.; Fan, X.; Dikiy, S.; van der Veeken, J.; deRoos, P.; Liu, H.; Cross, J.R.; Pfeffer, K.; Coffer, P.J.; Rudensky, A.Y. Metabolites produced by commensal bacteria promote peripheral regulatory T-cell generation. Nat. Cell Biol. 2013, 504, 451–455. [Google Scholar] [CrossRef]
- Lu, Y.; Fan, C.; Li, P.; Lu, Y.; Chang, X.; Qi, K. Short chain fatty acids prevent high-fat-diet-induced obesity in mice by regulating G protein-coupled receptors and gut microbiota. Sci. Rep. 2016, 6, 37589. [Google Scholar] [CrossRef]
- Knudsen, K.E.B. Microbial degradation of whole-grain complex carbohydrates and impact on short-chain fatty acids and health. Adv. Nutr. 2015, 6, 206–213. [Google Scholar] [CrossRef]
- Kau, A.L.; Ahern, P.P.; Griffin, N.W.; Goodman, A.L.; Gordon, J.I. Human nutrition, the gut microbiome and the immune system. Nat. Cell Biol. 2011, 474, 327–336. [Google Scholar] [CrossRef]
- Berni Canani, R.; Sangwan, N.; Stefka, A.T.; Nocerino, R.; Paparo, L.; Aitoro, R.; Calignano, A.; Khan, A.A.; Gilbert, J.A.; Nagler, C.R. Lactobacillus rhamnosus GG-supplemented formula expands butyrate-producing bacterial strains in food allergic infants. ISME J. 2016, 10, 742–750. [Google Scholar] [CrossRef]
- den Besten, G.; Bleeker, A.; Gerding, A.; van Eunen, K.; Havinga, R.; van Dijk, T.H.; Oosterveer, M.H.; Jonker, J.W.; Groen, A.K.; Reijngoud, D.-J.; Bakker, B.M. Short-chain fatty acids protect against high-fat diet-induced obesity via a PPARγ-dependent switch from lipogenesis to fat oxidation. Diabetes 2015, 64, 2398–2408. [Google Scholar] [CrossRef] [PubMed]
- Gao, Z.; Yin, J.; Zhang, J.; Ward, R.E.; Martin, R.J.; Lefevre, M.; Cefalu, W.T.; Ye, J. Butyrate improves insulin sensitivity and increases energy expenditure in mice. Diabetes 2009, 58, 1509–1517. [Google Scholar] [CrossRef]
- Lin, H.V.; Frassetto, A.; Kowalik Jr, E.J.; Nawrocki, A.R.; Lu, M.M.; Kosinski, J.R.; Hubert, J.A.; Szeto, D.; Yao, X.; Forrest, G.; Marsh, D.J. Butyrate and propionate protect against diet-induced obesity and regulate gut hormones via free fatty acid receptor 3-independent mechanisms. PLoS ONE 2012, 7, e35240. [Google Scholar] [CrossRef] [PubMed]
- Flint, H.J.; Duncan, S.H.; Scott, K.P.; Louis, P. Links between diet, gut microbiota composition and gut metabolism. Proc. Nutr. Soc. 2015, 74, 13–22. [Google Scholar] [CrossRef] [PubMed]
- Teixeira, T.F.; Collado, M.C.; Ferreira, C.L.; Bressan, J.; Peluzio Mdo. C. Potential mechanisms for the emerging link between obesity and increased intestinal permeability. Nutr. Res. 2012, 32, 637–647. [Google Scholar] [CrossRef] [PubMed]
- Resnick, M.B.; Konkin, T.; Routhier, J.; Sabo, E.; Pricolo, V.E. Claudin-1 is a strong prognostic indicator in stage II colonic cancer: a tissue microarray study. Mod. Pathol. 2005, 18, 511–518. [Google Scholar] [CrossRef]
- Hsu, H.-P.; Lai, M.-D.; Lee, J.-C.; Yen, M.-C.; Weng, T.-Y.; Chen, W.-C.; Fang, J.-H.; Chen, Y.-L. Mucin 2 silencing promotes colon cancer metastasis through interleukin-6 signaling. Sci. Rep. 2017, 7, 5823. [Google Scholar] [CrossRef]
- Nakamura, A.; Yokoyama, Y.; Tanaka, K.; Benegiamo, G.; Hirayama, A.; Zhu, Q.; Kitamura, N.; Sugizaki, T.; Morimoto, K.; Itoh, H.; Fukuda, S.; Auwerx, J.; Tsubota, K.; Watanabe, M. Asperuloside improves obesity and type 2 diabetes through modulation of gut mcrobiota and metabolic signaling. iScience 2020, 23, 101522. [Google Scholar] [CrossRef]
Figure 1.
Effect of administered Lactiplantibacillus plantarum RP12 on high-fat diet-induced obese mouse model. (A) Weight change of mouse groups over 10 weeks. (B) Total weight gain for each group after 10 weeks. (C) Food intake for each group over 10 weeks. (D) Food efficiency ratio over 10 weeks for all groups. (E) Glucose tolerance test. (F) Area under curve. (G) Organ weights of mice in two groups after sacrifice. eWAT, epididymal white adipose tissue. Mice were fasted for 12 h before intraperitoneal glucose injection (2 g/kg). Results are present as mean ± SEM (n = 7). Significant differences between HFD and RP12 groups are indicated as *p < 0.05, **p < 0.01, ***p < 0.001.
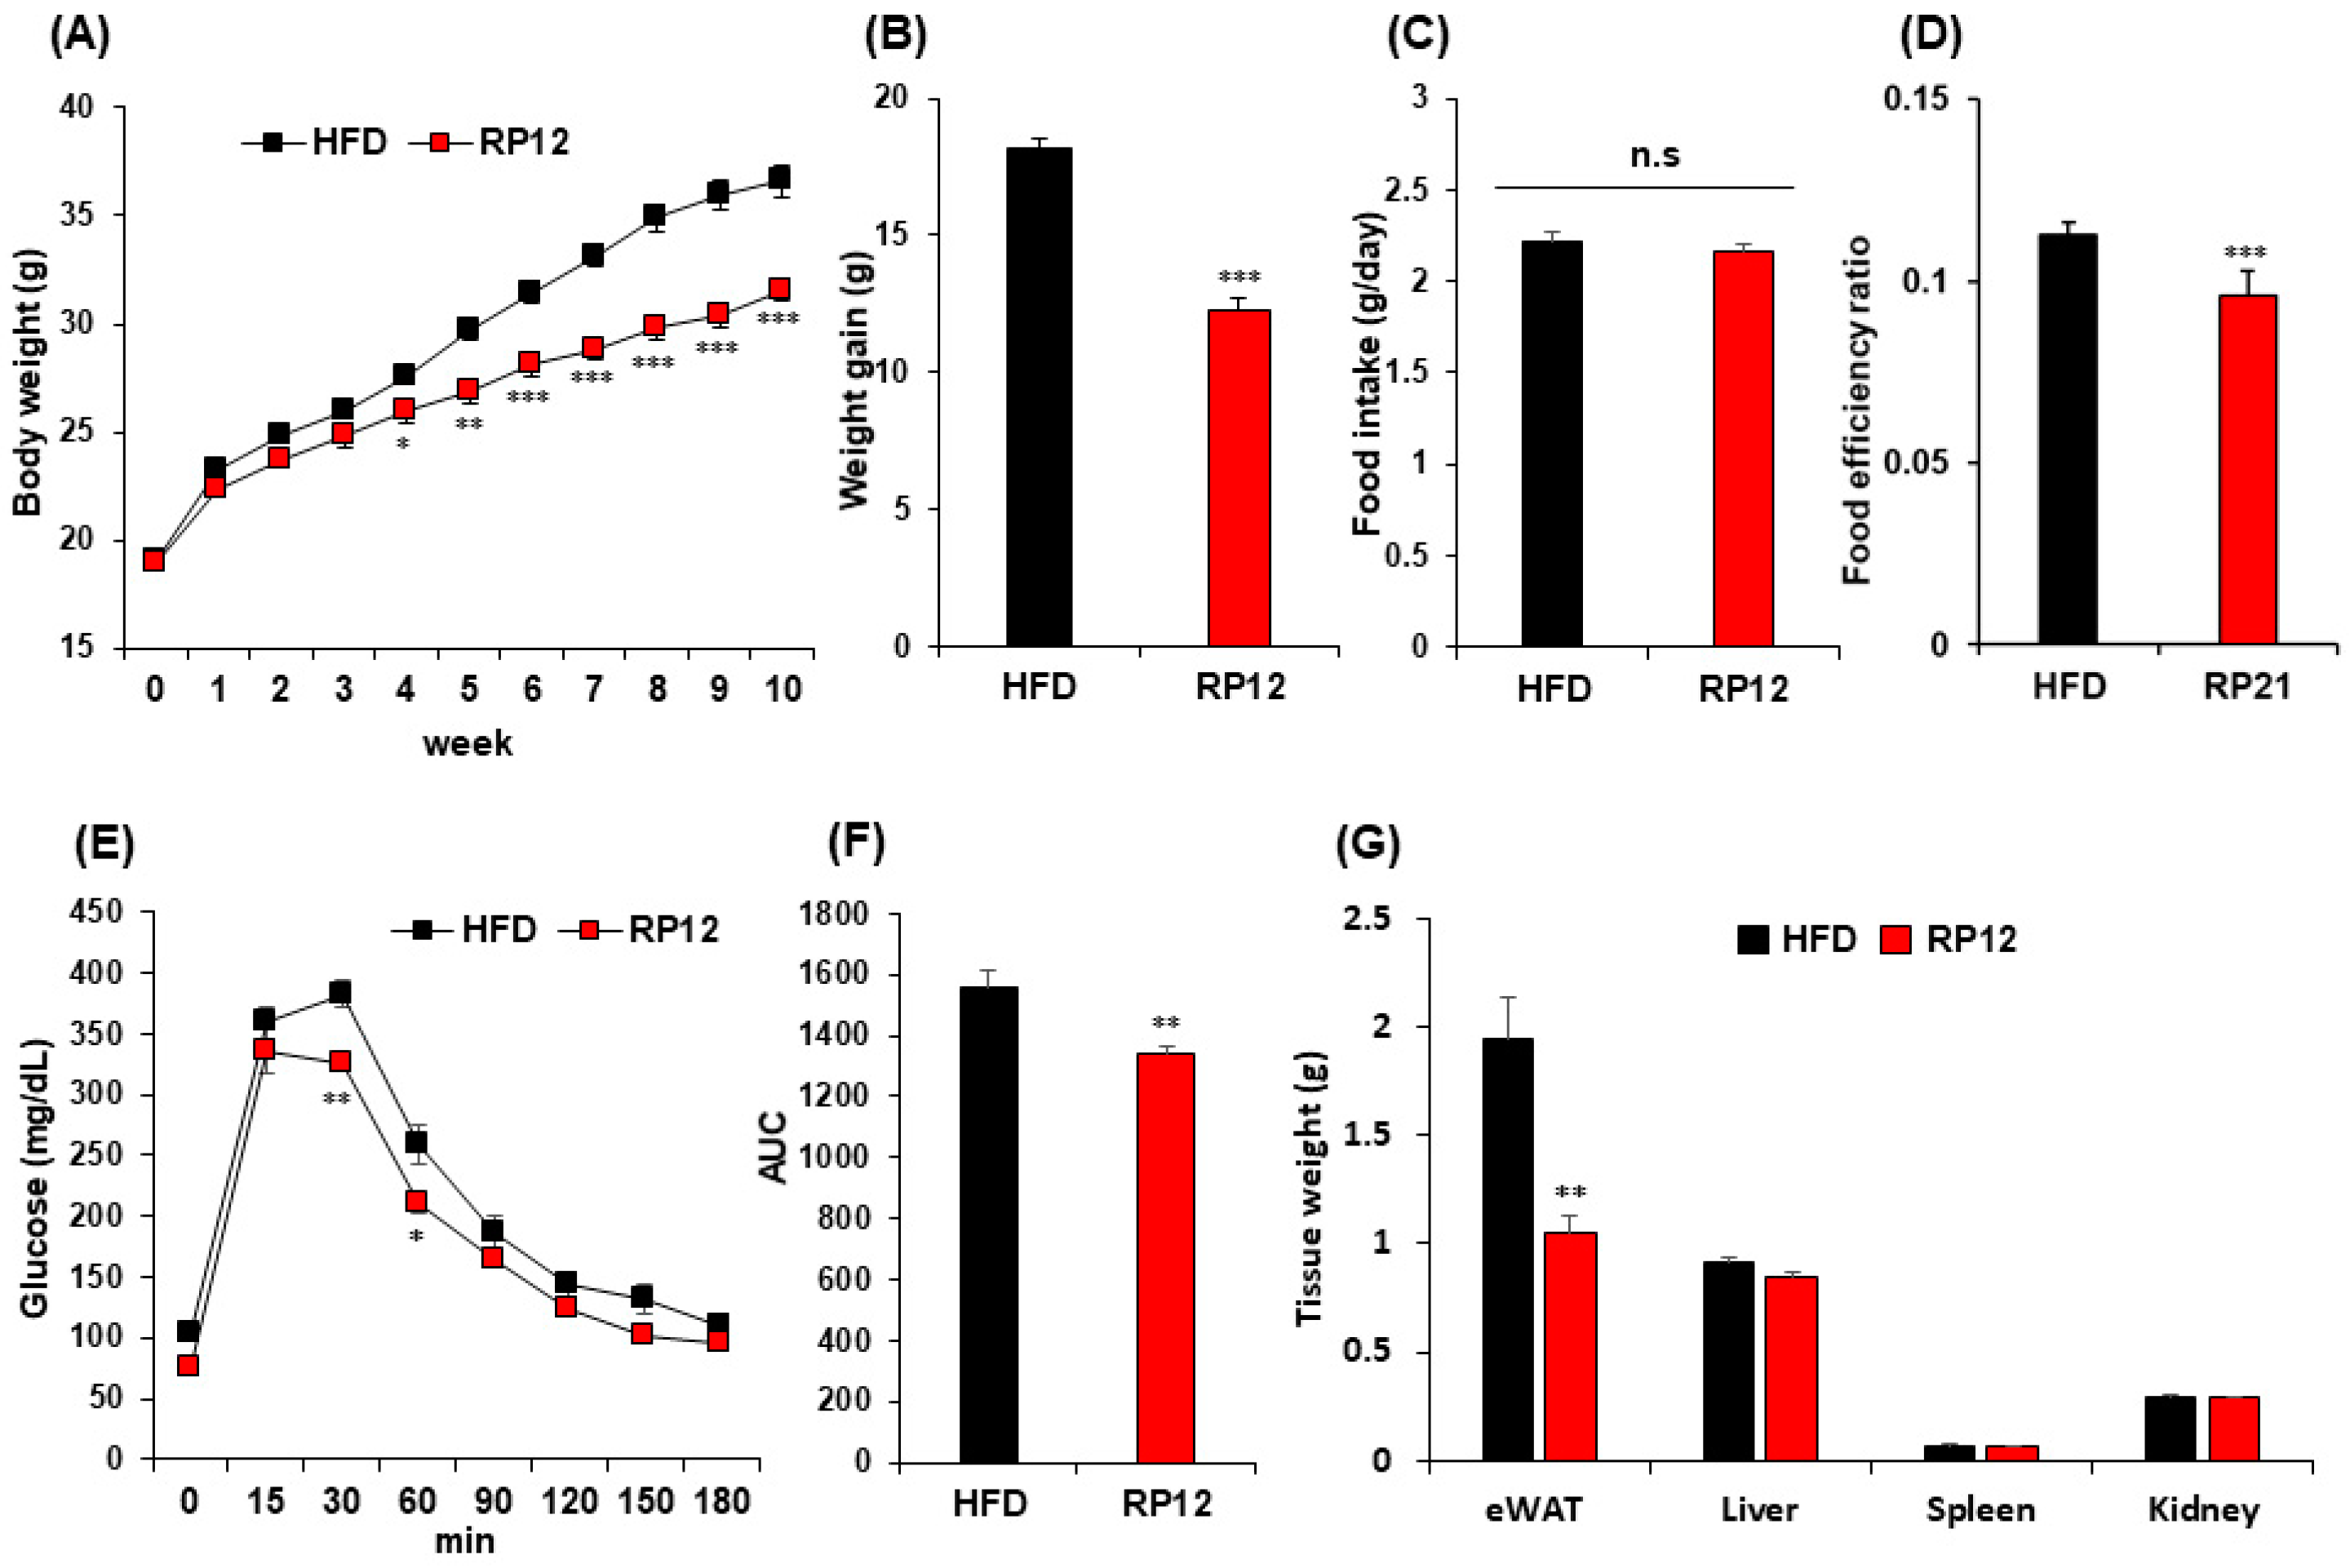
Figure 2.
Effect of administered Lactiplantibacillus plantarum RP12 on gene expression in the epididymal fat pads and liver. (A) The mRNA expression levels of Pparγ, Cebpα, aP2, Cd36, Lpl, Srebp-1c, Fas and Scd1 in epididymal fat pads measured by quantitative real-time PCR. (B) Measurement of anti-inflammatory gene expression in epididymal fat pads via quantitative real-time PCR. (C) The mRNA expression levels of Srebp-1c, Fas and Scd1 in liver determined by quantitative real-time PCR. (D) Assessment of fatty acid oxidation gene expression in liver via quantitative real-time PCR. Ppar γ, peroxisome proliferator-activated receptor γ; Cebpα, CCAAT-enhancer-binding protein-α; aP2, adipocyte protein 2; Cd36, cluster of differentiation 36; Lpl, lipoprotein lipase; Srebp-1c, sterol regulatory element-binding protein 1; Fas, fatty acid synthase; Scd1, stearoyl-CoA desaturase-1; Tnfα, tumor necrosis factor alpha; Mcp1, monocyte chemotactic protein 1; Il-6, interleukin-6; Pparα, peroxisome proliferator-activated receptor α; Cpt1α, carnitine palmitoyltransferase1 α; Ucp2, uncoupling protein 2; Aox1, acyl coenzyme A oxidase 1; Acot1, acyl coenzyme A thioesterase 1. Results are shown as mean ± SEM (n = 7). Significant differences between HFD and RP12 are indicated as *p < 0.05, **p < 0.01.
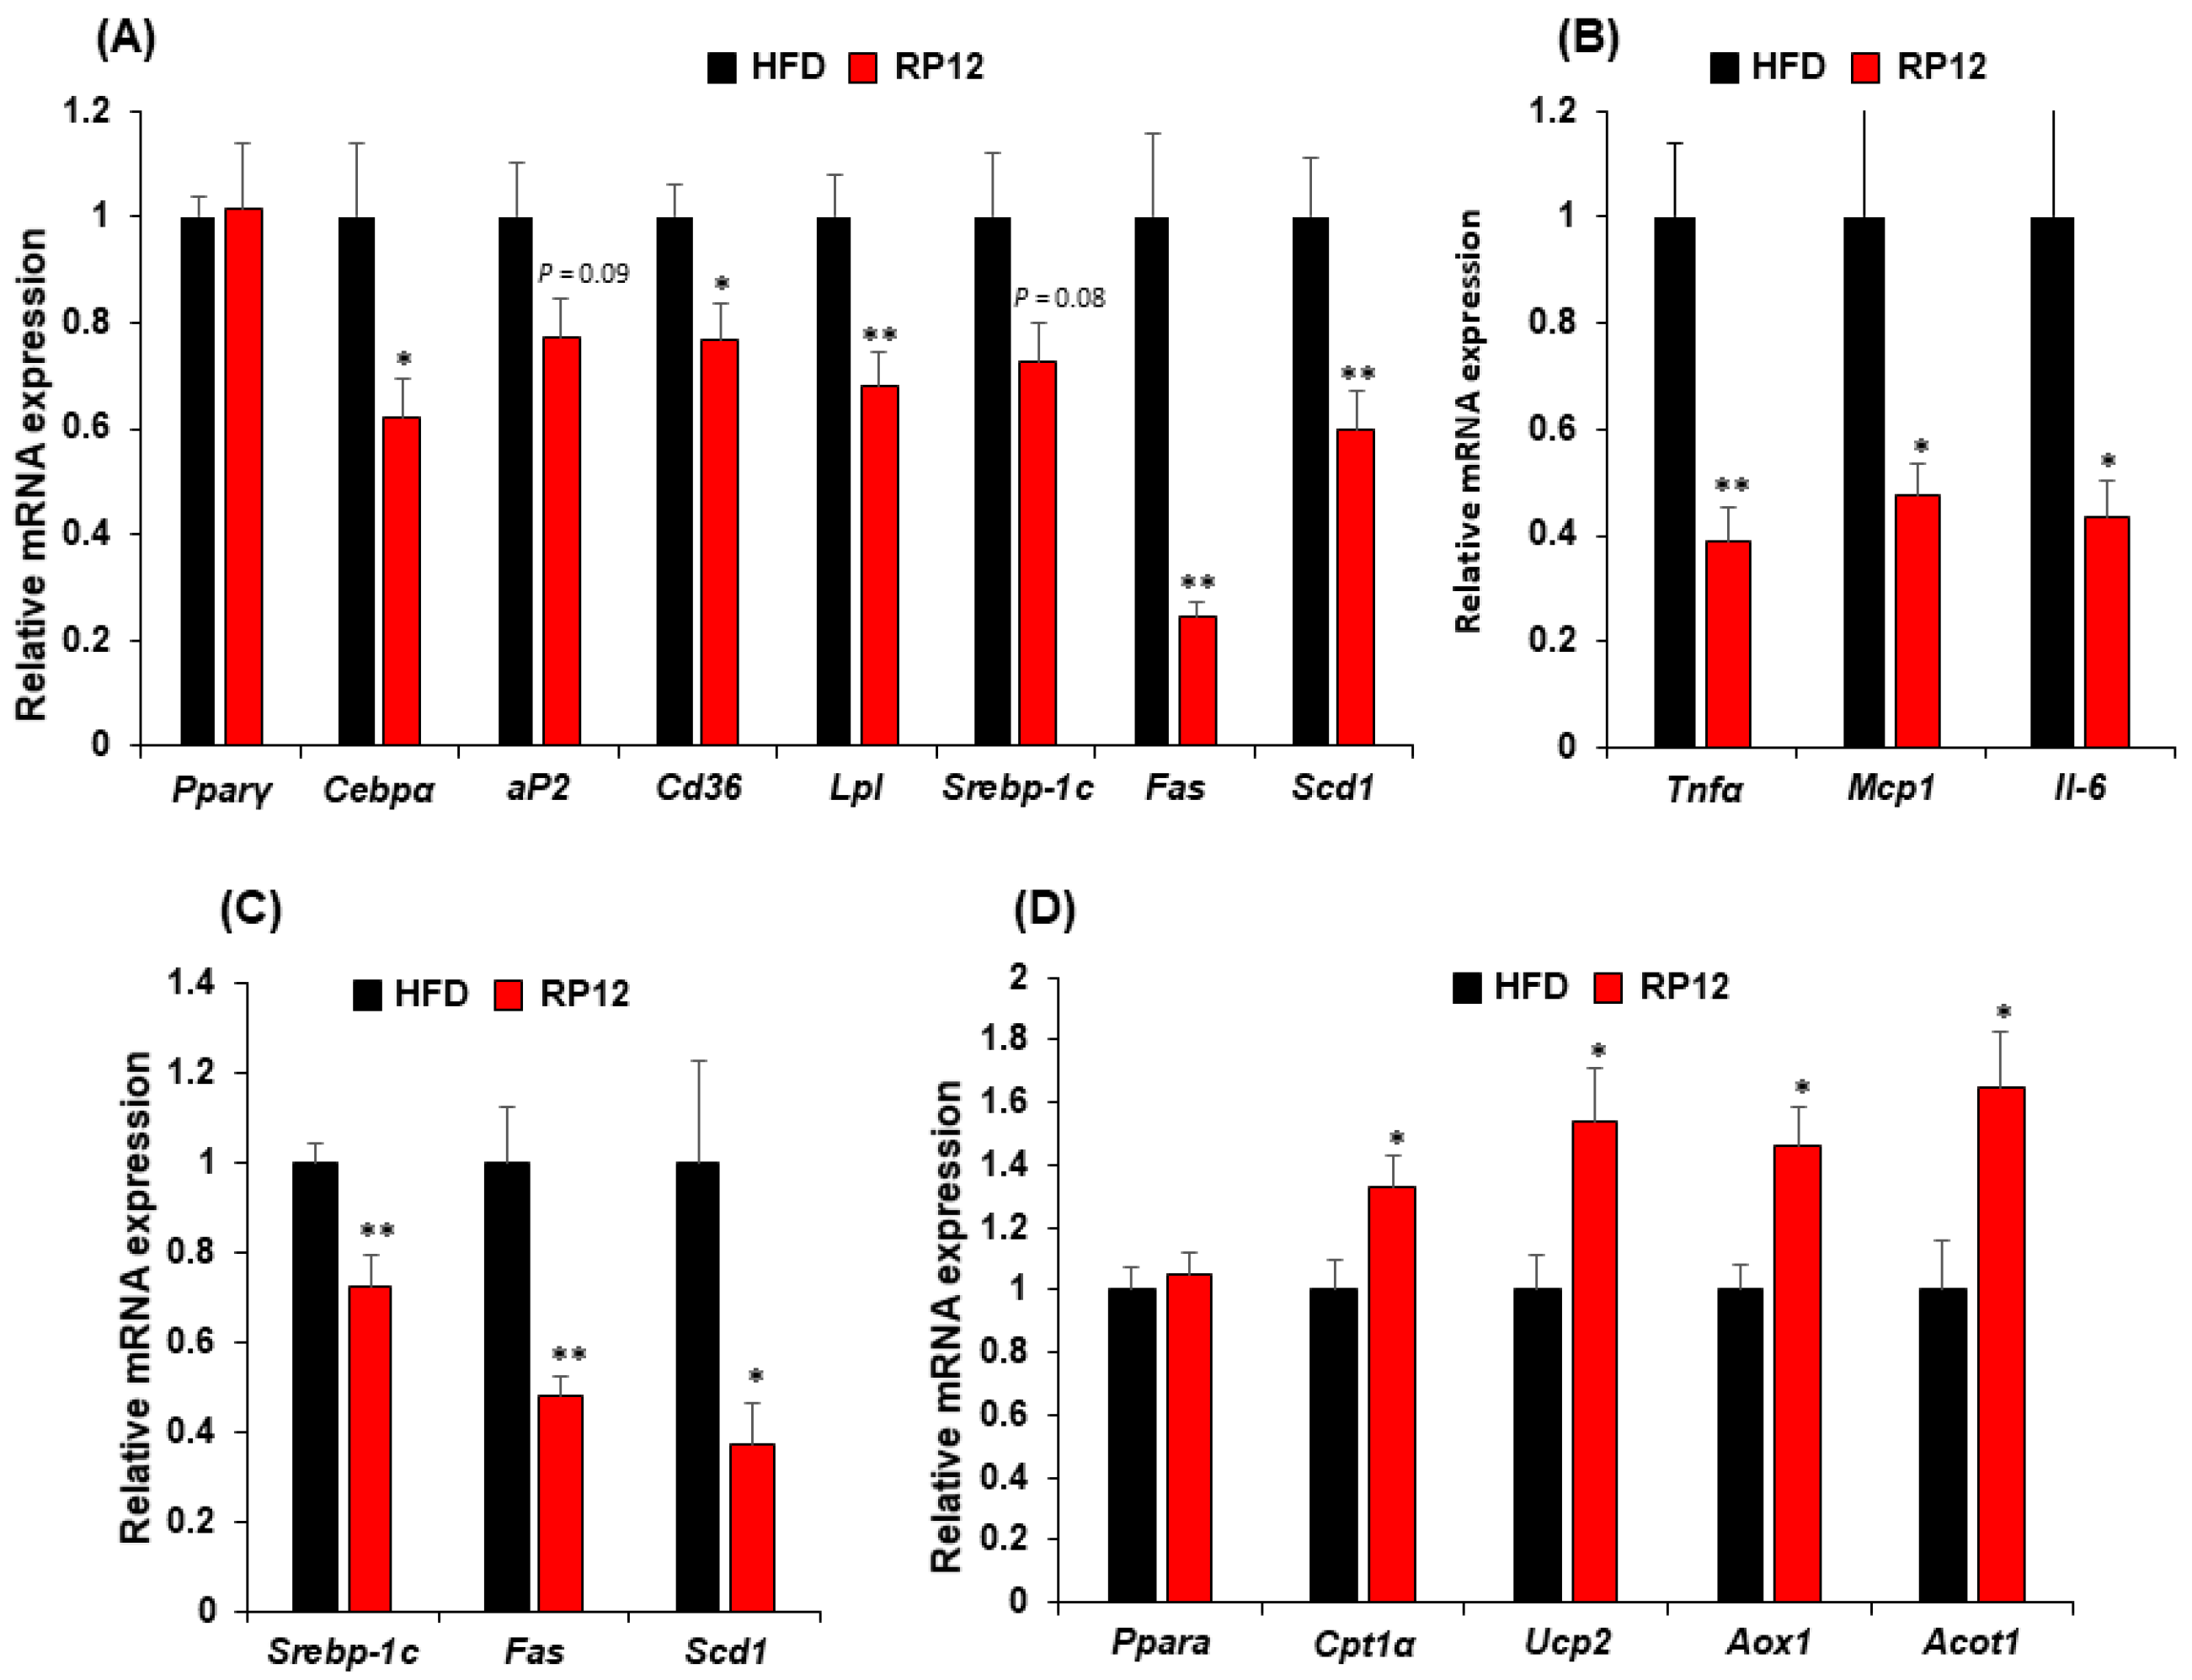
Figure 3.
Effect of administered Lactiplantibacillus plantarum RP12 on fecal microbiome composition. (A) Bacillota, Bacteroidota and Bacillota to Bacteroidota ratio at 10 weeks. (B) The relative abundance of specific families in fecal microbiota at 10 weeks. The nonparametric Wilcoxon signed rank test for paired data and the Mann-Whitney U test for unpaired data were used. Significant differences between HFD and RP12 are indicated as *p < 0.05, **p < 0.01.
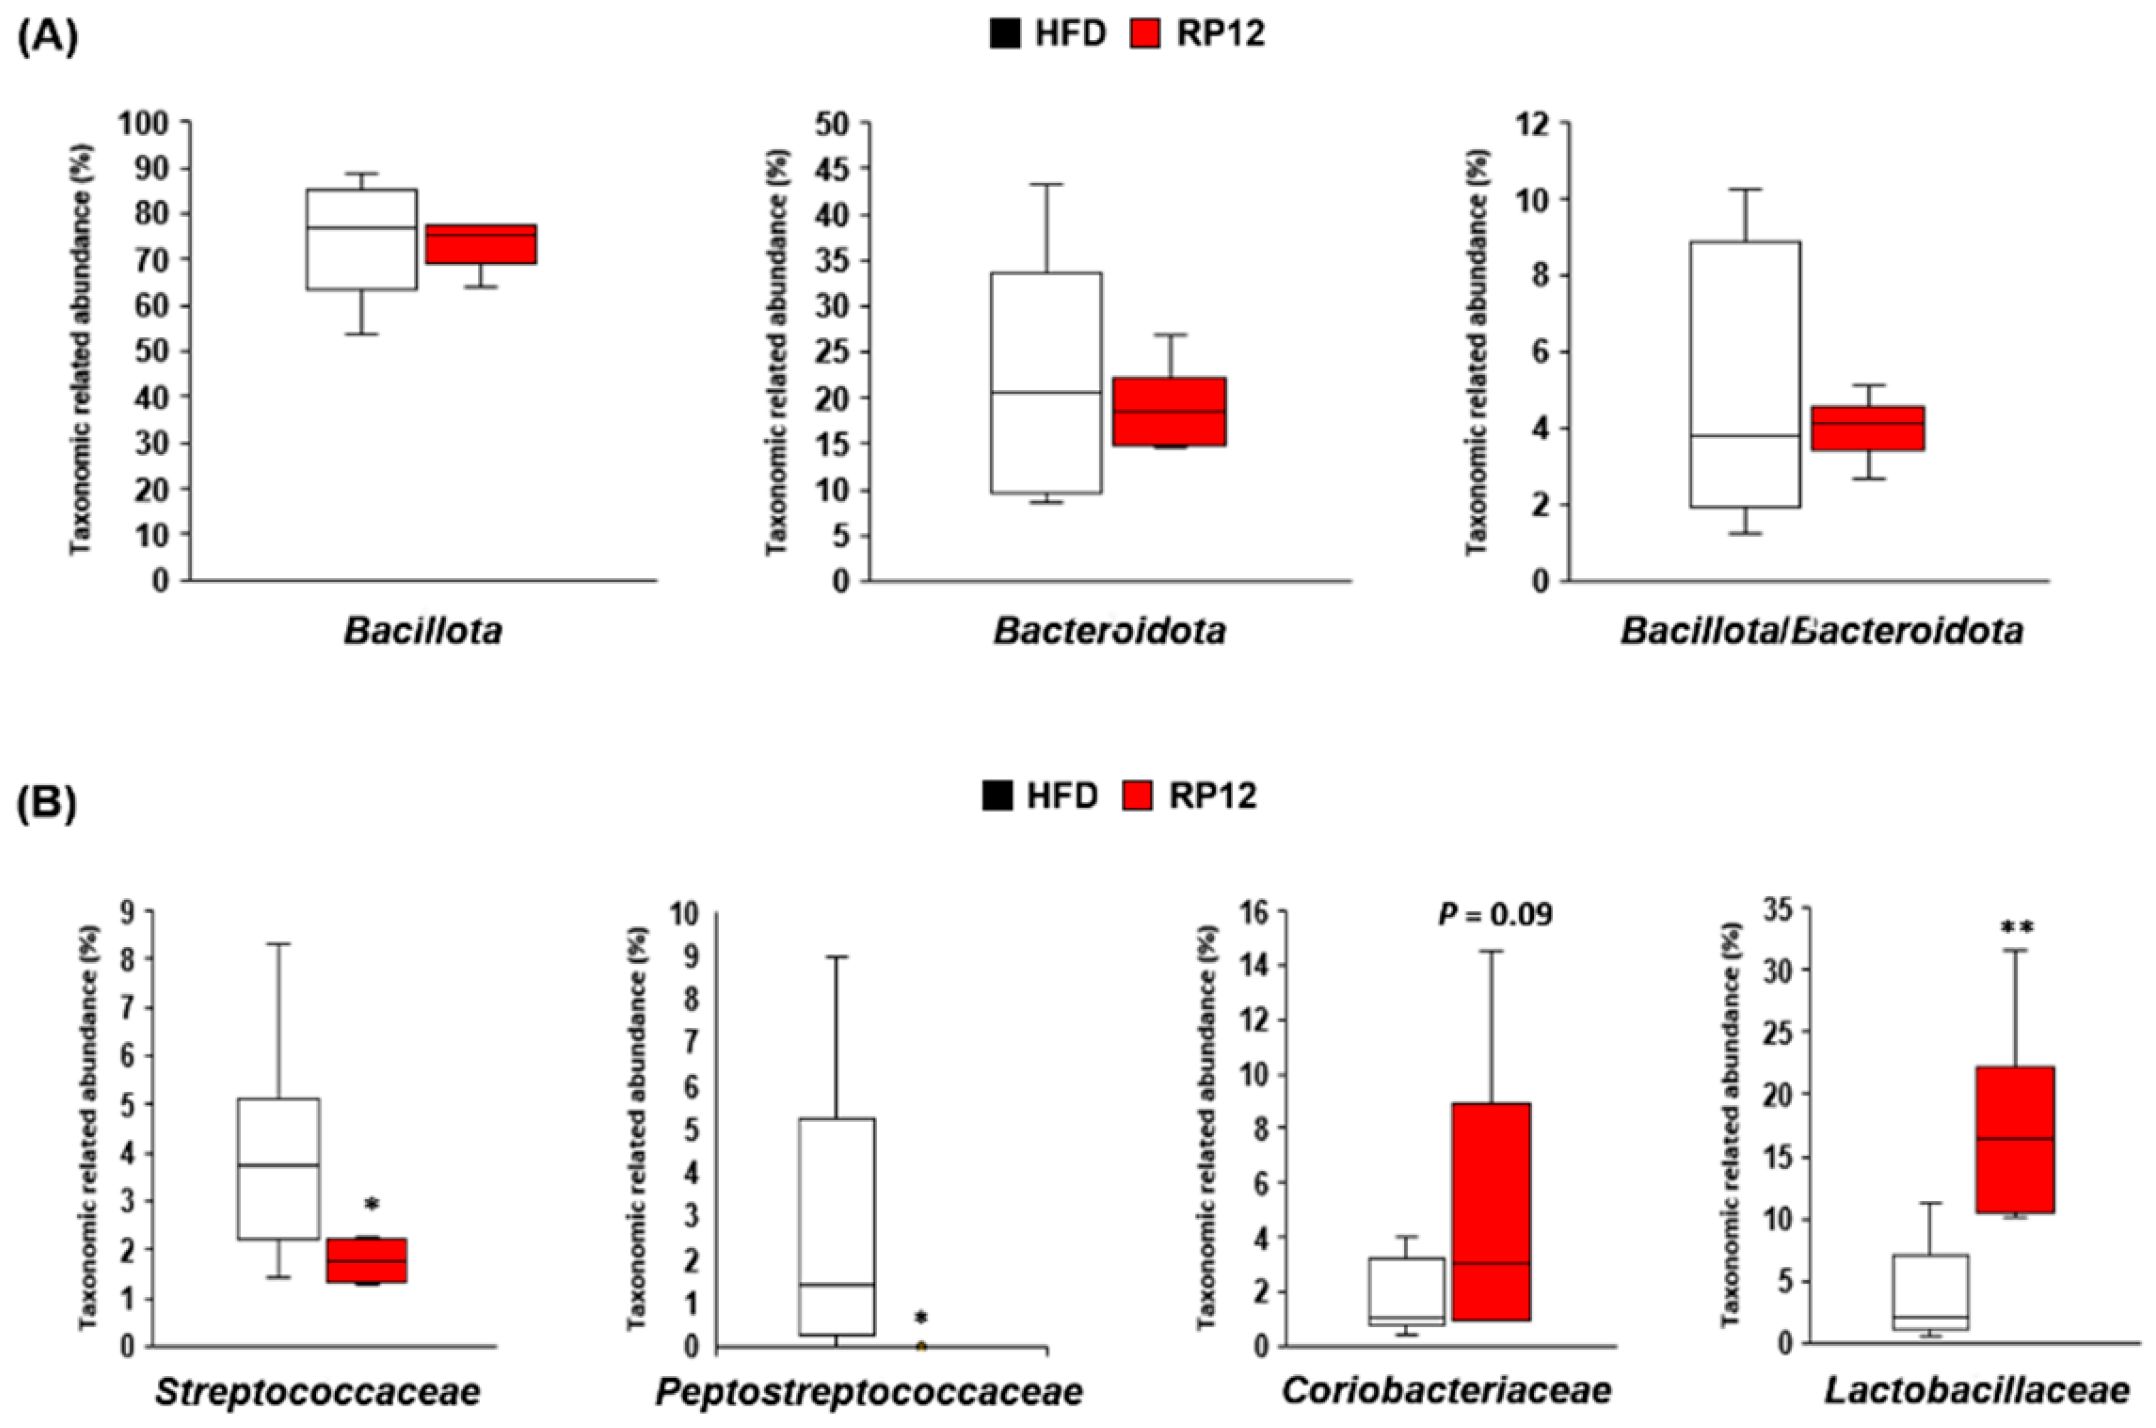
Figure 4.
The relative abundance of specific bacterial genera in fecal microbiota at 10 weeks. The nonparametric Wilcoxon signed rank test and Mann-Whitney U test were applied for paired and unpaired data, respectively. Significant differences between HFD and RP12 are indicated as *p < 0.05, **p < 0.01.
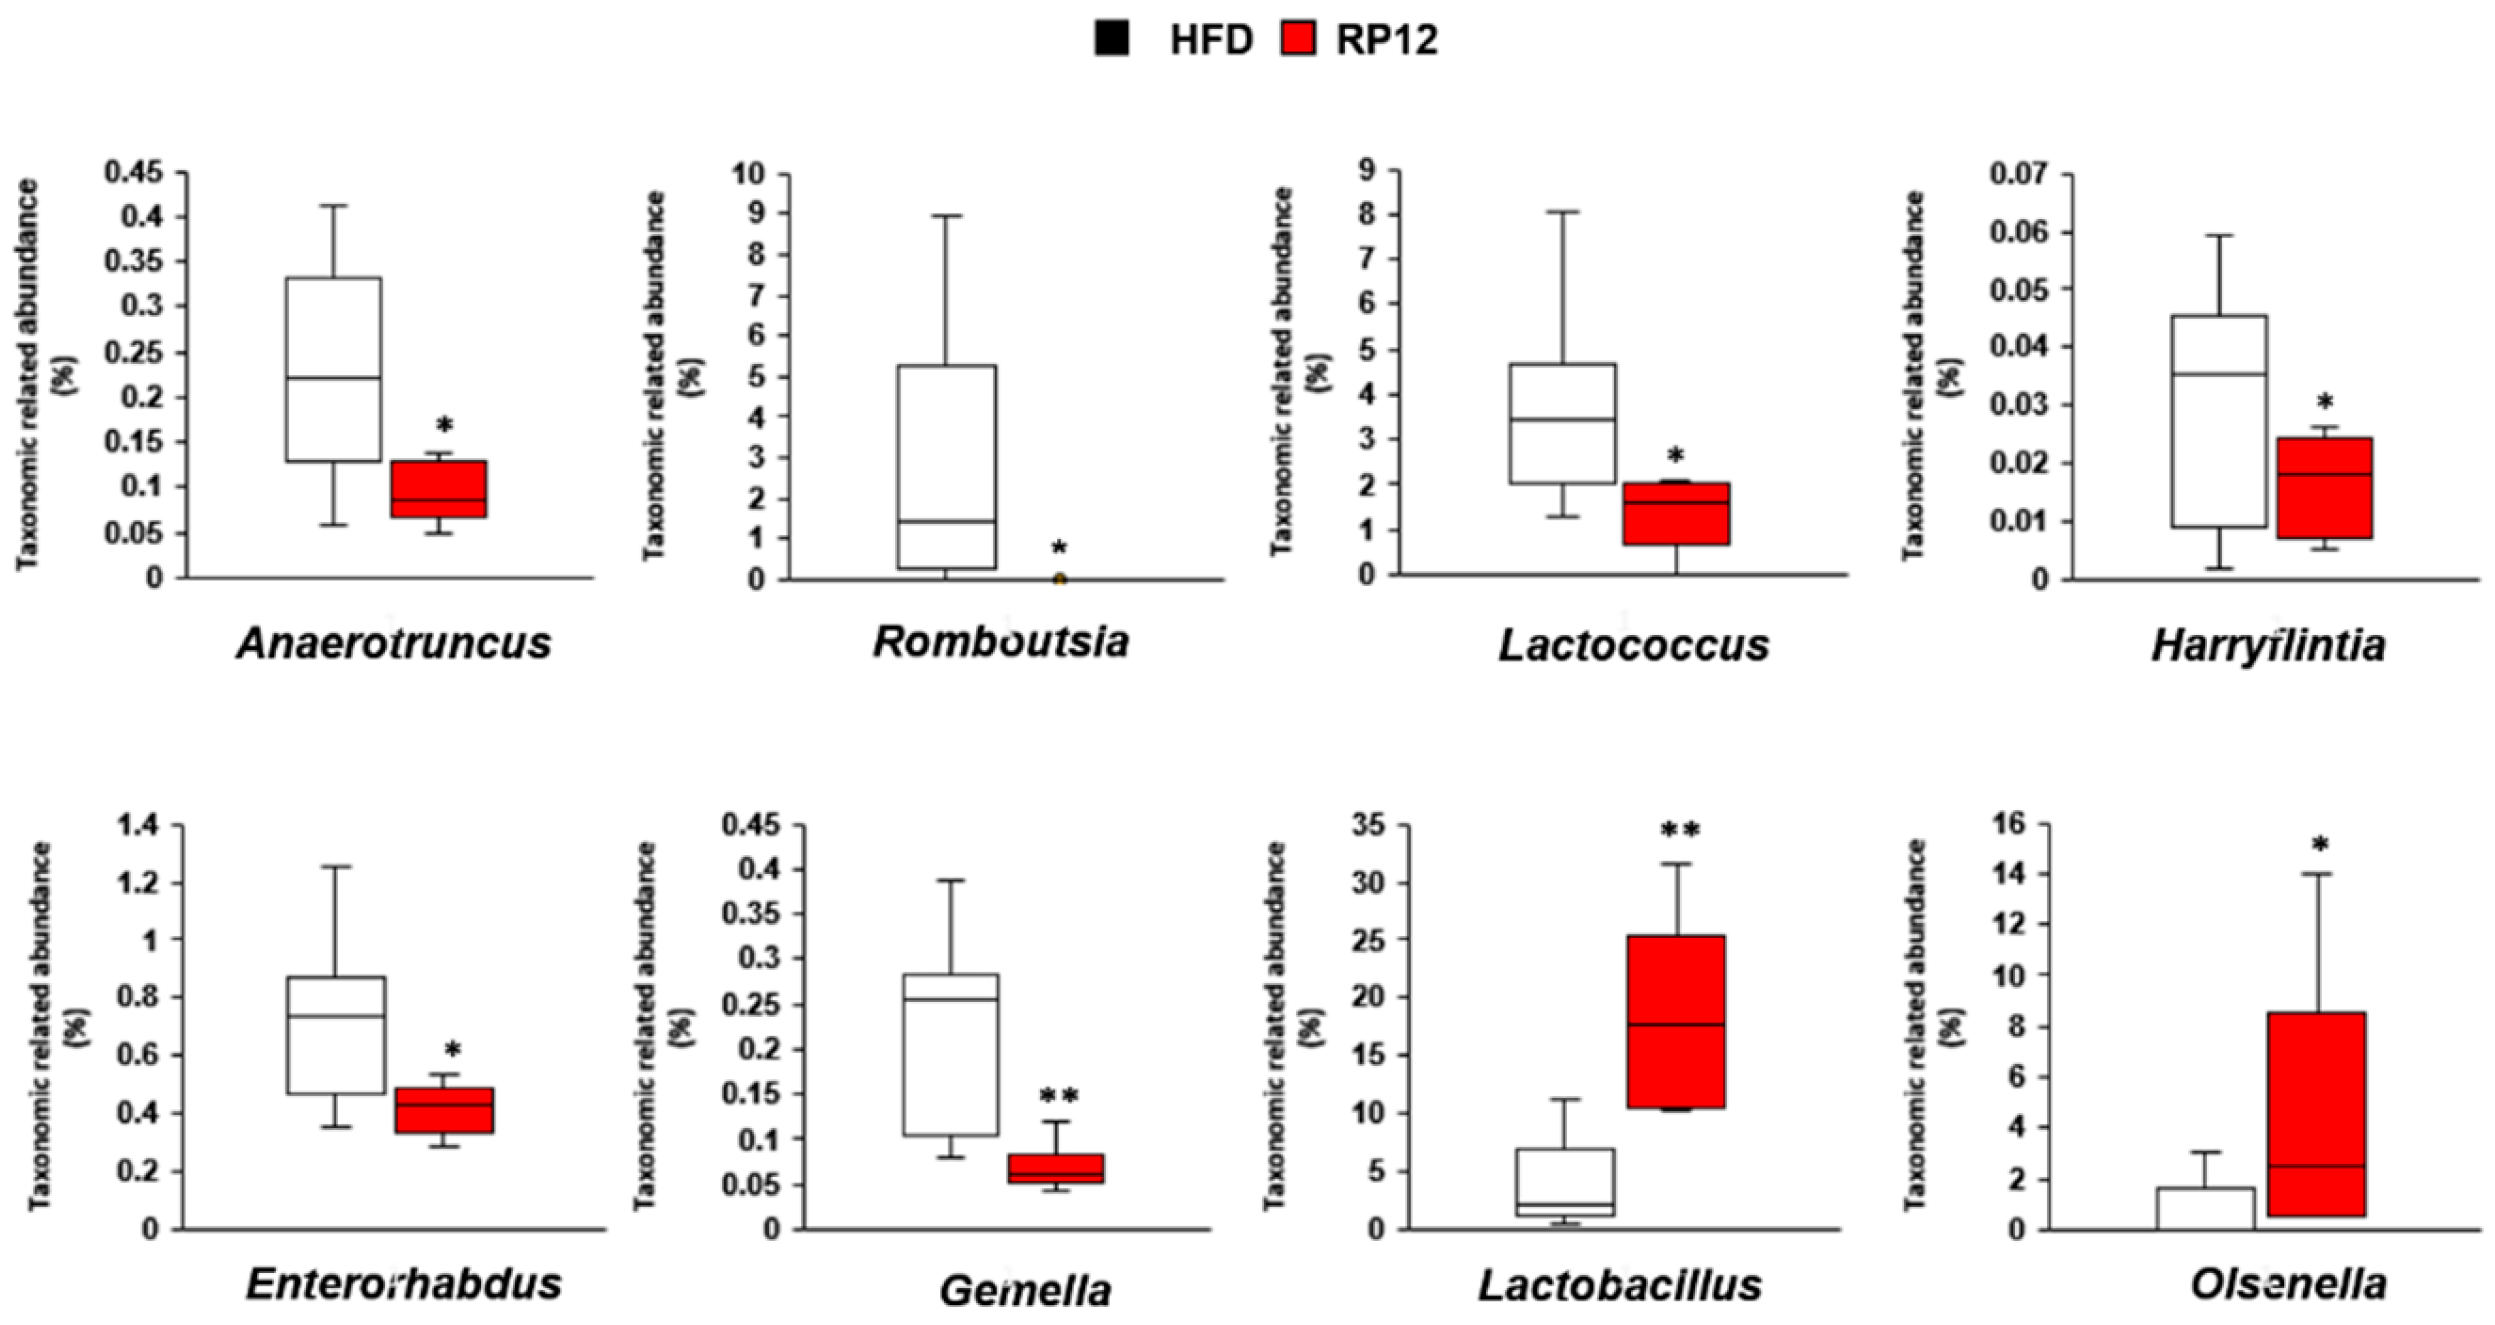
Figure 5.
The relative abundance of specific bacterial species in fecal microbiota at 10 weeks. The nonparametric Wilcoxon signed rank test for paired data and Mann-Whitney U test for unpaired data were used. Significant differences between HFD and RP12 are indicated as *p < 0.05, **p < 0.01.
Figure 5.
The relative abundance of specific bacterial species in fecal microbiota at 10 weeks. The nonparametric Wilcoxon signed rank test for paired data and Mann-Whitney U test for unpaired data were used. Significant differences between HFD and RP12 are indicated as *p < 0.05, **p < 0.01.
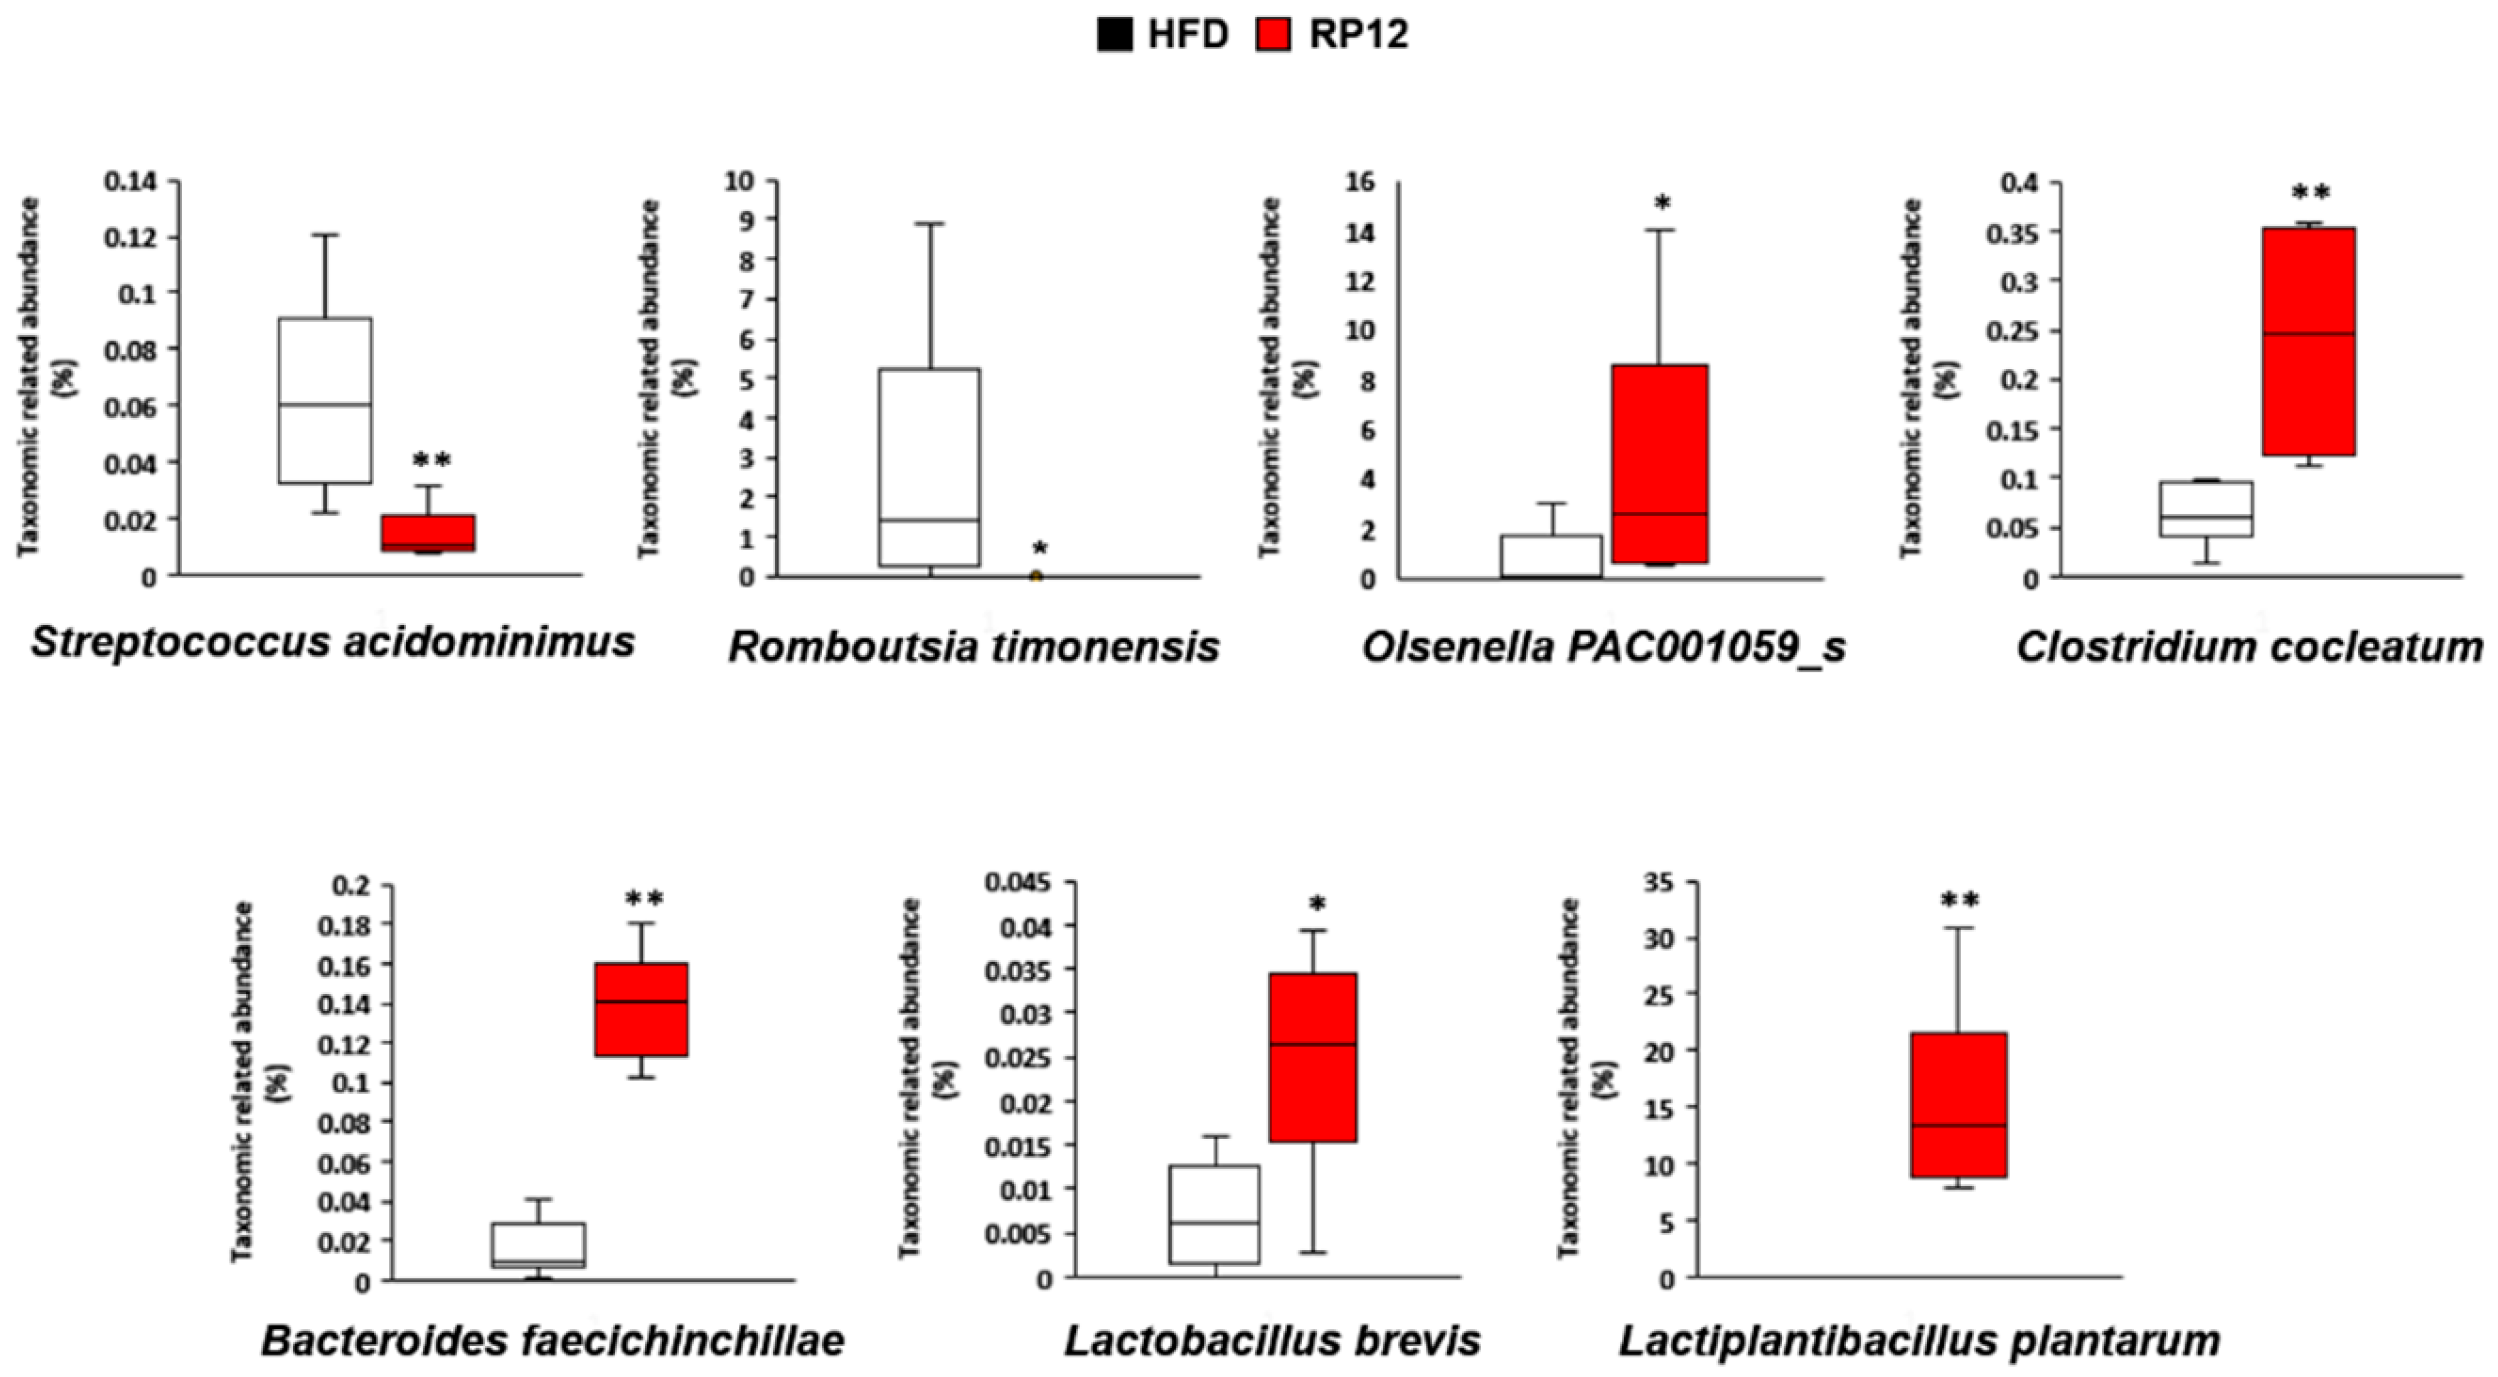
Figure 6.
Concentrations of lipids and short-chain fatty acids (SCFAs) from fecal contents of HFD and RP12 groups. (A) Lipid concentration. (B) Concentration of acetic acid, butyric acid and propionic acid. Results are present as mean ± SEM (n = 7). Significant differences between HFD and RP12 are indicated as *p < 0.05, ***p < 0.001.
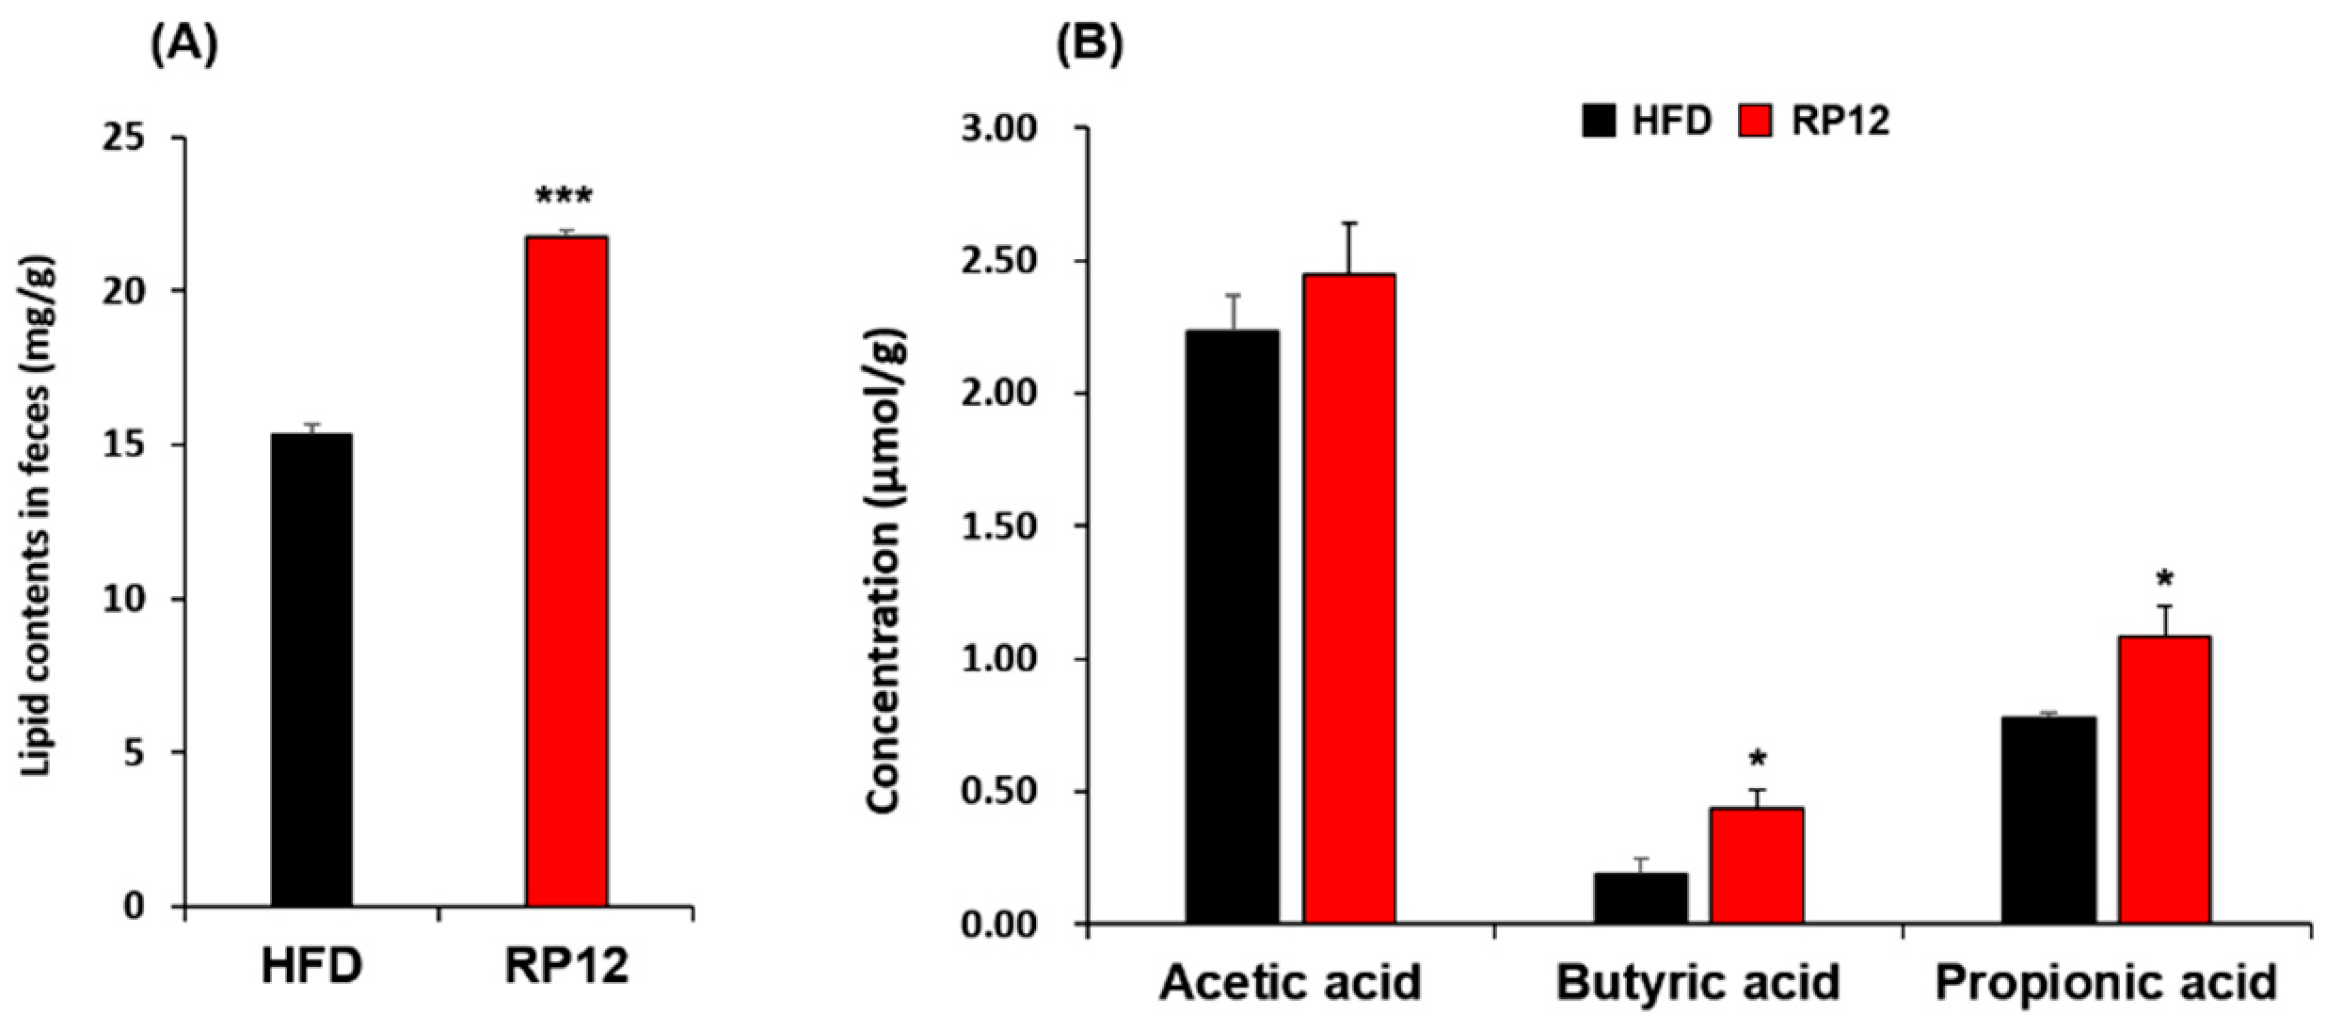
Figure 7.
Effect of administered Lactiplantibacillus plantarum RP12 on the histological parameters and expression of Claudin-1 and Muc2 in ileum and colon. (A) Representative H&E staining for sections of ileum. Scale bar, =100μm. (B) Representative H&E staining for sections of colon. Scale bar, =100μm. (C) The mRNA expression levels of Claudin-1 and Muc2 in ileum measured by quantitative real-time PCR. (D) The mRNA expression levels of Claudin-1 and Muc2 in colon measured by quantitative real-time PCR. Results are shown as mean ± SEM (n = 7). Significant differences between HFD and RP12 are indicated as *p < 0.05.
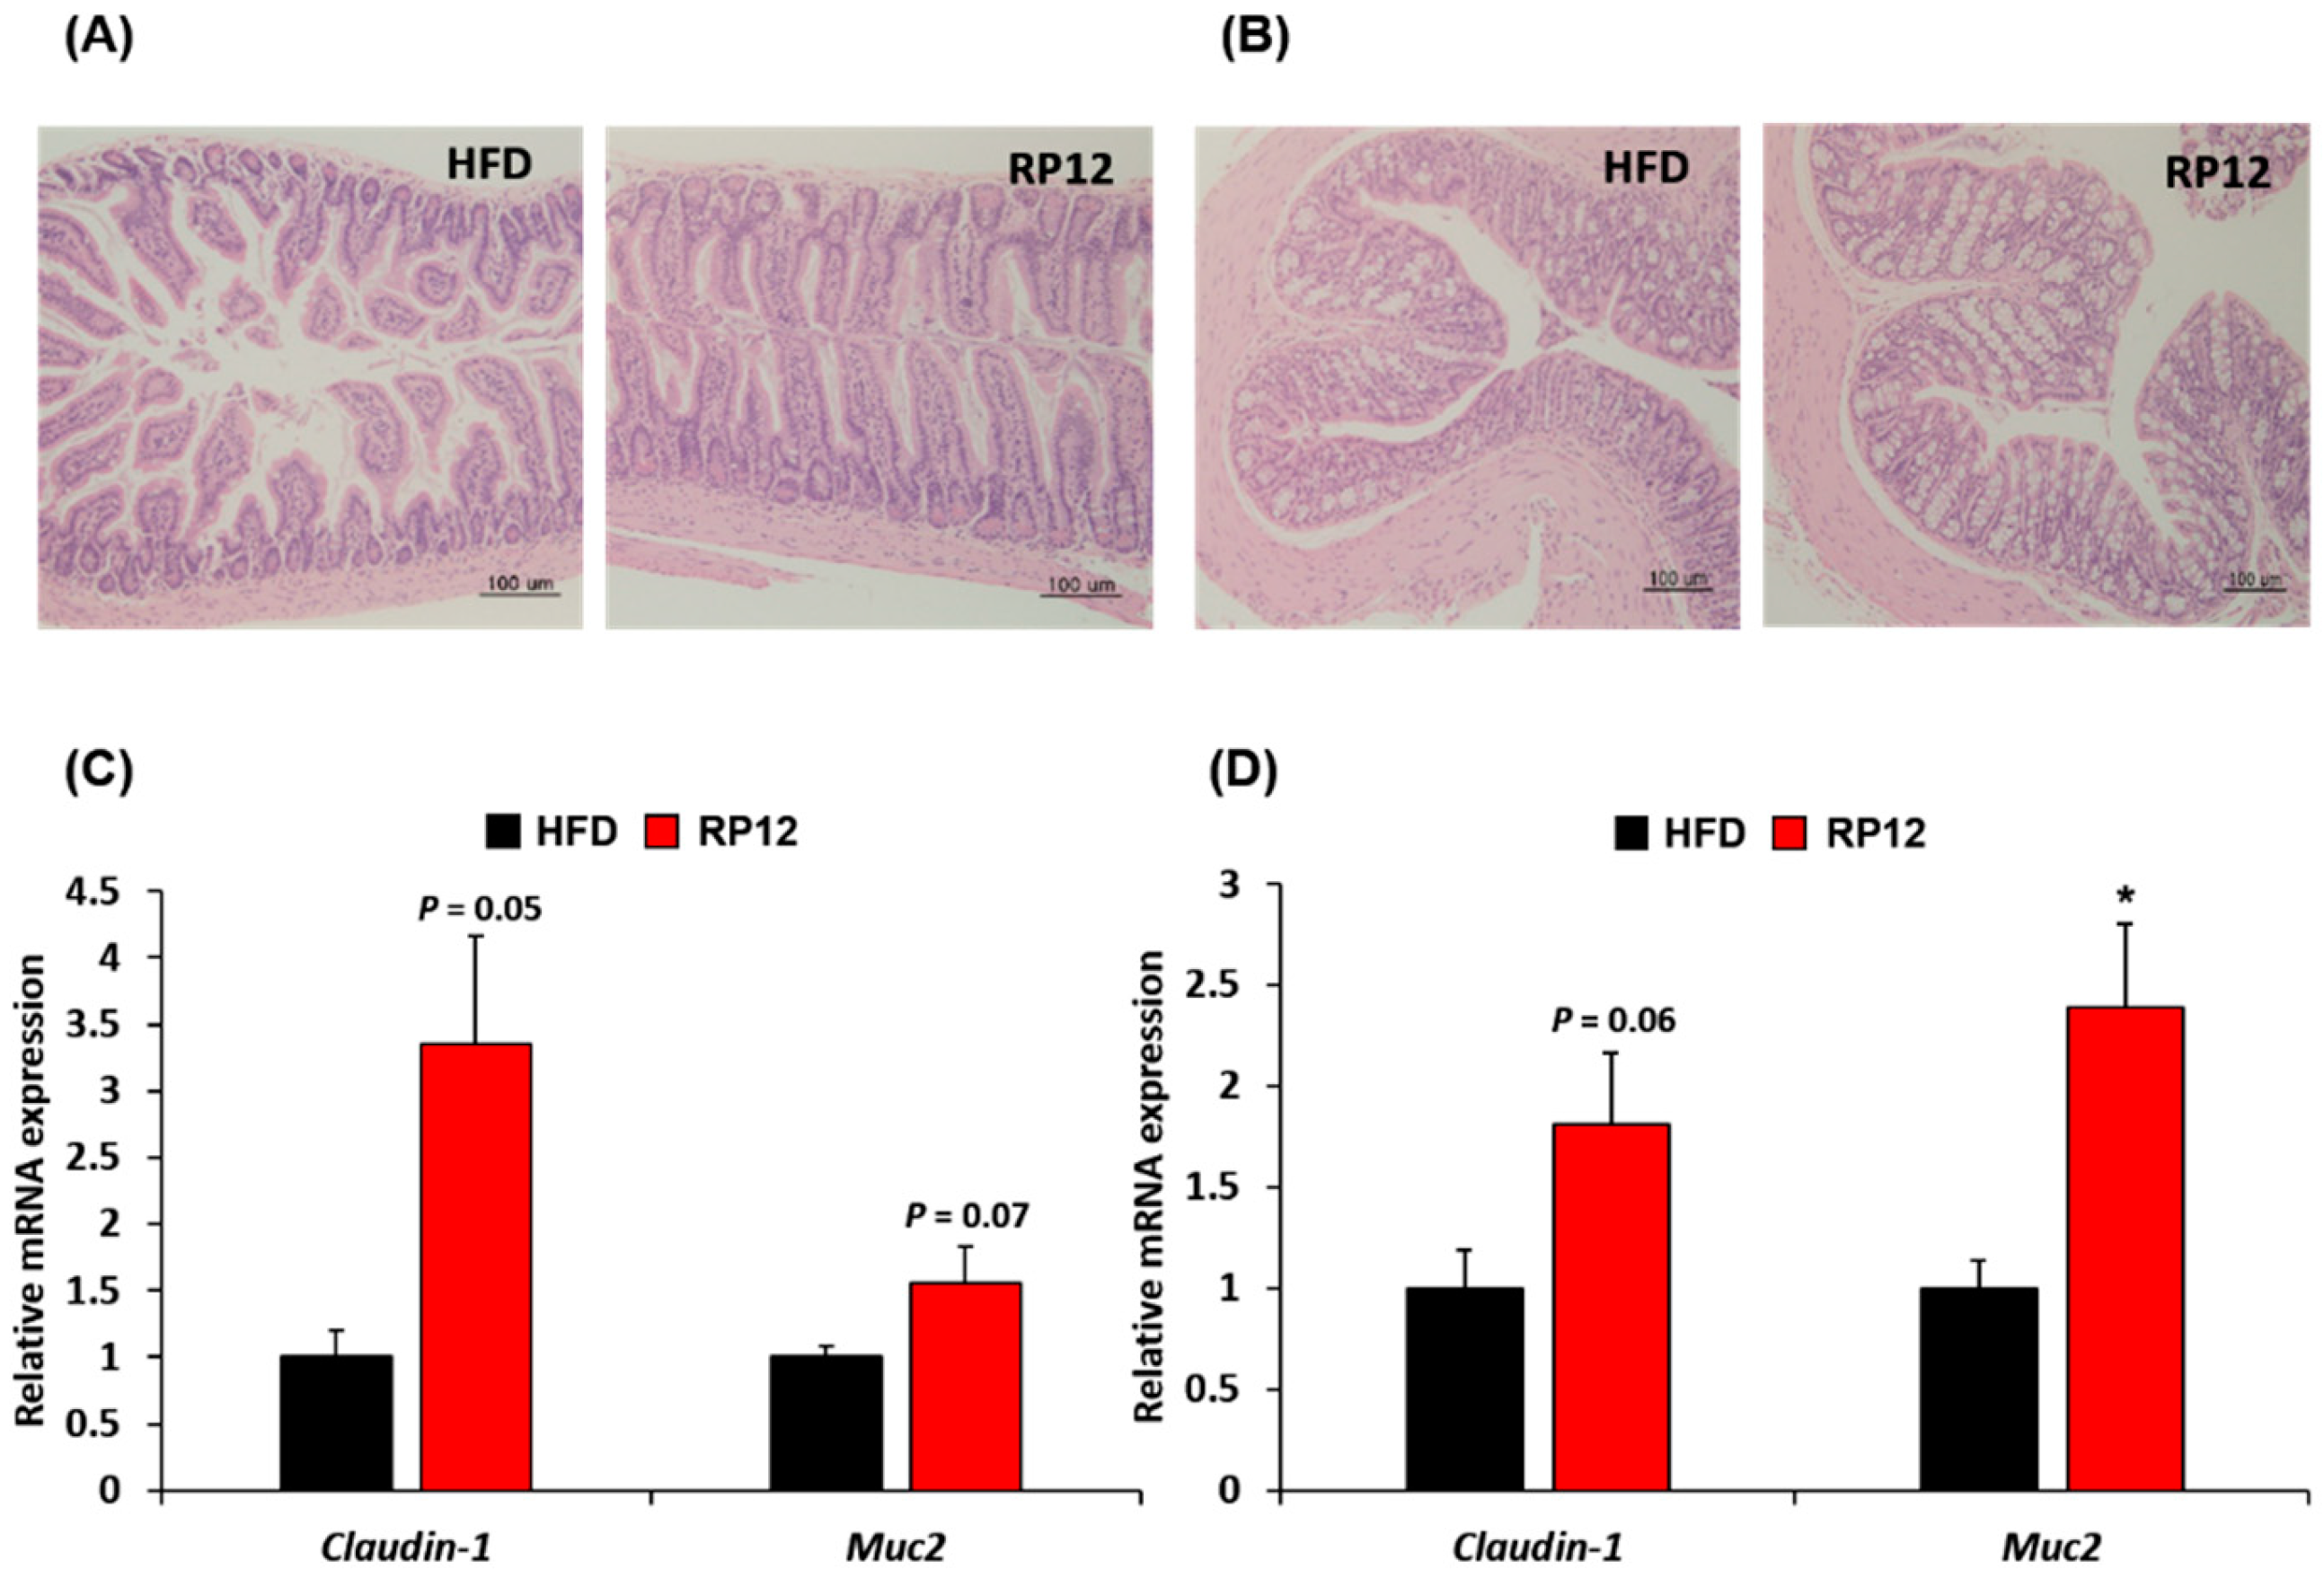

Table 1.
Biochemical parameter of serum in HFD and RP12 groups.
| HFD | RP12 | |
|---|---|---|
| Total cholesterol (mg/dl) | 151.43 ± 10.51 | 139.40 ± 10.78* |
| Glucose (mg/dl) | 196.29 ± 15.60 | 125.80 ± 13.34* |
| TG (mg/dl) | 69.29 ± 6.19 | 61.40 ± 2.22 |
| HDL (mg/dl) | 95.43 ± 2.89 | 98.20 ± 2.22 |
| LDL (mg/dl) | 22.71 ± 1.81 | 18.80 ± 0.66 |
Values are shown as the means ± SEM (n= 7). Abbreviation: TG, triglyceride; HDL, high-density lipoprotein; LDL, low-density lipoprotein. Significant differences between HFD and RP12 groups are indicated as *p < 0.05.
Disclaimer/Publisher’s Note: The statements, opinions and data contained in all publications are solely those of the individual author(s) and contributor(s) and not of MDPI and/or the editor(s). MDPI and/or the editor(s) disclaim responsibility for any injury to people or property resulting from any ideas, methods, instructions or products referred to in the content. |
© 2025 by the authors. Licensee MDPI, Basel, Switzerland. This article is an open access article distributed under the terms and conditions of the Creative Commons Attribution (CC BY) license (http://creativecommons.org/licenses/by/4.0/).
Copyright: This open access article is published under a Creative Commons CC BY 4.0 license, which permit the free download, distribution, and reuse, provided that the author and preprint are cited in any reuse.


