Preprint
Article

This version is not peer-reviewed.

Enhancing Gut Microbiome and Metabolic Health in Mice Through Administration of the Presumptive Probiotic Strain Lactiplantibacillus pentosus PE11

A peer-reviewed article of this preprint also exists.

Submitted:

08 December 2024

Posted:

09 December 2024

You are already at the latest version

Abstract

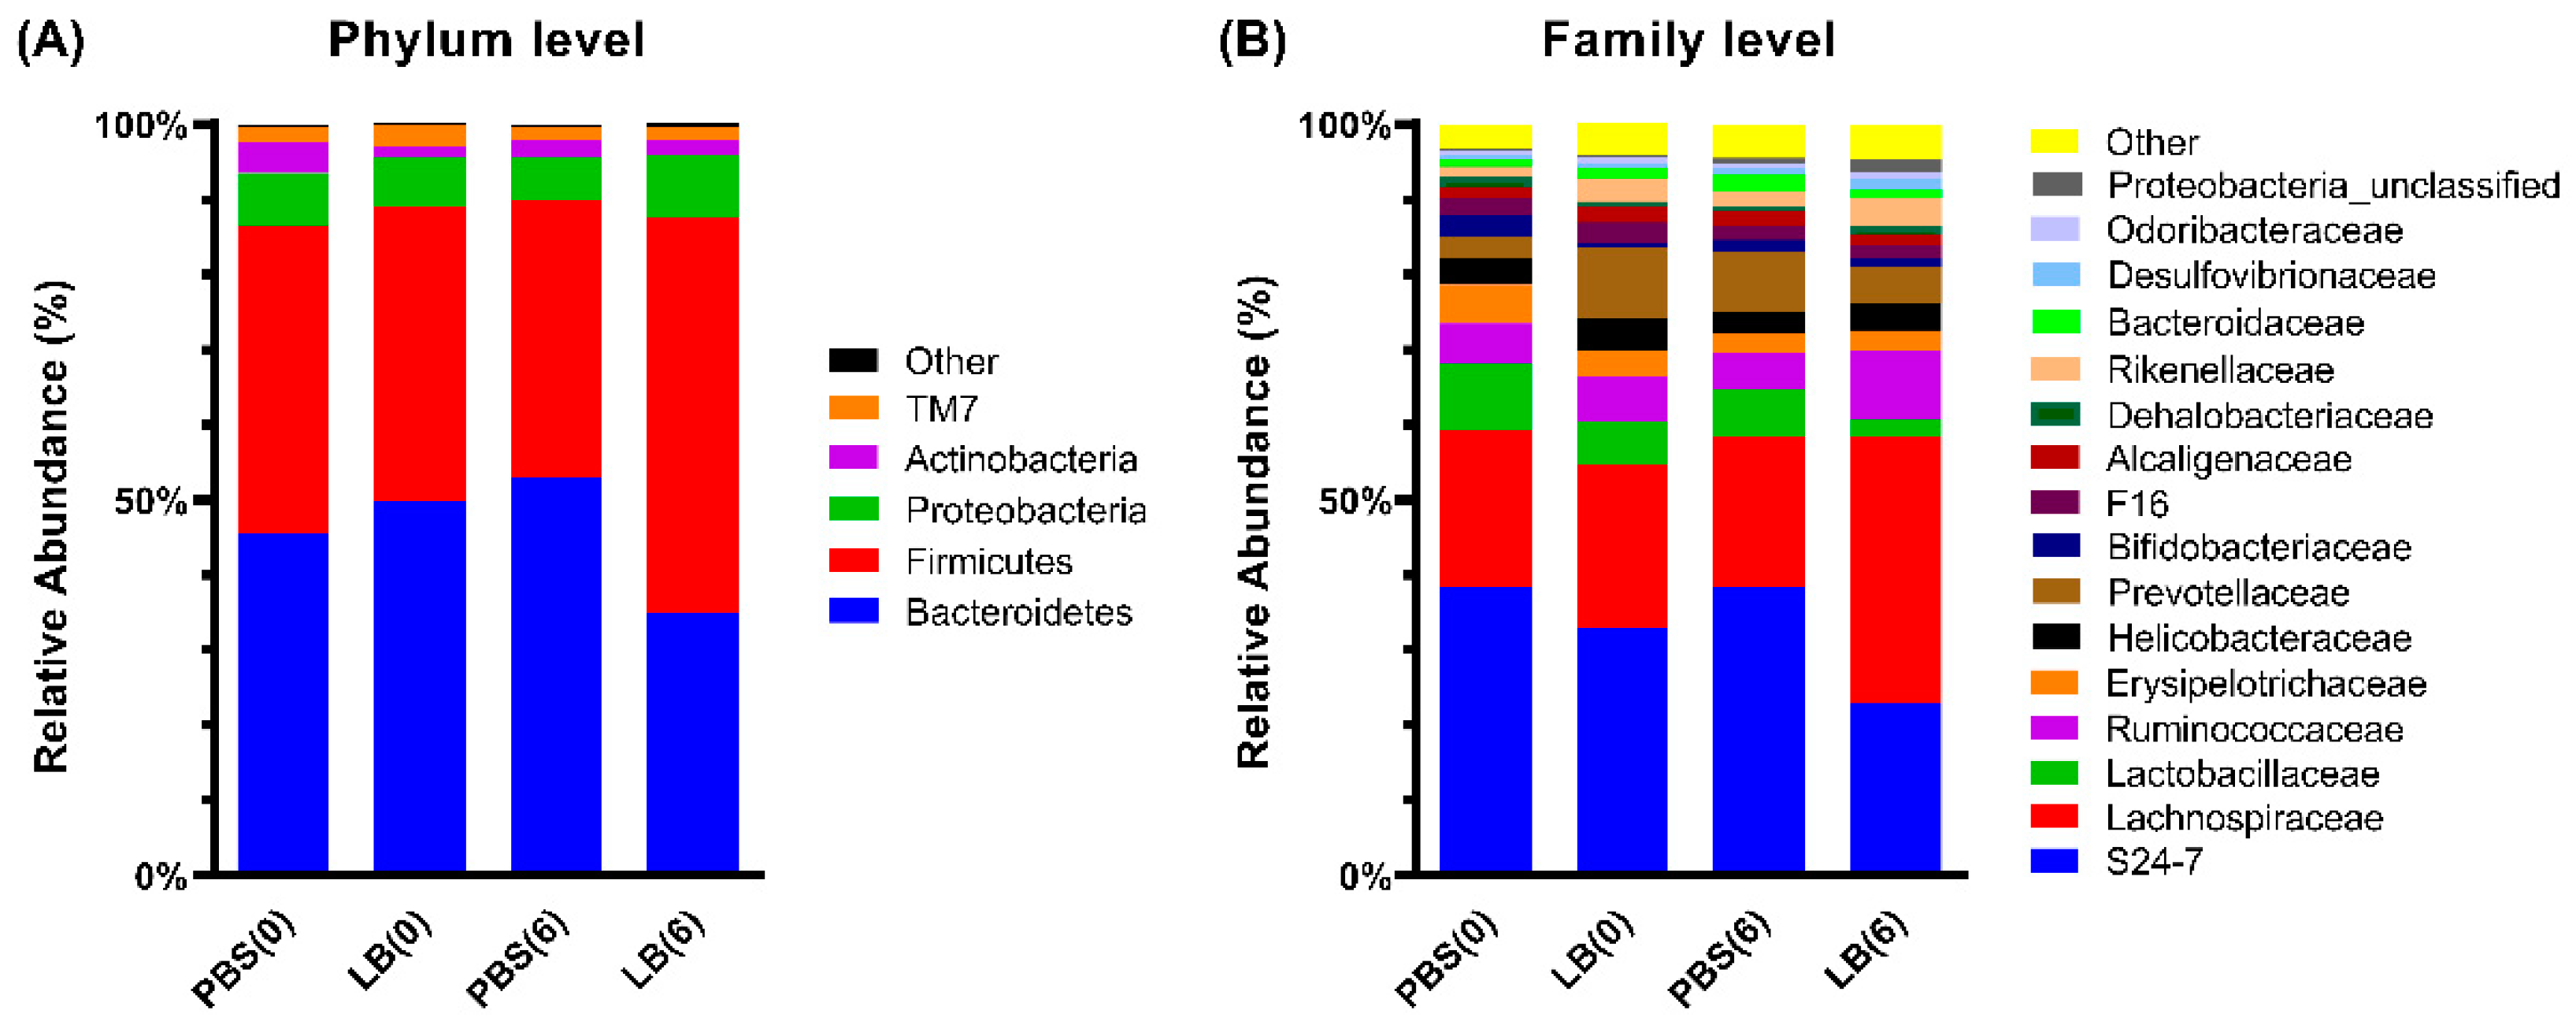
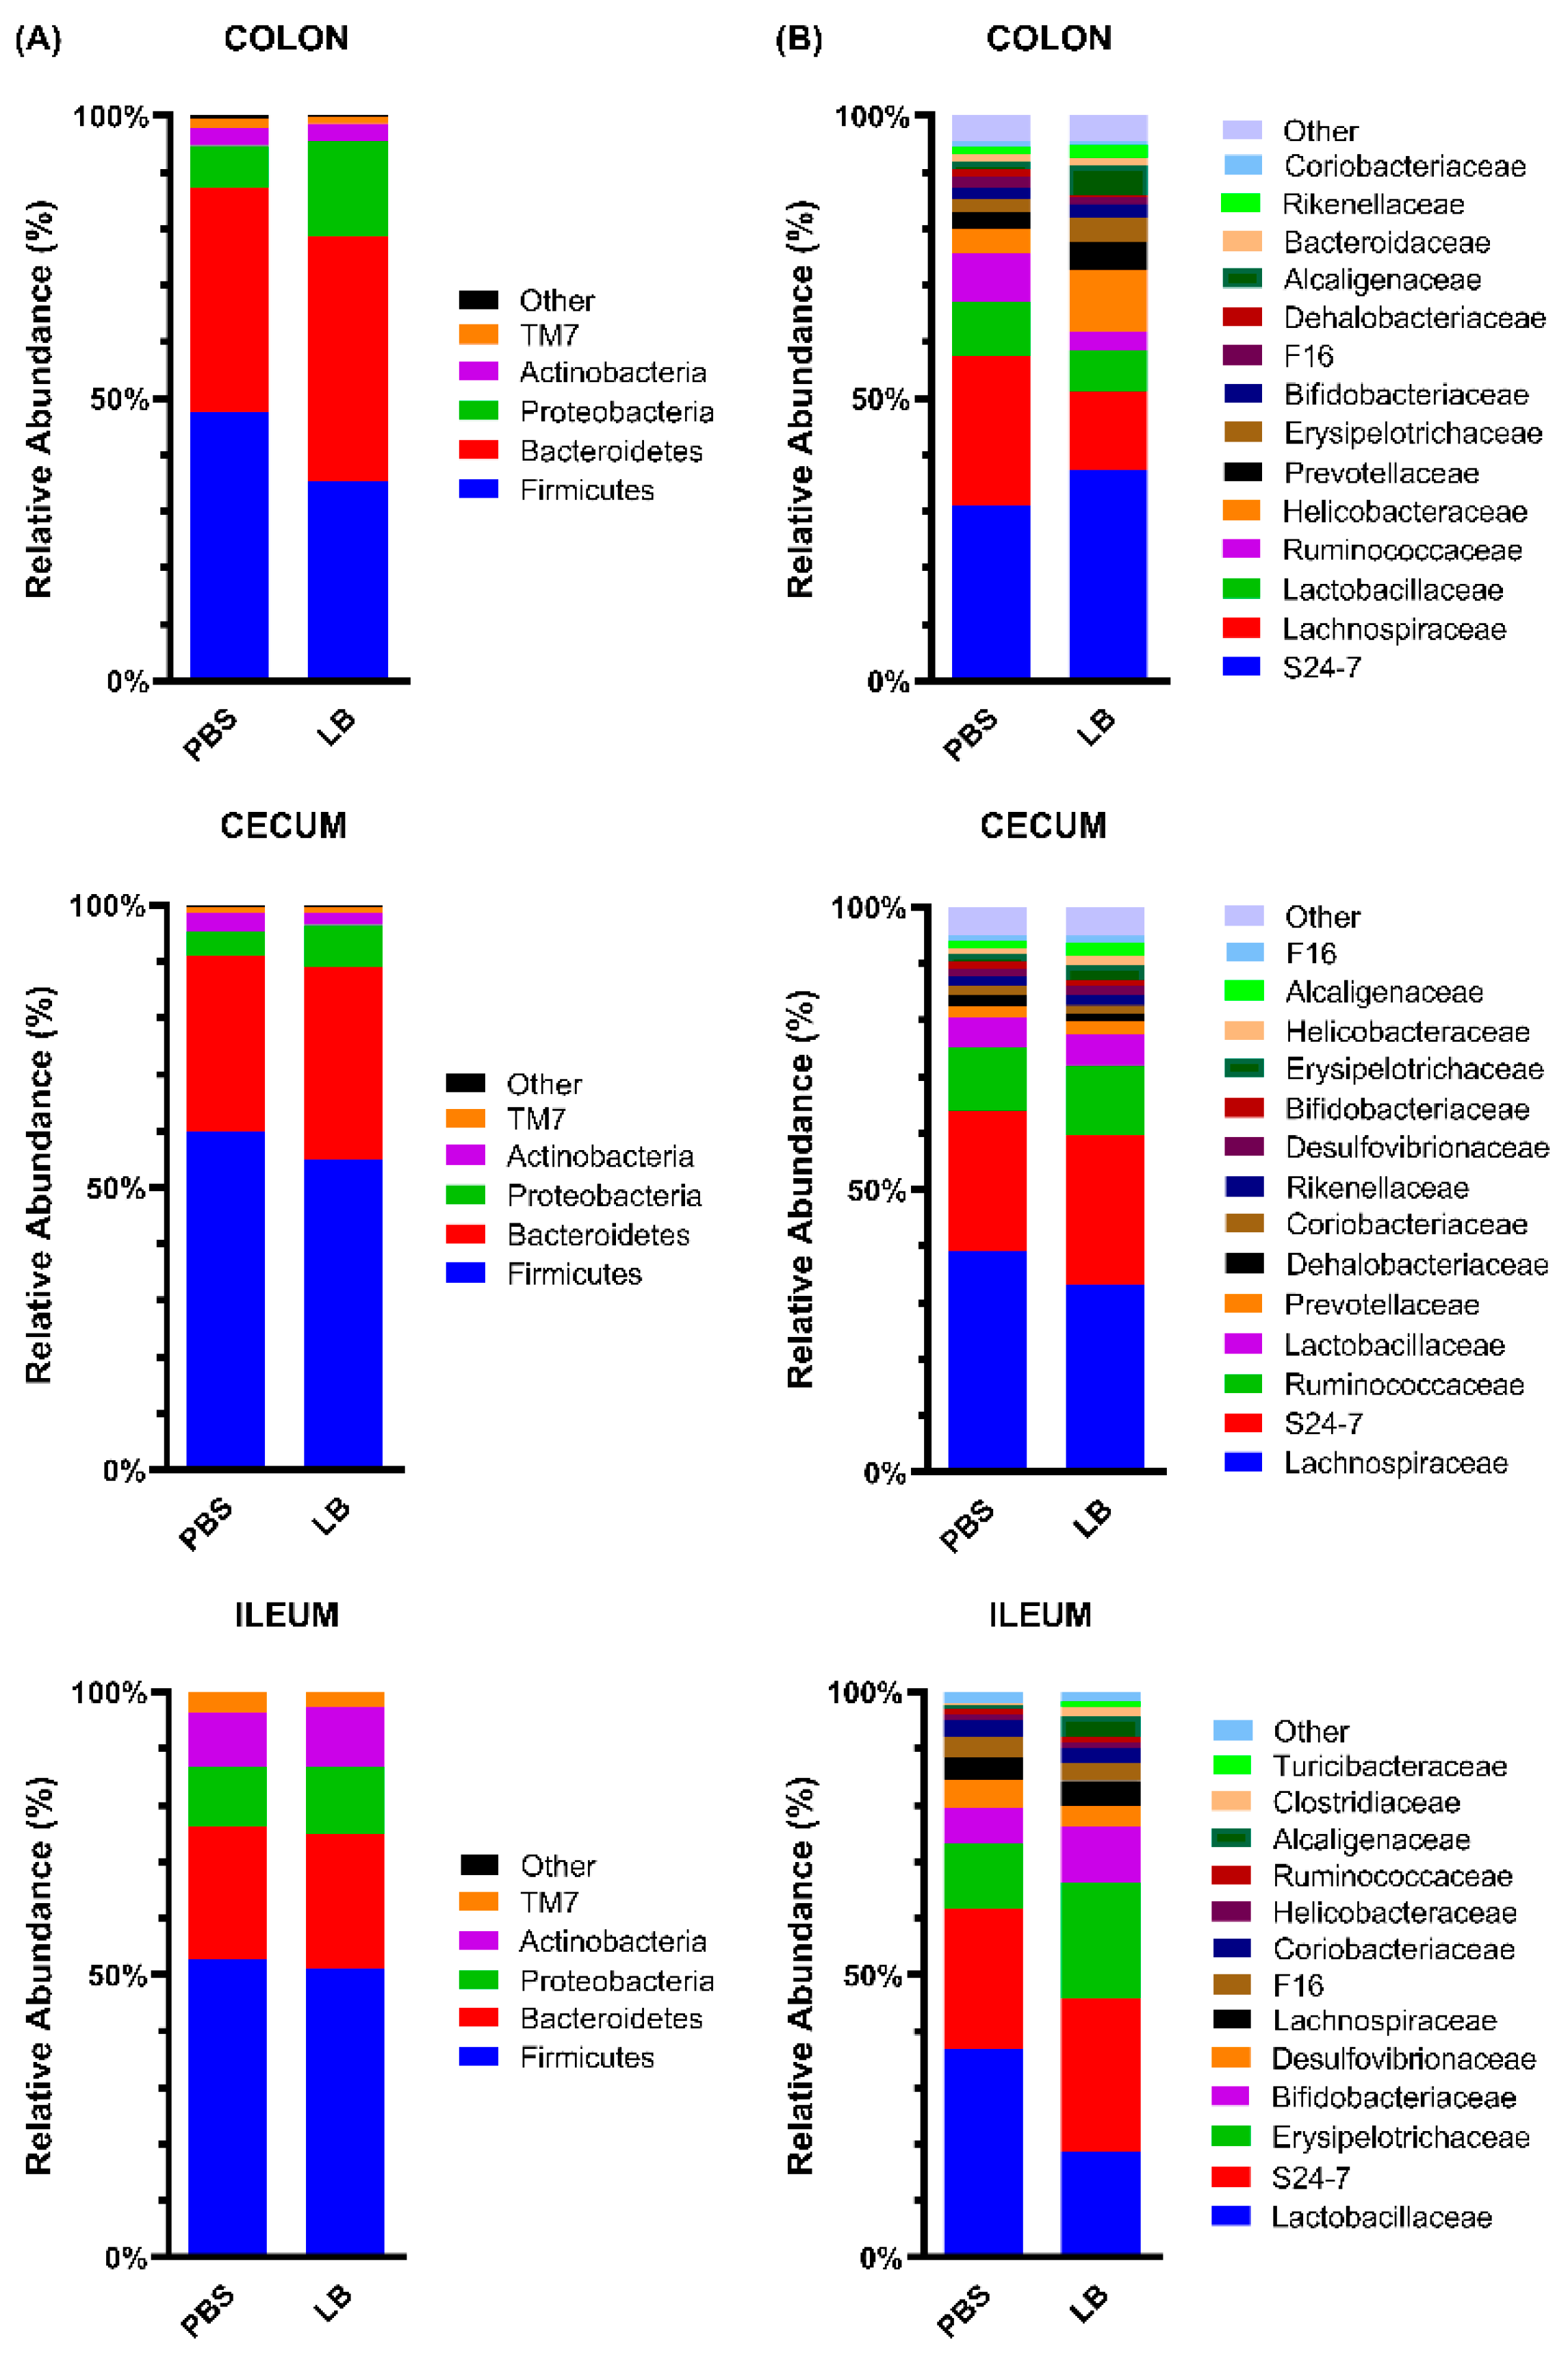
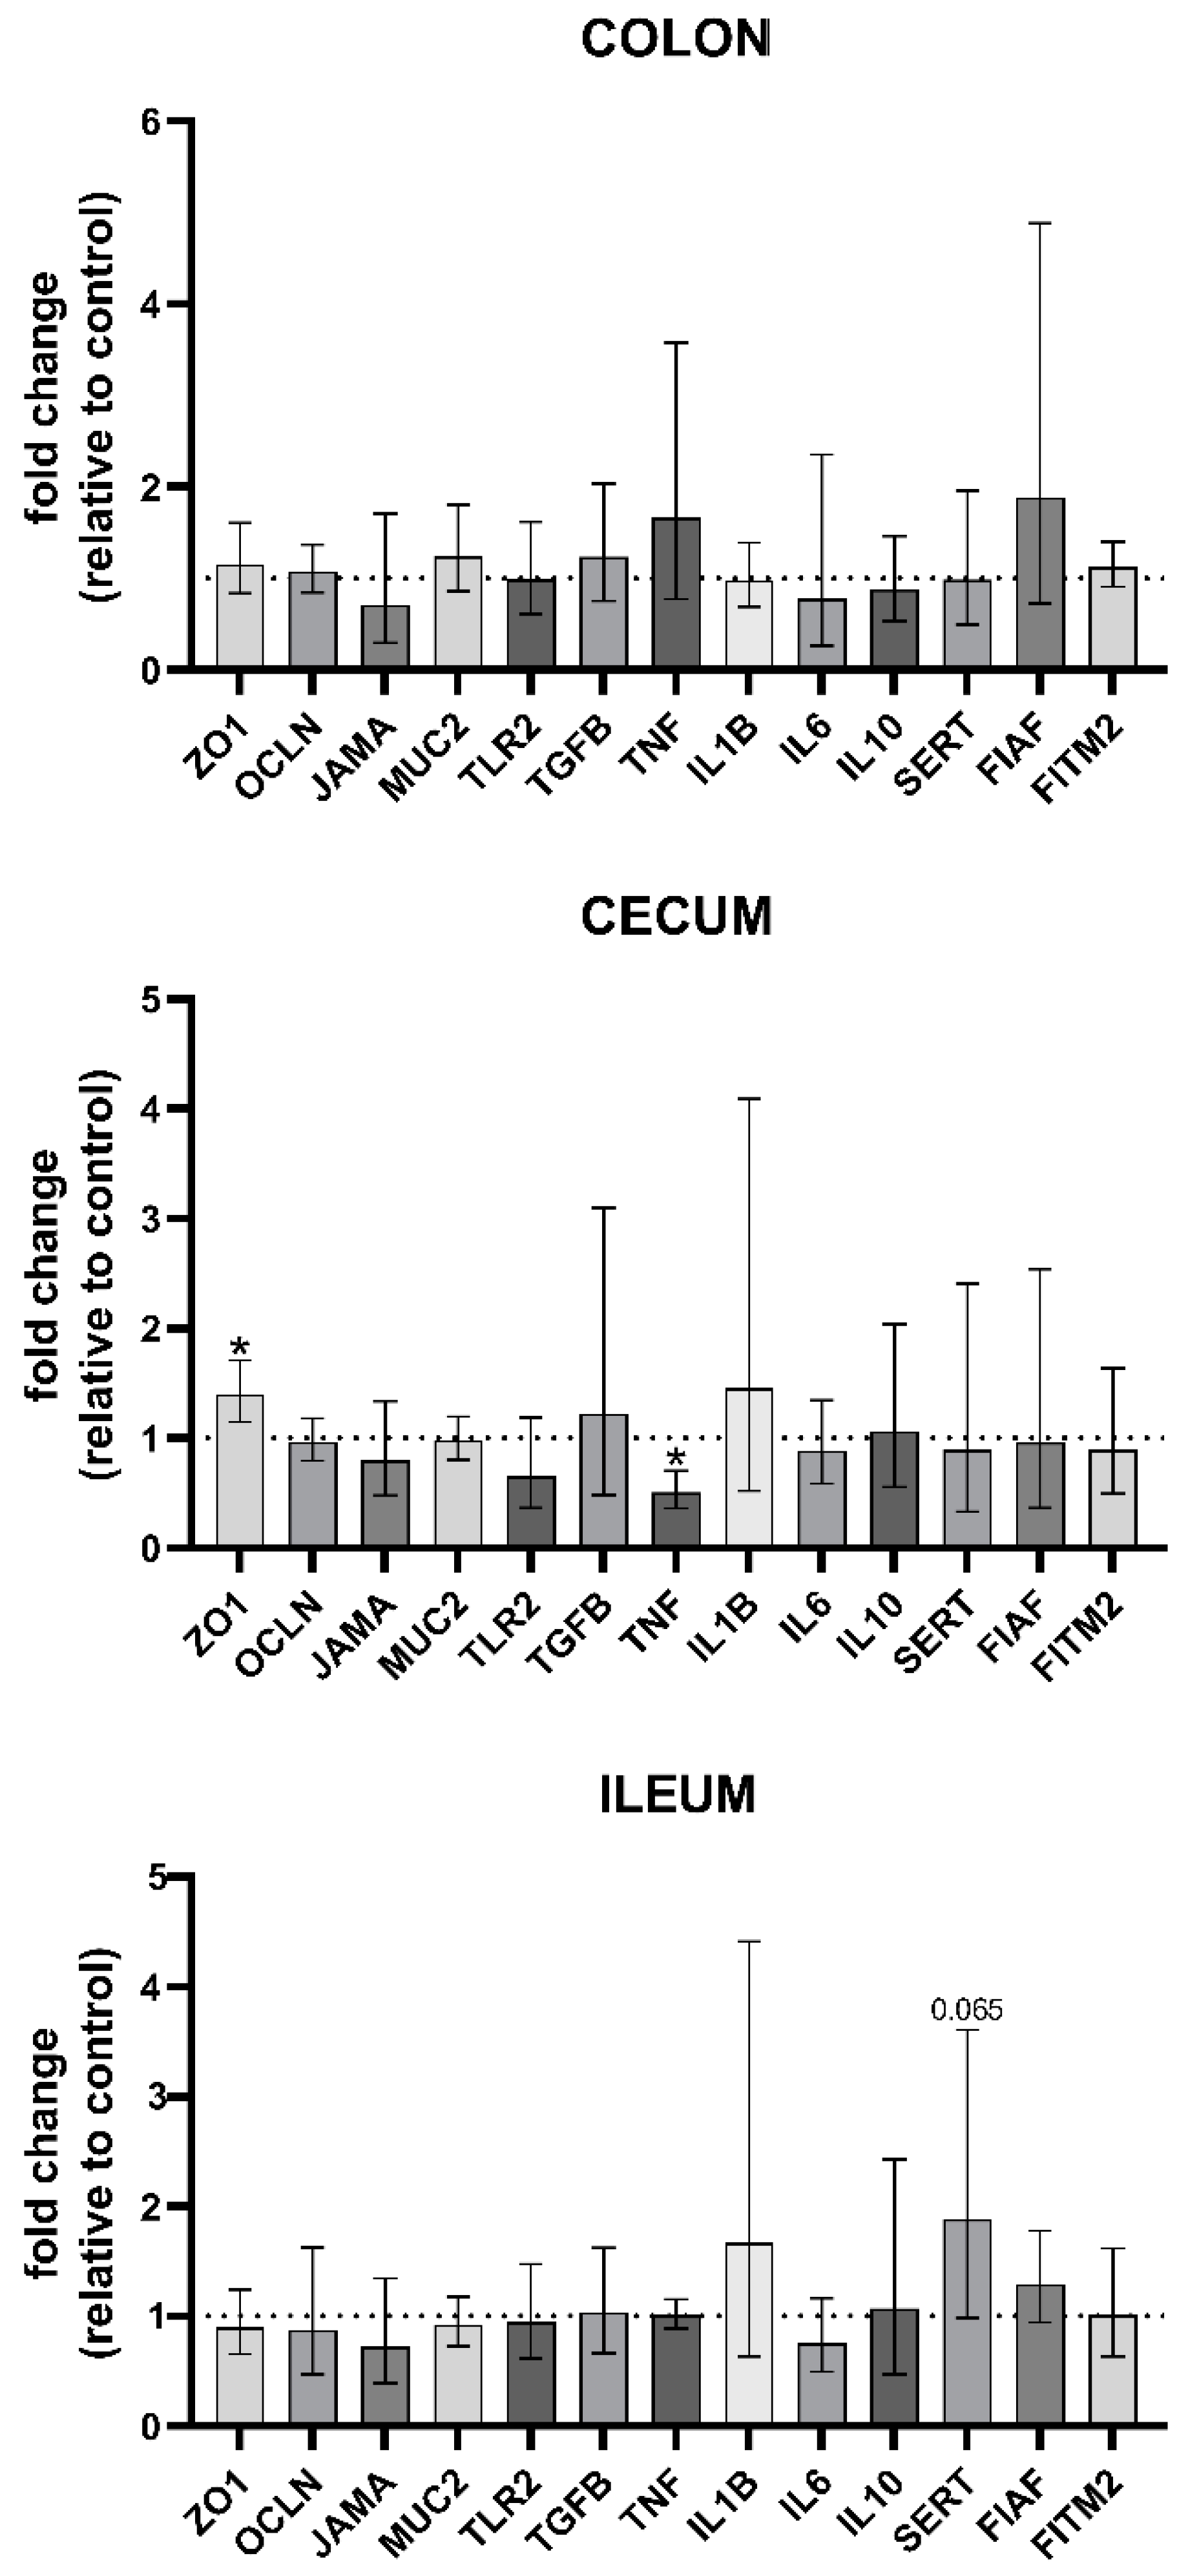
Over the past decade, probiotics have gained increasing recognition for their health benefits to the host. While most research has focused on the therapeutic effects of probiotics in the treatment of various diseases, recent years have seen a shift towards exploring their role in enhancing and supporting overall health. In this work, we have studied the effects of a novel potential probiotic strain, Lactiplantibacillus pentosus PE11, in healthy mice following a six-week dietary intervention. The assessment included monitoring the general health of the animals, biochemical analyses, profiling of the gut and fecal microbial communities and gene expression analysis. Our results showed that the administration of Lactiplantibacillus pentosus PE11 led to significant changes in the composition of the fecal microbiome, specifically an increase in the Firmicutes/Bacteroidetes ratio and in the relative abundance of the Lachnospiraceae, Ruminococcaceae and Rikenellaceae families. Additionally, a significant reduction in triglyceride and alanine aminotransferase levels was observed, along with a trend toward decreased total cholesterol levels. Our results suggest that in healthy mice Lactiplantibacillus pentosus PE11 has the potential to positively influence gut microbiome structure and metabolism, thereby supporting improved overall health.

Keywords: 
;  ;  ;  ;  

1. Introduction

The intestinal microbiota is a complex and diverse community of microorganisms residing in the gastrointestinal tract (GI), encompassing over 1,500 species of bacteria, fungi, archaea, protozoa, and viruses [1]. Among these, bacterial species are the most predominant [2]. The structure of the gut microbial community varies across different segments of the GI, reflecting the distinct environmental conditions in each region. Microbial abundance and diversity gradually increase along the GI, from the relatively low levels in the stomach to the dense and diverse populations found in the colon [3]. Gut microbiota maintains a symbiotic relationship with the host and, along with its metabolites, has a crucial role; its primary functions include nutrient metabolism, xenobiotic and drug metabolism, vitamin synthesis, and protection against pathogens [4]. Additionally, the gut microbiota contributes to the development of the immune system, the development and modulation of the nervous system as well as the maintenance of the integrity of the epithelial barrier [4]. Due to its extensive connections with various organs via neural, endocrine, humoral, immunological, and metabolic pathways, the gut microbiota has recently been recognized as a "vital organ" [5]. Numerous human diseases, including gastrointestinal, metabolic, cardiovascular, neurodevelopmental and neurodegenerative disorders have been linked to specific changes in the structure of the gut microbiota- a state known as dysbiosis [6,7].
According to FAO/WHO probiotics are “live microorganisms which when administered in adequate amounts confer a health benefit on the host” [8]. Over the past 20 years probiotics have been the focus of intensive research. Several bacterial strains, of the Pediococcus, Lactococcus, Enterococcus, Streptococcus, Propionibacterium, Bacillus, Lactobacillus and Bifidobacterium genera, commonly found in fermented foods, have been characterized for their probiotic properties [9,10]. Yeast strains of the genus Saccharomyces have also been characterized as probiotics [9]. A large body of evidence point to the beneficial effects of probiotic administration in managing various diseases, for instance intestinal inflammatory diseases, such as Crohn’s Disease and inflammatory bowel disease (IBD) or metabolic diseases, such as diabetes and obesity [9]; in these conditions the positive effects of probiotic administration include strengthening the gut barrier, suppressing pathogen growth and modulating the immune system [2,10]. Moreover, probiotics contribute significantly to the modulation of lipid and bile salt metabolism, the synthesis of vitamin K, riboflavin and folate, enzyme activity, toxin neutralization and intestinal electrolyte absorption [2,10].
Most of the studies on probiotics focus on their role in disease management; relatively little is known, however, about strains that positively affect healthy individuals and the potential role probiotics may play in preserving overall health. Therefore, despite the widespread popularity of probiotics, clear guidelines for their use in healthy populations are still lacking [11]. Probiotic properties are strain specific, as different strains have different mechanisms of action [12]. A strain that is effective in managing a specific disorder may not have positive effects in healthy individuals. Unlike the study of probiotics in disease management, where outcomes are evaluated through symptom improvement, exploring the role of probiotics on healthy individuals presents unique challenges. Notably, the definition of a "normal" or "healthy" human gut microbiota remains a subject of debate [13]. Given the established diversity in the microbial communities of healthy populations—shaped by factors such as genotype, gender, diet, and age [2]—it is unrealistic to expect uniform effects from different probiotic strains or to assume that a particular strain will have identical effects across individuals. Therefore, studies in healthy animals are essential, as they can help identify strains that offer health benefits, evaluate their impact on overall well-being, and provide critical data before human trials.
Lactiplantibacillus pentosus PE11 (Lb. pentosus PE11), was isolated from olive fruit, classified and characterized through Whole Genome Sequencing analysis [14]. Notably this species has been included into the European Food Safety Authority’s (EFSA) QPS (Qualified Presumption of Safety) list. In vitro tests assessing the probiotic functional properties revealed that Lb. pentosus PE11 demonstrated robust probiotic characteristics, meeting the established standards for probiotics [14]. In this study, we investigate the effects of Lb. pentosus PE11 in healthy mice following a dietary intervention with a focus on GI microbiota, as well as biochemical and molecular markers of overall health. Lb. pentosus PE11 demonstrated probiotic potential by increasing butyrate-producing families like Lachnospiraceae and reducing triglycerides and ALT levels, suggesting benefits for metabolic and liver health. Region-specific effects on the expression of genes involved in intestinal barrier integrity and anti-inflammatory activity in the cecum suggest its role in promoting gut, and, when considered together with the previous data, in overall health.

2. Materials and Methods

2.1. Preparation of Bacterial Cultures

Lb. pentosus PE11 [14], was grown anaerobically on a synthetic medium (20 g/L glucose, 25 g/L yeast extract, 2 g/L KH2PO4, 6 g/L CH3COONa, 0.3 g/L MgSO4, and 0.05 g/L MnSO4) at 37 °C for 24 h. Freeze-dried cells were prepared as previously described [14]. Cell viability during storage was confirmed by microbiological analysis.

2.2. Animals

Three-month-old male C57BL/6 mice were housed in individually ventilated cages with free access to sterile laboratory chow (Mucedola, Italy, type 4RF25) and water. The mice were maintained at the Laboratory of Experimental Surgery & Surgical Research, Department of Medicine, Democritus University of Thrace (EL71 BIO exp 1), under a 12-h light/dark cycle at 21 ± 2 °C with relative humidity at 55 ± 10 %. G-power analysis was conducted to estimate the number of mice required for each experimental group. Mice were randomnly divided into two groups (n = 5 per group), in the same cage per treatment. Following a one-week adaptation one group received oral gavage with a suspension of 10⁹ CFU of Lb. pentosus PE11 in 200 μL sterile phosphate-buffered saline (PBS, Invitrogen, Waltham, MA, USA) (LB group), while the second group received 200 μL of sterile PBS (PBS group, control). The Lb. pentosus PE11 suspension was freshly prepared for each dose by resuspending freeze-dried bacterial cells in 200 μL PBS to achieve a final concentration of 5 × 10⁹ CFU/mL. Treatments were administered daily for the first week and every other day for the subsequent five weeks. Body weight was recorded weekly. Fecal samples were collected at the start of the experiment (Day 0) as well as at the end of the six-week experimental period (the day after the last gavage) and were stored at − 80 °C until DNA isolation. Mice were sacrificed via cervical dislocation and blood was collected by cardiac puncture. Luminal contents from the colon, cecum and ileum were immediately collected and stored at − 80 °C for subsequent microbiome analyses. Additionally, biopsies from these GI regions were collected, rinsed in cold PBS, and were either immediately stored at − 80°C for subsequent gene expression analysis or stored in 4% w/v paraformaldehyde (PFA) in PBS for at least 24 h at 4 °C for subsequent histological analysis.
All animal experiments were conducted in accordance with Directive 2010/63 of the European Parliament and Council of 22 September 2010, which was the legislation in force at the time. The protocol was approved by the Animal Care and Use Committee of the Prefecture of Evros, Thrace, Greece, under permit number 36662/118 (08/02/2022).

2.3. Serum Biochemical Analyses

Blood samples were centrifuged at 3,000 rpm for 15 min at 4 °C. Serum was collected and stored at −80 °C until further use. Serum levels of alanine aminotransferase (ALT), alkaline phosphatase (ALP), blood urea nitrogen (BUN), creatinine (CREA), high-density lipoprotein (HDL), low-density lipoprotein (LDL), total cholesterol (TC), and triglyceride (TG), were analyzed at an accredited laboratory (LABnet, Thessaloniki, Greece).

2.4. Histology

Fixed tissues were washed with PBS, cryoprotected in 30 % w/v sucrose in PBS at 4 °C, embedded in Tissue Freezing Medium (Leica, Germany) and sectioned at 12 µm using a Leica CM1900 UV cryostat (Leica, Germany). Sections were post fixed in 4% w/v PFA in PBS for 10 min, washed three times with PBS and stained with hematoxylin - eosin (Applichem, Germany) according to manufacturer's instructions. Samples were analyzed with a Leica DM5500 B microscope (Leica Microsystems Germany). Images were obtained using the camera software (LAS v4.13, Leica Microsystems) and image panels were designed using the GIMP (gimp.org). Villus height and crypt depth were measured in ImageJ version 2.9.0/1.53t (imagej.nih.gov).

2.5. Gene Expression Analysis

Total RNA was isolated from biopsies of the colon, cecum and ileum using Trizol Reagent (Thermo Fisher Scientific, Waltham, MA, USA), following the manufacturer’s instructions. The concentration and purity of the RNA were assessed using a NanoDrop Spectrophotometer (Thermo Fisher Scientific, Waltham, MA, USA) and its integrity was assessed by loading 100 ng of RNA on a 1.5% w/v agarose gel (UltraPure Agarose, Invitrogen, Carlsbad, CA, USA). RNA was stored at − 80 °C. cDNA synthesis was performed using 5 μg of total RNA with the Maxima H Minus First Strand cDNA Synthesis Kit with dsDNase (Thermo Fisher Scientific, Waltham, MA, USA), according to the manufacturer’s instructions. The cDNA was stored at − 20 °C.
Primers that amplify part of the coding sequences of the following genes were designed: ZO1 (Zona Occludens 1), OCLN (Occludin) JAMA (Junctional Adhesion Molecule A), TLR2 (Toll Like Receptor 2), MUC2 (Mucin 2), TGFB (Transforming Growth Factor β) TNF (Tumor Necrosis Factor), IL1B (Interleukin 1B), IL6 (Interleukin 6), IL10 (Interleukin 10), FIAF (Fasting - Induced Adipose Factor), FITM2 (Fat storage Inducing Transmembrane protein 2), SERT (5-hydroxytryptamine -Serotonin- Transporter) and CANX (Calnexin) using the NCBI Primer Blast tool, based on the cDNA sequences published in GenBank. The sequence, product length, and melting temperature (Tm) for each primer pair are listed in Table S1.
For quantitative polymerase chain reaction (qPCR), a 1:25 or 1:125 dilution of the cDNA was used. qPCR was conducted using a StepOne™ (Thermo Fisher Scientific, Waltham, MA, USA)thermocycler under the following conditions: initial denaturation at 95 °C for 2.5 min, followed by 40 cycles of denaturation at 95 °C for 10 s, annealing at the appropriate Tm for 20 s, and elongation at 72 °C for 10 s. The qPCR reaction volume was 20 μL, consisting of 10 μL KAPA SYBR FAST qPCR Master Mix (2×) (Sigma-Aldrich, St. Louis, MO, USA), 0.5 μM forward primer, 0.5 μM reverse primer and 5 μL diluted cDNA.
At the end of the reactions melting curves were analyzed to confirm amplification specificity. Baseline correction and PCR efficiency were determined for each reaction using the LinRegPCR program (v.2021.2) [15]. Efficiency-weighted Ct values were calculated for each pair of data points (Ct and PCR efficiency), along with the mean efficiency-weighted Ct value from the three technical replicates. Expression levels for each target gene were normalized to CANX, that was used as the reference gene. Fold changes in the expression of the target genes were calculated using the samples of the PBS group as reference [16].

2.6. Analysis of the Microbial Communities

2.6.1. DNA Extraction

Metagenomic DNA isolation was performed using NucleoSpinStool Mini Kit (Macherey-Nagel, Düren, Germany) according to the manufacturer's instructions. Samples were homogenized with Precellys Evolution Homogenizer (Bertin Instruments, Montigny-le-Bretonneux, France) (3 cycles at 6,300 rpm for 30 s with 30 s interval between cycles). NanoDrop Spectrophotometer was used to assess purity and concentration of the isolated DNA; integrity was assessed by gel electrophoresis on an 1% w/v agarose gel.

2.6.2. Amplicon-Based Next Generation Sequencing

Amplicon-based Next-Generation Sequencing (NGS) was employed to analyze the structure of microbial communities. V4 hypervariable region of the 16SrRNA locus, approximately 290 bp in length, was amplified using the primers 5’-GTGCCAGCMGCCGCGGTAA-3’ (forward) and 5’GGACTACHVGGGTWTCTAAT-3’ (reverse). For the Polymerase Chain Reaction (PCR), 50 ng of metagenomic DNA were used in a reaction of 20 μl with 10 μl of KAPA SYBR FAST qPCR Master Mix and 0.2 μΜ of each primer. The cycling conditions were as follows: initial denaturation at 95 oC for 5 min, followed by 25 cycles of denaturation at 95 oC for 30 s, annealing at 58 oC for 40 s and elongation at 72 oC for 40 s, with a final elongation step at 72 oC for 5 min.
The PCR products were analyzed on a 2% w/v agarose gel (cleaned-up with NucleoMag NGS Clean-up and Size Select magnetic beads (Macherey-Nagel, Düren, Germany), at a volume ratio of DNA to beads of 1/1.8 and quantified using Qubit 4 Fluorometer (Thermo Fisher Scientific, Waltham, MA, USA) with the Qubit dsDNA HS Assay Kit (Thermo Fisher Scientific, Waltham, MA, USA). Library preparation and sequencing were performed on the ION Torrent S5 platform as previously described [17].

2.6.3. Data Analysis

Torrent Suite software (Thermo Fisher Scientific, Waltham, MA, USA) was used to generate UBAM files of the raw data, excluding polyclonal, low-quality, and low-signal reads. The UBAM files were converted to FASTA format using Samtools (v.1.13) [18].
The initial steps of the analysis were performed with Mothur (v.1.45.3) [19], following previously described protocols [17]. Low-abundance bacterial operational taxonomic units (OTUs) were filtered out using a 0.1% threshold with a 25% prevalence rule, implemented via the online platform MicrobiomeAnalyst (https://www.microbiomeanalyst.ca/) [20]. Alpha- and beta-diversity analyses were conducted, including the calculation of Shannon and Simpson diversity indices, rarefaction and Shannon curves, Principal Coordinates Analysis (PCoA) based on Bray–Curtis distance, and Permutational Multivariate Analysis of Variance (PERMANOVA). These analyses were carried out using the PAST (PAleontological STatistics) software package (v.4.03) [21]. Graphs displaying the median relative abundance of each group at the phylum and family levels were generated using GraphPad Prism 9.0 (GraphPad Software, CA, USA).

2.7. Statistical Analysis

Differences in animal weight, biochemical parameter concentrations, colonic and cecal crypt depth, ileal villus height, gene expression levels, diversity indices, and relative abundances of bacterial taxa between groups were assessed using either an unpaired t-test (two-tailed) or a Mann–Whitney U-test (two-tailed). The t-test was applied to data with a normal distribution, while the Mann–Whitney U-test was used for non-normally distributed data. A p-value of less than 0.05 was considered statistically significant. Statistical analyses were performed using GraphPad Prism 9.0 (GraphPad Software, CA, USA).

3. Results

3.1.Β. Ody Weight

Body weight did not differ significantly between Lb. pentosus PE11-treated and control mice throughout the dietary intervention (Figure S1A, Table S2). Similarly, no significant difference in total body weight gain was observed at the end of the intervention (Figure S1B, Table S2). These findings indicate that Lb. pentosus PE11 administration had no impact on growth performance.

3.2. Histological Analysis

Histological evaluation did not reveal any alterations (Figure S2). Moreover, no significant differences in the colonic and cecal crypt depth or in the height of the ileal villi were observed between Lb. pentosus PE11-treated and control mice (Figure S3).

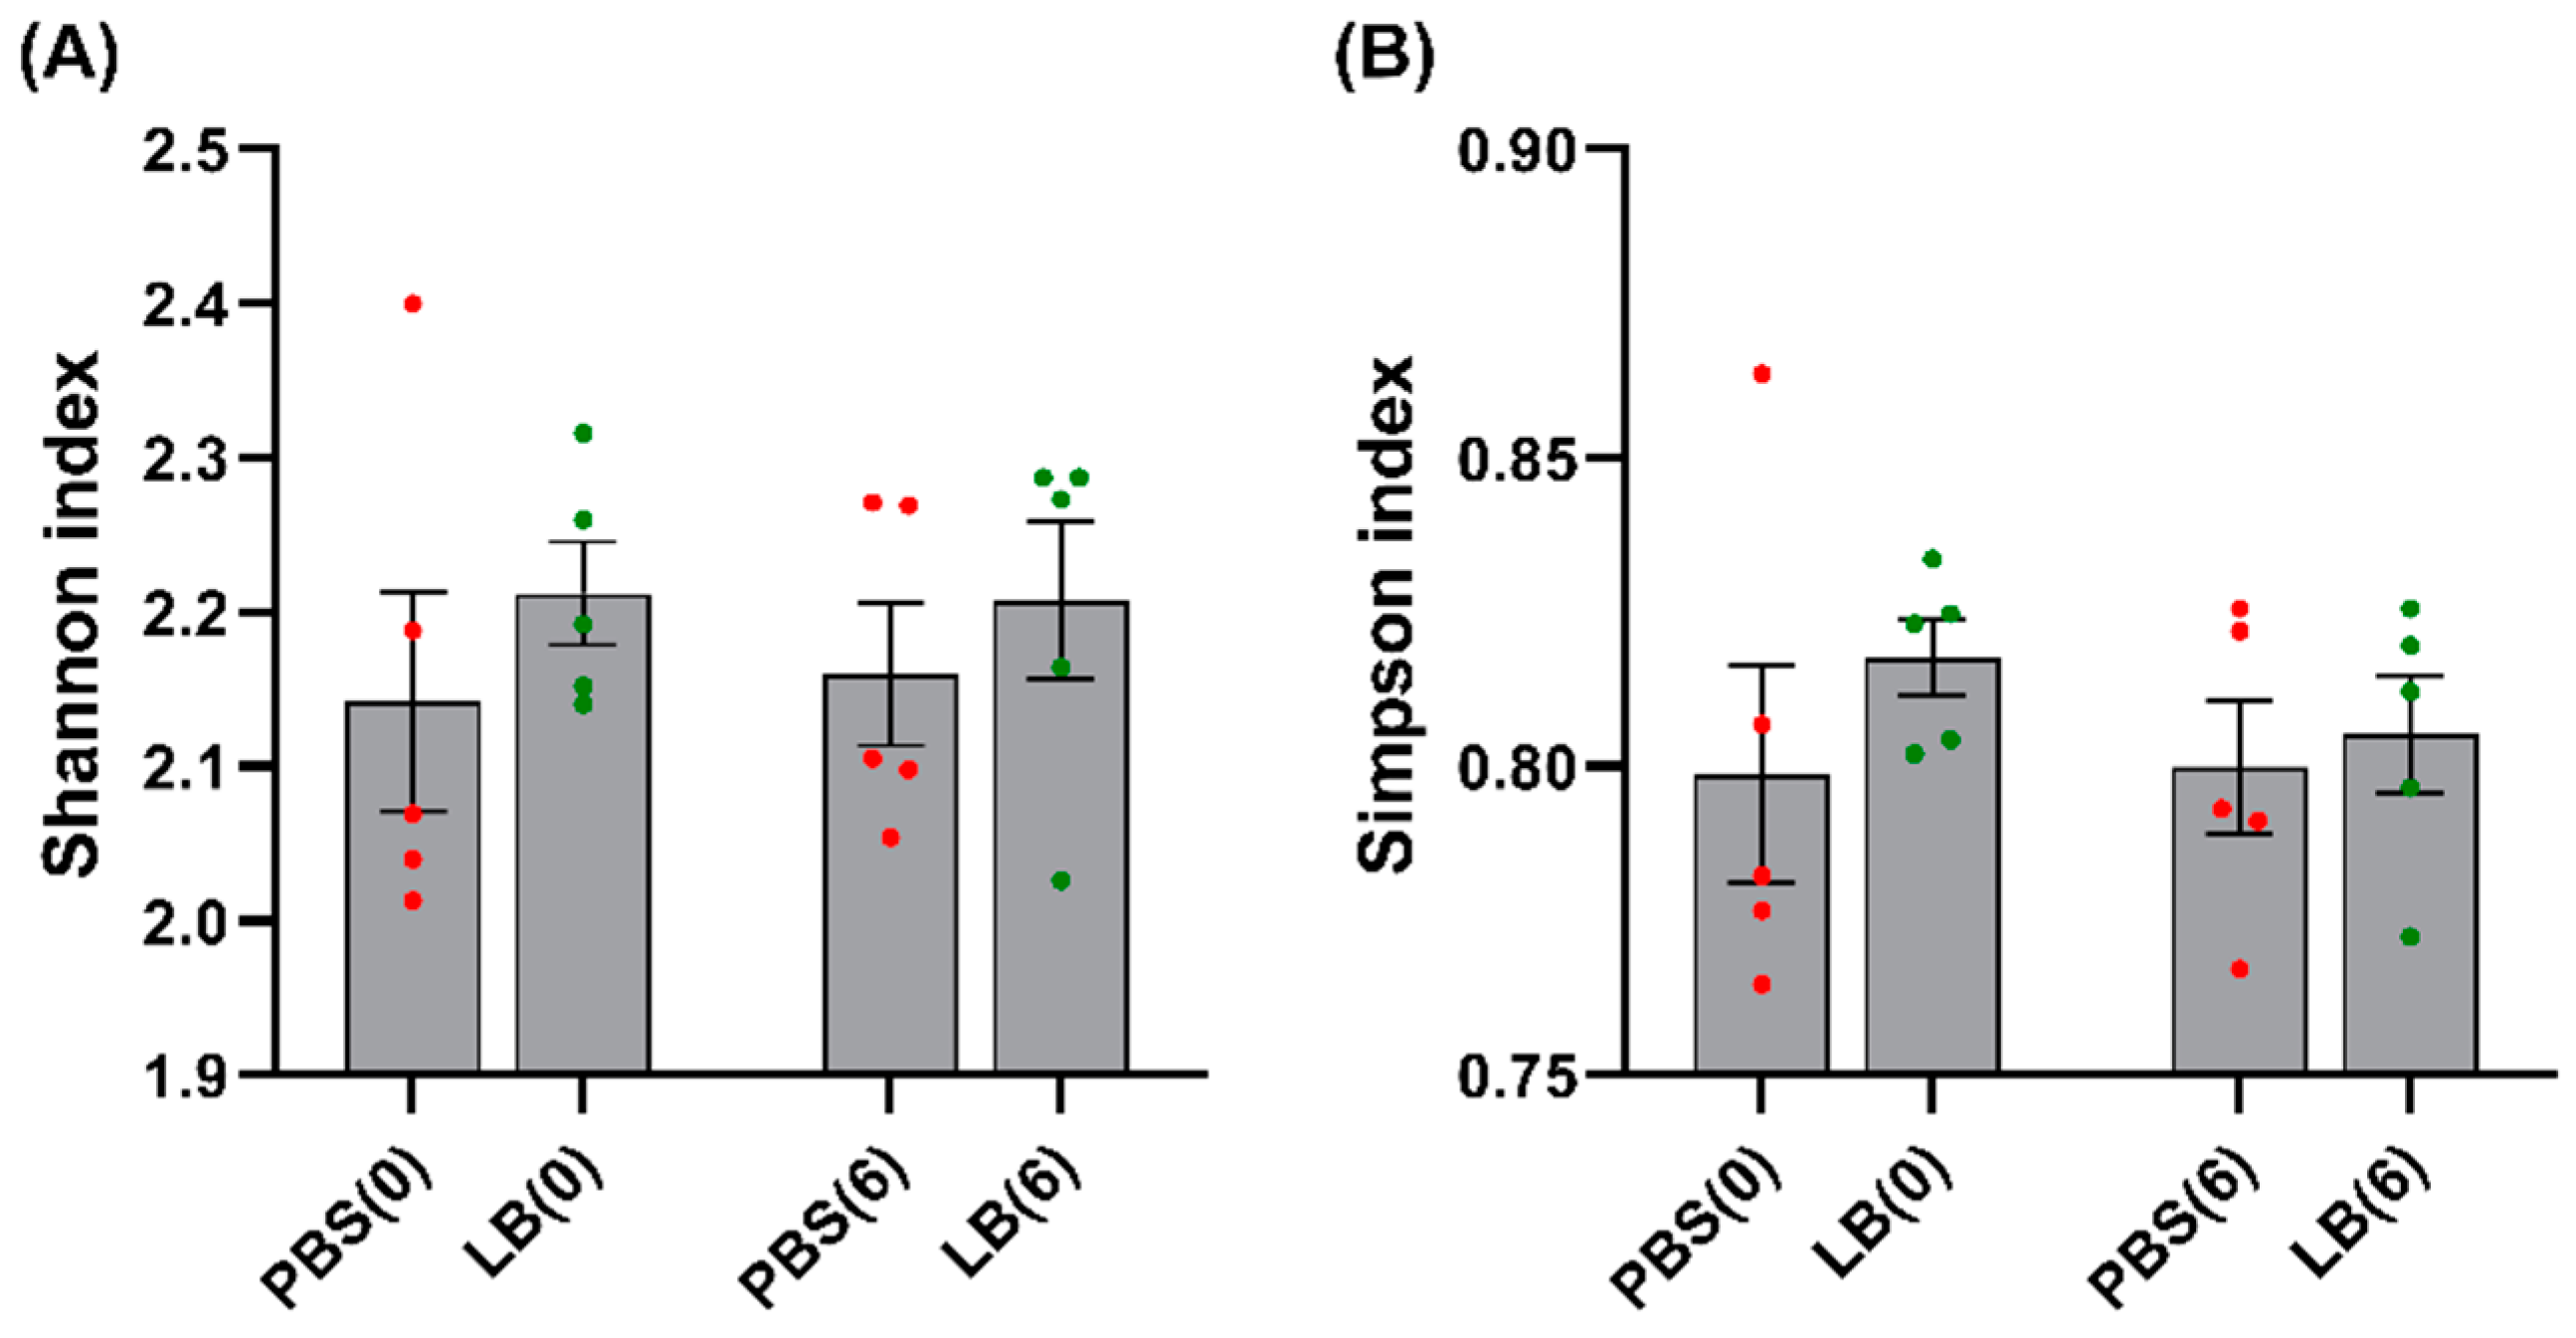
3.3. Analysis of the Fecal Microbial Community

At a 97% similarity threshold, analysis of the V4 amplicon of 16S rRNA from the samples identified 75 OTUs. After applying a 0.1% abundance filter combined with a 25% prevalence rule, 29 bacterial OTUs were retained (Table S3, S4), while 46 low-abundance OTUs were excluded. Rarefaction analysis confirmed that sequencing depth was sufficient to capture the microbial diversity within the samples (Figures S4, S5).
Alpha diversity did not vary across datasets with no significant differences observed in the Shannon and Simpson indices between the two groups either at the start or the end of the experiment (Figure 1).
PCoA based on Bray–Curtis distance revealed no significant differences in the fecal microbiome structure between the two groups at the onset of the intervention (Day 0) (Figure 2A). However, after the six-week administration of Lb. pentosus PE11, a notable difference emerged (Figure 2B), indicating that the relative abundance of certain bacterial taxa was altered during the intervention.
In all samples, the two dominant phyla were Bacteroidetes (22.87%–54.43%) and Firmicutes (31.75%–64.96%), collectively accounting for over 83% of the total bacterial population. Proteobacteria (3.82-9.03%) and Actinobacteria (0.90-5.12%) were also present. At Day 0, no significant differences were observed at either the phylum or family level between the PBS and LB groups (Figure 3A, Table S3). However, after the intervention, the relative abundance of Firmicutes was significantly higher in the LB group compared to the PBS group (51.15%, 36.66% respectively), while Bacteroidetes were significantly more abundant in the PBS group (52.38%, 34.16%, respectively) (Figure 3A, Table S4). Consequently, the Firmicutes-to-Bacteroidetes (F/B) ratio was significantly higher in the LB group than in the PBS group (1.50, 0.70 respectively) (Table S4).
At the family level, the relative abundance of Lachnospiraceae, Ruminococcaceae, and Rikenellaceae was significantly higher in the Lb. pentosus-treated group compared to the control group, with relative abundance of 33.13% vs. 18.87%, 8.59% vs. 4.60% vs. and 3.31 vs. 1.84%, respectively (Figure 3B, Table S4). Conversely, families such as S24_7 and Lactobacillaceae were found at lower relative abundance in the LB group (21.67% vs. 36.00% and 2.19 vs. 5.95 %), while Desulfovibrionaceae showed an increase (1.27% vs. 0.68). These changes, while indicative of a shift in the microbial community, were only marginally significant (p = 0.056) (Figure 3B, Table S4).

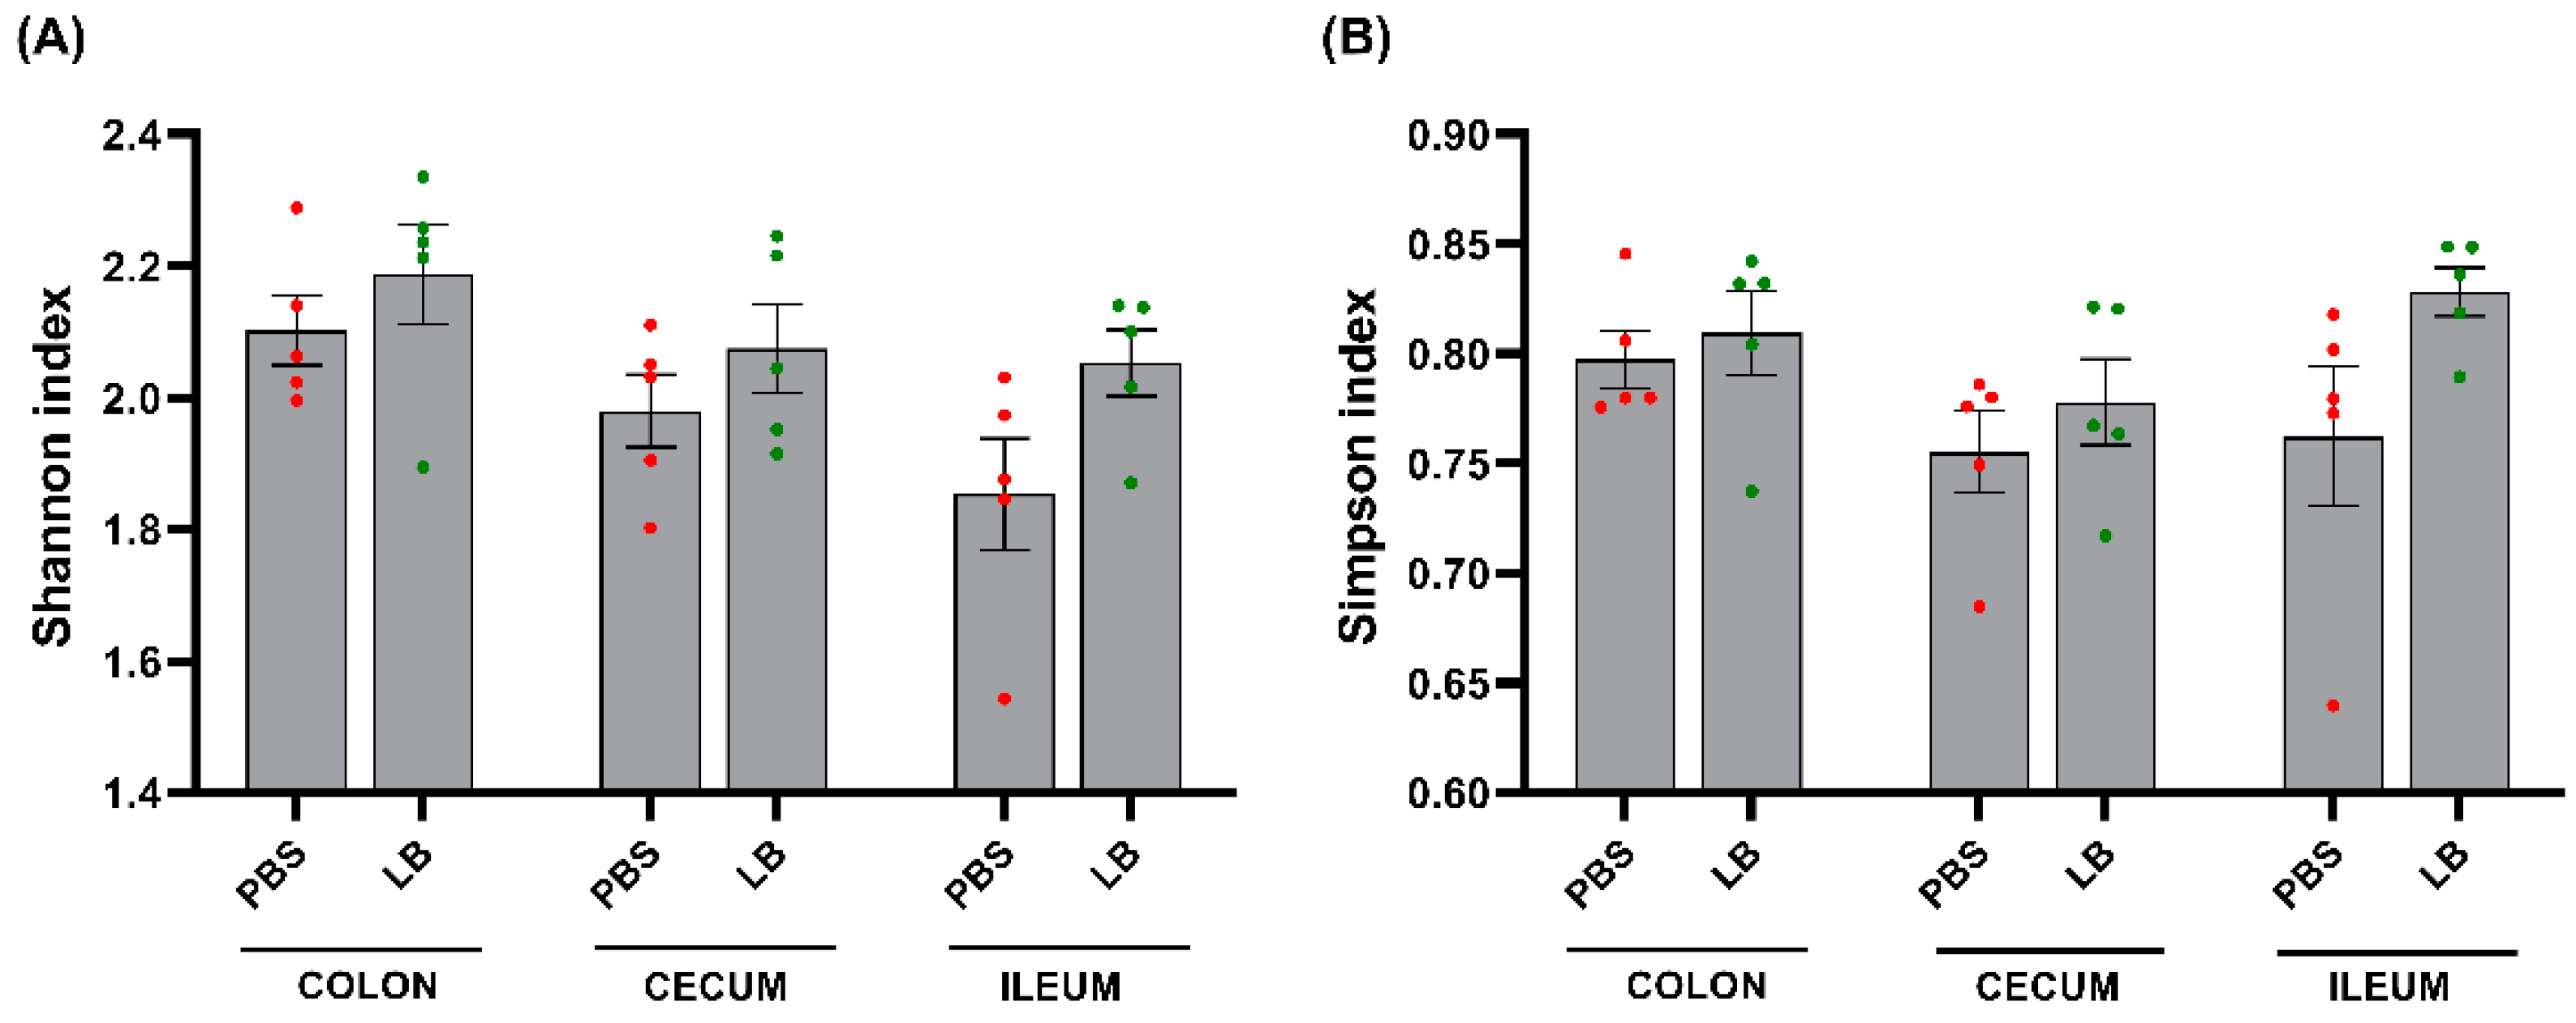
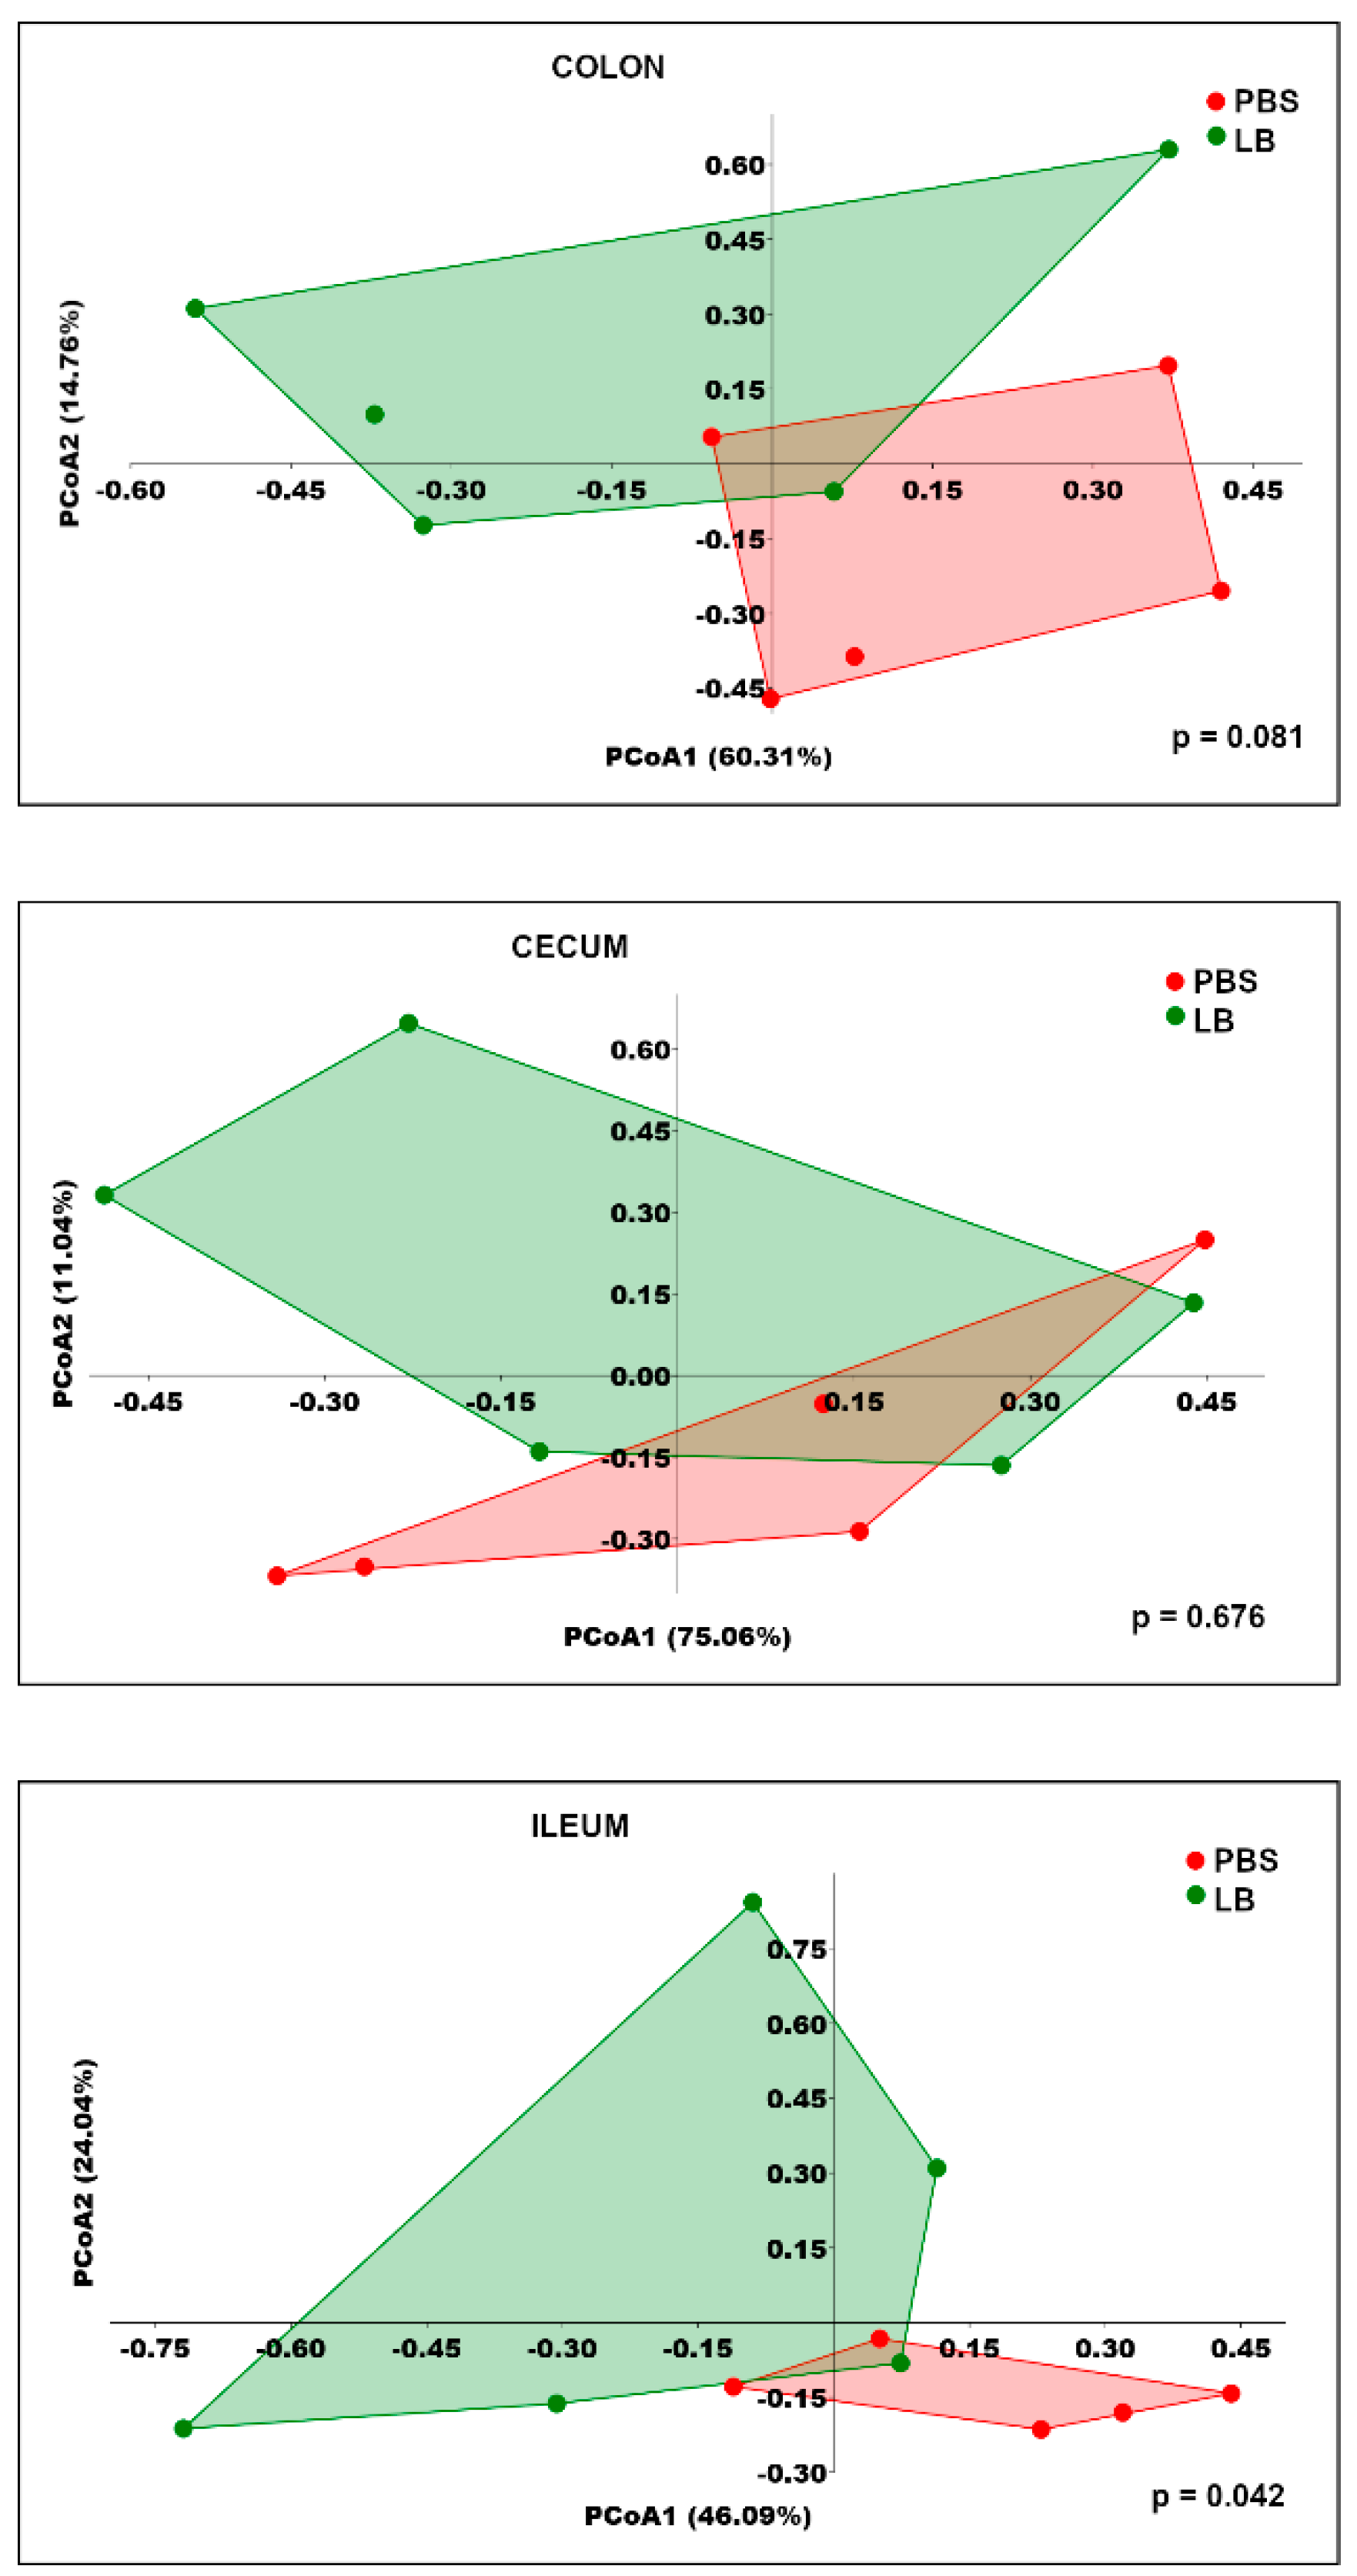
3.4. Analysis of the GI Microbial Communities

At 97% similarity threshold, analysis of the V4 amplicon of the 16S rRNA from colonic, cecal, and ileal samples identified 63, 58, and 72 OTUs, respectively. Following the application of a 0.1% abundance filter and a 25% prevalence rule, 28, 29, and 24 OTUs were retained for the colon, cecum, and ileum, respectively (Tables S5, S6 and S7), with 35, 29, and 48 low-abundance OTUs excluded. Rarefaction analysis demonstrated that sequencing depth was sufficient (Figures S6, S7 and S8).
Alpha diversity, assessed using Shannon and Simpson indices did not significantly differ between the groups across the three sites (Figure 4). PCoA based on Bray–Curtis distances showed no significant differences in the structures of the colonic and cecal microbial communities between the PBS and LB groups (Figure 5). However, the ileal bacterial community exhibited a significant change suggesting an alteration in the relative abundance of specific bacterial taxa during the intervention.
In the GI track microbial communities, the phyla Firmicutes and Bacteroidetes were the most dominant across all regions, comprising over 73% of the total bacterial population in the colon, 83% in the cecum, and 63% in the ileum. Proteobacteria accounted for 5.98–23.17% in the colon, 3.86–8.93% in the cecum, and 2.36–23.77% in the ileum, while Actinobacteria contributed 1.17–7.33% in the colon, 1.28–5.97% in the cecum, and 6.85–20.16% in the ileum. Statistical analysis revealed no significant differences in the median relative abundances of these four dominant phyla between the PBS and LB groups across all regions (Figure 6A; Tables S5, S6, and S7).
In the colon of the LB group an increased abundance of the Rikenellaceae family was detected, while F16 and Dehalobacteriaceae families exhibited lower abundances with relative abundances of 2.02% vs. 1.10%, 1.14% vs. 1.73 and 0.34% vs. 1.32, respectively (Figure 6B, Tables S5). Moreover, no significant differences in the relative abundances of cecal families were observed between the LB group and the PBS group (Figure 6B, Table S6). In the ileum of the animals of the LB group, however, Lactobacillaceae, the most predominant family in the ileal microbial community of mice, was detected at a significantly lower abundance compared to the PBS group (15.18% vs. 32.68%) (Figure 6B, Table S7). Furthermore, the median relative abundance of Erysipelotrichaceae and Alcaligenaceae was higher in the LB group compared to the PBS group (16.45% vs. 10.03% and 2.78% vs. 0.54, respectively). These differences, however, were marginally significant (p = 0.056) (Figure 6B, Table S7).

3.5. Serum Biochemical Parameters

The impact of Lb. pentosus PE11 administration on common biochemical parameters used to assess overall health is summarized in Table 1 (values for each animal are presented in Table S8). Lb. pentosus PE11 administration had no significant effect on the BUN, CRE, HDL, LDL, or ALP. TG and ALT levels, however, were significantly reduced in the mice of the LB group compared to the PBS group 57 vs. 91 mg/dL and 33 vs. 75 U/L, respectively). Notably, TC levels showed a trend towards reduction in the Lb. pentosus PE11 group (67 vs. 81 mg/dL).

3.6. Gene Expression Analysis

We also analyzed in distinct parts of the GI track (colon, cecum and ileum) the expression of markers related to the integrity of the gut barrier (ZO1, OCLN, JAMA), mucin expression (MUC2), serotonin (SERT) and lipid (FIAF, FITM2) metabolism. Furthermore, we evaluated the expression of genes linked to the immune system regulation, as the genes coding the toll-like receptor 2 (TLR2) and cytokines (TGF, TNF, IL1B, IL6, IL10). As shown in Figure 7B, the expression of ZO1 mRNA in the cecum was significantly upregulated in the LB group, with a fold change of 1.40 (p = 0.039), indicating enhanced epithelial barrier integrity. Additionally, Lb. pentosus PE11 administration led to a notable reduction in TNF mRNA expression levels in the cecum, with a fold change of 0.50 (p = 0.038; Figure 7B), suggesting anti-inflammatory effects. The expression of SERT mRNA in the ileum exhibited an upward trend in the Lb. pentosus PE11-treated group compared to the control group, with a fold change of 1.89. This increase approached statistical significance (p = 0.065; Figure 7C), indicating a potential modulation of serotonin reuptake in the ileum by Lb. pentosus PE11.

4. Discussion

Several studies have demonstrated the beneficial effects of probiotics in managing various diseases, particularly in conditions such as GI disorders, inflammatory diseases, and metabolic disorders. However, their impact on healthy individuals is less well-studied, and despite the variety of probiotics available in the market, clear guidelines for their use in healthy populations are still lacking [11]. As a result, interest in this area is increasing. In this study, we investigated the role of a novel potential probiotic strain, Lactiplantibacillus pentosus PE11, in healthy mice over a six-week period, focusing on its effects on GI microbiota and markers of the overall health.
We first analyzed the impact of Lb. pentosus PE11 on the structure of the fecal microbiota. β-diversity and PERMANOVA analysis revealed a clear difference between the structures of the two communities, with significant shifts in the relative abundance of specific bacterial taxa. More specifically, the F/B ratio increased, with the Lachnospiraceae, Ruminococcaceae, and Rikenellaceae families becoming more abundant in the LB group.
The F/B ratio is commonly used in assessing microbiota structure and has been linked to various health conditions. For instance, a decreased F/B ratio has been associated with obesity, DSS-induced colitis or IBD in both mouse models and human patients [22]. However, as the F/B ratio varies across populations, age groups and gender in humans or strain in experimental animals, and is influenced by environmental and genetic factors, conflicting findings have been reported [22]. Additionally, other phyla, such as Proteobacteria, play significant roles, while only a limited number of probably distinct bacterial species within the Firmicutes and Bacteroidetes phyla, are linked to different conditions or a healthy microbiome.
Lachnospiraceae and Ruminococcaceae are key producers of short-chain fatty acids (SCFAs), serving in the intestine as the primary producers of butyrate [23], one of the most crucial metabolite for the host health [24]. Butyrate is implicated in the preservation of gut integrity during inflammation by promoting the expression of tight junction proteins as well as in the protection against C. difficile colonization and/or C. difficile infection [25,26,27]. Interestingly, in alcohol-induced liver disease models a reduced abundance of the butyrate-producing families Lachnospiraceae and Ruminococcaceae, has been linked not only to decreased butyrate levels but also to the progression of the disease [28]. Moreover, the Lachnospiraceae family has been associated with improved lipid metabolism in mouse models of a high-fat diet [29,30].
Along with the increased abundance of Lachnospiraceae following Lb. pentosus PE11 administration, we observed a significant decrease in TG levels as well as a marginal decrease in TC levels. Elevated levels of serum TC and TG are well-known risk factors for the onset of cardiovascular diseases, including atherosclerosis, coronary artery disease [31,32]. Several studies have shown the beneficial effects of probiotics in lowering TC and TG levels in high fat diets [14,33,34,35,36,37,38]; however there is limited information available regarding their effects on healthy animals [39].
Excess cholesterol and triglycerides also contribute to the development of pancreatitis and liver disease [31,32]. ALT, an enzyme primarily located in the liver, is normally present in the bloodstream at low levels. It serves as a key marker of liver function, with elevated serum ALT indicating liver cell damage caused by increased hepatic cell membrane fragility or cell death [40]. Administration of Lb. pentosus PE11 led also to a decrease in ALT levels in accordance with previous studies that have shown that probiotic treatment can lower serum levels of ALT, improving the symptoms of liver diseases [38,41,42,43,44]. Our data highlight the potential of Lb. pentosus PE11 not only in modulating lipid metabolism but also in supporting liver function through its impact on ALT levels.
Members of the family Rikenellaceae are known hydrogen producers with the capability to neutralize cytotoxic reactive oxygen species (ROS). Research indicates that hydrogen can mitigate oxidative stress and suppress key pro-inflammatory cytokines in inflamed tissues, thereby alleviating symptoms of diseases such as IBD [45]. The observed increase in the relative abundance of Rikenellaceae in our study suggests that Lb. pentosus PE11 may contribute to reducing oxidative stress, even in healthy animals.
An increased abundance of Lachnospiraceae, Ruminococcaceae, Rikenellaceae, and Lactobacillaceae has been positively correlated with greater ileal and colonic villus height, indicating a potential link between microbial populations and gut morphology [46]. However, in our study, no statistically significant differences were observed in the height of the gastrointestinal villi and crypts, despite changes in microbial composition. This suggests that the relationship between gut microbiota and intestinal mucosa morphology may be influenced by additional factors or requires a longer intervention period to manifest measurable effects.
Fecal microbiome analysis is widely utilized due to its non-invasive nature and the ease of sample collection. However, it does not fully capture the microbial composition along the GI tract. While fecal samples provide a better representation of microbial communities in the large intestine, they differ significantly from those in the stomach, small intestine, and other GI regions due to the distinct environmental conditions in each area [47,48,49]. In this vein we analysed the luminal microbial communities of the colon, cecum and ileum. The structure of the microbial communities in the colon was influenced by Lb. pentosus PE11; the relative abundance of Rikenellaceae was higher while the abundances of F16 and Dehalobacteriaceae were reduced. In fecal samples, Rikenellaceae family showed a similar increase, alongside higher abundances of Lachnospiraceae and Ruminococcaceae. This suggests that while Lb. pentosus PE11 broadly impacts microbial populations in the colon, only certain families demonstrate consistent changes in both colonic and fecal communities.
Despite the fact that L. pentosus PE11 did not affect the microbial community of the cecum, gene expression analysis revealed decreased TNF expression, as well increased ZO1 expression in this part of the GI track. TNF is a pro-inflammatory cytokine with a crucial role in several diseases [50], while ZO1 is a protein involved in the development of tight junctions and in the maintenance of the intestinal barrier preventing harmful substances from entering in the submucosa and preserving the immune homeostasis in the gut [51]. Interestingly the upregulation of ZO1 is correlated with increased abundance of Lachnospiraceae in the gut [25].
The ileal microbial community was also influenced by Lb pentosus PE11; Lactobacillaceae abundance was decreased. Lactobacillaceae abundance was also reduced in feces, although this change was not statistically significant, suggesting that the observed change in the fecal microbiota may have arisen from changes in the ileal microbial community. Similar results have been obtained in studies in mice fed with high fat diet [14,52,53], as well as in healthy mice following a five-day intervention with a potential probiotic strain [54]. In addition in the ileum, gene expression analysis indicated a trend toward increased SERT. Serotonin has a key role in the regulation of fluid secretion, GI motility, and sensory perception and its elevated expression is often associated with disturbances in gut sensation and motility, which are symptoms observed in various GI disorders, both organic and functional [55]. SERT is responsible for the reabsorption of serotonin by enterocytes in the mucosa, thus maintaining stable serotonin levels within the intestine [56]. Increased SERT expression lead to reduced serotonin levels [57,58,59], which may help regulate gut motility and alleviate GI disorder symptoms.

5. Conclusions

The administration of Lactiplantibacillus pentosus PE11 in healthy mice over six weeks revealed promising potential as a probiotic, particularly in modulating gut microbiota and health markers. Changes in the fecal microbial community structure included an increase in butyrate-producing families like Lachnospiraceae and Ruminococcaceae. These shifts, accompanied by modest improvements in lipid metabolism namely reduced triglyceride levels, and a decrease in ALT, a marker of liver function, suggest a role in supporting metabolic and hepatic health. The intervention also revealed region-specific effects along the gastrointestinal tract. In the ileum, changes in the microbial community structure and a trend toward increased SERT expression indicate a potential role in gut motility regulation, while in the cecum, decreased TNF expression and increased ZO1 expression point to enhanced intestinal barrier integrity and anti-inflammatory effects. These data align with growing evidence linking probiotics to gut homeostasis and immune modulation.
Although no significant effects on villus morphology were observed, the changes in the microbiota imply potential long-term benefits that may require longer interventions to fully manifest. Additionally, the differences between fecal and site-specific microbiota stress the importance of analyzing multiple gastrointestinal regions in order to gain a comprehensive insight of the effects. Further studies are, however, needed to validate these findings across different models, unravel the mechanisms underlying the effects, and assess their relevance to human health.

Supplementary Materials

The following supporting information can be downloaded at: Preprints.org, Figure S1: Effect of Lb. pentosus PE11 on body weight over the intervention; Figure S2: Histological evaluation of colonic, cecal and ileal morphology; Figure S3: Assessment of the crypt depth and villus height in control and Lb. pentosus PE11 treated mice; Figure S4: Rarefaction and Shannon curves of fecal samples collected at the start of the dietary intervention; Figure S5: Rarefaction and Shannon curves of fecal samples collected at the end of the dietary intervention; Figure S6: Rarefaction and Shannon curves of colonic samples collected at the end of the dietary intervention; Figure S7: Rarefaction and Shannon curves of cecal samples collected at the end of the dietary intervention; Figure S8: Rarefaction and Shannon curves of ileal samples collected at the end of the dietary intervention; Table S1: Primers used in qPCR analysis; Table S2: Body weight measurements during the dietary intervention; Table S3: OTU tables (feces)at Day 0; Table S4: OTU tables (feces) at the end of the intervention; Table S5: OTU tables (colon) at the end of the intervention; Table S6: OTU tables (cecum) at the end of the intervention; Table S7: OTU tables (ileum) at the end of the intervention; Table S8: List of values of biochemical parameters of each animal at the end of the intervention.

Author Contributions

Conceptualization, G.S., Y.K., M.E.G.; methodology, I.F., E.S., N.S., E.K., P.S., A.T., P.Y., Y.K, M.E.G., G.S; validation, I.F., F.F.,G.S., E.S., A.R.V.; investigation, I.F., E.S., N.S., E.K., D.K., A.R.V., F.F.; resources, A.T., P.P, P.Y. G.S., Y.K., M.E.G; data curation, I.F., E.S., G.S., M.E.G..; writing—original draft preparation, I.F., E.S.; writing—review and editing, I.F., E.S., N.S., A.T., P.Y., P.P., P.S., G.S., Y.K., M.E.G.; visualization, I.F., E.S., N.S..; supervision, G.S., M.E.G.; project administration, Y.K, M.E.G., G.S.; funding acquisition, P.P., G.S., Y.K., M.E.G. All authors have read and agreed to the published version of the manuscript.

Funding

This research was funded by the project “Infrastructure of Microbiome Applications in Food Systems-FOODBIOMES” (MIS 5047291), which is implemented under the Action “Regional Excellence in R&D Infrastructures,” funded by the Operational Programme “Competitiveness, Entrepreneurship and Innovation” (NSRF 2014–2020) and co-financed by Greece and the EU (European Regional Development Fund).

Institutional Review Board Statement

All animal experiments were conducted in accordance with Directive 2010/63 of the European Parliament and Council of 22 September 2010, which was the legislation in force at the time. The protocol was approved by the Animal Care and Use Committee of the Prefecture of Evros, Thrace, Greece, under permit number 36662/118 (08/02/2022).

Informed Consent Statement

Not applicable.

Data Availability Statement

The data presented in this study are available in Tables S2-S8.

Acknowledgments

We would like to thank the iFUNFoods consortium for providing the Lb. pentosus PE11 used in this study. iFUNFoods project (code: T1EDK-0346) was funded by the European Regional Development Fund of the European Union and Greek national funds through the Operational Program Competitiveness, Entrepreneurship, and Innovation, under the call RESEARCH CREATE—INNOVATE.

Conflicts of Interest

Author Panayiotis Panas was employed by QLCon. The remaining authors declare that the research was conducted in the absence of any commercial or financial relationships that could be construed as a potential conflict of interest.

References

  1. Maciel-Fiuza, M.F.; Muller, G.C.; Campos, D.M.S.; do Socorro Silva Costa, P.; Peruzzo, J.; Bonamigo, R.R.; Veit, T.; Vianna, F.S.L. Role of Gut Microbiota in Infectious and Inflammatory Diseases. Front. Microbiol. 2023, 14, 1098386. [CrossRef]
  2. Maftei, N.-M.; Raileanu, C.R.; Balta, A.A.; Ambrose, L.; Boev, M.; Marin, D.B.; Lisa, E.L. The Potential Impact of Probiotics on Human Health: An Update on Their Health-Promoting Properties. Microorganisms 2024, 12, 234. [CrossRef]
  3. Dieterich, W.; Schink, M.; Zopf, Y. Microbiota in the Gastrointestinal Tract. Med. Sci. 2018, 6, 116. [CrossRef]
  4. Jandhyala, S.M.; Talukdar, R.; Subramanyam, C.; Vuyyuru, H.; Sasikala, M.; Reddy, D.N. Role of the Normal Gut Microbiota. World J. Gastroenterol. WJG 2015, 21, 8787–8803. [CrossRef]
  5. Ahlawat, S.; Asha; Sharma, K.K. Gut–Organ Axis: A Microbial Outreach and Networking. Lett. Appl. Microbiol. 2021, 72, 636–668. [CrossRef]
  6. Chen, Y.; Zhou, J.; Wang, L. Role and Mechanism of Gut Microbiota in Human Disease. Front. Cell. Infect. Microbiol. 2021, 11. [CrossRef]
  7. Afzaal, M.; Saeed, F.; Shah, Y.A.; Hussain, M.; Rabail, R.; Socol, C.T.; Hassoun, A.; Pateiro, M.; Lorenzo, J.M.; Rusu, A.V.; et al. Human Gut Microbiota in Health and Disease: Unveiling the Relationship. Front. Microbiol. 2022, 13, 999001. [CrossRef]
  8. Hill, C.; Guarner, F.; Reid, G.; Gibson, G.R.; Merenstein, D.J.; Pot, B.; Morelli, L.; Canani, R.B.; Flint, H.J.; Salminen, S.; et al. The International Scientific Association for Probiotics and Prebiotics Consensus Statement on the Scope and Appropriate Use of the Term Probiotic. Nat. Rev. Gastroenterol. Hepatol. 2014, 11, 506–514. [CrossRef]
  9. Rau, S.; Gregg, A.; Yaceczko, S.; Limketkai, B. Prebiotics and Probiotics for Gastrointestinal Disorders. Nutrients 2024, 16, 778. [CrossRef]
  10. Latif, A.; Shehzad, A.; Niazi, S.; Zahid, A.; Ashraf, W.; Iqbal, M.W.; Rehman, A.; Riaz, T.; Aadil, R.M.; Khan, I.M.; et al. Probiotics: Mechanism of Action, Health Benefits and Their Application in Food Industries. Front. Microbiol. 2023, 14, 1216674. [CrossRef]
  11. Merenstein, D.J.; Tancredi, D.J.; Karl, J.P.; Krist, A.H.; Lenoir-Wijnkoop, I.; Reid, G.; Roos, S.; Szajewska, H.; Sanders, M.E. Is There Evidence to Support Probiotic Use for Healthy People? Adv. Nutr. 2024, 15, 100265. [CrossRef]
  12. McFarland, L.V.; Evans, C.T.; Goldstein, E.J.C. Strain-Specificity and Disease-Specificity of Probiotic Efficacy: A Systematic Review and Meta-Analysis. Front. Med. 2018, 5, 124. [CrossRef]
  13. Piquer-Esteban, S.; Ruiz-Ruiz, S.; Arnau, V.; Diaz, W.; Moya, A. Exploring the Universal Healthy Human Gut Microbiota around the World. Comput. Struct. Biotechnol. J. 2021, 20, 421–433. [CrossRef]
  14. Somalou, P.; Ieronymaki, E.; Feidaki, K.; Prapa, I.; Stylianopoulou, E.; Spyridopoulou, K.; Skavdis, G.; Grigoriou, M.E.; Panas, P.; Argiriou, A.; et al. Novel Wild-Type Pediococcus and Lactiplantibacillus Strains as Probiotic Candidates to Manage Obesity-Associated Insulin Resistance. Microorganisms 2024, 12, 231. [CrossRef]
  15. Ramakers, C.; Ruijter, J.M.; Deprez, R.H.L.; Moorman, A.F.M. Assumption-Free Analysis of Quantitative Real-Time Polymerase Chain Reaction (PCR) Data. Neurosci. Lett. 2003, 339, 62–66. [CrossRef]
  16. Ganger, M.T.; Dietz, G.D.; Ewing, S.J. A Common Base Method for Analysis of qPCR Data and the Application of Simple Blocking in qPCR Experiments. BMC Bioinformatics 2017, 18, 534. [CrossRef]
  17. Tegopoulos, K.; Tsirka, T.; Stekas, C.; Gerasimidi, E.; Skavdis, G.; Kolovos, P.; Grigoriou, M.E. Spatiotemporal Dynamics of Assyrtiko Grape Microbiota. Microorganisms 2024, 12, 577. [CrossRef]
  18. Li, H.; Handsaker, B.; Wysoker, A.; Fennell, T.; Ruan, J.; Homer, N.; Marth, G.; Abecasis, G.; Durbin, R. The Sequence Alignment/Map Format and SAMtools. Bioinformatics 2009, 25, 2078–2079. [CrossRef]
  19. Schloss, P.D.; Westcott, S.L.; Ryabin, T.; Hall, J.R.; Hartmann, M.; Hollister, E.B.; Lesniewski, R.A.; Oakley, B.B.; Parks, D.H.; Robinson, C.J.; et al. Introducing Mothur: Open-Source, Platform-Independent, Community-Supported Software for Describing and Comparing Microbial Communities. Appl. Environ. Microbiol. 2009, 75, 7537–7541. [CrossRef]
  20. Lu, Y.; Zhou, G.; Ewald, J.; Pang, Z.; Shiri, T.; Xia, J. MicrobiomeAnalyst 2.0: Comprehensive Statistical, Functional and Integrative Analysis of Microbiome Data. Nucleic Acids Res. 2023, 51, W310–W318. [CrossRef]
  21. Hammer, O.; Harper, D.A.T.; Ryan, P.D. PAST: Paleontological Statistics Software Package for Education and Data Analysis.
  22. Stojanov, S.; Berlec, A.; Štrukelj, B. The Influence of Probiotics on the Firmicutes/Bacteroidetes Ratio in the Treatment of Obesity and Inflammatory Bowel Disease. Microorganisms 2020, 8, 1715. [CrossRef]
  23. Zaplana, T.; Miele, S.; Tolonen, A.C. Lachnospiraceae Are Emerging Industrial Biocatalysts and Biotherapeutics. Front. Bioeng. Biotechnol. 2024, 11, 1324396. [CrossRef]
  24. Hu, Y.; Chen, Z.; Xu, C.; Kan, S.; Chen, D. Disturbances of the Gut Microbiota and Microbiota-Derived Metabolites in Inflammatory Bowel Disease. Nutrients 2022, 14, 5140. [CrossRef]
  25. Gao, Y.; Davis, B.; Zhu, W.; Zheng, N.; Meng, D.; Walker, W.A. Epithelial Biology and Secretion: Short-Chain Fatty Acid Butyrate, a Breast Milk Metabolite, Enhances Immature Intestinal Barrier Function Genes in Response to Inflammation in Vitro and in Vivo. Am. J. Physiol. - Gastrointest. Liver Physiol. 2021, 320, G521. [CrossRef]
  26. Wu, Z.; Xu, Q.; Wang, Q.; Chen, Y.; Lv, L.; Zheng, B.; Yan, R.; Jiang, H.; Shen, J.; Wang, S.; et al. The Impact of Dietary Fibers on Clostridioides Difficile Infection in a Mouse Model. Front. Cell. Infect. Microbiol. 2022, 12, 1028267. [CrossRef]
  27. Martinez, E.; Taminiau, B.; Rodriguez, C.; Daube, G. Gut Microbiota Composition Associated with Clostridioides Difficile Colonization and Infection. Pathogens 2022, 11, 781. [CrossRef]
  28. Singhal, R.; Donde, H.; Ghare, S.; Stocke, K.; Zhang, J.; Vadhanam, M.; Reddy, S.; Gobejishvili, L.; Chilton, P.; Joshi-Barve, S.; et al. Decrease in Acetyl-CoA Pathway Utilizing Butyrate-Producing Bacteria Is a Key Pathogenic Feature of Alcohol-Induced Functional Gut Microbial Dysbiosis and Development of Liver Disease in Mice. Gut Microbes 13, 1946367. [CrossRef]
  29. Lin, R.; He, X.; Chen, H.; He, Q.; Yao, Z.; Li, Y.; Yang, H.; Simpson, S. Oil Tea Improves Glucose and Lipid Levels and Alters Gut Microbiota in Type 2 Diabetic Mice. Nutr. Res. N. Y. N 2018, 57, 67–77. [CrossRef]
  30. Koontanatechanon, A.; Wongphatcharachai, M.; Nonthabenjawan, N.; Jariyahatthakij, P.; Khorporn, T.; Parnsen, W.; Keattisin, B.; Leksrisompong, P.; Srichana, P.; Prasopdee, S.; et al. Effects of Omega-3-Rich Pork Lard on Serum Lipid Profile and Gut Microbiome in C57BL/6NJ Mice. Int. J. Food Sci. 2022, 2022, 9269968. [CrossRef]
  31. Lee, Y.; Siddiqui, W.J. Cholesterol Levels. In StatPearls; StatPearls Publishing: Treasure Island (FL), 2024.
  32. Karanchi, H.; Muppidi, V.; Wyne, K. Hypertriglyceridemia. In StatPearls; StatPearls Publishing: Treasure Island (FL), 2024.
  33. Lim, P.S.; Loke, C.F.; Ho, Y.W.; Tan, H.Y. Cholesterol Homeostasis Associated with Probiotic Supplementation in Vivo. J. Appl. Microbiol. 2020, 129, 1374–1388. [CrossRef]
  34. Xie, N.; Cui, Y.; Yin, Y.-N.; Zhao, X.; Yang, J.-W.; Wang, Z.-G.; Fu, N.; Tang, Y.; Wang, X.-H.; Liu, X.-W.; et al. Effects of Two Lactobacillus Strains on Lipid Metabolism and Intestinal Microflora in Rats Fed a High-Cholesterol Diet. BMC Complement. Altern. Med. 2011, 11, 53. [CrossRef]
  35. Huang, Y.; Wang, X.; Wang, J.; Wu, F.; Sui, Y.; Yang, L.; Wang, Z. Lactobacillus Plantarum Strains as Potential Probiotic Cultures with Cholesterol-Lowering Activity. J. Dairy Sci. 2013, 96, 2746–2753. [CrossRef]
  36. Choi, M.J.; Yu, H.; Kim, J.I.; Seo, H.; Kim, J.G.; Kim, S.-K.; Lee, H.S.; Cheon, H.G. Anti-Obesity Effects of Lactiplantibacillus Plantarum SKO-001 in High-Fat Diet-Induced Obese Mice. Eur. J. Nutr. 2023, 62, 1611–1622. [CrossRef]
  37. Damodharan, K.; Lee, Y.S.; Palaniyandi, S.A.; Yang, S.H.; Suh, J.-W. Preliminary Probiotic and Technological Characterization of Pediococcus Pentosaceus Strain KID7 and in Vivo Assessment of Its Cholesterol-Lowering Activity. Front. Microbiol. 2015, 6, 768. [CrossRef]
  38. Aziz, M.; Hemeda, S.A.; Albadrani, G.M.; Fadl, S.E.; Elgendey, F. Ameliorating Effect of Probiotic on Nonalcoholic Fatty Liver Disease and Lipolytic Gene Expression in Rabbits. Sci. Rep. 2023, 13, 6312. [CrossRef]
  39. Melia, S.; Juliyarsi, I.; Kurnia, Y.F.; Aritonang, S.N.; Purwati, E.; Sukma, A.; Fitria, N.; Susmiati, S.; Meinapuri, M.; Pratama, Y.E.; et al. Effect of Fermented Milk Pediococcus Acidilactici BK01 on Cholesterol and Microbiota in Wistar Mice Intestine. J. Adv. Vet. Anim. Res. 2023, 10, 64–71. [CrossRef]
  40. Moriles, K.E.; Zubair, M.; Azer, S.A. Alanine Aminotransferase (ALT) Test. In StatPearls; StatPearls Publishing: Treasure Island (FL), 2024.
  41. Kim, S.; Lee, Y.; Kim, Y.; Seo, Y.; Lee, H.; Ha, J.; Lee, J.; Choi, Y.; Oh, H.; Yoon, Y. Akkermansia Muciniphila Prevents Fatty Liver Disease, Decreases Serum Triglycerides, and Maintains Gut Homeostasis. Appl. Environ. Microbiol. 2020, 86, e03004-19. [CrossRef]
  42. Luo, M.; Yan, J.; Wu, L.; Wu, J.; Chen, Z.; Jiang, J.; Chen, Z.; He, B. Probiotics Alleviated Nonalcoholic Fatty Liver Disease in High-Fat Diet-Fed Rats via Gut Microbiota/FXR/FGF15 Signaling Pathway. J. Immunol. Res. 2021, 2021, 2264737. [CrossRef]
  43. Al-muzafar, H.M.; Amin, K.A. Probiotic Mixture Improves Fatty Liver Disease by Virtue of Its Action on Lipid Profiles, Leptin, and Inflammatory Biomarkers. BMC Complement. Altern. Med. 2017, 17, 43. [CrossRef]
  44. Yan, Y.; Liu, C.; Zhao, S.; Wang, X.; Wang, J.; Zhang, H.; Wang, Y.; Zhao, G. Probiotic Bifidobacterium Lactis V9 Attenuates Hepatic Steatosis and Inflammation in Rats with Non-Alcoholic Fatty Liver Disease. AMB Express 2020, 10, 101. [CrossRef]
  45. Bellés, A.; Abad, I.; Sánchez, L.; Grasa, L. Whey and Buttermilk-Based Formulas Modulate Gut Microbiota in Mice with Antibiotic-Induced Dysbiosis. Mol. Nutr. Food Res. 2023, 67, e2300248. [CrossRef]
  46. Xie, Y.; Li, W.; Zhu, L.; Zhai, S.; Qin, S.; Du, Z. Effects of Phycocyanin in Modulating the Intestinal Microbiota of Mice. MicrobiologyOpen 2019, 8, e00825. [CrossRef]
  47. Lkhagva, E.; Chung, H.-J.; Hong, J.; Tang, W.H.W.; Lee, S.-I.; Hong, S.-T.; Lee, S. The Regional Diversity of Gut Microbiome along the GI Tract of Male C57BL/6 Mice. BMC Microbiol. 2021, 21, 44. [CrossRef]
  48. Ahn, J.-S.; Lkhagva, E.; Jung, S.; Kim, H.-J.; Chung, H.-J.; Hong, S.-T. Fecal Microbiome Does Not Represent Whole Gut Microbiome. Cell. Microbiol. 2023, 2023, 6868417. [CrossRef]
  49. Gu, S.; Chen, D.; Zhang, J.-N.; Lv, X.; Wang, K.; Duan, L.-P.; Nie, Y.; Wu, X.-L. Bacterial Community Mapping of the Mouse Gastrointestinal Tract. PLOS ONE 2013, 8, e74957. [CrossRef]
  50. Al-Sadi, R.; Guo, S.; Ye, D.; Rawat, M.; Ma, T.Y. TNF-α Modulation of Intestinal Tight Junction Permeability Is Mediated by NIK/IKK-α Axis Activation of the Canonical NF-κB Pathway. Am. J. Pathol. 2016, 186, 1151–1165. [CrossRef]
  51. Liu, Q.; Jian, W.; Wang, L.; Yang, S.; Niu, Y.; Xie, S.; Hayer, K.; Chen, K.; Zhang, Y.; Guo, Y.; et al. Alleviation of DSS-Induced Colitis in Mice by a New-Isolated Lactobacillus Acidophilus C4. Front. Microbiol. 2023, 14. [CrossRef]
  52. Park, S.; Ji, Y.; Jung, H.-Y.; Park, H.; Kang, J.; Choi, S.-H.; Shin, H.; Hyun, C.-K.; Kim, K.-T.; Holzapfel, W.H. Lactobacillus Plantarum HAC01 Regulates Gut Microbiota and Adipose Tissue Accumulation in a Diet-Induced Obesity Murine Model. Appl. Microbiol. Biotechnol. 2017, 101, 1605–1614. [CrossRef]
  53. Ji, Y.S.; Kim, H.N.; Park, H.J.; Lee, J.E.; Yeo, S.Y.; Yang, J.S.; Park, S.Y.; Yoon, H.S.; Cho, G.S.; Franz, C.M. a. P.; et al. Modulation of the Murine Microbiome with a Concomitant Anti-Obesity Effect by Lactobacillus Rhamnosus GG and Lactobacillus Sakei NR28. Benef. Microbes 2012, 3, 13–22. [CrossRef]
  54. Taverniti, V.; Cesari, V.; Gargari, G.; Rossi, U.; Biddau, C.; Lecchi, C.; Fiore, W.; Arioli, S.; Toschi, I.; Guglielmetti, S. Probiotics Modulate Mouse Gut Microbiota and Influence Intestinal Immune and Serotonergic Gene Expression in a Site-Specific Fashion. Front. Microbiol. 2021, 12, 706135. [CrossRef]
  55. Guzel, T.; Mirowska-Guzel, D. The Role of Serotonin Neurotransmission in Gastrointestinal Tract and Pharmacotherapy. Mol. Basel Switz. 2022, 27, 1680. [CrossRef]
  56. Bertrand, P.P.; Bertrand, R.L. Serotonin Release and Uptake in the Gastrointestinal Tract. Auton. Neurosci. Basic Clin. 2010, 153, 47–57. [CrossRef]
  57. Gu, Y.; Wang, C.; Qin, X.; Zhou, B.; Liu, X.; Liu, T.; Xie, R.; Liu, J.; Wang, B.; Cao, H. Saccharomyces Boulardii, a Yeast Probiotic, Inhibits Gut Motility through Upregulating Intestinal Serotonin Transporter and Modulating Gut Microbiota. Pharmacol. Res. 2022, 181, 106291. [CrossRef]
  58. Orlando, A.; Clemente, C.; D’Attoma, B.; Russo, F. Effects of Lactobacillus Rhamnosus GG on the Serotonergic Pathway in a Gliadin-Induced Enteropathy Animal Model. J. Funct. Foods 2020, 72, 104077. [CrossRef]
  59. Jeong, J.-J.; Jin, Y.-J.; Ganesan, R.; Park, H.J.; Min, B.H.; Jeong, M.K.; Yoon, S.J.; Choi, M.R.; Sharma, S.P.; Jang, Y.J.; et al. Multistrain Probiotics Alleviate Diarrhea by Modulating Microbiome-Derived Metabolites and Serotonin Pathway. Probiotics Antimicrob. Proteins 2024. [CrossRef]
Figure 1. Shannon (A) and Simpson (B) diversity indices. Data are presented as mean ± SEM. PBS(0): control group - Day 0, PBS(6): control group - end of the intervention, LB(0): Lb. pentosus PE11 group - Day 0, LB(6): Lb. pentosus PE11 group - end of the intervention. p > 0.05 , not indicated.
Preprints 142236 g001
Figure 2. PCoA based on Bray–Curtis distance for fecal microbiota before (A) and after the six-week intervention (B). The numbers in brackets indicate the percentage of variance explained by the corresponding coordinates (PCoA1 and PCoA2). Each point on the graph represents the microbial community of the fecal sample of an individual mouse.
Preprints 142236 g002
Figure 3. Relative abundance graphs of bacterial OTUs at the phylum (A) and family (B) levels. "Other" represents bacterial taxa with a median relative abundance of less than 1% in both groups. PBS(0): control group - Day 0, PBS(6): control group - end of the intervention, LB(0): Lb. pentosus PE11 group - Day 0, LB(6): Lb. pentosus PE11 group - end of the intervention.
Preprints 142236 g003
Figure 4. Shannon (A) and Simpson (B) diversity indices at the end of the intervention. Data are presented as mean ± SEM. PBS: control group, LB: Lb. pentosus PE11 group.
Preprints 142236 g004
Figure 5. PCoA based on Bray–Curtis distance for colonic, cecal and ileal microbiota after the six-week intervention. The numbers in brackets indicate the percentage of variance explained by the corresponding coordinates (PCoA1 and PCoA2). The p-value was calculated using PERMANOVA. Each point on the graph represents the microbial community of the sample of an individual mouse.
Preprints 142236 g005
Figure 6. Relative abundance graphs of bacterial OTUs at the phylum (A) and family (B) levels along the GI tract at the end of the intervention. "Other" represents bacterial taxa with a median relative abundance of less than 1% in both groups. PBS: control group LB: Lb. pentosus PE11 group.
Preprints 142236 g006
Figure 7. Effect of Lb. pentosus PE11 on the relative gene expression in colon, cecum and ileum following the six-week dietary intervention. The fold change for each gene is represented by individual bars. Data are expressed as geometric mean with 95 % CI. *p < 0.05, p > 0.05 value not indicated.
Preprints 142236 g007
Table 1. Effect of Lb. pentosus PE11 administration on the biochemical parameters following the dietary intervention. Data are expressed as median (min-max).
Biochemical parameter PBS group
control
LB group
Lb. pentosus PE11
p-value
ALT (U/L) 75 (53-145) 33 (17-43) 0.008
ALP (U/L 76 (60-96) 87 (78-93) 0.286
BUN (mg/dL) 43 (39-92) 42 (37-47) 0.413
CRE (mg/dL) 0.31 (0.27-0.39) 0.29 (0.28-0.31) 0.460
HDL (mg/dL) 54 (33-66) 40 (39-57) 0.278
LDL (mg/dL) 5 (4-8) 5 (4-6) 0.762
TC (mg/dL) 81 (72-100) 67 (65-94) 0.056
TG (mg/dL) 91 (79-101) 57 (37-67) 0.008
Disclaimer/Publisher’s Note: The statements, opinions and data contained in all publications are solely those of the individual author(s) and contributor(s) and not of MDPI and/or the editor(s). MDPI and/or the editor(s) disclaim responsibility for any injury to people or property resulting from any ideas, methods, instructions or products referred to in the content.
Copyright: This open access article is published under a Creative Commons CC BY 4.0 license, which permit the free download, distribution, and reuse, provided that the author and preprint are cited in any reuse.
Prerpints.org logo

Preprints.org is a free preprint server supported by MDPI in Basel, Switzerland.

Subscribe

Disclaimer

Terms of Use

Privacy Policy

Privacy Settings

© 2025 MDPI (Basel, Switzerland) unless otherwise stated