
Submitted:
11 April 2025
Posted:
11 April 2025
You are already at the latest version
Abstract
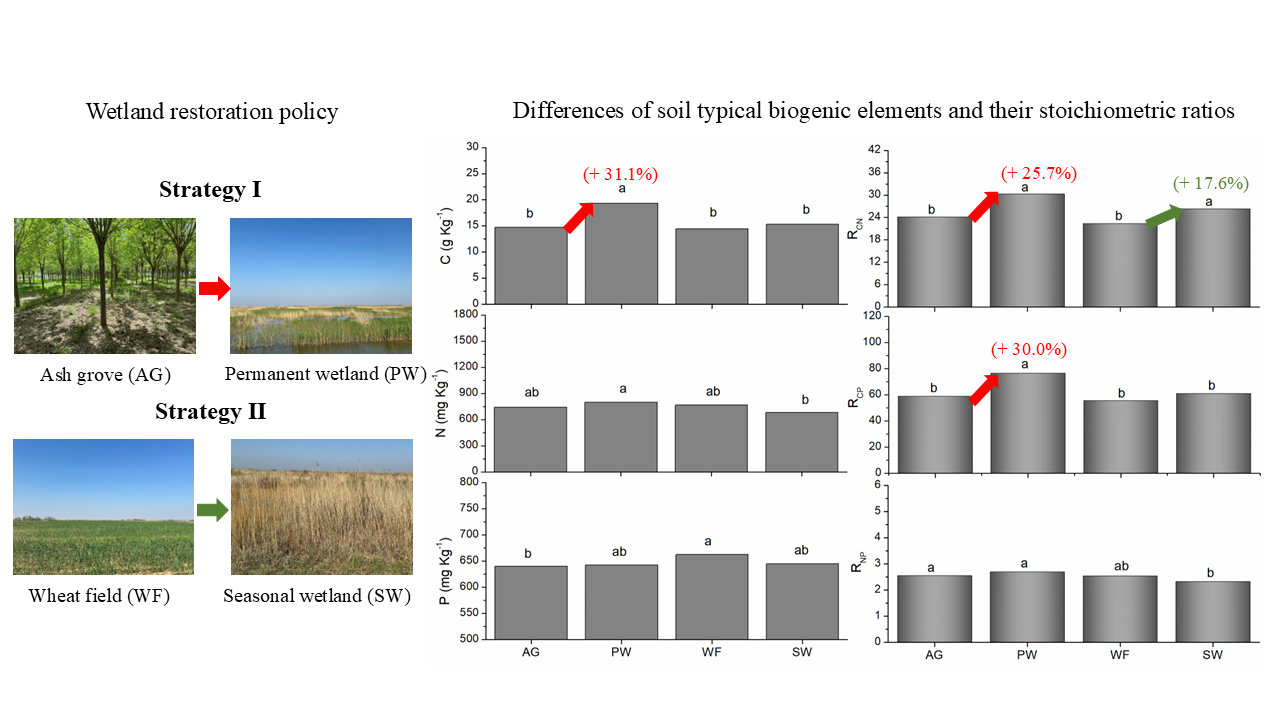
Wetland restoration has led to land-use changes of coastal zone and also effected on soil nutrient distribution and dynamics. To characterize the differences of typical biogenic elements (C, N and P) distribution and trends of soil induced by wetland restoration policy, we studied two intervention strategies which covered woodland or cropland converted into wetland from four wetland use conditions (ash grove (AG), permanent wetland (PW), wheat field (WF) and seasonal wetland (SW)) in the Yellow River Delta (YRD). The results demonstrated that conversion to permanent wetland showed a more or less significant increase in concentrations and stoichiometric ratios of soil C, N and P, while reclamation of seasonal wetland increased soil N and soil P and the ratio of soil N:P (RNP). We observed the mean soil C concentrations of PW and SW increased by 31.1% and 6.3% in the 0-50cm soil profile separately, compared to their former wetland use, confirming powerful C sequestration of coastal wetlands. PW after 25 years of conversion of woodland to wetland showed an increase in soil C:N (RCN, 25.7%) and C:P (RCP, 30.0%) and SW after 12 years of returning cropland to wetland showed an increase by 17.6% in RCN throughout the soil profile, while similar differences of soil in top 5 cm layers turned out to be even apparent in the studied four wetland use conditions, suggesting the varying of different wetland intervention strategies and implementation period. The underlying changes in nutrient distribution and stoichiometric ratio dynamics are mainly due to C sequestration of wetland and N/P fertilization of reclamation. This brings new insights and helps to increase the knowledge the long-term effect of wetland restoration on soil nutrient distribution and trends in YRD. Understanding these effects can provide sensible policymaking for the conservation and management of coastal wetlands, which is helpful to realize ecological functionality of coastal wetland and achieve carbon neutrality in China.
Keywords:
wetland intervention strategy
; biogenic elements distribution
; stoichiometric ratio
; coastal zone soils
; the Yellow River Delta
1. Introduction
Coastal wetlands are not only valuable and sensitive ecosystems, but also the most productive and highly threatened ecosystems, which stayed in a mixture of brackish and fresh water bodies in the world [1,2,3], including seagrass meadows, mangrove forests, intertidal flats, tidal salt marshes and tidal freshwater wetlands [4,5,6,7]. Coastal wetlands provide most decisive ecosystem services, including natural coastal line protection, carbon (C) sequestration and habitat for important populations and species [8,9]. In addition to their ecological, cultural, and aesthetic significance, coastal wetlands play an essential role in ensuring the sustainability of coastal zone to sustain rapid population growth and urbanization through their dynamic interaction with physical and chemical properties of the environment [10,11]. Coastal wetlands are the most intense C sinks of atmospheric greenhouse gases along with organic C stock in the biosphere [12,13,14]. They are responsible for about half of all C burial in oceans (Kirwan and Blum, 2011), and their persistence as a valuable ecosystem (valued up to 194,000 $ ha-1 yr-1) due to waste treatment, erosion control, and storm protection [15], and a strong resilience to sea level rise in all of the climate change scenarios [8,16,17]. Meanwhile, a large global anthropogenic increase in the flux of reactive forms of nitrogen (N) and phosphorous (P) to agroecosystem and natural ecosystems is occurring, and it is reflected in increased nutrient loading in coastal wetlands [18]. And N and P accumulation or limitation in coastal wetlands substantially change the composition and functioning of estuarine and nearshore ecosystems [3,19,20].
Human beings and wetlands have been fiercely intertwined for centuries in coastal zone, whereby populations both influence and depend on the broad and indispensable ecosystem services that coastal wetlands provide [10,11]. Ironically, coastal wetlands are heavily impacted, degraded, or destroyed worldwide by rapid population growth and coastal development, especially by urbanization and tourism exploration [21]. Natural wetland conversion and loss were almost 4 times faster in the 20th and early 21st centuries than previously, with a net loss of up to 70% of natural wetlands present in 1900 AD [22]. The loss rate of coastal natural wetlands accelerated progressively in the 20th century, which is faster than inland natural wetlands; and the phenomenon is continuing worldwide, and particularly rapidly in Asia [22]. Global and regional processes influence the stability of coastal ecosystems and can interact to restrict ecosystem responses to sea level rise, and thus increase their vulnerability to sea level rise and related natural hazards [23,24]. Extensive conversion of coastal zones to urban, agricultural, and industrial land use types brings pressure to bear on remaining natural zones and reduces the ability of delivering valuable ecosystem services such as storm surge resistance, fisheries production, wildlife habitat, recreational tourism, and coastal diverse biota [24,25]. A global meta-analysis revealed rapid economic growth and high population density level are the most frequently identified potential forces of the widespread wetland conversion and loss, and extensive agricultural development has been the main proximate cause [22,26].
Anthropogenic activities mainly refer to the combustion of fossil fuels continuously raise atmospheric carbon dioxide (CO2) concentrations [19]. Meanwhile the excessive use of nutrient chemical fertilizers has greatly increased the quantity of essential nutrients in pedosphere and hydrosphere, especially reactive N released into the atmosphere, which subsequently reaches the terrestrial land surface via deposition [27]. Enhanced nutrient availability due to human activities is frequently identified as a major factor driving changes in the Earth’s ecosystem structure, function and evolution [28]. Meanwhile, changes in the structure, function and evolution of the wetland ecosystems affect ecosystem services impact human welfare that are often underestimated [29]. Coastal ecosystems, including saltmarshes, mangroves, vegetated dunes and sandy beaches, can build vertically and expand laterally in response to sea level rise, though this capacity varies across sites. However, in coastal deltas, human-induced changes can be rapid and modify coastlines over short periods of time, by altering freshwater and sediment availability. Human activities are chiefly to blame as the main factors of coastal wetland loss and degradation [30,31]. Meanwhile, the engineering restoration and phytoremediation turn into the most popular wetland ecological restoration and ecological remediation techniques [32].
In China, coastal reclamation is considered to be the most common landscape change in extensive land redevelopment areas where rapid urbanization occurs [33,34]. However, the main intervention strategies in wetland restoration policy in the Yellow River Delta (YRD) have implemented to convert woodland and cropland which used to be coastal wetlands to coastal wetlands since sustainable development strategy implemented in 1992. Although the conversion projects of former woodland and farmland to wetlands have been carried out for many years in the YRD, the effects of wetland restoration strategy on the nutrient dynamic distribution of coastal zone soils have not been reported in this area. Hence, in this paper, we choose two wetland restoration intervention strategies (strategy Ⅰ: woodland converted to wetland and strategy Ⅱ: cropland converted into wetland) in YRD as our study objects to study their effects on typical biogenic elements distribution of coastal zone soils. The main purposes of this paper are to investigate differences of soil typical biogenic nutrients concentrations (including total C and total N and total P) and stoichiometric ratios of elements (including C:N (RCN), C:P (RCP) and N:P (RNP)) in typical coastal landscapes caused directly by wetland intervention strategies and identify the long-term effect of wetland restoration strategies on typical biogenic distribution and trends of coastal zone soils.
2. Materials and Methods
2.1. Study Area and Sampling Plots Selection
The studied coastal zone is located in YRD, at the south shore of Bohai Sea and the western part of Laizhou Bay in North China (Figure 1). The YRD is the not only one of the most vibrant land-ocean interaction areas among the large river deltas globally [3,35,36]. The Yellow River Delta National Nature Reserve (YNR) established by the State Council of China aims to protect coastal wetland ecosystem in 1992, which has played an important role in providing habitats for diverse biota, including breeding and stopover sites specifically for migration and living safety of rare or endangered bird species [3,37]. The northern part of YNR is the slightly older YRD, but not that far in the past, formed during the Yellow River successively followed the Shenxiangou course from 1953 to 1964 and the Diaokou course from 1964 to 1976 flowing into the Bohai Sea. Ash tree (Fraxinus chinensis), as ecological economic wood was once widely planted. The southern part is the fairly recent YRD, induced from the artificial change from the Diaokou to the Qingshuigou course since 1976, followed by a shift towards the north bank of the Qingbacha course (1996 ~ now) [3,38]. Wheat, rice, corn and cotton are predominant artificial cultivated crops.
To understand the long-term effects of different intervention strategies of perform wetland restoration policy on typical biogenic elements distribution of coastal zone soils in YRD, four kinds of sampling plots were collected in YNR. In response to strategy Ⅰ, Ash grove (AG), where ash tree is main economic tree, and adjacent permanent wetland (PW) which has been convert woodland to grassy marsh wetland after the storm surge in 1997, were collected in Yiqian’er Management Station, the northern part of YNR. At the same time, in response to strategy Ⅱ, wheat field (WF) where wheat is cultivated with corn in rotation, and adjacent seasonal wetlands (SW) where carried out conversion projects of farmland to seasonal tidal freshwater wetland since 2010, were collected in buffer zone of southern part of YNR.
2.2. Sample Collection and Statement
In order to get different vertical layered soil samples, 20 soil sample plots were collected in AG, PW, WF, SW of in April 25-28, 2022, with 5 replicate soil columns in each plot. Soil columns were drilled with 50 cm depth and sectioned at depths of 2,5,10,20 cm. Soil column samples were collected along an S-shaped curve, and corresponding soil samples from same layers 0-2 cm, 2-5 cm, 5-10 cm, 10-20 cm, and 20-50 cm mixed in 5 layers within each plot. After mixing soil samples, they were stored in zip-lock polyethylene plastic bags meanwhile labeled with different depth. Spread soil samples on plastic sheets in a cool, well-ventilated, clean environment for natural air drying when arrived in the laboratory. After drying, the soil samples were ground and subsequently sieved for chemical analysis [3,35].
We state that we had obtained entry exit permits for scientific research activities at these locations and our work did not involve and influence the rare and endangered wild animals and plants.
2.3. Chemical Assay, Calculation, Data Analyses and Figure Drawing
Chemical assay: We used an elemental analyzer of vario MACRO cube (made in Germany 2019) to determine the soil total C and total N, and conventional Mo-Sb colorimetric method to determine the total P in soil which have been previously well describe in detail [3,35,39]. Cutting ring method (cutting ring with a height of 50 mm) was used to measure soil bulk density () at different layers, is the ratio of the dry weight of the sampled soil within cutting ring the and the volume of the cutting ring.
Calculation: The average concentrations of typical biogenic elements (, g-1 or mg kg-1) and C:N:P ratios (, specific value) in 0-50 cm soil were calculated by the following equations:
Where , are soil bulk density and soil thickness of different layers (0-2, 2-5, 5-10, 10-20, 20-50 cm layers), respectively. is soil total nutrient concentration (C, N and P concentration, g kg-1or mg kg-1) of different layers determined by experiment and is C:N:P ratio (divided into , specific value) of different layers calculated after converting mg kg-1 into mmol kg-1. After consideration of soil physical property in the field observations, we take 85% and 110% of 0-5 cm layer as 0-2 cm layer and 2-5 cm layer respectively, considering the height limit of cutting ring.
Data analyses: IBM SPSS Statistics 26.0 software package (IBM Inc., 2019) was used to analyze difference test of significance in typical biogenic nutrients (including C, N and P) concentrations and their stoichiometry ratios of elements (including C:N (RCN), C:P (RCP) and N:P (RNP)) in different sites and layers within groups.
Figure drawing: Figures were drawn by using OriginPro v2021 software packages (OriginLab Inc., 2021).
3. Results
3.1. Soil C, N, and P Concentrations and Variability
Soil C concentrations varied across in AG, PW, WF, SW, ranging between 11.54 and 27.87 g kg-1, 14.67 and 42.28 g kg-1, 10.75 and 26.62 g kg-1,12.69 and 25.31 g kg-1, respectively (Table 1). PW exhibited the highest coefficient of variation (c.v.) in soil C concentrations, whereas SW showed the lowest. The mean content of soil C was ranked as PW >> SW > AG > WF. A significant difference was found between PW and SW (P < 0.01) in content of soil C, and no significant difference was identified between AG and WF (Figure 2).
Soil N concentrations in AG, PW, WF, SW ranged between 611.58 and 1801.36 mg kg-1, 604.84 and 2481.78 mg kg-1, 609.31 and 1892.44 mg kg-1, 578.57 and 1208.27 mg kg-1, respectively (Table 1). The c.v. of soil N concentrations followed a similar pattern to as those of soil C. The mean N content ranked from highest to lowest as PW, WF, AG, SW. A significant difference was no significant difference was identified between PW and SW (P < 0.05) in content of soil N, but no significant difference observed between AG and WF (Figure 2). Meanwhile, both C concentrations and N concentrations exhibited significant spatial variability in PW in 0-50 cm depth profile distribution.
Soil P concentrations in AG, PW, WF, SW ranged between 608.17 and 707.00 mg kg-1, 583.00 and 746.33 mg kg-1, 632.83 and 797.00 mg kg-1, 616.17 and 768.65 mg kg-1, respectively (Table 1). The mean P content was highest in WF, followed by PW, SW, and AG. A significant difference was found between WF and AG (P <0.05), but no significant difference was observed between PW and SW. Soil P concentrations in all sample plots exhibited low spatial variability across the 0-50 cm depth profile, with the smallest and most stable coefficient of variation values.
3.2. Stoichiometry Ratios of Soil C, N and P
The ranges of RCN were 11.90 to 29.26, 17.65 to 40.49, 16.28 to 25.21, and 21.33 to 32.99 in AG, PW, WF and SW, respectively (Table 1). The mean RCN values were ranked as PW > SW >> AG > WF, and there were significant differences in RCN between PW/SW and AG/WF (P < 0.05). Meanwhile, the difference between PW and SW and the difference between AG and WF were not statistically significant (Figure 2).
The ranges of RCP were 48.74 to 101.90, 61.50 to 150.34, 43.78 to 94.02, and 51.64 to 96.68 in AG, PW, WF and SW, respectively (Table 1). The mean RCP values were highest in PW, followed by SW, AG, and WF, with significant differences observed between PW and SW/AG/WF (P < 0.05), but no significant differences among AG, WF and SW (Figure 2).
The ranges of RNP were 2.10 to 5.69, 2.07 to 7.47, 2.05 to 5.44, and 1.87 to 3.89 in AG, PW, WF and SW, respectively (Table 1). The mean RNP value descended in the order of order of PW, AG, WF and SW, and there were significant differences in RCN between PW/AG and SW (P < 0.05), no significant differences between WF and PW/AG/SW (Figure 2). Additionally, the RCN, RCP and RNP in PW showed higher spatial variability compared to that of AG, WF and SW in 0-50 cm depth profile distribution.
3.3. Profile Distribution of Soil C, N and P Concentrations and Ratios
The mean concentrations of soil C, N and P in soil profiles under different wetland use types were showed in Table 2 and A1. Results showed that concentrations of soil C, N and P in surface layers were higher than those of the deeper layers and all significantly declined with soil depth increasing (Figure 3). Meanwhile, all soil profiles showed same consistent downward trends, decreased steeply in top layers and leveled off below 10 cm. PW showed the steepest decline in 0-10 cm soil layers, while SW had little change.
Soil C and soil N showed greater variability than soil P in 0-50 cm depth profile distribution under different wetland use types, and the variation of soil N in 10-50cm soil layers were relatively small and stable. Duncan’s multiple-range test which included a one-way ANOVA: post Hoc multiple comparison tests further identified significant differences amongst different soil layers, except for the 10-20cm soil layer and 20-50cm soil layer at 0.05 (Table 2) or 0.01 level considering the concentrations of C, N and P (Table A1).
In different wetland use types, significant differences were observed analogously amongst different soil layers considering the RCN, RCP and RNP values (Figure 4). With the soil depth increasing, RCN increased in the entire soil profiles including PW, WF and SW, with an exception in AG 0-5cm depth. RCP followed an opposite ranking order in AG, PW and WF decreased with increasing soil depth, with the exception of 0-5cm depth in SW, and RNP showed the same order as RCP in all soil profiles (Figure 4). RCN and RCP exhibited greater variability than RNP across the 0-50 cm depth profile distribution, and RNP showed low spatial variability within same soil layers throughout the profile and its variations in 10-20cm soil layers and 20-50cm soil layers were relatively minor and stable (Figure 4).
4. Discussion
4.1. The Transition and the Influence of China’s Land Use Policy
Globally, nearly all temperate coastal regions have experienced net immigration with rapid economic growth which has led to extensive conversion of natural coastal wetlands to agriculture, aquaculture, forestry, and residential and industrial purposes [10,25]. In 2023, China produced over 6.95 × 10⁸ t of grains and has successfully fed 18% population for many years with only 9% arable land and 6% freshwater resources at a global scale. This achievement also significantly contributes to the goals of achieving the eradication of world hunger and ensuring global food security. According to a global forest resources assessment in 2020 led by FAO, China possesses a total forest area of 2.20 × 10⁸ ha, accounting for 5 % of the total forest area around the whole world [40]. Satellite data indicates that climate change, human land-use practices, fertilization, N deposition and recovery from natural disturbances have played crucial roes in increasing leaf area of vegetation directly or indirectly [41]. The net increase in leaf area of China accounts for one quarter of the global net increase, despite that China only covered 6.6% of global vegetated area during 2000 ~ 2017, and forests and croplands contribute 42% and 32%, respectively [41]. Focusing on forested lands in China, forest inventories reveal a notable 19% increase in forest area over a single decade driven by natural forest expansion and afforestation [41]. Healthy forests can not only supply food, energy, and building materials, but also provide extensive and essential ecosystem services, for example, hosting biodiversity, storing C, and regulating climate for human [42], while cropland define as agricultural land used to meet increasing demands for food, biofuel and other commodities intended for mankind consumption under the background of global population growth and increasing standards of living [43]. With the corresponding period, a global assessment on wetland losses reveals that long-term loss and conversion of natural wetlands has been widespread around the whole world only excluding Antarctica [22]. According to the latest estimations in recent studies, nearly one third of China’s wetlands lost during 1978 to 2008 based on survey and draw wetland map [44], and about 29% of China’s wetlands have been lost mainly due to direct human activity, including the acceleration of agricultural development and urbanization [31,44].
Policies and strategies addressing the interplay between climate change and wetlands can be found both in related entities and policies at all levels of government which ensure effective climate change adaptation, emergency response and disaster risk control in coastal zones in the context of a changing climate [7,45]. Although wetlands are not explicitly referenced in formal climate change treaties, their relevance and significance are implied by the definitions of wetlands as “sources or sinks and reservoirs” for greenhouse gases by wetland scientists and policy makers [7,46,47]. Wetlands, particularly coastal saltwater blue C wetlands support incredibly productive plant communities, that remove and absorb vast amounts of CO2 via photosynthesis with high-biomass plants, and sequester the largest fraction of that C in their wet, anaerobic soils [7,13,48]. Historically, the lack of national legislation for wetland conservation, overemphasis on GDP growth, undervaluation of wetlands, and inappropriate definitions of wetlands in laws and regulations contributed to China’s coastal wetlands loss [33]. Now, enhancing the wetland carbon sink function is one of the important ways for China to achieve the strategic goal of carbon peaking and carbon neutrality [46]. According to the current estimation of the National Forestry and Grassland Administration, wetlands have steadily expanded steadily recent years, growing by 202,600 ha only from 2016 to 2020 in China, which play an important role in environmental protection and water quality improvement work [49]. In our studied region, policies have promoted the conversion of woodland to wetland grassland, the conversion of farmland to wetland since YNR had been established. Additionally, the local government and Sinopec’s Shengli Oilfield have dismantled about 300 oil wells located in and around the core area of Yellow River estuary to protect coastal wetland in recent years. The up-to-date number of birds species in YNR has increased to 371, almost twice as the number 187 when it was established, and the protected species populations in the reserve already reach 1% of their global totals at present [50]. Legislation on wetland conservation and the implement of early restoration strategies have significantly promoted biodiversity and other ecological functions of YNR’s coastal wetlands.
4.2. Wetland Restoration Policies Effects on Coastal Wetland Soil
Although wetland plant communities have relatively high biomass compared to those in other land use types, the overwhelming majority of sequestered C was stored in the soils rather than plants in most types of wetlands [7]. Meanwhile, spatial and temporal distribution of soil nutrients varies in accordance with land use patterns [28,51], both because land managers have selected specific soil texture, nutrition and moisture conditions for specific land uses, and modified the improper soil properties in the process tailored to their needs. Permanent environment factors and land-use effects are unlikely to display the exact same spatial patterns [52]. Forest loss drives a decaying capacity of plant leaves and litter to retain carbon inside forest patches in deforested landscapes [53]. Draining wetlands used for agriculture conversion can lead to the oxidation of soil organic matter, releasing CO2 into the atmosphere. In China, coastal reclamation has significantly reduced carbon storage, that only 4.2% of the total reclamation area accounted for one-fifth of carbon storage loss across all coastal wetlands between 1990 and 2015 [34], and the most significant decline of C storage observed in the Yangtze River Delta, the Pearl River Delta and the Bohai Bay between 2005 and 2010 [34,54].
In our studied sites, we observed that significant increases in soil C (31.1%) and RCN (25.7%) and RCP (30.0%) in PW after 25 years of forest loss compared with AG throughout the 0-50cm soil profile (Table 1, Figure 2). Same trends were even more obvious within the upper 5 cm of soils (Figure 4) which retained the most recent C accumulation may be ascribed to powerful carbon sequestration capacity inherent in coastal zone soils. Additionally, soil RCN in SW showed a notable 17.6% increase compared with those in WF throughout the 0-50cm soil profile, accompanied a significant reduction of RNP in 10 cm depth below the surface (Table 2, Figure 4). However, the increase of soil C and the decrease of soil N and P in SW were not obvious after 12 years natural restoration from crop planting, confirming the combined effects of wetland nutrient retention in SW and agricultural development, including crop fertilization, straw removal carried out in WF. Nevertheless, nearly all content and stoichiometric ratio indicators of PW soil C, N and P were noticeably higher than those of SW, with an exception of soil P which no significant difference was found, indicated that the longer litter deposition and the better soil nutrient retention capacity of coastal wetland soils under inundation. Indeed, implementing wetland restoration strategies can significantly affected vegetation cover, soil-plant system nutrient cycling, and overall ecosystem dynamics in wetlands, ultimately achieving a new balanced soil elemental stoichiometry. Under limiting conditions, soil degradation resulting from deforestation did not happen in our study area, on the contrary, convert woodlands to grassy marsh wetlands improved the contents and stoichiometric ratios of nutrients, especially for relative indicators with soil C. Meanwhile, combined fertilization of N, P and other nutrition elements during agricultural cultivation definitely change contents and stoichiometric ratios of soil nutrients in coastal zone slowly. It needs a sufficient time interval to observe meaningful differences in soil between the current restored wetland and the former wetland use patterns under manual intervention.
5. Conclusions
In summary, our study analyzes the impact of current wetland restoration and utilization policies on soil nutrient distribution in YRD. We suggest that wetland restoration is the optimal strategy for YRD to enhance its long-term C sequestration and other ecological functions. Proper management, prudent utilization and conservation of coastal wetlands could be profit to achieve carbon neutrality for China. Nonetheless, long-term monitoring and ongoing research are essential to fully comprehend the effects of restoration on coastal ecosystems.
Author Contributions
F. Qu, L. Meng and A. Song were responsible for methodology conceptualization, data curation, funding acquisition and wrote and revised the original paper. F. Qu, J Liu, M Luo, F. Wang were responsible for the investigation and formal analysis J. Liu, F. Wang and M. Luo who performed the experiment were responsible for data curation and analysis in the lab. X. Wu provided resources and supervision during our sampling and experimental work. All authors contributed ideas and actions diligently to the final version of this research paper.
Data Availability Statement
The original data presented in this study are included in the article. Further inquiries can be directed to the corresponding author.
Acknowledgments
Meng L. received fundings from the National Natural Science Foundation of China (Grant No. 42406193); Qu F., Meng L. and Song A. received fundings from the Natural Science Foundation of Shandong Province grants (Grant No. ZR2023MD046, No. ZR2020QD092 and No. ZR2020MD007 respectively). Wu X.’s participation was supported by the Yiqian’er Management Station and Dawenliu Management Station affiliated to Yellow River Delta National Nature Reserve. We are grateful to the staff of the reserve for providing us with convenience in sampling for this study.
Conflicts of Interest
The authors declare that there is no potential conflict of interest regarding the publication of this paper.
Abbreviations
The following abbreviations are used in this manuscript:
| YNR | The Yellow River Delta National Nature Reserve |
| YRD | The Yellow River Delta |
| AG | Ash grove |
| PW | Permanent wetland |
| WF | Wheat field |
| SW | Seasonal wetland |
Appendix A
Appendix A.1

Table A1.
Profile distribution of soil C, N and P concentrations and ratios under different wetland use types in the YRD. (p = 0.01, n =25).
Table A1.
Profile distribution of soil C, N and P concentrations and ratios under different wetland use types in the YRD. (p = 0.01, n =25).
| Plots | Parameters | 0-2 cm | 0-5 cm | 5-10 cm | 10-20 cm | 20-50 cm |
| AG | C | 24.16 a | 20.98 ab | 16.54 bc | 14.54 c | 13.19 c |
| N | 1701.74 a | 1540.48 b | 809.84 c | 648.35 d | 620.00 d | |
| P | 695.19 a | 676.51 ab | 645.75 bc | 631.31 c | 635.11 c | |
| RCN | 16.55 b | 15.86 b | 23.77 a | 26.13 a | 24.82 a | |
| RCP | 89.56 a | 79.70 ab | 66.03 bc | 59.35 c | 53.49 c | |
| RNP | 5.42 a | 5.04 a | 2.77 b | 2.27 c | 2.16 c | |
| PW | C | 37.71 a | 33.72 a | 21.35 b | 18.23 b | 16.61 b |
| N | 2388.48 a | 1901.64 b | 920.26 c | 641.83 d | 612.66 d | |
| P | 735.19 a | 719.04 a | 673.91 b | 659.745 b | 617.12 c | |
| RCN | 18.40 b | 20.71 b | 27.02 a | 33.16 a | 31.65 a | |
| RCP | 132.29 a | 120.93 a | 81.57 b | 71.34 b | 69.39 b | |
| RNP | 7.18 a | 5.85 b | 3.02 c | 2.15 d | 2.20 d | |
| WF | C | 24.24 a | 23.37 a | 18.07 b | 14.44 c | 12.22 c |
| N | 1693.51 a | 1381.25 b | 1034.29 c | 690.64 d | 626.91 d | |
| P | 730.33 a | 715.31 a | 705.31 ab | 662.31 bc | 646.21 c | |
| RCN | 16.71 b | 20.01 ab | 20.49 ab | 24.41 a | 22.68 a | |
| RCP | 85.74 a | 84.31 a | 66.16 b | 56.18 bc | 48.74 c | |
| RNP | 5.13 a | 4.26 b | 3.24 c | 2.31 d | 2.14 d | |
| SW | C | 20.65 a | 21.03 a | 16.65 b | 16.15 b | 13.87 b |
| N | 1041.29 a | 965.75 a | 738.34 b | 642.42 b | 629.64 b | |
| P | 722.53 a | 702.59 ab | 678.26 bc | 643.82 cd | 628.68 d | |
| RCN | 23.30 b | 25.43 ab | 26.52 ab | 29.28 a | 25.64 ab | |
| RCP | 73.84 ab | 77.37 a | 63.40 ab | 64.82 ab | 56.91 b | |
| RNP | 3.19 a | 3.04 a | 2.41 b | 2.21 b | 2.22 b |
* The superscript a, b, c and d refer to significant differences between groups, and groups in homogeneous subsets are marked as the superscript ab, bc and cd. The order of groups with a rank as: a > ab > b > bc > c > cd > d (p = 0.01, n =25).
References
- Navarro, N.; Rodríguez-Santalla, I. Coastal Wetlands. J. Mar. Sci. Eng. 2023, 11, 767. [Google Scholar] [CrossRef]
- Cowardin, L.M.; Carter, V.; Golet, F.C.; LaRoe, E.T. Classification of Wetlands and Deepwater Habitats of the United States. Fish and Wildlife Service, U.D.o.t.I., Ed. Fish and Wildlife Service, US Department of the Interior.: Washington, D.C., 1979; p 131.
- Meng, L.; Qu, F.; Bi, X.; Xia, J.; Li, Y.; Wang, X.; Yu, J. Elemental stoichiometry (C, N, P) of soil in the Yellow River Delta nature reserve: Understanding N and P status of soil in the coastal estuary. Sci. Total Environ. 2021, 751, 141737. [Google Scholar] [CrossRef] [PubMed]
- S.Hopkinson, C.; Wolanski, E.; Cahoon, D.R.; Perillo, G.M.E.; Brinson, M.M. Coastal Wetlands: A Synthesis. In Coastal Wetlands: An Integrated Ecosystem Approach, Second Edition ed.; Perillo, G.M.E., Wolanski, E., Cahoon, D.R., Brinson, M.M., Eds. Elsevier: Amsterdam, 2019; pp 1-75.
- Finlayson, C.M.; Milton, G.R.; Prentice, R.C. Wetland types and distribution. In Finlayson, C.M., Milton, G.R., & Prentice, R.C. (2018). . in: Finlayson, C. Max, Milton, G. Randy, Prentice, R. Crawford and Davidson, Nick C. (ed.) The Wetland Book II: Distribution, Description and Conservation, Finlayson, C.M., Milton, G.R., Prentice, R.C., Davidson, N.C., Eds. Springer Netherlands: 2018.
- Moffett, K.B.; Nardin, W.; Silvestri, S.; Wang, C.; Temmerman, S. Multiple Stable States and Catastrophic Shifts in Coastal Wetlands: Progress, Challenges, and Opportunities in Validating Theory Using Remote Sensing and Other Methods. Remote Sens. 2015, 7, 10184–10226. [Google Scholar] [CrossRef]
- Moomaw, W.R.; Chmura, G.L.; Davies, G.T.; Finlayson, C.M.; Middleton, B.A.; Natali, S.M.; Perry, J.E.; Roulet, N.; Sutton-Grier, A.E. Wetlands In a Changing Climate: Science, Policy and Management. Wetlands 2018, 38, 183–205. [Google Scholar] [CrossRef]
- Schuerch, M.; Spencer, T.; Temmerman, S.; Kirwan, M.L.; Wolff, C.; Lincke, D.; McOwen, C.J.; Pickering, M.D.; Reef, R.; Vafeidis, A.T. , et al. Future response of global coastal wetlands to sea-level rise. Nature 2018, 561, 231–234. [Google Scholar] [CrossRef] [PubMed]
- Maltby, E.; Acreman, M.C. Ecosystem services of wetlands: pathfinder for a new paradigm. Hydrol. Sci. J. 2011, 56, 1341–1359. [Google Scholar] [CrossRef]
- Pratolongo, P.; Leonardi, N.; Kirby, J.R.; Plater, A. Temperate coastal wetlands: morphology, sediment processes, and plant communities. In Coastal Wetlands: An Integrated Ecosystem Approach, Second Edition ed.; Perillo, G.M.E., Wolanski, E., Cahoon, D.R., Brinson, M.M., Eds. Amsterdam, 2019; pp 105-152.
- Kirwan, M.L.; Megonigal, J.P. Tidal wetland stability in the face of human impacts and sea-level rise. Nature 2013, 504, 53–60. [Google Scholar] [CrossRef]
- Maher, D.T.; Call, M.; Santos, I.R.; Sanders, C.J. Beyond burial: lateral exchange is a significant atmospheric carbon sink in mangrove forests. Biol. Lett. 2018, 14, 20180200. [Google Scholar] [CrossRef]
- Fourqurean, J.W.; Duarte, C.M.; Kennedy, H.; Marbà, N.; Holmer, M.; Mateo, M.A.; Apostolaki, E.T.; Kendrick, G.A.; Krause-Jensen, D.; McGlathery, K.J., et al. Seagrass ecosystems as a globally significant carbon stock. Nat. Geosci. 2012, 5, 505-509. [CrossRef]
- Chmura, G.L.; Anisfeld, S.C.; Cahoon, D.R.; Lynch, J.C. Global carbon sequestration in tidal, saline wetland soils. Global Biogeochem. Cy. 2003, 17, 1111. [Google Scholar] [CrossRef]
- Costanza, R.; Groot, R.d.; Sutton, P.; Ploeg, S.v.d.; Anderson, S.J.; Kubiszewski, I.; Farber, S.; Turner, R.K. Changes in the global value of ecosystem services. Global Environ. Chang. 2014, 26, 152–158. [Google Scholar] [CrossRef]
- Wang, F.; Lu, X.; Sanders, C.J.; Tang, J. Tidal wetland resilience to sea level rise increases their carbon sequestration capacity in United States. Nat. Commun. 2019, 10, 5434. [Google Scholar] [CrossRef]
- Macreadie, P.I.; Costa, M.D.P.; Atwood, T.B.; Friess, D.A.; Kelleway, J.J.; Kennedy, H.; Lovelock, C.E.; Serrano, O.; Duarte, C.M. Blue carbon as a natural climate solution. Nat. Rev. Earth Env. 2021, 2, 826–839. [Google Scholar] [CrossRef]
- Morris, J.T.; Bradley, P.M. Effects of nutrient loading on the carbon balance of coastal wetland sediments. Limnol. Oceanogr. 1999, 44, 699–702. [Google Scholar] [CrossRef]
- Peñuelas, J.; Sardans, J.; Rivas-ubach, A.; Janssens, I.A. The human-induced imbalance between C, N and P in Earth’s life system. Glob. Chang. Biol. 2012, 18, 3–6. [Google Scholar] [CrossRef]
- Sundareshwar, P.V.; Morris, J.T.; Koepfler, E.K.; Fornwalt, B. Phosphorus Limitation of Coastal Ecosystem Processes. Science 2003, 299, 563–565. [Google Scholar] [CrossRef]
- Aitali, R.; Snoussi, M.; Kolker, A.S.; Oujidi, B.; Mhammdi, N. Effects of Land Use/Land Cover Changes on Carbon Storage in North African Coastal Wetlands. J. Mar. Sci. Eng. 2022, 10, 364. [Google Scholar] [CrossRef]
- Davidson, N.C. How much wetland has the world lost? Long-term and recent trends in global wetland area. Mar. Freshw. Res. 2014, 65, 934–941. [Google Scholar] [CrossRef]
- Heckbert, S.; Costanza, R.; Poloczanska, E.; Richardson, A. Climate Regulation as a Service from Estuarine and Coastal Ecosystems. In Treatise on Estuarine and Coastal Science, 2011.
- Oppenheimer, M.; Glavovic, B.C.; Hinkel, J.; Wal, R.v.d.; Magnan, A.K.; Abd-Elgawad, A.; Cai, R.; Cifuentes-Jara, M.; DeConto, R.M.; Ghosh, T., et al. Sea level rise and implications for low-lying islands, coasts and communities; Cambridge, UK and New York, NY, USA, 2019; pp 321-445.
- Foster, T.E.; Stolen, E.D.; Hall, C.R.; Schaub, R.; Duncan, B.W.; Hunt, D.K.; Drese, J.H. Modeling vegetation community responses to sea-level rise on Barrier Island systems: A case study on the Cape Canaveral Barrier Island complex, Florida, USA. PLoS One 2017, 12, e0182605. [Google Scholar] [CrossRef]
- Asselen, S.v.; Verburg, P.H.; Vermaat, J.E.; Janse, J.H. Drivers of Wetland Conversion: a Global Meta-Analysis. PLoS ONE 2013, 8, e81292. [Google Scholar] [CrossRef]
- Maaroufi, N.I.; Nordin, A.; Hasselquist, N.J.; Bach, L.H.; Palmqvist, K.; Gundale, M.J. Anthropogenic nitrogen deposition enhances carbon sequestration in boreal soils. Glob. Chang. Biol. 2015, 21, 3169–3180. [Google Scholar] [CrossRef]
- Graham, S.A.; Mendelssohn, I.A.; Silliman, B. Contrasting effects of nutrient enrichment on below-ground biomass in coastal wetlands. J. Ecol. 2015, 104, 249–260. [Google Scholar] [CrossRef]
- Newton, A.; Icely, J.; Cristina, S.; Perillo, G.M.E.; Turner, R.E.; Ashan, D.; Cragg, S.; Luo, Y.; Tu, C.; Li, Y., et al. Anthropogenic, Direct Pressures on Coastal Wetlands. Front. Ecol. Evol. 2020, 8. [CrossRef]
- Coleman, J.M.; Huh, O.K.; Braud, D. Wetland Loss in World Deltas. J. Coastal Res. 2008, 24, 1–14. [Google Scholar] [CrossRef]
- Hu, S.; Niu, Z.; Chen, Y.; Li, L.; Zhang, H. Global wetlands: Potential distribution, wetland loss, and status. Sci. Total Environ. 2017, 586, 319–327. [Google Scholar] [CrossRef] [PubMed]
- Zhou, D.; Yu, J.; Guan, B.; Li, Y.; Yu, M.; Qu, F.; Zhan, C.; Lv, Z.; Wu, H.; Wang, Q., et al. A Comparison of the Development of Wetland Restoration Techniques in China and Other Nations. Wetlands 2020, 40, 2755-2764. [CrossRef]
- Ma, Z.; Melville, D.S.; Liu, J.; Chen, Y.; Yang, H.; Ren, W.; Zhang, Z.; Piersma, T.; Li, B. Rethinking China’s new great wall: Massive seawall construction in coastal wetlands threatens biodiversity. Science 2014, 346, 912–914. [Google Scholar] [CrossRef] [PubMed]
- Li, Y.; Qiu, J.; Li, Z.; Li, Y. Assessment of Blue Carbon Storage Loss in Coastal Wetlands under Rapid Reclamation. Sustainability 2018, 10, 2818. [Google Scholar] [CrossRef]
- Qu, F.; Yu, J.; Du, S.; Li, Y.; Lv, X.; Ning, K.; Wu, H.; Meng, L. Influences of anthropogenic cultivation on C, N and P stoichiometry of reed-dominated coastal wetlands in the Yellow River Delta. Geoderma 2014, 235-236, 227-232. [CrossRef]
- Yang, W.; Sun, T.; Yang, Z. Effect of activities associated with coastal reclamation on the macrobenthos community in coastal wetlands of the Yellow River Delta, China: a literature review and systematic assessment. Ocean Coast. Manag. 2016, 129, 1–9. [Google Scholar] [CrossRef]
- Qu, F.; Meng, L.; Xia, J.; Huang, H.; Zhan, C.; Li, Y. Soil phosphorus fractions and distributions in estuarine wetlands with different climax vegetation covers in the Yellow River Delta. Ecol. Indic. 2021, 125, 107497. [Google Scholar] [CrossRef]
- Li, S.; Wang, G.; Deng, W.; Hu, Y.; Hu, W. Influence of hydrology process on wetland landscape pattern: A case study in the Yellow River Delta. Ecol. Eng. 2009, 35, 1719–1726. [Google Scholar] [CrossRef]
- Zhao, Y.Y.; Hu, X.M.; Lu, Z.H. Soil C, N and P Stoichiometry of Shrub Communities in Chenier Wetlands in Yellow River Delta, China. Asian J. Chem. 2014, 26, 5457–5460. [Google Scholar] [CrossRef]
- FAO. Global Forest Resources Assessment 2020—Key findings; Rome, 2020.
- Chen, C.; Park, T.; Wang, X.; Piao, S.; Xu, B.; Chaturvedi, R.K.; Fuchs, R.; Brovkin, V.; Ciais, P.; Fensholt, R., et al. China and India lead in greening of the world through land-use management. Nat. Sustain. 2019, 2, 122-129. [CrossRef]
- Trumbore, S.; Brando, P.; Hartmann, H. Forest health and global change. Science 2015, 349, 814–818. [Google Scholar] [CrossRef]
- Potapov, P.; Turubanova, S.; Hansen, M.C.; Tyukavina, A.; Zalles, V.; Khan, A.; Song, X.-P.; Pickens, A.; Shen, Q.; Cortez, J. Global maps of cropland extent and change show accelerated cropland expansion in the twenty-first century. Nat. Food 2021, 3, 19–28. [Google Scholar] [CrossRef] [PubMed]
- Niu, Z.; Zhang, H.; Wang, X.; Yao, W.; Zhou, D.; Zhao, K.; Zhao, H.; Li, N.; Huang, H.; Li, C., et al. Mapping wetland changes in China between 1978 and 2008. Chinese Sci. Bull. 2012, 57, 2813-2823. [CrossRef]
- Jentoft, S.; Chuenpagdee, R.; Barragán-Paladines, M.J.; Franz, N. The Small-Scale Fisheries Guidelines; Springer International Publishing AG: Cham, Switzerland, 2017; Vol. 14, pp. 850.
- Zhang, X.; Zhu, J.; Zhang, X.; Yan, Z.; Kang, X. Approaches to Enhance Wetland Carbon Sink in China. Natural Protected Areas 2022, 2, 17–23. [Google Scholar] [CrossRef]
- Zhang, J. Coastal Saline Soil Rehabilitation and Utilization Based on Forestry Approaches in China. Springer: 2014.
- Donato, D.C.; Kauffman, J.B.; Murdiyarso, D.; Kurnianto, S.; Stidham, M.; Kanninen, M. Mangroves among the most carbon-rich forests in the tropics. Nat. Geosci. 2011, 4, 293–297. [Google Scholar] [CrossRef]
- Yang, W. China makes progress on wetlands preservation. China Daily 2021.
- Hou, L. Environmental protection makes China’s wetland areas flourish. China Daily 2022.
- Liu, X.; Ma, J.; Ma, Z.-W.; Li, L.-H. Soil nutrient contents and stoichiometry as affected by land-use in an agro-pastoral region of northwest China. CATENA 2017, 150, 146–153. [Google Scholar] [CrossRef]
- Burst, M.; Chauchard, S.; Dambrine, E.; Dupouey, J.-L.; Amiaud, B. Distribution of soil properties along forest-grassland interfaces: Influence of permanent environmental factors or land-use after-effects? Agr. Ecosyst. Environ. 2020, 289, 106739. [Google Scholar] [CrossRef]
- Faria, D.; Morante-Filho, J.C.; Baumgarten, J.; Bovendorp, R.S.; Cazetta, E.; Gaiotto, F.A.; Mariano-Neto, E.; Mielke, M.S.; Pessoa, M.S.; Rocha-Santos, L., et al. The breakdown of ecosystem functionality driven by deforestation in a global biodiversity hotspot. Biol. Conserv. 2023, 283, 110126. [CrossRef]
- Tian, P.; Zhai, J.; Zhao, G.; Mu, X. Dynamics of runoff and suspended sediment transport in a highly erodible catchment on the chinese Loess Plateau. Land Degrad. Dev. 2016, 27, 839–850. [Google Scholar] [CrossRef]
Figure 1.
Sampling plots in coastal zone in the YRD (including: ash grove (AG) and permanent wetland (PW), wheat field (WF) and seasonal wetland (SW)).
Figure 1.
Sampling plots in coastal zone in the YRD (including: ash grove (AG) and permanent wetland (PW), wheat field (WF) and seasonal wetland (SW)).
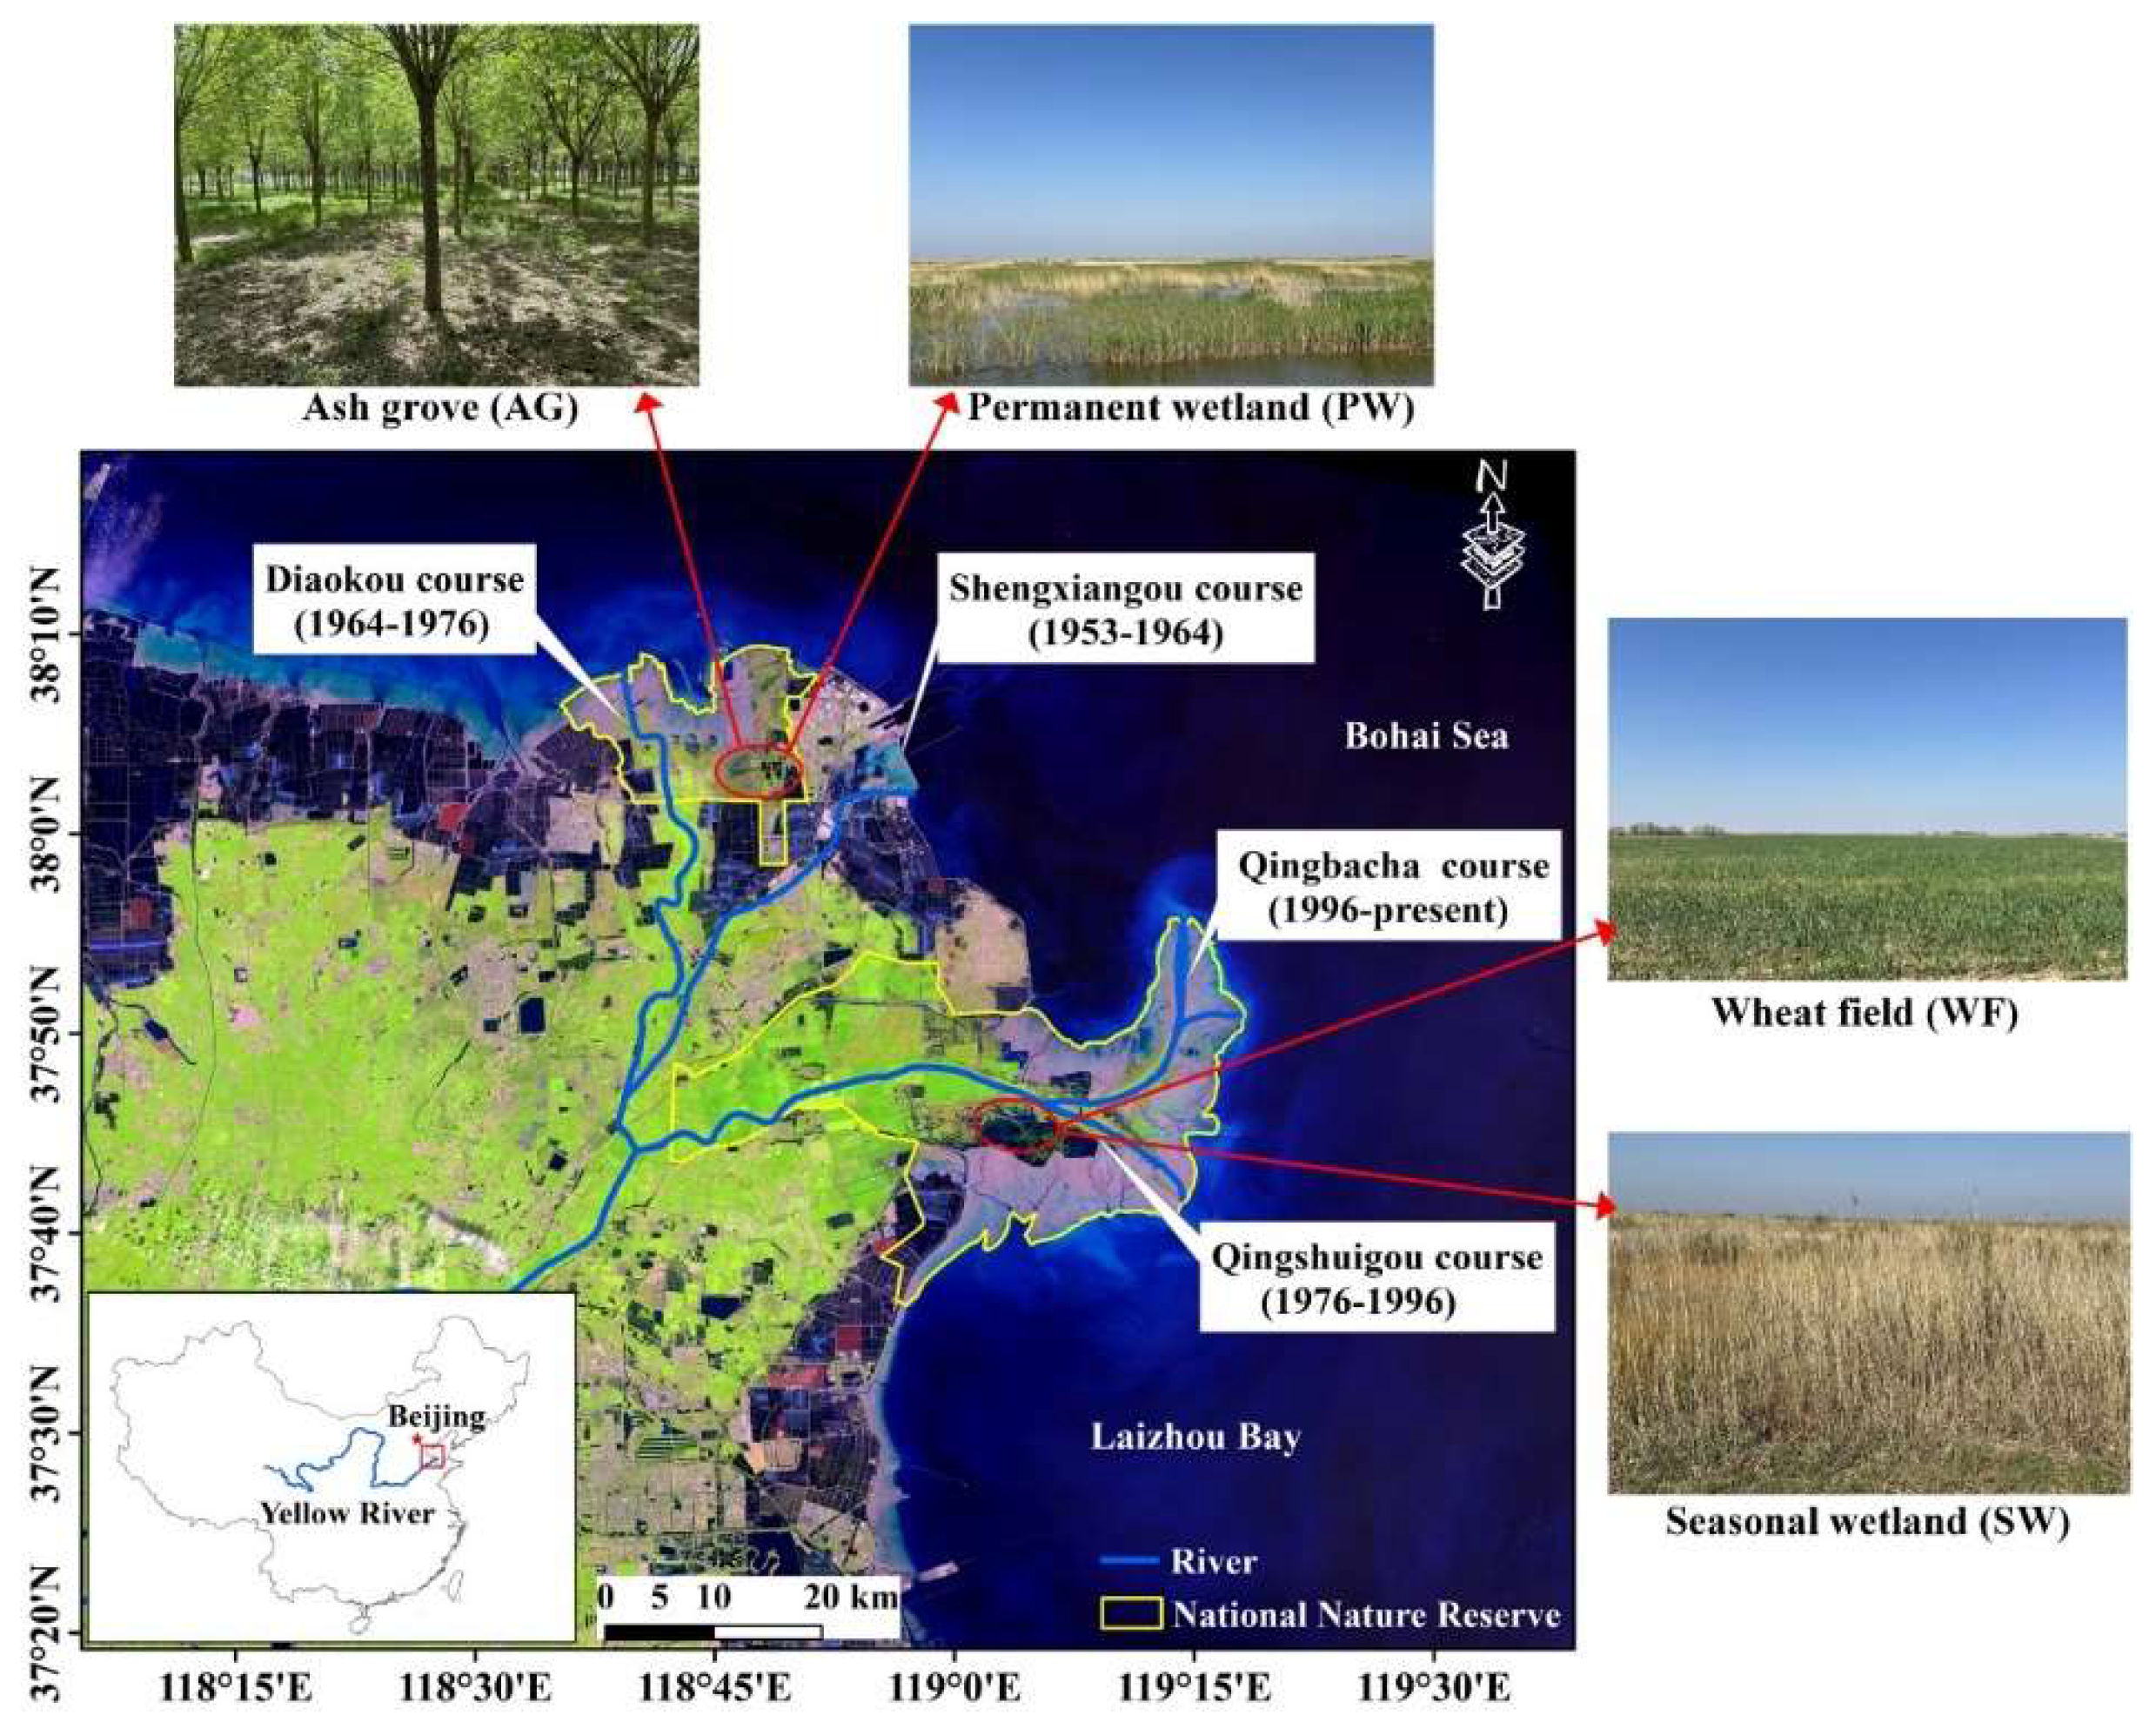
Figure 2.
The mean concentrations and stoichiometry ratios of soil C, N and P under different wetland use types.
Figure 2.
The mean concentrations and stoichiometry ratios of soil C, N and P under different wetland use types.
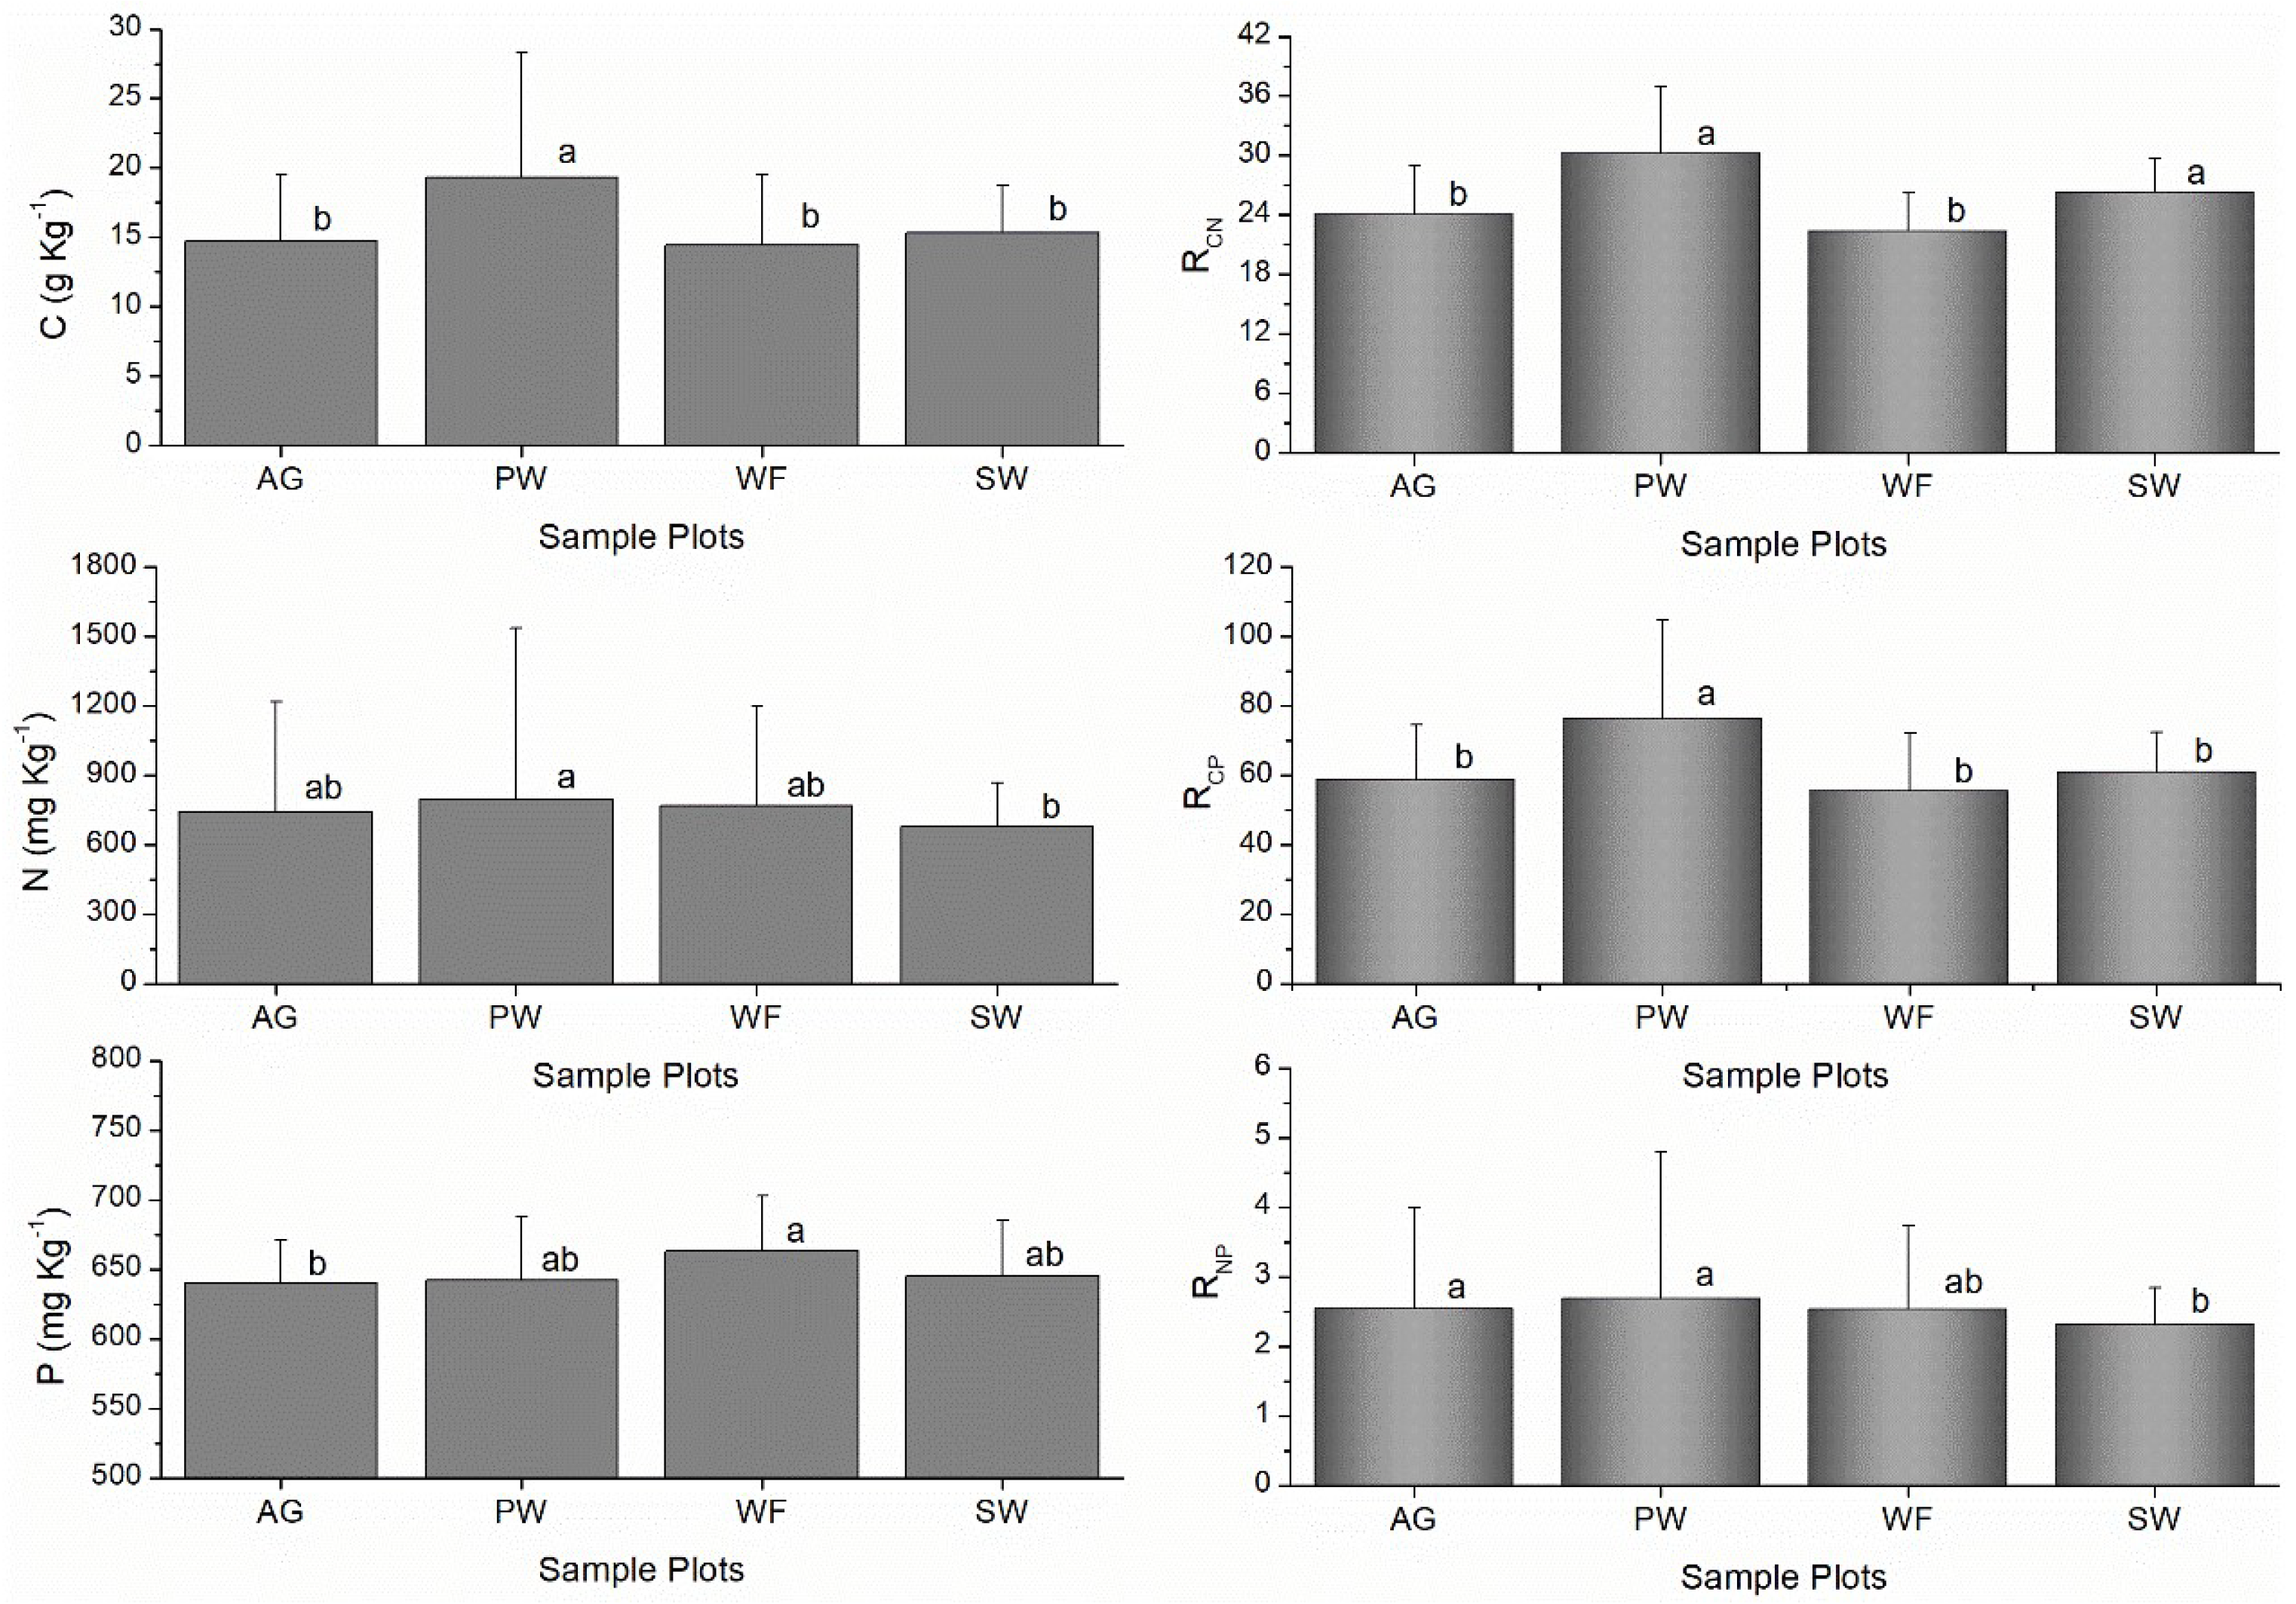
Figure 3.
Vertical distribution of soil C, N and P concentrations under different wetland use types.
Figure 3.
Vertical distribution of soil C, N and P concentrations under different wetland use types.
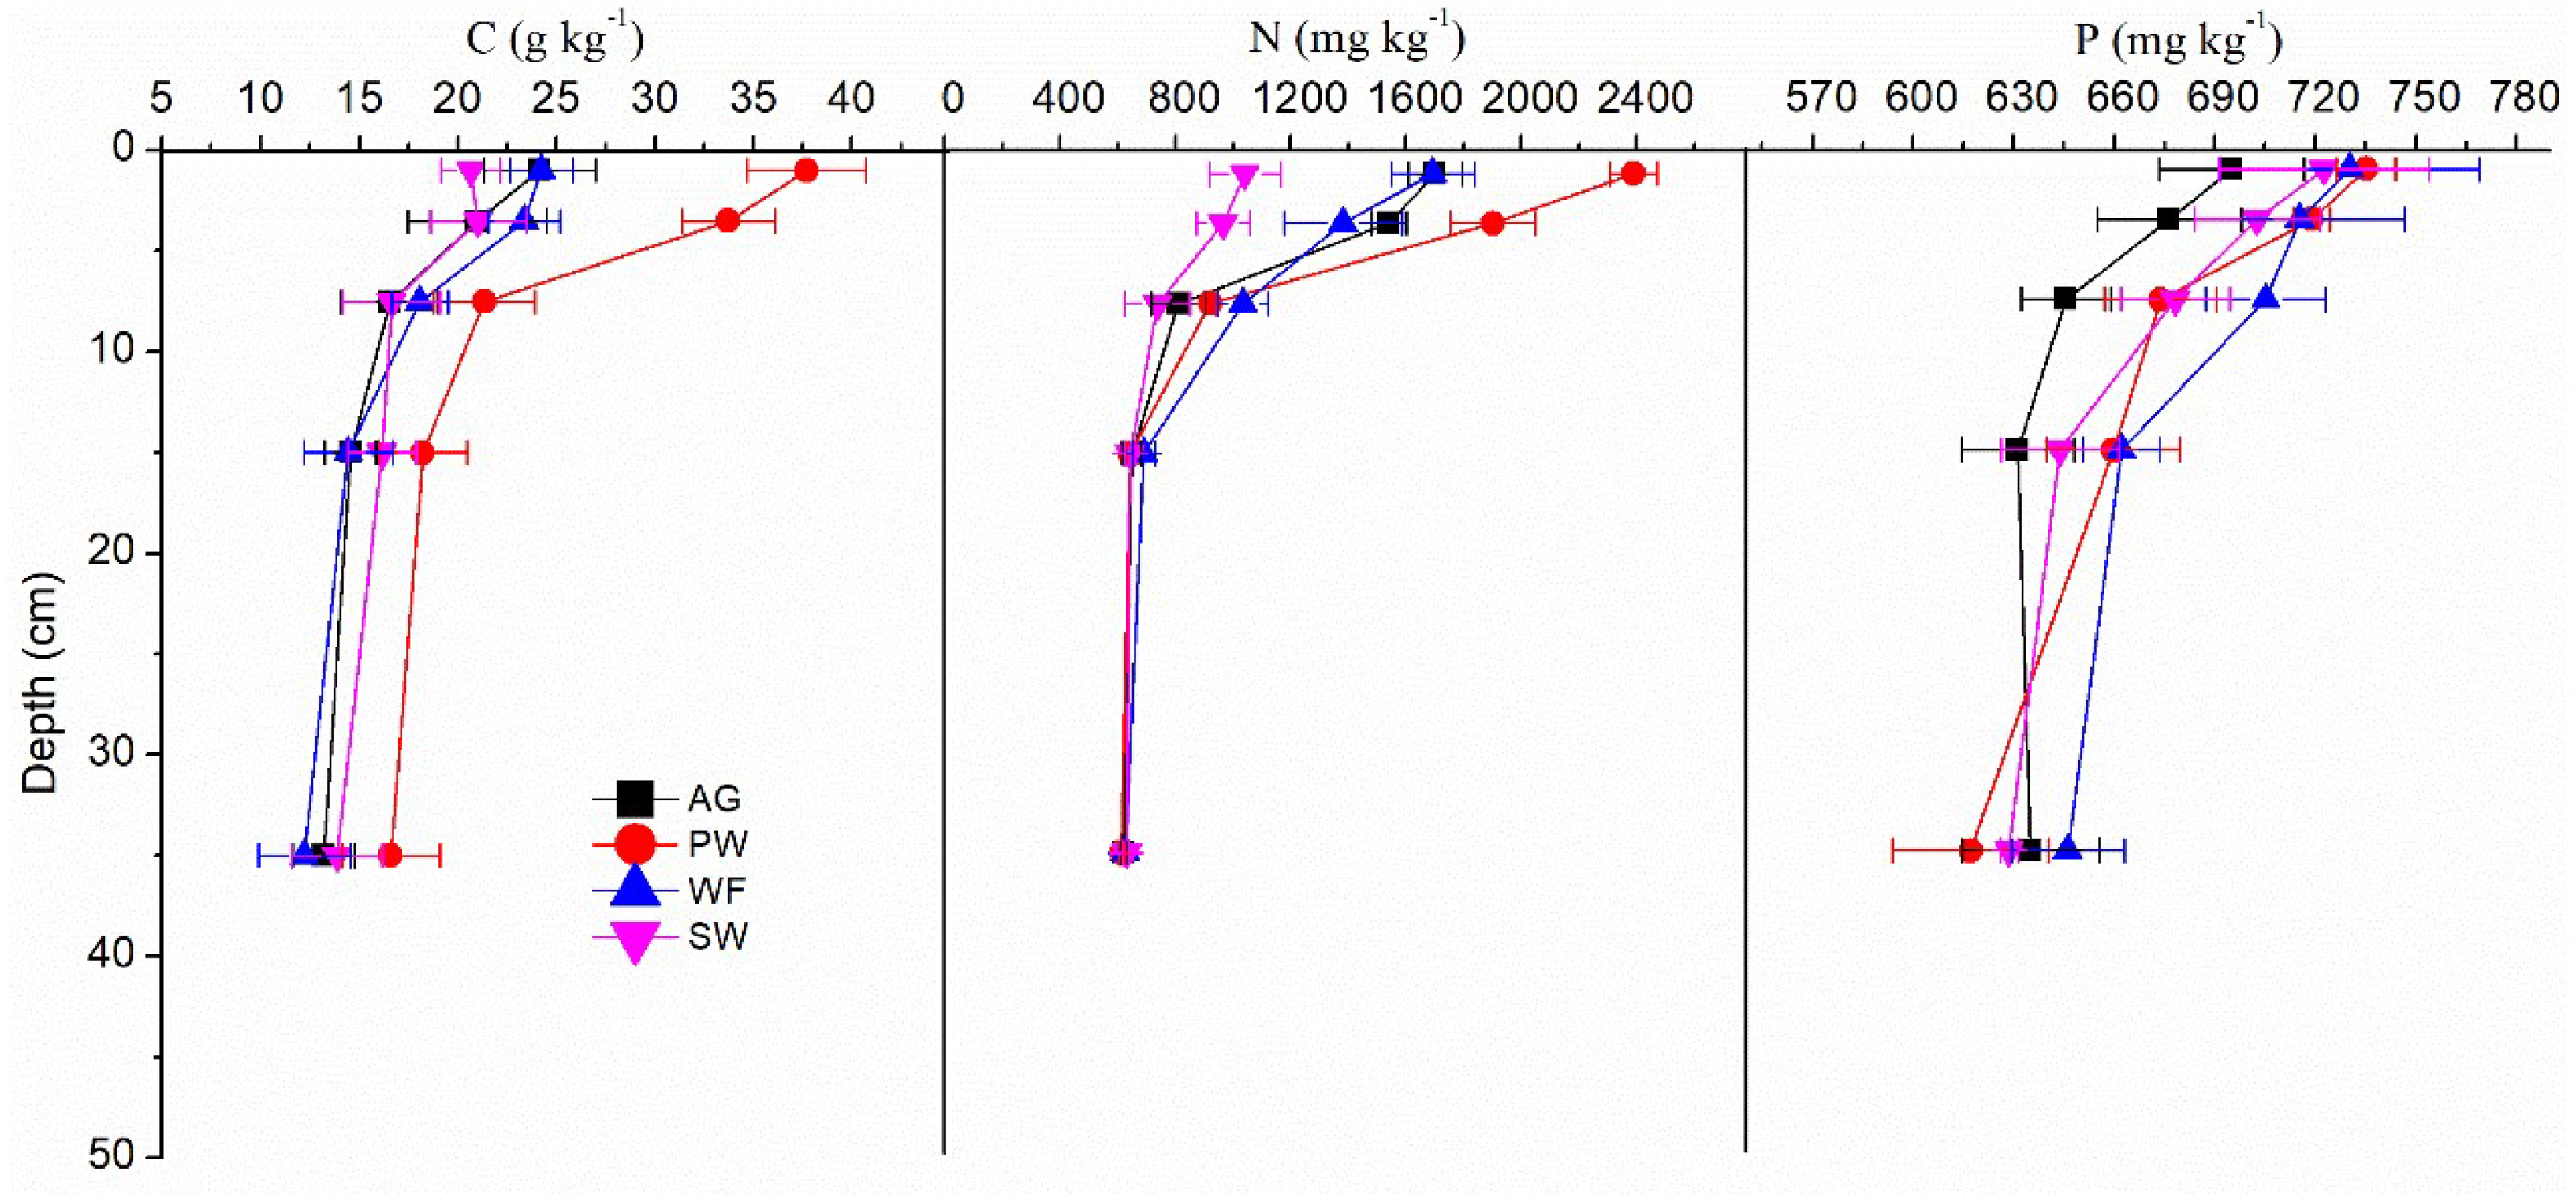
Figure 4.
Vertical distribution of stoichiometry ratios of soil C, N and P under different wetland use types.
Figure 4.
Vertical distribution of stoichiometry ratios of soil C, N and P under different wetland use types.

Table 1.
Summary of soil C, N and P concentrations and ratios under different wetland use types in coastal zone in the YRD.
Table 1.
Summary of soil C, N and P concentrations and ratios under different wetland use types in coastal zone in the YRD.
| Plots | Parameters | Min | Max | Mean | Std | c.v. |
| AG (n=25) | C (g kg-1) | 11.54 | 27.87 | 14.71 b | 4.76 | 0.32 |
| N (mg kg-1) | 611.58 | 1801.36 | 743.16 ab | 475.64 | 0.64 | |
| P (mg kg-1) | 608.17 | 707.00 | 640.30 b | 30.79 | 0.05 | |
| RCN | 11.90 | 29.26 | 24.11 b | 4.80 | 0.20 | |
| RCP | 48.74 | 101.90 | 58.93 b | 15.55 | 0.26 | |
| RNP | 2.10 | 5.69 | 2.55 a | 1.45 | 0.57 | |
| PW (n=25) | C (g kg-1) | 14.67 | 42.28 | 19.28 a | 9.04 | 0.47 |
| N (mg kg-1) | 604.84 | 2481.78 | 797.62 a | 738.76 | 0.93 | |
| P (mg kg-1) | 583.00 | 746.33 | 642.16 ab | 45.70 | 0.07 | |
| RCN | 17.65 | 40.49 | 30.30 a | 6.68 | 0.22 | |
| RCP | 61.50 | 150.34 | 76.61 a | 28.22 | 0.37 | |
| RNP | 2.07 | 7.47 | 2.69 a | 2.11 | 0.78 | |
| WF (n=25) | C (g kg-1) | 10.75 | 26.62 | 14.40 b | 5.15 | 0.36 |
| N (mg kg-1) | 609.31 | 1892.44 | 768.32 ab | 429.06 | 0.56 | |
| P (mg kg-1) | 632.83 | 797.00 | 662.85 a | 40.18 | 0.06 | |
| RCN | 16.28 | 25.51 | 22.41 b | 3.75 | 0.17 | |
| RCP | 43.78 | 94.02 | 55.58 b | 16.62 | 0.30 | |
| RNP | 2.05 | 5.44 | 2.53 ab | 1.21 | 0.48 | |
| SW (n=25) | C (g kg-1) | 12.69 | 25.31 | 15.30 b | 3.42 | 0.22 |
| N (mg kg-1) | 578.57 | 1208.27 | 679.69 b | 189.88 | 0.28 | |
| P (mg kg-1) | 616.17 | 768.65 | 644.86 ab | 39.99 | 0.06 | |
| RCN | 21.33 | 32.99 | 26.35 a | 3.37 | 0.13 | |
| RCP | 51.64 | 96.68 | 61.05 b | 11.44 | 0.19 | |
| RNP | 1.87 | 3.89 | 2.32 b | 0.52 | 0.22 |
The single superscript letters a and b represent differential classification in the four groups according to wetland use types, and the superscript letter symbol ab is used to mark group in homogeneous subsets. The value of different groups is in an order of a > ab > b (p = 0.01, n=4).
Table 2.
Profile distribution of soil C, N and P concentrations and ratios under different wetland use types in the YRD. (p = 0.05, n =25).
Table 2.
Profile distribution of soil C, N and P concentrations and ratios under different wetland use types in the YRD. (p = 0.05, n =25).
| Plots | Parameters | 0-2 cm | 0-5 cm | 5-10 cm | 10-20 cm | 20-50 cm |
| AG | C | 24.16 a | 20.98 a | 16.54 b | 14.54 b | 13.19 b |
| N | 1701.74 a | 1540.48 b | 809.84 c | 648.35 d | 620.00 d | |
| P | 695.19 a | 676.51 a | 645.75 b | 631.31 b | 635.11 b | |
| RCN | 16.55 b | 15.86 b | 23.77 a | 26.13 a | 24.82 a | |
| RCP | 89.56 a | 79.70 a | 66.03 b | 59.35 bc | 53.49 c | |
| RNP | 5.42 a | 5.04 b | 2.77 c | 2.27 d | 2.16 d | |
| PW | C | 37.71 a | 33.72 b | 21.35 c | 18.23 cd | 16.61 d |
| N | 2388.48 a | 1901.64 b | 920.26 c | 641.83 d | 612.66 d | |
| P | 735.19 a | 719.04 a | 673.91 b | 659.745 b | 617.12 c | |
| RCN | 18.40 c | 20.71 c | 27.02 b | 33.16 a | 31.65 a | |
| RCP | 132.29 a | 120.93 a | 81.57 b | 71.34 b | 69.39 b | |
| RNP | 7.18 a | 5.85 b | 3.02 c | 2.15 d | 2.20 d | |
| WF | C | 24.24 a | 23.37 a | 18.07 b | 14.44 c | 12.22 c |
| N | 1693.51 a | 1381.25 b | 1034.29 c | 690.64 d | 626.91 d | |
| P | 730.33 a | 715.31 a | 705.31 a | 662.31 b | 646.21 b | |
| RCN | 16.71 c | 20.01 bc | 20.49 abc | 24.41 a | 22.68 ab | |
| RCP | 85.74 a | 84.31 a | 66.16 b | 56.18 bc | 48.74 c | |
| RNP | 5.13 a | 4.26 b | 3.24 c | 2.31 d | 2.14 d | |
| SW | C | 20.65 a | 21.03 a | 16.65 b | 16.15 b | 13.87 b |
| N | 1041.29 a | 965.75 a | 738.34 b | 642.42 b | 629.64 b | |
| P | 722.53 a | 702.59 ab | 678.26 b | 643.82 c | 628.68 c | |
| RCN | 23.30 b | 25.43 ab | 26.52 ab | 29.28 a | 25.64 ab | |
| RCP | 73.84 ab | 77.37 a | 63.40 bc | 64.82 abc | 56.91 c | |
| RNP | 3.19 a | 3.04 a | 2.41 b | 2.21 b | 2.22 b |
* The superscripts (a, b, c and d) represent differential classification in the five groups on the basis of soil layer depth, and the superscript symbol consisting of 2 or more letters combines (ab, bc, cd and abc) are used to mark groups in homogeneous subsets. The value of different groups is in an order of a > ab > abc > b > bc > c > cd > d (p = 0.05, n=25).
Disclaimer/Publisher’s Note: The statements, opinions and data contained in all publications are solely those of the individual author(s) and contributor(s) and not of MDPI and/or the editor(s). MDPI and/or the editor(s) disclaim responsibility for any injury to people or property resulting from any ideas, methods, instructions or products referred to in the content. |
© 2025 by the authors. Licensee MDPI, Basel, Switzerland. This article is an open access article distributed under the terms and conditions of the Creative Commons Attribution (CC BY) license (http://creativecommons.org/licenses/by/4.0/).
Copyright: This open access article is published under a Creative Commons CC BY 4.0 license, which permit the free download, distribution, and reuse, provided that the author and preprint are cited in any reuse.


