
Submitted:
11 April 2023
Posted:
12 April 2023
You are already at the latest version
Abstract
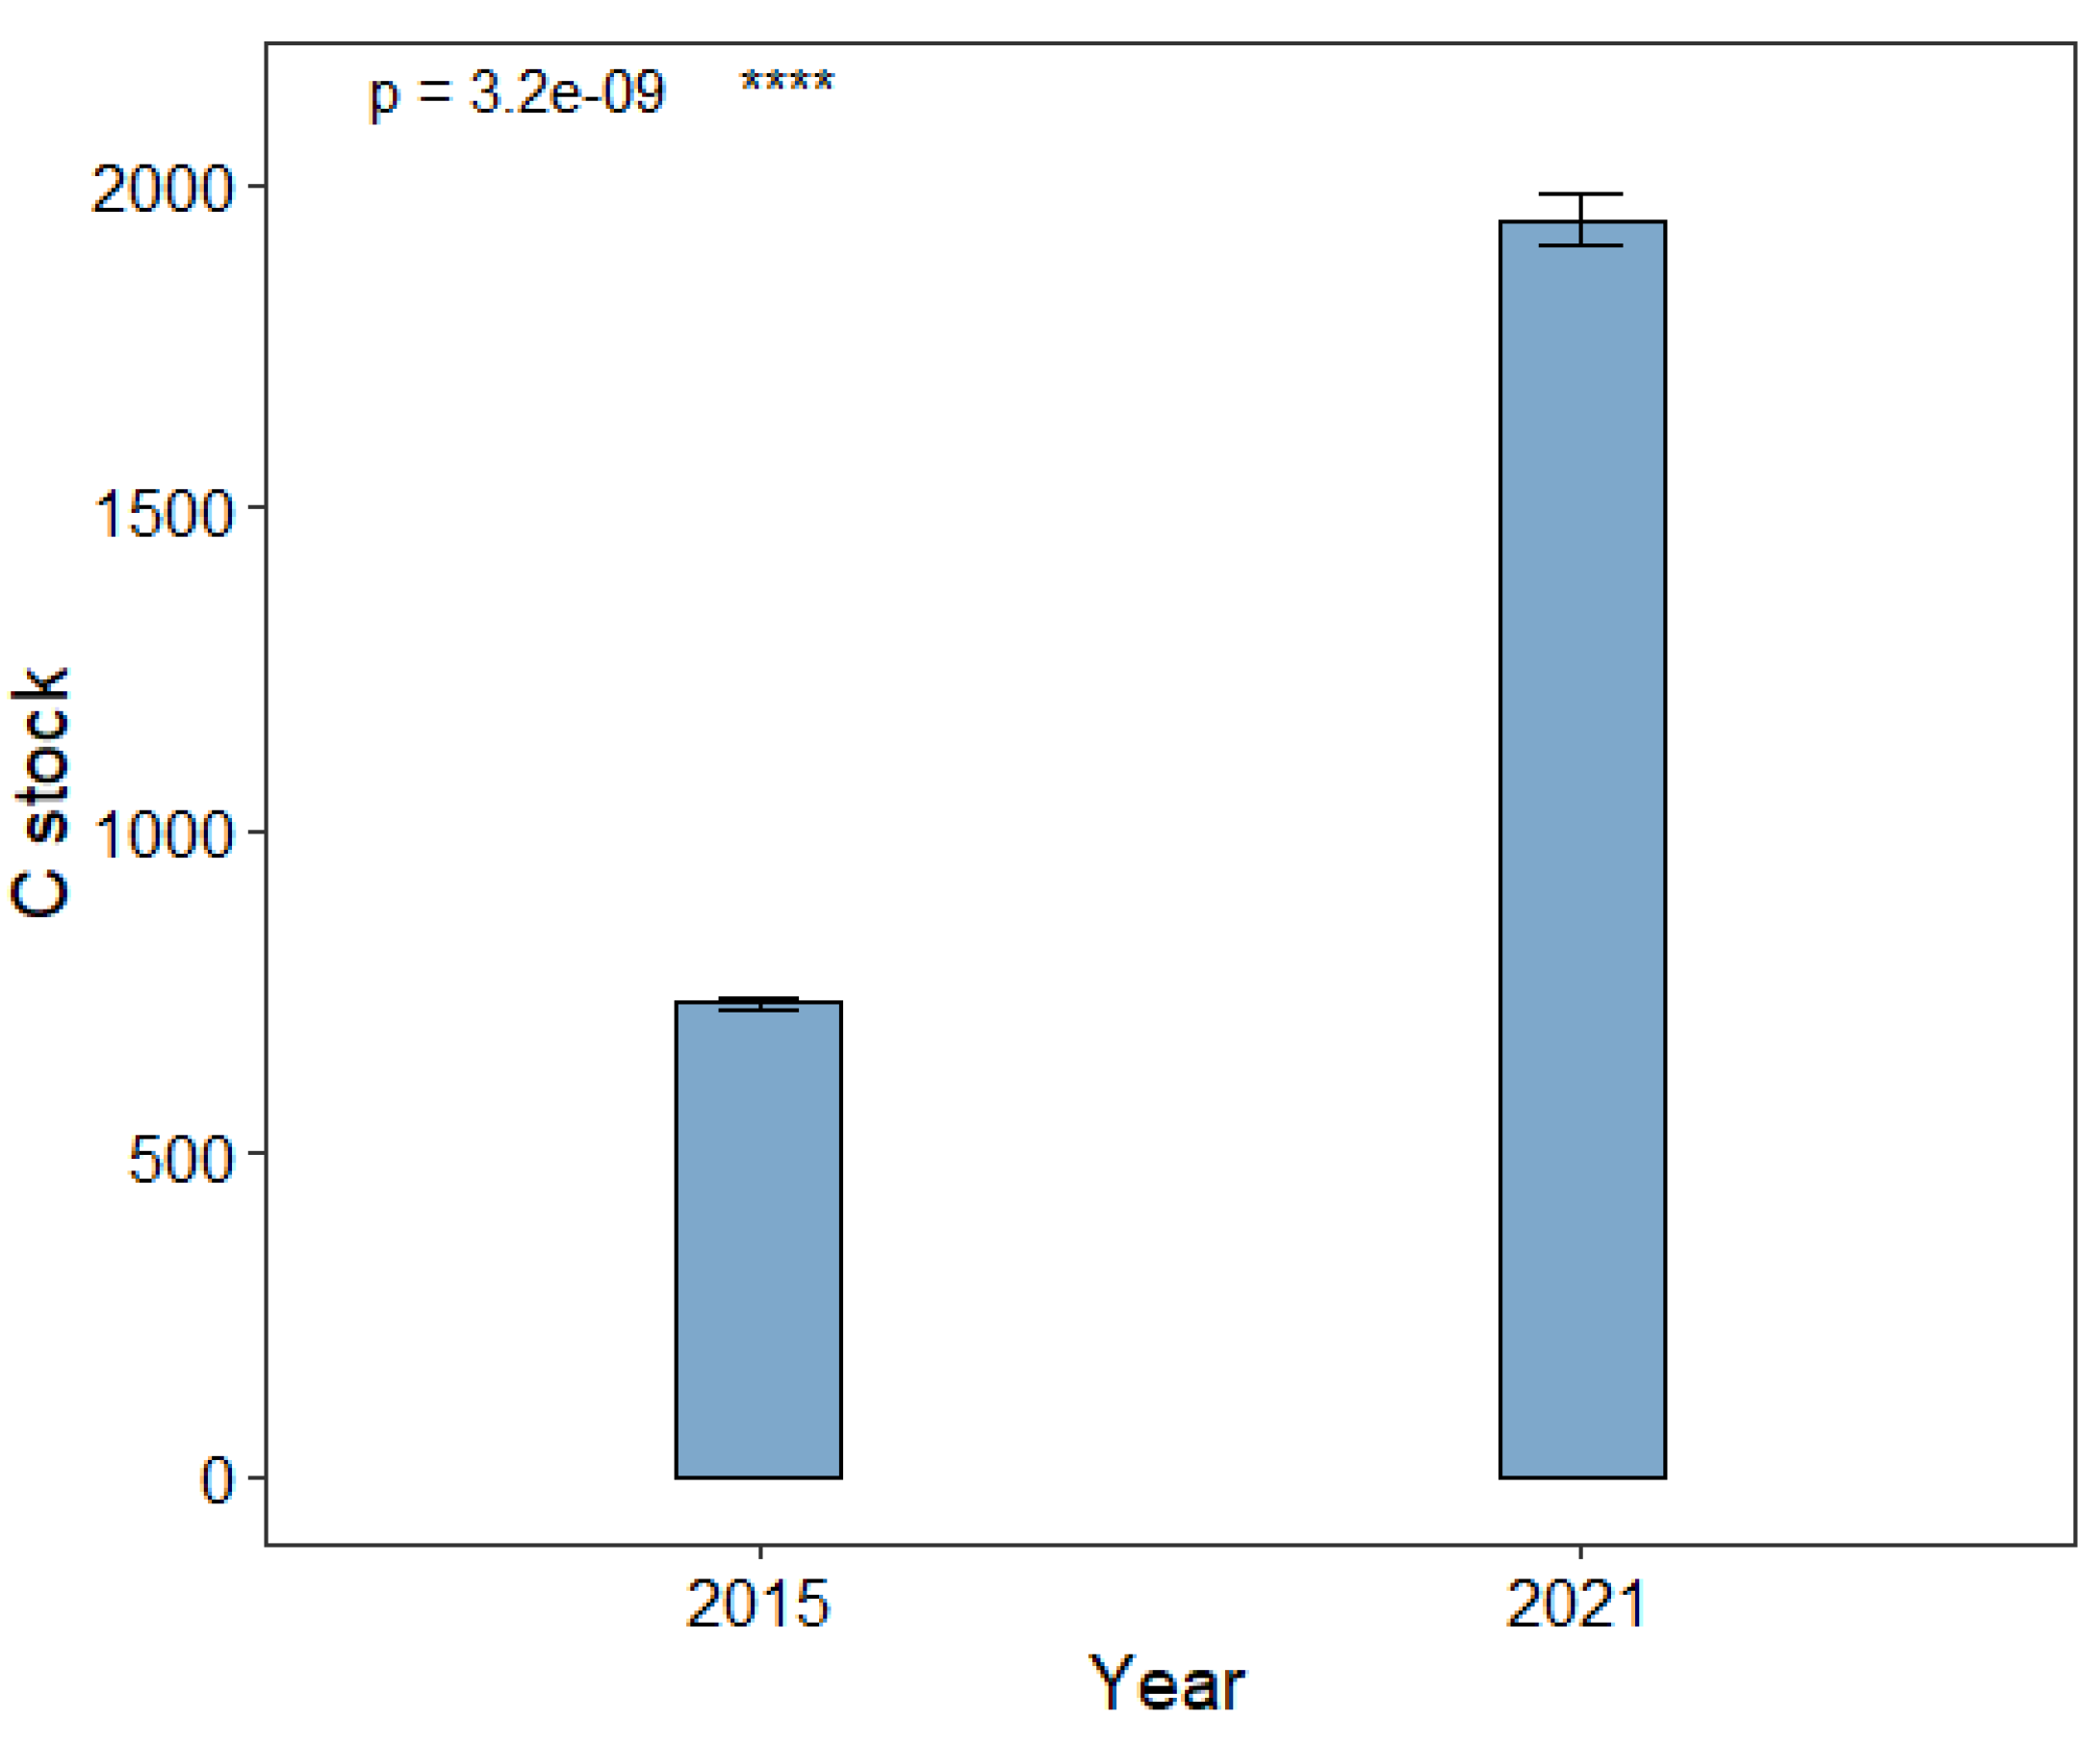
We investigated and quantified soil organic carbon (SOC) stock at the mangrove forest (Magyi, That Bot Khan and Wette) of Shwe Thaung Yan coastal region in Myanmar and estimated the SOC stock changes in Magyi mangrove forest over six years using repeated field measurements. The study sites were characterized by different mangrove vegetation, soil types, and sediment deposition from different water sources. Results showed that the mangrove preservation and restoration efforts had a significant effect on soil C storage, with soil carbon stocks in 2021 (1954.43 ± 33.24 ton/ha) being 2.7 times higher than the estimated carbon stock in 2015 (732.26 ± 6.99 ton/ha). The results also revealed slight differences in SOC between Magyi and the Tha-Bot-Khan and Wette areas, as the mangrove plants in the latter areas have an additional source of nutrients from Pho-Thoung-Gyi, a deep-sea bay near the forest. Our research findings are beneficial in understanding the role of Myanmar’s mangrove ecosystems in carbon sequestration and climate change mitigation efforts.
Keywords:
Soil Organic Carbon (SOC)
; Mangrove
; Myanmar
; Blue carbon
; coastal ecosystem
; Soil organic carbon stock
1. Introduction
Mangroves are highly productive ecosystems having substantial ecological, social and economic significance [1]. They are distributed in tropical and subtropical locations, primarily at the inter-tidal region between the sea and land [2]. Despite its significance that provide critical economic and ecological services for humans [3], global mangrove cover declined at an alarming rates during the twentieth century [4,5]. Due to increased global awareness, conservation policies and invaluable efforts to preserve and regenerate, the rate of mangrove loss, has slowly decreased in past two decades [4]. However, rapid coastal population growth, aspiration for infrastructural development and economic and political emphasis on large scale conversion of mangrove forest into commercial use still poses critical threat to mangrove forest ecosystems.
Globally, mangrove forest area is estimated at 14.8 million ha [6], more than a third of which is found in South-East Asia [3]. Myanmar, heavily forested South-East Asian country with forest cover density over 44%, accounts for 3.6% of global mangroves [2]. Myanmar's coastline is 2832 kilometers long and is separated into three coastal zones; the Rakhine Coastal Region, the Ayeyarwady Delta and the Gulf of Mottama Coastal Region, and the Taninthayi Coastal Region, stretching along the Bay of Bengal and Andaman Sea [7]. Following Malaysia, Bangladesh, and Papua New Guinea, Myanmar has the fourth largest mangrove area in Southeast Asia. The Ayeyarwady Delta has the most mangroves (46%), followed by Taninthayi (37%) and Rakhine (17%) [7].
Mangrove forests in Myanmar play an important role in the coastal ecosystems and livelihoods of people living in those regions. These forests are effective in protecting coastlines from erosion, providing food and habitat for aquatic species, and sequestering soil organic carbon. Recent research has suggested that mangrove forests in Myanmar may be particularly important for the sequestration of soil organic carbon (SOC). Mangrove forests can store large amounts of soil organic carbon in their root systems and sediments, which is important for mitigating the causes of global climate change.
Temporal and spatial distribution of SOC in mangrove ecosystems has been studied in many other countries, however, research on SOC in mangrove ecosystems in Myanmar is limited. The lack of research on SOC in mangrove ecosystems is concerning as it is a key indicator of soil health and plays an essential role in carbon cycling, nutrient retention, and water storage. As it is essential to better understand SOC in Myanmar’s mangrove ecosystems to better manage them and protect their vital services, this study aims to estimate SOC at spatial and temporal level at the selected mangrove forest (Magyi, That Bot Khan and Wette) of Shwe Thaung Yan coastal region in Myanmar. The study also aims to estimate the impact of preservation and restoration efforts on carbon stock at Magyi and Uto tidal creek between 2015-2021.
Mangrove and SOC
High carbon burial rates in mangroves creates an efficient carbon sink, storing a large amount of organic carbon in the sediments below the ground surface [8]. Ecological processes of organic carbon in mangrove ecosystems are complex, including origins of sediment organic carbon, carbon fluxes between mangroves and their adjacent systems (coastal waters and atmosphere), and cycling processes beside carbon accumulation in plants (primary production and plant respiration) [9]. Sediment organic carbon originates from suspending solids in coastal waters, mangrove plants (litter falls and underground roots) and benthic algae. Large amount of long-term material exchanges between mangroves and their adjacent system is the significant difference between mangrove forests and inland forests (including inland wetlands) [9].
Due to tidal inundation, waterlogged soils inhibit mangrove soil carbon oxidation and remineralization, reducing carbon dioxide (CO2) emissions into the atmosphere [10,11]. Saline tidal wetlands generally have low methane (CH4) emissions as sulfates from the tidal currents promote the predominance of sulfur-reducing microorganisms and the efficiency of these ecosystems in reducing greenhouse gas emissions. As a result, mangrove ecosystems have the potential to play an important role in carbon cycling and climate change mitigation due to a natural mechanism for sequestering carbon over time [11]. Despite their recognizable importance, mangrove forests are currently under threats from sea-level rise as well as land use conversion for agricultural, industrial, and urban development [11]. It is therefore important to improve our understanding of how mangrove carbon stocks naturally change over time, and the impacts of human activities on them.
There are very few published studies using repeated measures of organic carbon in mangrove forests in Myanmar. This study seeks to evaluate carbon stock change through the repeated field measures across six years in Magyi's mangroves, using a unique combination of measures taken at the study locations along Magyi and Uto tidal streams in 2015. We sought to quantify soil organic carbon stocks of mangrove forests on Magyi and Uto tidal creeks after six years, while testing the hypotheses that the mangrove soil carbon increases within six years. The outcome of this research will provide valuable information to whether mangrove restoration can promote soil organic carbon accumulation in Myanmar.
2. Materials and Methods
2.1. Study area
The Magyi and Uto tidal streams on the Shwe Thaung Yan coast of the Rakhine Coastal zone are dominated by mangrove swamps. The area has a monsoon-influenced, humid, sub-tropical climate with a mean annual temperature of 27°C. The tidal streams of Magyi and Uto are eight and eleven kilometers respectively [12]. Beginning in Rakhine Yoma, the streams split into small channels along the way before discharging into the Bay of Bengal. The tides follow a semidiurnal pattern and have two tidal cycles per month, with the spring tide and neap tide occurring alternately. Mangroves grow densely along the tidal streams and the coverage areas are around 728.74 ha. The primary species are Rhizophora apiculata, Bruguiera gymnorrhiza, Ceriops decandra and Ceriops tagal.
The mangrove ecosystem of Magyi has been significantly degraded and substantially destructed as a result of natural disturbances and anthropogenic actions such as agricultural land transformation, aquaculture ponds, salt ponds, etc [13]. Magyi mangrove ecosystem is one of the important coastal ecosystems providing ecological security of the coastal area and livelihood security to the coastal fishermen. Besides it plays an important role in carbon sequestration as large amounts of carbon is stored in the below ground biomass. The Worldview International Foundation has been working with the Department of Marine Science at the University of Pathein to protect Magyi's mangrove forests since 2014 [12]. Magyi’s mangrove forests were rapidly recovered due to plantation of mangroves in the degraded places and forest monitoring.
2.2. Field Sampling
Soil sampling was conducted in the mangrove forest alongside the tidal creeks during the neap tide period (First week of September 2021). Samples were carried out randomly from 40 stations along the two channels which is Uto and Magyi, 20 stations on each channel. And also, the soil sample was collected from 20 plots in the Tha-Bot-Khan and 15 plots in Wette channels.
At each station, three soil cores of the three different mangroves species, particularly Rhizophora sp, Bruguiera sp and Ceriops sp were collected as these are the dominant species of the forest. Under the mangrove trees, soil samples were collected from the surface layer of the soil to a depth of 1 m with the aid of soil core sampler which has a 4.5 cm diameter (mouth of the core sampler). The core was immediately sectioned into three pieces, each 33.33 cm long. The cutting soil samples were put into the container. The lid was firmly sealed not to introduce the oxygenated air to the sample. All samples were stored in a cool place and transported to the laboratory of the Marine Science Department of Pathein University.
2.3. Laboratory analysis
In the laboratory, soil samples were stored in a dark freezer at -4°C until analysis. Samples were prepared for Loss on Ignition (LOI) procedure. Each original sample was collected in 4.15 cm x 2.55 cm (Diameter x Length). Subsamples were obtained by dividing the original sample in half. Debris and large roots in the samples were removed. Wet weight of the original and subsamples were recorded. Samples were then dried in the muffle furnace at 80°C until constant mass was achieved. Dry weight of the samples at 80°C was then dried to the constant weight at 500°C. Each drying time took an hour, and this was repeated until constant weight reached, thus it is approximately eight to ten hours for 80°C and three to five hours for 500°C.
Determination of organic carbon content and total carbon stock:
The organic carbon content in the soil is computed as follow:
= - = * 100
= The total carbon stock (Ctotal) is determined as below.
= * = * thickness interval (cm)
This calculation is repeated for all sampled stations, then the average of total carbon stock was determined.
Total carbon stock (ton/ha/m) =
3. Results
3.1. Carbon stocks in 2021
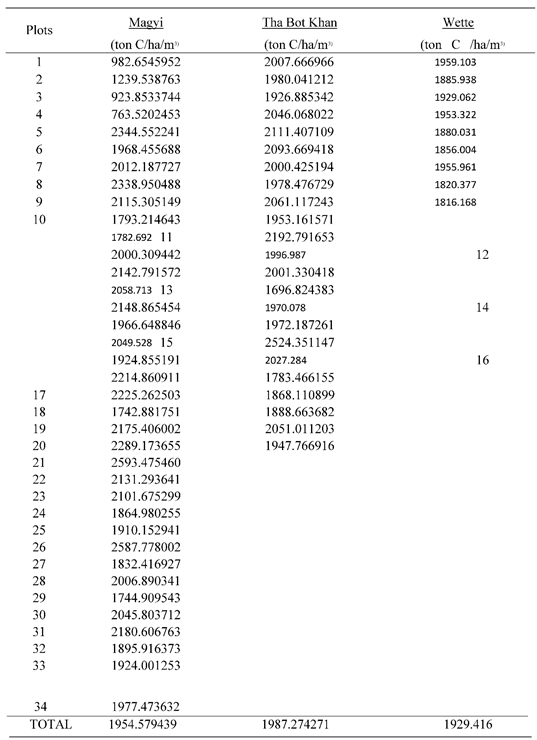
Average soil carbon (C) stock and percentage of carbon in each plot (plot 1 - 34) of the soil profile (0 – 1 m) can be found in Table 1. The highest C stock was found in plot 21 (2593.48 ± 126.39ton C/ ha), followed by plot 26 (2587.78 ± 139.76ton C/ ha) and plot 15 (2524.35 ± 113.91ton C/ ha) (Figure 1). Plots with the lowest C stock were plot 4 (763.52 ± 70.59 tonC/ ha), plot 3 (923.85 ± 90.96 tonC/ ha) and plot 1 (982.66 ± 34.17 tonC/ ha). The average carbon stock of the plots was 1954.43 ± 33.24 tonC/ ha. Carbon stocks were found to be significantly different among the plots (p < 0.05).
This is due to the reason that there were different types of soil texture within the plots. The soil of Uto creek (Plot 1 to 20) can be classified as silt, silt loam, clay, sandy clay, and sandy loam while the Magyi creek mostly has clay, sandy clay, and sandy loam texture. Plots with the soil texture of high clay proportion such as plot 21 and 26 contain the highest carbon percentage and carbon stocks. Significance of the carbon stocks and percentage of carbon (%C) difference between plots, and soil depths was assessed using one-way ANOVA. For all tests, significance was determined at P < 0.05. All results are shown with their standard error of the arithmetic mean (±SE).
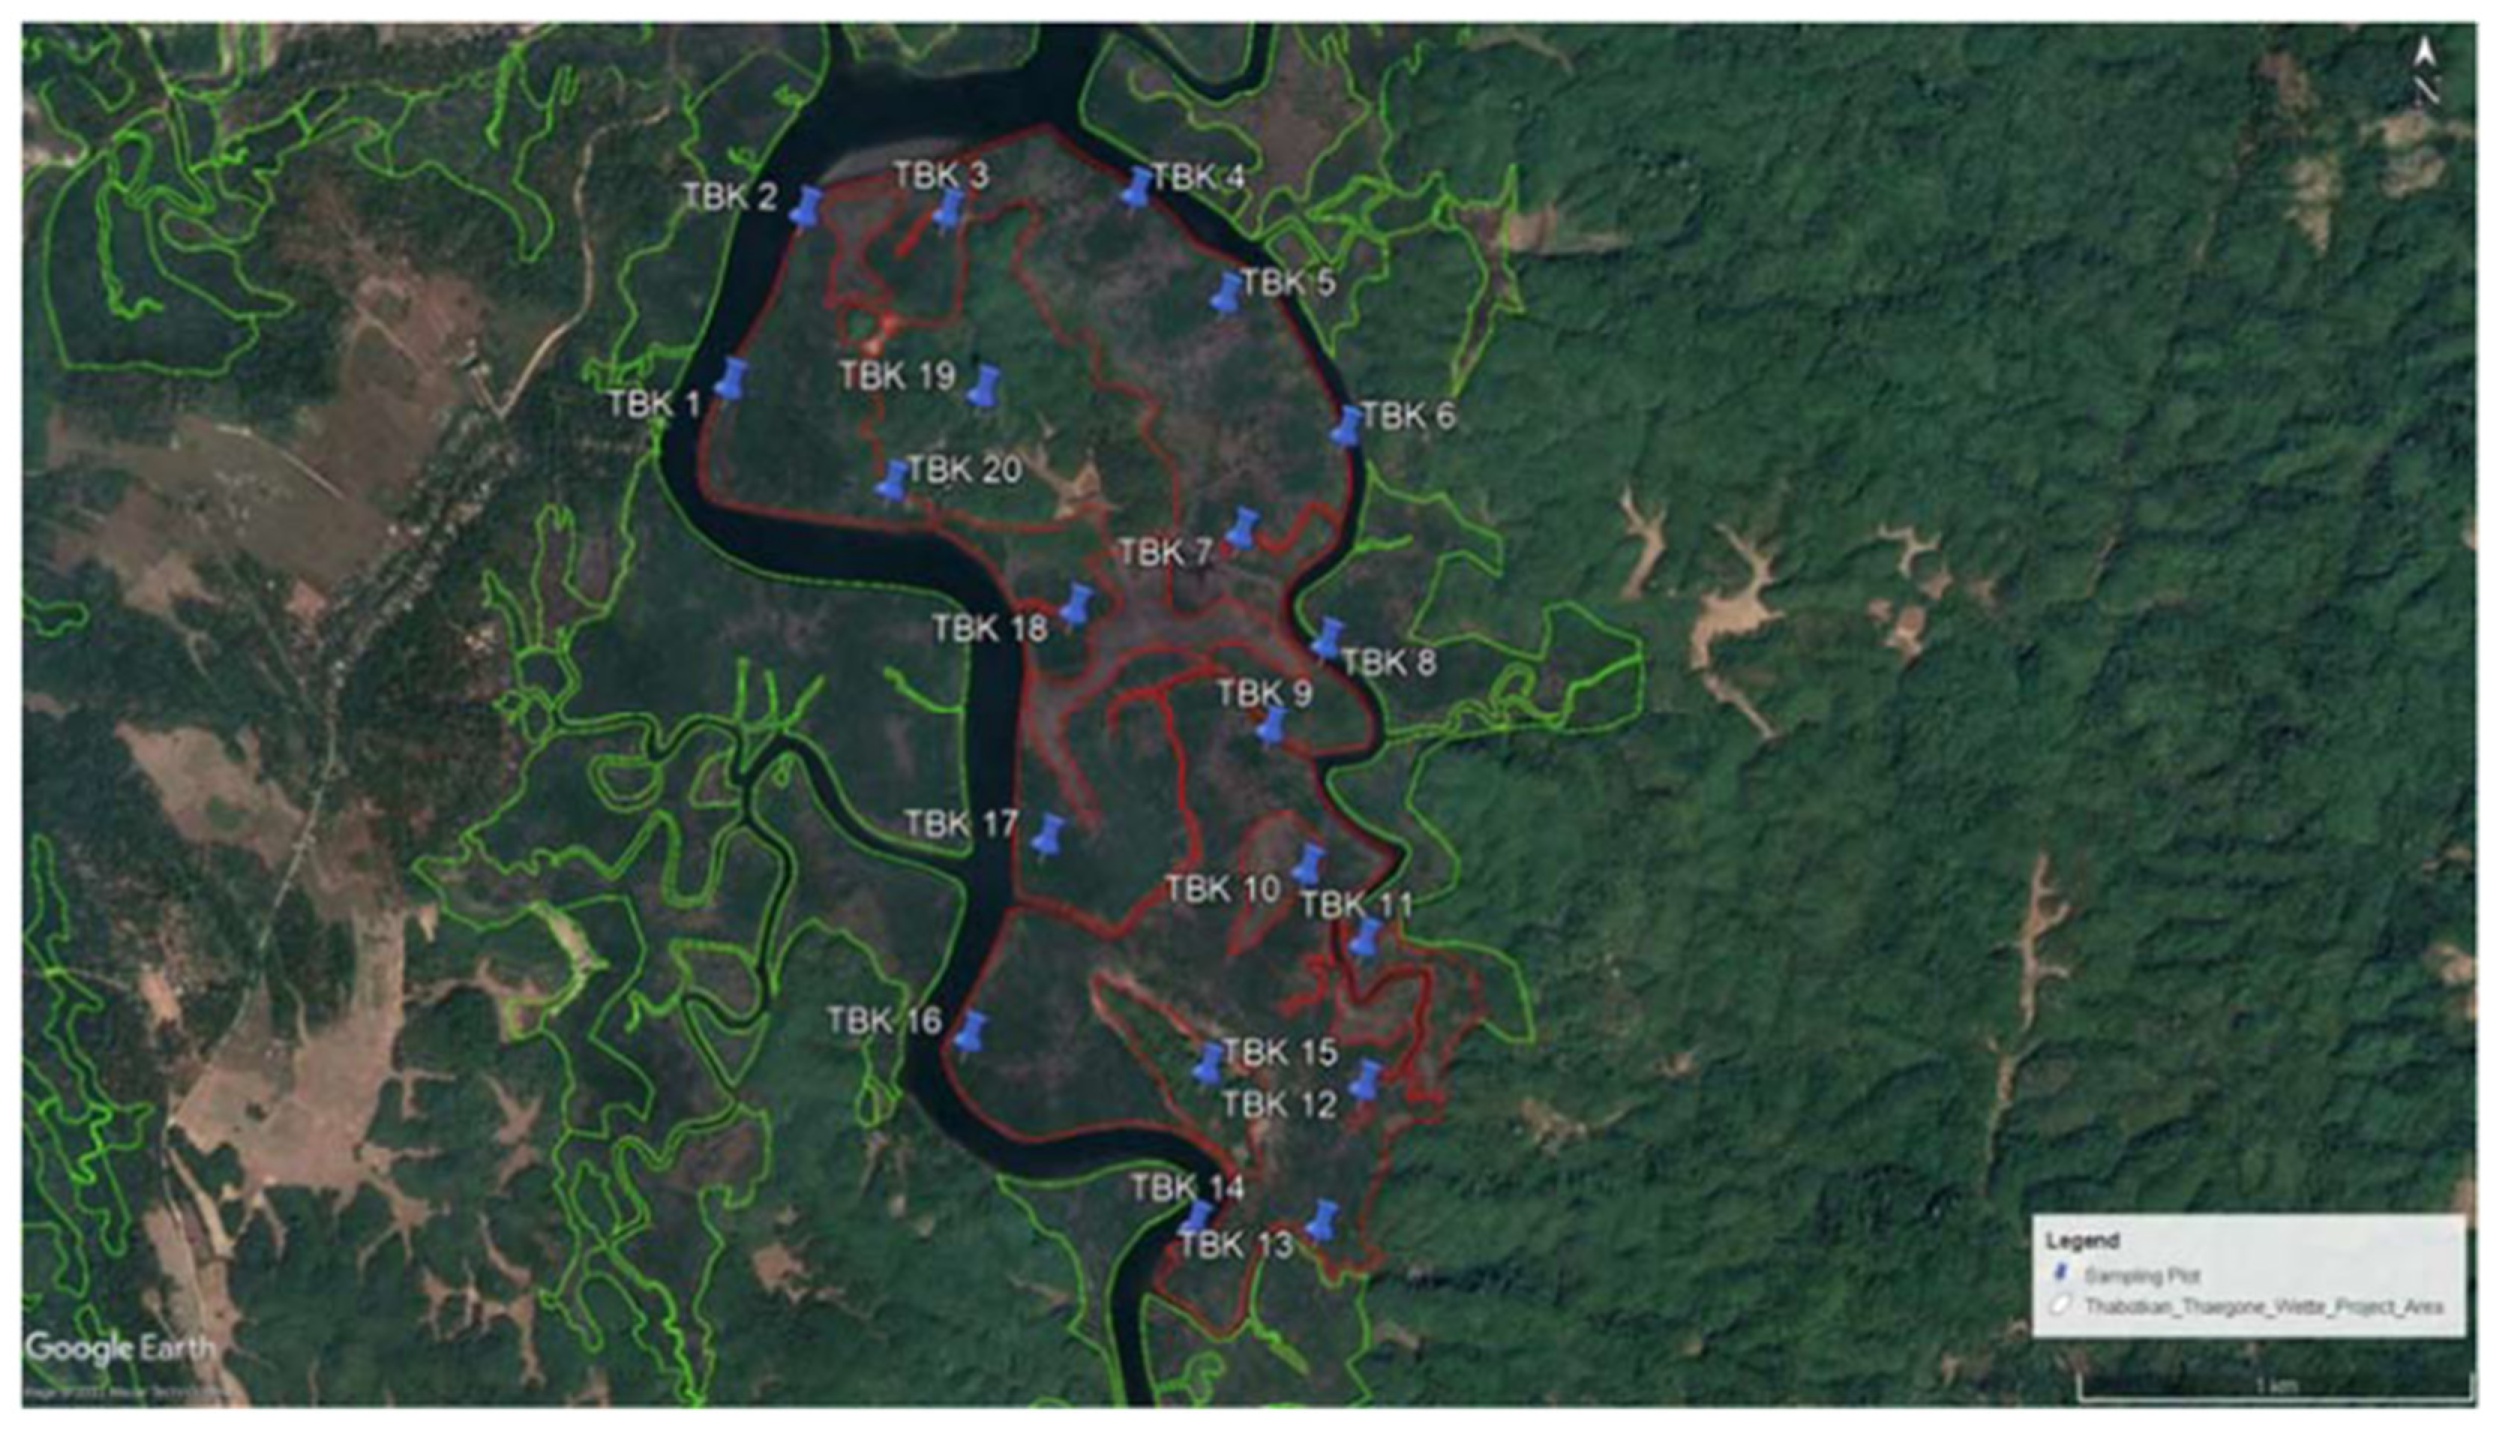
Figure 2.
Map of the sampling stations in That-Bot-Khan tidal creeks.
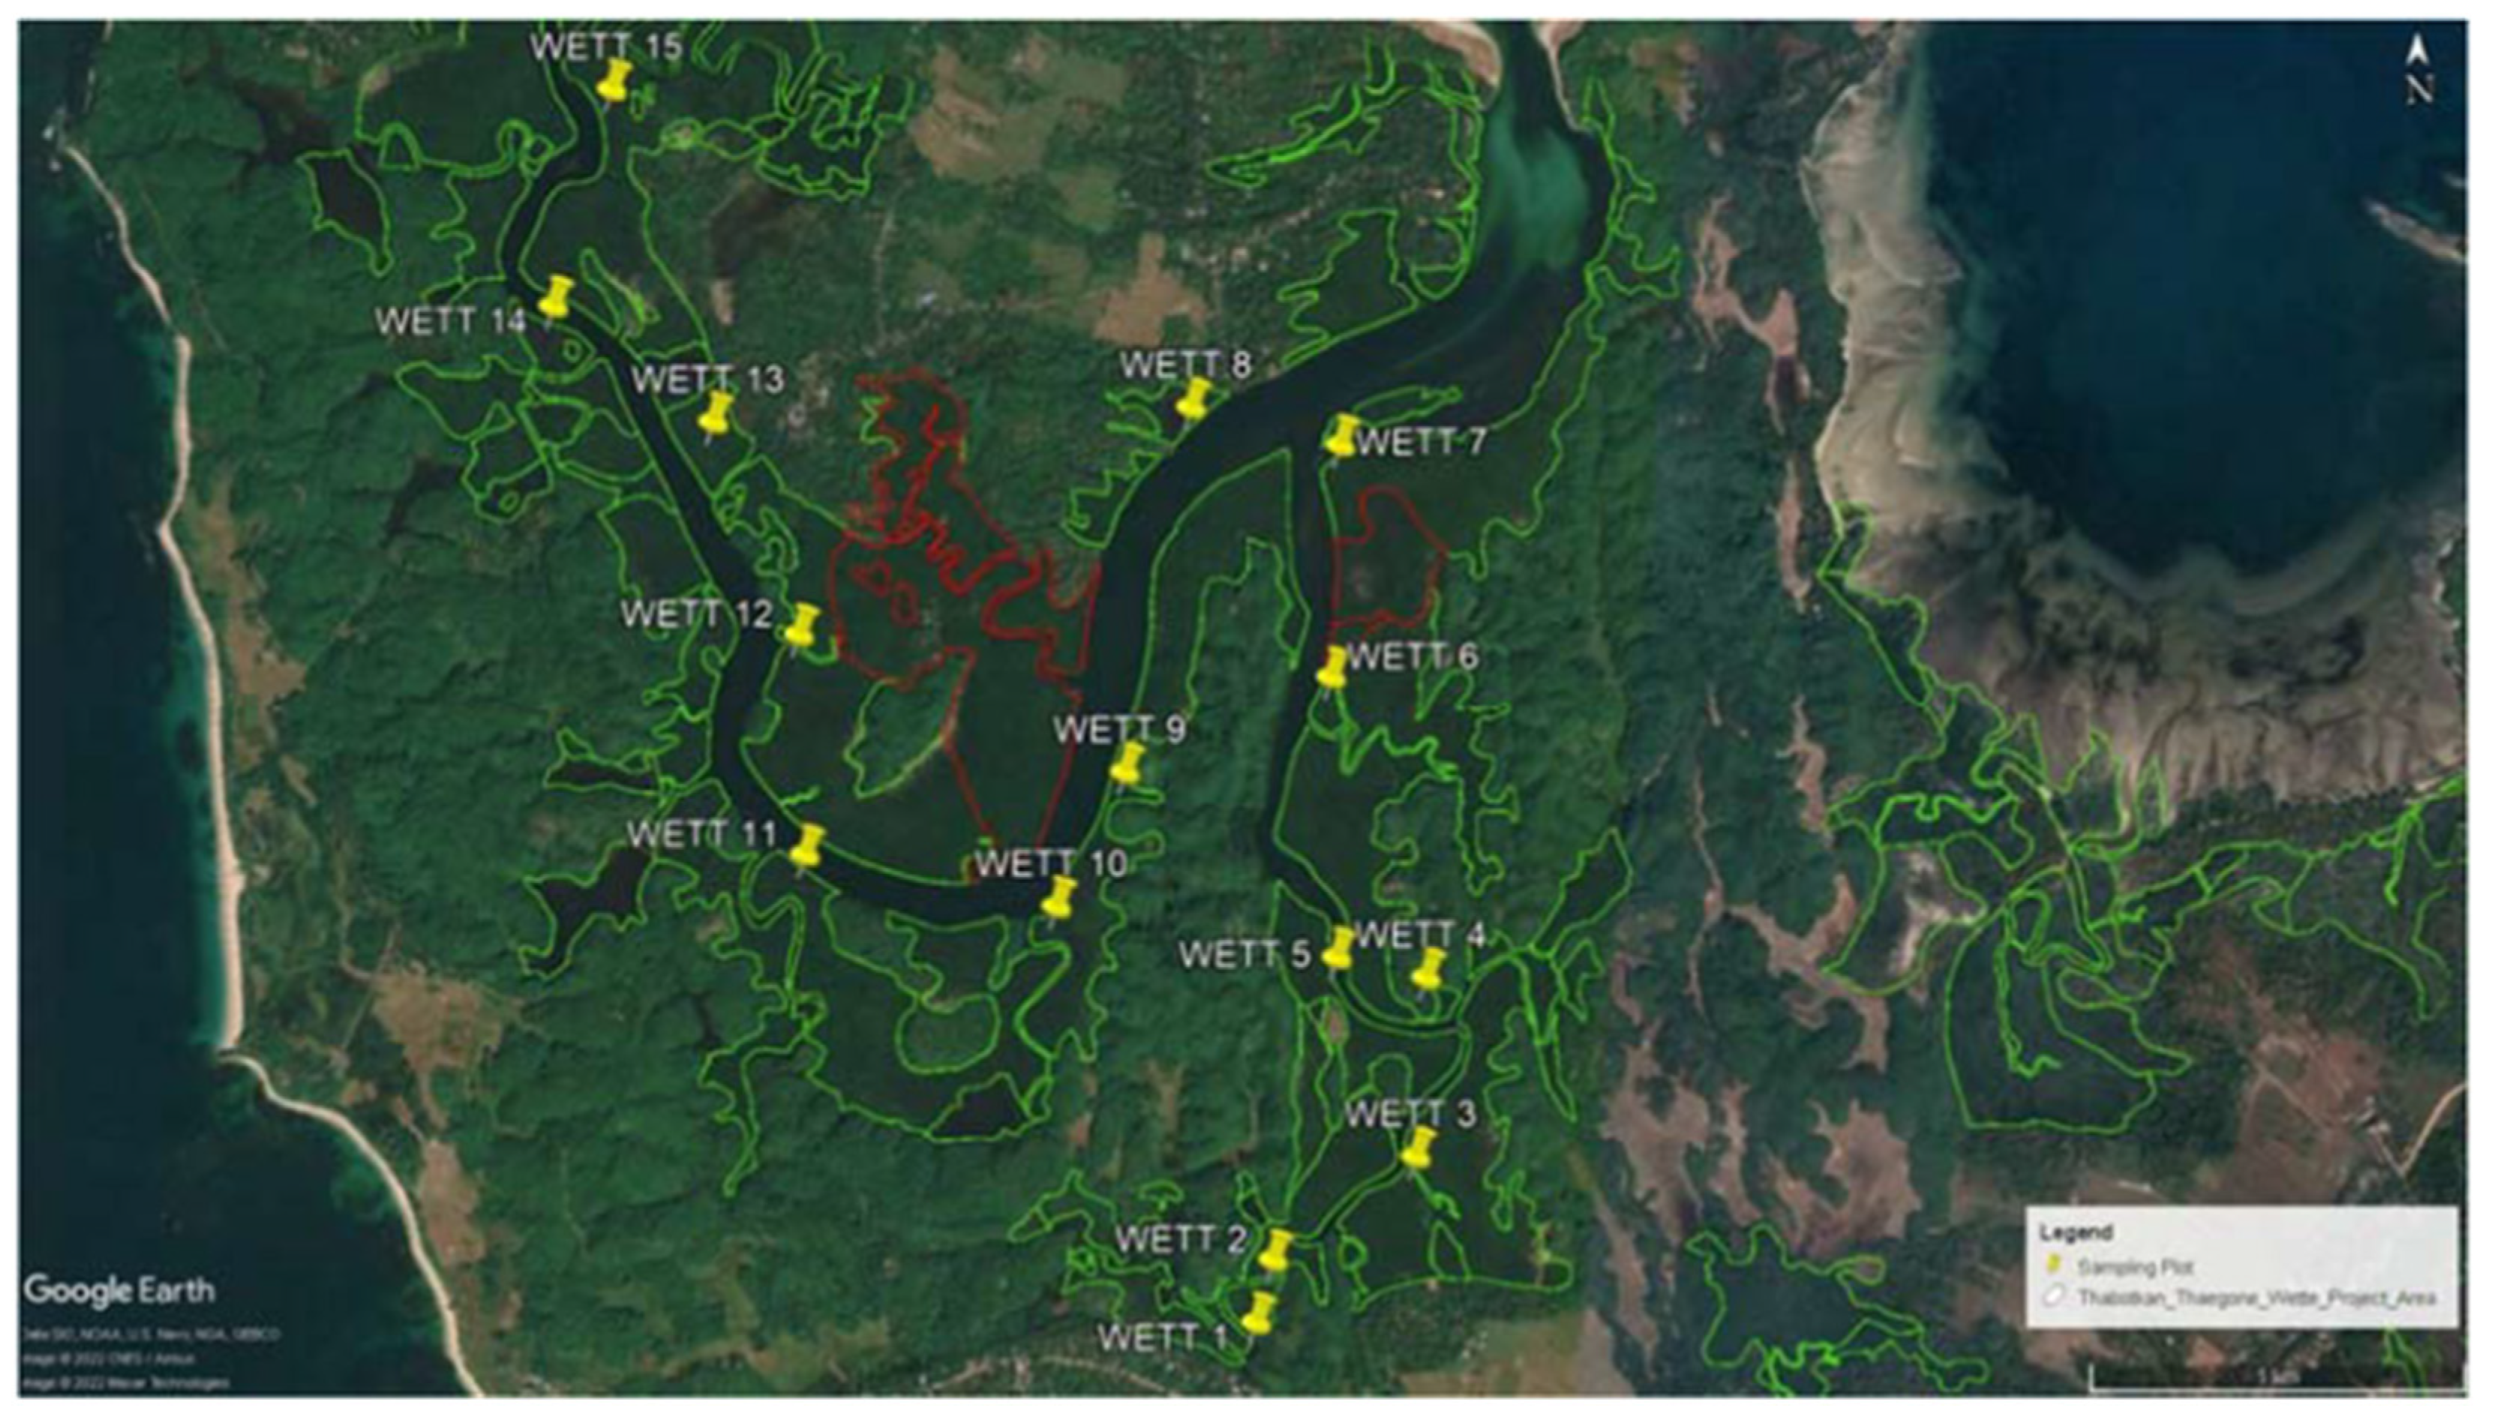
Figure 3.
Map of the sampling stations in Wette tidal creeks.
Carbon stocks were also spatially different in the forest (Figure 4, Figure 5 and Figure 6). Plots located upstream of the Uto tidal creek such as plots 1, 2, 3, and 4 have lower %C and C stock which is likely to be impacted by the low organic matter input due to the limited tidal current reach. In addition, the levels of the carbon stocks between Uto and Magyi tidal creeks were highly different. The mean C stock of the Uto channel ranges from 763.52 ton/ ha to 2524.35 tonC/ ha while the range of mean C stocks in Magyi tidal creek are 1744.91 ton/ ha – 2587.78 ton/ ha. This variation may be due to the soil types; Magyi tidal creeks contain more clay texture, and it enhances carbon content levels in the soil compared to the carbon content in Uto tidal creek.
Table 1 summarizes the average carbon stock and %C in each depth. Mean values of soil %C and C stock differed across the depth, showing that carbon accumulation generally increased with the soil depth. %C at the surface is 19.47 ± 0.54 %, 20.28 ± 0.55 % at 2 feet depth, and 22.05 ± 0.49 % at 1 meter. While average soil %C at the sub layers were higher than the surface, the increase of the %C content with the depth was not statistically significant (p = 0.156). Carbon in each depth of the soil is important for many ecosystem services. Soil C at the surface plays an important role in provisional (e.g., food, feed, etc.), regulatory (e.g., atmospheric CO2 exchange), and supporting (e.g., soil structure, nutrient retention) services. Meanwhile, subsoil C plays a more dominant role in regulatory (e.g., carbon sequestration) services, and somewhat less important in provisional and supporting services [14]
The result shown in Table 1 reveals that the soil bulk density decreased with the soil depth. The average soil bulk density of the soil surface was 1.02 ± 0.03 g/ cm3, 0.93 ± 0.02 g/ cm3 and 0.92 ± 0.02 g/ cm3 at the 2 feet layer and 3 feet layer respectively. Figure 7, Figure 8 and Figure 9 explains that the negative correlation between carbon content and bulk density (BD) is highly significant. %C varied considerably depending on the soil bulk density, showing that the lower bulk density significantly resulted in the higher %C in the soil (R2 = 0.028, p < 0.05). Soil BD could indicate the conditions of soil moisture and ventilation, which allows the buried carbon to be oxidized and lost as CO2. BD tends to decrease as %C increases [15].
3.2. SOC in That-Bot-Khan
The mean organic carbon stock of Tha Bot Khan was between 1783.466155-ton C/ha to 2111.407109 tonC/ha. However, the average organic carbon stock of mangrove soil was 1987.274271-ton C/ha (Table. 4). Maximum SOC stock was recorded in plot (5) which appeared at the middle portion of channel so, sediment distribution was of well conditions with the tidal regime and in those areas were accumulated by the allochthonous and autochthonous action. However minimum SOC stock was in plot (13) at the inner part of the forest (Figure 10 and Figure 11). Analysis by ANOVA tests between the sampling area groups, (p > 0.562) shows that the values of the soil organic carbon are not significant to each other, and (R2=0.8679) which is related as negative correlation between bulk density and %C as Magyi’s mangrove forest (Figure 12) because most of the mangrove soil were composed with clay loam (Appendix Table A4).
3.3. SOC in Wette
The Wette area is very close to the deep zone (Figure 2) and composed of many tributaries through dense mangrove forest. The soil organic carbon content was alike as other two channels as Magyi and Tha-Bot-Khan. The soil organic carbon stock lies within 1782.691879-2058.71288 tonC/ha, the maximum about 2058.71288 was found in plot (12) and minimum value of soil organic carbon recorded in plot (10) (Figure 13 and Figure 14). By the statistical analysis, the result shown that (p> 0.326) values mean in all the sampling areas are not significant and (R2= 0-969) mean, which had strongly negative impacts within soil bulk density and %C content (Figure 15). The study results showed that all the soil structure appeared as silt-clay loam, but some areas were found little lower in the SOC values. The negative correlation between the bulk density and %C were seen as other two type channel.
In accordance with the statistical analysis among the three groups of Magyi, Tha Bot Khn and Wette areas showed that there was slight change in the values of the soil organic carbon within the groups (p> 0.811). The study results revealed that the soil carbon content of Tha-Bot Khan areas was more than other two areas (Appendix Table A6) (Figure 16).
3.4. Comparison of carbon stock in 2015 and 2021
The results show that mean C stock of the Magyi mangrove forest soils substantially increased over six years (p < 0.05) between 2015-2021. The Mean C stock of the forest increased by 2.7 times; from 732.26 ton/ ha to 1954.43 ton/ ha during the period (Figure 17). This indicates that most of the C inputs from Magyi mangroves as well as from the adjacent waters have been deposited in the soil. In mangrove forests, leaves, litter, roots, and organic matter from adjacent waters such as tidal and riverine water are deposited over years and allow carbon to be accumulated at the deep soil horizons. This mechanism has significantly increased carbon content in Magyi’s mangrove forest.
Significance of the carbon stocks difference between years (repeated measures) was assessed using t-test. Significance was determined at P < 0.05. All the results are shown along with their standard error of the arithmetic mean (±SE).
Figure 18.
Mean C stock in 2015 and 2021. Error bars represent 1 standard error.
4. Discussion
Mangroves are increasingly recognized as an important contributor to climate change mitigation, given the significantly high carbon burial rates [16]. Our findings from repeated soil carbon measurements demonstrate the importance of the soil C reservoir following mangrove reforestation and draw attention to its value for C emissions mitigation. Average C stock of the Magyi mangrove forest in 2021 is 2.7 times higher than that in 2015. Our estimate of the mangrove soil carbon in 2021 is 1954.43 ± 33.24 ton/ ha. According to the former studies, mangrove carbon stocks in the Indo Pacific Region were 1023 ton/ ha [17], 853-1385 ton/ ha in Micronesia, 479-1068 ton/ ha in Palau [18], and 900–3400 Mg C/ ha in Baja California [19]. The results prove that carbon sequestration capacity of Magyi mangrove forest is comparable to that of other mangroves in the world.
Average carbon stocks of the deep soil horizons (at 1 m depth) were relatively higher than those found in other layers over six years. This is due to the quality of the organic carbon in the soil; surface layer having more active or labile organic carbon and subsoil having more passive organic carbon which is more chemically stable [20]. Organic carbon in deep soils is dominated by ancient slow-cycling carbon and remains stable due to lack of fresh carbon supply, an essential source of energy for soil microbes, influenced by anaerobic microbe which strongly reduces the decomposition at depth [21]. The topsoil is of great importance for provisional services since it provides habitat, food, nutrients, and raw materials [22]. Subsoils contain significant fraction of soil carbon but have a greater role in carbon sequestration which falls under regulating ecosystem services [23].
Our findings suggest that soil C accumulation in mangrove ecosystem is affected by several factors, notably climate, soil texture, land-use prior to afforestation, forest age, mix-forest type, density of forest, species composition, tidal range, tidal regime, tide inundation and sediment distribution relative with autochthonous and allochthonous. Soil organic matter (SOM) dynamic is at broad range by the effect of biotic and abiotic factors that are directly from plant material or have been chemically transformed by the soil biotic and abiotic factors [24].
The age of C in SOM tends to increase with soil depth [25] . This is because microbial SOM processing is often more abundant at shallow soil depths, whereas stabilization of SOM onto the mineral surfaces becomes more dominant in the deeper soil (> 30 cm) [26]. Our study also shows that % C and SOC stock increase relative with the depth.
Mangroves have been seen to actively increase the clay content of soil, which is associated with the higher C accumulation [27]. C contents in Magyi mangrove soil are dependent to the soil texture because at the stations with higher clay percentage higher C stocks were found. Comparing two tidal creeks of the forest, mangrove soil in Magyi tidal creek contains higher C stocks (with a range of 1744.91 ton/ ha – 2587.78 ton/ ha) than those in Uto creek (from 763.52 ton/ ha to 2524.35 ton/ ha) due to its higher composition of clay soil texture. Most of the inner parts of the region of That-Bot-Khan and Wette appeared as clay loam by the effects of slow current which increased more sedimentation at the inner part of the region especially found in plots 5, 6 of That-Bot-Kham and plot 12, 14 of Wette areas.
The negative correlation between carbon content and soil bulk density in this study further proved that soil bulk density could affect soil porosity, soil permeability, ventilation, and soil structure and that further affects carbon accumulation.
Mix-species and richness of above-ground biomass may also be having an influence on the increase of Magyi soil carbon stock during six-year reforestation. Lang’at, et al. [28] found that forests with mixed species developed denser root networks below-ground at faster rates compared to homogenous forests, and within 3 to 4 years, below-ground biomass had exceeded above-ground biomass. The restoration program included 3 different species: Rhizophora sp, Bruguiera sp and Ceriops sp and supported C accumulation. While preparing the subsample for analysis, we removed large roots; however, fine roots were difficult to remove since they were binding with the fine clay soil. In addition, no attempt was made to distinguish life from dead roots. Dead roots are an important carbon source to soil C pool since they are stored in the deep soil layer for years.
Rhizosphere, a thin area of soil surrounding roots receiving carbon (C) exudation from plants, represents a site of intense competition for available C and nutrient between surface-reactive particles and soil microorganisms [29]. This competition can reduce the amount of available C to a critical level, it becomes limiting for microbial growth and soil organic matter decomposition. On the other hand, acceleration, or retardation of decomposition of soil organic C caused by root activity is termed as rhizosphere priming effect (RPE) [30]. This effect has been increasingly recognized to play a crucial role on the native C destabilization as it is influenced by fresh C availability, microbial activity, and soil mineralogy such as crystallinity of clay minerals and Al-, Fe-oxides [31]. Combining microbial ecology and soil mineral interactions, we can understand how soil characteristics and climate change can influence below ground competition and finally rhizosphere priming effect.
Origins of sediment organic carbon, carbon fluxes between mangroves and their adjacent systems (coastal waters and atmosphere), and cycling processes are all examples of organic carbon processes in mangrove ecosystems [9]. Constant buildup of organic matter and sediments within mangroves roots allows for the steady accumulation of carbon over time in Magyi mangrove forest. Due to the tidal flush, there is a large material exchange between mangrove ecosystems and their adjacent coastal waters. In addition, higher rates of organic matter input from Magyi and Uto streams enhanced the soil carbon stocks (autochthonous organic matter accumulation) as they originated from Rakhine Yoma. During soil texture analyses, benthic algae were also observed in the soil and benthic algae was one of the contributors to the increase of soil carbon (allochthonous). Kuramoto and Minagawa [32] reported that in southwest Thailand mangroves, benthic algae contributed 39% of sediment organic carbon.
5. Conclusion
In this study, we investigated and quantified the soil carbon stock change in Magyi mangrove forest over six years using the repeated field measurements. Magyi mangroves were degraded due to aquaculture, agriculture, and charcoal production in the past, but it was restored by Worldview International Foundation in collaboration with Pathein University and Forest Department since 2014. The study sites were characterized by different mangrove vegetation, soil types and sediment deposition from different water sources; Shwe Thaung Yan coastal waters as well as Magyi and Uto streams originated from Rakhine Yoma. Planted mangroves were found to be greatly developing under no human disturbances and supported the soil carbon accumulation by trapping organic matter within their roots. Our estimated soil carbon stocks in 2021 (1954.43 ± 33.24 ton/ ha) was 2.7 times higher than the estimated carbon stock in 2015 (732.26 ± 6.99 ton/ ha). Our hypothesis that the mangrove soil carbon has increased after six years is evident through the result and higher accumulation of soil carbon at 1 meter depth after six-year restoration was also observed. These results suggest that the mangrove restoration significantly enhances soil C storage. The substantial soil C stocks commonly found in Magyi mangroves play an important role in sequestering atmospheric CO2, promoting climate change mitigation and this reservoir should not be neglected in C accounting programs. Also, the study results observed in Tha-Bot-Khan and Wette areas differ slightly from the Magyi’s SOC because the mangrove plants can get their nutrients all year round through Pho-Thoung- Gyi, deep sea bay near the forest and this action didn’t appear in the Magi’s mangrove forest. Finally, the present research on the studies of organic carbon accumulation in the mangrove soil will be helpful to understand the role of mangrove ecosystem in carbon sequestration and efforts on climate change mitigation.
Author Contributions
Conceptualization, H.Y.; methodology, H.Y.; S.T.T.H.; H.T.N; validation, S.K.; J.K.; analysis, H.Y.; writing—original draft preparation, H.Y.; S.T.H.H.; writing—review and editing, S.K.; J.K..; All authors have read and agreed to the published version of the manuscript.
Htay Aung (H.K.), Saroj Koirala (S.K.), Soe Thaw Thaw Htun (S.T.T.H.), Joacim Kontny (J.K.), Htun Thiri Naing (H.T.N)
Funding
This research and the APC was funded by Worldview International Foundation, 70 Yaw Min Gyi Street, Dagon Township, Yangon, Myanmar.
Data Availability Statement
All the data collected and used for the analysis of this study will be available upon request. We also encourage readers to look into the tables in the appendix section for additional data.
Conflicts of Interest
The authors declare no conflict of interest.
Appendix

Table A1.
The sampling plots in Magyi and U-To channel with coordinate points.
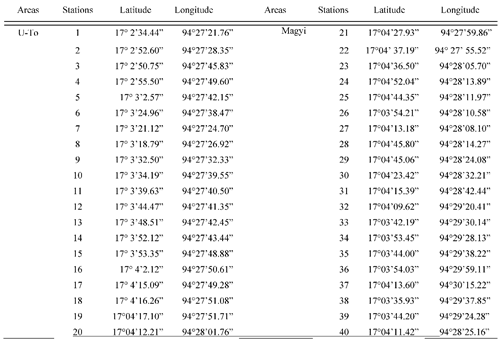 |
Table A2.
The sampling plots in That-Bot-Khan and Wette channel with coordinate points.
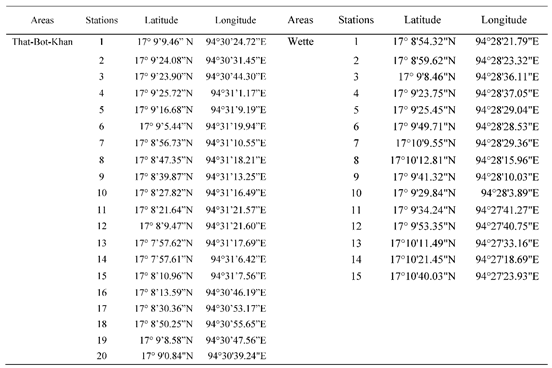 |
Table A3.
Percentage of carbon, carbon stock and soil texture of each sample plots of Magyi’ channel.
Table A3.
Percentage of carbon, carbon stock and soil texture of each sample plots of Magyi’ channel.
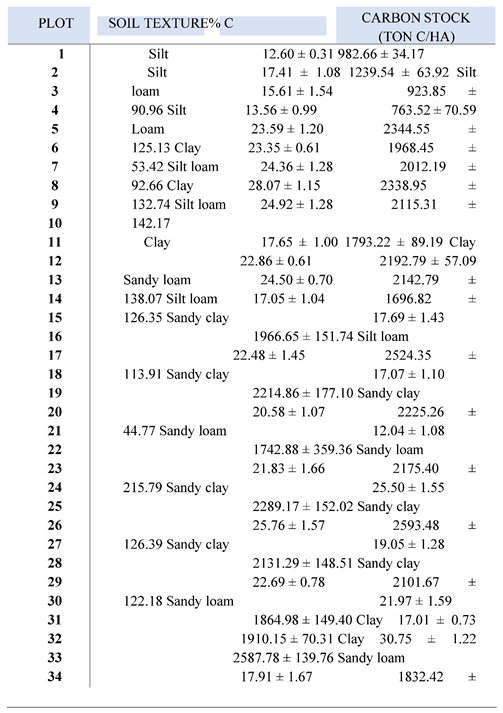 |
Values represent mean ± 1 standard deviation, where appropriate.
Table A4.
SOC, Bulk density, % C and Soil texture of each sampling plots of Tha Bot Khan area.
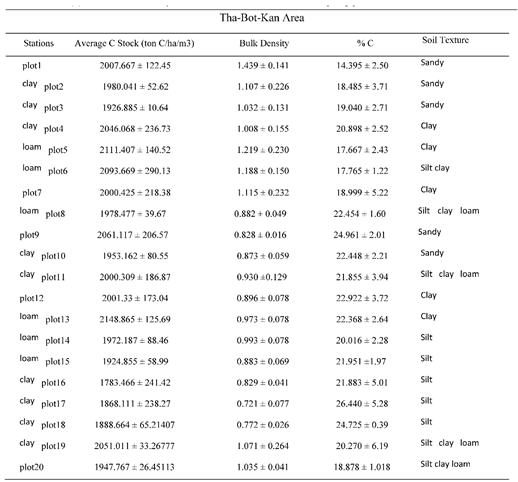 |
Table A5.
SOC, Bulk density, % C and Soil texture of each sampling plots of Wette area.
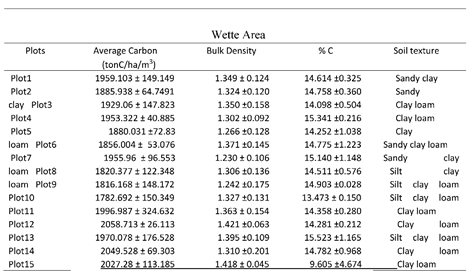 |
Table A6.
Average soil organic carbon stock of Magyi, Tha Bot Khan areas and Wette.
 |
References
- Veettil, B.K.; Pereira, S.F.R.; Quang, N.X. Rapidly diminishing mangrove forests in Myanmar (Burma): a review. Hydrobiologia 2018, 822, 19–35. [Google Scholar] [CrossRef]
- Giri, C.; Ochieng, E.; Tieszen, L.L.; Zhu, Z.; Singh, A.; Loveland, T.; Masek, J.; Duke, N. Status and distribution of mangrove forests of the world using earth observation satellite data. Global Ecology and Biogeography 2011, 20, 154–159. [Google Scholar] [CrossRef]
- Estoque, R.C.; Myint, S.W.; Wang, C.; Ishtiaque, A.; Aung, T.T.; Emerton, L.; Ooba, M.; Hijioka, Y.; Mon, M.S.; Wang, Z. Assessing environmental impacts and change in Myanmar's mangrove ecosystem service value due to deforestation (2000–2014). Global change biology 2018, 24, 5391–5410. [Google Scholar] [CrossRef] [PubMed]
- de Lacerda, L.D.; Ferreira, A.C.; Ward, R.; Borges, R. Mangroves in the Anthropocene: From local change to global challenge. Frontiers in Forests and Global Change Tropical Forests 2022. [Google Scholar] [CrossRef]
- Duke, N.C.; Meynecke, J.-O.; Dittmann, S.; Ellison, A.M.; Anger, K.; Berger, U.; Cannicci, S.; Diele, K.; Ewel, K.C.; Field, C.D. A world without mangroves? Science 2007, 317, 41–42. [Google Scholar] [CrossRef] [PubMed]
- FAO. Global Forest Resources Assessment (FRA) FAO: 2020.
- Zöckler, C.; Aung, C. The mangroves of myanmar. Sabkha Ecosystems: Volume VI: Asia/Pacific 2019, 253–268. [Google Scholar]
- Breithaupt, J.L.; Smoak, J.M.; Smith III, T.J.; Sanders, C.J.; Hoare, A. Organic carbon burial rates in mangrove sediments: Strengthening the global budget. Global Biogeochemical Cycles 2012, 26. [Google Scholar] [CrossRef]
- Yong, Y.; Baipeng, P.; Guangcheng, C.; Yan, C. Processes of organic carbon in mangrove ecosystems. Acta Ecologica Sinica 2011, 31, 169–173. [Google Scholar] [CrossRef]
- Howard, J.; Hoyt, S.; Isensee, K.; Telszewski, M.; Pidgeon, E. Coastal blue carbon: methods for assessing carbon stocks and emissions factors in mangroves, tidal salt marshes, and seagrasses. 2014.
- Mcleod, E.; Chmura, G.L.; Bouillon, S.; Salm, R.; Björk, M.; Duarte, C.M.; Lovelock, C.E.; Schlesinger, W.H.; Silliman, B.R. A blueprint for blue carbon: toward an improved understanding of the role of vegetated coastal habitats in sequestering CO2. Frontiers in Ecology and the Environment 2011, 9, 552–560. [Google Scholar] [CrossRef]
- Aung, H. Soil carbon measurement in Magyi’s mangrove forest; Marine Science Department, Pathein University. , 2015.
- Soe-Htun, U.; Wai, M.K.; Nyunt, T.; Kyaw, S.P.P.; Aye, M.M. Seagrasses of Myanmar with special reference to the phytogeographic distribution of the species of ASEAN nations. J Myan Acad Art Sci 2009, 7. [Google Scholar]
- Chandler, R.D. Soil organic carbon distribution with depth: Implications for ecosystem services. Clemson University, 2016.
- Curtis, R.O.; Post, B.W. Estimating bulk density from organic-matter content in some Vermont forest soils. Soil Science Society of America Journal 1964, 28, 285–286. [Google Scholar] [CrossRef]
- McHarg, E.; Mengo, E.; Benson, L.; Daniel, J.; Joseph-Witzig, A.; Posen, P.; Luisetti, T. Valuing the contribution of blue carbon to small island developing states' climate change commitments and Covid-19 recovery. Environmental Science & Policy 2022, 132, 13–23. [Google Scholar]
- Donato, D.C.; Kauffman, J.B.; Murdiyarso, D.; Kurnianto, S.; Stidham, M.; Kanninen, M. Mangroves among the most carbon-rich forests in the tropics. Nature geoscience 2011, 4, 293–297. [Google Scholar] [CrossRef]
- Kauffman, J.B.; Heider, C.; Cole, T.G.; Dwire, K.A.; Donato, D.C. Ecosystem carbon stocks of Micronesian mangrove forests. Wetlands 2011, 31, 343–352. [Google Scholar] [CrossRef]
- Ezcurra, P.; Ezcurra, E.; Garcillán, P.P.; Costa, M.T.; Aburto-Oropeza, O. Coastal landforms and accumulation of mangrove peat increase carbon sequestration and storage. Proceedings of the National Academy of Sciences 2016, 113, 4404–4409. [Google Scholar] [CrossRef]
- Fontaine, S.; Barot, S.; Barré, P.; Bdioui, N.; Mary, B.; Rumpel, C. Stability of organic carbon in deep soil layers controlled by fresh carbon supply. Nature 2007, 450, 277–280. [Google Scholar] [CrossRef]
- Luk, S.Y.-X. Constraining Natural and Anthropogenic Disturbances in the Delivery of Coastal Ecosystem Services. Massachusetts Institute of Technology, 2022.
- Brady, N.C.; Weil, R.R.; Weil, R.R. The nature and properties of soils; Prentice Hall Upper Saddle River, NJ: 2008; Vol. 13.
- Lorenz, K.; Lal, R. The depth distribution of soil organic carbon in relation to land use and management and the potential of carbon sequestration in subsoil horizons. Advances in agronomy 2005, 88, 35–66. [Google Scholar]
- Basile-Doelsch, I.; Balesdent, J.; Pellerin, S. Reviews and syntheses: The mechanisms underlying carbon storage in soil. Biogeosciences 2020, 17, 5223–5242. [Google Scholar] [CrossRef]
- Balesdent, J.; Basile-Doelsch, I.; Chadoeuf, J.; Cornu, S.; Derrien, D.; Fekiacova, Z.; Hatté, C. Atmosphere–soil carbon transfer as a function of soil depth. Nature 2018, 559, 599–602. [Google Scholar] [CrossRef] [PubMed]
- Jackson, R.B.; Lajtha, K.; Crow, S.E.; Hugelius, G.; Kramer, M.G.; Piñeiro, G. The ecology of soil carbon: pools, vulnerabilities, and biotic and abiotic controls. Annual review of ecology, evolution, and systematics 2017, 48, 419–445. [Google Scholar] [CrossRef]
- Furukawa, K.; Wolanski, E. Sedimentation in mangrove forests. Mangroves and salt marshes 1996, 1, 3–10. [Google Scholar] [CrossRef]
- Lang’at, J.K.S.; Kirui, B.K.; Skov, M.W.; Kairo, J.G.; Mencuccini, M.; Huxham, M. Species mixing boosts root yield in mangrove trees. Oecologia 2013, 172, 271–278. [Google Scholar] [CrossRef] [PubMed]
- Merino, C.; Nannipieri, P.; Matus, F. Soil carbon controlled by plant, microorganism and mineralogy interactions. Journal of soil science and plant nutrition 2015, 15, 321–332. [Google Scholar] [CrossRef]
- Dungait, J.A.; Hopkins, D.W.; Gregory, A.S.; Whitmore, A.P. Soil organic matter turnover is governed by accessibility not recalcitrance. Global Change Biology 2012, 18, 1781–1796. [Google Scholar] [CrossRef]
- Sollins, P.; Kramer, M.G.; Swanston, C.; Lajtha, K.; Filley, T.; Aufdenkampe, A.K.; Wagai, R.; Bowden, R.D. Sequential density fractionation across soils of contrasting mineralogy: evidence for both microbial-and mineral-controlled soil organic matter stabilization. Biogeochemistry 2009, 96, 209–231. [Google Scholar] [CrossRef]
- Kuramoto, T.; Minagawa, M. Stable carbon and nitrogen isotopic characterization of organic matter in a mangrove ecosystem on the southwestern coast of Thailand. Journal of Oceanography 2001, 57, 421–431. [Google Scholar] [CrossRef]
Figure 1.
Map of the sampling plots in Uto and Magyi tidal creeks.
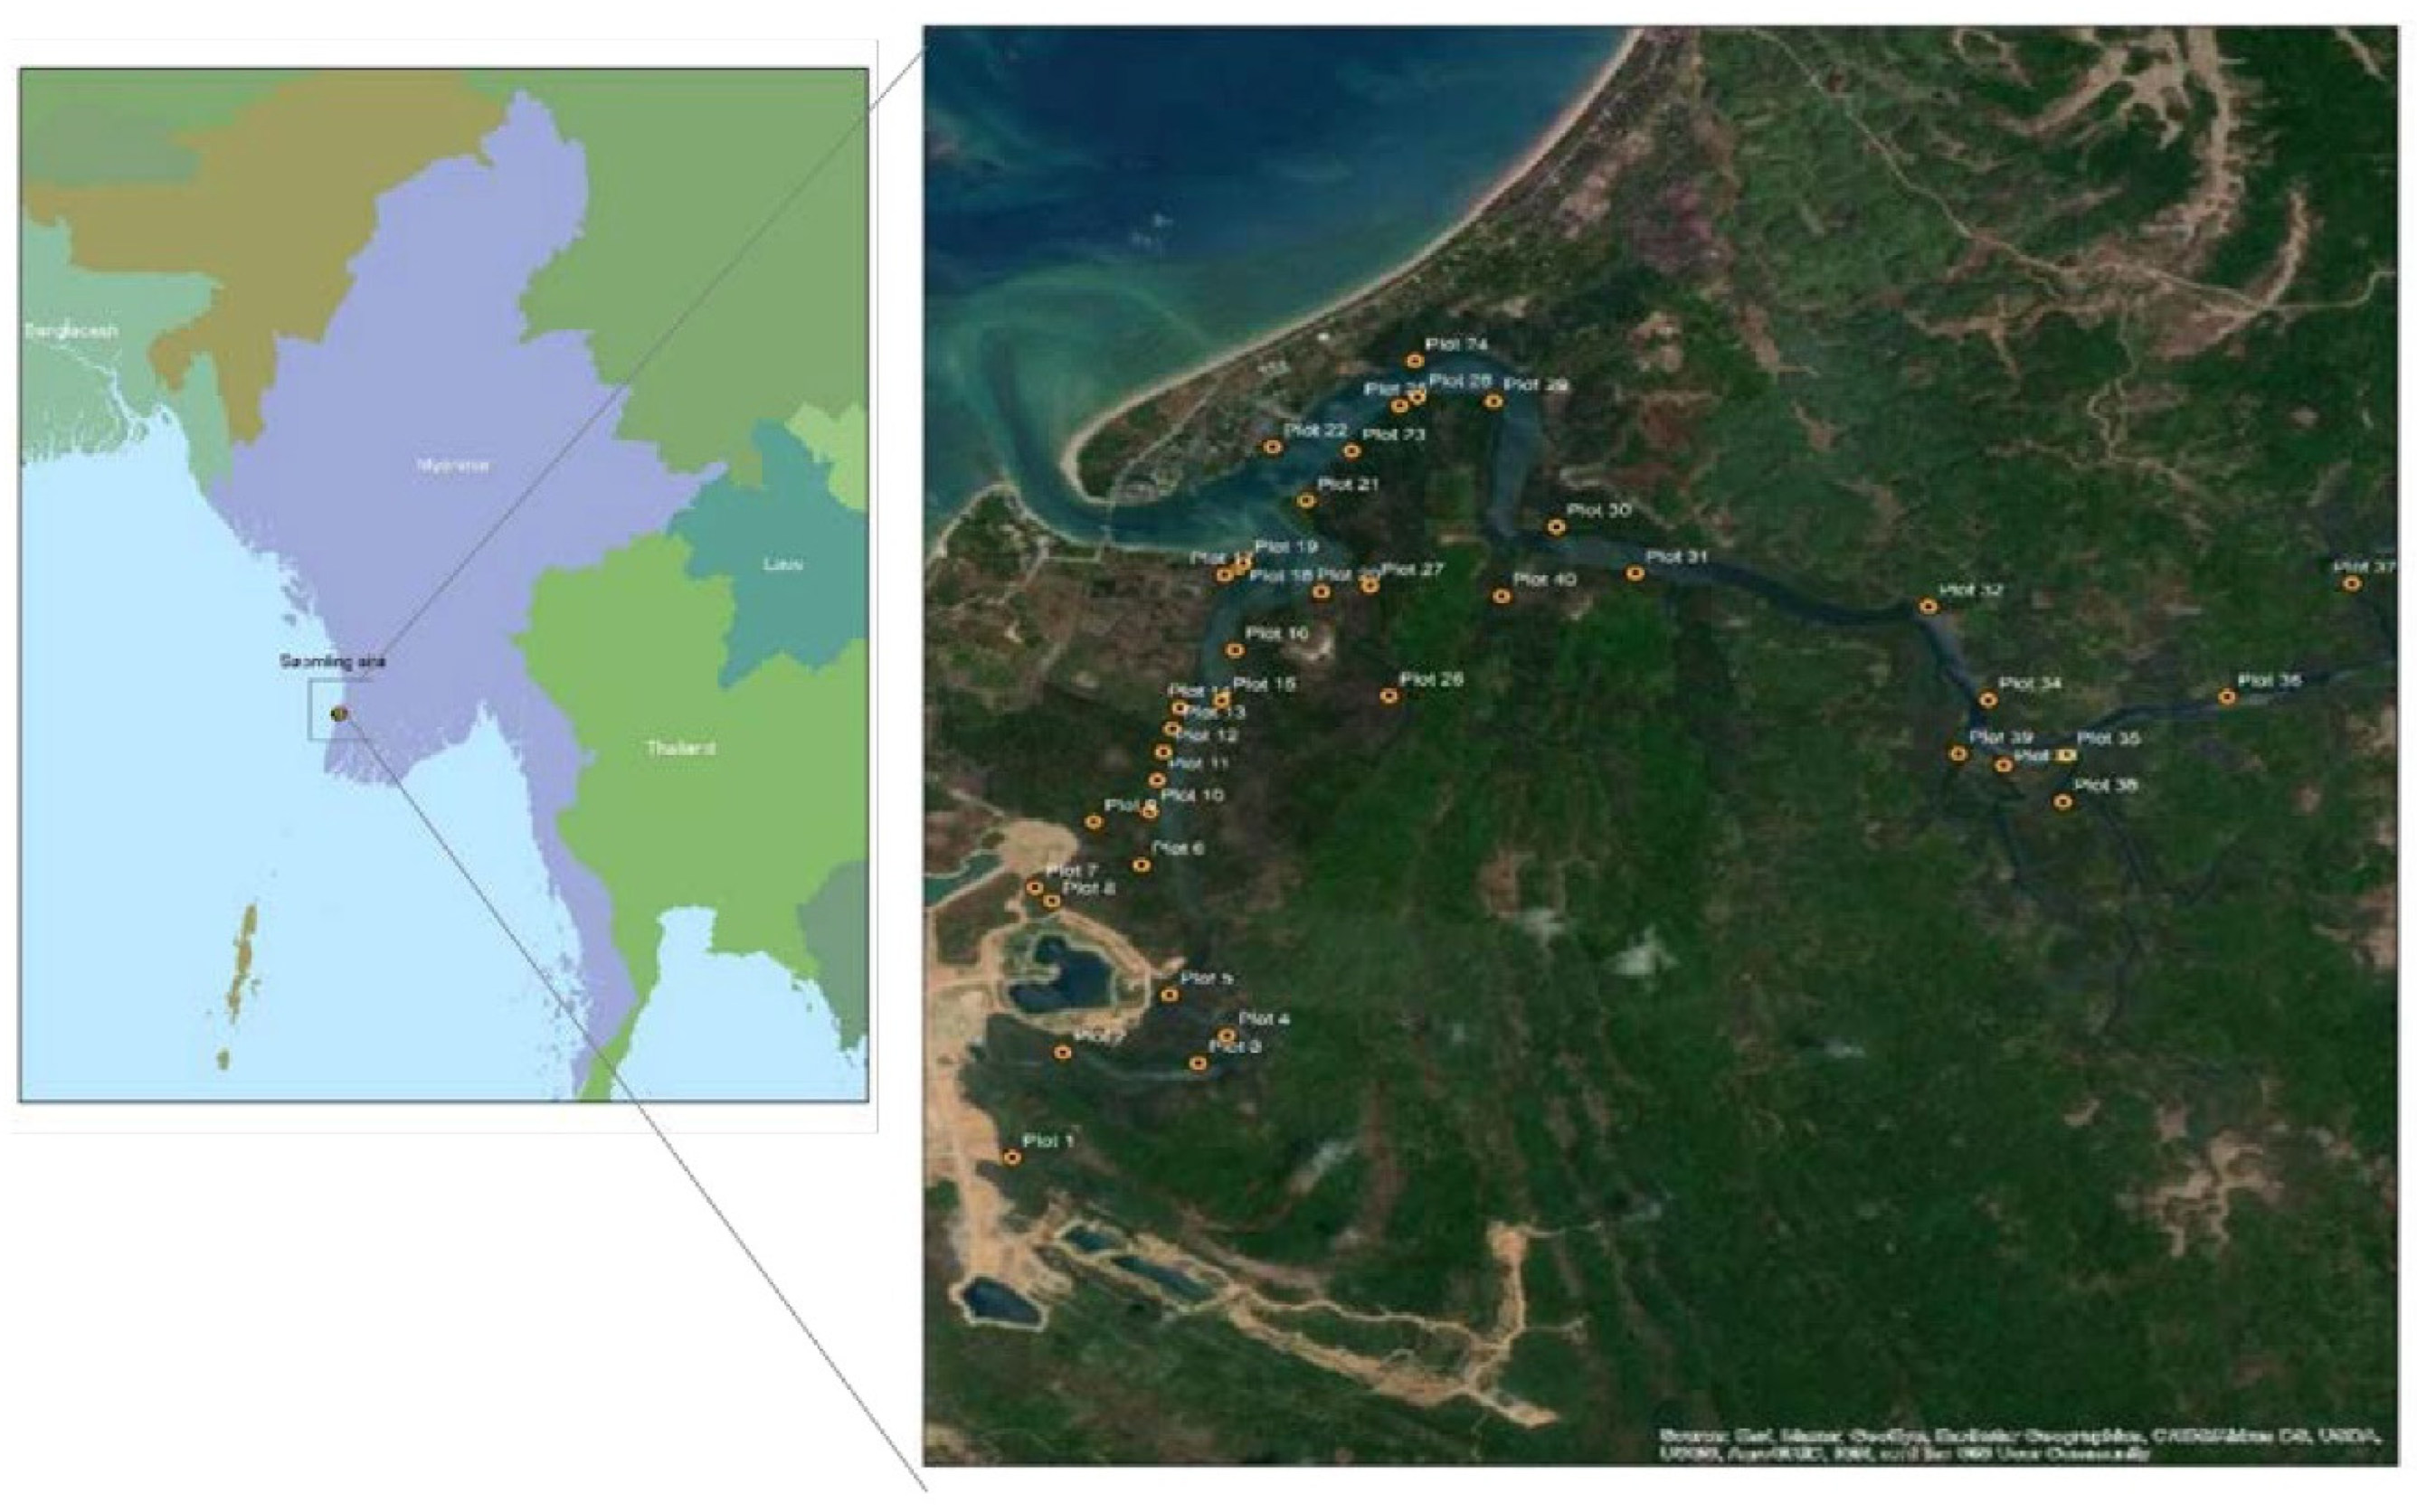
Figure 4.
Carbon stocks of the sampling stations. Boxplots show the mean (middle line), quartiles (boxes), and 1.5 times the interquartile range (IQR) (whiskers).
Figure 4.
Carbon stocks of the sampling stations. Boxplots show the mean (middle line), quartiles (boxes), and 1.5 times the interquartile range (IQR) (whiskers).

Figure 5.
The soil organic carbon values in different plots of Magyi ‘s mangrove forest.
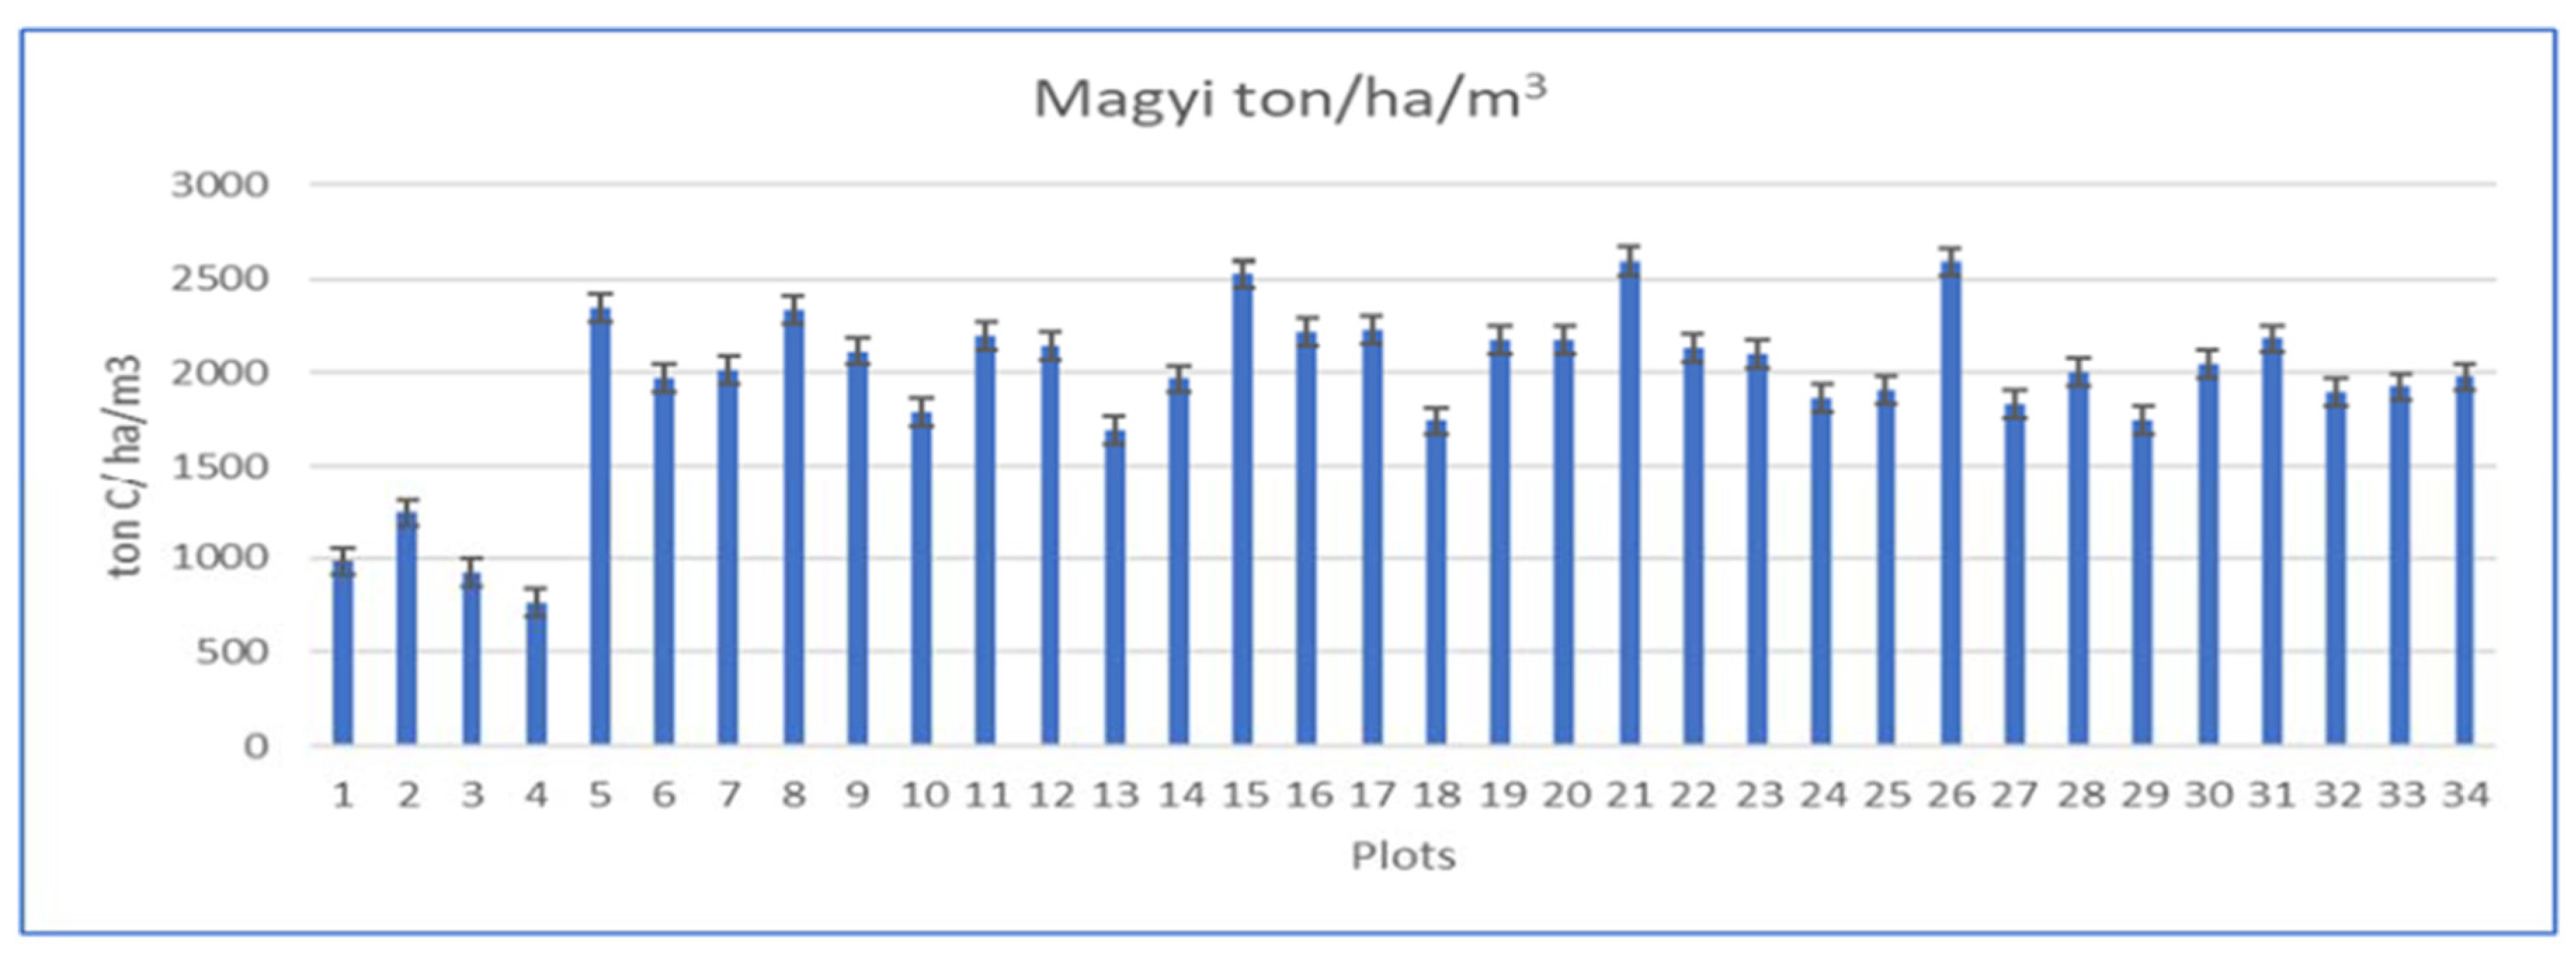
Figure 6.
Differences of carbon stocks in Uto (left) and Magyi (right) tidal creeks.
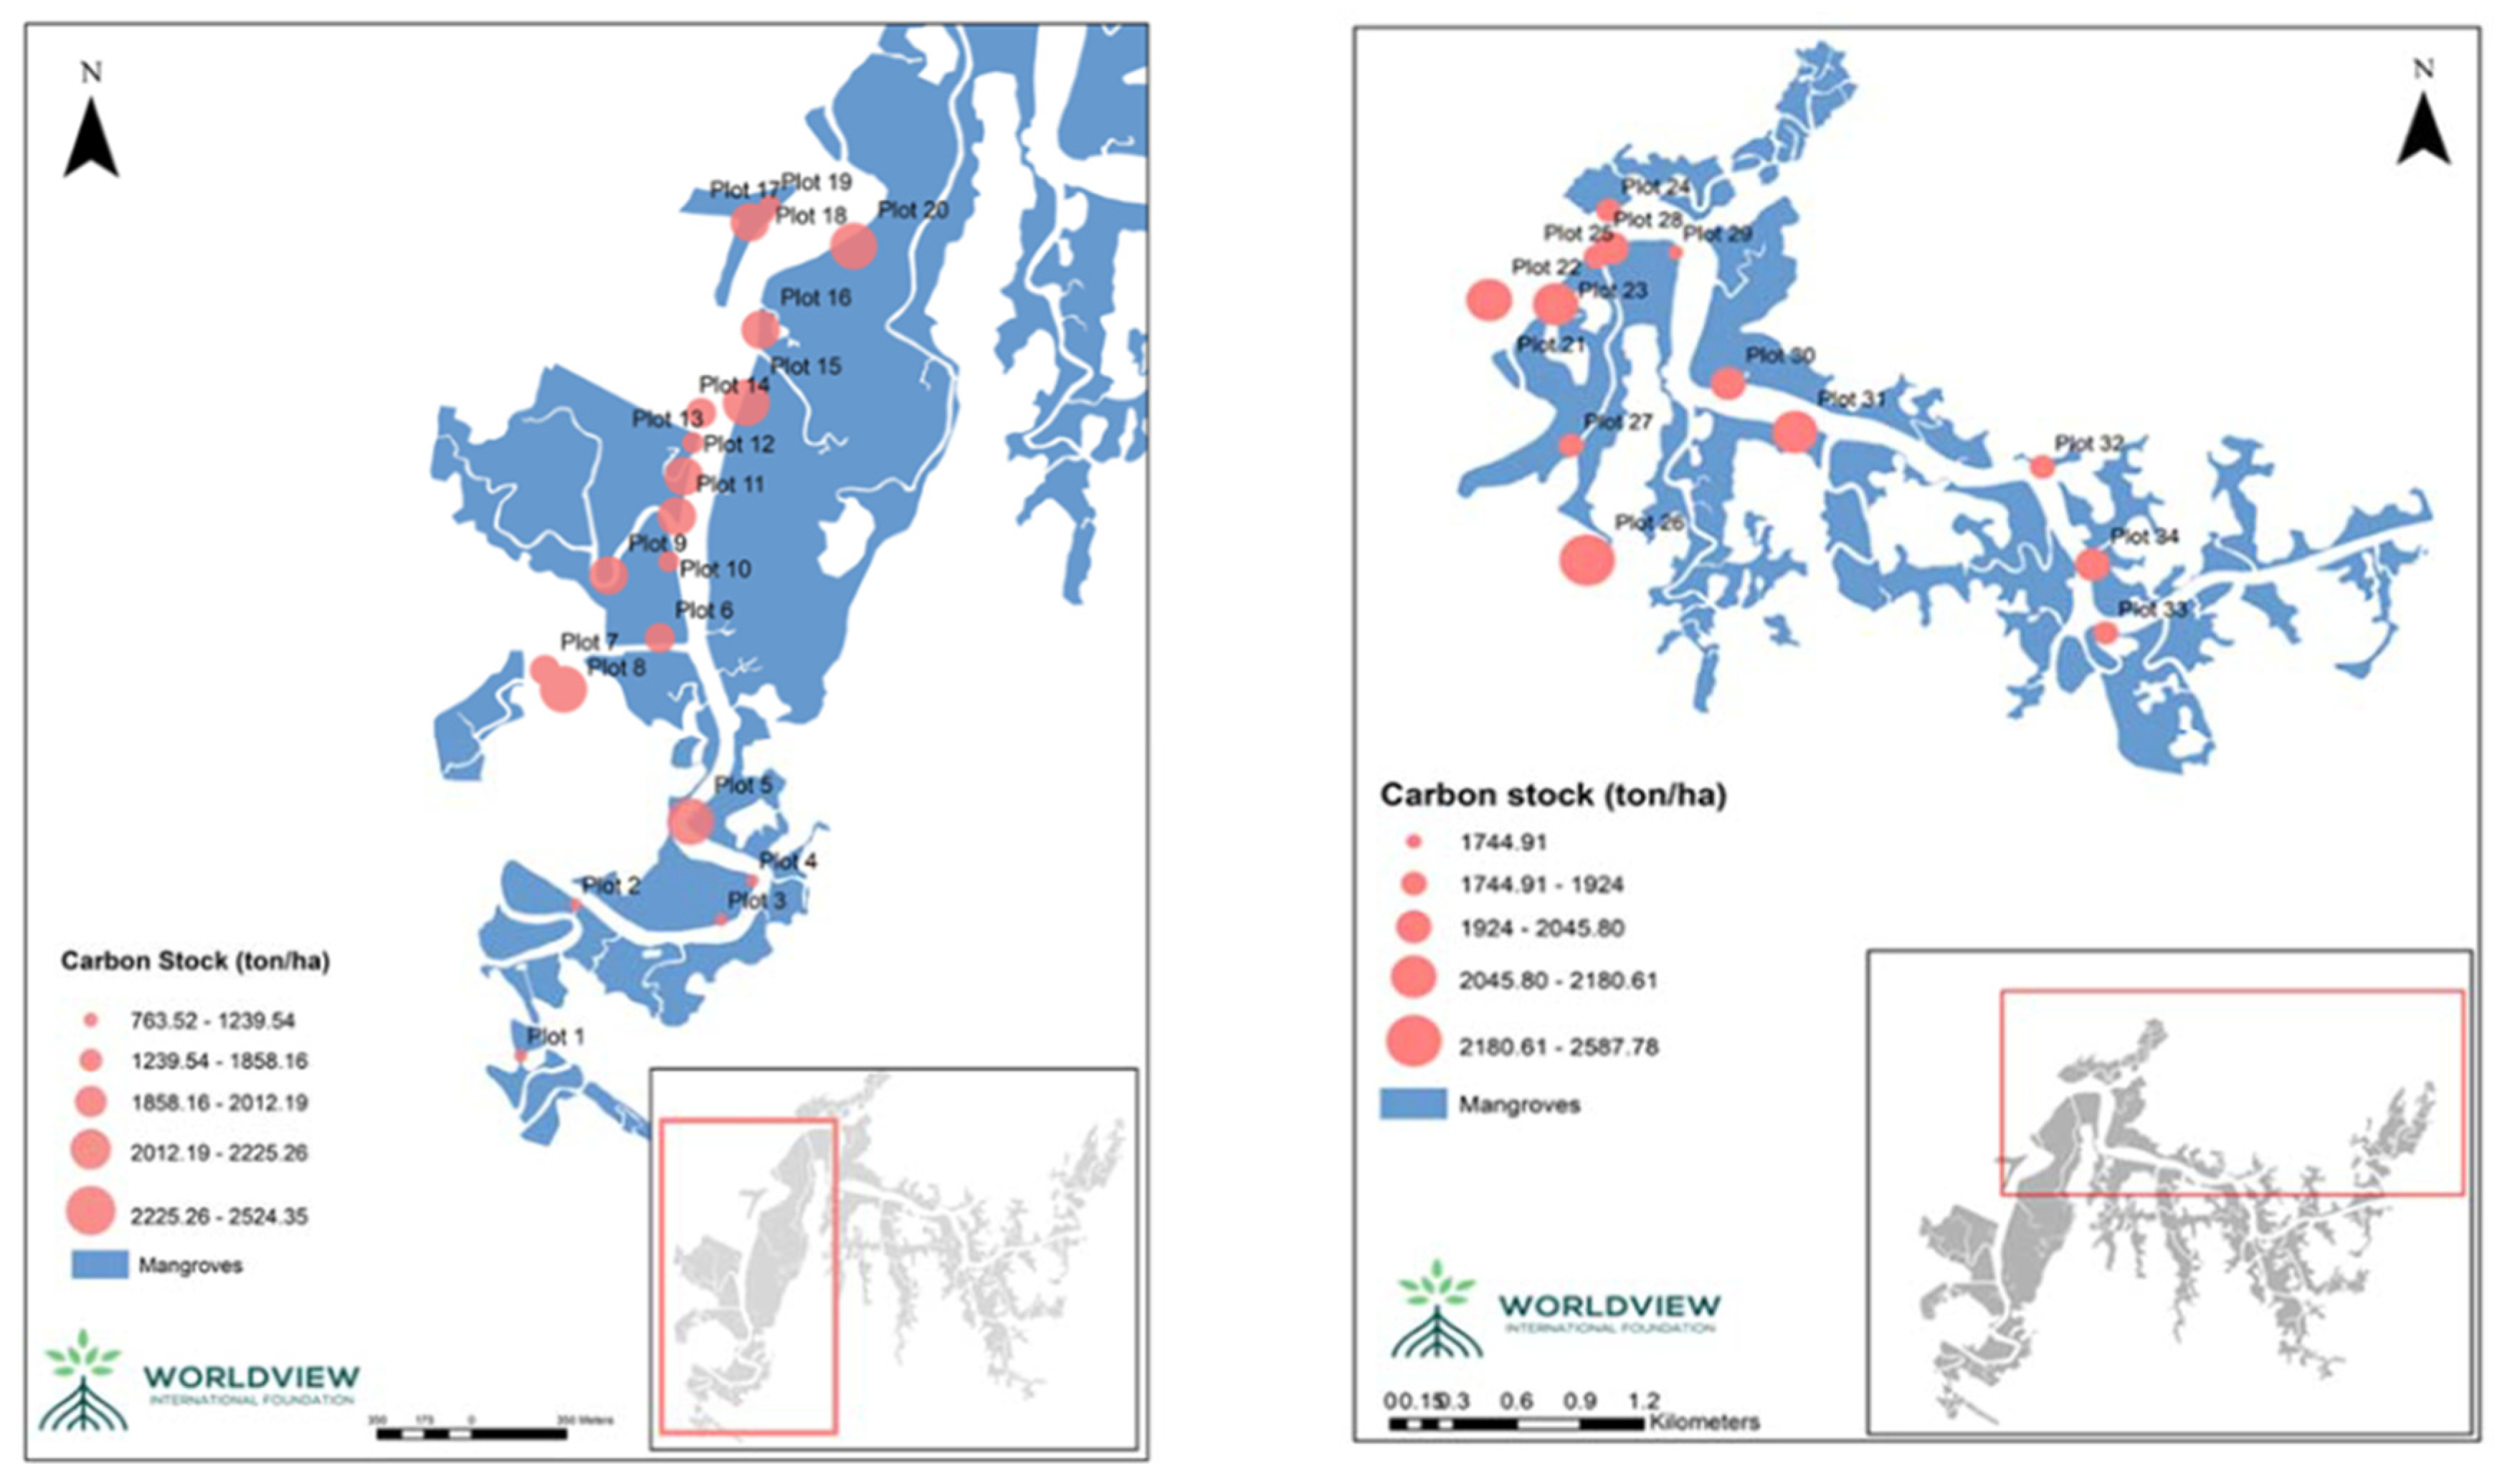
Figure 7.
Changes of bulk density with depth. Error bars represent 1 standard error.
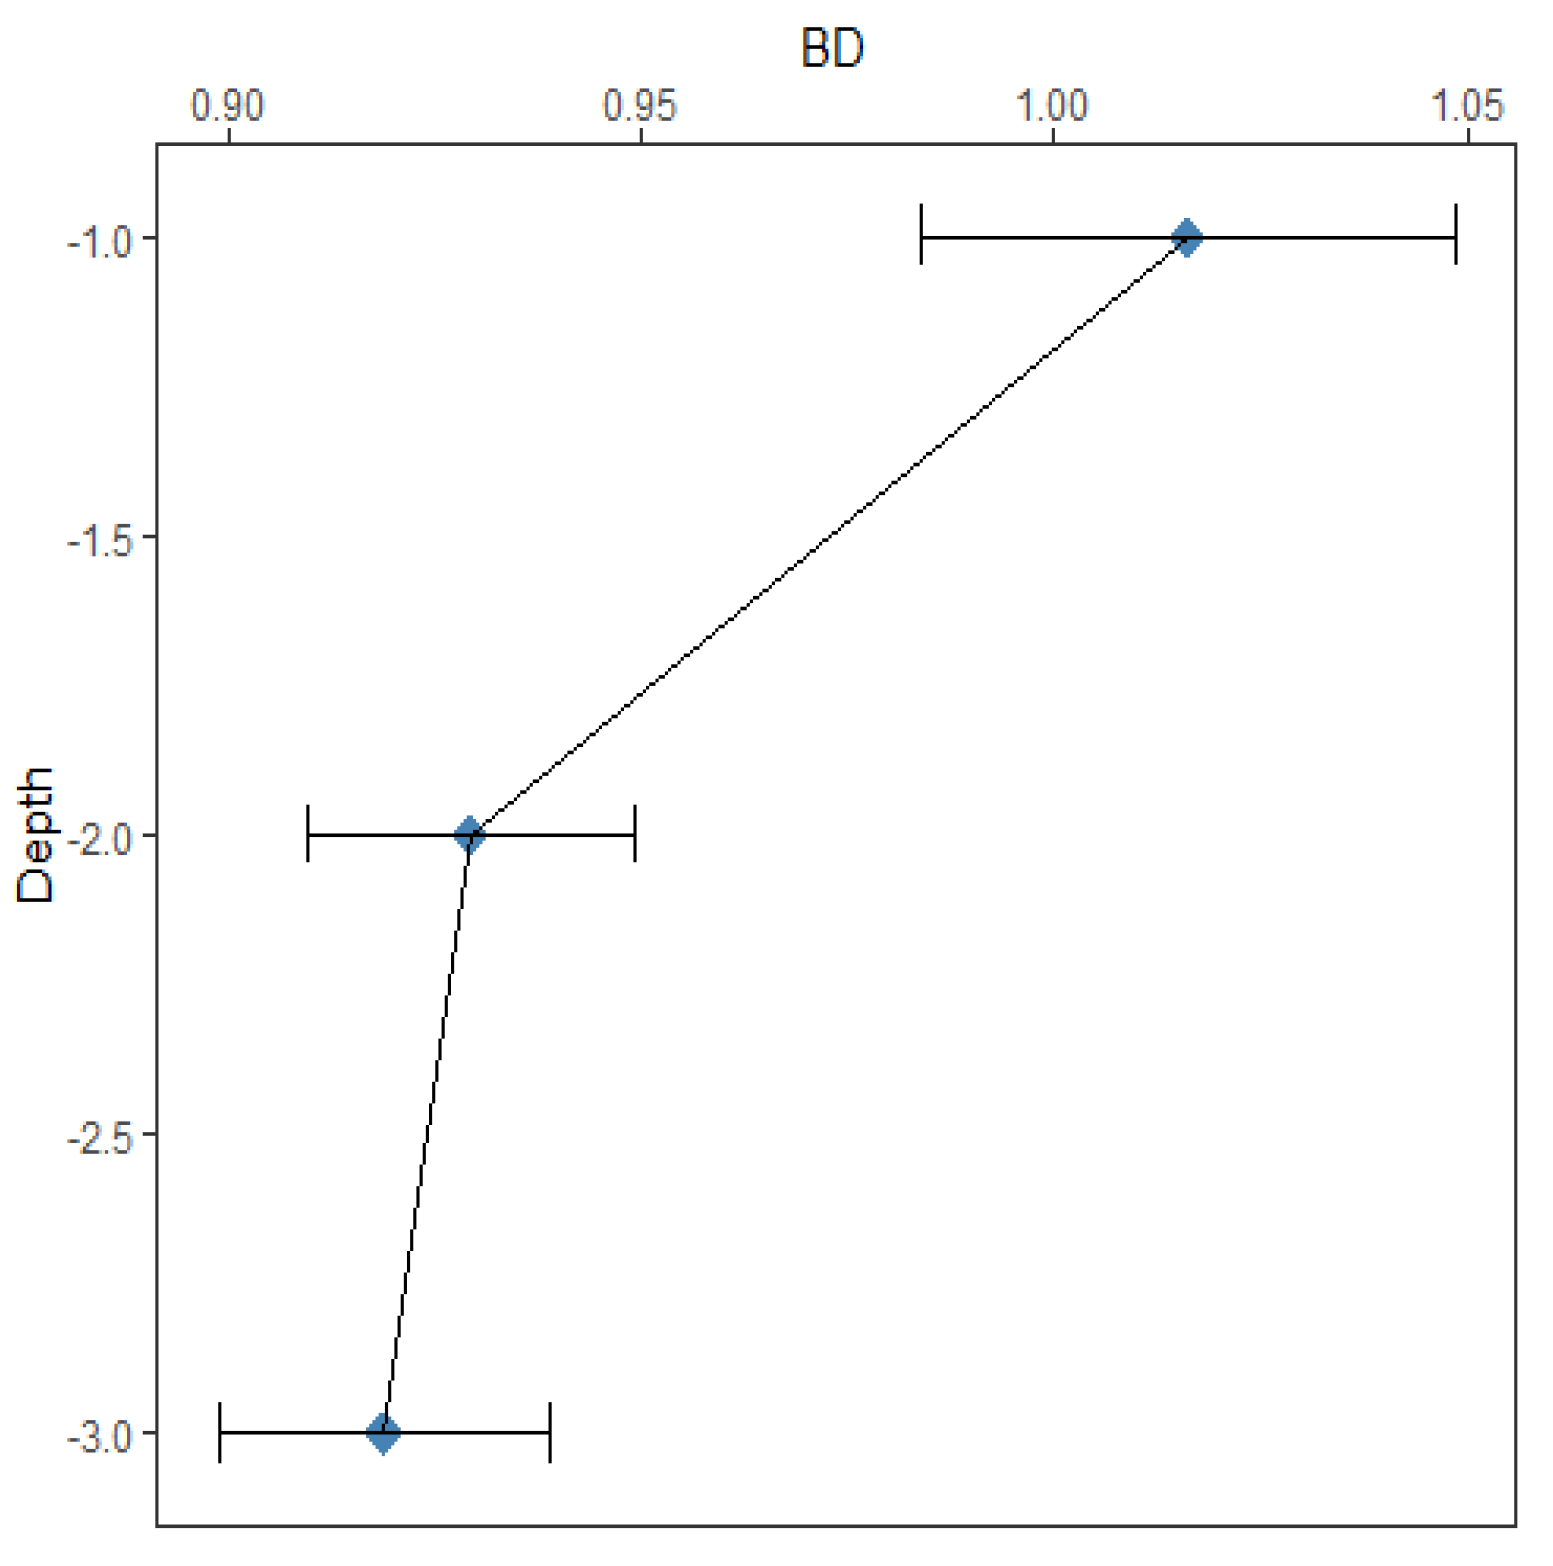
Figure 8.
Changes of C % with depth. Error bars represent 1 standard error.
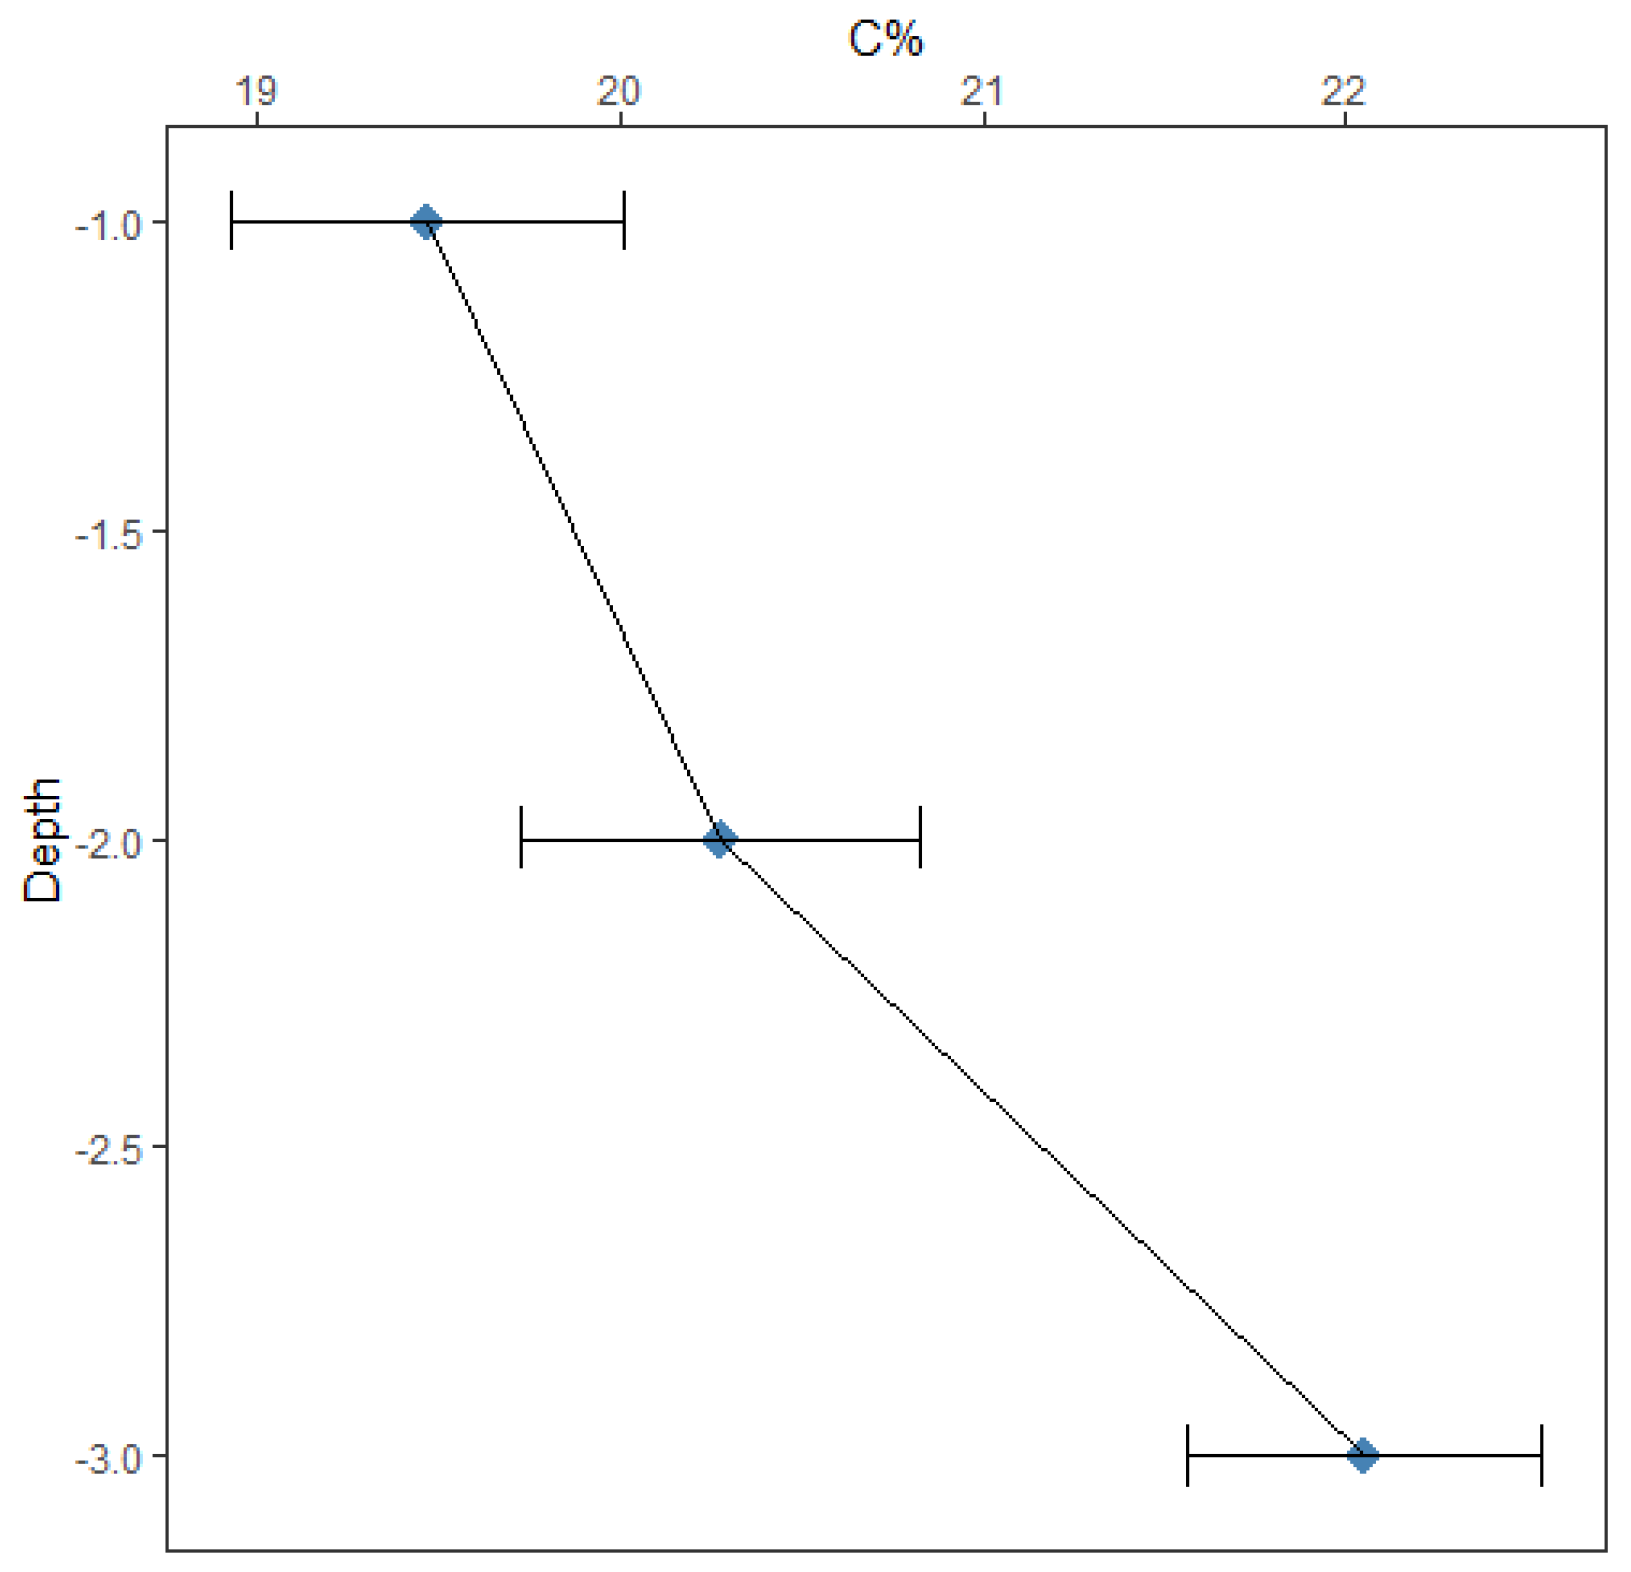
Figure 9.
Relationship between bulk density and C percentage.
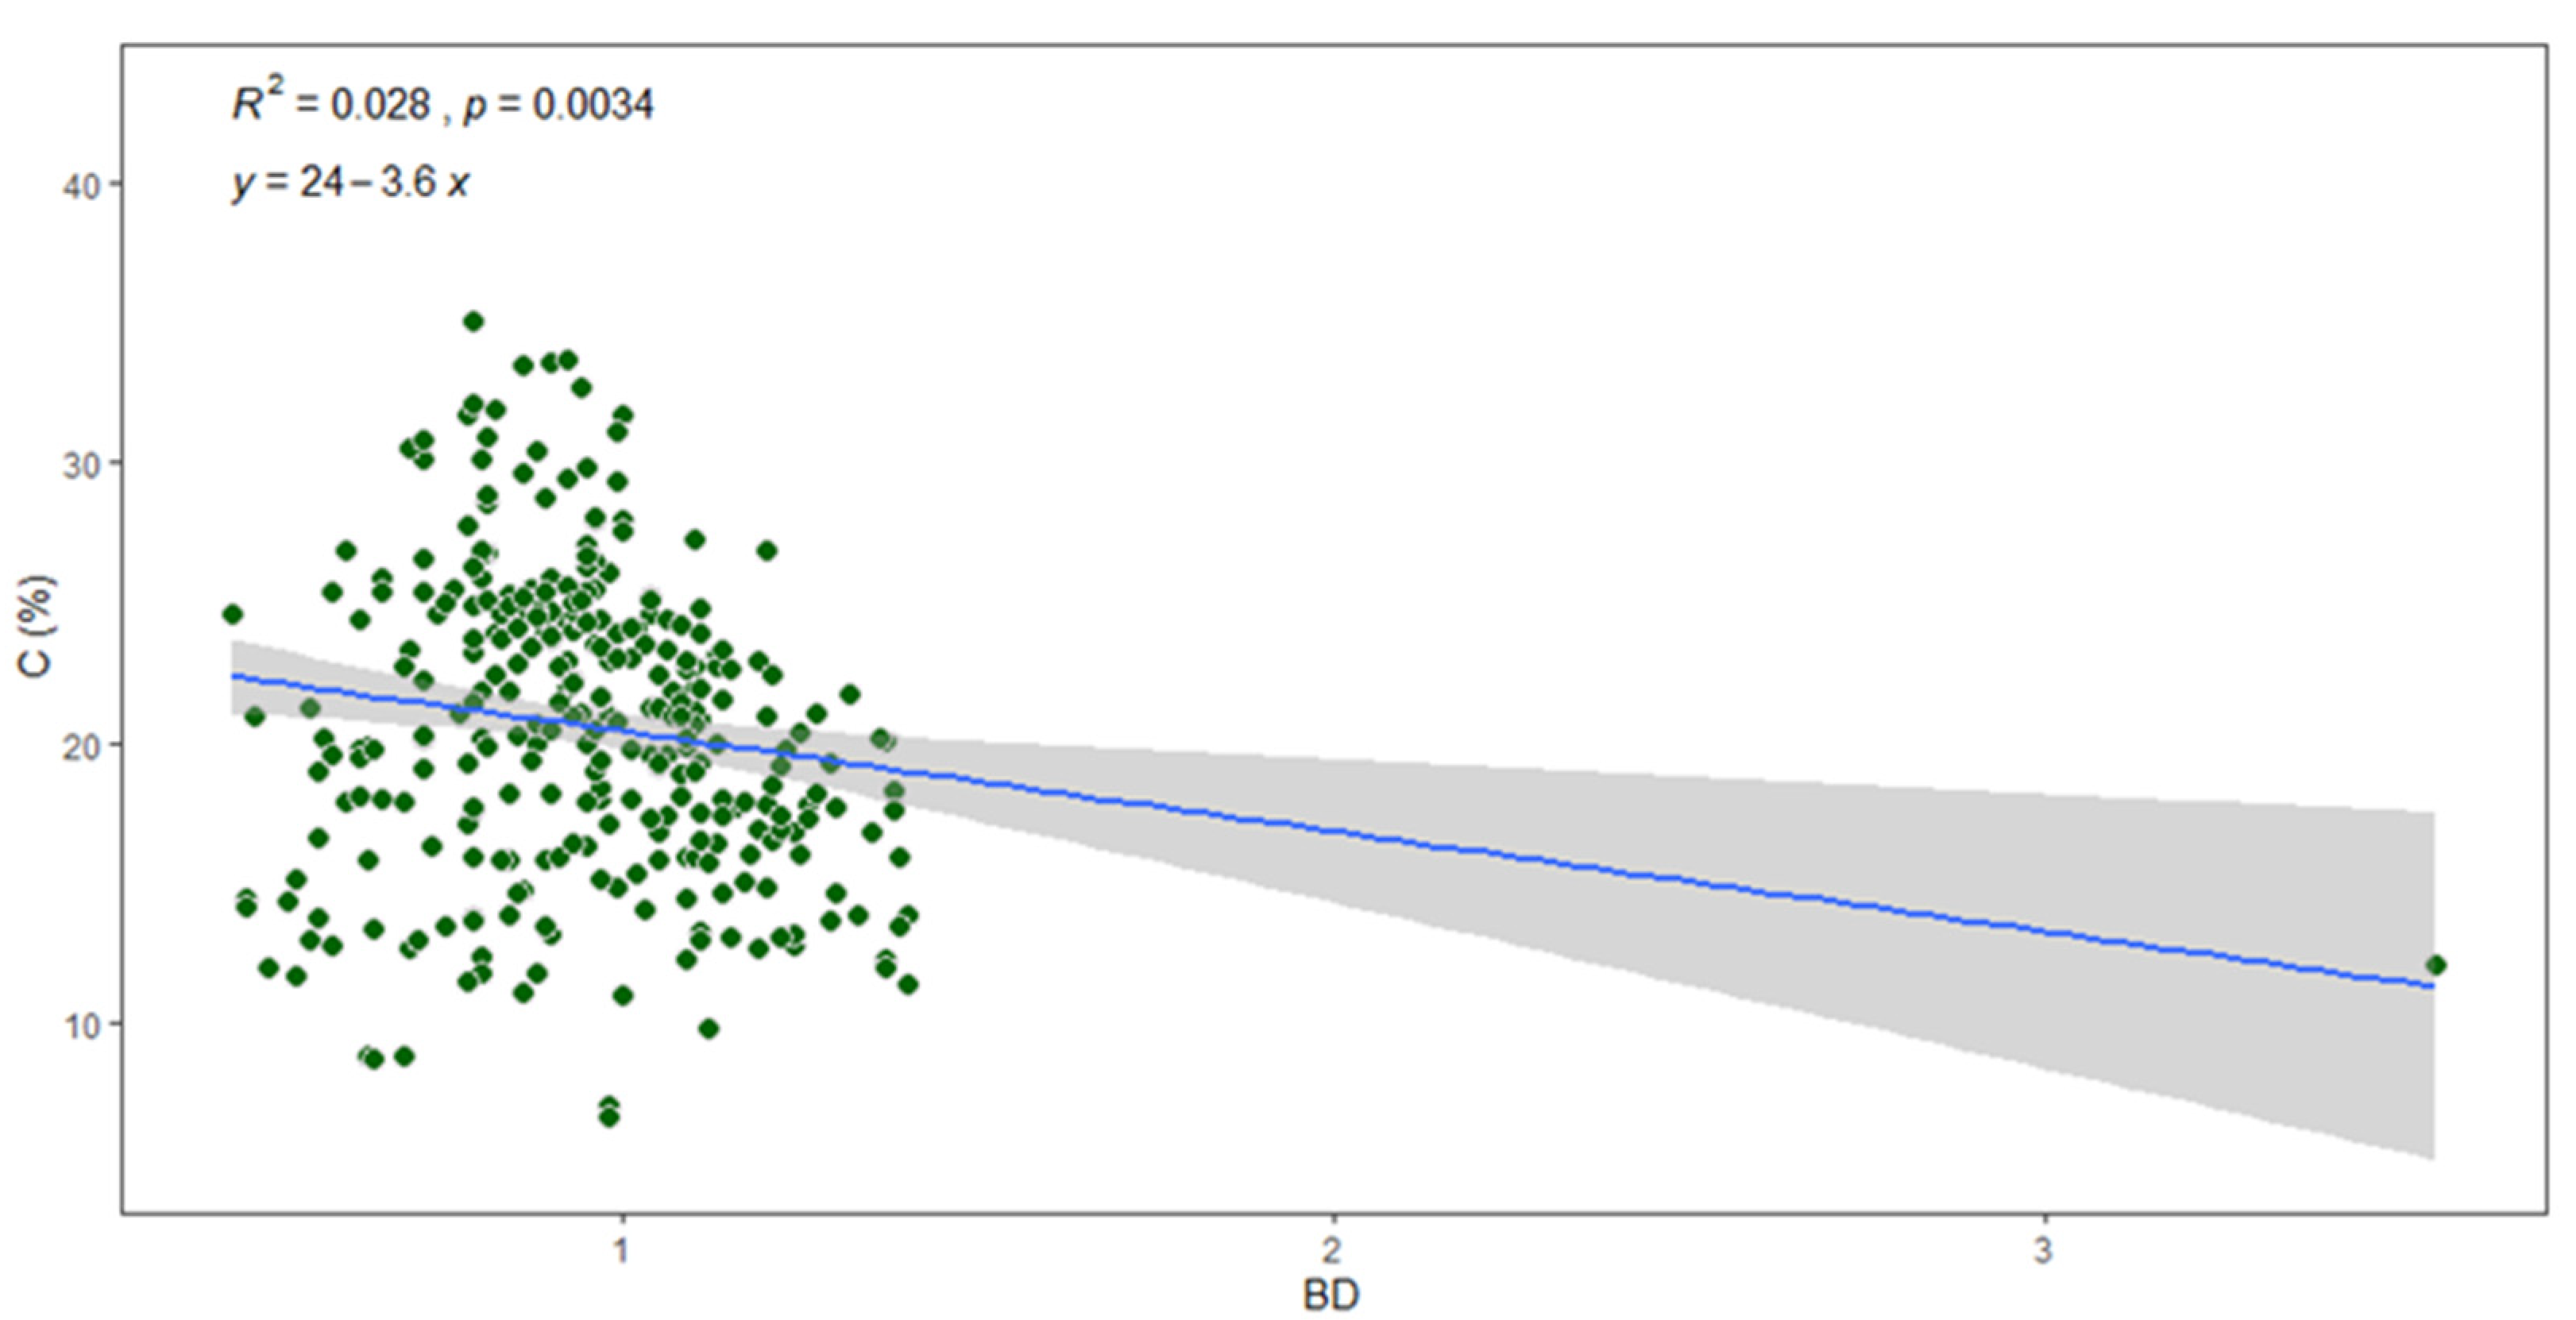
Figure 10.
Comparison of soil organic carbon between sampling plots of Tha Bot Khan areas.
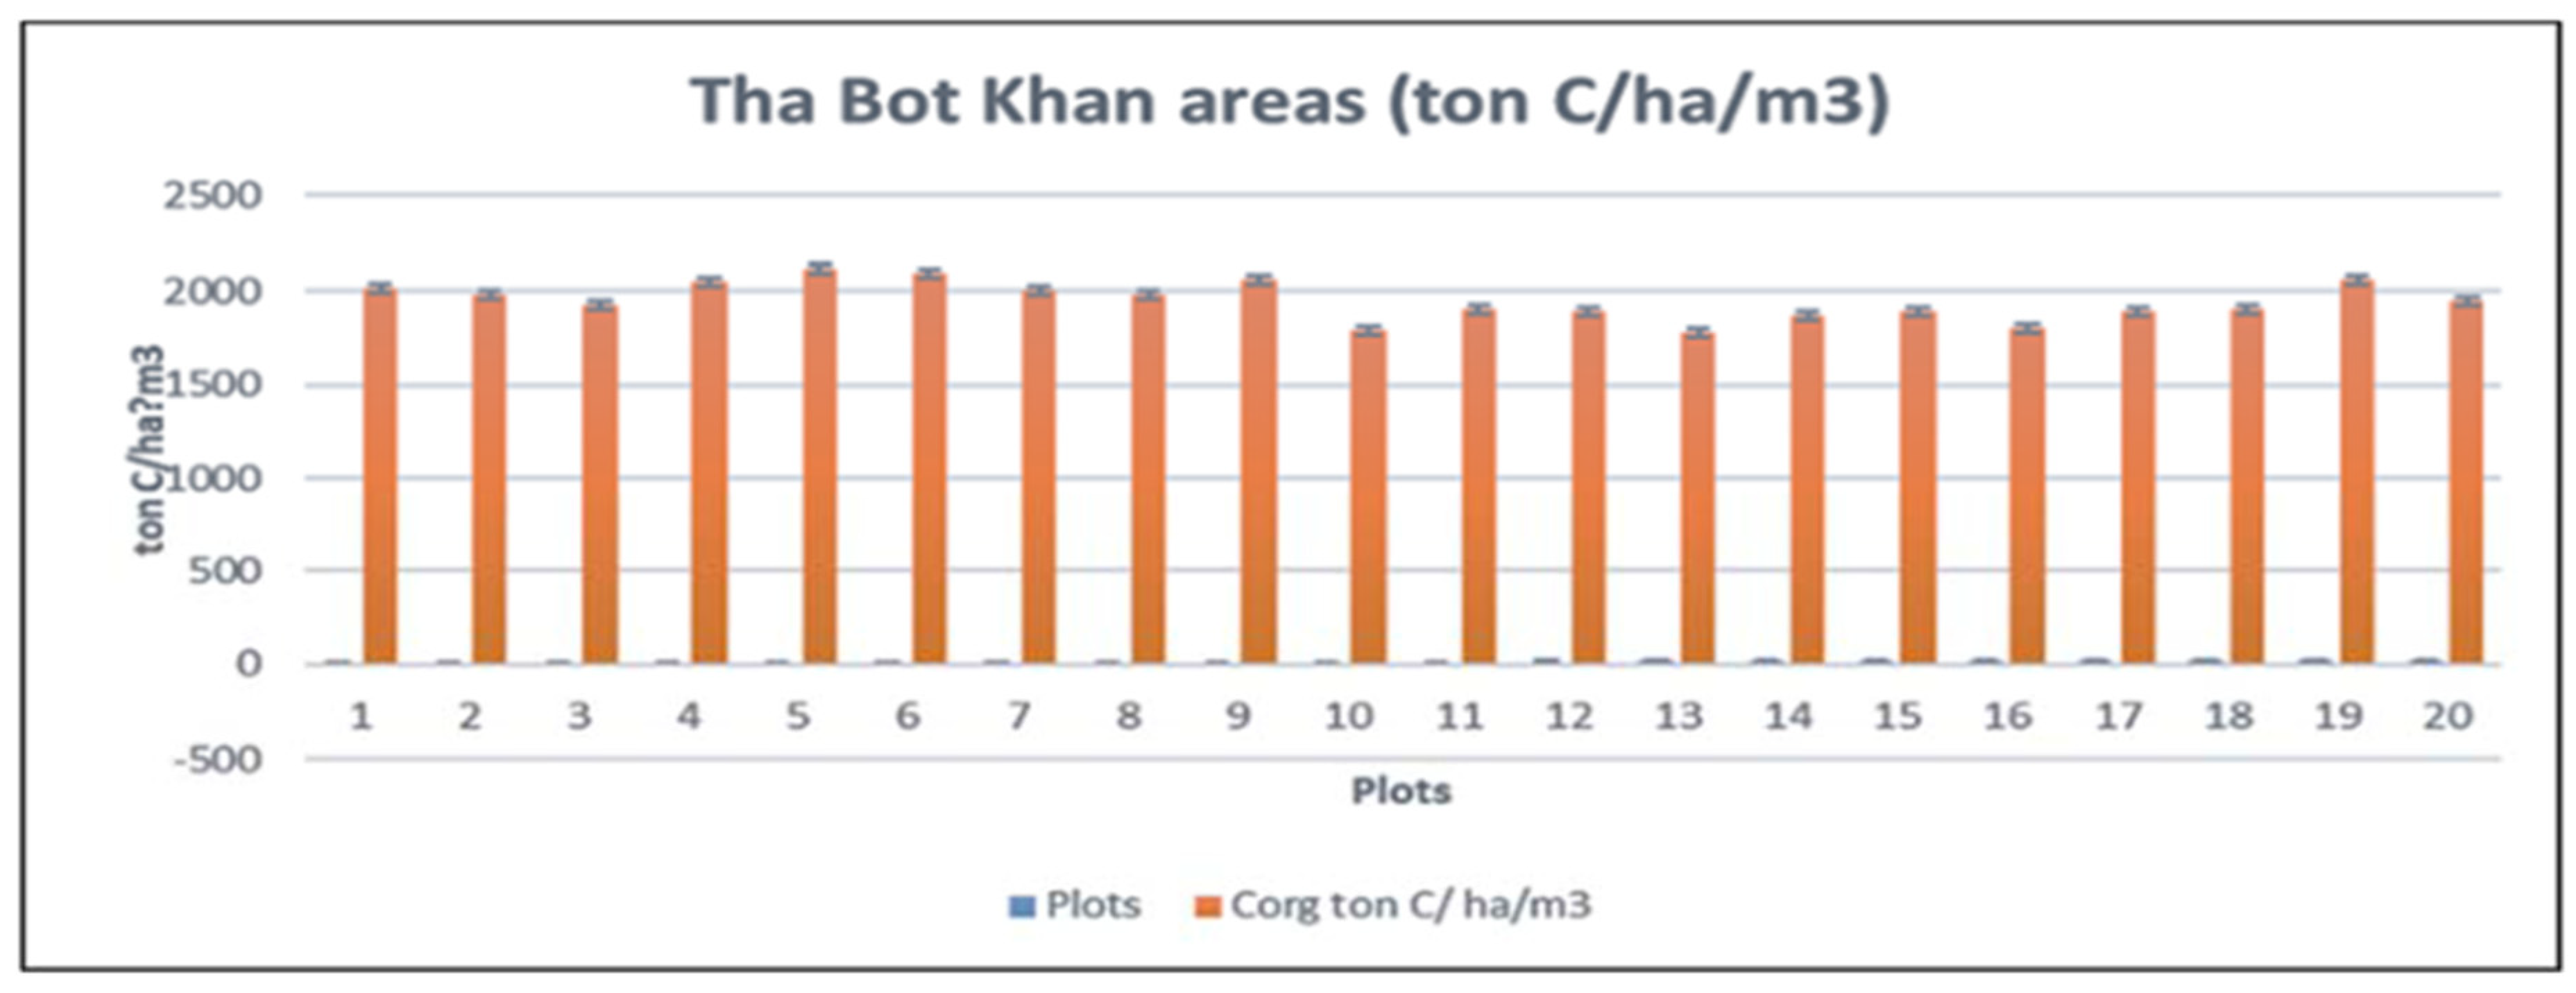
Figure 11.
Soil organic carbon stock in sampling plots. Box model showing SOC stock in the sampling areas of Tha Bot Khan.
Figure 11.
Soil organic carbon stock in sampling plots. Box model showing SOC stock in the sampling areas of Tha Bot Khan.
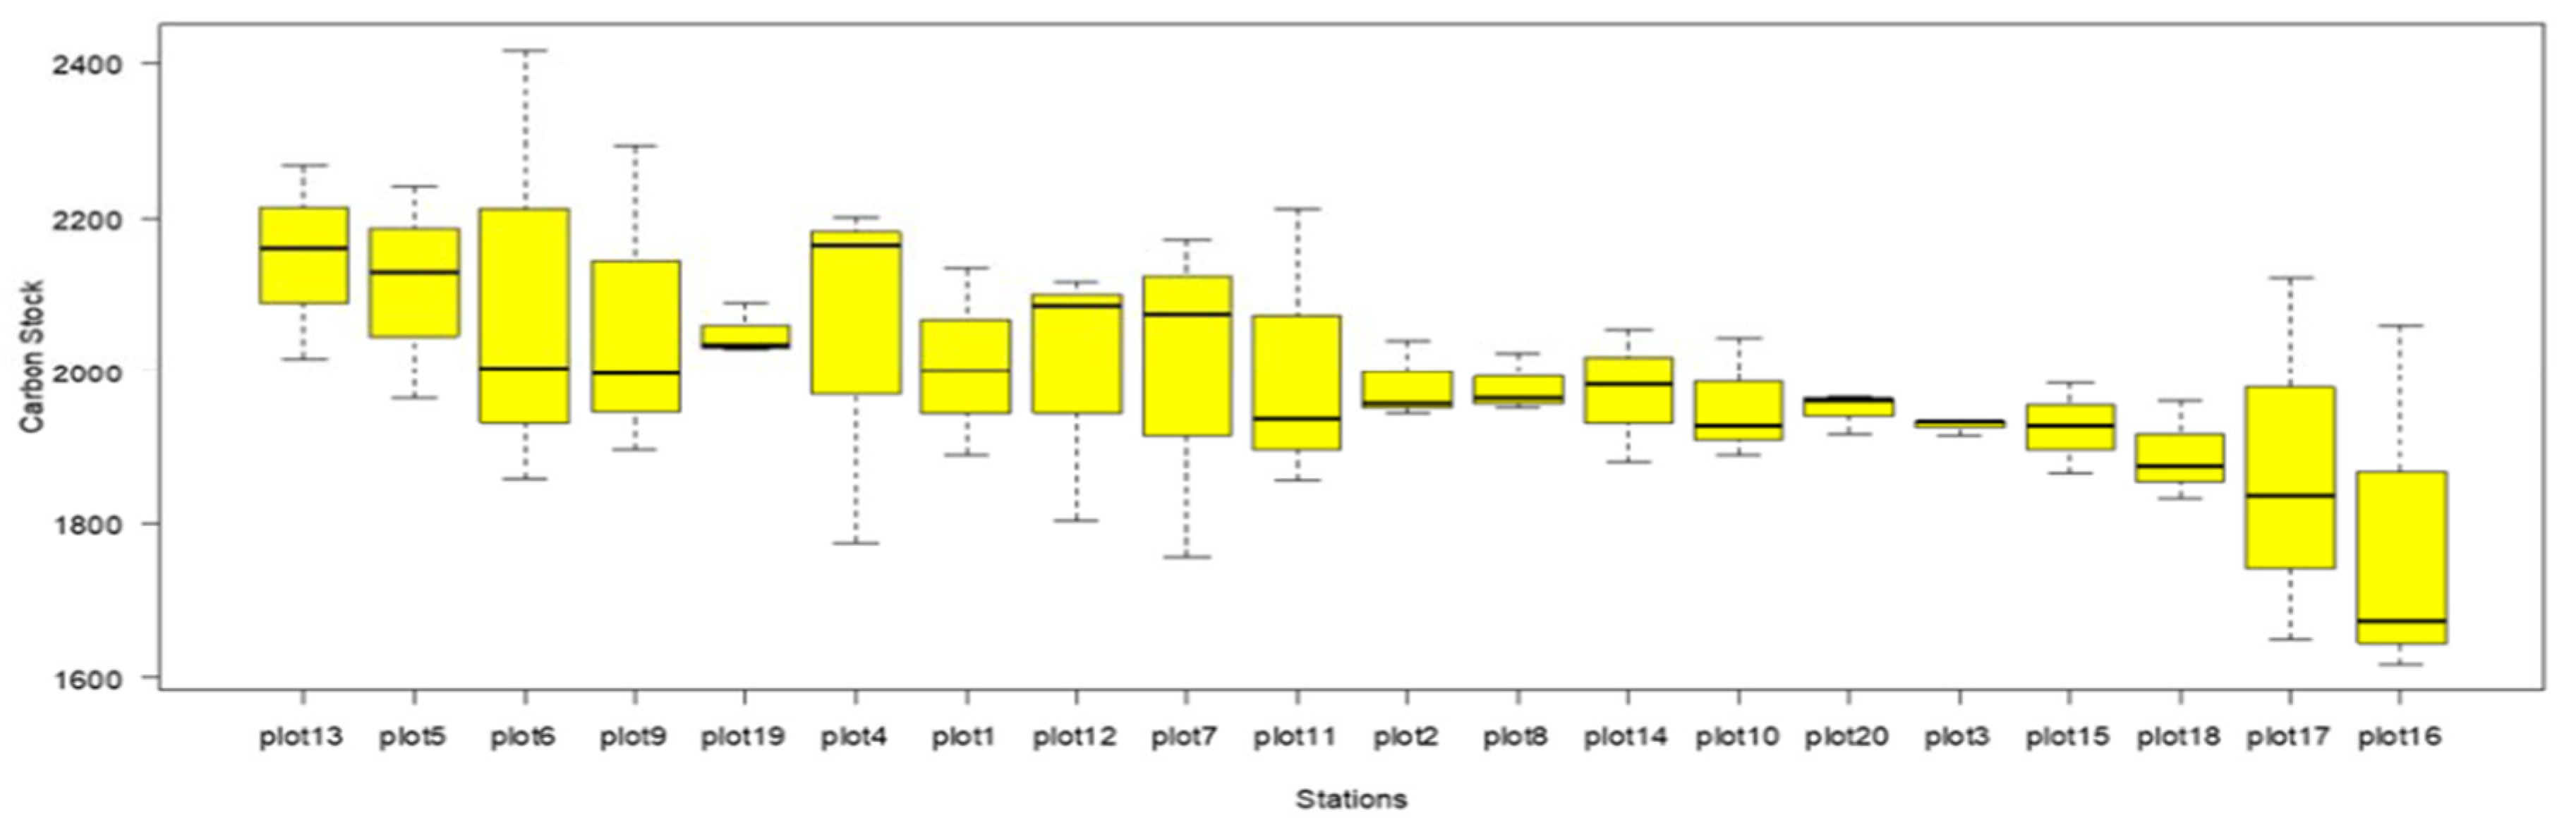
Figure 12.
Relationship of soil bulk density and %C content in Tha-Bot-Khan’s mangrove forest.
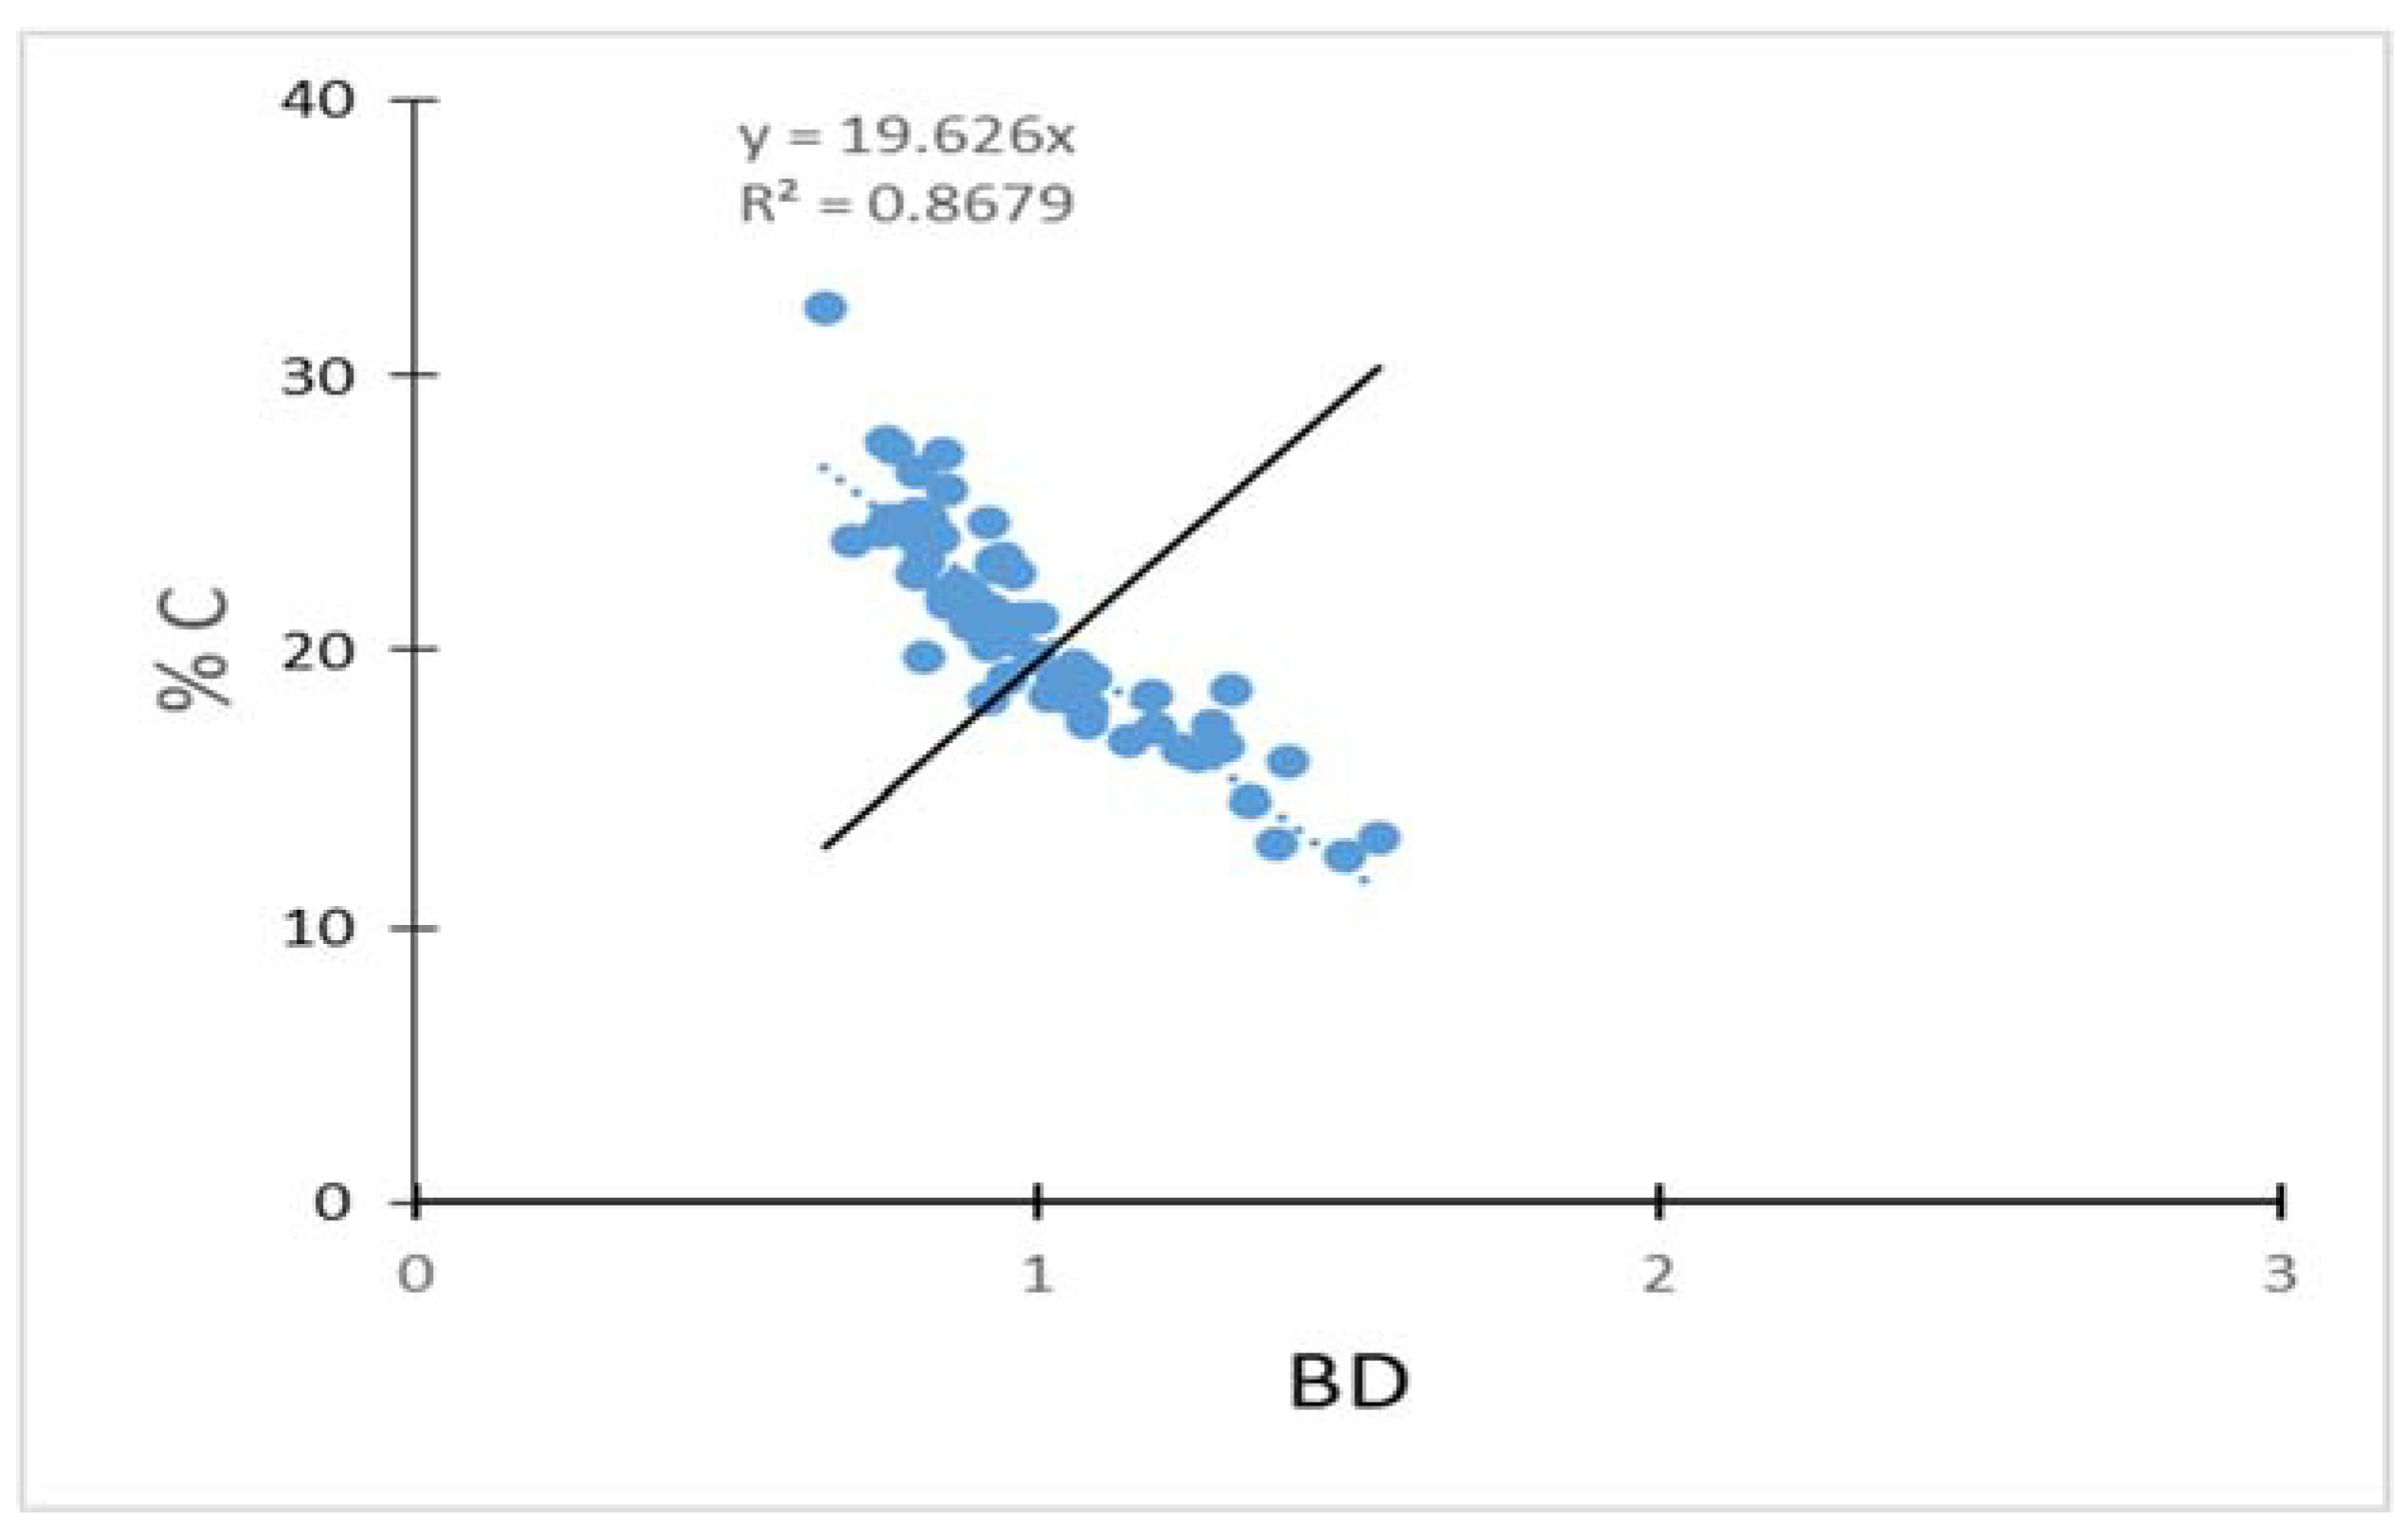
Figure 13.
Comparison of soil organic carbon between sampling plots of Wette areas.
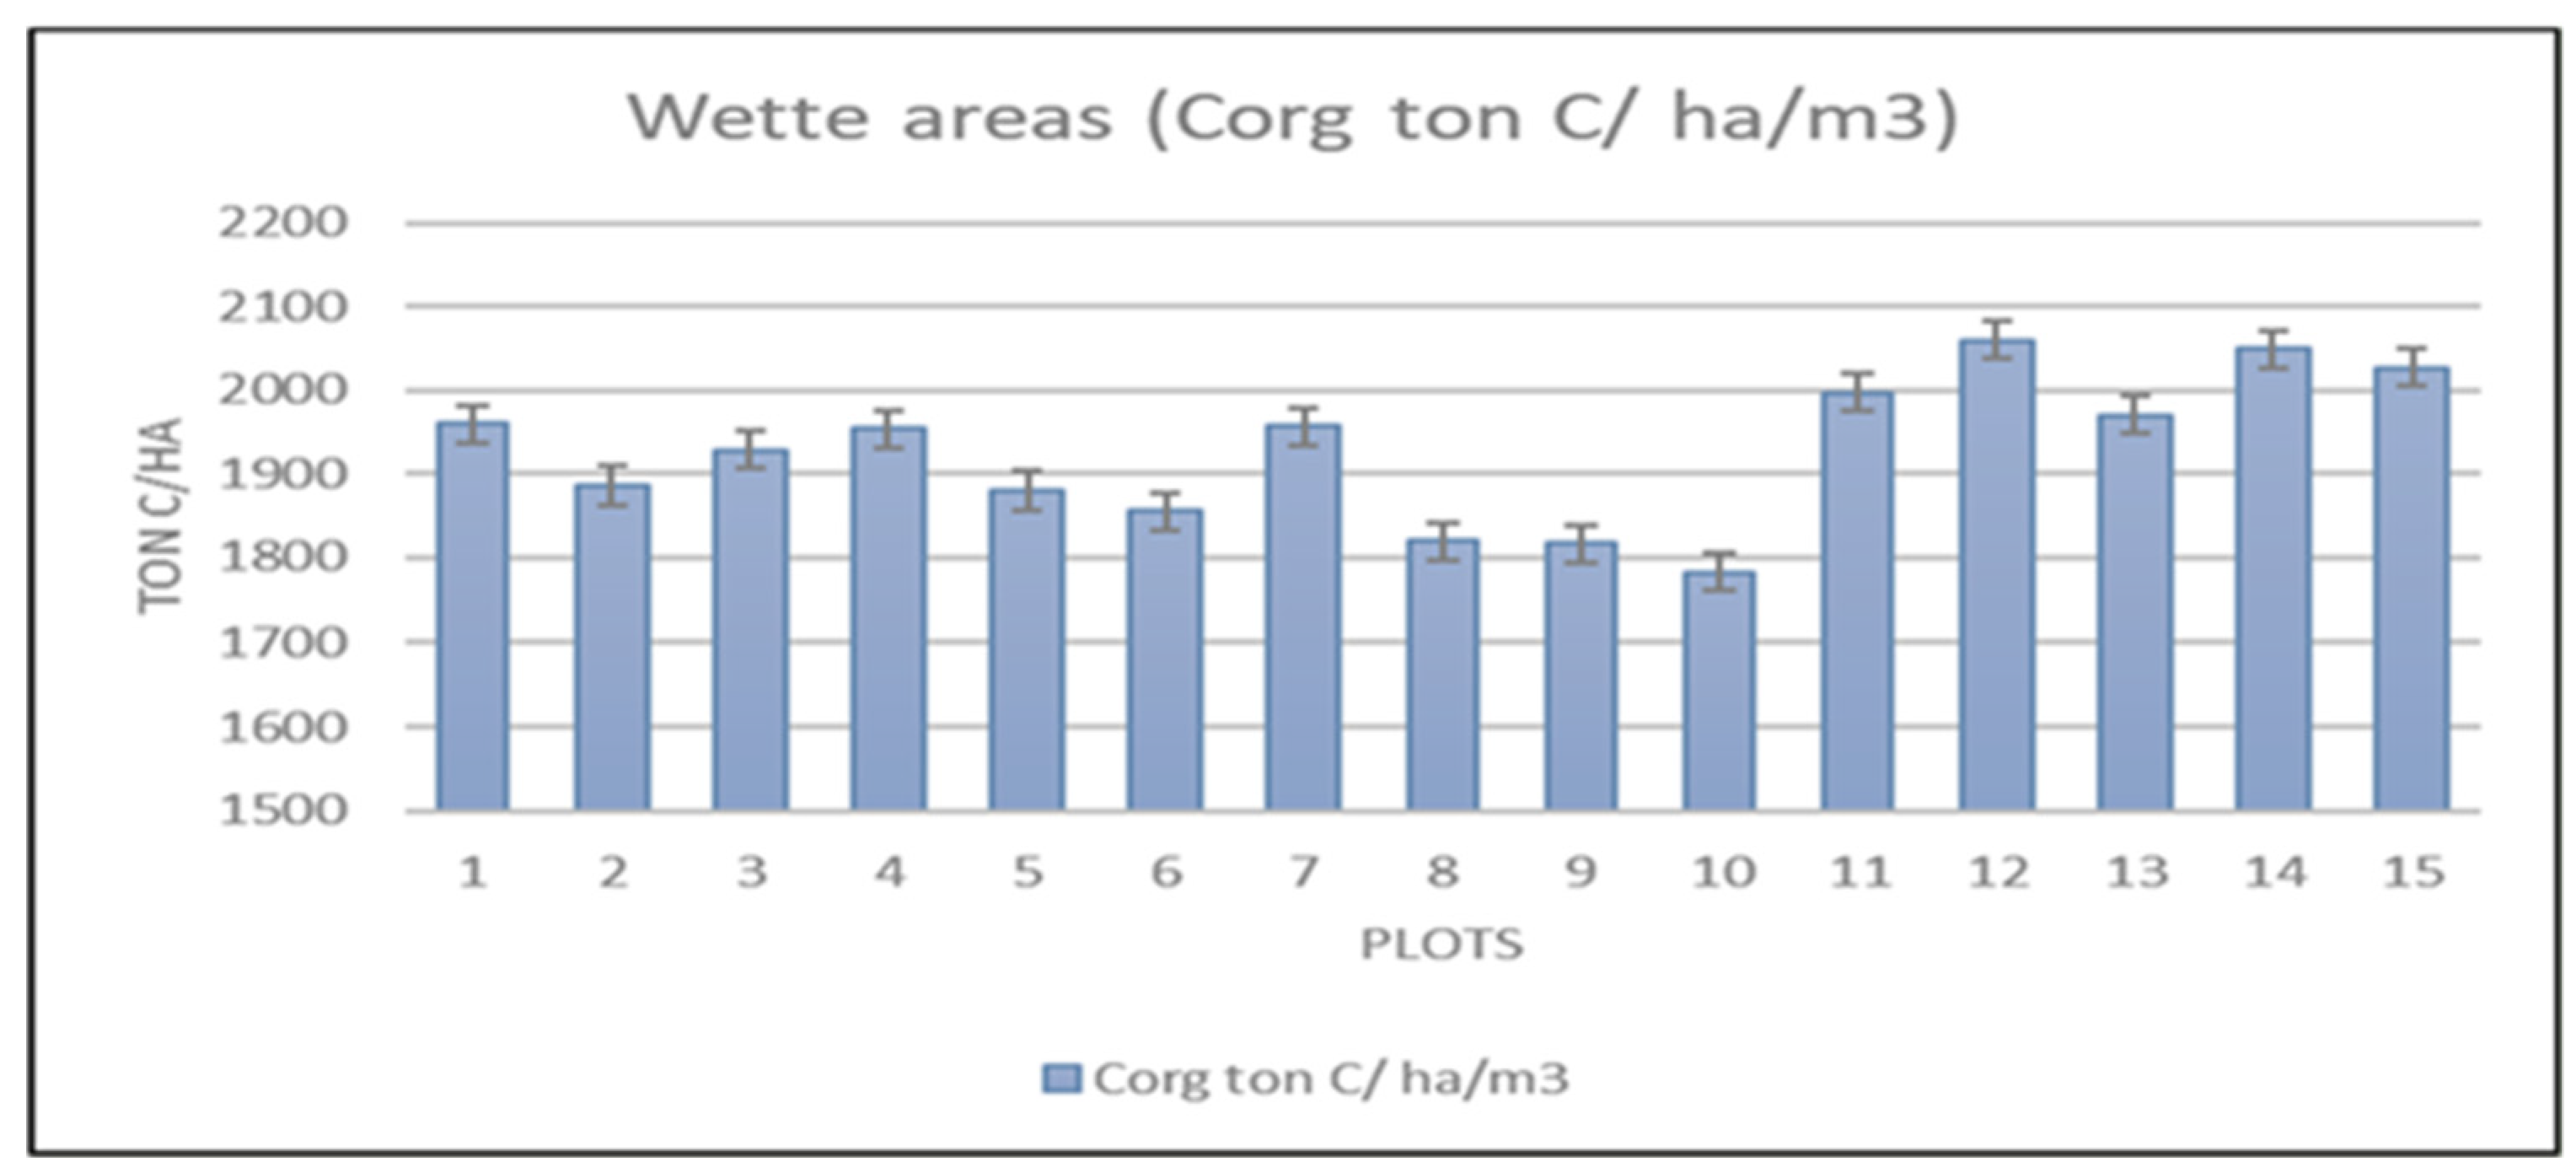
Figure 14.
Soil organic carbon stock in sampling plots. Box model showing SOC stock in sampling areas of Wette.
Figure 14.
Soil organic carbon stock in sampling plots. Box model showing SOC stock in sampling areas of Wette.
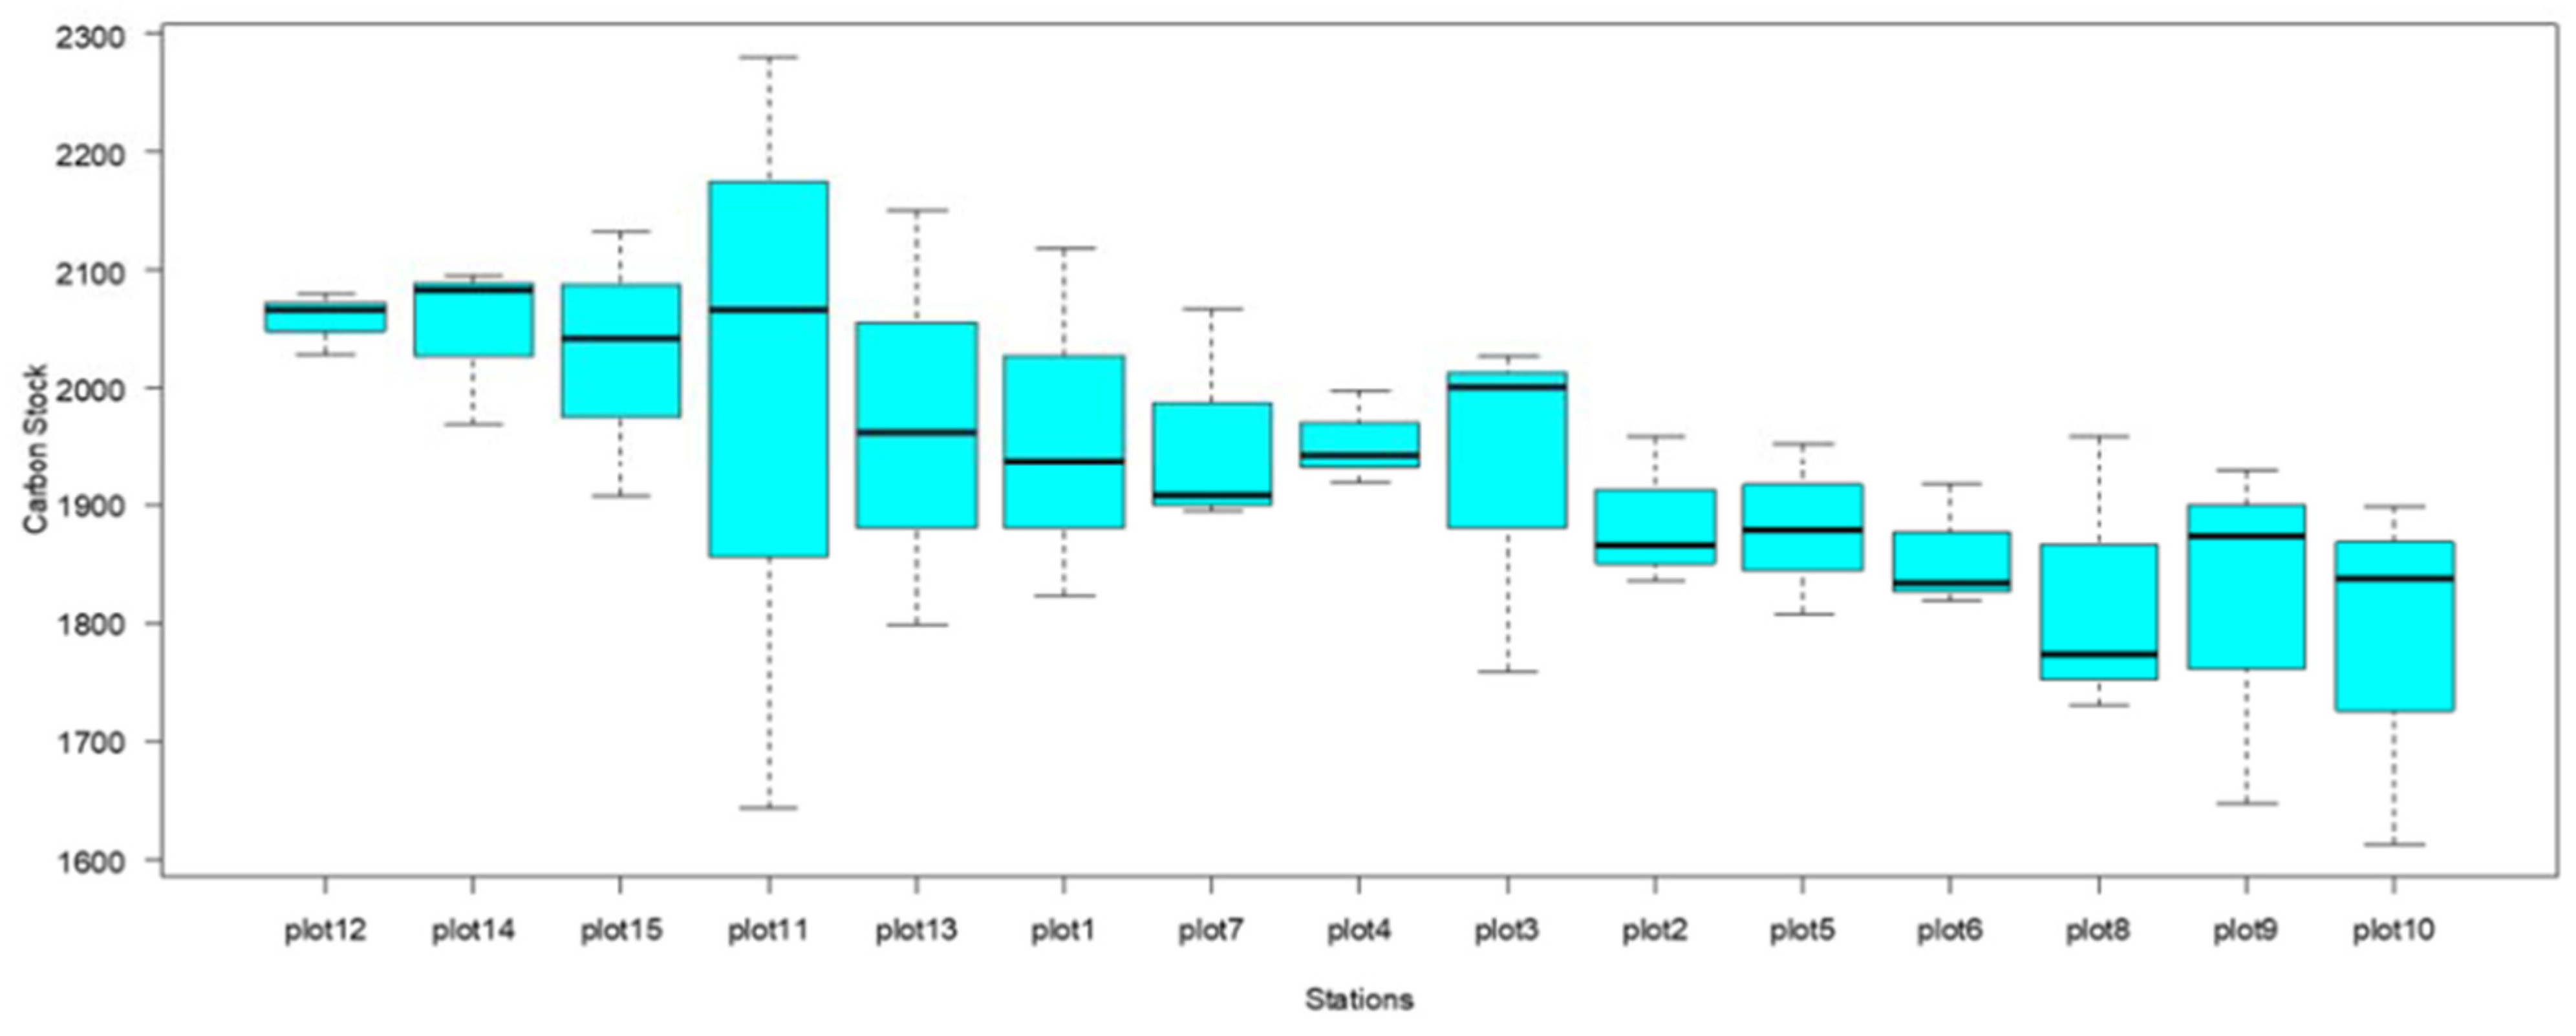
Figure 15.
Relationship of soil bulk density and %C content in Wette’s mangrove forest.
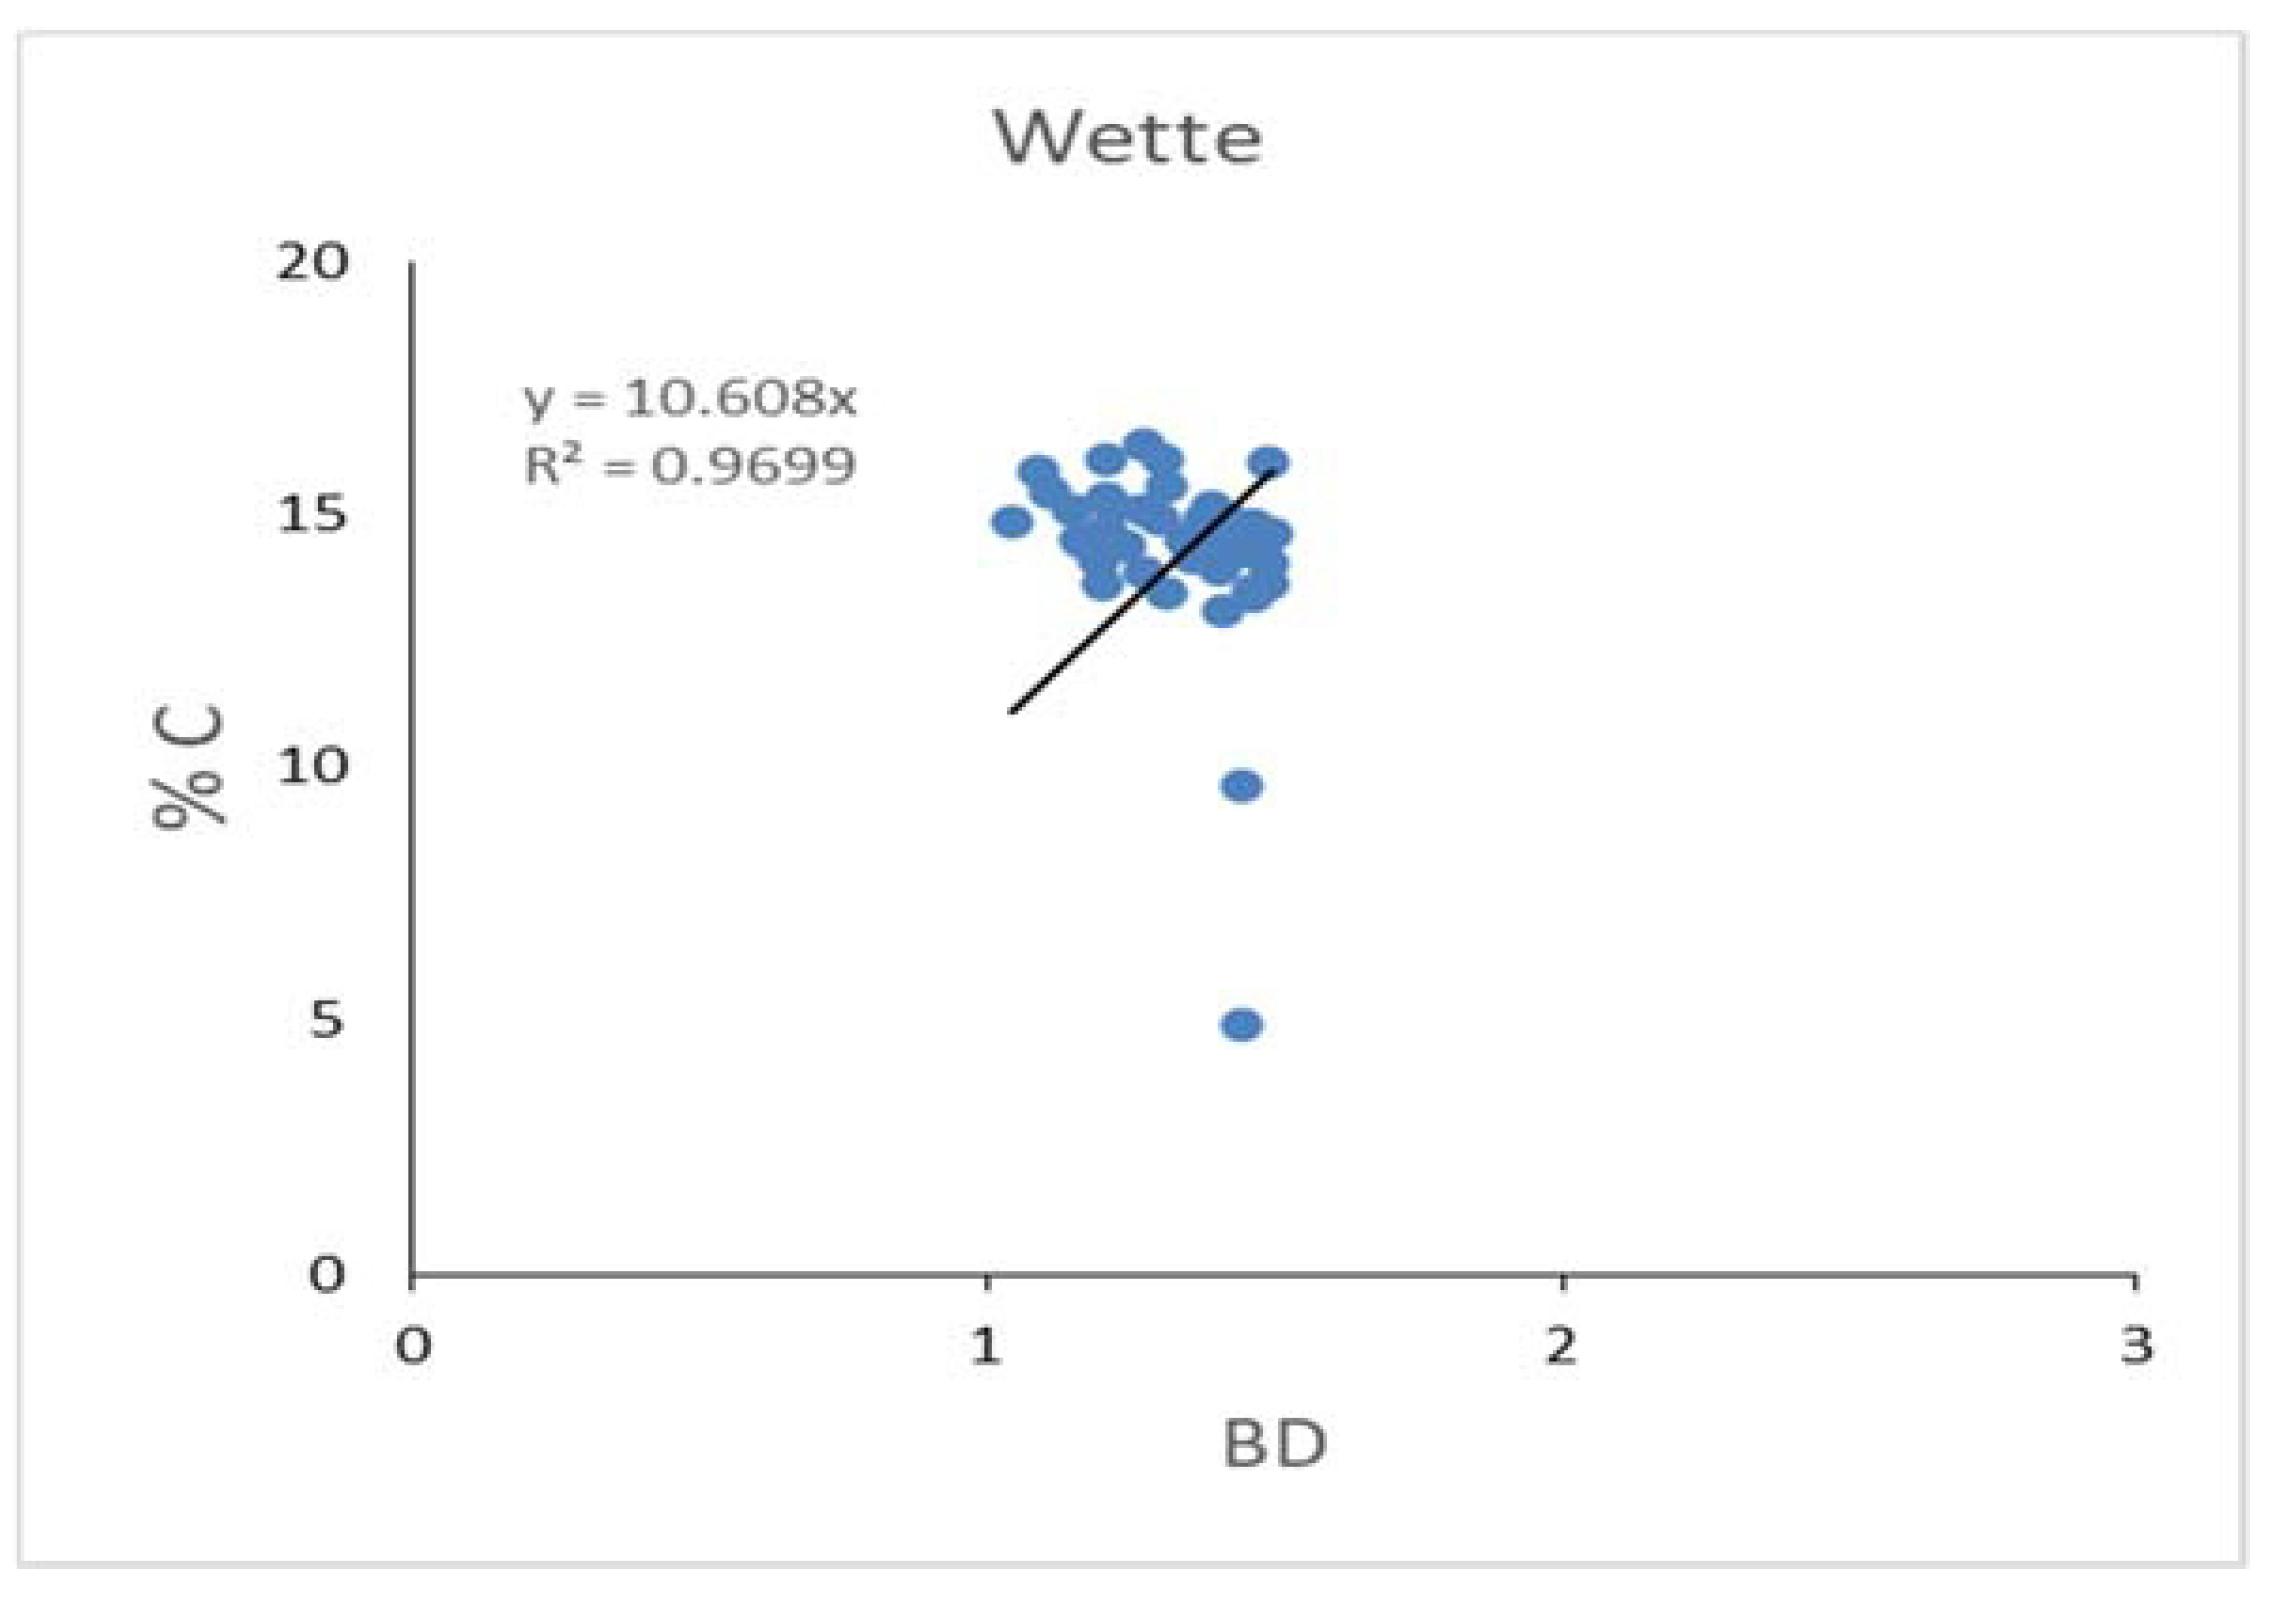
Figure 16.
Soli organic carbon stock in the different areas of Magyi, Tha Bot Khan and Wette.
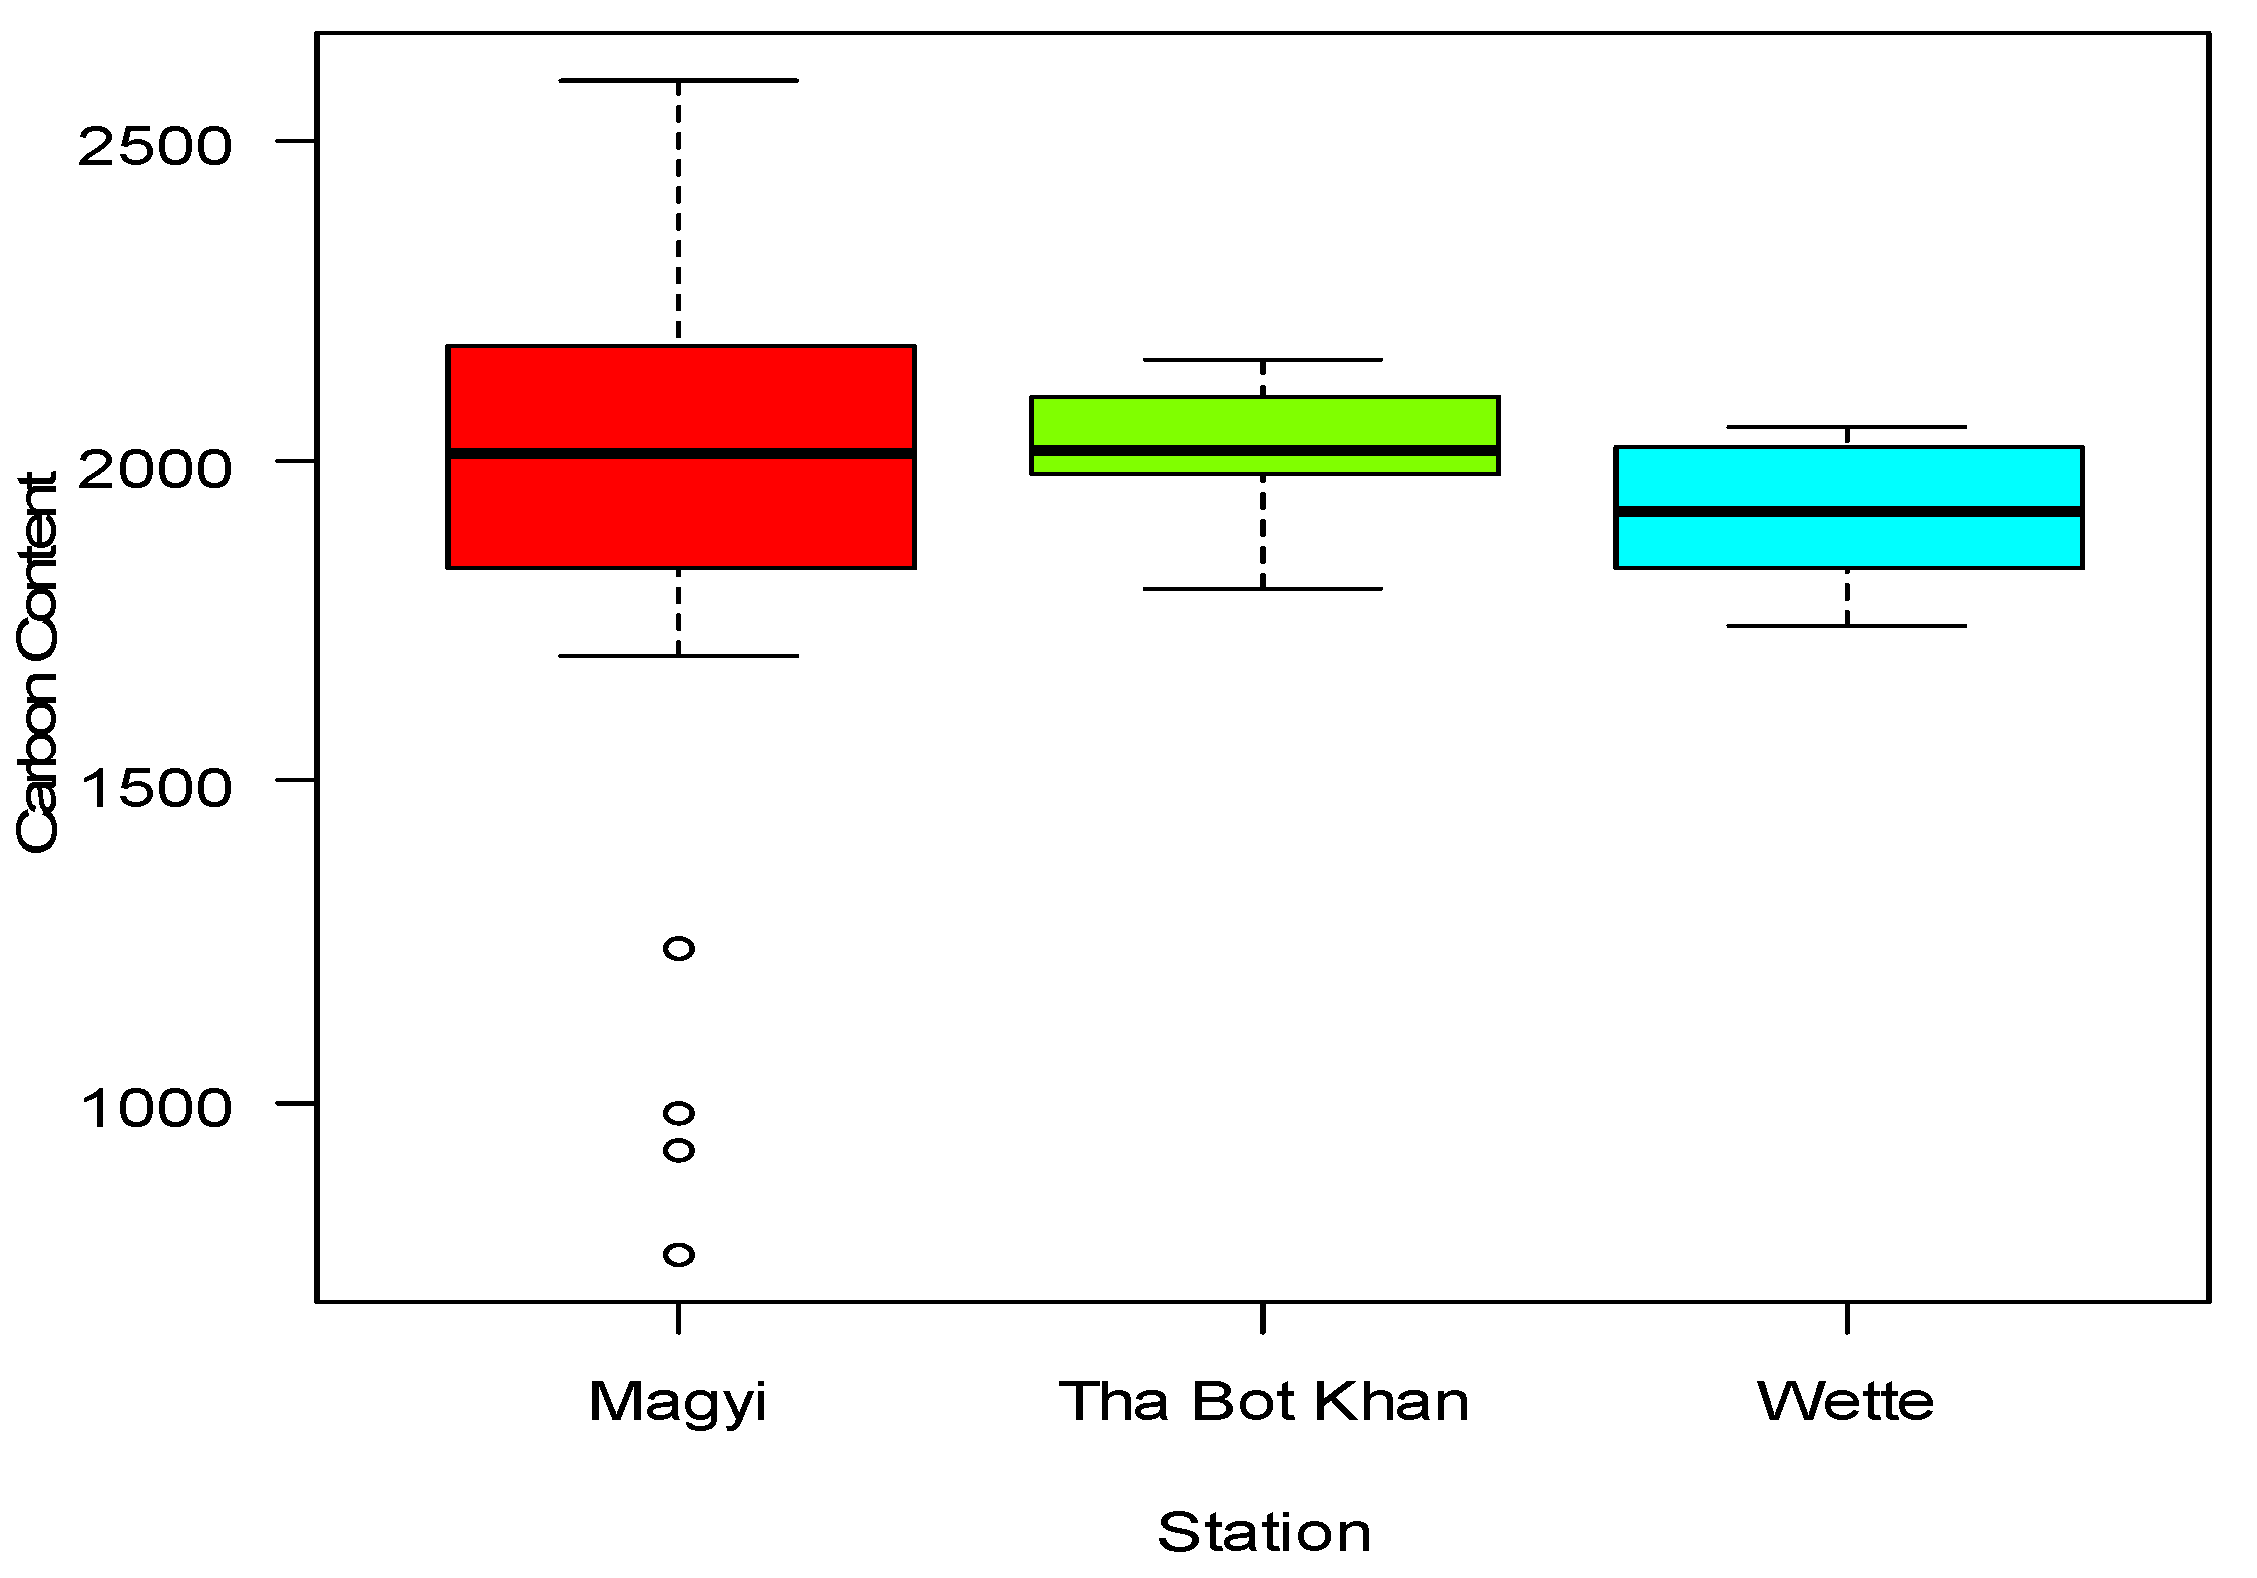
Figure 17.
Increase of C% over time from 2015 to 2021. Error bars represent 1 standard error.
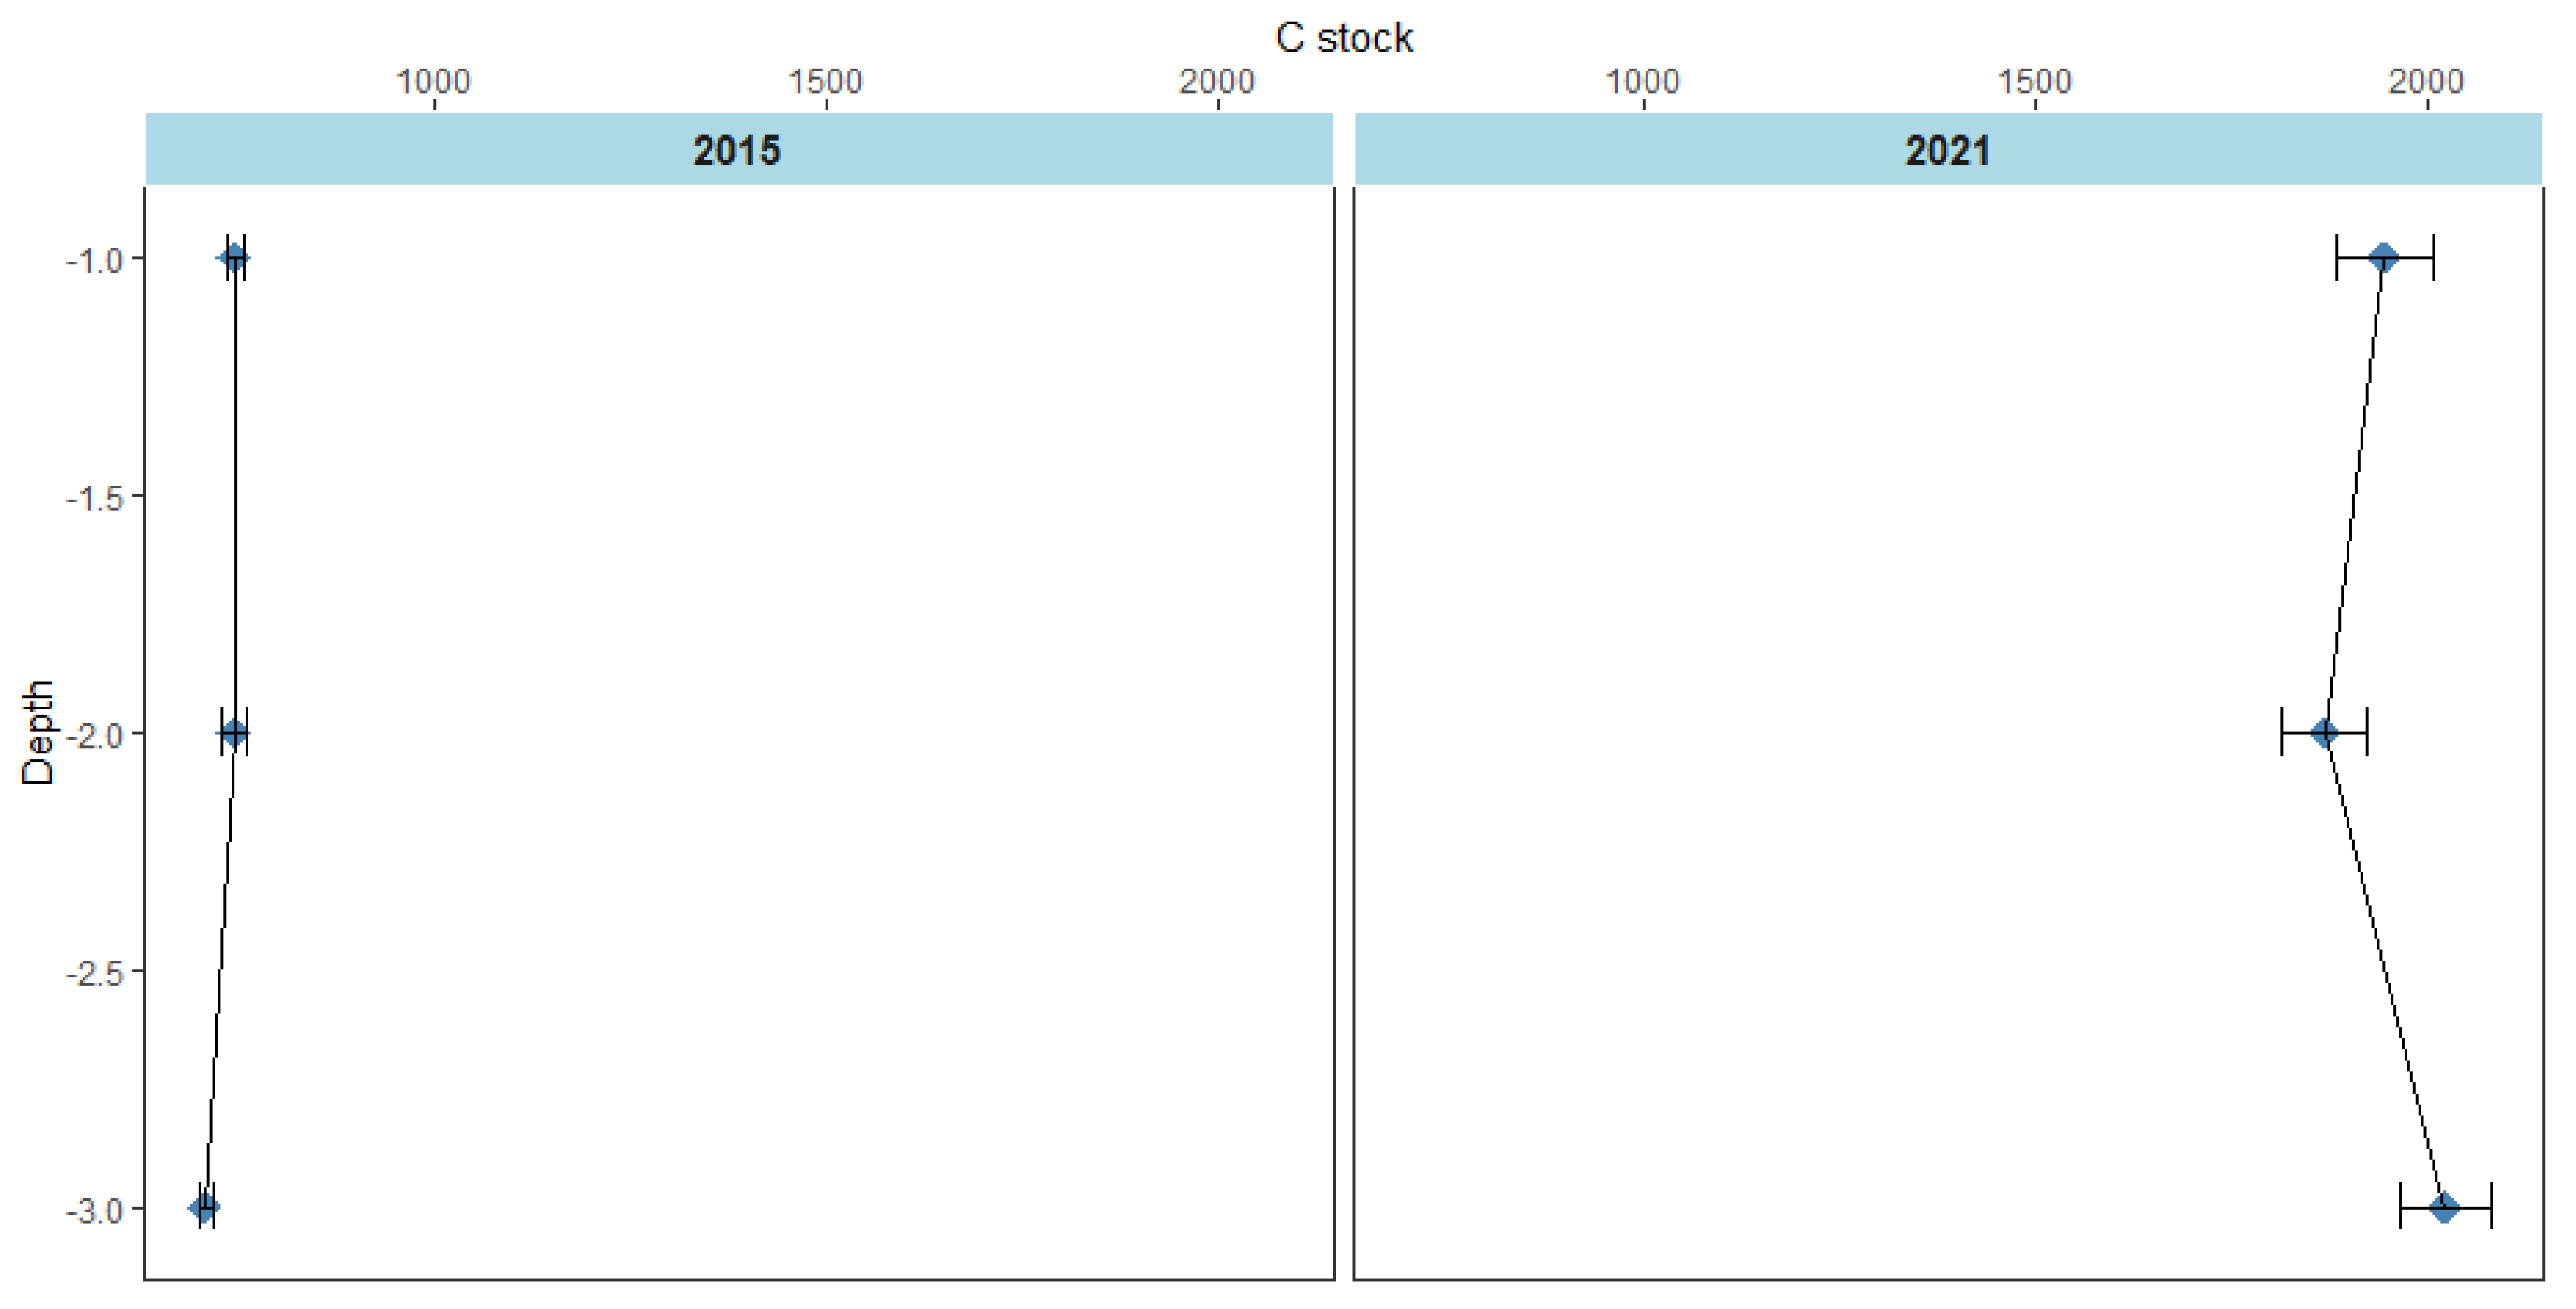
Table 1.
Average carbon percentage and carbon stock of each depth in all stations .
| Depth (ft) | Bulk Density (g/cm3) | %C | C stock (ton/ ha) |
|---|---|---|---|
| 0-1 | 1.02 ± 0.03 | 19.47 ± 0.54 | 1953.07 ± 60.48 |
| 1-2 | 0.93 ± 0.02 | 20.28 ± 0.55 | 1876.90 ± 54.44 |
| 2-3 | 0.92 ± 0.02 | 22.05 ± 0.49 | 2033.32 ± 57.14 |
Values represent mean ± 1 standard deviation, where appropriate.
Disclaimer/Publisher’s Note: The statements, opinions and data contained in all publications are solely those of the individual author(s) and contributor(s) and not of MDPI and/or the editor(s). MDPI and/or the editor(s) disclaim responsibility for any injury to people or property resulting from any ideas, methods, instructions or products referred to in the content. |
© 2023 by the authors. Licensee MDPI, Basel, Switzerland. This article is an open access article distributed under the terms and conditions of the Creative Commons Attribution (CC BY) license (http://creativecommons.org/licenses/by/4.0/).
Copyright: This open access article is published under a Creative Commons CC BY 4.0 license, which permit the free download, distribution, and reuse, provided that the author and preprint are cited in any reuse.


