
Submitted:
10 April 2025
Posted:
11 April 2025
You are already at the latest version
Preprints on COVID-19 and SARS-CoV-2
Abstract
Understanding the long-term dynamics of SARS-CoV-2 neutralizing antibodies is critical for evaluating vaccine-induced protection and informing booster strategies. In this longitudinal study, we analyzed 114 serum samples from 19 individuals across six time points over a three-year period following mRNA vaccination (Comirnaty) and natural SARS-CoV-2 infection. Using pseudotype-based neutralization assays against nine SARS-CoV-2 variants, including major Omicron subvariants (BA.1–BA.5, BQ.1.1, XBB), and anti-S1 IgG ELISA, we observed that antibody levels peaked after the third vaccine dose (mean ELISA ratio ± SD: 8.89 ± 1.65 S/C) and remained relatively stable two years later (mean: 7.53± 1.17 S/C). Neutralization titers rose markedly after the second and third doses, with the highest neutralization observed at two years post-booster. Strong correlations were found between anti-S1 IgG levels and mean neutralization titers for pre-Omicron variants (r = 0.79–0.93; p<0.05), but only moderate for Omicron subvariants (r ≈ 0.50–0.64). Notably, hybrid immunity (vaccination plus infection) resulted in higher neutralization titers at the final time point compared to vaccine-only participants. The lowest neutralization was observed against XBB, underscoring the immune evasiveness of emerging variants. These findings support the importance of booster vaccination and highlight the added durability of hybrid immunity in long-term protection.
Keywords:
SARS-CoV-2
; Pseudotypes
; Neutralization Assays
; Antibodies
; Longitudinal Analysis
1. Introduction
The emergence of the novel SARS-CoV-2 virus in late 2019 introduced an unprecedented challenge to global public health, as the human immune system had never encountered this pathogen before [1]. This led to a rapid and intense worldwide response, with scientists and healthcare institutions collaborating to develop effective vaccines. These vaccines have played a crucial role in curbing the pandemic, significantly reducing infection rates and mortality from COVID-19 [2]. Nonetheless, the virus’s rapid mutation capability leads to the development of new variants, as evidenced by the Delta wave and subsequent Omicron waves, allowing it to evade the immune response generated by vaccination or prior infection [3]. Thus, reinfection with the virus is possible. However, immunisation and previous infection with SARS-CoV-2 have established immunological memory, including neutralising antibodies (NAbs), which can be reactivated upon reinfection, resulting in less severe disease [4].
Immune memory consists of four key components: memory CD8 T cells, memory CD4 T cells, memory B cells, and circulating antibodies (Abs). These elements work together to provide lasting protection against reinfection and severe disease. Memory CD8 T cells eliminate virus-infected cells, reducing viral replication, while memory CD4 T cells enhance both CD8 T cell and B cell responses, ensuring a coordinated immune defence [4,5]. Memory B cells act as long-term reservoirs, rapidly producing high-affinity antibodies upon re-exposure to SARS-CoV-2, while circulating antibodies, mainly IgG and IgA, neutralise the virus before infection occurs [6,7]. These components are crucial for long-lasting immunity, particularly against reinfection and emerging variants. Although antibody levels decline over time, memory B and T cells persist, maintaining protection even as new variants arise [8]. Notably, T cell-mediated immunity remains principally unaffected by spike protein mutations, offering cross-protection [4]. This layered defence highlights the importance of natural infection and vaccination in mitigating COVID-19 severity [4,5].
The SARS-CoV-2 virus is a positive-sense RNA virus that encodes 29 proteins, both structural and nonstructural, including the spike (S), envelope (E), membrane (M), nucleocapsid (N) proteins, and ORF1a/b polyproteins. Glycoprotein S is critical for the immune response and is the major antigen that elicits immunity through vaccination or recovery from COVID-19 [9]. It facilitates the attachment and entry of SARS-CoV-2 into host cells by binding to the angiotensin-converting enzyme 2 (ACE-2) receptor [4]. The primary role of NAbs is to prevent infection by binding to specific antigens, such as the S protein of SARS-CoV-2. By targeting key regions required for the virus to infect host cells, such as the receptor binding domain (RBD), NAbs block the virus from entering cells. In this way, they can effectively neutralise its ability to cause disease [10]. NAbs against SARS-CoV-2 exhibit variable persistence in the bloodstream, influenced by factors such as vaccination, infection, age, and booster doses.
There are three major types of antibodies: IgM, IgA and IgG involved in antiviral immunity [4,11]. IgM are created approximately 4 days after the disease onset and can persist only 17 – 21 days according to disease severity [12]. The estimated half-life of anti-S IgG Abs ranged from 140 to 364 days, and NAbs showed a similar rate of antibody decay [13,14]. Anti-S IgA Abs are estimated to persist in the blood with a half-life of more than 300 days. In contrast, nucleocapsid IgG and IgA binding Abs are short-lived, with an estimated half-life of 90 days [5,13]. This suggests that the antigen (S vs N) is a crucial component influencing antibody durability. Interestingly, infants infected with SARS-CoV-2 have shown that IgG anti-S Abs can persist in the blood for more than 800 days, suggesting that age may also be an essential factor in influencing antibody persistence [13,15,16].
Various longitudinal studies have investigated the persistence of neutralising antibodies in sera samples, their ability to maintain effectiveness over time, and their response to newly emerging variants. Some studies have specifically analysed differences between vaccinated, previously infected, and hybrid immunity (vaccinated and infected) cohorts [13,17,18,19]. Although vaccine-induced immunity offers strong initial protection, antibody levels decline over time. Booster doses have been shown to restore and broaden neutralising responses, particularly in vulnerable populations with underlying conditions or immunodeficiency [20,21,22].
During the COVID-19 pandemic, pseudotyped viruses became widely used as safe and standardized alternatives to live SARS-CoV-2 for studying viral entry and evaluating vaccine efficacy via pseudotype-based neutralisation assays. Their main advantage lies in eliminating the need for BSL-3 laboratories, as the assays can be safely conducted under BSL-2 conditions in a rapid and high-throughput manner.To monitor the neutralisation ability of sera samples, we used neutralisation assays based on the recombinant vesicular stomatitis virus (rVSV) pseudotyped system, which can imitate the SARS-CoV-2 virus by coating its surface with the S protein of the targeted variant. rVSV is replicable deficient (rVSV∆G) because it lacks the gene for the G protein, which is necessary for replication [23,24,25].
The long-term dynamics and persistence of the elicited neutralizing antibody responses are critical factors in understanding the durability of protection and informing future vaccination strategies against both the original virus and emerging variants This study aims to provide a comprehensive picture of the dynamics of neutralising antibodies generated after vaccination and recovery from COVID-19. The obtained data provide a valuable addition to the body of information on the long-term neutralising capacity of antibodies to SARS-CoV-2.
2. Materials and Methods
2.1. Participants
Participants (5M/14F) aged 26-59 years (mean 41.4 ± 9.4 years; median 44.0 years) were voluntarily recruited from the employees of the Biomedical Research Center of the Slovak Academy of Sciences. Blood serum samples were collected from 19 individuals who had received at least three doses of the COVID-19 mRNA vaccine Comirnaty (Pfizer/BioNTech) between 2021 and 2023. Three participants also received a fourth dose during the the study period. Each participant provided six serum samples, totalling 114 serum samples. Blood was drawn at six time points (Figure 1): T1) three weeks after the first vaccine dose, T2) approximately one month after the second dose, T3) three to four months after the second dose, T4) six to eight months after the second dose, T5) two weeks after the third dose, and T6) two years after the third dose.
Between these time points, 15 participants contracted COVID-19 once or twice, caused by different SARS-CoV-2 variants. Among the 15 participants who contracted SARS-CoV-2, 13 were infected between timepoints T5 and T6, and two between T4 and T5. Thirteen of these infections occurred between T5 and T6, and two between T4 and T5. Only four respondents (all with three vaccine doses) reported never having been infected. The dates of positive PCR tests, along with dates of vaccinations, identified variants and course of disease, are listed in Supplementary Table 1. The severity of COVID-19 symptoms was categorized as very mild, mild, or moderate. Very mild cases included no fever or fever up to 38°C, with symptoms lasting 3 to 5 days. Mild cases involved fever above 38°C or prolonged low-grade fever, possibly accompanied by additional symptoms such as fatigue or joint pain, and lasted approximately 7 days. Moderate cases were characterized by high fever and more severe symptoms persisting for more than 7 days. The course of the pandemic in Slovakia, along with the indicated vaccination and blood collection time points, is summarized in Figure 1.
2.2. Plasmids
Plasmids carrying sequences of the S protein from various SARS-CoV-2 variants were generously provided by Addgene and David Nemazee (RRIDs: Addgene_170442, 170451, 172320, 180375, 194494, 194493]), Alejandro Balazs (169467), and Marceline Côté (18603).
2.3. Cell lines
We used BHK21 cells (ATCC, CCL-10), Vero E6 cells stably expressing human ACE2 and TMPRSS2 (BEI NR-54970) and 293FT cells stably expressing T7 polymerase and VSVG (293FT-VSVG-T7pol) [27] using the Sleeping Beauty transposon plasmid expression system [28] kindly provided by Dr. Ivan Kosik, Dr. Thiasheng Li and Dr. Jon Yewdell (NIAID, NIH, USA). All cell lines were maintained in low-glucose Dulbecco´s Modified Eagle Meduium (Biosera, Cholet, France) supplemented with 10% Fetal Bovine Serum (FBS) (Gibco), 100 µg/ml Penicillin-Streptomycin-Amphotermicin B (PSA), 50 µg/ml Gentamicin Sulfate (Thermo Fisher Scientific Inc.).
2.4. SARS-CoV-2 Spike protein Pseudotype-based neutralization assay
Recombinant rVSVΔG-GFP-G virus (Kerafast) was prepared in 293T7-VSVG cells (MOI = 5). Viral titration was performed on BHK21 cells as described previously [24,25]. To produce SARS-CoV-2 pseudotyped viruses, BHK21 cells were transfected with S protein-encoding plasmids using TurboFect (Thermo Fisher Scientific) and incubated 24 h at 37°C. Cells were then infected with rVSVΔG-GFP-G (MOI = 5) and incubated overnight. Anti-VSV-G antibody (1 µg/ml) was added to neutralize residual parental virus. rVSVΔG-GFP-S particles were harvested upon GFP expression and cytopathic effect after 24–48 h, and stored at –80°C [24,25,29].
For pseudotype-based neutralisation assay, Vero E6 ACE2/TMPRSS2 cells (19,000/well) were seeded in 96-well plates. Sera were diluted two-fold in serum-free DMEM, mixed with pseudovirus (MOI = 0.1), and incubated for 1 h at 37°C. The mixtures were transferred to cell monolayers and incubated for 20 – 24 h. Neutralisation was assessed by GFP fluorescence microscopy; ImageJ was used to quantify fluorescent foci. Infection rates were normalized to positive controls, and NT50 values calculated using the log-logistic model in R (`drc` package) [30]. Plots were generated with `ggplot2` [31]. Detailed description of the whole procedure is provided in Supplementary methods.
2.5. anti-SARS-CoV-2 S1 IgG enzyme-linked immunosorbent assay (ELISA)
To assess antibody responses, we used a semiquantitative anti-SARS-CoV-2 IgG ELISA targeting the S1 subunit of the SARS-CoV-2 spike protein (EuroImmun Medizinische Labordiagnostika AG, Lübeck, Germany) according to manufacturer’s instructions. Results were expressed as sample/calibrator OD ratios. According to manufacturer criteria, ratios < 0.8 were negative, 0.8–1.0 borderline, and >1.1 positive. Borderline values were considered positive as in Kajanová et al. [32,33].
2.6. Statistical analysis
The 50% neutralization titer (NT50) was determined using a four-parameter log-logistic dose-response model implemented in the drc package in R software. The dose-response model (drm) function was used to fit the model, and ED50() extracted NT50 values. Neutralization curves were visualized using ggplot2, with fitted curves generated by geom_smooth.
Statistical analyses of the obtained data were performed using GraphPad Prism 10.4.1. (Boston, MA, USA) and IBM SPSS Statistics version 26 (SPSS Inc., Chicago, IL, USA). The data were tested for normal distribution using Shapiro-Wilk test and the appropriate statistical tests were then used. Changes in antibody levels over time were analysed using the repeated measures ANOVA with Bonferoni post hoc test. The paired t-test was used to analyse the change in antibody levels between T5 and T6 in infected and uninfected subgroups of volunteers. Pearson or Spearman correlation coefficients r with 95% CI were calculated to examine the association of anti-S1 IgG antibody levels and neutralising antibody titers. All values are expressed as mean ± standard deviation unless stated otherwise. A p value of less than 0.05 was considered statistically significant.
3. Results
3.1. Correlation of anti-SARS-CoV-2-S1 IgG antibodies with neutralisation titers
Altogether, a total of 114 serum samples from 19 participants were analysed for the presence of neutralizing antibodies to nine SARS-CoV-2 variants and sub-variants (B.1, B.1.1.7, B.1.617.2, B.1.351, BA.1, BA.2, BA.4/5, BQ.1.1, XBB). Thus, this study assessed the presence of neutralising antibodies against virus variants that that had not yet emerged at the time of serum collection (e.g., BA.1, BA.2, BA.4/5, BQ.1.1, XBB for the first five sample collections). The overall changes in neutralization titers against the nine variants over time are presented as a heatmap of mean titers in Figure 2, while the individual kinetics of neutralization titers for each participant are shown in Supplementary Figure S1.
Besides neutralisation assays, all serum samples were analysed by ELISA detecting IgG antibodies targeting the S1 subunit of the SARS-CoV-2 S protein (Figure 3). Following the first vaccine dose, the mean anti-S1 IgG antibody level was approximately 3.05± 1.23 S/C, indicating a relatively low response. After the second dose, antibody levels rose significantly (p<0.001) to an average of 7.6 ± 0.81 S/C within a few weeks. However, a gradual decline followed, with levels dropping to an average of 5.18 S/C after 3-4 months and 3.38 ± 1.35 S/C after 6-8 months. A significant increase (p<0.001) was observed after the third vaccine dose, with antibody levels peaking at 8.89 ± 1.65 S/C. These levels remained relatively stable over the next two years, averaging 7.53 ± 1.17 S/C (Figure 3).
Pearson correlation analysis was conducted to evaluate the relationship between mean neutralizing antibody titers and anti-S1-IgG antibody levels measured by ELISA (Figure 4). The calculated correlation coefficients (r) showed significant differences between SARS-CoV-2 variants. For pre-Omicron variants, a strong correlation was observed (B.1, r = 0.93; B.1.1.7, r = 0.84; B.1.617.2, r = 0.79; B.1.351, r = 0.92), reflecting a consistent relationship between antibody titers and neutralization potential. In contrast, for Omicron variants, correlation coefficient values around 0.5 indicated a moderate correlation (BA.1, r = 0.64; BA.2, r = 0.57; BA.4/5, r = 0.55; BQ.1.1, r = 0.54; XBB, r = 0.50). These findings suggest that the extensive accumulation of novel mutations in Omicron variants significantly impacts viral neutralization, particularly when immunity was induced through vaccination against the genuine B.1 variant.
3.2. Neutralization Trends Across Virus Variants
The neutralization capacity varied markedly depending on the vaccination dose and prior SARS-CoV-2 infections and analysed variants (Figure 5). The weakest neutralization was observed after the first vaccine dose (T1). A substantial (p<0.01) increase in neutralization capacity followed the second dose, with serum samples from the T2 effectively neutralizing pre-Omicron variants (B.1, B.1.1.7, B.1.617.2) with non-significant increase in neutralization capacity for B.1.351 and the Omicron variants (BA.1, BA.2, BA.4/5, BQ.1.1; XBB). Three to four months after the second dose (T3), neutralization capacity significantly declined for pre-Omicron variants, while showing limited ability to neutralize Omicron variants. Six to eight months post-second dose (T4), neutralization capacity further decreased for pre-Omicron variants, with no detectable activity against Omicron variants. Two to four weeks after the third dose (T5), neutralization titers markedly increased (p<0.01 – p<0.001), particularly against pre-Omicron variants, but also showed a noticeable improvement for all Omicron variants (p<0.01). By two years post-third dose (T6), neutralization titers had relatively stabilized and did not show such a significant decline as three months after the second vaccine dose. The serum samples from the last collection (2 years post 3rd vaccine dose, T6) showed overall highest neutralisation capacity across all variants. At that time, most of the respondents experienced at least one clinically noticeable COVID-19 attributable to Omicron infections (n = 13) or Delta and then Omicron infections (n = 2), while only four reported no infection. The lowest neutralisation capacity was observed against the XBB variant, a recombinant virus of two BA.2 descendants, BJ.1 and BM.1.1.1 [34].
The most substantial drop in the neutralisation ability was observed in the sera taken 6 – 8 months (T4) after the second vaccine dose in comparison with the sera taken 1 month after the second vaccine dose (T2; Figure 6). This decline, occurring just before arrival of the Delta wave, is also visible in the overall reduction in anti-S1 IgG antibody levels (Figure 4A). In contrast, after the third vaccine, even after two years (T6), and even for those without clinical disease, neutralisation titers did not show such a marked decline as three months after the second vaccine dose. These findings confirm the importance of the 3rd (booster) vaccine dose in sustaining long-lasting neutralising immunity.
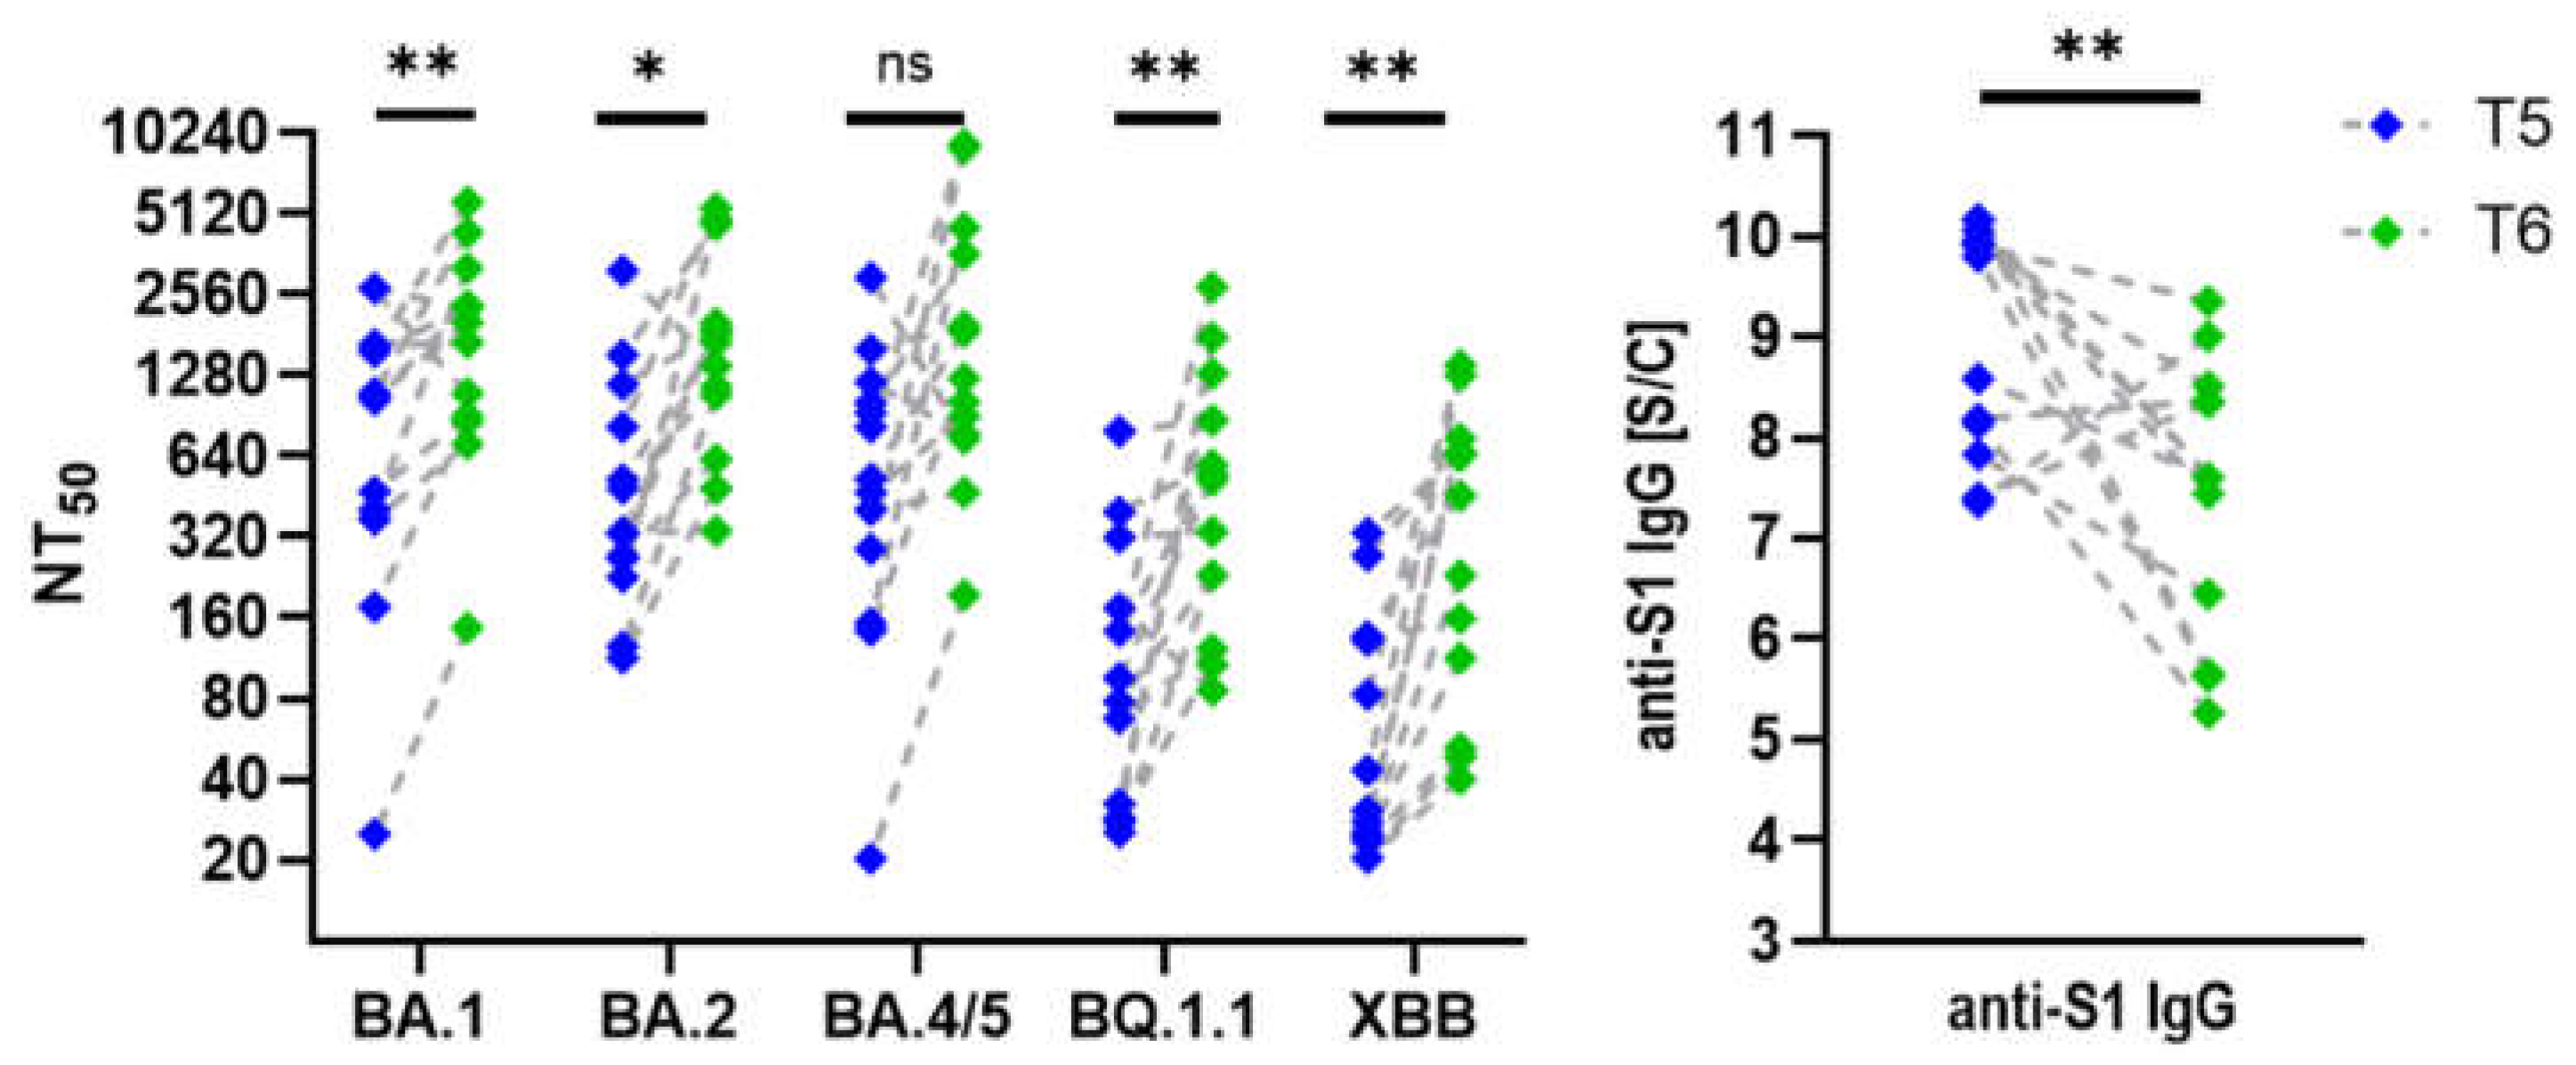
Interestingly, participants vaccinated three times and infected at least once with an Omicron variant displayed slightly higher neutralisation titers in their most recent serum collection (T6) despite a significant decline (p=0.002) in anti-S1 IgG levels (Figure 7). In individuals who received three vaccine doses but did not contract SARS-CoV-2, neutralisation titers against Omicron variants did not increase as markedly as in those who experienced clinical infection, but nevertheless remained stable over the two-year period following the third dose. Trends highlight the effect of hybrid immunity versus vaccination alone on long-term neutralisation capacity and antibody levels.
In summary, a significant increase in neutralization titers was observed after the second and third doses, particularly against pre-Omicron variants. In contrast, titers against Omicron subvariants remain much lower or even undetectable, highlighting strong immune evasion. Nevertheless, the third vaccine dose and natural infection contributed to improved long-term immunity, as evidenced by sustained titers at the two-year mark.
4. Discussion
This study provides a comprehensive longitudinal analysis of the humoral immune response following mRNA vaccination and natural SARS-CoV-2 infection. By assessing neutralizing antibody titers against multiple SARS-CoV-2 variants, including those that had not yet emerged at the time of serum collection, we gained valuable insights into the durability and breadth of vaccine-induced immunity.
Our findings highlight the robust induction of anti-S1 IgG antibodies and neutralization capacity following the second and third vaccine doses. A significant rise in neutralizing titers was observed after the second dose, with effective neutralization of pre-Omicron variants. However, these titers declined substantially over time, particularly three to six months post-vaccination. This waning immunity coincided with the emergence of the Delta variant, suggesting that declining neutralization titers may have contributed to increased susceptibility to infection during this period. These results are consistent with other studies demonstrating the transient nature of vaccine-induced antibody responses, emphasizing the need for booster doses to sustain immunity [35,36,37].
The third vaccine dose significantly boosted neutralization titers, not only against pre-Omicron variants but also against Omicron subvariants. Notably, despite an initial increase in anti-S1 IgG levels post-booster, these levels gradually declined over two years. However, neutralization titers remained relatively stable, in case of Omicron variants even increased, suggesting a qualitative improvement in antibody response, possibly due to affinity maturation and long-lived plasma cell contributions [8,38]. The sustained neutralization titers even two years post-booster reinforce the importance of the third vaccine dose in maintaining durable immune protection.
A key observation was the differential response among participants based on infection history. Those who had received three vaccine doses and experienced an Omicron infection displayed slightly higher neutralization titers at the final time point (T6) compared to those who were triple-vaccinated but infection-naïve. This confirms that hybrid immunity, resulting from vaccination and natural infection, may provide superior and more sustained protection against emerging variants. Prior studies have reported that hybrid immunity generates broader and more potent neutralizing responses, potentially due to repeated antigenic exposure driving B cell maturation and memory responses [39,40,41,42].
Our correlation analysis revealed a strong association between anti-S1 IgG levels and neutralization titers for pre-Omicron variants (r = 0.79–0.93 ; p<0.05), but a more moderate correlation for Omicron subvariants (r ≈ 0.50–0.64; ns). This reduced correlation suggests that while IgG levels remain a useful marker of immunity, they may not fully predict neutralization efficacy against highly mutated variants. The substantial immune evasion observed in Omicron variants underscores the necesity of updated vaccines in fully preventing infection with these later-emerging lineages [43,44,45].
We observed the lowest neutralization capacity against the XBB variant [34] what aligns with previous findings highlighting its significant immune evasion properties. For instance, Wang et al. [46] reported that neutralizing antibody titers against XBB subvariants were reduced by 66- to 155-fold compared to earlier strains, indicating a substantial decrease in vaccine-induced antibody effectiveness. Additionally, Zhang et al. [47] demonstrated that individuals previously infected with earlier Omicron subvariants exhibited markedly reduced neutralizing antibody levels against several XBB subvariants, suggesting limited cross-protection provided by prototype- and Omicron BA.5 variant-induced neutralising antibodies.
Interestingly, our findings align with prior studies demonstrating that vaccine-induced sera collected before the emergence of Omicron variants exhibited measurable cross-neutralising activity against BA.1 and BA.2 sublineages [48,49]. Andreano et al. [48] identified both receptor binding domain (RBD)- and M-terminal domain (NTD)-targeting monoclonal antibodies capable of neutralising Omicron variants, suggesting that conserved epitopes—particularly in Class 3 regions and specific NTD sites—can elicit broadly reactive antibodies even in the absence of prior exposure to those variants. Gruell et al. [49] further showed that although primary vaccination induced only weak serum neutralisation of Omicron, a third mRNA vaccine dose dramatically enhanced neutralising titers, supporting the concept of affinity maturation leading to broader cross-reactivity. Consistent with these reports, we observed higher neutralisation titers against BA.2 than BA.1, a pattern previously linked to epitope accessibility and structural differences between subvariants.
Despite these valuable insights, our study has some limitations. The relatively small sample size (n=19) may limit generalizability to larger populations. Additionally, while we assessed humoral responses, cellular immunity was not evaluated. This limitation was particularly evident when attempting to further divide participants into subgroups based on infection status, as the group of individuals without clinical disease was too small for statistically significant comparisons. T cell-mediated responses play a critical role in long-term protection and viral clearance, particularly against immune-evasive variants. Future studies incorporating T cell analyses and functional neutralization assays against newer variants would provide a more complete understanding of vaccine-induced immunity.
However, a notable strength of our study is its extensive follow-up period of two years, which provides a detailed perspective on the long-term dynamics of the immune response. Many longitudinal studies on SARS-CoV-2 vaccine-induced immunity have been limited to shorter durations, often ranging from six months to one year. Several other long-term studies, such as the ProHEpiC-19 study (24 months, 800 healthcare workers) [50], the PARIS study (3 years, large cohort of healthcare workers) [51], or a 20-month study on recovered individuals of Hvidt et al. [52], have also provided valuable insights into SARS-CoV-2 long-term immunity. However, these studies primarily focused on infection risk, antibody presence, and broad immune responses rather than detailed neutralization analyses across multiple variants, as conducted in our study incorporating extensive variant-specific neutralization testing. Our extended follow-up allows for a more comprehensive assessment of the durability of vaccine-induced and hybrid immunity over an extended period, offering valuable insights into the long-term effectiveness of vaccination strategies.
5. Conclusions
In conclusion, our study reinforces the importance of booster vaccinations in maintaining neutralization capacity and highlights the added benefit of hybrid immunity. While vaccine-induced protection wanes over time, natural infection following vaccination appears to enhance long-term immunity. These findings support ongoing efforts to optimize booster strategies and adapt vaccines to emerging variants to ensure continued protection against SARS-CoV-2.
Supplementary Materials
The following supporting information can be downloaded at: Preprints.org. Supplementary Table S1: Basic Characteristics of Study Participants. Demographic information, vaccination history, and SARS-CoV-2 infection details for each participant, including variant type and clinical course of the disease. Supplementary Table S2: SARS-CoV-2 Anti-S1 IgG Antibody Levels. ELISA-based measurements of anti-S1 IgG antibody levels (expressed as sample-to-calibrator [S/C] ratios) in serum samples collected from participants at six defined time points during the study. Supplementary Figure S1: Pseudotype-Based Neutralization Assays. Each panel displays neutralization assay results for individual participants, showing serum neutralizing activity across six time points against nine distinct SARS-CoV-2 variants using a pseudotype-based system. Supplementary methods: SARS-CoV-2 Spike protein Pseudotype-based neutralization assay.
Author Contributions
Conceptualisation, V.V, S.P., B.K.; methodology,V.V., Mo.Sl., B.K.; validation, B.K.; formal analysis, V.V., B.K.; investigation, V.V, J.N., M.L., Mo.Sl., I.K., Ľ.L., Ž.R., Mi.Sa.; resources, Ž.R.; data curation, V.V., Mi.Sa., Ž.R., B.K.; writing—original draft preparation, V.V., B.K.; writing—review and editing, B.K., S.P., Ž.R.; visualisation, V.V., Mi.Sa.; supervision, B.K.; project administration, B.K.; funding acquisition, B.K, V.V. All authors have read and agreed to the published version of the manuscript.
Funding
This research was funded by the Slovak Research and Development Agency grant PP-COVID-20-0017 (B.K.), SAS Programme for PhD students’grants Doktogrant APP0397 (V.V.) and by the European Union’s Horizon 2020 research and innovation program [EVA-GLOBAL project, grant agreement number 871029] (B.K.).
Acknowledgements
We express our gratitude to Lenka Jelenská and Dominik Ontko for their outstanding technical help and to Dr. Ivan Kosik (NIAID, NIH, USA) for his help in settting up the pseudotype assays. During the preparation of this manuscript, the author(s) used ChatGPT (GPT-4-turbo, OpenAI) for the purposes of text editing, translation, and refining language. The use was limited to linguistic aspects and did not influence the study's content, analysis, or conclusions. The authors have reviewed and edited the output and take full responsibility for the content of this publication.
Ethical Statement
The study was approved by the independent Ethics Committee of the Bratislava self-governing region approved the study by its decision No. 09833/2020/HF and amendment 07071/2021 from June 30, 2021. The participants provided written informed consent to participate in this study.
Conflicts of Interest
The authors declare no conflicts of interest.
References
- Dhama, K.; Khan, S.; Tiwari, R.; Sircar, S.; Bhat, S.; Malik, Y.S.; Singh, K.P.; Chaicumpa, W.; Bonilla-Aldana, D.K.; Rodriguez-Morales, A.J. Coronavirus Disease 2019 –COVID-19. Clin. Microbiol. Rev. 2020, 33. [Google Scholar] [CrossRef] [PubMed]
- Anamika; Khanka, S.; Chandra, G.; Singh, K.; Jamloki, D.; Naaz, F.; Gupta, B. Review on Various Type of Vaccines for Controlling Infectious Disease. J. Res. Appl. Sci. Biotechnol. 2024, 3, 279–284. [Google Scholar] [CrossRef]
- Sleem, B.; Zareef, R.; Bitar, F.; Arabi, M. Myocarditis in COVID-19: A Focus on the Pediatric Population.
- Sette, A.; Crotty, S. Immunological Memory to SARS-CoV-2 Infection and COVID-19 Vaccines. Immunol. Rev. 2022, 310, 27–46. [Google Scholar] [CrossRef] [PubMed]
- Cohen, K.W.; Linderman, S.L.; Moodie, Z.; Czartoski, J.; Lai, L.; Mantus, G.; Norwood, C.; Nyhoff, L.E.; Edara, V.V.; Floyd, K.; et al. Longitudinal Analysis Shows Durable and Broad Immune Memory after SARS-CoV-2 Infection with Persisting Antibody Responses and Memory B and T Cells. Cell Rep. Med. 2021, 2, 100354. [Google Scholar] [CrossRef]
- Dan, J.M.; Mateus, J.; Kato, Y.; Hastie, K.M.; Yu, E.D.; Faliti, C.E.; Grifoni, A.; Ramirez, S.I.; Haupt, S.; Frazier, A.; et al. Immunological Memory to SARS-CoV-2 Assessed for up to 8 Months after Infection. Science 2021, 371, eabf4063. [Google Scholar] [CrossRef]
- Turner, J.S.; O’Halloran, J.A.; Kalaidina, E.; Kim, W.; Schmitz, A.J.; Zhou, J.Q.; Lei, T.; Thapa, M.; Chen, R.E.; Case, J.B.; et al. SARS-CoV-2 mRNA Vaccines Induce Persistent Human Germinal Centre Responses. Nature 2021, 596, 109–113. [Google Scholar] [CrossRef]
- Gaebler, C.; Wang, Z.; Lorenzi, J.C.C.; Muecksch, F.; Finkin, S.; Tokuyama, M.; Cho, A.; Jankovic, M.; Schaefer-Babajew, D.; Oliveira, T.Y.; et al. Evolution of Antibody Immunity to SARS-CoV-2. Nature 2021, 591, 639–644. [Google Scholar] [CrossRef]
- Yang, Y.; Du, L. SARS-CoV-2 Spike Protein: A Key Target for Eliciting Persistent Neutralizing Antibodies. Signal Transduct. Target. Ther. 2021, 6, 95. [Google Scholar] [CrossRef]
- Shi, R.; Shan, C.; Duan, X.; Chen, Z.; Liu, P.; Song, J.; Song, T.; Bi, X.; Han, C.; Wu, L.; et al. A Human Neutralizing Antibody Targets the Receptor-Binding Site of SARS-CoV-2. Nature 2020, 584, 120–124. [Google Scholar] [CrossRef]
- Murin, C.D.; Wilson, I.A.; Ward, A.B. Antibody Responses to Viral Infections: A Structural Perspective across Three Different Enveloped Viruses. Nat. Microbiol. 2019, 4, 734–747. [Google Scholar] [CrossRef]
- Liu, X.; Wang, J.; Xu, X.; Liao, G.; Chen, Y.; Hu, C.-H. Patterns of IgG and IgM Antibody Response in COVID-19 Patients. Emerg. Microbes Infect. 2020, 9, 1269–1274. [Google Scholar] [CrossRef] [PubMed]
- Suthar, M.S. Durability of Immune Responses to SARS-CoV-2 Infection and Vaccination. Semin. Immunol. 2024, 73, 101884. [Google Scholar] [CrossRef] [PubMed]
- L’Huillier, A.G.; Meyer, B.; Andrey, D.O.; Arm-Vernez, I.; Baggio, S.; Didierlaurent, A.; Eberhardt, C.S.; Eckerle, I.; Grasset-Salomon, C.; Huttner, A.; et al. Antibody Persistence in the First 6 Months Following SARS-CoV-2 Infection among Hospital Workers: A Prospective Longitudinal Study. Clin. Microbiol. Infect. 2021, 27, 784.e1–784.e8. [Google Scholar] [CrossRef]
- Shook, L.L.; Atyeo, C.G.; Yonker, L.M.; Fasano, A.; Gray, K.J.; Alter, G.; Edlow, A.G. Durability of Anti-Spike Antibodies in the Infant after Maternal COVID-19 Vaccination 2021.
- Joshi, D.; Nyhoff, L.E.; Zarnitsyna, V.I.; Moreno, A.; Manning, K.; Linderman, S.; Burrell, A.R.; Stephens, K.; Norwood, C.; Mantus, G.; et al. Infants and Young Children Generate More Durable Antibody Responses to SARS-CoV-2 Infection than Adults. iScience 2023, 26, 107967. [Google Scholar] [CrossRef]
- Affeldt, P.; Koehler, F.C.; Brensing, K.A.; Adam, V.; Burian, J.; Butt, L.; Gies, M.; Grundmann, F.; Hinrichs, S.; Johannis, W.; et al. Immune Responses to SARS-CoV-2 Infection and Vaccination in Dialysis Patients and Kidney Transplant Recipients. Microorganisms 2021, 10, 4. [Google Scholar] [CrossRef] [PubMed]
- Arévalo-Herrera, M.; Rincón-Orozco, B.; González-Escobar, J.M.; Herrera-Arévalo, S.M.; Carrasquilla-Agudelo, E.; Serna-Ortega, P.A.; Quiceno-García, S.; Palacio-Muñoz, N.; Rosero-López, B.; Mondol-Miranda, E.; et al. Longitudinal Follow-Up of the Specific Antibody Response to SARS-CoV-2 Vaccination in Colombia. J. Med. Virol. 2025, 97, e70133. [Google Scholar] [CrossRef]
- Schulte, B.; Richter, E.; Büning, A.; Baum, M.; Breuer, A.; Zorn, J.; König, J.; Geiger, M.; Eschbach-Bludau, M.; Heuser, J.; et al. A Longitudinal Study on SARS-CoV-2 Seroconversion, Reinfection and Neutralisation Spanning Several Variant Waves and Vaccination Campaigns, Heinsberg, Germany, April 2020 to November 2022. Eurosurveillance 2024, 29. [Google Scholar] [CrossRef]
- Tworek, A.; Jaroń, K.; Cicha, M.; Rydzewski, A.; Wierzba, W.; Zaczyński, A.; Król, Z.; Rydzewska, G. The Persistence of SARS-CoV-2 Neutralizingantibodies after COVID-19: A One-Yearobservation. Is a SARS-CoV-2 Vaccinationbooster Dose Necessary? Cent. Eur. J. Immunol. 2023, 48, 92–96. [Google Scholar] [CrossRef]
- Aiano, F.; Ireland, G.; Baawuah, F.; Beckmann, J.; Okike, I.O.; Ahmad, S.; Garstang, J.; Brent, A.J.; Brent, B.; Borrow, R.; et al. Antibody Persistence After Primary SARS-CoV-2 Infection and Protection Against Future Variants Including Omicron in Adolescents: National, Prospective Cohort Study. Pediatr. Infect. Dis. J. 2023, 42, 496–502. [Google Scholar] [CrossRef]
- Karunathilake, R.P.; Kumara, R.A.; Karunathilaka, A.; Wazil, A.W.M.; Nanayakkara, N.; Bandara, C.K.; Abeysekera, R.A.; Noordeen, F.; Gawarammana, I.B.; Ratnatunga, C.N. 18-Month Longitudinal SARS COV-2 Neutralizing Antibody Dynamics in Haemodialysis Patients Receiving Heterologous 3-Dose Vaccination (AZD-1222- AZD-1222- BNT162b2) in a Lower Middle Income Setting. BMC Nephrol. 2024, 25, 176. [Google Scholar] [CrossRef]
- Whitt, M.A. Generation of VSV Pseudotypes Using Recombinant ΔG-VSV for Studies on Virus Entry, Identification of Entry Inhibitors, and Immune Responses to Vaccines. J. Virol. Methods 2010, 169, 365–374. [Google Scholar] [CrossRef] [PubMed]
- Nie, J.; Li, Q.; Wu, J.; Zhao, C.; Hao, H.; Liu, H.; Zhang, L.; Nie, L.; Qin, H.; Wang, M.; et al. Quantification of SARS-CoV-2 Neutralizing Antibody by a Pseudotyped Virus-Based Assay. Nat. Protoc. 2020, 15, 3699–3715. [Google Scholar] [CrossRef] [PubMed]
- Condor Capcha, J.M.; Lambert, G.; Dykxhoorn, D.M.; Salerno, A.G.; Hare, J.M.; Whitt, M.A.; Pahwa, S.; Jayaweera, D.T.; Shehadeh, L.A. Generation of SARS-CoV-2 Spike Pseudotyped Virus for Viral Entry and Neutralization Assays: A 1-Week Protocol. Front. Cardiovasc. Med. 2021, 7, 618651. [Google Scholar] [CrossRef] [PubMed]
- NCZI.sk Https://Covid-19.Nczisk.Sk/Sk.
- Kowarz, E.; Löscher, D.; Marschalek, R. Optimized Sleeping Beauty Transposons Rapidly Generate Stable Transgenic Cell Lines. Biotechnol. J. 2015, 10, 647–653. [Google Scholar] [CrossRef]
- Yewdell, J.W.; Li, T.; Kang, I.; Hu, Z.; Gibbs, J.; Ye, C.; Kosik, I.; Shi, G.; Holly, J.; Kosikova, M.; et al. Syncytia Formation Promotes Virus Resistance to Interferon and Neutralizing Antibodies 2024.
- Xiong, H.-L.; Wu, Y.-T.; Cao, J.-L.; Yang, R.; Liu, Y.-X.; Ma, J.; Qiao, X.-Y.; Yao, X.-Y.; Zhang, B.-H.; Zhang, Y.-L.; et al. Robust Neutralization Assay Based on SARS-CoV-2 S-Protein-Bearing Vesicular Stomatitis Virus (VSV) Pseudovirus and ACE2-Overexpressing BHK21 Cells. Emerg. Microbes Infect. 2020, 9, 2105–2113. [Google Scholar] [CrossRef]
- Ritz, C.; Baty, F.; Streibig, J.C.; Gerhard, D. Dose-Response Analysis Using R. PLOS ONE 2015, 10, e0146021. [Google Scholar] [CrossRef]
- Wickham, H. Ggplot2. WIREs Comput. Stat. 2011, 3, 180–185. [Google Scholar] [CrossRef]
- Bradley, B.T.; Bryan, A.; Fink, S.L.; Goecker, E.A.; Roychoudhury, P.; Huang, M.-L.; Zhu, H.; Chaudhary, A.; Madarampalli, B.; Lu, J.Y.C.; et al. Anti-SARS-CoV-2 Antibody Levels Measured by the AdviseDx SARS-CoV-2 Assay Are Concordant with Previously Available Serologic Assays but Are Not Fully Predictive of Sterilizing Immunity. J. Clin. Microbiol. 2021, 59, e00989-21. [Google Scholar] [CrossRef]
- Kajanova, I.; Lukacikova, L.; Jelenska, L.; Grossmannova, K.; Radikova, Z.; Vlcek, M.; Klempa, B.; Kollar, R.; Bodova, K.; Kopacek, J.; et al. Seroprevalence of SARS-CoV-2 IgG Antibodies in the Staff of the Slovak Academy of Sciences in Response to COVID-19 and/or Vaccination: Situation in August 2021. Acta Virol. 2022, 65, 420–432. [Google Scholar] [CrossRef]
- Tamura, T.; Ito, J.; Uriu, K.; Zahradnik, J.; Kida, I.; Anraku, Y.; Nasser, H.; Shofa, M.; Oda, Y.; Lytras, S.; et al. Virological Characteristics of the SARS-CoV-2 XBB Variant Derived from Recombination of Two Omicron Subvariants. Nat. Commun. 2023, 14, 2800. [Google Scholar] [CrossRef]
- Sheehan, J.; Ardizzone, C.M.; Khanna, M.; Trauth, A.J.; Hagensee, M.E.; Ramsay, A.J. Dynamics of Serum-Neutralizing Antibody Responses in Vaccinees through Multiple Doses of the BNT162b2 Vaccine. Vaccines 2023, 11, 1720. [Google Scholar] [CrossRef] [PubMed]
- Feng, S.; Phillips, D.J.; White, T.; Sayal, H.; Aley, P.K.; Bibi, S.; Dold, C.; Fuskova, M.; Gilbert, S.C.; Hirsch, I.; et al. Correlates of Protection against Symptomatic and Asymptomatic SARS-CoV-2 Infection. Nat. Med. 2021, 27, 2032–2040. [Google Scholar] [CrossRef] [PubMed]
- Khoury, D.S.; Cromer, D.; Reynaldi, A.; Schlub, T.E.; Wheatley, A.K.; Juno, J.A.; Subbarao, K.; Kent, S.J.; Triccas, J.A.; Davenport, M.P. Neutralizing Antibody Levels Are Highly Predictive of Immune Protection from Symptomatic SARS-CoV-2 Infection. Nat. Med. 2021, 27, 1205–1211. [Google Scholar] [CrossRef]
- Sokal, A.; Chappert, P.; Barba-Spaeth, G.; Roeser, A.; Fourati, S.; Azzaoui, I.; Vandenberghe, A.; Fernandez, I.; Meola, A.; Bouvier-Alias, M.; et al. Maturation and Persistence of the Anti-SARS-CoV-2 Memory B Cell Response. Cell 2021, 184, 1201–1213.e14. [Google Scholar] [CrossRef]
- Andreano, E.; Paciello, I.; Piccini, G.; Manganaro, N.; Pileri, P.; Hyseni, I.; Leonardi, M.; Pantano, E.; Abbiento, V.; Benincasa, L.; et al. Hybrid Immunity Improves B Cells and Antibodies against SARS-CoV-2 Variants. Nature 2021, 600, 530–535. [Google Scholar] [CrossRef] [PubMed]
- Goel, R.R.; Apostolidis, S.A.; Painter, M.M.; Mathew, D.; Pattekar, A.; Kuthuru, O.; Gouma, S.; Hicks, P.; Meng, W.; Rosenfeld, A.M.; et al. Distinct Antibody and Memory B Cell Responses in SARS-CoV-2 Naïve and Recovered Individuals after mRNA Vaccination. Sci. Immunol. 2021, 6, eabi6950. [Google Scholar] [CrossRef]
- Suthar, M.S.; Arunachalam, P.S.; Hu, M.; Reis, N.; Trisal, M.; Raeber, O.; Chinthrajah, S.; Davis-Gardner, M.E.; Manning, K.; Mudvari, P.; et al. Durability of Immune Responses to the BNT162b2 mRNA Vaccine. Med 2022, 3, 25–27. [Google Scholar] [CrossRef]
- Bobrovitz, N.; Ware, H.; Ma, X.; Li, Z.; Hosseini, R.; Cao, C.; Selemon, A.; Whelan, M.; Premji, Z.; Issa, H.; et al. Protective Effectiveness of Previous SARS-CoV-2 Infection and Hybrid Immunity against the Omicron Variant and Severe Disease: A Systematic Review and Meta-Regression. Lancet Infect. Dis. 2023, 23, 556–567. [Google Scholar] [CrossRef]
- Planas, D.; Bruel, T.; Staropoli, I.; Guivel-Benhassine, F.; Porrot, F.; Maes, P.; Grzelak, L.; Prot, M.; Mougari, S.; Planchais, C.; et al. Resistance of Omicron Subvariants BA.2.75.2, BA.4.6, and BQ.1.1 to Neutralizing Antibodies. Nat. Commun. 2023, 14, 824. [Google Scholar] [CrossRef]
- Liu, L.; Iketani, S.; Guo, Y.; Chan, J.F.-W.; Wang, M.; Liu, L.; Luo, Y.; Chu, H.; Huang, Y.; Nair, M.S.; et al. Striking Antibody Evasion Manifested by the Omicron Variant of SARS-CoV-2. Nature 2022, 602, 676–681. [Google Scholar] [CrossRef]
- Stamatatos, L.; Czartoski, J.; Wan, Y.-H.; Homad, L.J.; Rubin, V.; Glantz, H.; Neradilek, M.; Seydoux, E.; Jennewein, M.F.; MacCamy, A.J.; et al. mRNA Vaccination Boosts Cross-Variant Neutralizing Antibodies Elicited by SARS-CoV-2 Infection. Science 2021, 372, 1413–1418. [Google Scholar] [CrossRef] [PubMed]
- Wang, Q.; Iketani, S.; Li, Z.; Liu, L.; Guo, Y.; Huang, Y.; Bowen, A.D.; Liu, M.; Wang, M.; Yu, J.; et al. Alarming Antibody Evasion Properties of Rising SARS-CoV-2 BQ and XBB Subvariants. Cell 2023, 186, 279–286.e8. [Google Scholar] [CrossRef] [PubMed]
- Zhang, H.; Li, B.; Sun, J.; Zou, L.; Yi, L.; Lin, H.; Zhou, P.; Liang, C.; Zeng, L.; Zhuang, X.; et al. Immune Evasion after SARS-CoV-2 Omicron BA.5 and XBB.1.9 Endemic Observed from Guangdong Province, China from 2022 to 2023. Virol. J. 2024, 21, 298. [Google Scholar] [CrossRef]
- Andreano, E.; Paciello, I.; Marchese, S.; Donnici, L.; Pierleoni, G.; Piccini, G.; Manganaro, N.; Pantano, E.; Abbiento, V.; Pileri, P.; et al. Anatomy of Omicron BA.1 and BA.2 Neutralizing Antibodies in COVID-19 mRNA Vaccinees. Nat. Commun. 2022, 13, 3375. [Google Scholar] [CrossRef]
- Gruell, H.; Vanshylla, K.; Tober-Lau, P.; Hillus, D.; Schommers, P.; Lehmann, C.; Kurth, F.; Sander, L.E.; Klein, F. mRNA Booster Immunization Elicits Potent Neutralizing Serum Activity against the SARS-CoV-2 Omicron Variant. Nat. Med. 2022, 28, 477–480. [Google Scholar] [CrossRef] [PubMed]
- Torán-Monserrat, P.; Lamonja-Vicente, N.; Costa-Garrido, A.; Carrasco-Ribelles, L.A.; Quirant, B.; Boigues, M.; Molina, X.; Chacón, C.; Dacosta-Aguayo, R.; Arméstar, F.; et al. SARS-CoV-2 Infection Risk by Vaccine Doses and Prior Infections Over 24 Months: ProHEpiC-19 Longitudinal Study. JMIR Public Health Surveill. 2024, 10, e56926–e56926. [Google Scholar] [CrossRef]
- Srivastava, K.; Carreño, J.M.; Gleason, C.; Monahan, B.; Singh, G.; Abbad, A.; Tcheou, J.; Raskin, A.; Kleiner, G.; Van Bakel, H.; et al. SARS-CoV-2-Infection- and Vaccine-Induced Antibody Responses Are Long Lasting with an Initial Waning Phase Followed by a Stabilization Phase. Immunity 2024, 57, 587–599.e4. [Google Scholar] [CrossRef]
- Hvidt, A.K.; Guo, H.; Andersen, R.; Lende, S.S.F.; Vibholm, L.K.; Søgaard, O.S.; Schleimann, M.H.; Russell, V.; Cheung, A.M.-W.; Paramithiotis, E.; et al. Long-Term Humoral and Cellular Immunity after Primary SARS-CoV-2 Infection: A 20-Month Longitudinal Study. BMC Immunol. 2023, 24, 45. [Google Scholar] [CrossRef]
Figure 1.
Schematic Representation of the Experimental Timeline. The timeline illustrates the progression of dominant SARS-CoV-2 variants in Slovakia and their association with fluctuations in COVID-19 hospitalisations [26]. Major infection waves correspond to the emergence of key variants, including B.1.1.7, B.1.617.2, BA.1/2, BA.4/5, BQ.1.1, and XBB.1.5. Vaccination events are indicated by syringe icons (doses 1–4), and serum collection time points (T1–T6) are marked by drop icons. The six sampling time points correspond approximately to: T1 – 3 weeks after first vaccine dose, T2 – 1 month post second vaccine dose, T3 – 3-4 months post second vaccine dose, T4 – 6-8 months post second vaccine dose, T5 –2 weeks post third dose, T6 – 2 years post third dose(31 months post first vaccine dose).
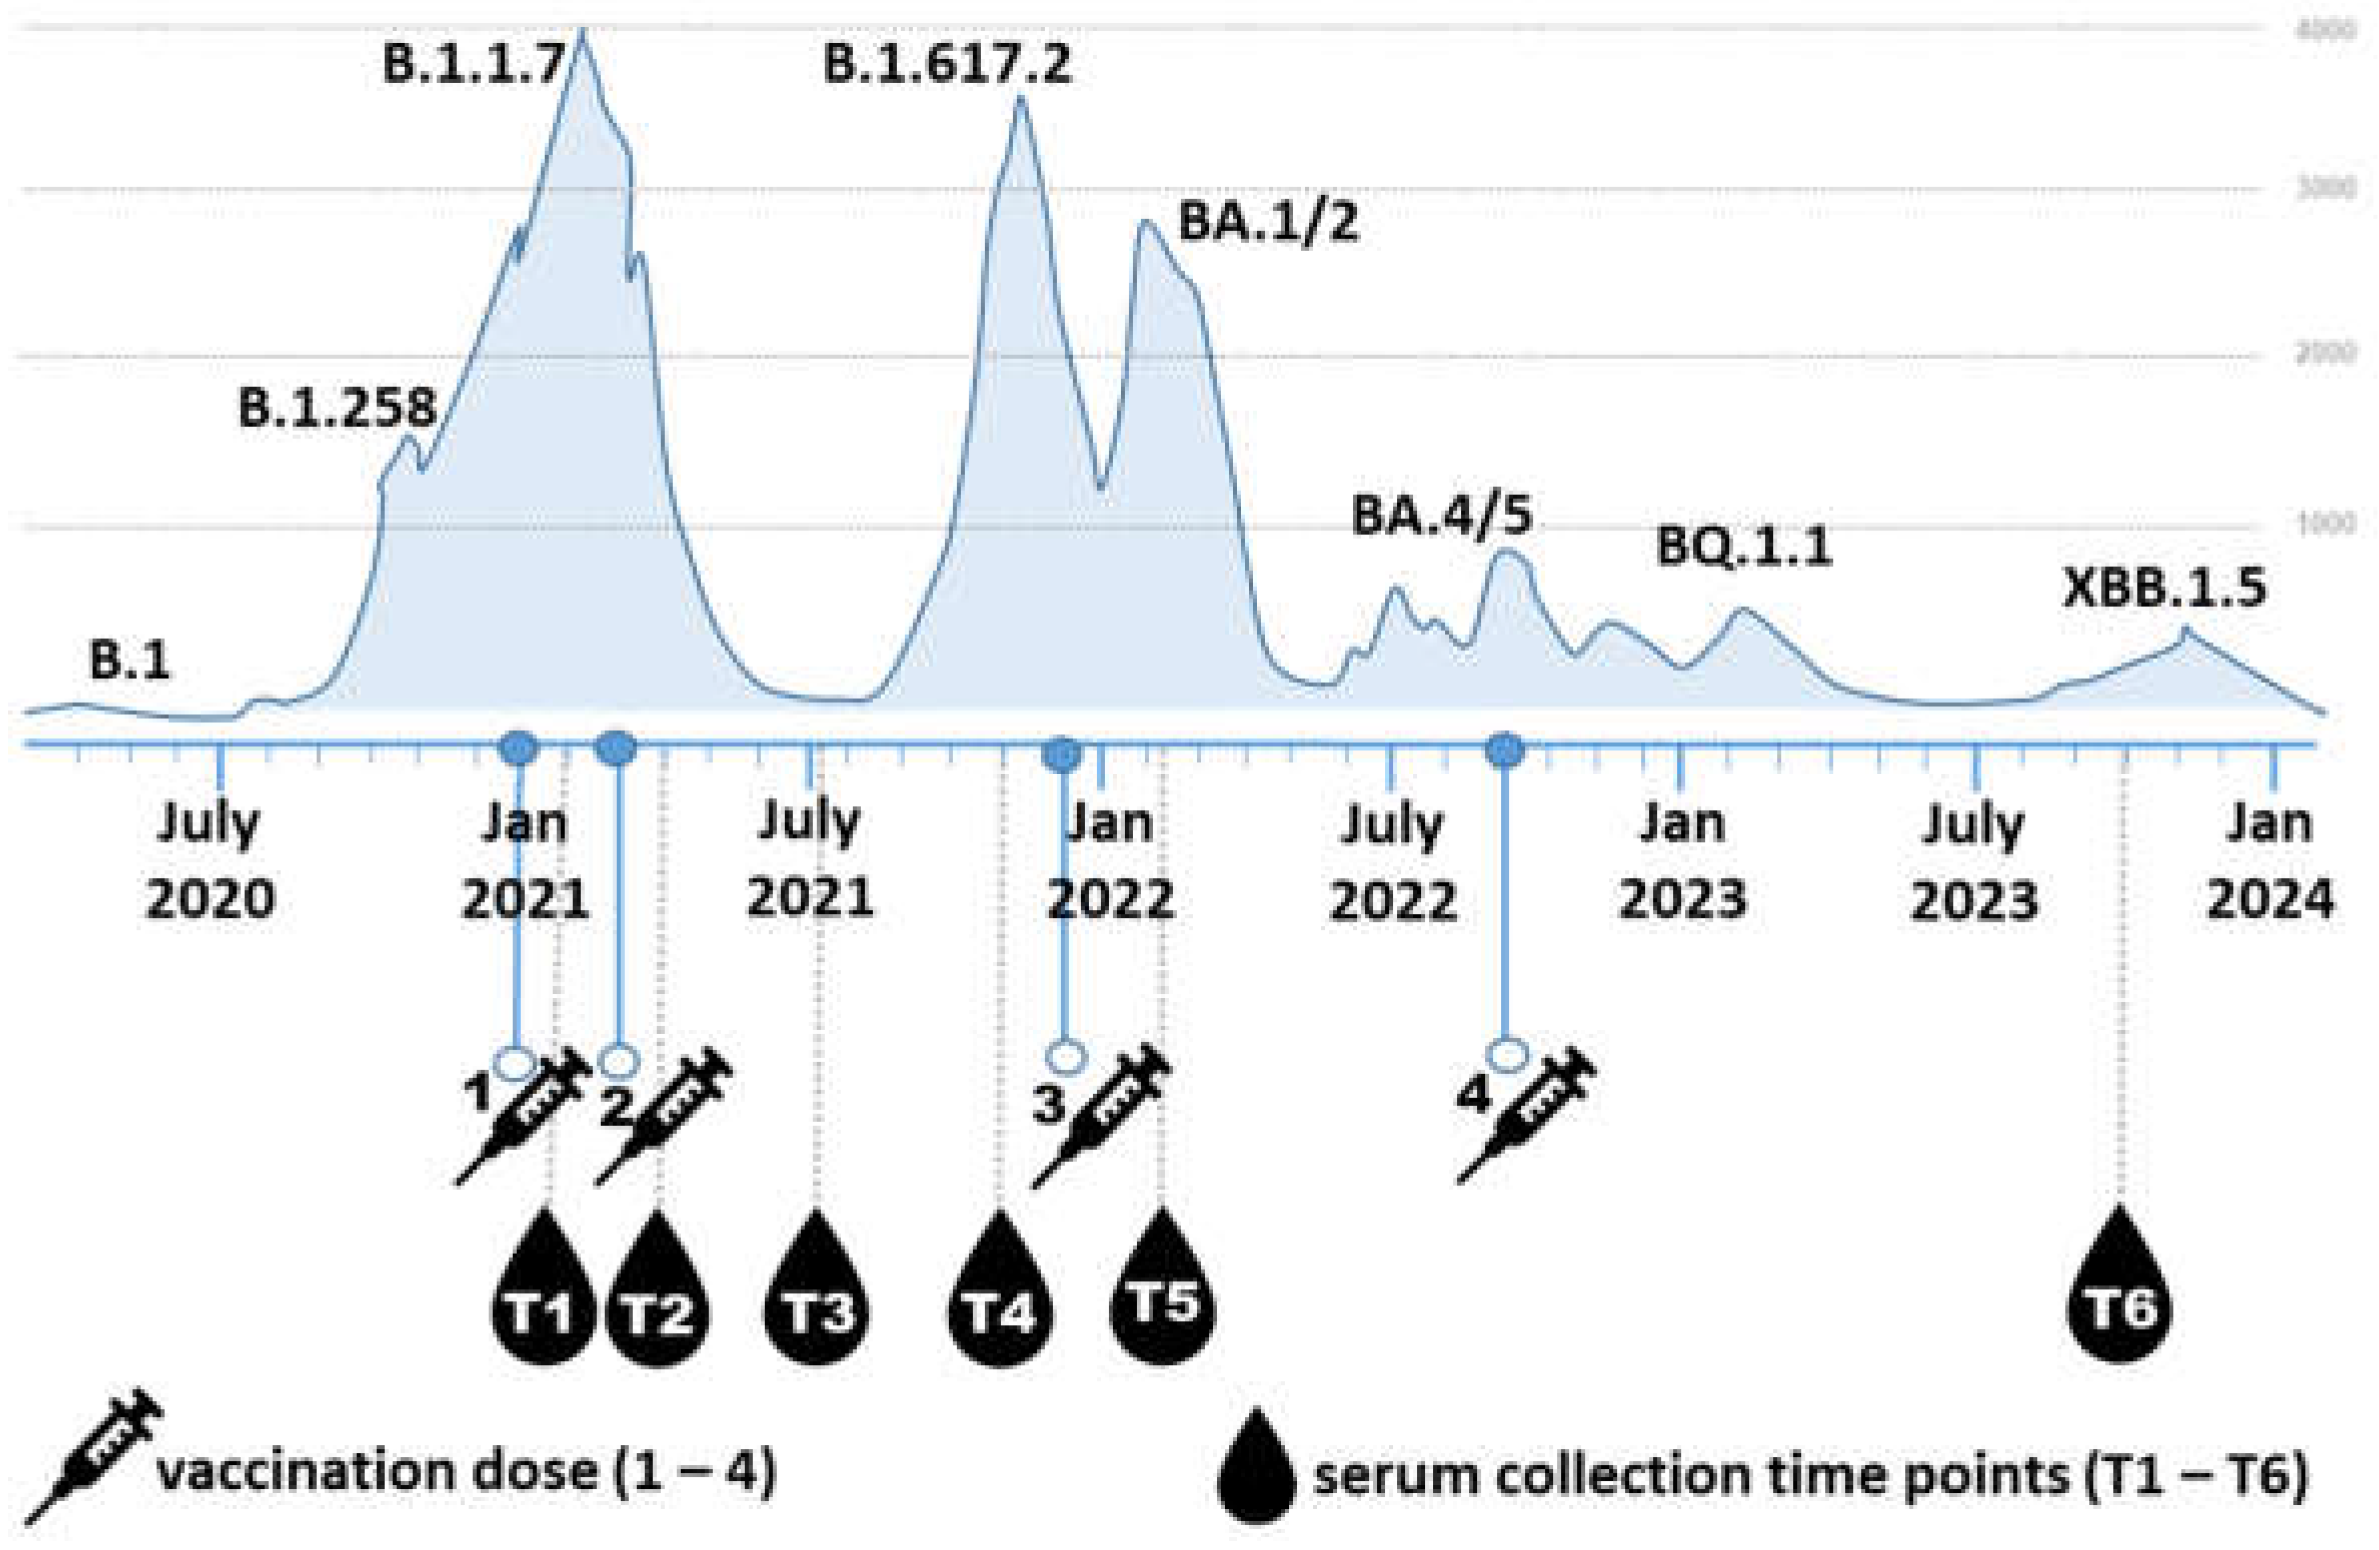
Figure 2.
Heatmap of Neutralization Titers Across SARS-CoV-2 Variants Over Time. The heatmap displays average neutralization titers (NT50) against nine SARS-CoV-2 variants across six serum collection time points (T1–T6). Each square represents the mean NT50 value for a given variant and time point. Dark blue indicates high neutralization capacity, lighter shades reflect lower titers, and white denotes absence of detectable neutralization.
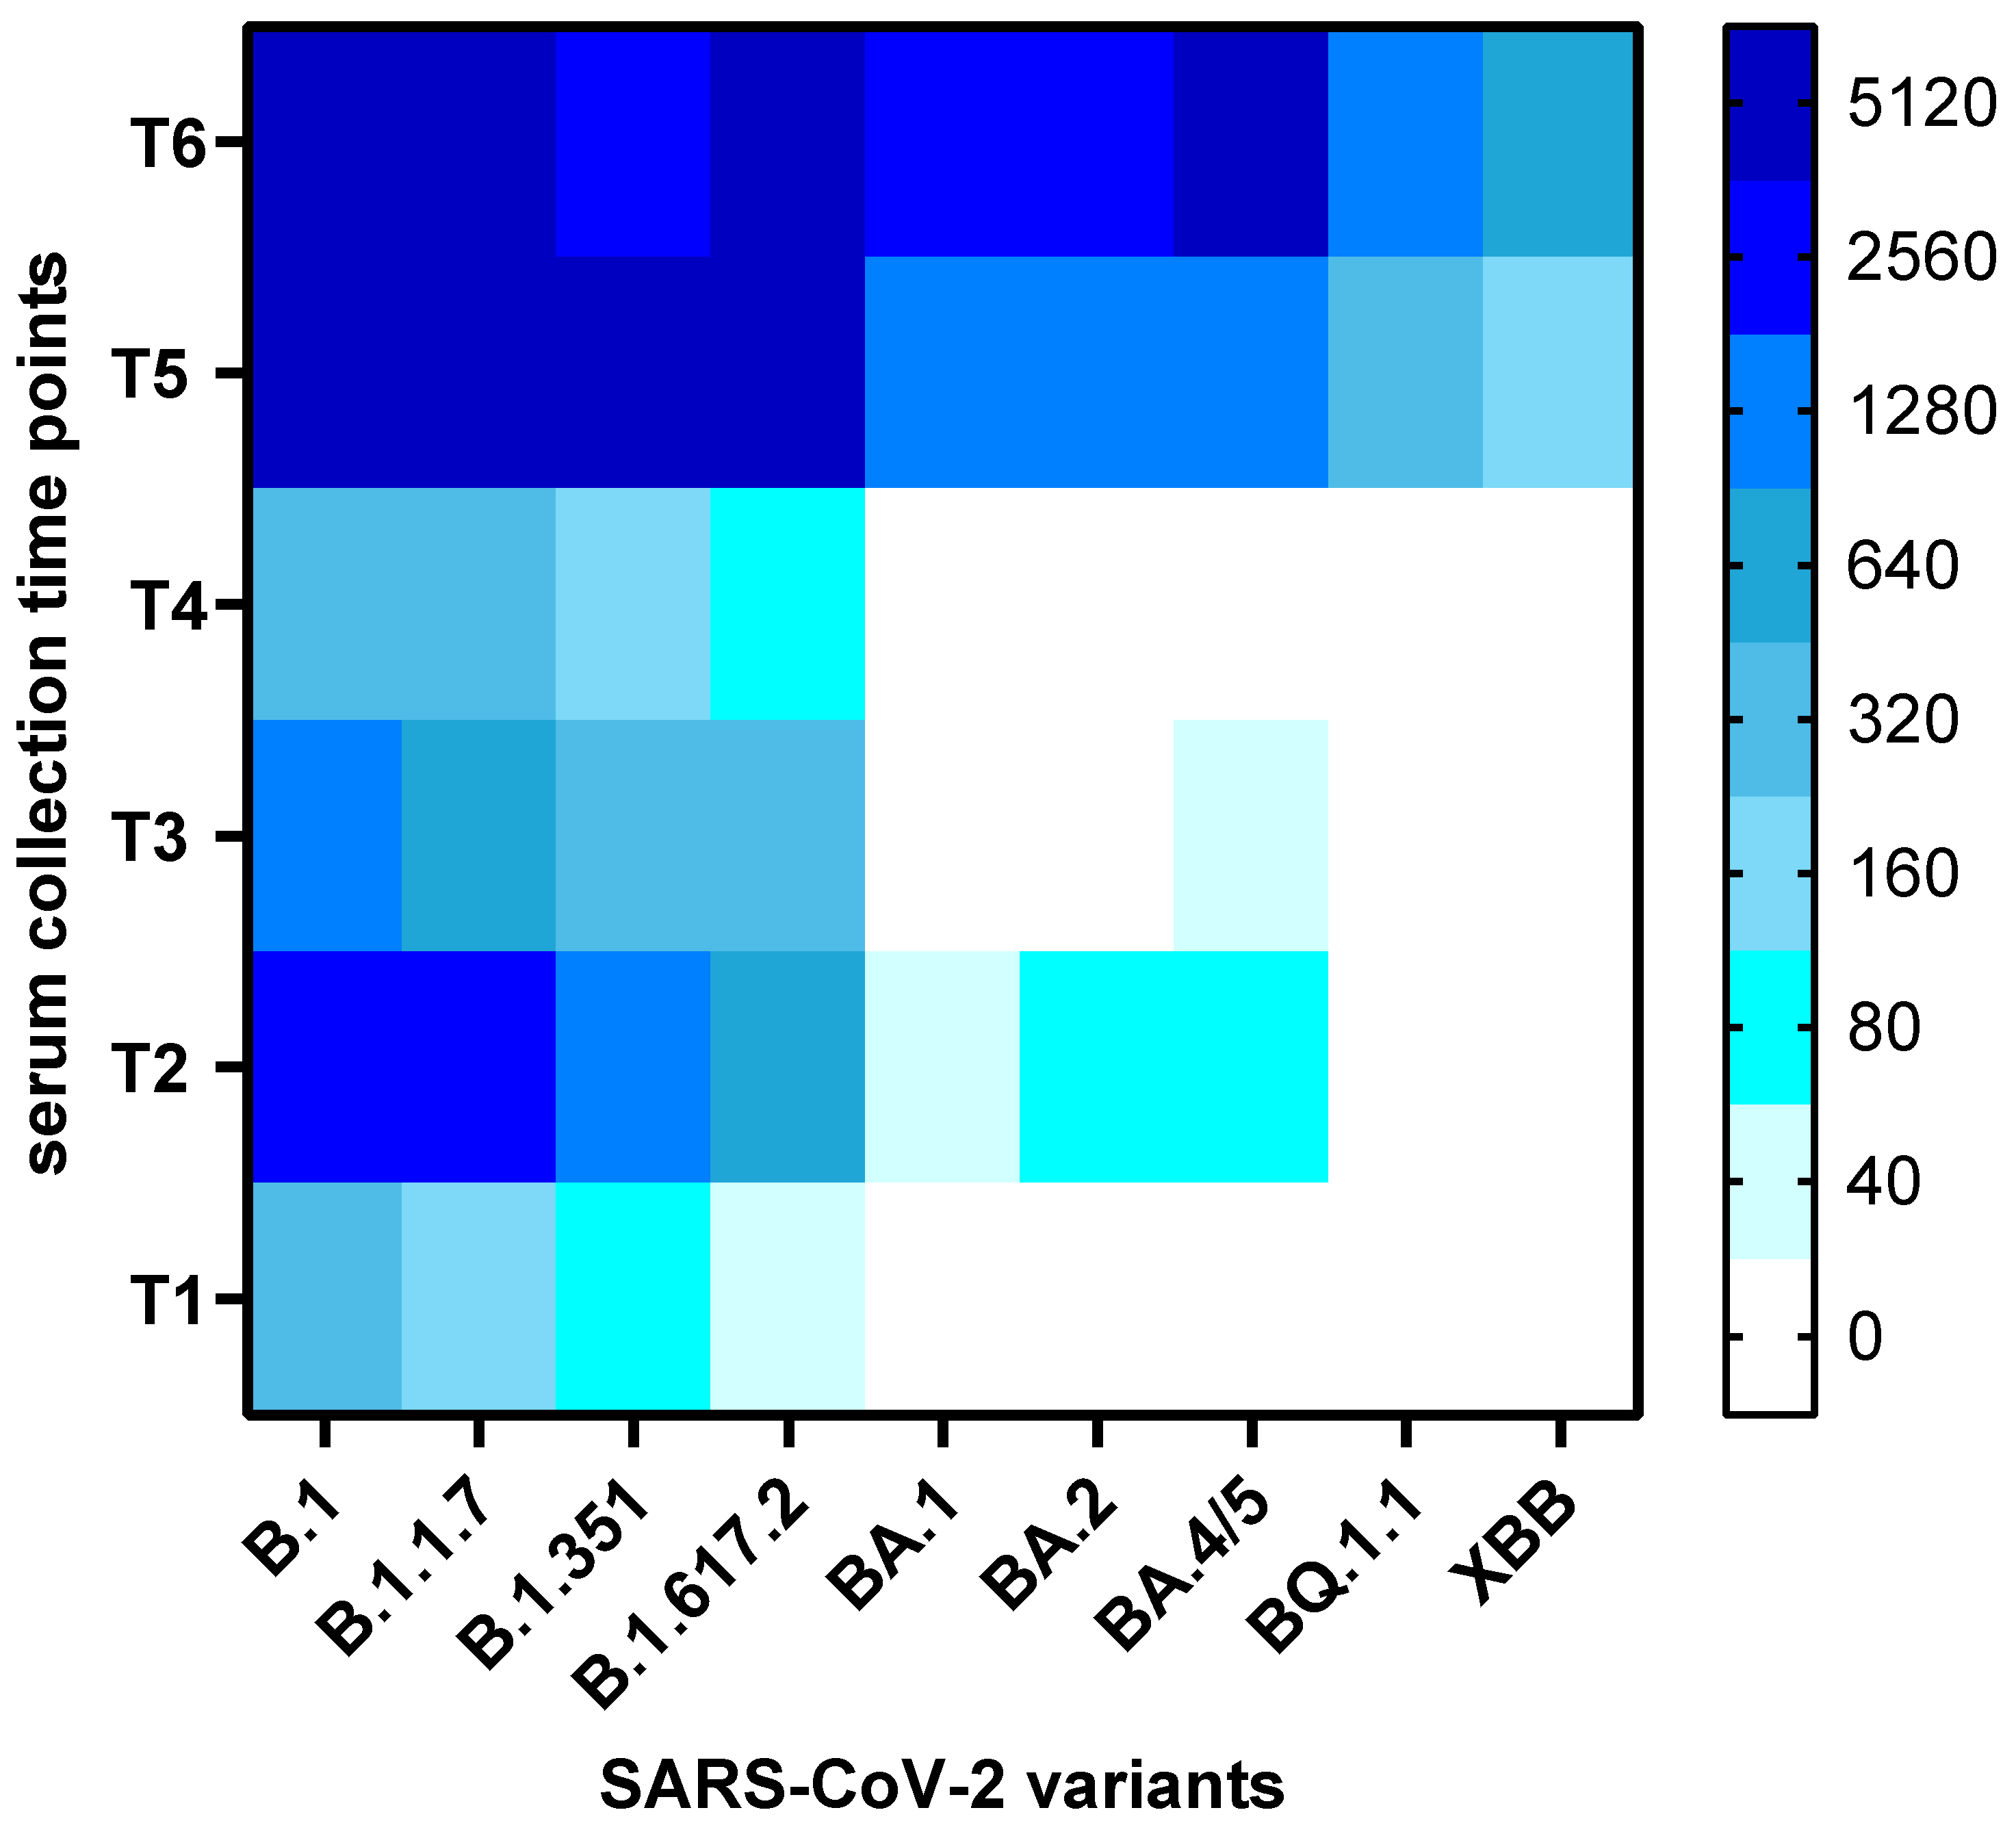
Figure 3.
Detection of SARS-CoV-2 anti-S1 IgG by ELISA. The graph displays anti-S1 IgG antibody levels expressed as sample-to-calibrator (S/C) ratios, measured by ELISA at six time points. Blue points indicate mean values with standard deviations as error bars (n = 19). A repeated-measures ANOVA with Greenhouse–Geisser correction showed a statistically significant difference in anti-S1 IgG levels across time points (F(2.700, 48.594) = 85.376, p < 0.0005). Post hoc analysis with Bonferroni adjustment revealed significantly higher IgG levels at T2, T3, T5, and T6 compared to T1 (p < 0.001). No significant difference was observed between T5 and T6 (p = 0.215), nor at T4 compared to T1.
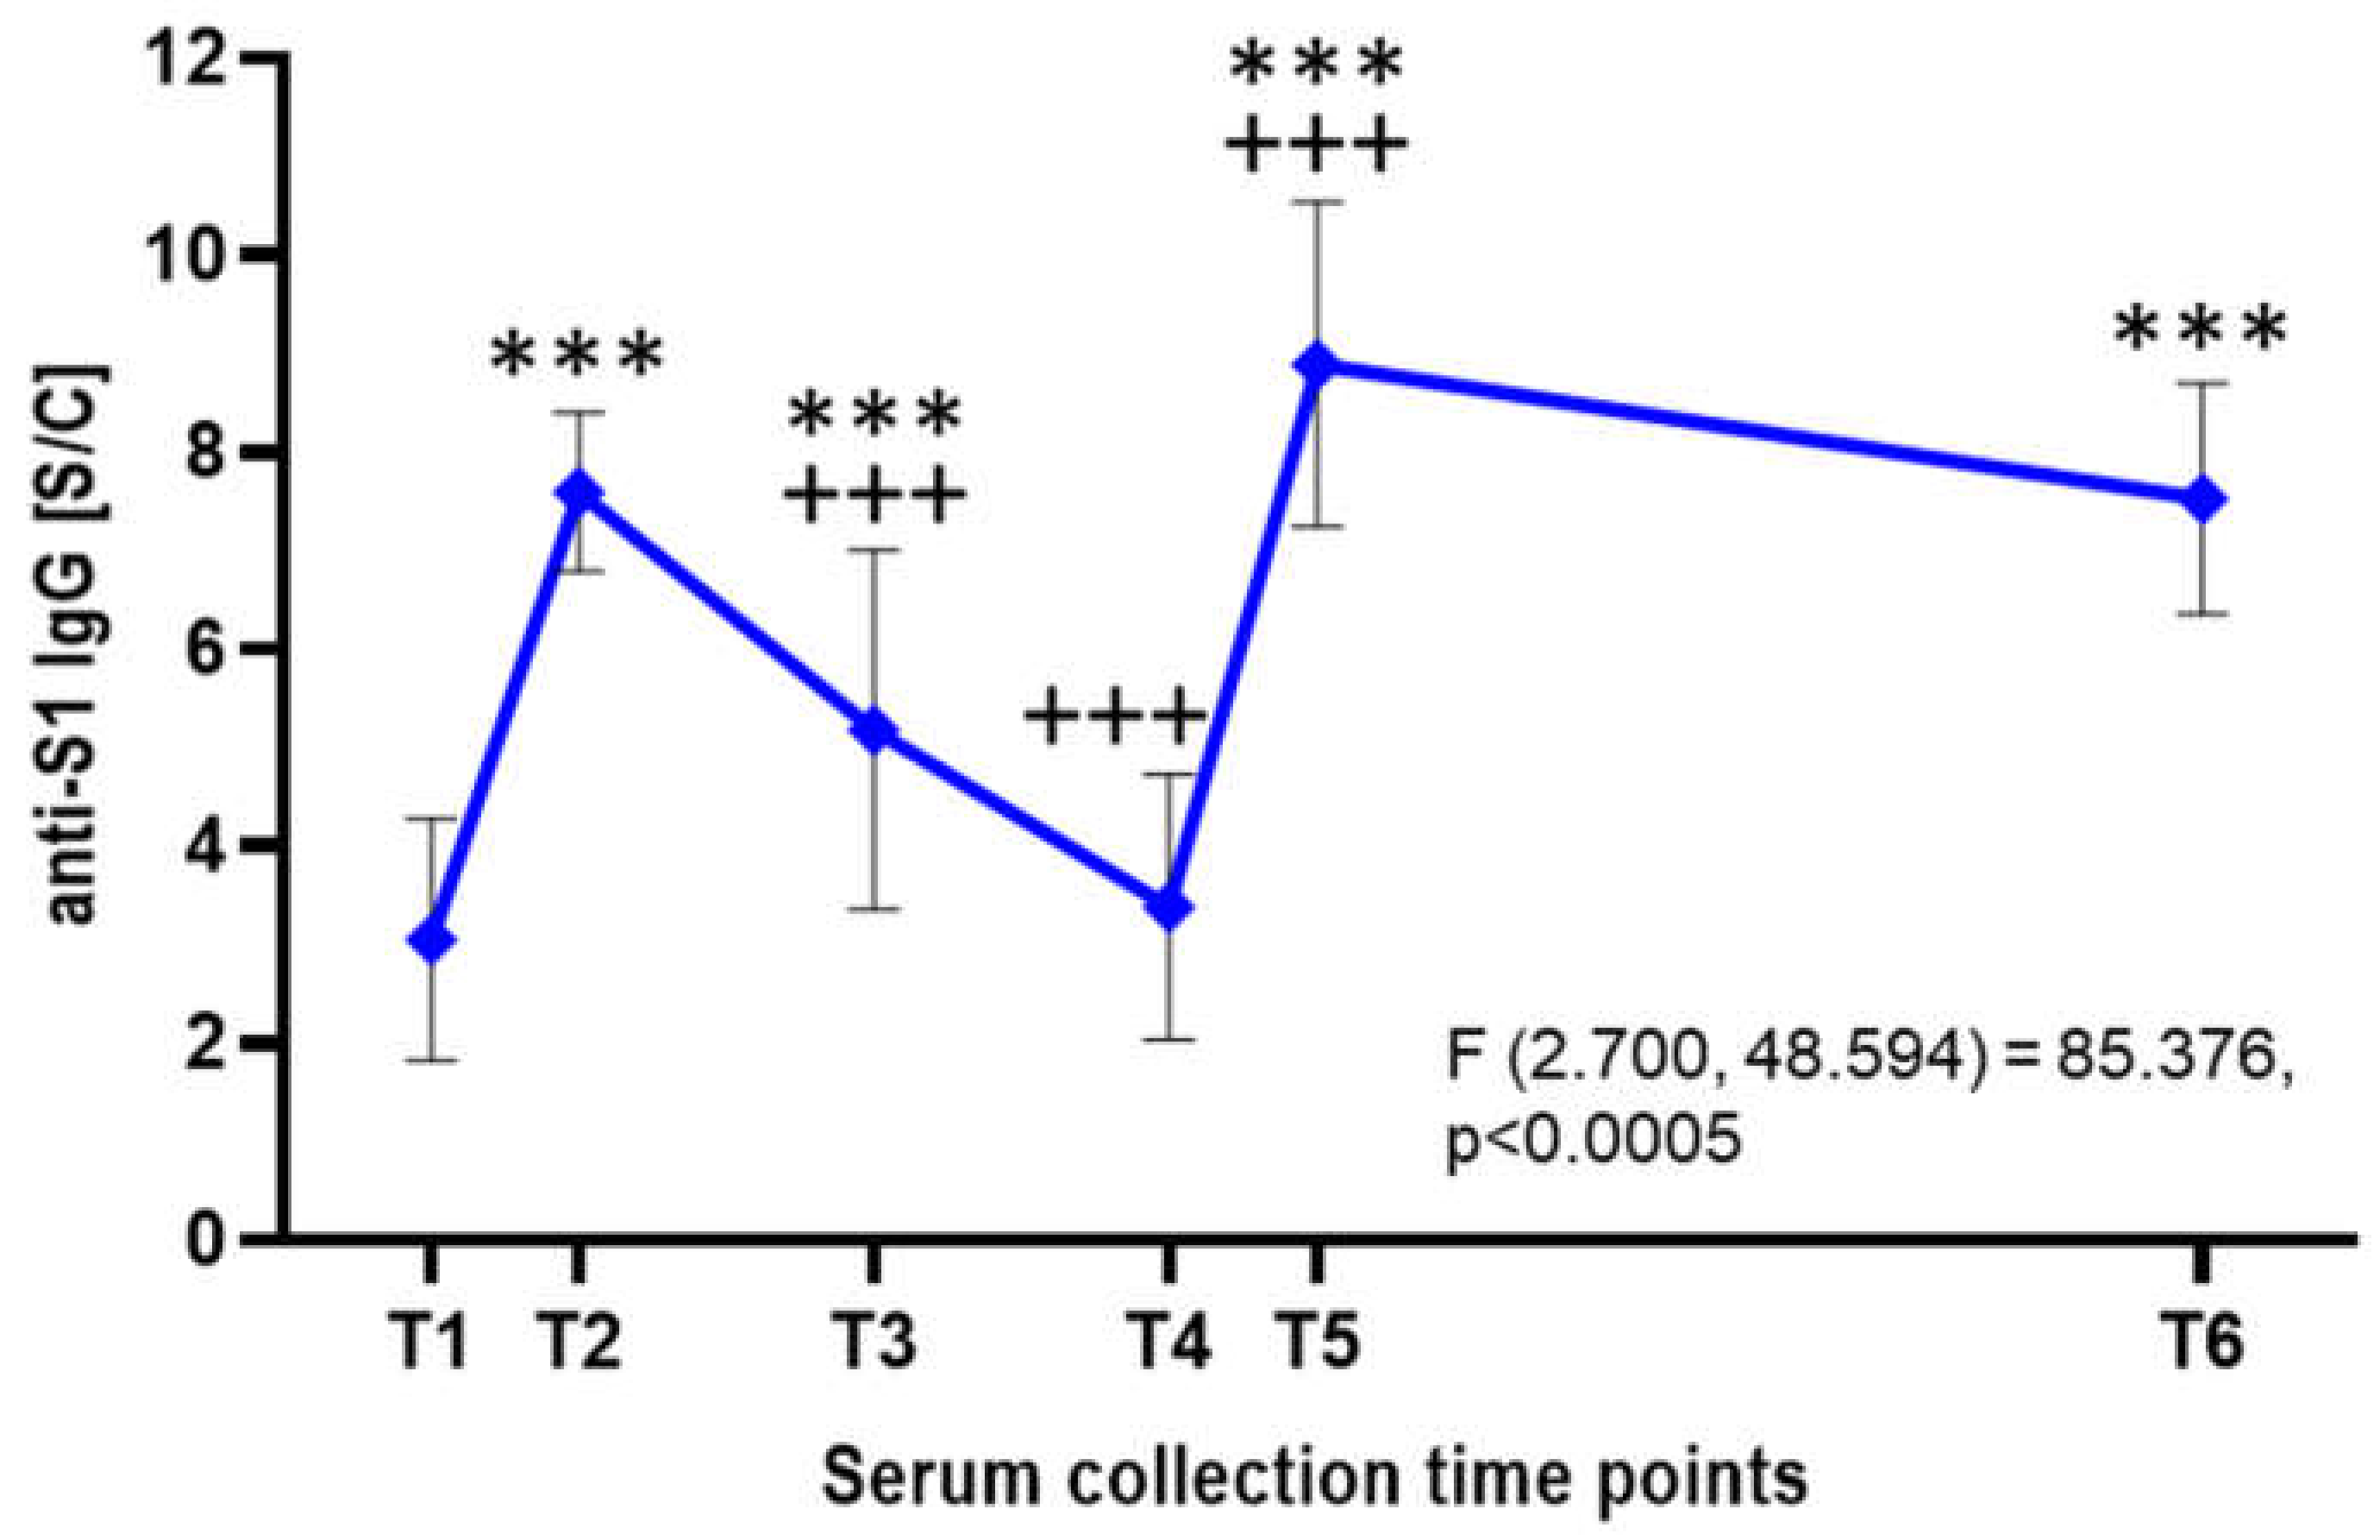
Figure 4.
Correlation Between Anti-S1 IgG Antibody Levels and Neutralization Titers. (A) Dual y-axis plots illustrate the temporal relationship between anti-S1 IgG antibody levels (blue line, right y axis) and neutralization titers (NT50, black lines, left y axis) across six time points. The left y-axis shows the arithmetic mean of neutralization titers for each SARS-CoV-2 variant, while the right y-axis (blue line) represents the mean anti-S1 IgG levels. (B) Correlation plots between NT50 values and anti-S1 IgG levels for each variant. Pearson correlation coefficients (r) with 95% confidence intervals and p values are shown.
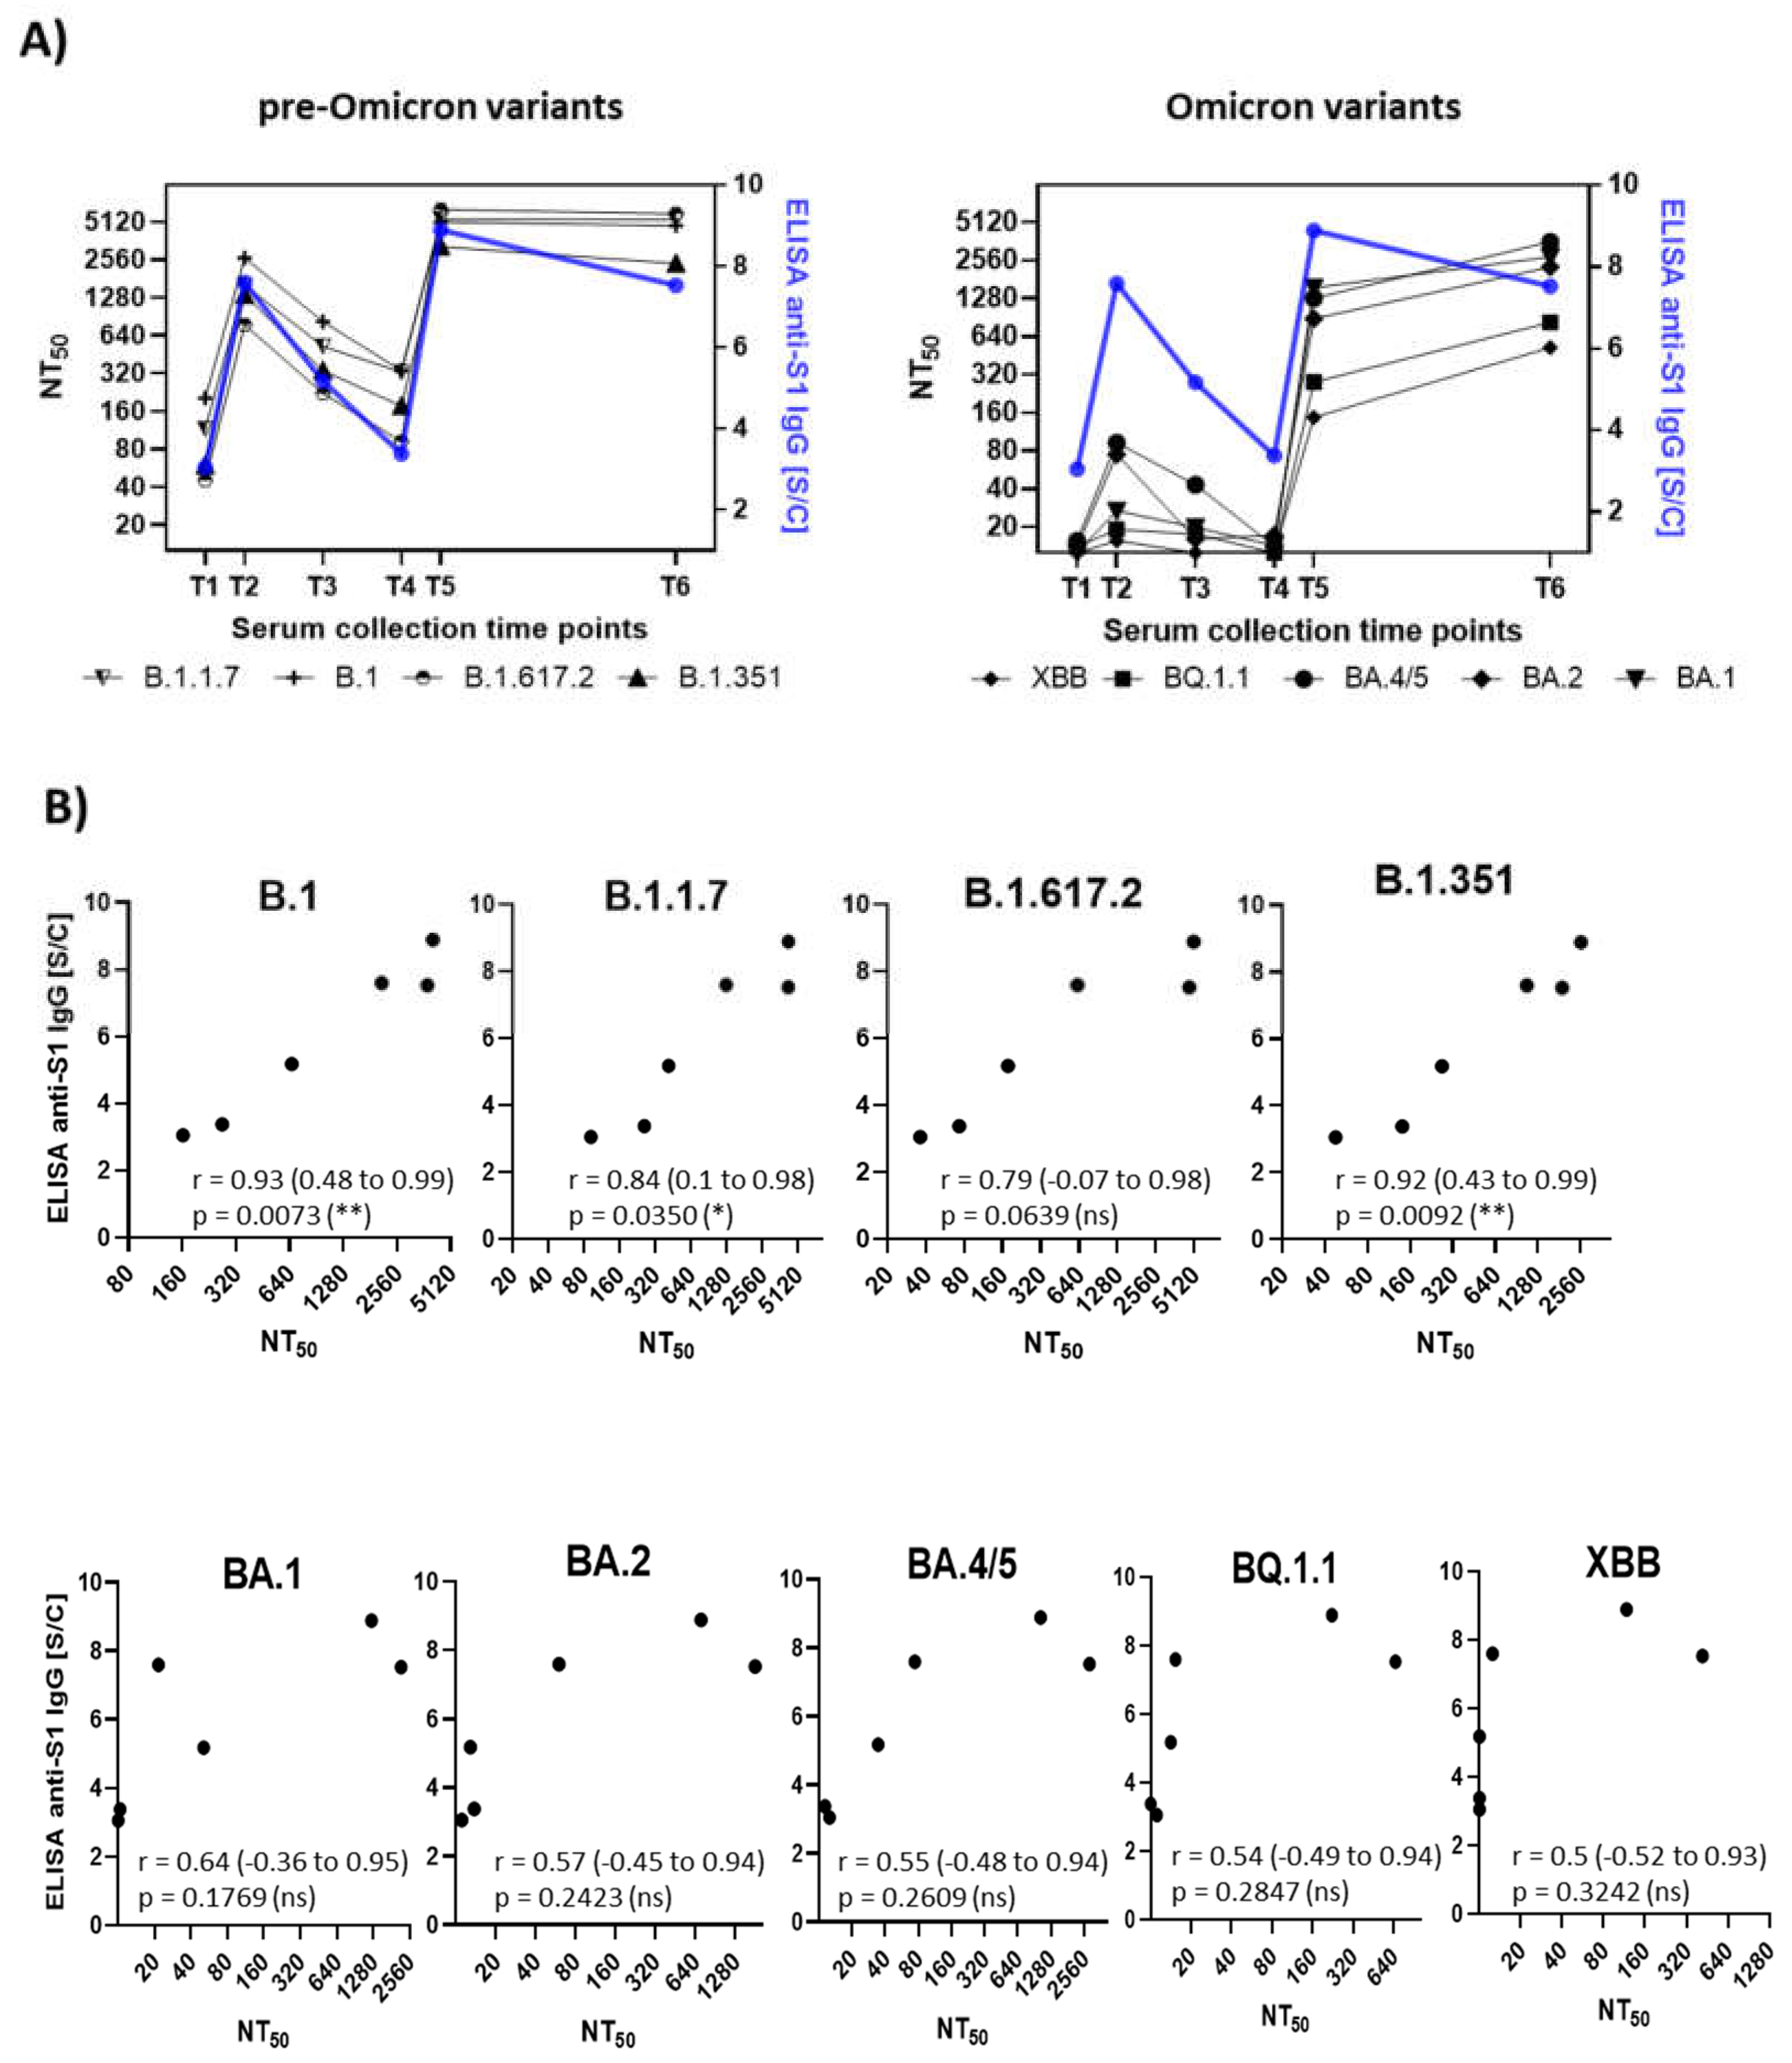
Figure 5.
Neutralization Assays for Nine SARS-CoV-2 Variants. Each graph shows results from pseudotype-based neutralization assays performed for a single SARS-CoV-2 variant, using 114 serum samples collected at six time points from 19 participants (n = 19 per time point). The left column presents results for pre-Omicron variants (B.1, B.1.1.7, B.1.351, B.1.617.2), while the right column displays Omicron subvariants (BA.1, BA.2, BA.4/5, BQ.1.1, XBB). Neutralization titers are expressed as NT50 values.
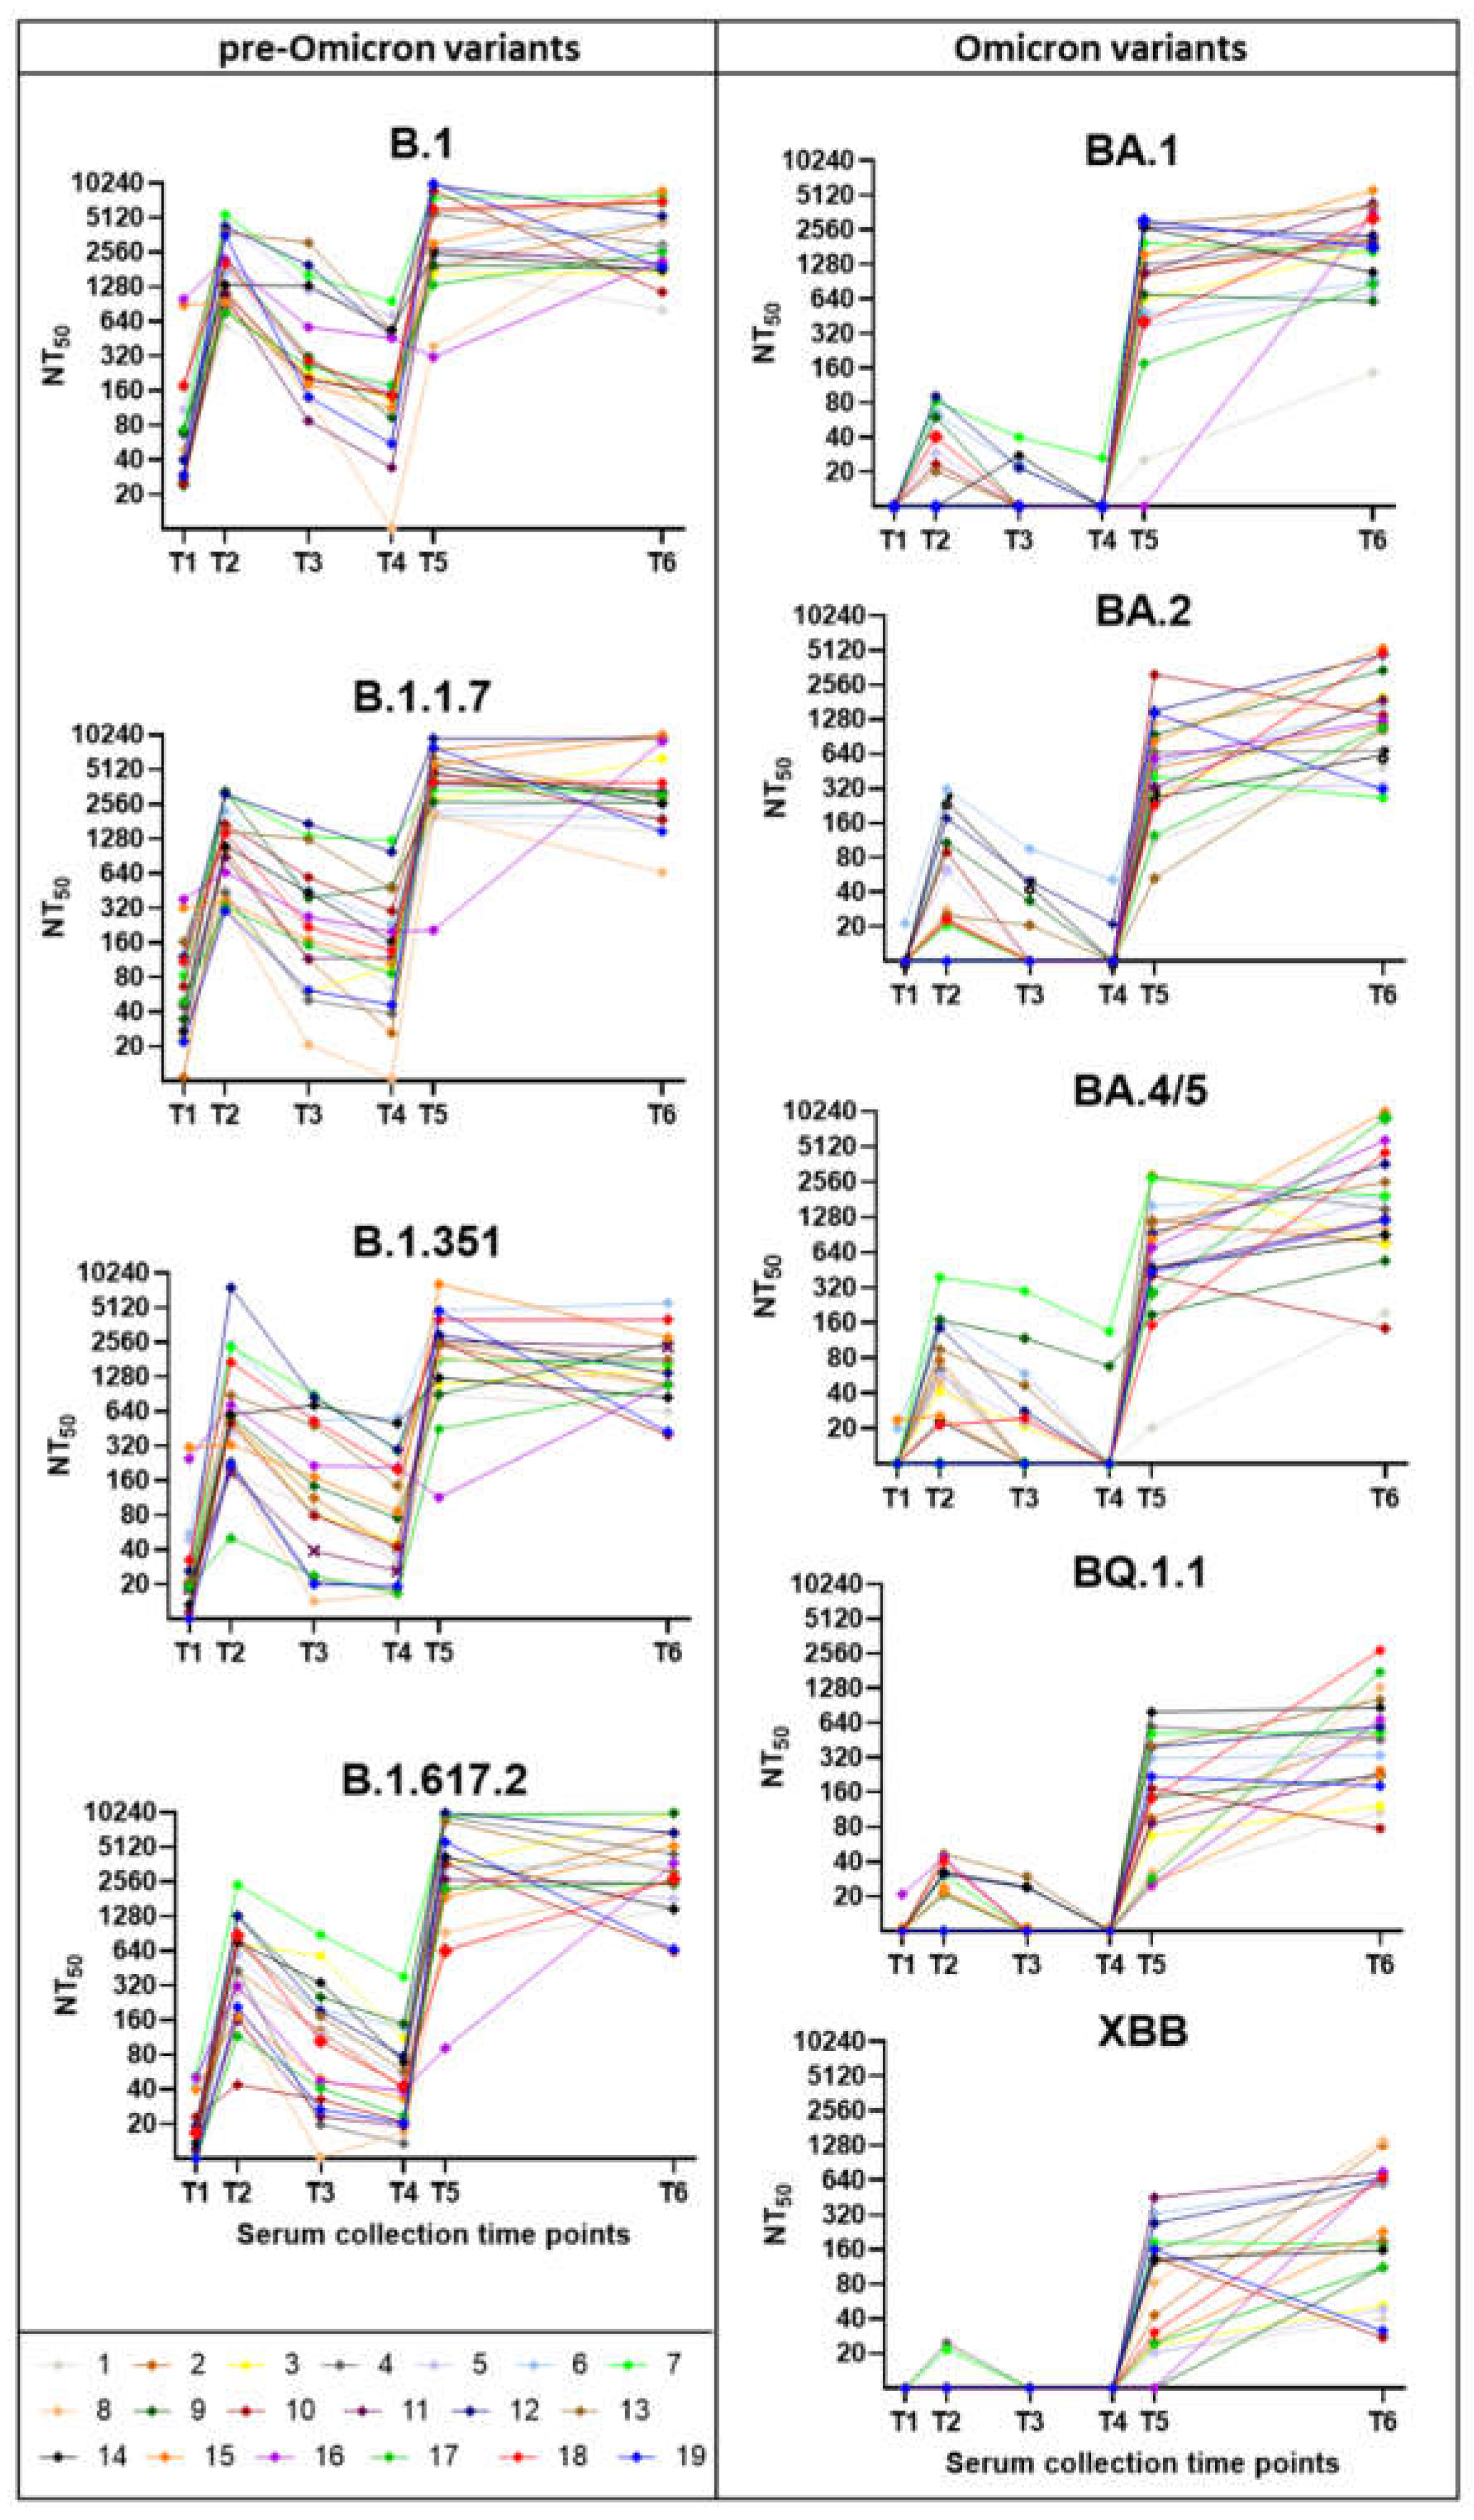
Figure 6.
Decline in Neutralization Capacity of Sera Following the Second Vaccine Dose.The graph compares neutralization titers (NT50) of serum samples collected shortly after the second vaccine dose (T2) and 6–8 months later (T4) from 19 participants (n = 19). Pseudotype-based neutralization assays were performed against four SARS-CoV-2 variants. Repeated measures ANOVA with Bonferoni post hoc test revealed statistically significant declines in B.1, B.1.1.7, p < 0.001 (***); B.1.617.2, p < 0.01 (**); ns, not significant, p > 0.05.
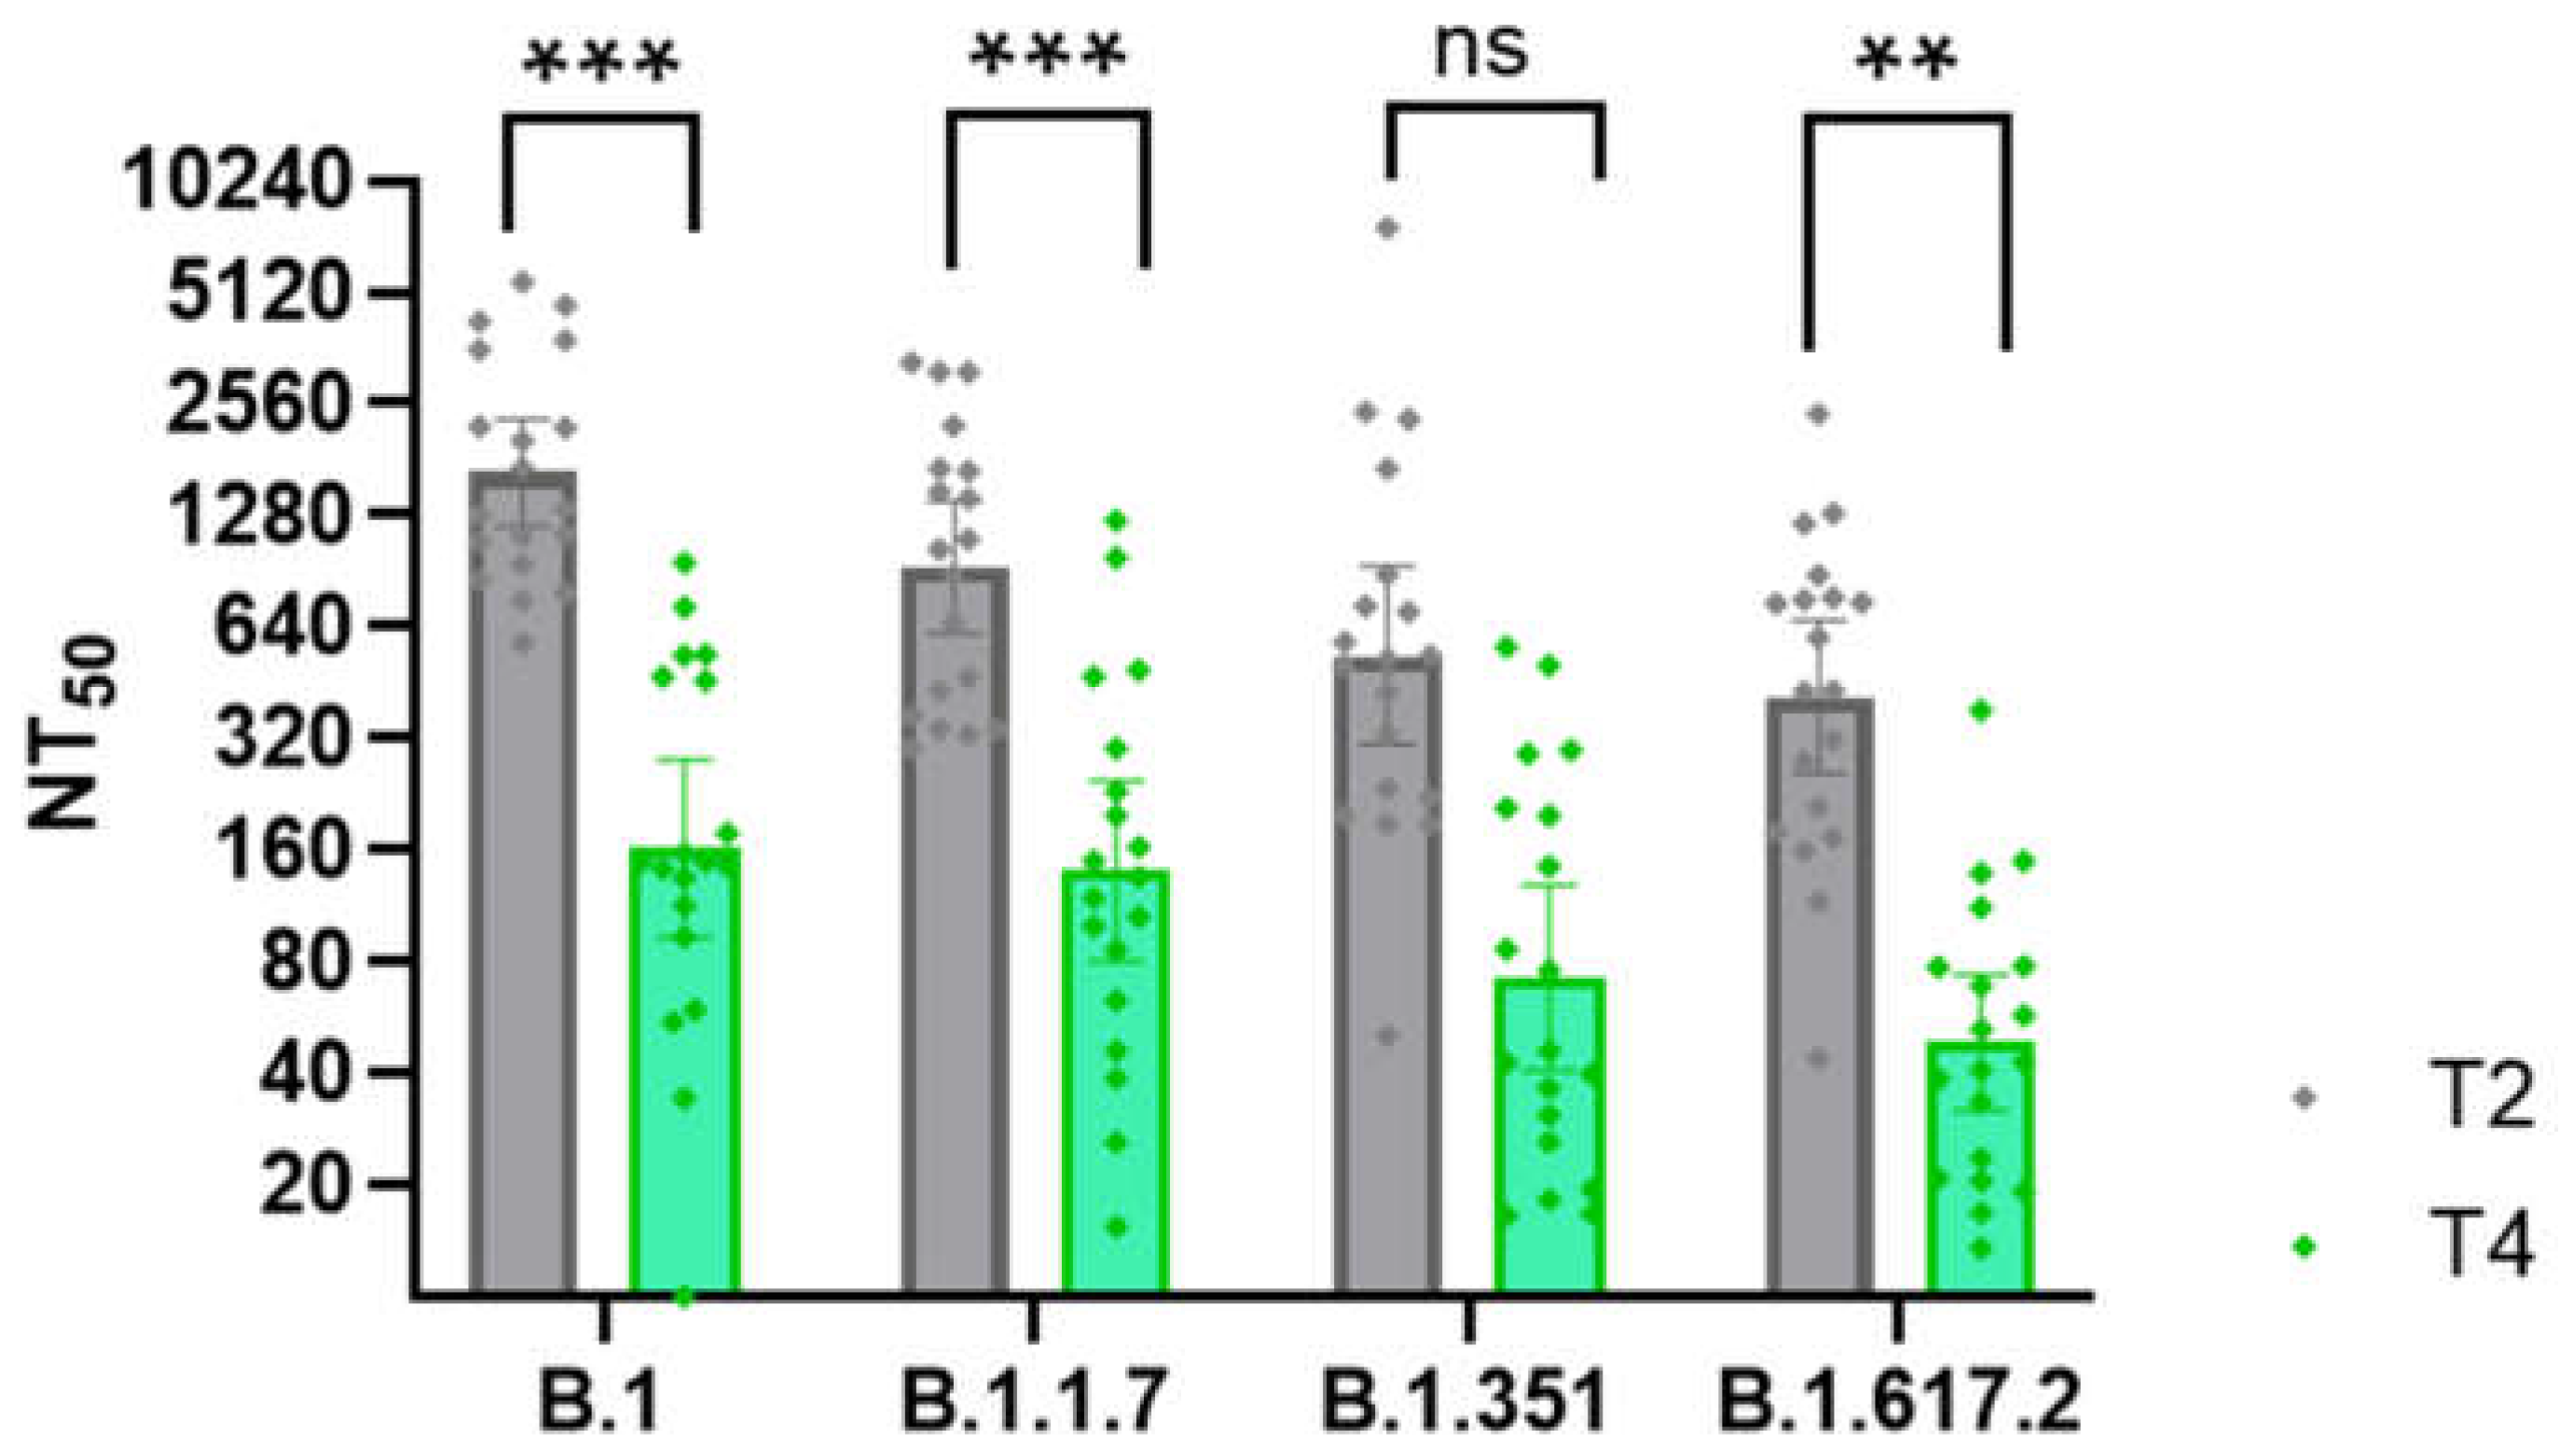
Figure 7.
Neutralization of Omicron Variants Using Serum Samples Collected at T5 and T6. Graphs show changes in neutralization titers (NT50) against Omicron variants and corresponding anti-S1 IgG antibody levels between T5 (2 weeks post-third dose) and T6 (31 months post-first dose) in participants who experienced Omicron infection during the study period (n = 13). Pairwise comparison revealed statistically significant increases in BA.1, BQ.1.1, XBB, p < 0.01 (**);BA.2, p < 0.05 (*); and decline in anti-S1 IgG, p < 0.01 (**).
Disclaimer/Publisher’s Note: The statements, opinions and data contained in all publications are solely those of the individual author(s) and contributor(s) and not of MDPI and/or the editor(s). MDPI and/or the editor(s) disclaim responsibility for any injury to people or property resulting from any ideas, methods, instructions or products referred to in the content. |
© 2025 by the authors. Licensee MDPI, Basel, Switzerland. This article is an open access article distributed under the terms and conditions of the Creative Commons Attribution (CC BY) license (http://creativecommons.org/licenses/by/4.0/).
Copyright: This open access article is published under a Creative Commons CC BY 4.0 license, which permit the free download, distribution, and reuse, provided that the author and preprint are cited in any reuse.


