
Submitted:
10 April 2025
Posted:
10 April 2025
You are already at the latest version
Abstract
High-Test Peroxide (HTP) monopropellant thrusters are being considered for spacecraft lander missions due to their simplicity and reduced toxicity compared to traditional propellants. Pulse-Width Modulation (PWM) throttling is a key technique for precise thrust control in such systems. However, PWM throttling can lead to pressure surges and oscillations in the propellant feed system, potentially compromising system reliability. This study investigates the influence of PWM parameters, specifically duty cycle and frequency, on pressure surges and oscillations in a 50 N-class HTP monopropellant thruster. The objective is to identify stable operating conditions that mitigate these effects, thereby enhancing the reliability of PWM throttling for lander applications.
An experimental setup was developed, including a 50 N-class thruster with a MnO$_2$/La/Al$_2$O$_3$ catalyst and a solenoid valve for PWM control. Cold flow tests using water characterized valve response and water hammer effects, while hot fire tests with 90 wt.\% HTP evaluated thruster performance under steady-state and PWM conditions. Analytical methods, including Joukowsky's equation and power spectral density analysis, were used to interpret the data and understand the underlying mechanisms.
The results showed that while surge pressures generally aligned with steady-state values, specific PWM conditions led to amplified surges, particularly at low duty cycles. Additionally, high duty cycles induced chugging instability. The natural frequencies of the feed system were found to play a crucial role in these phenomena. Stable operating conditions were identified by avoiding duty cycles that cause constructive interference of pressure waves.
This research demonstrates that by carefully selecting PWM parameters based on the feed system's dynamic characteristics, pressure surges and oscillations can be minimized, ensuring reliable operation of HTP monopropellant thrusters in PWM throttling mode. These findings contribute to the development of more efficient and safer propulsion systems for spacecraft landers.
Keywords:
PWM Throttling
; High-Test Peroxide (HTP)
; Monopropellant Thruster
; Water Hammer
; Pressure Surges
; Chugging Instability
1. Introduction
Thrust control refers to adjusting the thrust level generated by a propulsion system according to mission requirements and is primarily applied to liquid propellant rocket engines. It is utilized in missions such as acceleration control of launch vehicles, spacecraft rendezvous operations, and trajectory and attitude control of ballistic and interceptor missiles. For lander missions that require precise velocity and position control during terminal phase of the descent stage called powered descent, thrust control is considered one of the most crucial technologies for the soft landing of the spacecraft [1]. The principle of thrust control can be understood through the thrust equation expressed in Equation (1).
Depending on the propellant and operating environment of the propulsion system, the exhaust velocity at the nozzle exit and the ambient pressure are influenced. Methods to control thrust involve adjusting the remaining variables in the thrust equation: the propellant flow rate , the nozzle exit area , and the pressure of the exhaust gas . The most commonly used method for thrust control is manipulating the flow rate of propellant injected into the thruster. In this context, `throttling,’ which refers to controlling the propellant flow rate, is used synonymously with thrust control [1].
Pulse modulation throttling is a method of controlling the time-averaged thrust by modulating the pulse signal that drives the valve, thereby adjusting the opening and closing of the valve and manipulate the injection of the propellant. Pulse-Width Modulation (PWM) is one of the pulse modulation techniques, which operates at a constant frequency while changing a duty cycle, a proportion of the valve open time to a period of valve’s open/close cycle.
PWM thrust control is advantageous over other means of throttling for its technical simplicity thus higher system reliability and lower cost of development [2]. Furthermore, various guidance and control algorithms for the powered descent maneuvers using pulse modulation have already been studied, suggesting that such throttling technique is suitable for application of small-sized lander spacecraft. A prominent example of the implementation of pulse modulation throttling in lander application is the Mars Polar Lander (MPL) [2], an unmanned mission that attempted to land on Mars using the MR-107N hydrazine monopropellant thruster with pulse modulation thrust control. Although the mission failed, the lessons learned were instrumental in the success of the Phoenix lander [3], which employed the same technique to achieve a controlled descent and successful landing on the Martian surface. In 2016, ESA’s unmanned Mars lander, Schiaparelli [4], implemented a pulse modulated retro-propulsion system for powered descent. Meanwhile, Earth-based lander test beds, such as NASA’s warm gas test article for the Robotic Lunar Lander Development Project [5] or KAIST’s DALBIT-1 [6], were developed implementing pulse modulation thrust control to serve as flying test platforms for validating planetary landing technologies.
Nevertheless, PWM thrust control incorporates several significant drawbacks, including reduced propellant efficiency during transients, limited thrust levels, and substantial dependence on the performance of flow control valves. Notably, the abrupt closure of the valve during cyclic operation of PWM throttling generates high surge pressure due to water hammer effects, potentially damaging the propellant feed system and leading to propulsion system failure [1]. Such amplified pressure oscillations may also induce unstable propellant injection and incomplete combustion, degrading performance and imposing excessive structural vibration. For instance, one hypothesized failure mode in the loss of the MPL was feed component failure due to a water hammer-induced pressure surge [7]. A substantial amount of tests and verification were performed during the development of the subsequent Phoenix lander to mitigate potential system failure caused by PWM throttling [3].
For stable and reliable PWM throttling, understanding the propulsion system’s response to varying conditions of repetitive cycles is critical. Parameters of the modulated pulses, such as duty cycle and frequency, are known to govern the response of the feed system and thruster, significantly influencing the performance and structural integrity of the propulsion system. For example, pulse conditions that exacerbate oscillations throughout the propellant feed system and thruster could result in structural failure, leakage at feed components, or degradation and attrition of the catalyst. Martin et al. [8] reported that the conditions of high (greater than 80%) or low (less than 25%) duty cycles in 10 Hz frequency were avoided in the MPL mission to prevent the onset of the excessive pressure oscillations, which may lead to system instability and potential thruster backflow.
In this study, PWM throttling was experimentally investigated using a 50 N-class High-Test Peroxide (HTP) monopropellant thruster to identify pulse parameters exacerbating pressure surges and oscillations. The aim was to clarify relationships among valve response, propellant feed system properties, pulse conditions, and catalytic reactor responses amplifying these effects. Cold flow tests were conducted to characterize valve and feed system responses to the steady-state and pulse operation. Subsequently, steady-state hot fire tests verified thruster performance fidelity. PWM throttling was then performed at 10 Hz, with duty cycles ranging from 10 to 80% in 10% increments, to assess system response to repeated propellant injection cycles. A mechanism causing excessive pressure surges and oscillations was proposed and validated with experimental data. Mathematical correlation of identifying the pulse conditions that invoke such phenomena was derived.
2. Experimental Setup
2.1. HTP Monopropellant Propulsion System
2.1.1. Hight-Test Peroxide (HTP)
Thrusters utilizing hydrazine-based liquid propellants, widely used since the early days of space development, provide high specific impulse for excellent propellant efficiency and a low adiabatic decomposition temperature for reliable operation. However, these propellants are highly toxic and carcinogenic [9]. Their extreme toxicity necessitates advanced safety equipment and machinery for handling. Additionally, environmental pollution from decomposition gases limits access to experimental facilities, elevating development time and costs.
Research is actively exploring environmentally friendly, cost-effective, and efficient alternatives to hydrazine-based propellants. Key candidates include hydroxylammonium nitrate (HAN), ammonium dinitramide (ADN), and high-test peroxide (HTP), with HTP being a leading focus. Compared to hydrazine, HTP is easier to handle, offers superior stability and storability, and reduces operational costs. Its decomposition into water and oxygen is non-toxic, making it a promising substitute for toxic propellants [9]. Per Table 1, H2O2 has a lower specific impulse than hydrazine, reducing efficiency, but its high density yields a greater density-specific impulse, and its high specific heat enhances stability [10,11]. HTP decomposes catalytically or thermally per Equation (2), producing high-temperature water vapor and oxygen.
As the concentration of HTP increases, its adiabatic decomposition temperature, specific impulse, and density rise, enhancing its propellant suitability. However, the elevated decomposition temperatures of high concentrations are more likely to degrade catalysts, reducing its performance. Reduced heat capacity may also impair stability. Additionally, HTP costs rise with concentration. In this study, a 90 wt.% HTP from HABO Chemical Company was selected as the monopropellant, considering the cost of experiments and the readiness of the material acquisition.
2.1.2. MnO2/La/Al2O3 Catalyst
The catalyst in a thruster is exposed to a high temperature and pressure. During pulse operation, periodic injection of a high-momentum liquid propellant jet heightens mechanical and thermal stress. Hearn et al. [12] noted that this causes significant temperature fluctuations, weakening the bond between the catalyst support and active material due to differential thermal expansion. Excessive stress may fracture the catalyst, raising pressure drop and instability in the bed, leading to performance degradation or even system failure. Past studies [13,14,15] observed increased pressure drop and instability in HTP monopropellant thrusters after pulse operation, attributing it to catalyst damage from high-momentum propellant injection.
To stably perform PWM throttling of a HTP monopropellant thruster, it is essential to use a catalyst with high resistance to mechanical and thermal stress while maintaining adequate decomposition performance. In this study, MnO2/La/Al2O3 catalyst based on a lanthanum-doped -alumina support was selected and used in experiments. The catalyst overcomes the limitations of conventional -alumina based catalyst, which lacks durability in high pressure and large thermal gradient, by doping the support with lanthanum to enhance the resistance against the mechanical and thermal stress. The MnO2/La/Al2O3 catalyst exhibited lower BET surface area thus inferior reactivity compared to conventional -alumina based catalysts but demonstrated to withstand greater compressive loads from the high-momentum liquid jet, making it suitable for the pulse operation. Catalyst preparation was conducted by following the procedures suggested by Kang et al. [16] and An et al. [17]. Lanthanum from a Lanthanum Nitrate solution (La(NO3)3) was doped on commercial -alumina using wet-impregnation method. Manganese Oxide (MnO2) from a Sodium Permanganate solution (NaMnO4) was then deposited on the catalyst support using wet-impregnation method. Then, catalyst with the size of 16-18 mesh (1.19-1.00 mm) was selectively chosen and was used for the test.
2.1.3. HTP Monopropellant Thruster
A 50 N-class monopropellant thruster using 90 wt.% High-Test Peroxide (HTP) was designed and fabricated. Figure 1 shows its four main components: solenoid valve, injector, catalytic reactor, and chamber/nozzle assembly. Design parameters were obtained using Rocket Propulsion Analysis (RPA) software from RP Software+Engineering UG and are listed in Table 3. A suspended-armature solenoid valve from Space Solutions was mounted immediately upstream of the injector to reduce response time and dribble volume loss. Additionally, a thermal shield was incorporated to prevent heat transfer from the thruster to the valve and beyond.
To decouple the dynamic interaction between the propellant feeding system and the catalytic reactor, the injector was designed to impose the pressure drop of approximately 20% of the chamber pressure across the orifice. Assuming a discharge coefficient (Cd) of approximately 0.7, the injector was designed to exhibit 18 orifices of 350 µm of diameter, providing 4 bar of pressure drop at the designed mass flow rate. Following an empirical approach by An et al. [18], the catalytic reactor size was determined based on catalyst decomposition capacity (Equation (3)). For the MnO2/La/Al2O3 catalyst, a conservative decomposition capacity of 1.9 g/(s·cm2) was selected from prior studies. A 15° conical nozzle with a 4.86 mm throat diameter and 3.18 expansion ratio was selected to achieve 50 N thrust at sea level.
2.1.4. Propellant Feeding System and DAQ
Figure 2 shows the propellant feeding system, designed to deliver the desired mass flow rate to the HTP monopropellant thruster by pressurizing the propellant tank with high-pressure nitrogen gas. A regulator upstream of the tank maintains constant pressure during operation. A check valve and relief valve prevent propellant backflow and vent gas from the tank during a pressure surge. Pneumatic valves control propellant and purging gas flow. A turbine flow meter measures the propellant’s volumetric flow rate once steady state is reached. A solenoid valve is mounted closely upstream of the injector operated with the modulated valve drive signals which will be further explained in Section 2.2.1.
Pressure, temperature, thrust, propellant flow rate, and command signals were measured using National Instruments’ (NI) cDAQ-9174 with NI-9220 and NI-9213 modules, controlled by DASYLab. Sensor data were recorded at 1,000 Hz for pressure and thrust and 200 Hz for temperature, with a 100 kHz filter to remove high-frequency noise. Pressure transducers (Sensys PSHD series) with capacities of 70 bar, 50 bar, and 35 bar were installed, with higher-capacity units downstream of the propellant tank and upstream of the solenoid valve where surge pressure occurs. Temperature was measured using Omega K-type thermocouples. Thrust was measured with a calibrated Dacell CMM-2 load cell.
Pressure transducers were installed at five locations: P1 (downstream of the propellant tank), P2 (upstream of the solenoid valve), P3 (injector manifold), P4 (catalytic reactor inlet), and P5 (chamber). Temperature sensors were placed at four locations: T1 (catalytic reactor inlet), T2 (halfway through the reactor), T3 (catalytic reactor outlet), and T4 (chamber).
The integrated test setup, shown in Figure 3, includes the propellant feeding system, valve drive equipment, DAQ hardware, sensors, and thruster on a mobile platform. A polycarbonate shield protects operators from propellant leakage. The 50 N-class HTP thruster was secured to a slide bearing via a bracket, with a load cell at the front measuring thrust.
2.2. Valve and Electronics
2.2.1. Solenoid Valve
In this study, a solenoid valve designed and manufactured by Space Solutions was employed to regulate propellant injection using modulated valve drive signals. The solenoid valve, shown in Figure 4, integrates a suspended armature design with features of the sliding fit type. Although the sliding fit type is simpler, it is susceptible to surface friction and difficult to optimize for performance and reliability. Conversely, the suspended armature solenoid valve is compact, lightweight, highly resistant to mechanical abrasion and contamination, and generates minimal friction, making it ideal for long-term space applications. Figure 5 depicts the internal components of the solenoid valve: armature, S-spring, conventional spring, and elastomer seal. The S-spring is integrated with the armature, while the conventional spring is mounted on the opposite side. An elastomer seal, affixed to the armature’s base, obstructs the flow path when the armature contacts the valve seat in the absence of a drive signal.
2.2.2. Valve control system
The valve control system generates valve drive signals at specific frequencies and duty cycles to operate the solenoid valve under predetermined pulse conditions. Figure illustrates the system’s five main components: a computer, microprocessor, oscilloscope, power supply, and valve drive electronics (VDE) circuit. The computer, connected to the microprocessor, supplies power and transmits code developed using Arduino IDE to generate command signals for the desired pulse conditions. An Arduino Mega 2560 microprocessor generates the command signal and transmits it to the VDE circuit and data acquisition (DAQ) device. As the command signal from the microprocessor is only 5 V, a power supply connected to the VDE amplifies it to 28 V—the solenoid valve’s operating voltage—while preserving signal characteristics. Design requirements listed in Table 4 ensured precise valve actuation: rise and fall times of command and valve drive signals were limited to <1 ms, duty cycle error to <1%, and phase difference to <1 ms. The VDE, utilizing a P-channel MOSFET and PNP transistor, incorporates a flyback diode to mitigate back EMF spikes. After testing, Fairchild SPF-9530 (MOSFET), TIP-120 (PNP transistor), and Diode Incorporated’s 6A10 (diode) were selected, with a 10 k resistor. A Tektronix DPO-3052 oscilloscope validated the system at 10 Hz with duty cycles of 10 - 90%, targeting extremes that impose the greatest load on the VDE. Measurements confirmed the system exceeded design requirements as shown in Table 5 and was used in hot fire tests.
3. Experimental Results
3.1. Cold Flow Test
3.1.1. Valve Response Characteristics
A cold flow test using water as a simulant characterized valve response, excluding the catalytic reactor and chamber/nozzle assembly. The propellant tank was pressurized to replicate the mass flow rate of the hot fire test conditions. Opening response delay (ORD) is the time from the "On" pulse to the maximum upstream pressure drop; closing response delay (CRD) is from the "Off" pulse to the maximum pressure surge. Post-opening perturbations arise from rarefaction waves, while post-closing perturbations stem from water hammer-induced compression waves. Tests ran at 5 Hz and 10 Hz with duty cycles (DC) of 10–90% in 10% increments, benchmarked against MPL, Mighty Eagle, and DALBIT-1 operations [5,6,8]. Analysis showed consistent ORD ( 8 ms) and CRD ( 25 ms) across frequencies and DCs, with valve response delay (VRD) from actuation onset to completion at 3.5 ms for both opening and closure. At Hz with DC = 80% and 90%, and Hz with DC = 90%, the valve remained open, exhibiting no water hammer surge. Figure 6 illustrates the difference between intended () and actual () valve closure times, per Equation (4). A negative indicates persistent valve opening during PWM throttling. For , the solenoid’s electromagnetic force, exceeding spring force, sustains an open state and restrains the armature’s movement to the closed position. At 10 Hz with DC = 80% and 90%, values were 3 ms and -7 ms; at 5 Hz with DC = 90%, it was 3 ms, suggesting a persistent open state. Reducing CRD is key to expanding the PWM thrust control range.
3.1.2. Pressure Surge by Water Hammer
Surge pressure is the rapid upstream pressure increase when fluid flow stops abruptly due to rapid valve closure. Excessive surge pressure can damage feed components or cause system failure, potentially impacting thruster performance. Prior studies [8,19,20] have modeled, tested, and analyzed water hammer effects during pulse modulation thrust control to evaluate their impact on propulsion system prior to the hot fire tests. Generally, surge pressure is calculated using Joukowsky’s instantaneous water hammer equation (Equation (5)), based on fluid density , speed of sound in the fluid c, and fluid velocity . The speed of sound was calculated assuming a bulk modulus of water K at 2.2 GPa, a Young’s modulus of the propellant feed line E at 180 GPa, and pipe dimensions of 6.35 mm diameter D and 1.27 mm thickness e .
Table 6 compares theoretical surge pressure, calculated via Joukowsky’s equation, with cold flow test measurements. Measured values closely matched theoretical predictions from Equation (5). Discrepancies likely arise from deviations in the time consumption for valve closure, feed component geometry with the actual propellant feeding system and shear stress between the fluid and pipe wall.
Figure 7 shows the mean and standard deviation of surge pressure during pulse operation at = 5 and 10 Hz, with DC = 10% to 90%. As noted in Section 3.1.1, surge pressures could not be measured under conditions with insufficient valve closure. Surge pressures during pulse operation were comparable to steady-state values, with similar discrepancies between theoretical and measured results. While repetitive valve actuation had minimal impact on surge pressure, a slight decrease in surge pressure was observed with increasing duty cycle. This trend likely stems from persistent pressure at the injector manifold, which buffers and curbs sudden liquid flow upon valve opening. Figure 8 displays pressure measurements at the valve upstream and injector manifold during = 10 Hz pulse operation with DC = 20% and 50%. Longer valve closure times (i.e., lower duty cycles) expel more liquid from the manifold, lowering manifold pressure. Upon valve opening, the increased pressure differential across the valve boosts mass flow rate, which stabilizes over time. However, with shorter valve open times, closure precedes stabilization of the enhanced flow. Per Equation (5), this results in elevated surge pressure, as observed.
Notably, the water hammer-induced pressure surge is immediately followed by a secondary spike and consistent-wavelength oscillations. This stems from water’s high bulk modulus, causing pressure fluctuations that drop below vapor pressure, inducing cavitation. Cavitation upstream of the valve triggers backflow, which collides with the wall, generating another surge. The less intense secondary spike raises the fluctuation’s trough above vapor pressure, after which normal perturbations resume.
3.2. Hot Fire Test
3.2.1. Steady-State Operation
Before pulse-mode hot fire tests, steady-state hot fire tests evaluated thruster performance against design targets to detect design or fabrication flaws. Table 7 summarizes steady-state test outcomes, while Figure 9 displays pressure and temperature data. The chamber pressure reached 18 bar, which is 2 bar less than the design value, due to a mismatch between the designed (4.86 mm) and fabricated (5.3 mm) nozzle throat diameters. This increased throat area reduced chamber pressure buildup, degrading performance. Also, a thermocouple failure hindered accurate temperature measurement at the catalytic reactor’s midpoint and neglected in the measurement. Figure 9 shows temperature trends at the reactor inlet, outlet, and chamber. The chamber temperature of 734.55°C closely aligned with the adiabatic decomposition temperature of 90 wt.% HTP (746.17°C), suggesting an effective catalyst bed design with minimal heat loss through the thruster walls.
The mean surge pressure in steady-state hot fire tests was 39.33 bar, with a mean pressure at valve upstream of 32 bar. The lower surge pressure relative to water likely stems from HTP’s smaller bulk modulus, preventing cavitation and the onset of the secondary water hammer.
Feed line characteristics was investigated using pressure perturbation measurement obtained from steady-state hot fire tests. The "ping test", per Martin et al. [8], uses the pressure response after valve closure to determine the natural frequency of the propellant feeding system. To determine the natural frequency, pressure data upstream of the valve (P2) were converted from time to frequency domain, shown in a power spectral density (PSD) plot (Figure 10). The ping test indicated that the feed line’s natural frequency with the valve closed () was 36.11 Hz. Similarly, the feed line’s natural frequency with the valve opened () was obtained as 24.51 Hz through FFT analysis using the the pressure oscillation measurement acquired at the valve upstream at the moment of valve opening.
3.2.2. PWM Throttling Operation
The hot fire test sequence for pulse operation, depicted in Figure 11, proceeded as follows. Since decomposition capability of the catalyst is highly dependent on its temperature, it was essential to keep the catalyst’s temperature identical for all cases before the pulse mode firing begins in order to make an appropriate comparison Hence, the thruster operated steadily for 3 seconds to elevate the catalyst bed temperature, ensuring complete propellant decomposition. A 1-second pause then mitigated steady-state effects and water hammer perturbations from influencing the propulsion system operating PWM throttling. Subsequently, command signals for preset pulse conditions actuated the solenoid valve for 6 seconds, enabling thruster pulse operation. In the hot fire test, PWM throttling operated at Hz. A trade-off exists: higher frequencies favor precise and responsive maneuvers, crucial for lander applications, but require a high-performance solenoid valve with limited mass flow rate and DC range. Thus, 10 Hz is a suitable compromise for lander applications, validated by prior references including MPL, Phoenix, Mighty Eagle, and DALBIT-1 [3,5,6,8].
Figure 12 shows pressure, thrust, and valve drive signal data from a 50 N-class HTP monopropellant thruster operated in pulse mode at = 10 Hz with DC = 10 - 90%. Pressure spikes and subsequent oscillations in the propellant feed system occur shortly after the "off" signal, while sharp pressure drops follow the "on" signal. These drops stem from rarefaction waves traveling through the feed line upon valve opening. Oscillations decay faster for rarefaction waves than for compression waves, as liquid flow dissipates and suppresses wave propagation. Similar to cold flow test results, the valve did not close at = 10 Hz with DC = 80 and 90% and at = 5 Hz with DC = 90%. Upstream pressure measurements showed no compression or rarefaction waves, indicating no valve actuation and thus no PWM throttling. Figure 12 displays fluctuating thrust readings during valve closure, likely due to structural vibration in the propellant feed system affecting the measurement device. This suggests that past pulse operations influence future fluid dynamics not only via wave propagation through the feed line but also through residual structural vibration.
Figure 13 illustrates the opening response delay (ORD) and closing response delay (CRD) from PWM throttling at Hz across various duty cycles (DC). Both ORD (11 ms) and CRD (27.5 ms) increased relative to the cold flow test, likely due to elevated upstream pressure. Data for DC = 80% are disregarded, as the prolonged CRD causes the valve to remain open throughout the pulse operation. Notably, the CRD at DC = 10% is shorter than other pulse condition, which will be further described below.
Water hammer pressures from pulse-width modulation (PWM) throttling at both frequencies were compared to steady-state measurements. Figure 14 shows the mean and standard deviation of surge pressures across duty cycles. In pulse operation, surge pressures generally align with the steady-state value of 39.33 bar. However, at = 10 Hz with DC = 10% and 40%, surge pressures exceed this average, peaking at 50.55 bar for the 10 Hz, 10% duty cycle condition. At = 5 Hz, surge pressure variations were minimal. Unlike cold flow tests, prolonged valve closure does not account for the amplification observed in = 10 Hz with DC = 10% condition, as surge pressures remained stable at = 5 Hz, DC = 10% despite that the injector manifold pressure was lower than that of = 10 Hz, DC = 10% duty cycle.
The amplified surge pressure at Hz, DC = 10% likely explains the shorter CRD compared to other conditions. In the solenoid valve, an elastomer seal on the armature blocks the flow path when springs return it to its base upon power cessation. Elevated upstream pressure assists this motion. When surge pressure significantly exceeds that in other conditions, the increased force on the armature reduces closure time, thereby reducing CRD, as shown in Figure 13.
Prior research offers insight into this phenomenon. Martin et al. [8] noted that waves from prior water hammer events affect subsequent pressure fluctuations. The solenoid valve’s electromagnetic force induces fluid oscillations, generating compression or rarefaction waves in the feed line based on actuation mode. When the valve opens, a rarefaction wave is generated at Hz. Conversely, a compression wave arises upon valve closure at Hz. Thus, repetitive actuation fills the feed line with pressure waves at frequencies of either or , propagating between the propellant tank and valve with varying phases. Superposition between these waves, under specific pulse conditions, can lead to amplified surge pressure or pressure drops, as shown in Figure 14. Two scenarios emerge: (1) valve closure induces a pressure surge via water hammer and the peak of the surge aligns with the crest of the pressure oscillation created from prior valve opening, or (2) valve opening induces a perturbation and the phase of undermost pressure drop aligns with the trough created from the prior valve closure.
The first scenario is described by Equation (6), which identifies pulse conditions that satisfy the criterion for constructive interference of pressure waves from consecutive valve actuations. Notably, CRD decreases with escalating surge pressure. The extended propagation of a wave before it superposes with the next actuation gradually dampens its intensity, thereby reducing the interference effect of the pulse conditions with higher n. Figure 15 depicts pulse conditions that satisfy this criterion with varying CRD. For n = 1 to 3, DC = 10% and 45% can provoke amplification, contingent on matching CRD to surge pressure. DC = 10% closely aligns with the criterion, explaining the amplified surge pressure in Figure 14, while DC = 40% borders an unstable point, offset by 5%, resulting in moderate surge pressure increase as shown in the Figure. The unstable point at (DC = 80%) cannot be achieved, as it causes the valve to remain open during PWM throttling.
Figure 16 shows the power spectral density (PSD) estimate, derived via Welch’s method from pressure data at the solenoid valve upstream during valve opening. Due to abrupt flow changes from valve actuation, PSD analysis includes only measurements during valve opening. The figure reveals peaks at harmonics of the fundamental frequency, indicating that cyclic valve actuation serves as a source of forced oscillation. High surge pressure conditions (DC = 10% and 40%) exhibit a dominant peak and its first overtone near the natural frequency for the closed-valve configuration ( Hz). This demonstrates that existing perturbations constructively interfere with newly generated oscillations from water hammer, intensifying the oscillation.
The second scenario is described by Equation (7), which identifies pulse conditions that the opening of the valve constructively interfere with the existing perturbation created by the previous valve closure, so that the pressure drop by the rarefaction wave could be amplified. Similar to CRD shortens with the increase of mean and surge pressure, the drop in valve upstream pressure could also shorten the ORD, by reducing the force acting on the armature that pushes it against the base.
Figure 17 depicts pulse conditions satisfying this criterion for varying CRD, which depends on upstream valve pressure. For to 3, DC = 70%, 40%, and 16% can induce amplification if CRD aligns with surge pressure. DC = 70% matches the constructive interference condition, while DC = 40% nears the sufficient condition but undergoes greater damping in the first overtone due to extended propagation before interference. Unlike the first scenario, constructive interference here significantly lowers pressure when the valve opens, flushing liquid out of the feed line. Given the valve closure duration and wave propagation dampening the perturbation, the pressure oscillation contributing to surge pressure increase is negligible by valve closure.
Figure 18 shows the PSD estimate from pressure measurements upstream of the valve while it is closed. Many peaks correspond to those in Figure 16, indicating that pressure perturbations persist through valve actuation. Notably, the PSD in the second scenario is less significant than the first, obscuring differences between conditions with and without constructive interference. This trend arises from liquid flow: when the valve opens, rarefaction waves propagating counter to the flow direction undergo significant energy loss, reducing perturbation amplitude despite constructive interference.
Reduced pressure during liquid injection significantly affects propulsion system stability. Chugging instability arises from dynamic interactions between the propellant feed and catalytic reactor; its suppression requires decoupling these dynamics with a sufficient pressure drop across feed components. If pressure during propellant injection decreases markedly, the reduced pressure drop heightens the likelihood of chugging instability onset. The pulse conditions for maximum rarefaction wave superposition are at a DC of 70%, with a valve closure duration () of 13.5 ms. This brief period limits gas ejection without propellant injection, sustaining high reactor pressure and further reducing the pressure drop. Figure 19 illustrates significant thrust fluctuations during continuous valve opening. Conversely, smaller DCs involve discrete thrust generation without steady-state operation, rendering chugging instability less significant.
The ideal impulse per pulse for any condition is given by Equation (8). However, accounting for valve response delays, propellant injection fluctuations during transients and due to chugging instability, and residual pressure post-closure, the actual impulse per pulse was measured using Equation () and is shown in Figure 20. Negative thrust readings, attributed to thruster and feed system vibrations, fell below the load cell’s offset and were thus ignored in calculating impulse per pulse against duty cycle (DC). The results indicate that, as with the 10 Hz condition, impulse per pulse generally increases linearly with DC, but deficiencies occurred at DC = 10% and 70%. At DC = 10%, reduced thrust likely results from significant structural vibrations induced by amplified surge pressure, disrupting measurement. At DC = 70%, chugging instability, triggered by low pressure drop across feed components, induces periodic propellant injection fluctuations, reducing thrust.
4. Conclusion
The study involved a 50 N-class HTP monopropellant thruster tested under PWM throttling. The experimental configuration included a propellant feeding system, a solenoid valve for PWM control, and a thruster with a MnO2/La/Al2O3 catalyst. Cold flow tests utilized water, while hot fire tests employed 90 wt.% HTP, with data analyzed using tools like Joukowsky’s equation and PSD analysis.
Cold flow tests demonstrated consistent valve response characteristics. An ORD of 8 ms and a CRD of 25 ms were recorded across frequencies of 5 Hz and 10 Hz and duty cycles from 10% to 90%. At high duty cycles (e.g., 80% and 90% at 10 Hz), the valve remained open due to electromagnetic forces overpowering the spring, preventing water hammer surges. Surge pressures ranged from 24.43 to 26.74 bar, aligning closely with the theoretical prediction of 29.59 bar, though slight deviations suggest influences from valve closure timing and system geometry.
Hot fire tests provided critical insights into thruster performance. Steady-state operation yielded a chamber pressure of 18 bar, falling 2 bar short of the 20 bar design target due to a larger-than-intended nozzle throat (5.3 mm vs. 4.86 mm). The chamber temperature reached 734.55, nearly matching the adiabatic decomposition temperature of 746.17, confirming the catalyst’s high effectiveness. The mean surge pressure was 39.33 bar, lower than in cold flow tests, attributed to HTP’s reduced bulk modulus.
PWM throttling at 10 Hz across duty cycles from 10% to 80% revealed significant dynamics. Pressure spikes and oscillations occurred post-valve closure, with surge pressures peaking at 50.55 bar at 10% duty cycle due to constructive interference of pressure waves. At high duty cycles (80% and 90%), the valve failed to close, disrupting PWM functionality. Chugging instability emerged at 70% duty cycle, causing thrust fluctuations and highlighting the system’s sensitivity to PWM parameters. PSD analysis identified resonant frequencies (36.11 Hz valve closed, 24.51 Hz valve open), enabling parameter adjustments for stable operation with minimized surges.
The results underscore PWM throttling’s potential for precise thrust control in spacecraft, alongside challenges like pressure surges and instability. HTP’s performance supports its role as a sustainable propellant alternative. Future efforts should prioritize optimizing feed system design to reduce oscillations, enhancing valve reliability at high duty cycles, and developing adaptive PWM strategies. Such improvements could broaden the thruster’s applicability to higher thrust classes and diverse missions, advancing efficient, eco-friendly propulsion technologies.
Funding
This project has received funding from the European Union’s Horizon 2020 research and innovation programme under the Marie Skłodowska-Curie grant agreement No 101110555.
Data Availability Statement
The data presented in this study are available on request from the corresponding author.
Conflicts of Interest
No conflict of interest exists in the submission of this manuscript, and the manuscript is approved by all authors for publication. I would like to declare on behalf of my co-authors that the work described was original research that has not been published previously, and is not under consideration for publication elsewhere, in whole or in part.
References
- Casiano, M.J.; Hulka, J.R.; Engineering, J.; Yang, V. Liquid-Propellant Rocket Engine Throttling: A Comprehensive Review. 45th AIAA/ASME/SAE/ASEE Joint Propulsion Conference & Exhibit 2009, 26, 897–923. [Google Scholar] [CrossRef]
- Schmidt, E.W.; Brewster, G.T.; Cain, G.E. Mars Lander Retro Propulsion. In Proceedings of the 50th International Astronautical Congress, 1999, number October 1999.
- McAllister, J.; Parish, C. Phoenix Landing Propulsion System Performance. In Proceedings of the 45th AIAA/ASME/SAE/ASEE Joint Propulsion Conference & Exhibit, Reston, Virigina, 8 2009; Number August, pp. 1–14. [CrossRef]
- Lubrano, G.; Capus, P.; Lebleu, D.; Maillan, O.; Garcon, P. Lubrano, G.; Capus, P.; Lebleu, D.; Maillan, O.; Garcon, P. Propulsion Subsystem for the Exomars Entry and Descent Module ( 2016 Mission Demonstrator ). In Proceedings of the International Conference on Space Propulsion, 2014, pp. 1–6.
- McGee, T.G.; Artis, D.A.; Cole, T.J.; Eng, D.A.; Reed, C.L.B.; Hannan, M.R.; Chavers, D.G.; Kennedy, L.D.; Moore, J.M.; Stemple, C.D. Mighty eagle: The development and flight testing of an autonomous robotic lander test bed. Technical Report 3, 2013.
- Choi, S.; Jo, B.U.; Cho, W.; Kwon, S. Design and Development of DALBIT-1: Earth-based Lander Testbed 2021. 2.
- JPL Special Review Board. Report on the Loss of the Mars Polar Lander and Deep Space 2 Missions. Technical Report March, 2000.
- Martin, T.A.; Rockwell, L.E.; Parish, C.L. Test and Modeling of the MArs ’98 Lander Descent Propulsion System Waterhammer. AIAA 1998.
- Batonneau, Y.; Brahmi, R.; Cartoixa, B.; Farhat, K.; Kappenstein, C.; Keav, S.; Kharchafi-Farhat, G.; Pirault-Roy, L.; Saouabé, M.; Scharlemann, C. Green Propulsion: Catalysts for the European FP7 Project GRASP. Topics in Catalysis 2014, 57, 656–667. [Google Scholar] [CrossRef]
- Ventura, M. Long Term Storability of Hydrogen Peroxide. In Proceedings of the 41st AIAA/ASME/SAE/ASEE Joint Propulsion Conference & Exhibit, Reston, Virigina, 7 2005; Number July, pp. 1–14. [CrossRef]
- Ha, S.u.; Kwon, M.c.; Seo, K.s.; Han, S. The Past and Future Perspectives of Hydrogen Peroxide as Rocket Propellants. Journal of The Korean Society for Aeronautical and Space Sciences 2009, p. 12.
- Hearn, H. Effect of Duty Cycle on Catalytic Thruster Degradation. Journal of Spacecraft and Rockets 1981, 18, 216–221. [Google Scholar] [CrossRef]
- Kang, H.; Lee, D.; Kang, S.; Kwon, S. Effect of H2O2 injection patterns on catalyst bed characteristics. Acta Astronautica 2017, 130, 75–83. [Google Scholar] [CrossRef]
- Lee, S.M. Lanthanum Doped Catalyst for Thruster of Green Monopropellant with Elevated Decomposition Temperature. PhD thesis, Korea Advanced Institute of Science and Technology, 2015.
- Kang, S. Design and performance evaluation of hybrid rocket using highly concentrated hydrogen peroxide. PhD thesis, Korea Advanced Institute of Science and Technology, 2016.
- Kang, S.; Lee, D.; Kwon, S. Lanthanum doping for longevity of alumina catalyst bed in hydrogen peroxide thruster. Aerospace Science and Technology 2015, 46, 197–203. [Google Scholar] [CrossRef]
- An, S.; Lee, J.; Brahmi, R.; Kappenstein, C.; Kwon, S. Comparison of Catalyst Support Between Monolith and Pellet in Hydrogen Peroxide Thrusters. Journal of Propulsion and Power 2010, 26, 439–445. [Google Scholar] [CrossRef]
- An, S.; Jin, J.; Lee, J.; Jo, S.; Park, D.; Kwon, S. Chugging Instability of H2O2 Monopropellant Thrusters with Reactor Aspect Ratio and Pressures. Journal of Propulsion and Power 2011, 27, 422–427. [Google Scholar] [CrossRef]
- Gibek, I.; Maisonneuve, Y. Waterhammer Tests With Real Propellants. 41st AIAA/ASME/SAE/ASEE Joint Propulsion Conference & Exhibit 2005, 5.
- Frei, T.E.; Fischer, T.L.; Weiss, J.M. Mars Polar Lander Thruster Cold Start Validation Testing. 37th AIAA/ASME/SAE/ASEE Joint Propulsion Conference and Exhibit 2001. [CrossRef]
Figure 1.
Schematic of 50 N-class HTP monopropellant thruster.
Figure 2.
Schematic of propellant feeding system.
Figure 3.
Integrated experimental test setup of (a) Data Acquisition (DAQ) system, (b) Propellant feeding system, and (c) Monopropellant thruster mounted on the test section.
Figure 3.
Integrated experimental test setup of (a) Data Acquisition (DAQ) system, (b) Propellant feeding system, and (c) Monopropellant thruster mounted on the test section.
Figure 4.
Component display of the 50 N-class HTP monopropellant thruster with the solenoid valve.
Figure 5.
Internal components of the solenoid valve.
Figure 6.
Conceptual schematics of the ORD, CRD, intended () and actual () valve closure time.
Figure 7.
Mean and standard deviation of surge pressure measured in PWM throttling cold flow tests in 5 Hz and 10 Hz at varying duty cycle frequencies.
Figure 7.
Mean and standard deviation of surge pressure measured in PWM throttling cold flow tests in 5 Hz and 10 Hz at varying duty cycle frequencies.
Figure 8.
Pressure measurement at the solenoid valve upstream and the injector manifold during the pulse operation of 10 Hz with (a) 20% and (b) 50% duty cycles.
Figure 8.
Pressure measurement at the solenoid valve upstream and the injector manifold during the pulse operation of 10 Hz with (a) 20% and (b) 50% duty cycles.
Figure 9.
(a) Pressure and (b) temperature measurement obtained in the hot fire test operated in a steady-state.
Figure 9.
(a) Pressure and (b) temperature measurement obtained in the hot fire test operated in a steady-state.
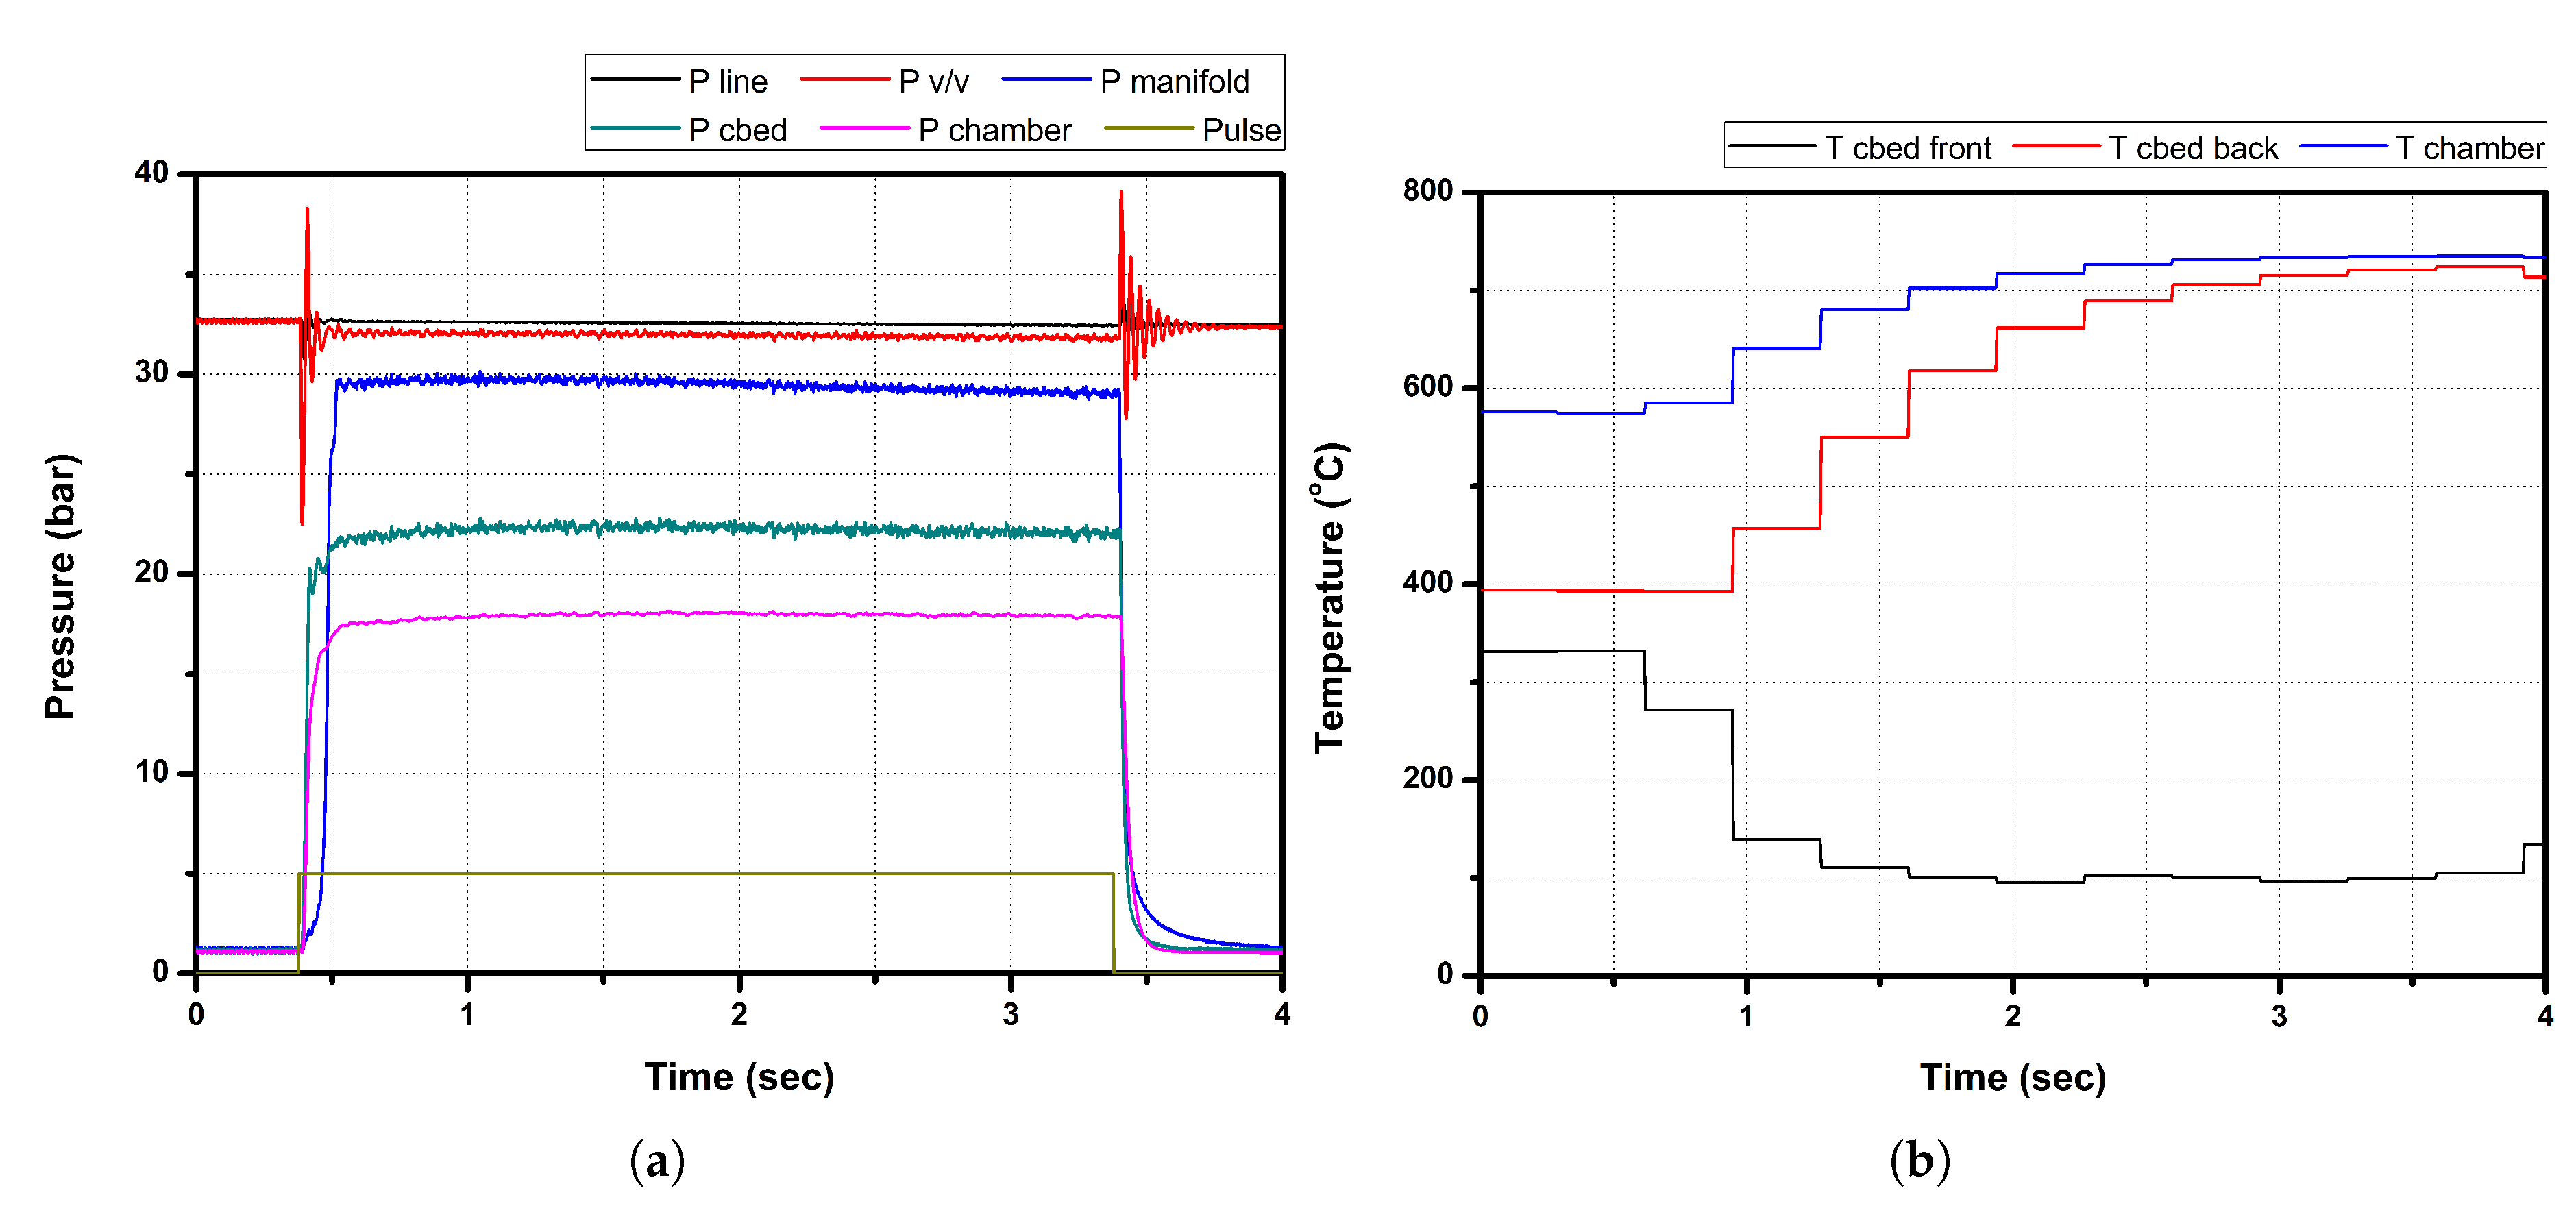
Figure 10.
Pressure measurement at the upstream of the solenoid valve upon closure and corresponding PSD plot.
Figure 10.
Pressure measurement at the upstream of the solenoid valve upon closure and corresponding PSD plot.
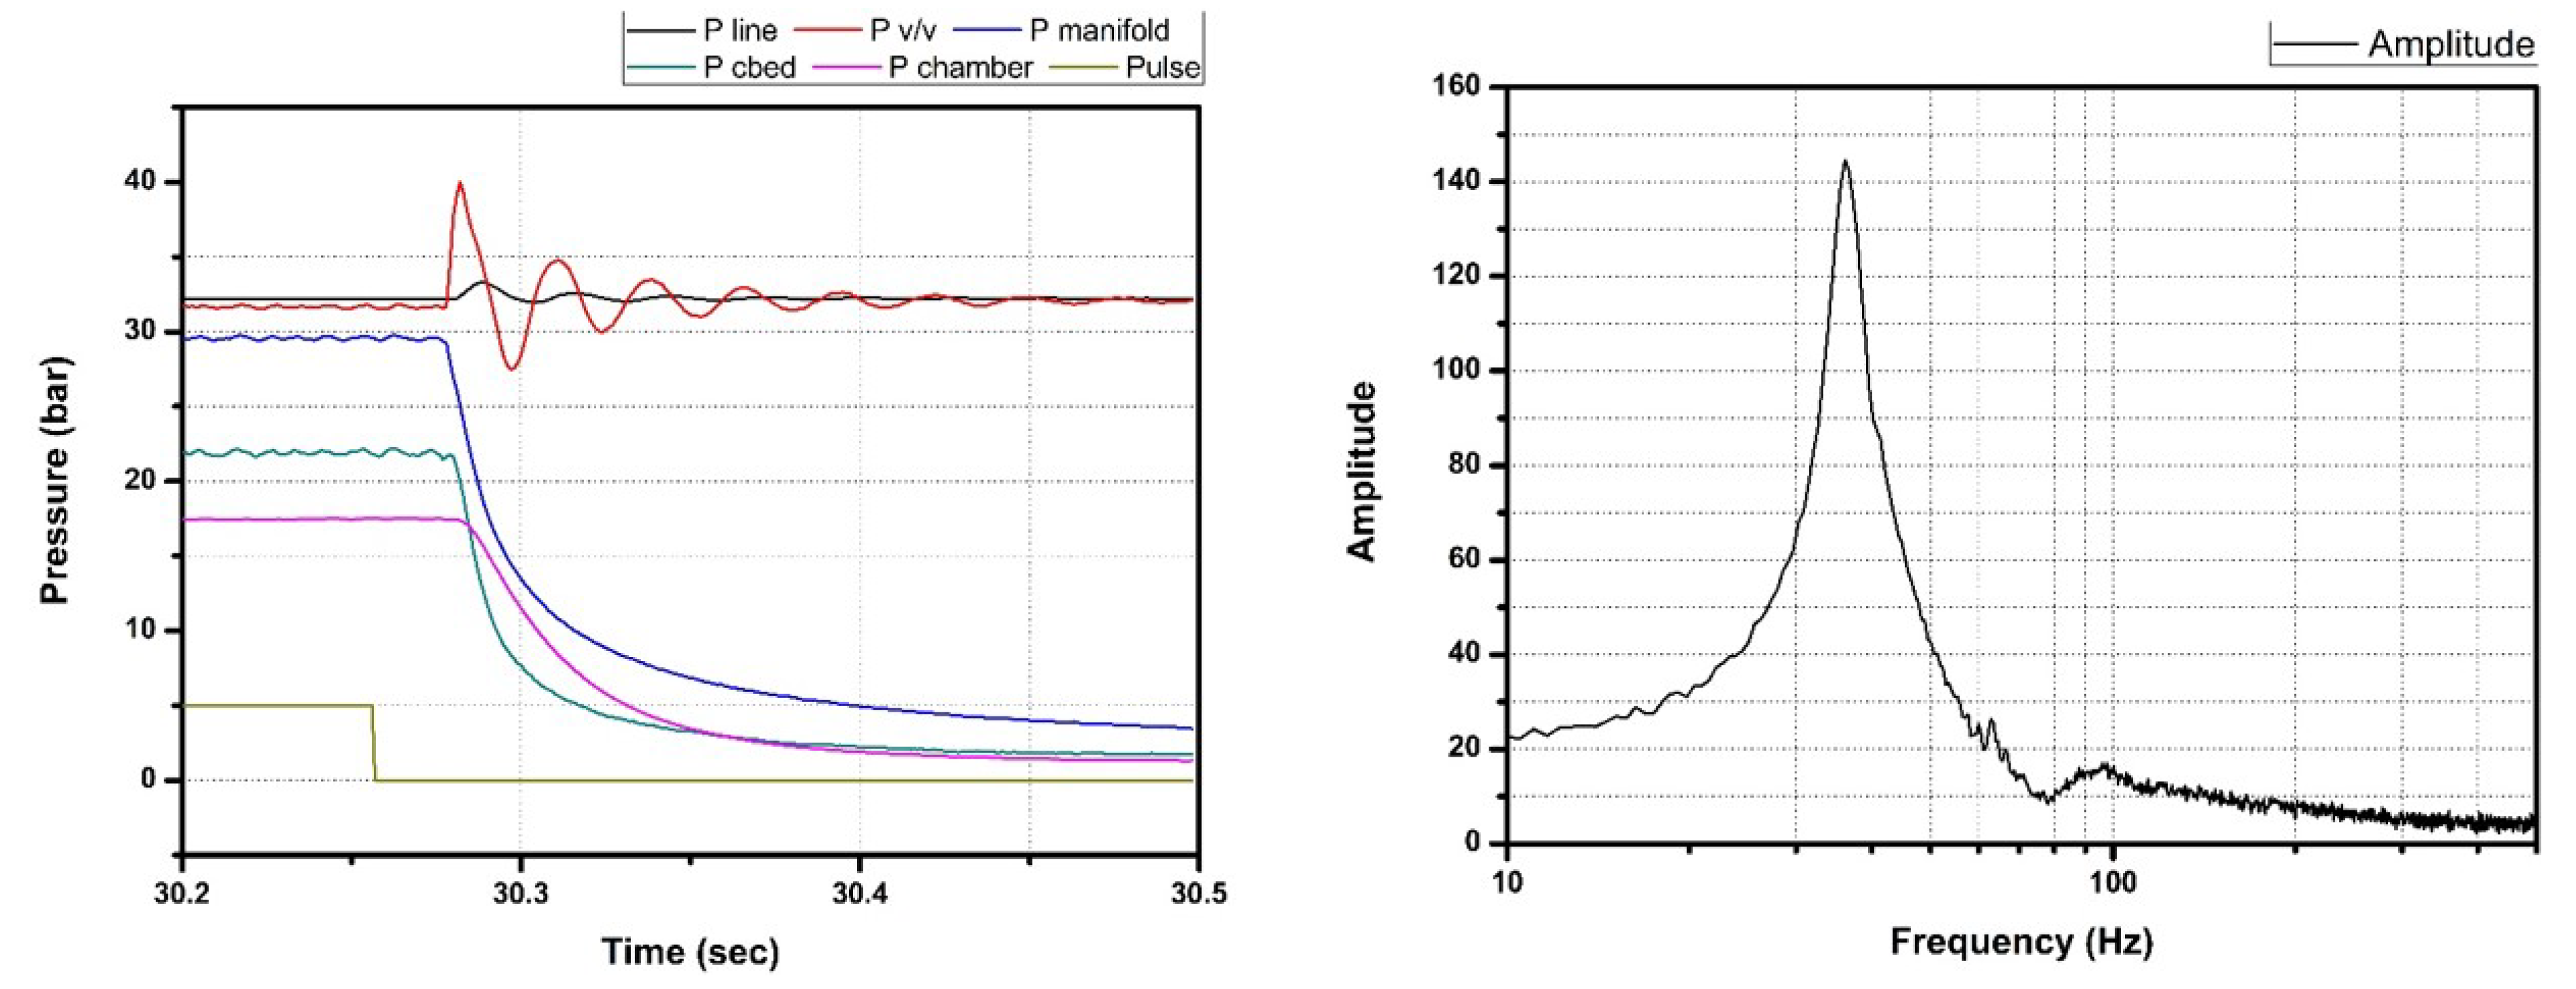
Figure 11.
Hot fire sequence for PWM throttling operation.
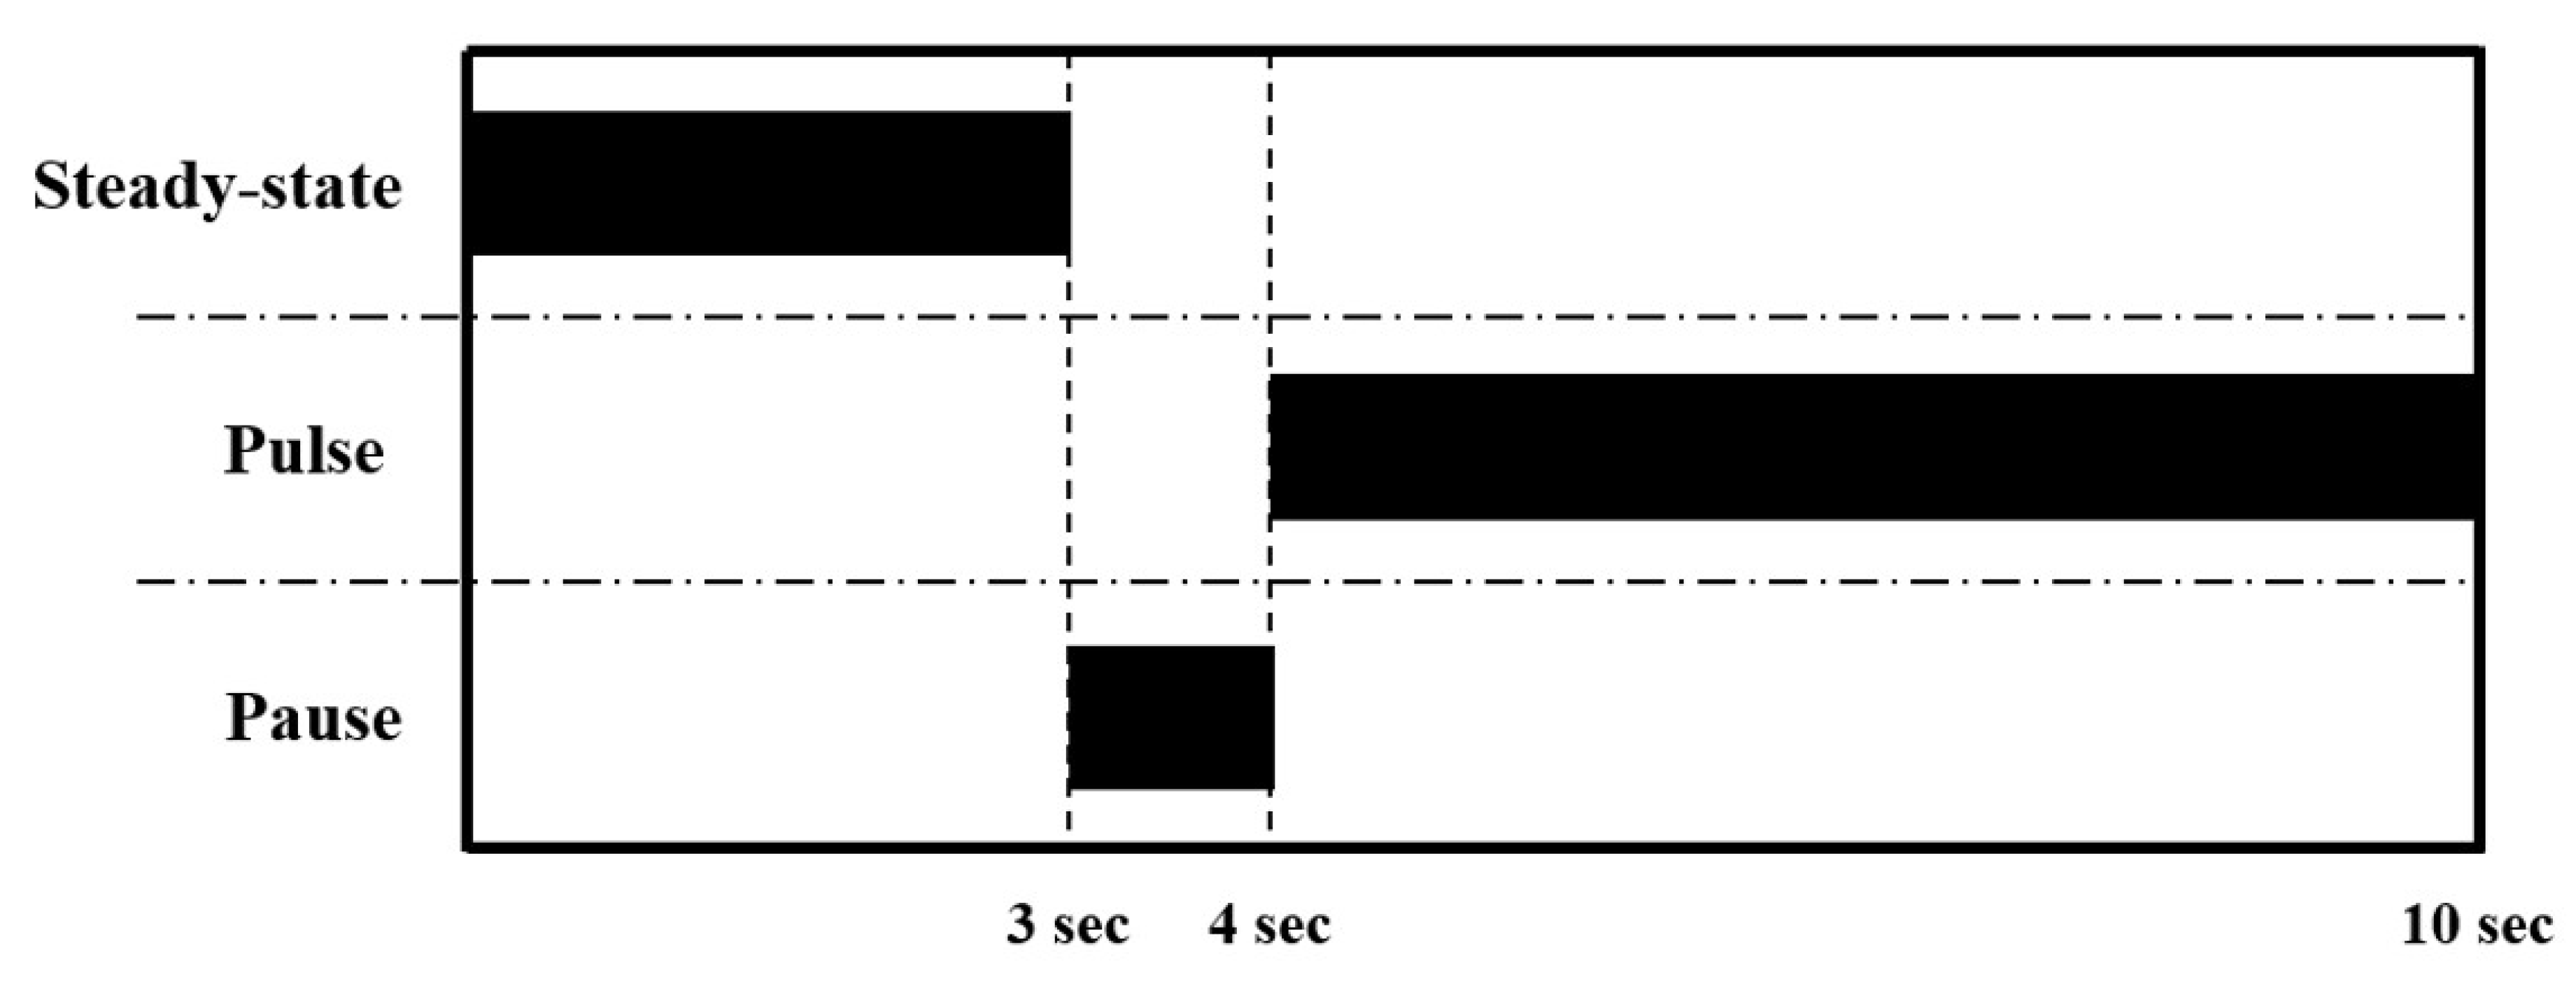
Figure 12.
Pressure, thrust, and valve drive signal measurement during PWM throttling operation at 10 Hz with duty cycles ranging from 10 to 80%.
Figure 12.
Pressure, thrust, and valve drive signal measurement during PWM throttling operation at 10 Hz with duty cycles ranging from 10 to 80%.
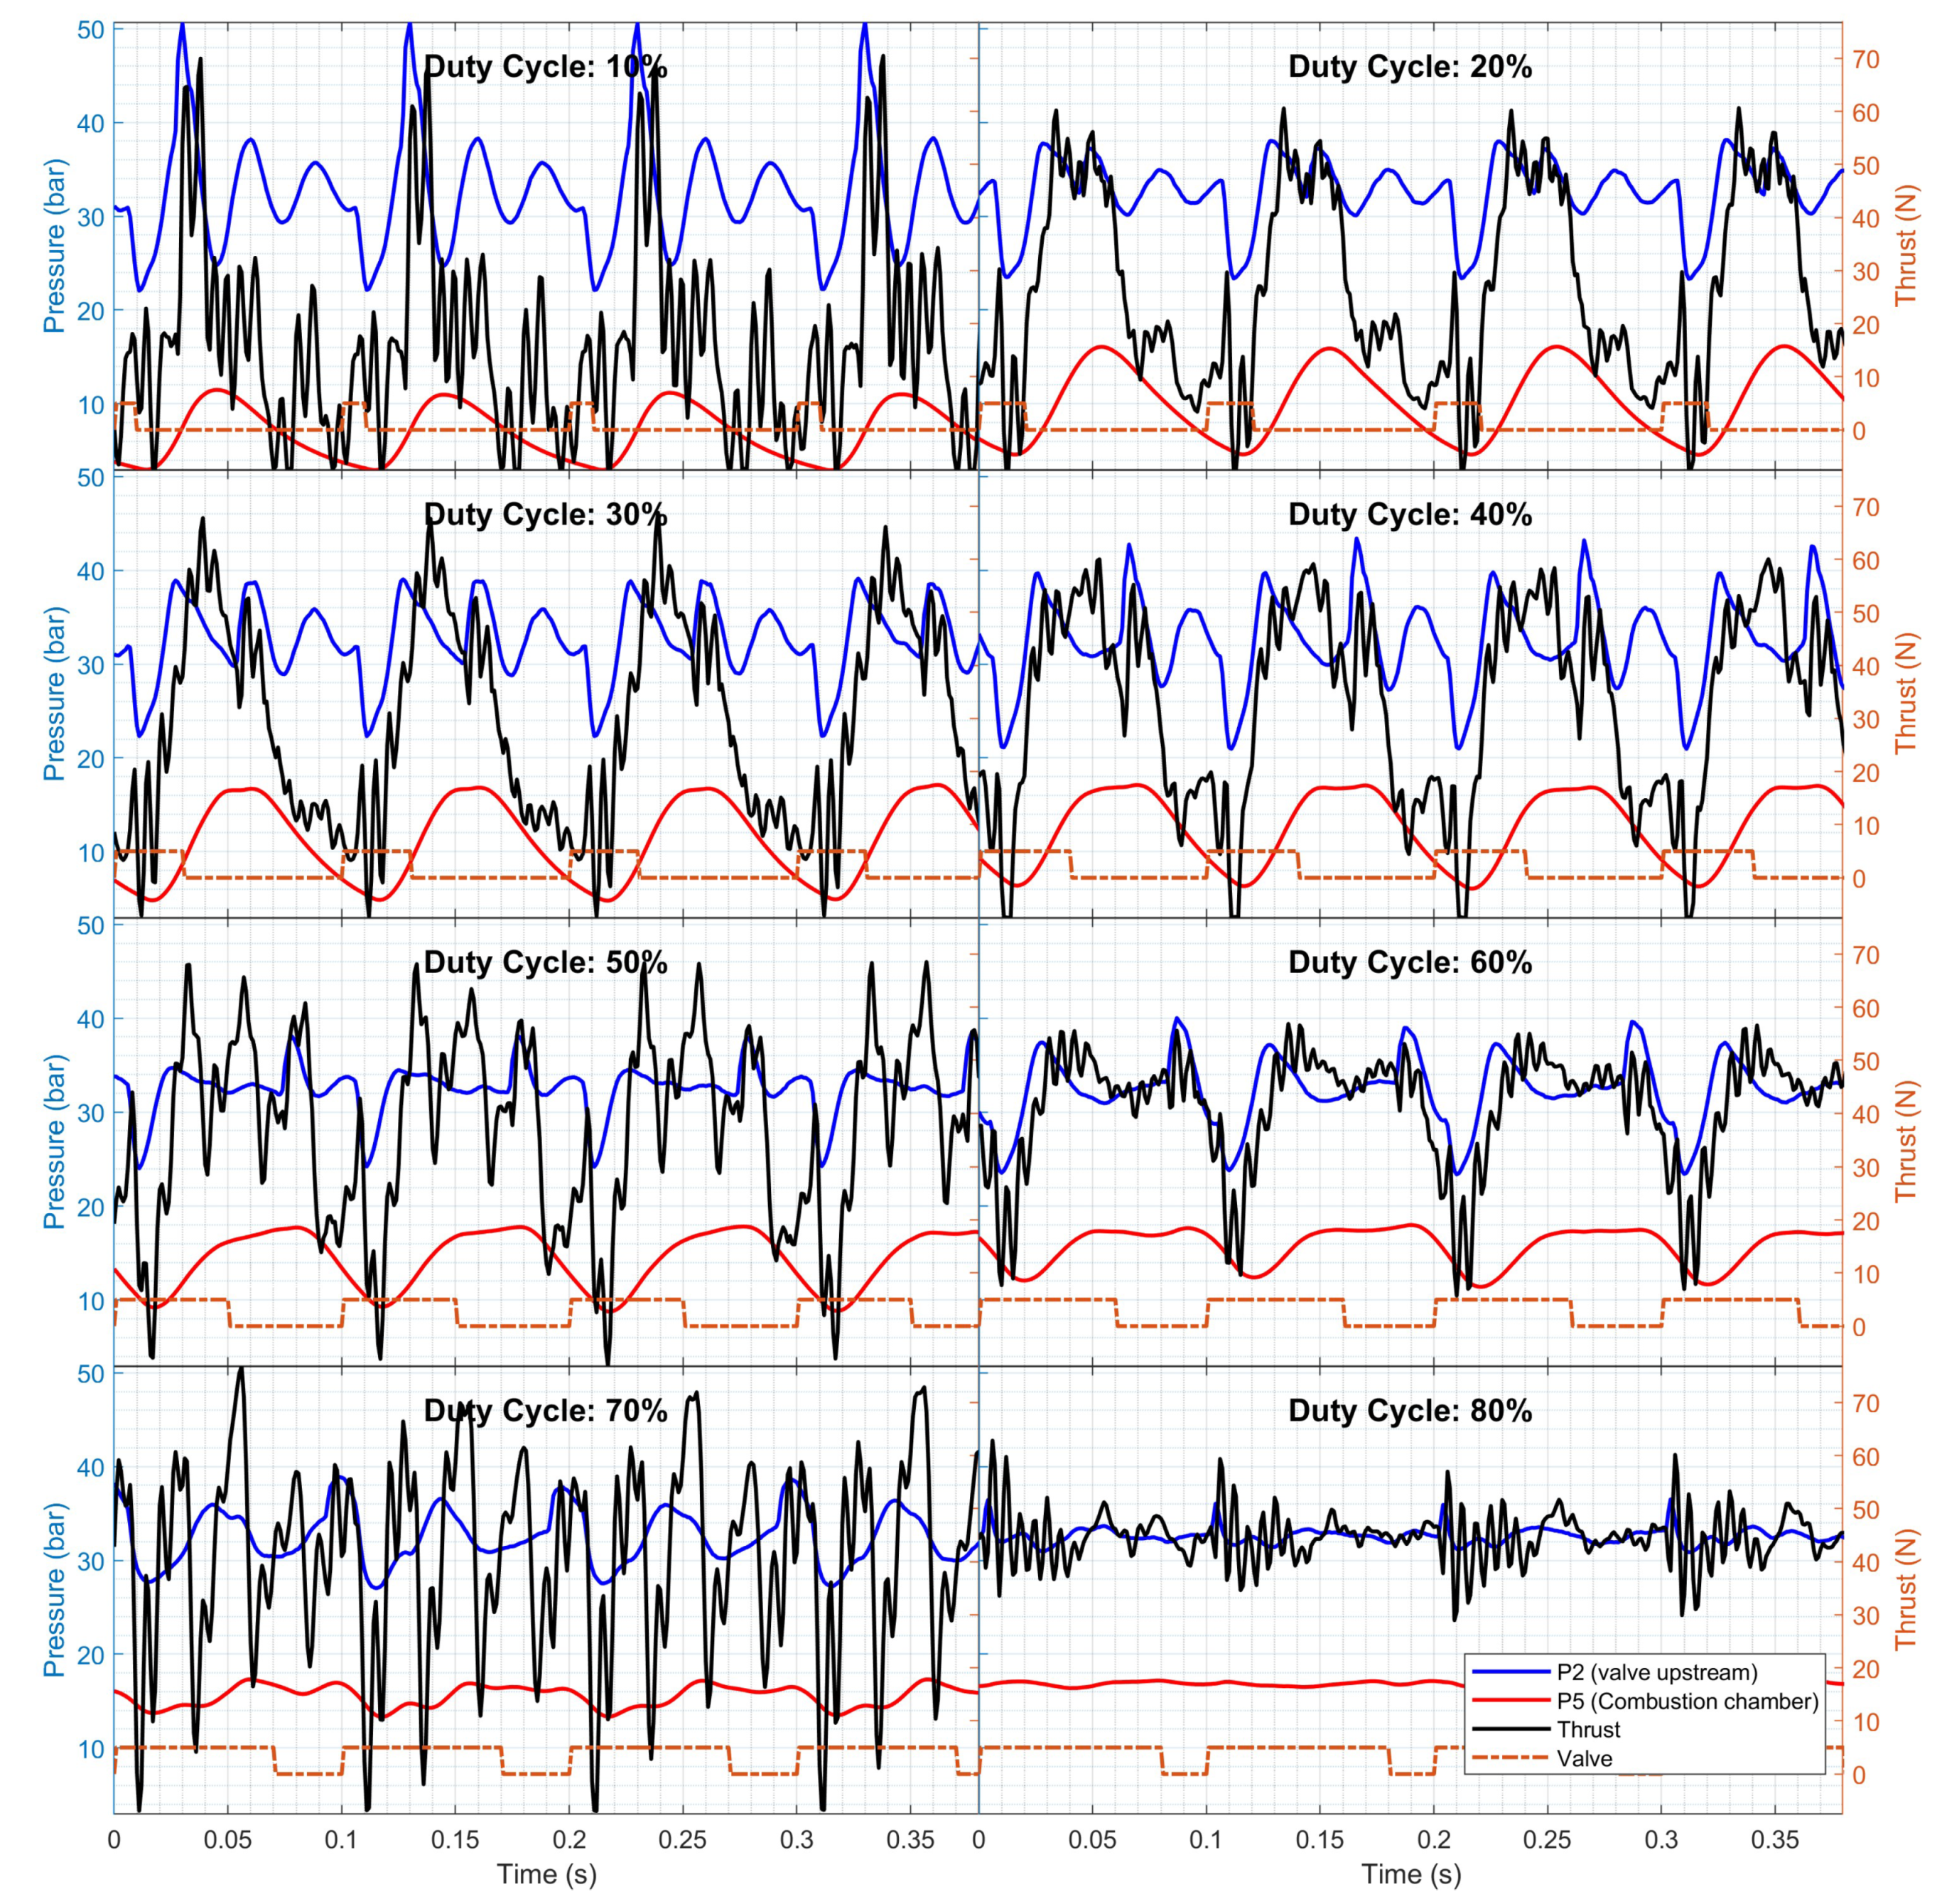
Figure 13.
ORD and CRD measured from the PWM throttling at = 10 Hz with different duty cycles%.
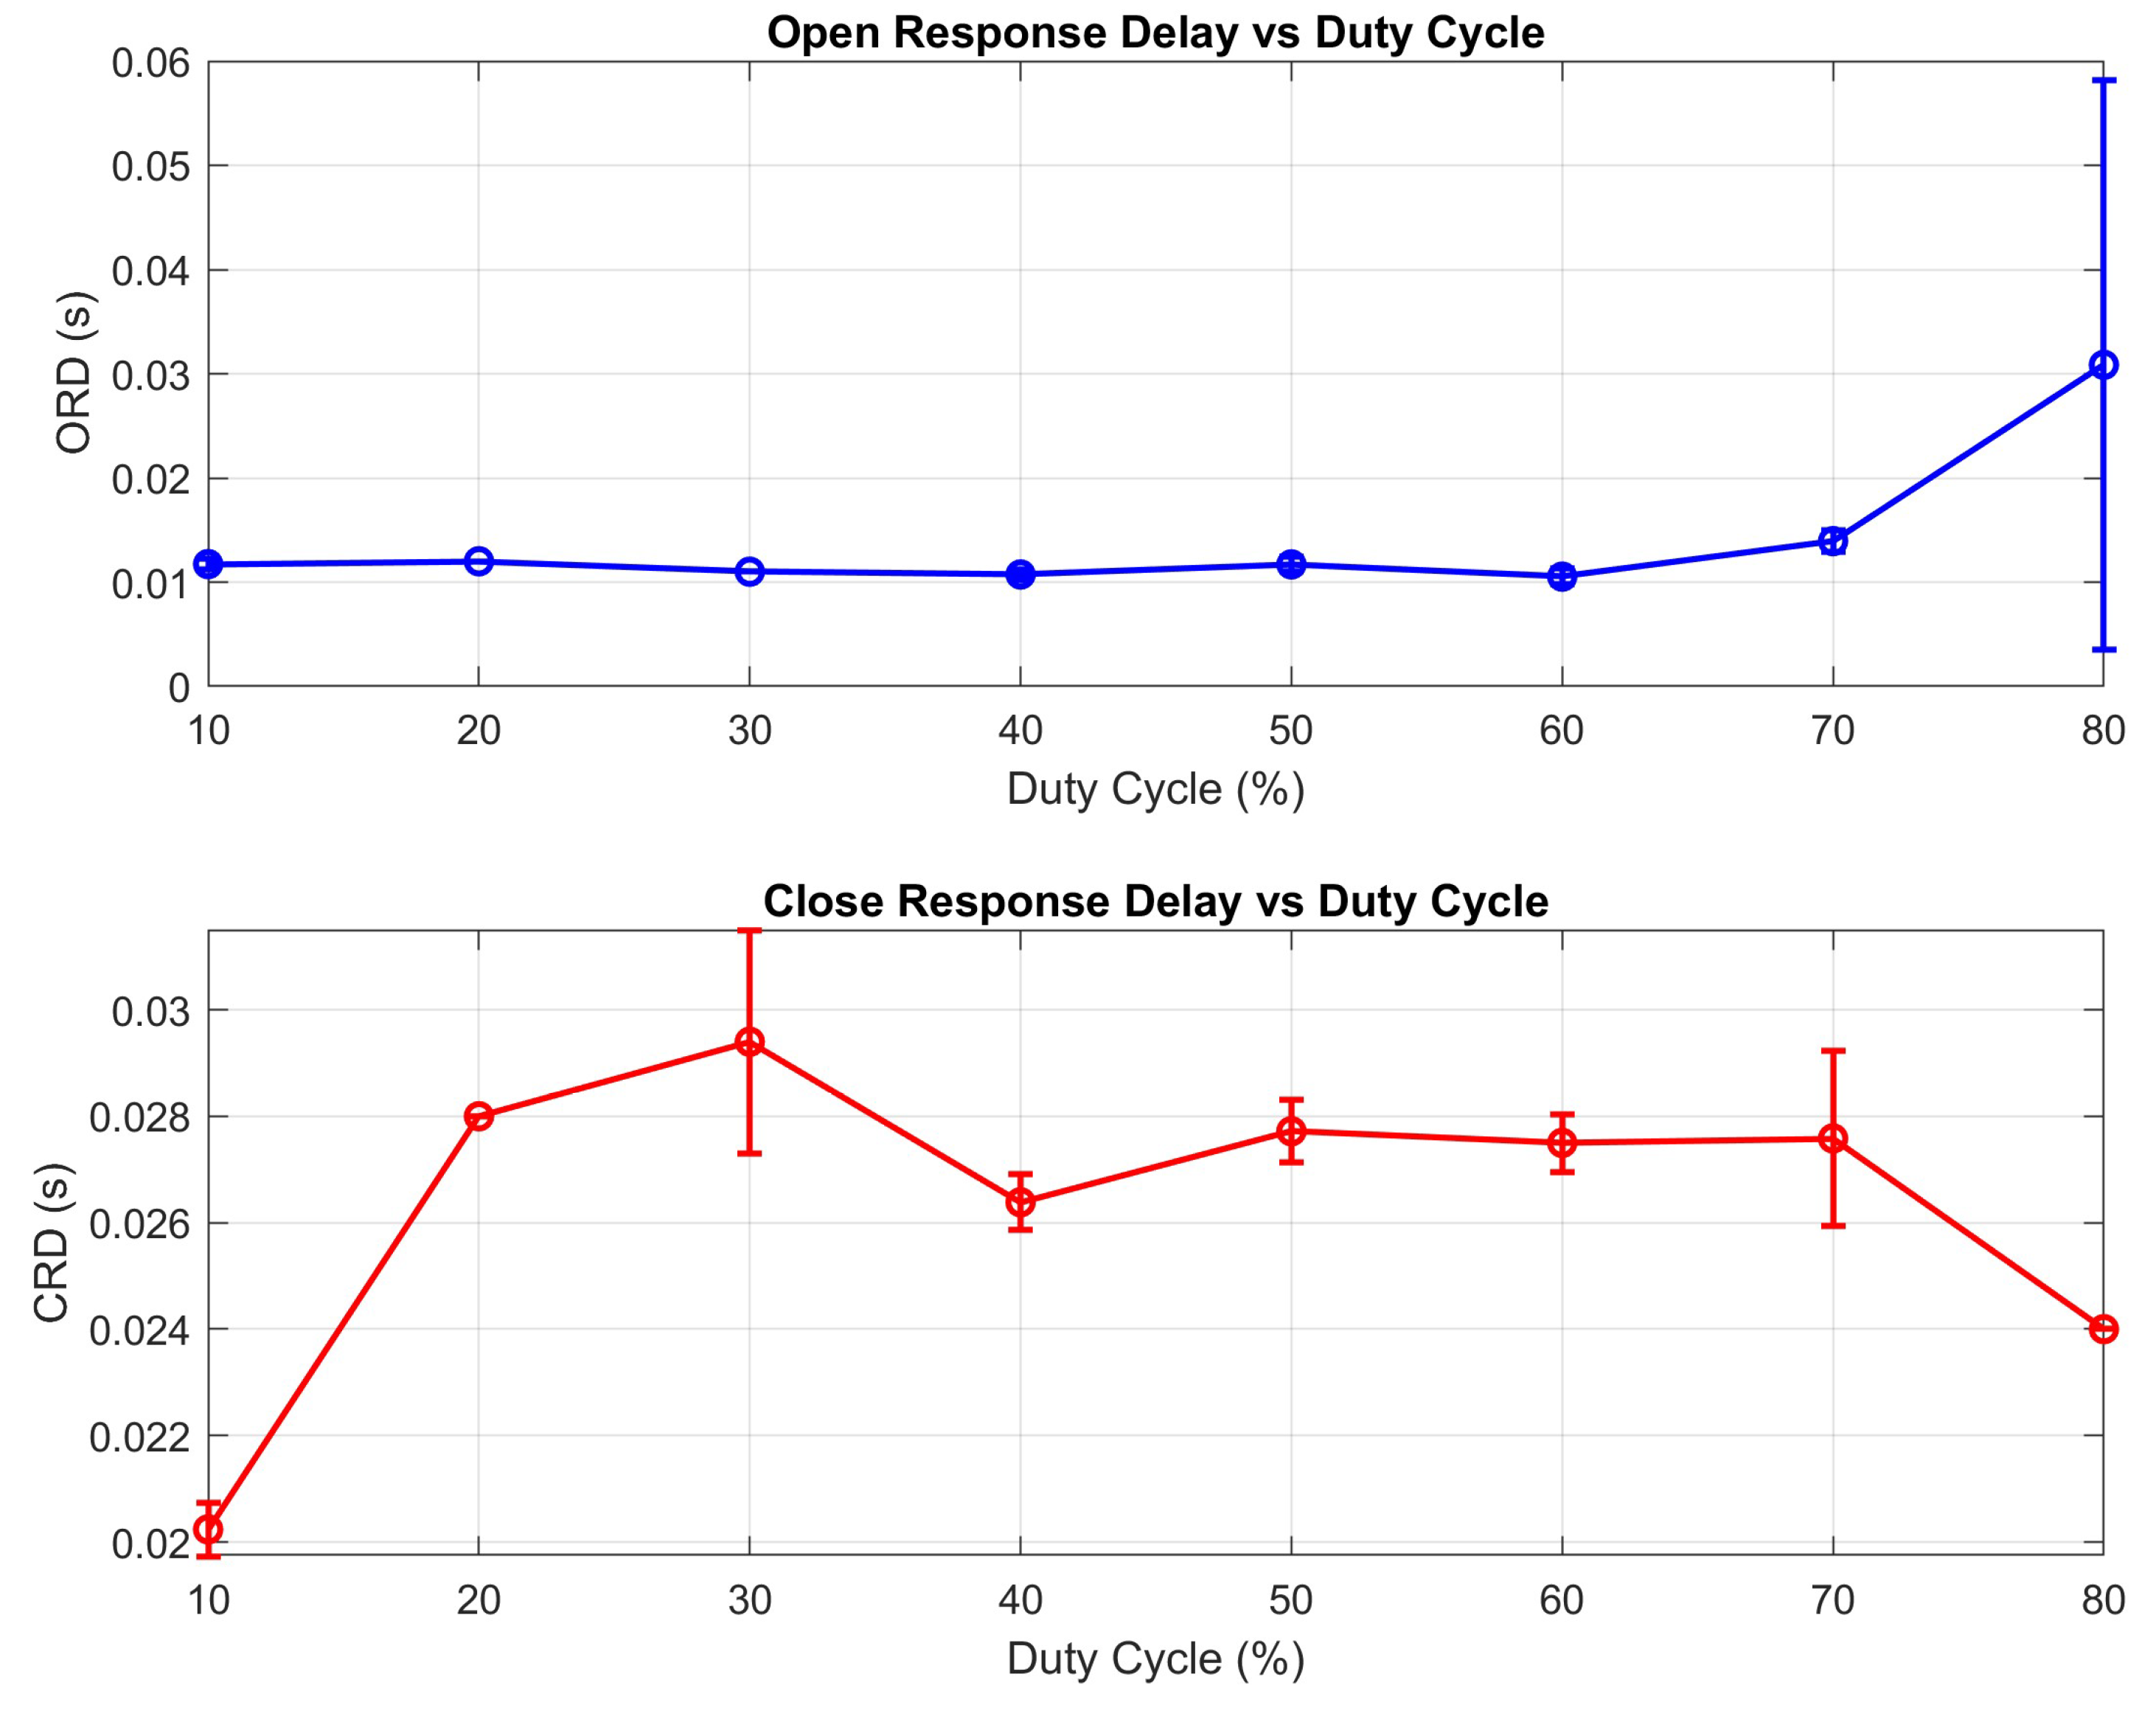
Figure 14.
Mean and standard deviation of surge pressure measured in PWM throttling hot fire tests in 10 Hz at varying duty cycle frequencies%.
Figure 14.
Mean and standard deviation of surge pressure measured in PWM throttling hot fire tests in 10 Hz at varying duty cycle frequencies%.
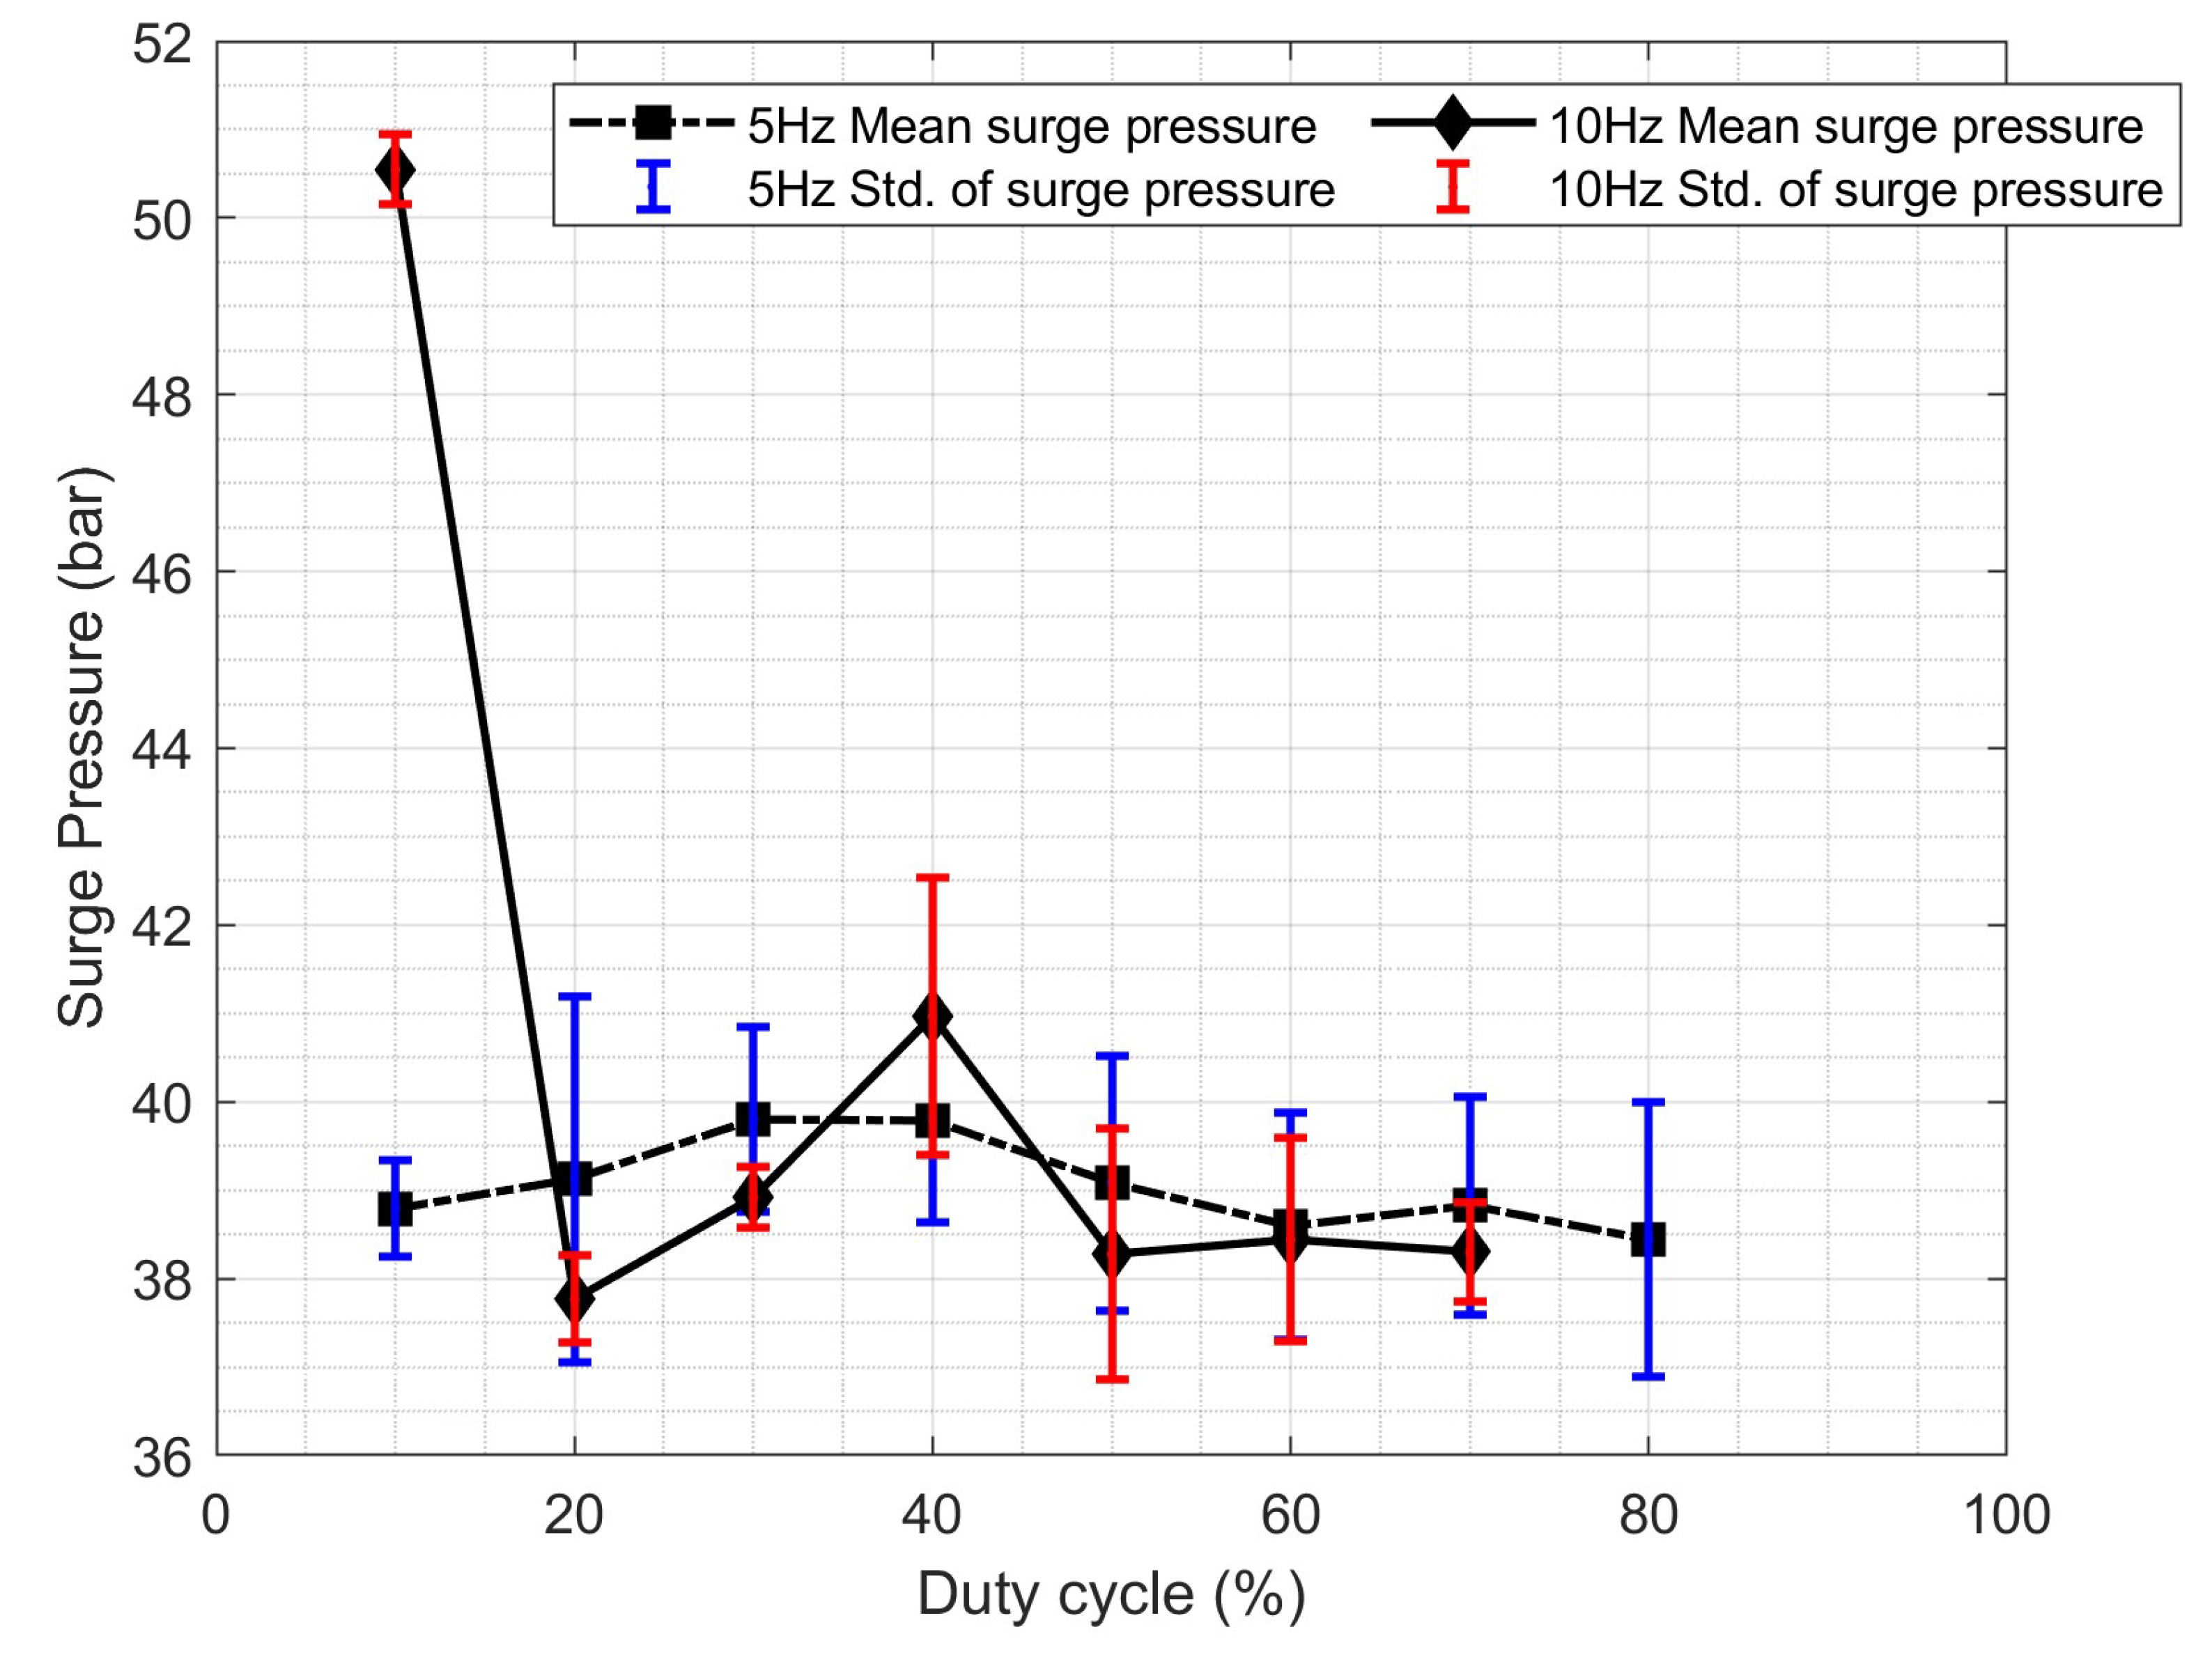
Figure 15.
pulse conditions which satisfies the criterion of the constructive interferences with the varying CRD.
Figure 15.
pulse conditions which satisfies the criterion of the constructive interferences with the varying CRD.
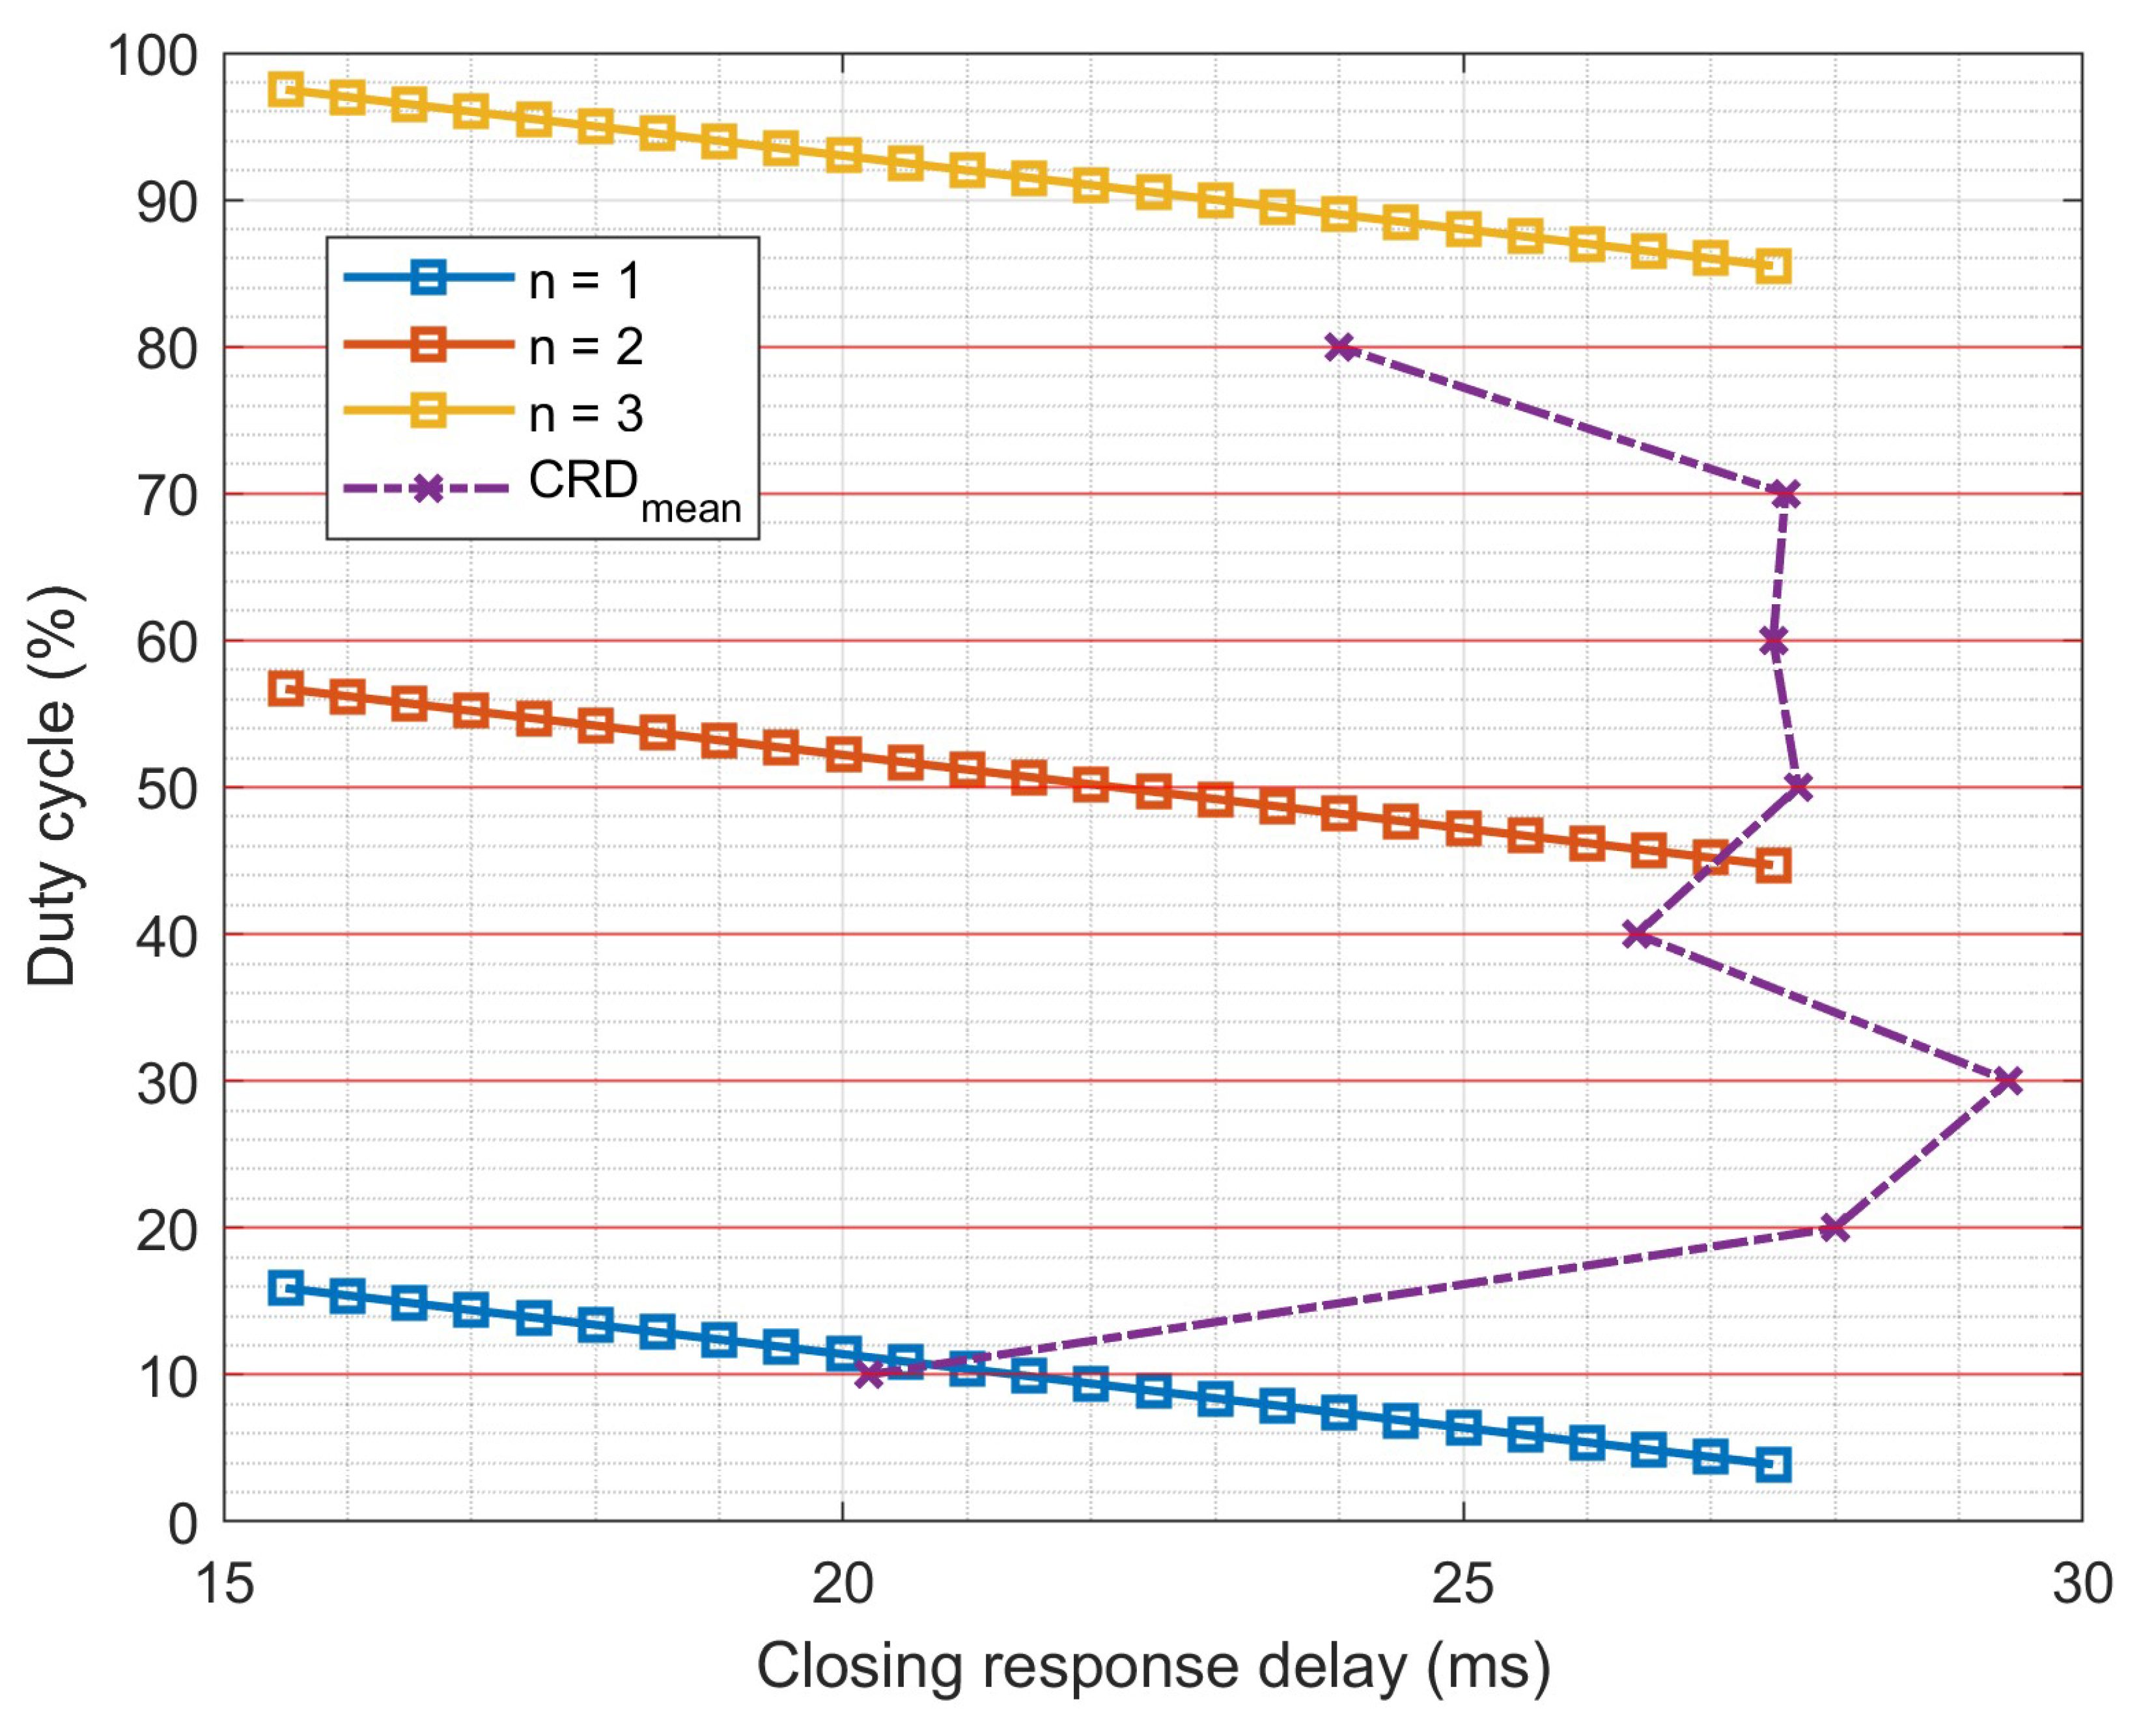
Figure 16.
PSD plot of pressure measurement acquired at the solenoid valve upstream when it’s opened during PWM throttling operation at 10 Hz with different duty cycles.
Figure 16.
PSD plot of pressure measurement acquired at the solenoid valve upstream when it’s opened during PWM throttling operation at 10 Hz with different duty cycles.
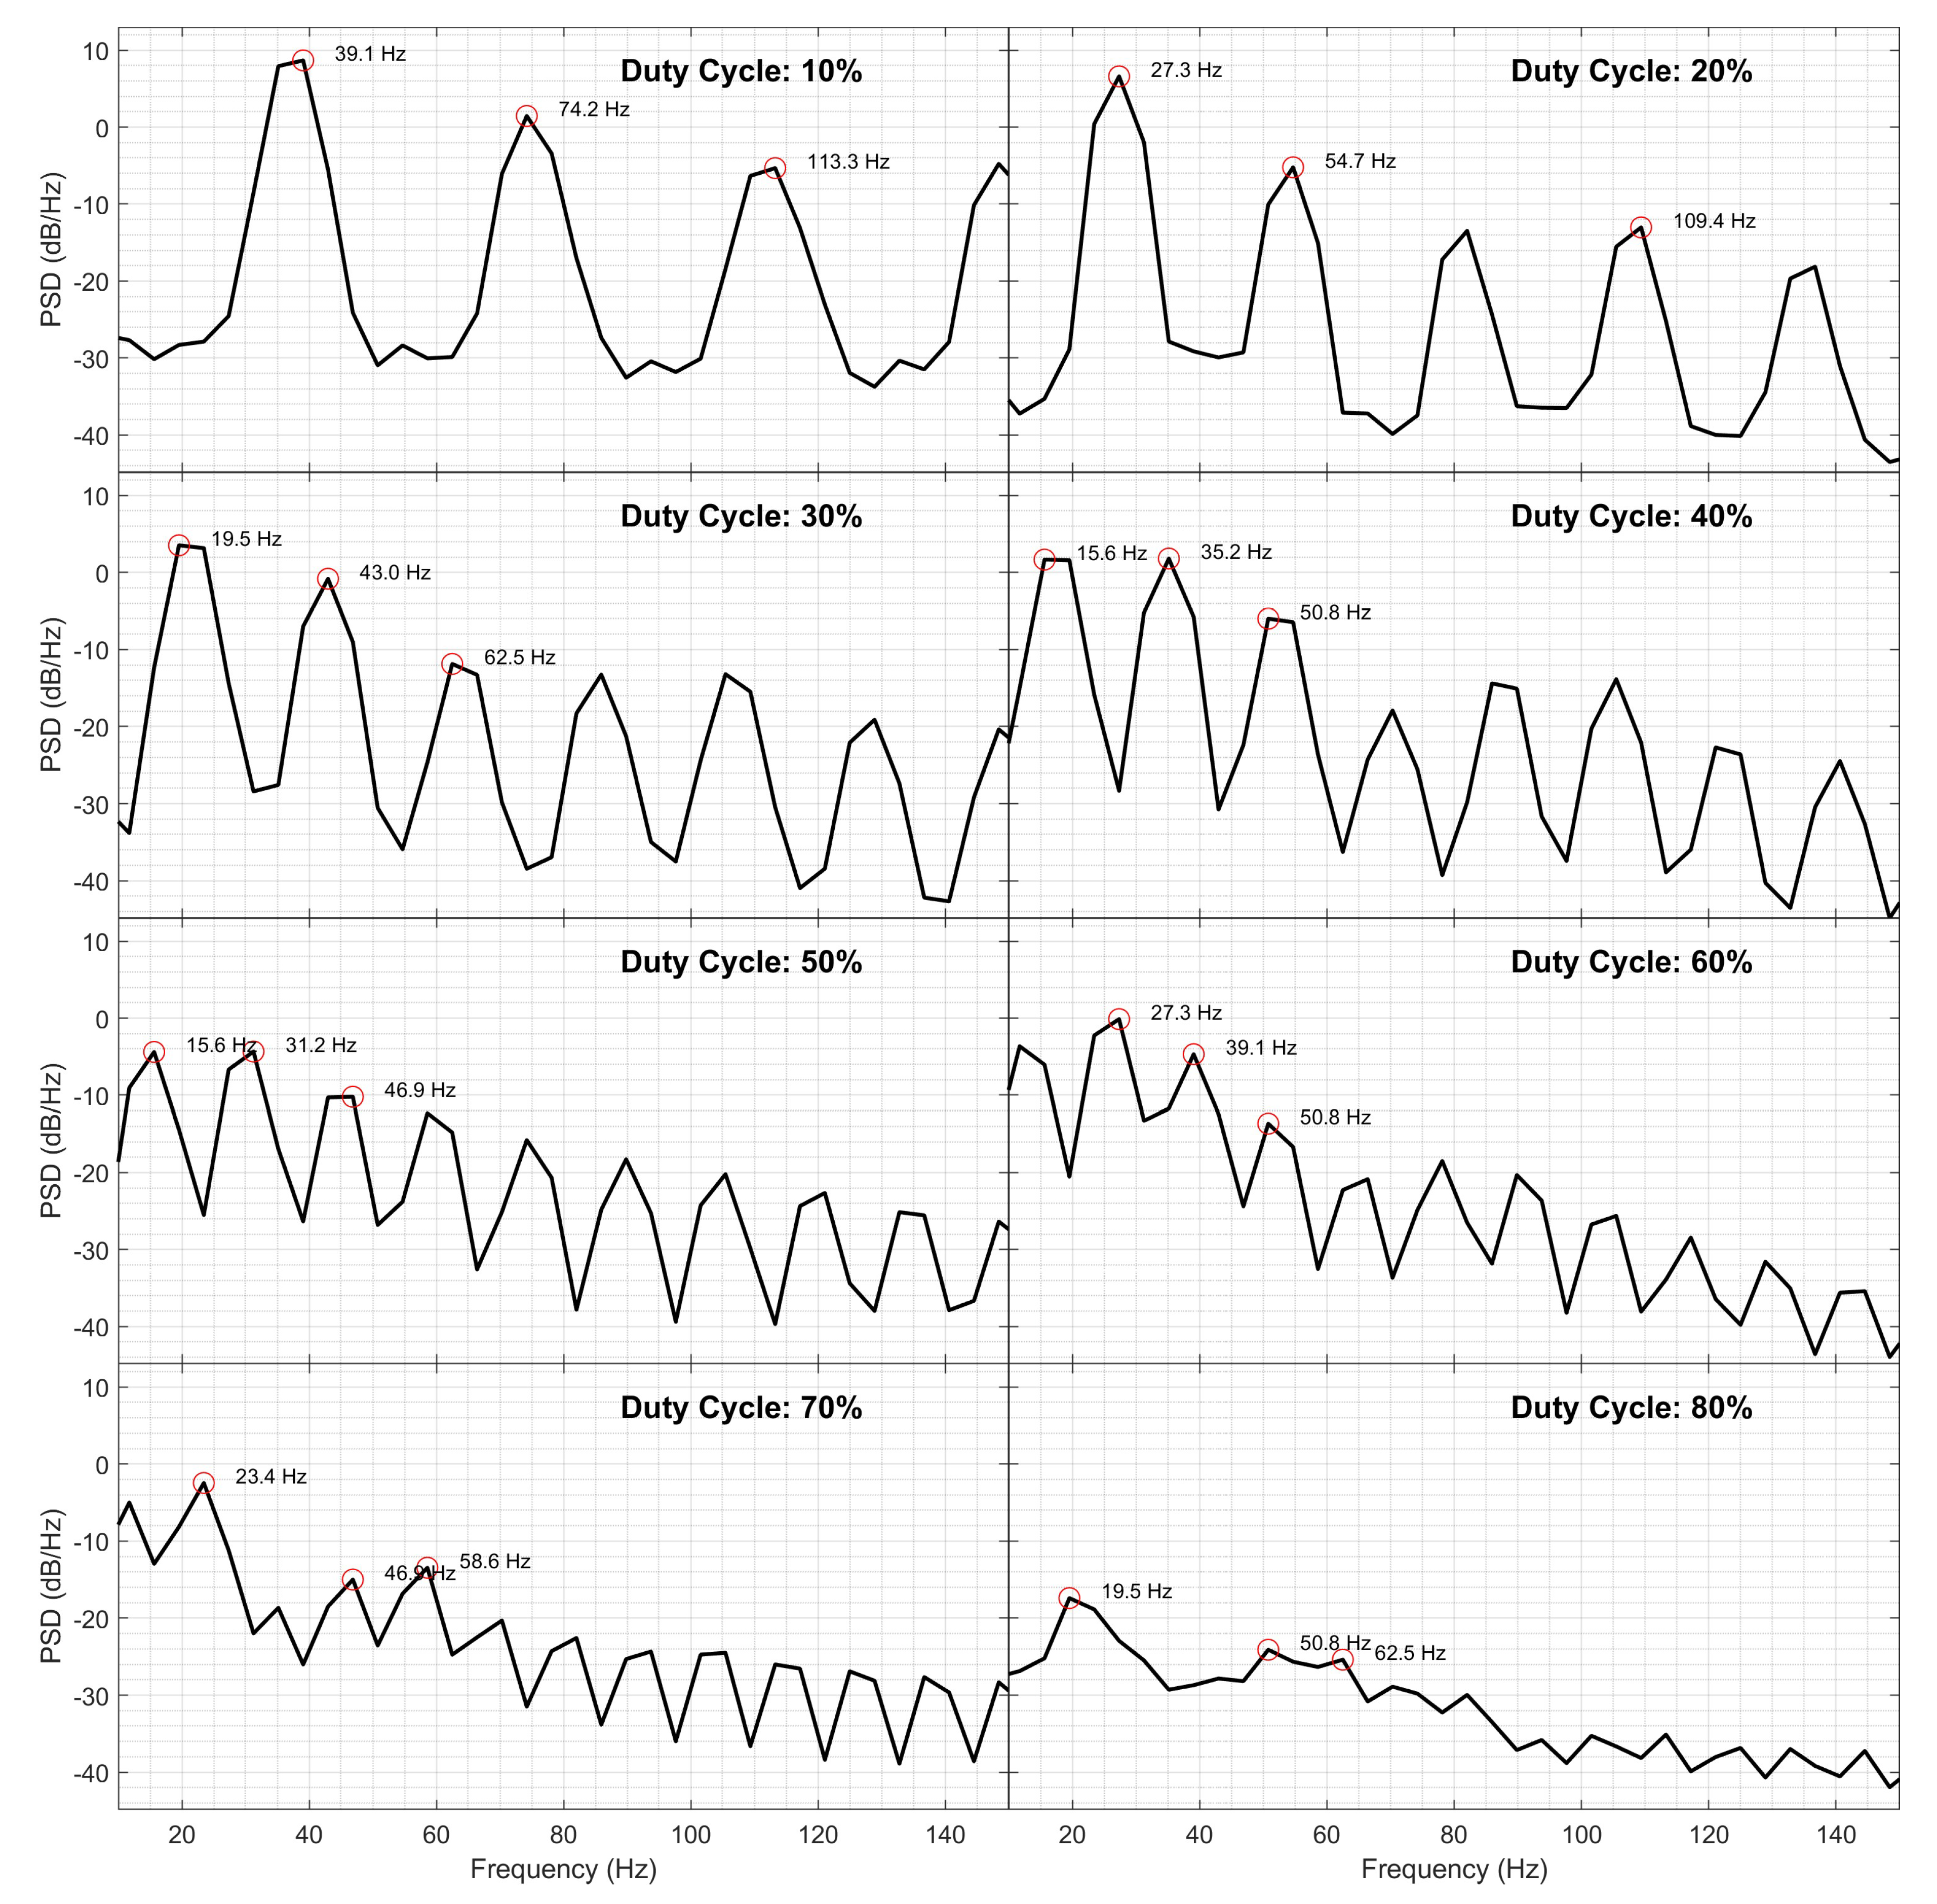
Figure 17.
pulse conditions which satisfies the criterion of the constructive interferences with the varying CRD.
Figure 17.
pulse conditions which satisfies the criterion of the constructive interferences with the varying CRD.
Figure 18.
PSD plot of pressure measurement acquired at the solenoid valve upstream when it’s closed during PWM throttling operation at 10 Hz with different duty cycles.
Figure 18.
PSD plot of pressure measurement acquired at the solenoid valve upstream when it’s closed during PWM throttling operation at 10 Hz with different duty cycles.
Figure 19.
Pressure at valve upstream and chamber, thrust, and valve drive signals of pulse condition = 10 Hz, DC = 70%.
Figure 19.
Pressure at valve upstream and chamber, thrust, and valve drive signals of pulse condition = 10 Hz, DC = 70%.
Figure 20.
Impulse per pulse with respect to duty cycle at = 10 Hz.

Table 1.
Performance comparison between hydrazine-based liquid propellant and high-concentration hydrogen peroxide.
Table 1.
Performance comparison between hydrazine-based liquid propellant and high-concentration hydrogen peroxide.
| Specification | Hydrazine (N2H4) | HTP (98 wt.%) |
|---|---|---|
| Vacuum specific impulse | 244.8 sec | 188.2 sec |
| Density | 1.02 g/cm3 | 1.43 g/cm3 |
| Specific heat | 1.559 J/(g·K) | 2.650 J/(g·K) |
| Decomposition product | Gaseous NH3, H2 | Gaseous H2O2, O2 |
Table 2.
Performance comparison between different concentrations of the high-concentration hydrogen peroxide.
Table 2.
Performance comparison between different concentrations of the high-concentration hydrogen peroxide.
| Density (wt.%) | Vacuum specific impulse (sec) | Adiabatic decomposition temperature (K) | Density @STP | Specific heat @STP (J/(g · K)) |
|---|---|---|---|---|
| 85 | 162.04 | 910.26 | 1.3762 | 2.8538 |
| 90 | 172.62 | 1032.45 | 1.3985 | 2.7755 |
| 98 | 188.23 | 1228.08 | 1.4343 | 2.6503 |
Table 3.
Design specification of 50 N-class HTP monopropellant thruster.
| Parameters | Value | Unit |
|---|---|---|
| Thrust | 50 | N |
| Propellant | 90 wt.% HTP | |
| Chamber pressure | 20 | bar |
| Propellant mass flow rate | 40.86 | g/s |
| Theoretical C* | 949.5 | m/s |
| Catalytic reactor length | 35 | mm |
| Catalytic reactor diameter | 28 | mm |
| Nozzle type | 15∘ cone | |
| Nozzle expansion ratio | 3.18 | |
| Nozzle throat diameter | 4.86 | mm |
Table 4.
Design requirements of the valve control system.
| Design requirements | Value |
|---|---|
| Rise, Fall time | < 1 msec |
| Input voltage | 28 ± 3 V |
| Duty cycle error between signals | < 1% |
| Phase difference between signals | < 1 msec |
Table 5.
Performance of the valve control system with respect to design requirements.
| Specification | 10% Duty cycle | 90% Duty cycle |
|---|---|---|
| Rise time of command signal | 9.32 ns | 8.78 ns |
| Rise time of valve drive signal | 120 ns | 560 ns |
| Fall time of command signal | 14.19 ns | − |
| Fall time of valve drive signal | 20 s | − |
| Valve drive voltage | 25.6 - 28.4 V | 24.8 - 28 V |
| Duty cycle error between signals | 0.059% | 0.07% |
| Duty cycle of command signal | 9.794% | 89.79% |
| Phase difference between signals at valve open | 600 ns | 560 ns |
| Phase difference between signals at valve closure | 48 s | − |
Table 6.
Comparison between the ideal pressure surge and the measurement acquired by the valve closure during the steady-state operation.
Table 6.
Comparison between the ideal pressure surge and the measurement acquired by the valve closure during the steady-state operation.
| Case label | Surge pressure (bar) |
|---|---|
| Joukowsky’s equation | 29.59 |
| Test 1 | 24.43 |
| Test 2 | 25.75 |
| Test 3 | 26.74 |
Table 7.
Performance comparison between the designed value and the measurement acquired from steady-state hot fire tests.
Table 7.
Performance comparison between the designed value and the measurement acquired from steady-state hot fire tests.
| Specification | Designed value | Measurement data |
|---|---|---|
| Chamber pressure | 20 bar | 18 bar |
| Propellant mass flowrate | 40.86 g/s | 39.5 - 43.5 g/s |
| Thrust | 50 N | 45.21 - 49.1 N |
| Sea-level specific impulse | 124.75 sec | 109.1 - 124.7 sec |
| Thermal efficiency () | − | 98.44% |
| C* efficiency () | − | 99.80% |
Disclaimer/Publisher’s Note: The statements, opinions and data contained in all publications are solely those of the individual author(s) and contributor(s) and not of MDPI and/or the editor(s). MDPI and/or the editor(s) disclaim responsibility for any injury to people or property resulting from any ideas, methods, instructions or products referred to in the content. |
© 2025 by the authors. Licensee MDPI, Basel, Switzerland. This article is an open access article distributed under the terms and conditions of the Creative Commons Attribution (CC BY) license (http://creativecommons.org/licenses/by/4.0/).
Copyright: This open access article is published under a Creative Commons CC BY 4.0 license, which permit the free download, distribution, and reuse, provided that the author and preprint are cited in any reuse.


