
Submitted:
08 April 2025
Posted:
10 April 2025
You are already at the latest version
Abstract
The agricultural sector plays a pivotal role in fulfilling the objectives set forth by the EU Green Deal. However, the extensive use of synthetic fertilizers has contributed to nutrient over-enrichment in aquatic ecosystems, promoting eutrophication due to excess nitrogen inputs from fertilizers. This phenomenon is a key driver of rapid and excessive algal blooms in rivers, lakes, and seas. In this study, three globally cultivated crop species – oilseed rape (Brassica napus L.), common wheat (Triticum aestivum L.), and pea (Pisum sativum L.) – were selected for experimental analysis. Various quantities of lyophilized phytoplankton biomass, collected from the Curonian Lagoon, a biologically productive and ecologically sensitive brackish water body in the southeastern Baltic region, were incorporated into the growth substrates of the studied plants. To evaluate the potential of phytoplankton biomass as a substitute for synthetic fertilizers, several biochemical parameters were assessed, including proline content, lipid peroxidation levels, hydrogen peroxide production, total phenols content, and antioxidant activity. The findings indicate that utilizing excess phytoplankton biomass can serve not only as a plant growth biostimulant but also as a sustainable alternative to synthetic fertilizers, thereby contributing to improved water quality and more environmentally responsible agricultural practices.
Keywords:
biofertilizer
; phytoplankton biomass
; plant biostimulant
; sustainable agriculture
; osmolytes
; oxidative stress
; crop growth
1. Introduction
Fertilizers are fundamental to modern agricultural practices, as they provide essential nutrients required for optimal plant growth and productivity. Typically produced through chemical methods, synthetic fertilizers offer precisely formulated nutrient ratios, particularly nitrogen (N), phosphorus (P), and potassium (K) [1,2]. The advantages of synthetic fertilizers include ease of management, rapid results, application convenience, cost-effectiveness, and compatibility with other chemical stimulants [3,4]. However, synthetic fertilizers are frequently criticized for lacking meso- and micronutrients. Environmental concerns also arise regarding their effects on soil pH, increased risks of over-fertilization, and the resulting need for more frequent applications [5,6,7].
In 2022, the European Union (EU) reported the application of 9.8 million tons of mineral fertilizers—specifically nitrogen and phosphorus—in agriculture [8]. This represented a year-on-year decrease of 10.3%, and a cumulative 15.9% drop since the peak in 2017. Nevertheless, from 2013 to 2021, a rising trend in the use of N and P fertilizers was observed in several EU countries, including Lithuania [8].
The European Green Deal is a comprehensive policy framework aiming to achieve climate neutrality in Europe by 2050. It incorporates strategies such as scalable agroecological and organic practices, alternative protein sources, sustainable aquaculture, and personalized dietary initiatives. Among its key targets is reducing nutrient losses by 50% by 2030, aligning with broader zero-pollution goals for water, soil, and air. Improving crop nutrient use efficiency and decreasing dependence on synthetic fertilizers by 20% are central objectives. In this context, biological fertilizers are increasingly recognized as sustainable, environmentally friendly, and economically viable alternatives [9]. Consequently, EU Member States are expected to reduce their reliance on mineral fertilizers and align their practices with the Green Deal’s sustainability targets.
Although nitrogen and phosphorus fertilizers significantly enhance crop productivity, their excessive use often results in nutrient runoff, contributing to environmental degradation. Over the past century, terrestrial nutrient inflow into the Baltic Sea has increased substantially [10,11]. This runoff is a major contributor to eutrophication, an escalating ecological concern. While eutrophication may occur naturally, anthropogenic activities – including untreated wastewater discharge, intensive fertilizer use, and airborne industrial pollutants – have intensified the process [12,13]. Contaminated water bodies frequently exhibit harmful algal blooms (HABs), predominantly composed of cyanobacteria such as Microcystis aeruginosa, Dolichospermum flos-aquae (formerly Anabaena flos-aquae), and Aphanizomenon flos-aquae. These species are typically not grazed by zooplankton due to their size and have the ability to fix atmospheric nitrogen, allowing them to thrive even in low-nutrient environments. Gas-filled vacuoles facilitate the accumulation of nitrate and phosphate, enabling these cyanobacteria to colonize the well-lit surface layers. Their rapid proliferation reduces light penetration and depletes dissolved oxygen, often resulting in fish mortality and broader aquatic ecosystem disruption [14]. These dense algal mats exacerbate ecological imbalance in nutrient-rich freshwater systems [15].
Despite the detrimental effects associated with cyanobacterial blooms, these microorganisms possess considerable nutritional value. They contain proteins, vitamins, pigments, fatty acids, antioxidants, phytohormones, and amino acids, making them promising resources for biodiesel, biohydrogen, and biogas production, as well as for use in food supplements [16,17,18,19,20,21].
Cyanobacteria have been widely studied as biofertilizers due to their potential to enhance crop productivity. Free-living and symbiotic species – such as Chlorogloeopsis, Plectonema, Dolichospermum, Nostoc, and Anabaenopsis – produce phytohormones including auxins, cytokinins, gibberellins, and amino acids, which positively influence plant growth and development [22,23,24,25,26]. Cyanobacterial strains isolated from wheat rhizospheres, such as Nostoc, Calothrix ghosi, and Hapalosiphon intricatus, have been shown to improve radicle length, seed germination, and coleoptile development. When combined with eubacteria, they can synergistically enhance soil nutrient availability [27].
Nevertheless, phytoplankton biomass – particularly that containing Aphanizomenon flos-aquae – remains underutilized as a biofertilizer on a global scale. Its application is limited by several factors, including insufficient research on cyanobacterial toxin production and detection, as well as technical challenges related to cultivation and harvesting, all of which may affect plant development outcomes.
Our previous study examined the effects of different concentrations of lyophilized phytoplankton biomass, collected from the Curonian Lagoon, a biologically productive and ecologically sensitive brackish water body in the southeastern Baltic region, on the biometric parameters (aboveground height, fresh and dry weights) and photosynthetic pigment composition in common wheat (Triticum aestivum L.), oilseed rape (Brassica napus L.), and pea (Pisum sativum L.). These initial results suggested that phytoplankton biomass may positively influence growth and development in these crops [28]. However, the findings also underscored the need for more detailed research to identify which specific components of phytoplankton biomass, primarily composed of A. flos-aquae, contribute most significantly to plant development.
Therefore, the main objective of this study was to investigate the potential use of cyanobacterial biomass, incorporated into plant growth substrates along with a microbial biostimulant, as an alternative to synthetic fertilizers. The study focused on assessing the effects on the growth processes of common wheat, oilseed rape, pea, thereby contributing to sustainable agricultural practices, environmental protection, and improved water quality.
2. Materials and Methods
2.1. Plant Material, Growth Conditions, Treatments, and Composition of Active Substances
Cyanobacterial biomass was collected during a bloom event in the Curonian Lagoon using a plankton net and subsequently concentrated manually with a sieve. Excess water was removed, and the biomass was immediately frozen and lyophilized at −50 °C and 0.5 mbar using a VaCo 2 freeze dryer (Zirbus Technology, Bad Grund, Harz, Germany). The freeze-dried material was stored at −20 °C until further analysis. To identify the dominant cyanobacterial species, a sample of surface water (0.10–0.30 m depth) was collected for microscopic examination. Species identification was performed based on morphological characteristics according to Komárek and Komárková [29] and Komárek [30]. The analysis revealed that the biomass was dominated by the cyanobacterium Aphanizomenon flos-aquae, which comprised more than 96% of the total phytoplankton biomass.
To enhance the decomposition of phytoplankton biomass and promote the release of biologically active compounds essential for plant mineral nutrition, an aqueous solution of “ProbioHumus” (1:100) was applied to arable soil (pH 7.0–7.3, P₂O₅ 248–250 mg/ha, K₂O 214.0–214.6 mg/kg) 14 days prior to sowing across all treatments, including the control. The microbial composition of “ProbioHumus” (Baltic Probiotics, Ceptuve, Latvia) included: Bacillus subtilis, yeast Saccharomyces cerevisiae, lactic acid bacteria (Bifidobacterium animalis, B. bifidum, B. longum), Lactobacillus diacetylactis, L. casei, L. delbrueckii, L. plantarum, L. lactis, Streptococcus thermophilus, and photosynthetic bacteria Rhodopseudomonas palustris and R. sphaeroides. Seeds of common wheat (Triticum aestivum L., cv. ‘Skagen’), oilseed rape (Brassica napus L., cv. ‘Visby’), and pea (Pisum sativum L., cv. ‘Astronaute’) were sown in plastic pots (0.14 × 0.14 × 0.30 m), with twenty seeds per pot, using 5 liters of unfertilized growth substrate per pot. The experiments were conducted in a Climacell growth chamber (Medcenter Einrichtungen GmbH, Planegg, Germany) under controlled conditions: temperature of 21 ± 1 °C, a photoperiod of 16/8 h (day/night), and a photon flux density of 60 μmol m⁻² s⁻¹. Soil moisture was maintained by regular irrigation with tap water throughout the experiment. To assess the effect of phytoplankton biomass on plant growth and development—and recognizing that different cultivars require specific nitrogen levels to optimize yield and economic sustainability [31] — different amounts of phytoplankton biomass were incorporated into the growth substrate, corresponding to nitrogen equivalent levels of 30, 60, 90, and 120 kg/ha. Each treatment group consisted of five pots: a control (no phytoplankton biomass) and four groups with biomass additions corresponding to 30, 60, 90, and 120 kg/ha of nitrogen equivalent, respectively.
Plant material was collected at the BBCH-16 growth stage [32] for biochemical analysis. The samples were immediately frozen and stored at −80 °C (Skadi Green Line, International Labmate Ltd., St Albans, UK).
2.2. Determination of Proline Content
Free proline content was determined using a modified colorimetric reaction based on acidified ninhydrin, following the method described by Bates et al. [33]. Leaf tissue (0.5 g) from common wheat, pea, and oilseed rape plants was homogenized in 10 mL of 3% sulfosalicylic acid solution and extracted at 4 °C for 14 h. The resulting extracts were centrifuged at 700 × g for 20 min using an MPW–351 R centrifuge (MPW Med. Instruments, Warsaw, Poland). The ninhydrin reagent was prepared by dissolving ninhydrin in a mixture of 20 mL of 6 M phosphoric acid and 30 mL of glacial acetic acid. For the colorimetric reaction, 2 mL of the sample supernatant was mixed with 2 mL of acidified ninhydrin reagent and 2 mL of glacial acetic acid. The reaction mixtures were incubated in an oven (Kleinfeld Labortechnik, Gehrden, Germany) at 105 °C for 1 hour, then cooled in an ice bath for 15 minutes. The chromophore was extracted by adding 2 mL of toluene to each tube. The upper toluene layer containing the red chromophore was analyzed spectrophotometrically at 520 nm using a quartz multicuvette and microplate reader (Tecan, Männedorf, Switzerland). Toluene was used as a blank. Calibration was performed using a standard curve prepared with L-proline, and results were expressed as µmol of proline per gram of fresh weight (FW).
2.3. Determination of Hydrogen Peroxide and Malondialdehyde Content
Hydrogen peroxide (H₂O₂) accumulation, indicative of stress responses, was quantified using a modified method based on Alexieva et al. [34]. Leaf tissue was homogenized using porcelain mortars and pestles in 5% (w/v) trichloroacetic acid (TCA) (Sigma-Aldrich, St. Louis, MO, USA). The resulting suspension was centrifuged at 12,000 × g for 20 min at 4 °C using a refrigerated centrifuge (MPW-351 R, MPW, Warsaw, Poland).
Test solutions were prepared by mixing 1 part of the supernatant, 1 part of 10 mM potassium phosphate buffer (pH 7.0; Alfa Aesar), and 2 parts of 1 M potassium iodide (Alfa Aesar). For the blank solution, the same proportions were used, replacing the supernatant with 0.5 mL of 5% TCA. All solutions were incubated in the dark at 25 °C for 30 minutes. Absorbance was measured at 390 nm using a SPECORD 210 Plus spectrophotometer (Analytik Jena GmbH, Jena, Germany). Hydrogen peroxide concentrations were calculated from a calibration curve generated with standard H₂O₂ solutions, taking into account sample weight and dilution factors. The results were expressed as µmol H₂O₂ per g FW.
Malondialdehyde (MDA), a marker of lipid peroxidation and plasma membrane damage, was quantified as follows: 2 mL of the sample supernatant was mixed with 3 mL of 0.5% 2-thiobarbituric acid (TBA) in TCA solution (Alfa Aesar, Haverhill, MA, USA). The mixture was incubated in a BT 200 block thermostat (Kleinfeld Labortechnik, Germany) at 95 °C for 30 minutes and then rapidly cooled in an ice bath. Absorbance was measured at 532 nm and 600 nm using a SPECORD 210 Plus spectrophotometer (Analytik Jena GmbH, Jena, Germany). MDA content was calculated using an extinction coefficient of 155 mM⁻¹ cm⁻¹ [35] and expressed as nmol MDA per g FW.
2.4. Determination of Total Phenol Content
Total phenol content was evaluated using the Folin-Ciocalteu colorimetric method, following the protocol of Swain and Goldstein [36]. Fresh plant material (exact weight) was homogenized in a porcelain mortar with 10 mL of 90% methanol (Roth, Karlsruhe, Germany) acidified with 0.1 N hydrochloric acid (Fluka). The homogenate was filtered through a 0.2 μm filter (Whatman, Schnelldorf, Germany). For the colorimetric reaction, 0.5 mL of the methanolic extract was mixed with 4 mL of aqueous sodium carbonate solution (7.5%, Fluka, Seelze, Germany), followed by the addition of 2.5 mL of diluted Folin-Ciocalteu reagent. A blank solution was prepared using 0.5 mL of methanol instead of extract, combined with 4 mL of the same sodium carbonate solution and 2.5 mL of diluted Folin-Ciocalteu reagent. The mixtures were thoroughly mixed and incubated in the dark for 30 minutes at room temperature to allow for color development. Absorbance was measured at 765 nm using a spectrophotometer. Total phenol content was quantified using a calibration curve prepared with known concentrations of gallic acid, and the results were expressed as gallic acid equivalents (GAE) in mg/g FW (R² = 0.99).
2.5. Antioxidant Activity Determination
Antioxidant activity was assessed using the 2,2-diphenyl-1-picrylhydrazyl hydrate (DPPH) radical scavenging method, as described by Brand-Williams et al. [37]. A methanolic DPPH solution (6.5 × 10⁻⁵ M) was freshly prepared using methanol (Roth, Karlsruhe, Germany) and stirred for 3 hours at 4 °C in the dark using a magnetic stirrer (MM 2A, Praha, Czech Republic).
Plant tissue extracts were mixed with the DPPH solution at a ratio of 1:20. A blank solution was prepared using the same DPPH solution without plant extract. All solutions were incubated in the dark at 25 °C for 30 minutes. Absorbance was measured at 515 nm using a SPECORD 210 Plus spectrophotometer (Analytik Jena GmbH, Jena, Germany). Butylated hydroxytoluene (BHT; Sigma-Aldrich, St. Louis, MO, USA) was used as a reference antioxidant. DPPH radical scavenging activity (%) was calculated by comparing the absorbance values of the blank (Ac) and the test sample (As), using the equation: (Ac − As) × 100 / Ac.
2.6. Statistical Analysis
Statistical analyses were performed using Microsoft Excel 2010 (Microsoft Corp., Redmond, WA, USA) and Statistica 10 (StatSoft Inc., Tulsa, OK, USA). Arithmetic means and standard deviations (SD) were calculated using the built-in descriptive statistics functions (AVERAGE, STDE). The normality of the data was assessed using the Shapiro–Wilk test. Where data did not follow a normal distribution, a logarithmic transformation was applied.
One-way analysis of variance (ANOVA) followed by Tukey’s HSD post-hoc test was used to evaluate statistically significant differences between treatments. Differences were considered statistically significant at p < 0.05. Results are presented as mean ± standard deviation, based on five replicates per treatment.
3. Results
3.1. Proline Content
The highest statistically significant proline content in oilseed rape plants (40.14 ± 0.16 µmol/g FW) was recorded when phytoplankton biomass was added to the growth substrate at a nitrogen equivalent of 120 kg/ha. A statistically significant increase was also observed at the 90 kg/ha N application rate, with a proline content of 28.75 ± 0.28 µmol/g FW. Lower, yet still statistically significant increases compared to the control were found in plants treated with phytoplankton biomass equivalent to 30 kg/ha and 60 kg/ha of N, where proline contents reached 19.87 ± 0.18 µmol/g FW and 14.74 ± 0.25 µmol/g FW, respectively (Figure 1).
A statistically significant increase in proline content compared to the control was observed in common wheat plants when phytoplankton biomass was added to the growth substrate at nitrogen equivalent rates of 60, 90, and 120 kg/ha, reaching 6.15 ± 0.09 µmol/g FW, 4.86 ± 0.29 µmol/g FW, and 11.49 ± 0.39 µmol/g FW, respectively. In contrast, the addition of phytoplankton biomass corresponding to 30 kg/ha of N did not result in a significant change in proline content compared to the control, with a value of 4.08 ± 0.11 µmol/g FW (Figure 2).
The addition of phytoplankton biomass to the growth substrate of pea plants resulted in a statistically significant increase in proline content in all treatments compared to the control. The highest proline level (22.18 ± 0.22 µmol/g FW) was observed in pea plants grown in substrate supplemented with phytoplankton biomass equivalent to 60 kg/ha of nitrogen (Figure 3).
3.2. Hydrogen Peroxide Content
The highest statistically significant increase in H₂O₂ content in oilseed rape plants was observed when phytoplankton biomass was added to the growth substrate at a nitrogen equivalent of 120 kg/ha, reaching 2.14 ± 0.01 µmol/g FW. In contrast, a significant decrease in H₂O₂ content (0.68 ± 0.02 µmol/g FW) was recorded at the 30 kg/ha N rate. Similar H₂O₂ levels were observed at 60 kg/ha and 90 kg/ha, measuring 0.80 ± 0.01 and 0.90 ± 0.01 µmol/g FW, respectively (Figure 4).
The highest H₂O₂ content in common wheat plants (0.54 ± 0.03 µmol/g FW) was recorded following the addition of phytoplankton biomass equivalent to 90 kg/ha of nitrogen. A statistically significant increase in H₂O₂ content (0.33 ± 0.01 µmol/g FW) was also observed at 120 kg/ha. At 30 kg/ha, the H₂O₂ content reached 0.18 ± 0.01 µmol/g FW. In contrast, the lowest H₂O₂ level (0.09 ± 0.02 µmol/g FW) was detected in plants treated with phytoplankton biomass equivalent to 60 kg/ha, which was significantly lower than in the control and other treatments (Figure 5).
The most pronounced statistically significant increase in H₂O₂ content in pea plants was observed following the addition of phytoplankton biomass equivalent to 30 kg/ha of nitrogen, with a value of 0.70 ± 0.01 µmol/g FW—the highest among all treatments. At 60 kg/ha, the H₂O₂ content was 0.50 ± 0.01 µmol/g FW, and at 90 kg/ha, it was 0.45 ± 0.01 µmol/g FW. A moderate increase was also observed at 120 kg/ha, reaching 0.58 ± 0.02 µmol/g FW. In all treatments, H₂O₂ content was significantly higher than in the control (Figure 6).
3.3. MDA Content
The addition of phytoplankton biomass to the growth substrate of oilseed rape plants at a nitrogen equivalent of 60 kg/ha resulted in the lowest malondialdehyde (MDA) content (20.56 ± 0.09 nmol/g FW) compared to the control. MDA content also remained lower than the control at other application rates: 23.23 ± 0.12 nmol/g FW at 30 kg/ha, 21.91 ± 0.13 nmol/g FW at 90 kg/ha, and 26.11 ± 0.34 nmol/g FW at 120 kg/ha (Figure 7).
The highest MDA content in common wheat plants (42.59 ± 0.68 nmol/g FW) was observed after the addition of phytoplankton biomass equivalent to 30 kg/ha of nitrogen, showing a statistically significant increase compared to the control. MDA content gradually decreased with increasing biomass rates (Figure 8).
A statistically significant increase in MDA content in pea plants was observed after the addition of phytoplankton biomass equivalent to 60 kg/ha of nitrogen, reaching 35.04 ± 0.07 nmol/g FW—the highest value recorded among all treatments. In contrast, the application of 30, 90, and 120 kg/ha resulted in lower MDA contents compared to the control, with values of 25.97 ± 0.14, 27.72 ± 0.41, and 26.02 ± 0.21 nmol/g FW, respectively (Figure 9).
3.4. Total Phenols Content and Antioxidant Activity
Our results showed that total phenols content decreased in all treated oilseed rape plants compared to the control group (1.45 ± 0.01 mg GAE/g FW). The lowest total phenols content was recorded at the 60 kg/ha N rate (0.99 ± 0.11 mg GAE/g FW), while the highest among treated groups was observed at 120 kg/ha (1.29 ± 0.01 mg GAE/g FW). At 30 kg/ha and 90 kg/ha, total phenols contents reached 1.20 ± 0.01 and 1.01 ± 0.07 mg GAE/g FW, respectively. A similar trend was observed in antioxidant activity. All treatments resulted in lower antioxidant activity compared to the control. The activity values in oilseed rape plants were 56.00 ± 0.50% (30 kg/ha), 46.68 ± 0.12% (60 kg/ha), 56.16 ± 0.11% (90 kg/ha), and 54.82 ± 0.44% (120 kg/ha), respectively (Figure 10).
In contrast to oilseed rape, the same amounts of phytoplankton biomass had different effects on total phenols content and antioxidant activity in common wheat plants. The lowest total phenols contents were recorded at 60 kg/ha (1.07 ± 0.01 mg GAE/g FW) and 120 kg/ha (1.08 ± 0.01 mg GAE/g FW). At 30 kg/ha and 90 kg/ha, total phenols content was higher, reaching 1.27 ± 0.01 and 1.30 ± 0.01 mg GAE/g FW, respectively. A similar pattern was observed in antioxidant activity. The lowest activity was found at 60 kg/ha (45.24 ± 1.16%) and 120 kg/ha (48.21 ± 1.22%). In contrast, higher antioxidant activities were measured at 30 kg/ha (64.69 ± 0.84%) and 90 kg/ha (73.36 ± 0.68%) of nitrogen equivalent (Figure 11).
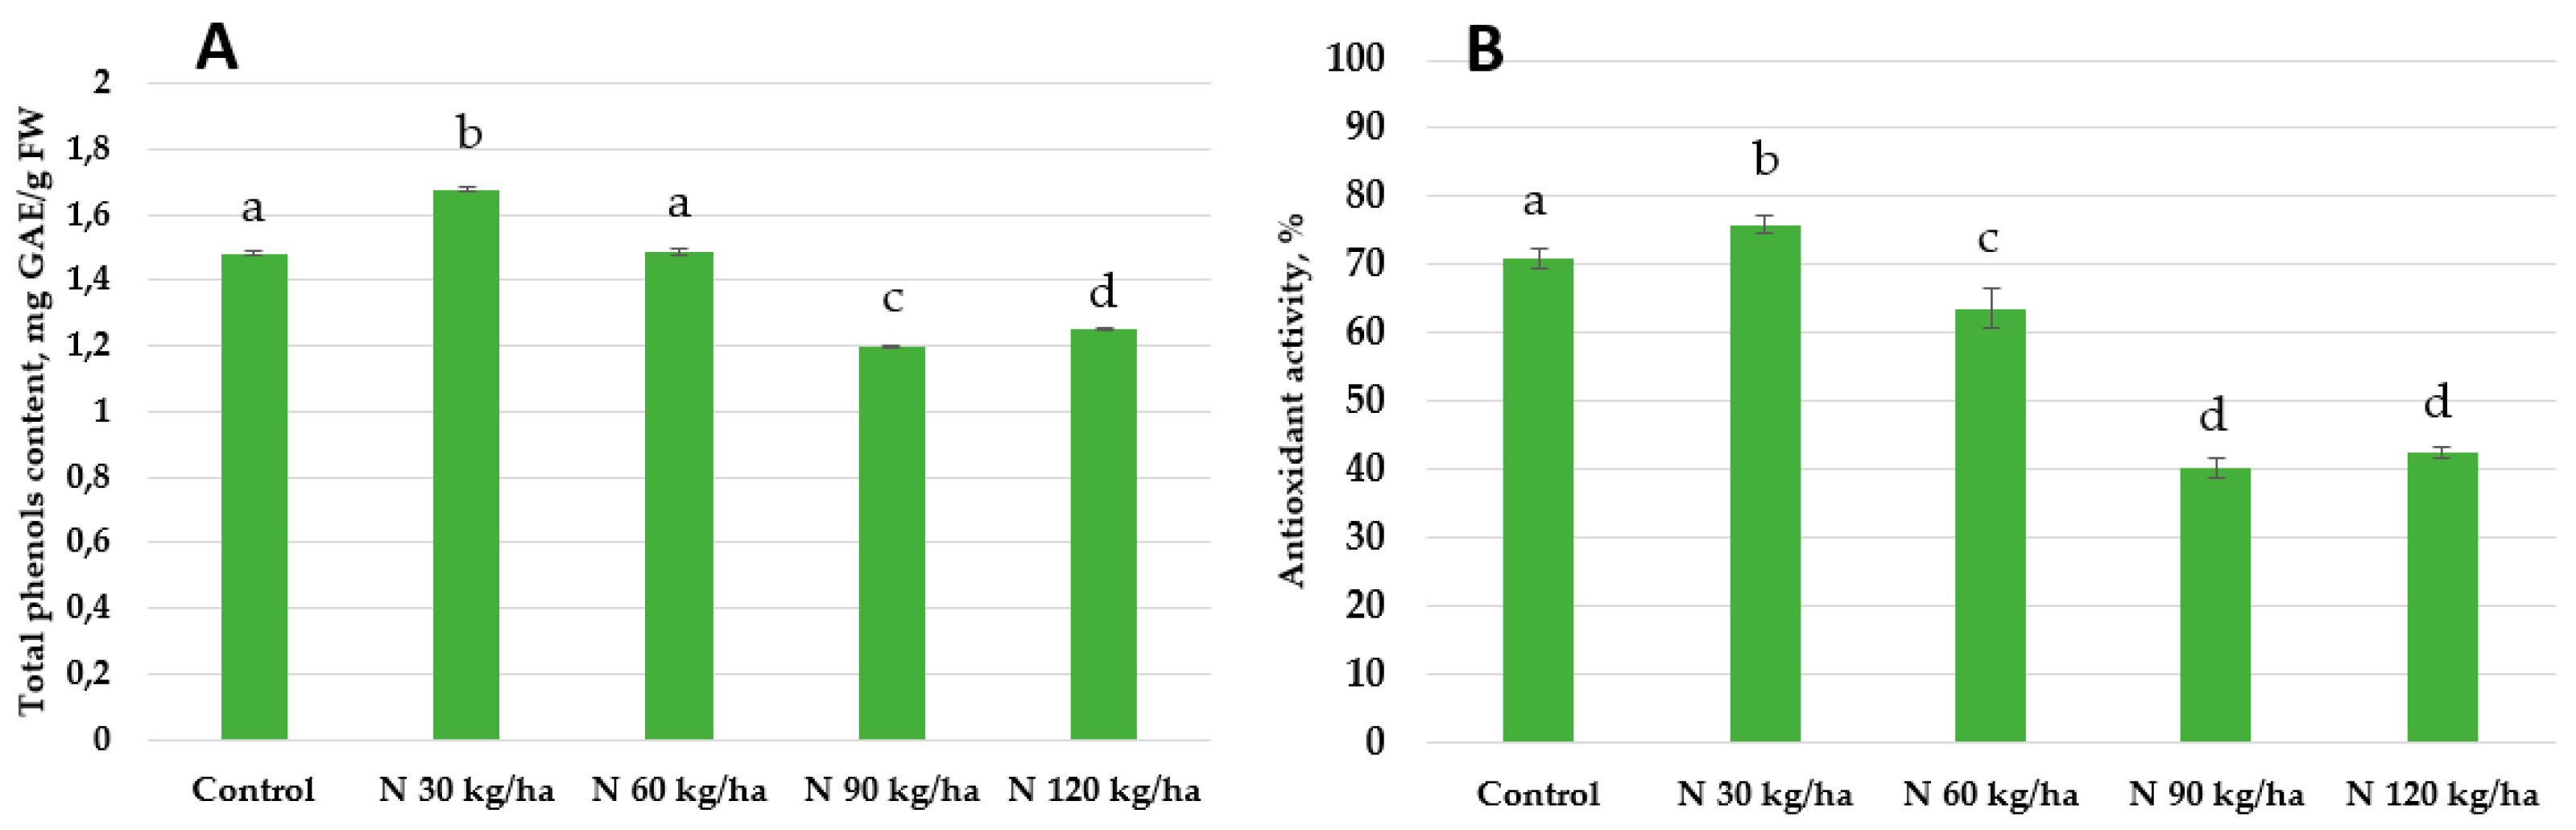
The addition of phytoplankton biomass equivalent to 90 kg/ha and 120 kg/ha of nitrogen to the growth substrate of pea plants resulted in comparable total phenols content of 1.20 ± 0.01 and 1.25 ± 0.01 mg GAE/g FW, respectively. A higher value was observed at 60 kg/ha (1.48 ± 0.01 mg GAE/g FW), while the highest total phenols content (1.68 ± 0.01 mg GAE/g FW) was recorded at 30 kg/ha. A similar trend was observed in antioxidant activity. The lowest activities were found at 90 kg/ha (40.25 ± 1.55%) and 120 kg/ha (42.50 ± 0.69%). At 60 kg/ha, antioxidant activity increased to 63.65 ± 3.00%, and the highest activity was observed at 30 kg/ha, reaching 75.93 ± 1.14% (Figure 12).
4. Discussion
The growing global population is closely linked to increasing demand for food resources, which in turn drives the intensification of agriculture. While the EU agri-food sector plays a vital role in the European economy, it also has a significant environmental footprint. Uncontrolled agricultural expansion has led to widespread eutrophication and recurring massive algal blooms in water bodies [1,12,13,14]. These challenges underscore the need for sustainable approaches to maintain and improve agricultural productivity. One of the most promising solutions lies in renewable resources, such as microalgae, particularly cyanobacteria.
Experimental studies have demonstrated that microalgae can function as effective biostimulants, promoting plant growth and development [38,39,40,41,42]. In addition, these microorganisms may enhance plant resistance to environmental stress through their influence on plant gene expression [43,44,45]. Despite the fact that cyanobacteria produce biologically active compounds that benefit plants, fundamental and applied studies on the use of phytoplankton biomass—particularly that dominated by Aphanizomenon flos-aquae – in agriculture remain limited. Moreover, it is unclear whether A. flos-aquae pecifically can improve stress tolerance in the plant species investigated in this study.
To explore the potential of cyanobacterial biomass as a biofertilizer and its effects on plant tolerance to environmental stress, we selected common wheat, oilseed rape, and pea as test species. Different amounts of lyophilized phytoplankton biomass – calculated as nitrogen (N) equivalents of 30, 60, 90, and 120 kg/ha – were added to the growth substrate to determine the most effective dose.
Given that antioxidant activity and phenols content are key components of the plant’s oxidative stress response, and that MDA is a widely recognized biomarker of membrane lipid peroxidation, we focused on these biochemical indicators. Additionally, changes in hydrogen peroxide and proline levels are closely associated with plant responses to both abiotic and biotic stresses [46,47,48,49,50].
4.1. Proline Content Changes Under Various Phytoplankton Biomass Addition
Proline is an amino acid that accumulates in plants as an osmolyte when exposed to stress conditions such as ultraviolet light, drought, cold, heavy metals, and low temperatures [47,48]. It has a multifunctional role in cellular metabolism. Proline has been shown to support plant adaptation under unfavourable conditions by inhibiting the accumulation of toxic compounds within cells [51,52]. It can also act as a molecular chaperone, stabilising protein structures, reducing the vulnerability of plant tissues [53], regulating oxygen assimilation, donating NH₂ groups during amino acid synthesis, and enhancing respiratory activity [54]. These processes improve the supply of carbon and nitrogen compounds, strengthen cell walls, increase cellular energy availability, and enable plants to restore functions damaged by stress [54,55].
In the current study, all levels of phytoplankton biomass had a positive effect on proline accumulation in oilseed rape. The highest proline content was recorded at the 120 kg/ha N rate, where it was six times higher than in control plants. A significant effect was also observed at 90 kg/ha, resulting in a more than 4.3 - fold increase in proline content compared to the control (Figure 1).
In contrast, not all treatments led to significant changes in proline content in common wheat. At 30 kg/ha N, a decrease in proline content was observed, but it was not statistically significant. However, phytoplankton biomass equivalent to 120 kg/ha and 60 kg/ha caused statistically significant increases of 204% and 63%, respectively (Figure 2).
A similar pattern to that observed in oilseed rape was found in pea plants, where all phytoplankton treatments resulted in elevated proline levels. Although levels were higher than in the control, the 30 kg/ha and 120 kg/ha treatments had the least pronounced effects, showing slightly more than a twofold increase. In contrast, the 60 kg/ha and 90 kg/ha treatments led to the highest increases in proline content, up to 2.7-fold compared to control plants (Figure 3).
It is important to note that proline can accumulate in plant tissues under both stress and non-stress conditions, and there is no universally defined baseline level for proline under optimal conditions. Therefore, based on our findings, the addition of phytoplankton biomass to the growth substrate appears to promote the accumulation of this key osmolyte, potentially enhancing plant adaptability to environmental stress.
These results are in agreement with previous studies on common wheat seedlings, where Dunaliella salina application enhanced germination and coleoptile growth and promoted proline synthesis [56]. Similarly, Oculatella lusitanica was shown to reduce the negative effects of salinity stress in lettuce plants by stimulating non-enzymatic antioxidant mechanisms, including proline, hydrogen peroxide, and glutathione [57].
4.2. Influence of Different Amounts of Phytoplankton Biomass on Hydrogen Peroxide and Malondialdehyde Content
Hydrogen peroxide (H₂O₂) is one of the key reactive oxygen species (ROS) continuously produced in plant cells as a by-product of aerobic metabolism. It can be generated not only under stress conditions, but also during normal physiological processes involving electron transfer, such as respiration and photosynthesis. H₂O₂ plays a dual role in plants: at low concentrations, it acts as a signalling molecule involved in gene expression, pathogen defense, and programmed cell death, while at high concentrations it causes oxidative stress and cellular damage [58]. It also contributes to various physiological processes, including growth and development, cellular senescence, stomatal regulation, photosynthesis, and respiration [46]. Our experiment revealed that the addition of phytoplankton biomass to the growth substrates of the analysed plants resulted in heterogeneous effects on hydrogen peroxide (H₂O₂) content, depending on the plant species and the applied biomass amount.
In oilseed rape plants, the most significant increase in H₂O₂ content was observed with the addition of phytoplankton biomass equivalent to N 120 kg/ha, where the content was more than 77% higher than in the control group (Figure 4).
Among common wheat plants, the most remarkable increase in H₂O₂ content occurred with the N 90 kg/ha treatment, where levels rose by 18-fold compared to the control. A similarly strong effect was observed at N 120 kg/ha, with H₂O₂ levels increasing 11-fold relative to control plants (Figure 5).
In pea plants, all tested biomass amounts significantly elevated H₂O₂ content compared to the control. The smallest increases were recorded at N 60 kg/ha and N 90 kg/ha, with H₂O₂ contents 61% and 45% higher, respectively. However, the highest increases were observed at N 30 kg/ha and N 120 kg/ha, where H₂O₂ levels were more than 2.3-fold and 1.9-fold greater than in control plants, respectively (Figure 6).
As noted earlier, more intense photosynthesis is associated with increased H₂O₂ production. The elevated H₂O₂ levels observed in our study align closely with findings from our previous research on photosynthetic pigment content in pea plants, where the highest pigment concentrations were also recorded [28].
Importantly, the observed H₂O₂ levels did not exceed the critical threshold of 5 µM, above which oxidative damage occurs, suggesting that the increases were within a beneficial range and likely acted as signalling rather than stress-inducing molecules [59].
Abiotic stress commonly stimulates ROS production, which can damage cellular macromolecules including lipids, proteins, and nucleic acids. Lipid peroxidation, driven by excess ROS, disrupts membrane integrity and function, especially when antioxidant defences are overwhelmed [49]. Experiments with Chlorella vulgaris under drought conditions showed that its application reduced MDA levels in broccoli, indicating alleviation of oxidative damage [60]. Our results align with these findings.
In oilseed rape, all phytoplankton treatments (N 30, N 60, N 90, and N 120 kg/ha) led to significantly lower MDA content compared to the control. Reductions of 26.9%, 35.3%, and 31.1% were observed at N 30, N 60, and N 90 kg/ha, respectively. Even at N 120 kg/ha, where the reduction was less pronounced (17.8%), the MDA level remained statistically significantly lower than in the control (Figure 7). These findings indicate that despite the rise in H₂O₂ content (Figure 4), no oxidative stress occurred, supporting the hypothesis that H₂O₂ served a signalling function rather than a stressor.
In common wheat, the addition of phytoplankton biomass at N 30, N 60, and N 90 kg/ha led to slight decreases in MDA content. However, only the N 120 kg/ha treatment resulted in a statistically significant reduction (5% lower than the control) (Figure 8). Notably, despite the dramatic increase in H₂O₂ levels at N 90 and N 120 kg/ha, there was no corresponding increase in lipid peroxidation, suggesting effective antioxidant responses in wheat.
In contrast, pea plants responded differently. The addition of phytoplankton biomass at N 30 kg/ha – despite producing the highest H₂O₂ content – resulted in the smallest reduction in MDA content (Figure 9). This discrepancy indicates that pea plants may have a unique oxidative stress response mechanism or a different sensitivity threshold to H₂O₂.
4.3. Activity of the Non-Enzymatic Plant Defence System under Various Phytoplankton Biomass Additions
Phenols are widespread secondary metabolites in plants that play essential physiological and morphological roles [61,62]. Under stressful conditions, phenols contribute to plant defence by enhancing resistance to pathogens and diseases, protecting leaves from UV radiation, and influencing characteristics such as colour, odour, and taste [63,64]. They also protect against photooxidative damage [65], heavy metal exposure [66], and inhibit lipid oxidation, thereby preserving membrane integrity and function [67]. The synthesis of phenols is highly responsive to both biotic (e.g., pathogens, infections) and abiotic (e.g., light, temperature, UV exposure) environmental factors [68]. Their antioxidant activity is attributed to the ability to neutralise free radicals [67,69]. Together with enzymatic defences, phenolic compounds form part of the plant’s non-enzymatic antioxidant system [50].
Our results showed that in oilseed rape, the addition of phytoplankton biomass to the growth substrate had no enhancing effect on the non-enzymatic defence system. In all treatments, both total phenol content and antioxidant activity decreased compared to the control. The smallest reduction in phenol content (11%) was observed in the N 120 kg/ha treatment. Antioxidant activity across all treatments was up to 27.89% lower than in the control, with the lowest value recorded at N 90 kg/ha, where antioxidant activity decreased by 13.24%.
In common wheat, the same trend was observed: antioxidant activity increased in parallel with rising total phenol content. The strongest activation of the non-enzymatic defence system occurred at N 90 kg/ha, where both parameters reached their highest values among all treatments.
A similar pattern was found in pea plants. Here, antioxidant activity and total phenol content also increased in correlation with H₂O₂ content. This suggests that a rise in H₂O₂ may trigger activation of the non-enzymatic defence system. The strongest response was recorded at N 30 kg/ha, where antioxidant activity and phenol content were statistically significantly higher than in the control by 7% and 13.51%, respectively (Figure 12).
Comparable findings have been reported in studies on rice. After 30 days of inoculation with Oscillatoria acuta and Phormidium boryanum, the phenol content in rice leaves increased markedly [70]. Similarly, treatment with Dunaliella salina enhanced both antioxidant activity and phenolic compound accumulation in tomato plants [71].
5. Conclusions
Based on the biochemical and biometric parameters analysed in both our previous [28] and current studies—including photosynthetic pigment content, proline, H₂O₂, MDA, total phenols, antioxidant activity, aboveground plant height, and changes in fresh and dry weights – it can be concluded that phytoplankton biomass equivalent to N 90 kg/ha had the most significant positive effect on the growth and development of oilseed rape and common wheat plants. In contrast, the N 30 kg/ha treatment had the strongest positive effect on pea plants.
The synergistic interaction between phytoplankton biomass and added probiotics not only enhanced plant growth but also appeared to activate key components of the non-enzymatic defence system, thereby contributing to increased resistance to adverse environmental factors.
Phytoplankton biomass, primarily composed of Aphanizomenon flos-aquae, represents a promising sustainable alternative to synthetic fertilisers. Its application in agriculture may not only support crop productivity but also offer an environmentally friendly solution for managing excess algal biomass resulting from eutrophication in aquatic ecosystems.
Author Contributions
Conceptualization, K.J., J.K., J.J., R.P.; methodology, K.J., J.K., J.J.; formal anaysis, R.M., K.J., J.K., J.J.; investigation, K.J., J.J.; data curation, J.J, R.M., K.J., S.J.; writing—original draft preparation, J.J.; writing—review and editing, J.J., S.J., J.K, R.P.; visualization, R.M.; supervision, J.J. All authors have read and agreed to the published version of the manuscript.
Funding
This research was funded by the Nature Research Centre R&D II programme.
Data Availability Statement
The data supporting reported results can be found in scientific reports of the Laboratory of Plant Physiology and Laboratory of Algology and Microbial Ecology of Nature Research Centre, where archived datasets generated during the study are included.
Conflicts of Interest
The authors declare no conflicts of interest.
References
- Chakraborty, S.; Tiwari, P.K.; Sasmal, S.K.; Misra, A.K.; Chattopadhyay, J. Effects of fertilizers used in agricultural fields on algal blooms. Eur. Phys. J. Spec. Top. 2017, 226, 2119–2133. [Google Scholar] [CrossRef]
- Zaib, M.; Zubair, M.; Aryan, M.; Abdullah, M.; Manzoor, S.; Masood, F.; Saeed, S. A review on challenge and opportunities of fertilizer use efficiency and their role in sustainable agriculture with future prospect and recommendations. Curr. Rese. Agri. Far. 2023, 4, 1–14. [Google Scholar] [CrossRef]
- Sharma, A.; Chetani, R. A review on the effect of organic and chemical fertilizers on plants. Int. J. Res. Appl. Sci. Eng. Technol. 2017, 5, 677–680. [Google Scholar] [CrossRef]
- Ciero, L. Role of inorganic fertilizers in modern agriculture: nourishing plants with minerals. Int. J. Manures and Fertilizers 2023, 11, 001–002. [Google Scholar]
- Verma, B.C.; Pramanik, P.; Bhaduri, D. Organic fertilizers for sustainable soil and environmental management. In Nutrient Dynamics for Sustainable Crop Production, Meena R.S.,Ed. Springer, Singapore, 2020, pp.289–313. [CrossRef]
- Chittora, D.; Parveen, T.; Yadav, J.; Meena, B.R.; Jain, T.; Sharma, K. Harmful impact of synthetic fertilizers on growing agriculture and environment. Glob. J. Pharmaceu. Sci. 2023, 11, 555804. [Google Scholar] [CrossRef]
- Shanmugavel, D.; Rusyn, I.; Solorza-Feria, O.; Kamaraj, S.-K. Sustainable SMART fertilizers in agriculture systems: A review on fundamentals to in-field applications. Sci. Total Environ. 2023, 904, 166729. [Google Scholar] [CrossRef]
- Eurostat. Available online: https://ec.europa.eu/eurostat/statistics-explained/index.php?title=Agri-environmental_indicator_-_mineral_fertiliser_consumption#Analysis_at_country_level (accessed on 2 January 2025).
- Europian commission. Available online: https://commission.europa.eu/strategy-and-policy/priorities-2019-2024/european-green-deal_en (accessed on 18 January 2025).
- Gustafsson, B.G.; Schenk, F.; Blenckner, T.; Eilola, K.; Meier, H.E.M.; Müller-Karulis, B.; Neumann, T.; Ruoho-Airola, T.; Savchuk, O.P.; Zorita, E. Reconstructing the development of Baltic Sea eutrophication. AMBIO 2012, 41, 534–548. [Google Scholar] [CrossRef]
- Lønborg, C.; Markager, S. Nitrogen in the Baltic Sea: Long-term trends, a budget and decadal time lags in responses to declining inputs. Estuarine, Coastal Shelf Sci. 2021, 261, 107529. [Google Scholar] [CrossRef]
- Balasuriya, B.T.G.; Ghose, A.; Gheewala, S.H.; Prapaspongsa, T. Assessment of eutrophication potential from fertiliser application in agricultural systems in Thailand. Sci Total Environ. 2022, 833, 154993. [Google Scholar] [CrossRef]
- Stakėnienė, R.; Jokšas, K.; Kriaučiūnienė, J.; Jakimavičius, D.; Raudonytė-Svirbutavičienė, E. Nutrient loadings and exchange between the curonian Lagoon and the Baltic Sea: Changes over the past two decades (2001–2020). Water 2023, 15, 4096. [Google Scholar] [CrossRef]
- Mazur-Marzec, H.; Pliński, M. Do toxic cyanobacteria blooms pose a threat to the Baltic ecosystem? Oceanologia 2009, 51, 293–319. [Google Scholar] [CrossRef]
- Lyon-Colbert, A.; Su, S.; Cude, C. A Systematic literature review for evidence of Aphanizomenon flos-aquae toxigenicity in recreational waters and toxicity of dietary. Toxins 2018, 10, 11–21. [Google Scholar] [CrossRef] [PubMed]
- Parmar, A.; Singh, N.K.; Pandey, A.; Gnansounou, E.; Madamwar, D. Cyanobacteria and microalgae: A positive prospect for biofuels. Bioresour. Technol. 2011, 102, 10163–10172. [Google Scholar] [CrossRef]
- Chen, J.; Li, J.; Dong, W.; Zhang, X.; Tyagi, R.D.; Drogui, P.; Surampalli, R. Y. The potential of microalgae in biodiesel production. Renewable and Sustainable Energy Rev. 2018, 90, 336–346. [Google Scholar] [CrossRef]
- Sitther, V.; Tabatabai, B.; Fathabad, S.G.; Gichuki, S.; Chen, H.; Christy, A.; Arumanayagam, S. Cyanobacteria as a biofuel source: Advances and applications. In Cyanobacterial Biology, Singh, P.K., Kumar, A., Singh, V.K., Shrivastava, A.K., Eds.; Academic Press Elsevier, London, UK, 2020, pp. 269-289. [CrossRef]
- Arias, D.M.; Ortíz-Sánchez, E.; Okoye, P.U.; Rodríguez-Rangel, H.; Ortega, A.B.; Longoria, A.; Domínguez-Espíndola, R.; Sebastian, P.J. A review on cyanobacteria cultivation for carbohydrate-based biofuels: cultivation aspects, polysaccharides accumulation strategies, and biofuels production scenarios. Sci. Total Environ. 2021, 794, 148636. [Google Scholar] [CrossRef] [PubMed]
- Hachicha, R.; Elleuch, F.; Ben Hlima, H.; Dubessay, P.; de Baynast, H.; Delattre, C.; Pierre, G.; Hachicha, R.; Abdelkafi, S.; Michaud, P.; et al. Biomolecules from microalgae and cyanobacteria: Applications and market survey. Appl. Sci. 2022, 12, 1924. [Google Scholar] [CrossRef]
- Scoglio, G.; Jackson, H.O.; Purton, S. The commercial potential of Aphanizomenon flos-aquae, a nitrogen-fixing edible cyanobacterium. J. Appl Phycol. 2024, 36, 1593–1617. [Google Scholar] [CrossRef]
- Hussain, A.; Hasnain, S. Phytostimulation and biofertilization in wheat by cyanobacteria. J. Ind. Microbiol. Biotechnol. 2011, 38, 85–92. [Google Scholar] [CrossRef]
- Mazhar, S.; Hasnain, S. Screening of native plant growth promoting cyanobacteria and their impact and Triticum aestivum var. Uqab 2000 growth. Afr. J. Agric. Res. 2011, 3988–3993. [Google Scholar] [CrossRef]
- Mader, P.; Kaiser, F.; Adholeya, A.; Singh, R.; Uppal, H.S.; Sharma, A.K.; et al. Inoculation of root microorganisms for sustainable wheat-rice and wheat-black gram rotations in India. Soil Biol. Biochem. 2011, 43, 609–619. [Google Scholar] [CrossRef]
- Ashraf, M.A.; Asif, M.; Zaheer, A.; Malik, A.; Qasim, A.Q.; Rasool, M. Plant growth promoting rhizobacteria and sustainable agriculture: A review. Afr. J. Microbiol. Res. 2013, 7, 704–709. [Google Scholar] [CrossRef]
- Chittora, D.; Meena, M.; Barupal, T.; Swapnil, P.; Sharma, K. Cyanobacteria as a source of biofertilizers for sustainable agriculture. Biochem. Biophys. Rep. 2020, 22, 100737. [Google Scholar] [CrossRef] [PubMed]
- Prasanna, R.; Babu, S.; Rana, A.; Kabi, S.R.; Chaudhary, V.; Gupta, V.; Kumar, A. Shivay, Y.S.; Nain, L.; Pal, R.K. Evaluating the establishment and agronomic proficiency of cyanobacterial consortia as organic options in wheat–rice cropping sequence. Exp. Agric. 2013, 49, 416–434. [Google Scholar] [CrossRef]
- Jankauskienė, J.; Buzytė, K.; Paškauskas, R. Melsvabakterių biomasės kaip biotrąšos naudojimo galimybės žemės ūkio augalų augimo ir vystymosi procesams valdyti. In Proceedings of the Conference for Junior Researchers “Science – Future of Lithuania”, Aplinkos apsaugos inžinerija / Environmental protection engineering, Vilnius, Lithuania, (19 March 2021) 24, 71-78. [CrossRef]
- Komárek, J.; Komárková, J. Diversity of Aphanizomenon-like cyanobacteria. Czech Phycol. 2006, 6, 1–32. [Google Scholar]
- Komárek, J. Cyanoprokaryota 3. Teil: Heterocytous Genera. In Süßwasserflora von Mitteleuropa Bd. 19/3, Büdel, B., Gärtner, G., Krienitz, L., Schagerl, M., Eds; Springer Spectrum, Berlin, 2013, pp. 1130.
- Hawkesford, M.; Riche, A.B. Impacts of G x E x M on nitrogen use efficiency in wheat and future prospects. Front. Plant Sci. 2020, 11, 1157. [Google Scholar] [CrossRef] [PubMed]
- Meier, U. Growth stages of mono and dicotyledonous plants. In BBCH Monograph; Meier, U., Ed.; Quedlinburg: Julius Kühn-Institut, 2018; p. 564. [Google Scholar] [CrossRef]
- Bates, L.S.; Waldren, R.P.; Teare, I.D. Rapid determination of free proline for water-stress studies. Plant Soil 1973, 39, 205–207. [Google Scholar] [CrossRef]
- Alexieva, V.; Sergiev, I.; Mapelli, S.; Karanov, E. The effect of drought and ultraviolet radiation on growth and stress markers in pea and wheat. Plant Cell Environ. 2001, 24, 1337–1344. [Google Scholar] [CrossRef]
- Kramer, G.; Norman, H.; Krizek, D.; Mirecki, R. Influence of UV-B radiation on polyamines, lipid peroxidation and membrane lipids in cucumber. Phytochemistry 1991, 30, 2101–2108. [Google Scholar] [CrossRef]
- Swain, T.; Goldstein, L. Methods in polyphenol chemistry. Pridham, J.B. Ed.; Pergamon Press, Oxford, UK., 1964; pp. 131–146.
- Brand-Williams, W.; Cuvelier, M.E.; Berset, C. Use of a free radical method to evaluate antioxidant activity. LWT—Food Sci. Technol. 1995, 28, 25–30. [Google Scholar] [CrossRef]
- Karthikeyan, N.; Prasanna, R.; Sood, A.; Jaiswal, P.; Nayak, S.; Kaushik, B.D. Physiological characterization and electron microscopic investigation of cyanobacteria associated with wheat rhizosphere. Folia Microbiol. 2009, 54, 43–51. [Google Scholar] [CrossRef]
- Maqubela, M.P.; Mnkeni, P.N.S.; Malam Issa, O.; Pardo, M.T.; D’Acqui, L.P. Nostoc cyanobacterial inoculation in South African agricultural soils enhances soil structure, fertility, and maize growth. Plant Soil 2009, 315, 79–92. [Google Scholar] [CrossRef]
- Sharma, S.B.; Sayyed, R.Z.; Trivedi, M.H.; Gobi, T.A. Phosphate solubilizing microbes: sustainable approach for managing phosphorus deficiency in agricultural soils. SpringerPlus 2013, 2, 587. [Google Scholar] [CrossRef]
- Li, J.; Li, C.; Smith, S.M. Hormone metabolism and signaling in plants; 1st ed.; Academic Press Elsevier, London, UK, 2017; pp. 597.
- Řezanka, T.; Palyzová, A.; Sigler, K. Isolation and identification of siderophores produced by cyanobacteria. Folia Microbiol. 2018, 63, 569–579. [Google Scholar] [CrossRef]
- Chiaiese, P.; Corrado, G.; Colla, G.; Kyriacou, M.C.; Rouphael, Y. Renewable sources of plant biostimulation: Microalgae as a sustainable means to improve crop performance. Front. Plant Sci. 2018, 9, 1782. [Google Scholar] [CrossRef]
- Kapoore, R.V.; Wood, E.E.; Llewellyn, C.A. Algae biostimulants: a critical look at microalgal biostimulants for sustainable agricultural practices. Biotechnol. Adv. 2021, 49, 107754. [Google Scholar] [CrossRef]
- Santini, G.; Biondi, N.; Rodolfi, L.; Tredici, M.R. Plant biostimulants from cyanobacteria: An emerging strategy to improve yields and sustainability in agriculture. Plants 2021, 10, 643. [Google Scholar] [CrossRef]
- Bright, J.; Desikan, R.; Hancock, J.T.; Weir, I.S.; Neill, S.J. ABA-induced NO generation and stomatal closure in Arabidopsis are dependent on H2O2 synthesis. Plant J. 2006, 45, 113–122. [Google Scholar] [CrossRef]
- Mattioli, R.; Falasca, G.; Sabatini, S.; Altamura, M.M.; Costantino, P.; Trovato, M. The proline biosynthetic genes P5CS1 and P5CS2 play overlapping roles in Arabidopsis flower transition but not in embryo development. Physiol. Plant 2009, 137, 72–85. [Google Scholar] [CrossRef]
- Yaish, M.W. Short communication proline accumulation is a general response to abiotic stress in the date palm tree (Phoenix dactylifera L.). Genet. Mol. Res. 2015, 14, 9943–9950. [Google Scholar] [CrossRef]
- Kong, W.; Liu, F.; Zhang, C.; Feng, H. Non-destructive determination of Malondialdehyde (MDA) distribution in oilseed rape leaves by laboratory scale NIR hyperspectral imaging. Sci Rep. 2016, 6, 35393. [Google Scholar] [CrossRef]
- Moradbeygi, H.; Jamei, R.; Heidari, R.; Darvishzadeh, R. Investigating the enzymatic and non-enzymatic antioxidant defense by applying iron oxide nanoparticles in Dracocephalum moldavica L. plant under salinity stress. Sci. Hortic. 2020, 272, 109537. [Google Scholar] [CrossRef]
- Yadav, S.K. Cold stress tolerance mechanisms in plants. A review. Agron. Sustainable Dev. 2010, 30, 515–527. [Google Scholar] [CrossRef]
- Hayat, S.; Hayat, Q.; Alyemeni, M.N.; Wani, A.S.; Pichtel, J.; Ahmad, A. Role of proline under changing environments: A review. Plant Signal Behav. 2012, 7, 1456–66. [Google Scholar] [CrossRef]
- Lehmann, S.; Funck, D.; Szabados, L.; Rentsch, D. Proline metabolism and transport in plant development. Amino Acids 2010, 39, 949–962. [Google Scholar] [CrossRef] [PubMed]
- Verbruggen, N.; Hermans, C. Proline accumulation in plants: A review. Amino Acids 2008, 35, 753–759. [Google Scholar] [CrossRef] [PubMed]
- Renzetti, M.; Funck, D.; Trovato, M. Proline and ROS: A unified mechanism in plant development and stress response? Plants 2024, 14, 2. [Google Scholar] [CrossRef]
- El-Arroussi, H.; Elbaouchi, A.; Benhima, R.; Bendaou, N.; Smouni, A.; Wahby, I. Halophilic microalgae Dunaliella salina extracts improve seed germination and seedling growth of Triticum aestivum L. under salt stress. Acta Hortic. 2016, 1148, 13–26. [Google Scholar] [CrossRef]
- Brito, Â.; Rocha, M.; Kaštovský, J. Viera, J.; Viera, C.P.; Ramos, V.; Correia, M.; Santos, M.; Mota, R.; Roque, J.; Pissarra, J.; Melo, P.; Tamagninin, P. A new cyanobacterial species with a protective effect on lettuce grown under salinity stress: Envisaging sustainable agriculture practices. J. Appl. Phycol. 2022, 34, 915–928. [Google Scholar] [CrossRef]
- Jajić, I.; Sarna, T.; Szewczyk, G.; Strzałka, K. Changes in production of reactive oxygen species in illuminated thylakoids isolated during development and senescence of barley. J Plant Physiol. 2015, 184, 49–56. [Google Scholar] [CrossRef]
- Chakraborty, S.; Hill, A.L.; Shirsekar, G.; Afzal, A.J.; Wang, G.-L.; Mackey, D.; Bonello, P. Quantification of hydrogen peroxide in plant tissues using Amplex Red. Methods 2016, 109, 105–113. [Google Scholar] [CrossRef]
- Kusvuran, S. Microalgae (Chlorella vulgaris Beijerinck) alleviates drought stress of broccoli plants by improving nutrient uptake, secondary metabolites, and antioxidative defense system. Hortic. Plant J. 2021, 7, 221–231. [Google Scholar] [CrossRef]
- Amarala, J.S.; Seabra, R.M.; Andradea, P.B.; Valentaoa, P.; Pereirac, L.A.; Ferreresd, F. Phenolic profile in the quality control of walnut (Juglans regia L.) leaves. Food Chem. 2004, 88, 373–379. [Google Scholar] [CrossRef]
- Cartea, M.E.; Francisco, M.; Soengas, P. Phenolic compounds in Brassica vegetables. Molecules 2011, 16, 251–280. [Google Scholar] [CrossRef]
- Pereira, D.M.; Valentão, P.; Pereira, J.A.; Andrade, P.B. Phenolics: from chemistry to biology. Molecules 2009, 14, 2202–2211. [Google Scholar] [CrossRef]
- Naczk, M.; Shahidi, F. Extractios and analysis of phenolics in food. J. Chromatogr. 2004, 1054, 95–111. [Google Scholar] [CrossRef]
- Cazzonelli, I. Carotenoids in nature: Insights from plants and beyond. Funct. Plant Biol. 2011, 38, 833–847. [Google Scholar] [CrossRef]
- Battke, F.; Ernst, D.; Halbach, S. Ascorbate promotes mercury vapour emission from plants. Plant Cell Environ. 2005, 28, 1487–1495. [Google Scholar] [CrossRef]
- Podsedek, A. Natural antioxidants and antioxidant capacity of Brassica vegetables: A review. LWT – Food Sci. Technol. 2007, 40, 1–11. [Google Scholar] [CrossRef]
- Li, J.; Zhu, Z.; Gerendas, J. Effects of nitrogen and sulfur on total phenolics and antioxidant activity in two genotypes of leaf mustard. J. Plant Nutr. 2008, 31, 1642–1655. [Google Scholar] [CrossRef]
- Ali, A.; Alqurainy, F.; Motohashi, N. Activities of antioxidants in plants under environmental stress. Environ. Sci. Biol. 2006, 1–32. [Google Scholar]
- Singh, D.P.; Prabha, R.; Yandigeri, M.S.; Arora, D.K. Cyanobacteria-mediated phenylpropanoids and phytohormones in rice (Oryza sativa) enhance plant growth and stress tolerance. Antonie van Leeuwenhoek 2011, 100, 557–568. [Google Scholar] [CrossRef] [PubMed]
- El Arroussi, H.; Benhima, R.; El-Baouchi, A.; Sijilmassi, B.; El Mernissi, N.; Aafsar, A.; Meftah- Kadmiri, I.; Bendaou, N.; Smouni, A. Dunaliella salina exopolysaccharides: a promising biostimulant for salt stress tolerance in tomato (Solanum lycopersicum). J. Appl. Phycol. 2018, 30, 2929–2941. [Google Scholar] [CrossRef]
Figure 1.
Effect of different amounts of phytoplankton biomass on proline content in oilseed rape plants. Statistically significant differences between treatment groups are indicated by different letters (Tukey’s test, p < 0.05; mean ± SD, n = 5).
Figure 1.
Effect of different amounts of phytoplankton biomass on proline content in oilseed rape plants. Statistically significant differences between treatment groups are indicated by different letters (Tukey’s test, p < 0.05; mean ± SD, n = 5).
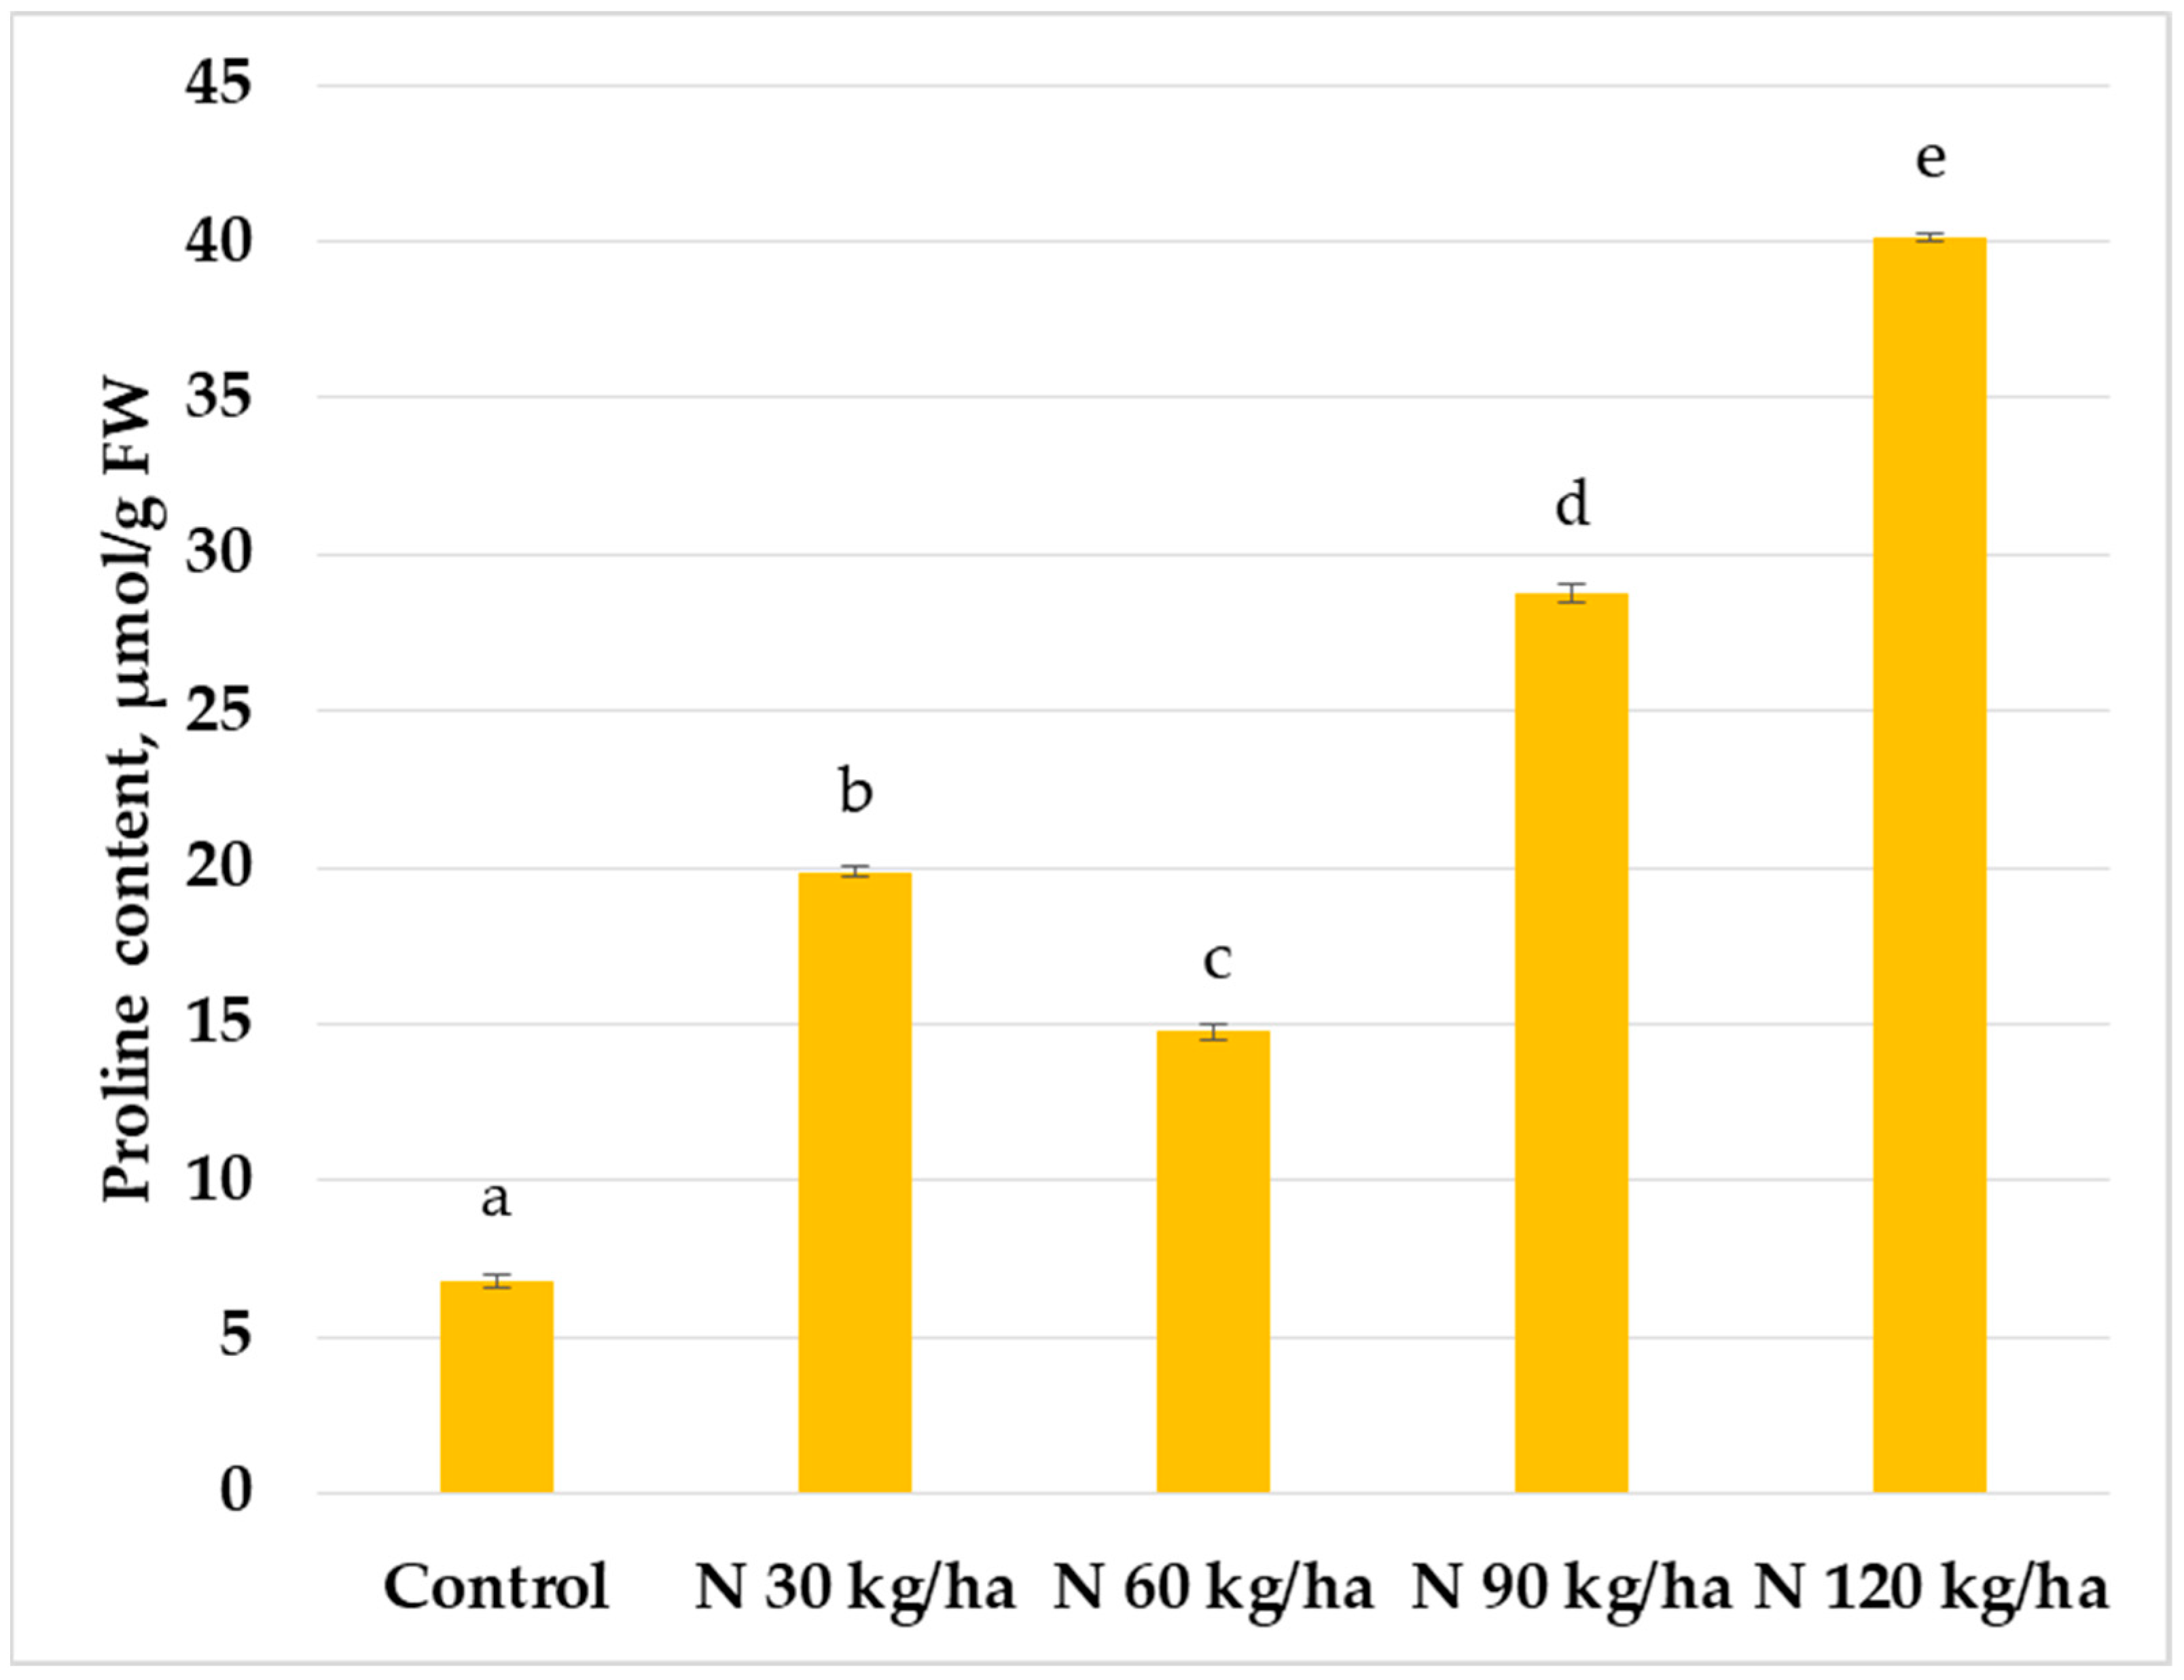
Figure 2.
Effect of different amounts of phytoplankton biomass on proline content in common wheat plants. Statistically significant differences between treatment groups are indicated by different letters (Tukey’s test, p < 0.05; mean ± SD, n = 5).
Figure 2.
Effect of different amounts of phytoplankton biomass on proline content in common wheat plants. Statistically significant differences between treatment groups are indicated by different letters (Tukey’s test, p < 0.05; mean ± SD, n = 5).

Figure 3.
Effect of different amounts of phytoplankton biomass on proline content in pea plants. Statistically significant differences between treatment groups are indicated by different letters (Tukey’s test, p < 0.05; mean ± SD, n = 5).
Figure 3.
Effect of different amounts of phytoplankton biomass on proline content in pea plants. Statistically significant differences between treatment groups are indicated by different letters (Tukey’s test, p < 0.05; mean ± SD, n = 5).
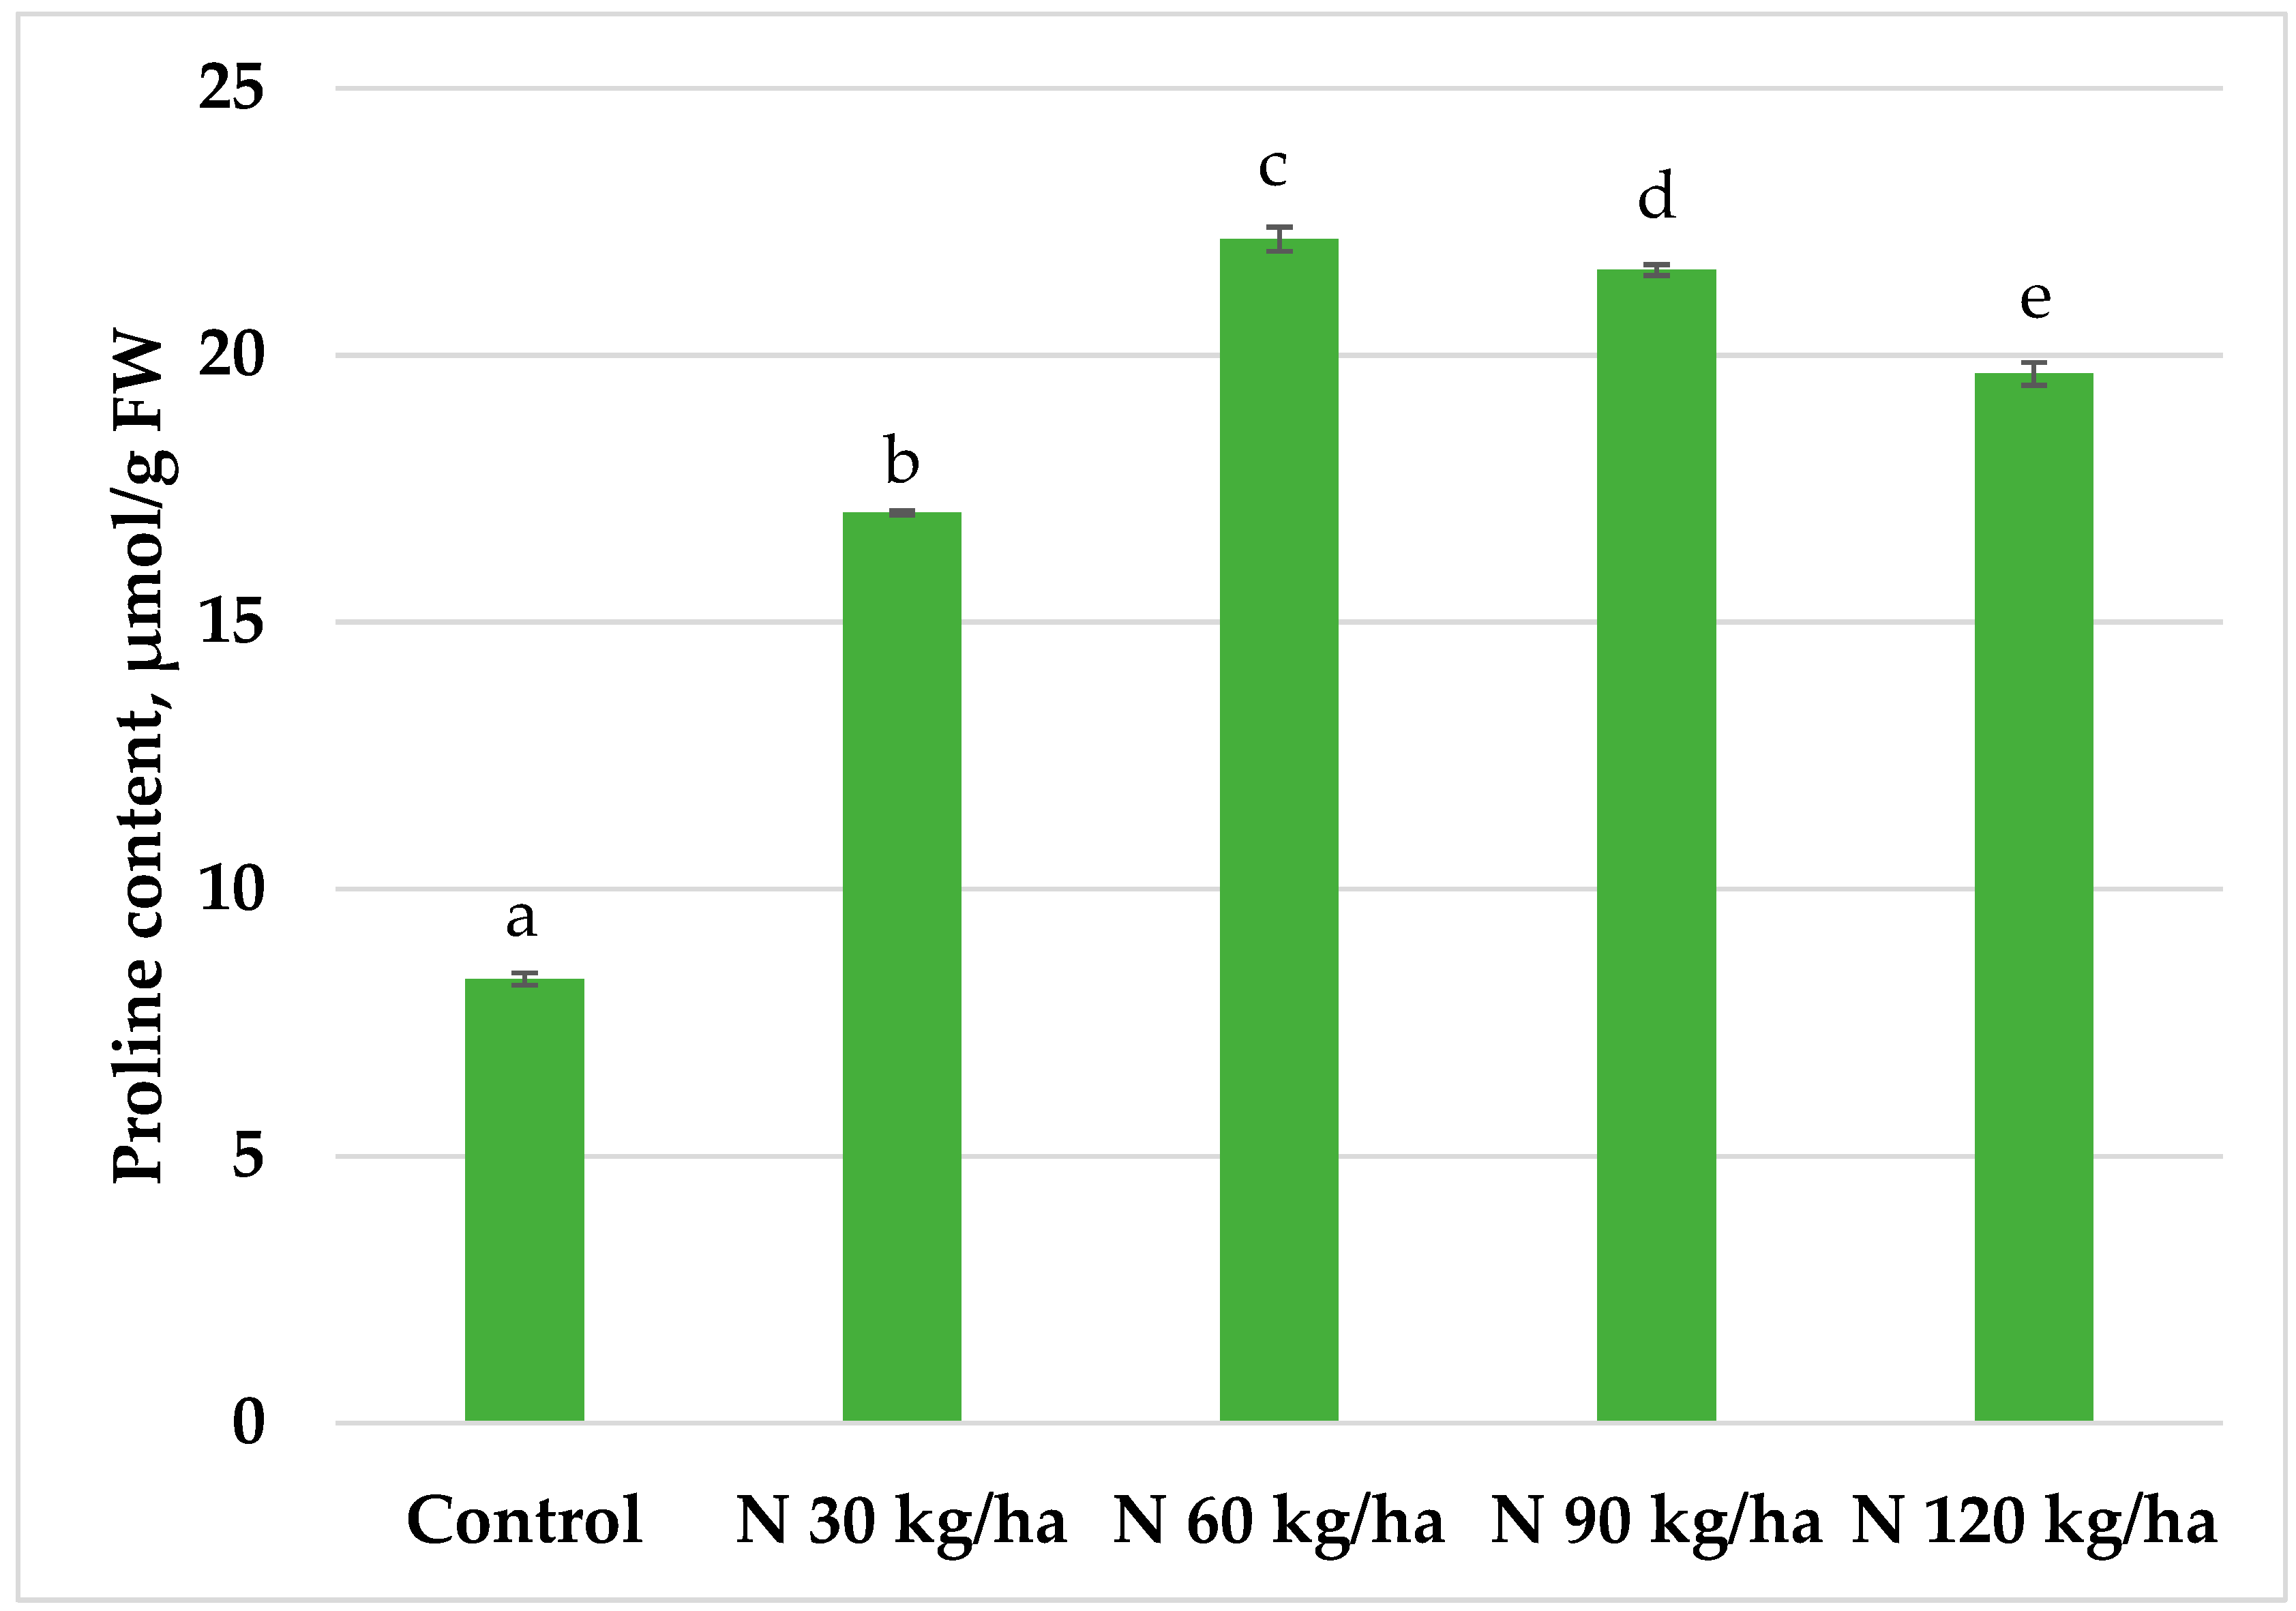
Figure 4.
Effect of different amounts of phytoplankton biomass on hydrogen peroxide content in oilseed rape plants. Statistically significant differences between treatment groups are indicated by different letters (Tukey’s test, p < 0.05; mean ± SD, n = 5).
Figure 4.
Effect of different amounts of phytoplankton biomass on hydrogen peroxide content in oilseed rape plants. Statistically significant differences between treatment groups are indicated by different letters (Tukey’s test, p < 0.05; mean ± SD, n = 5).
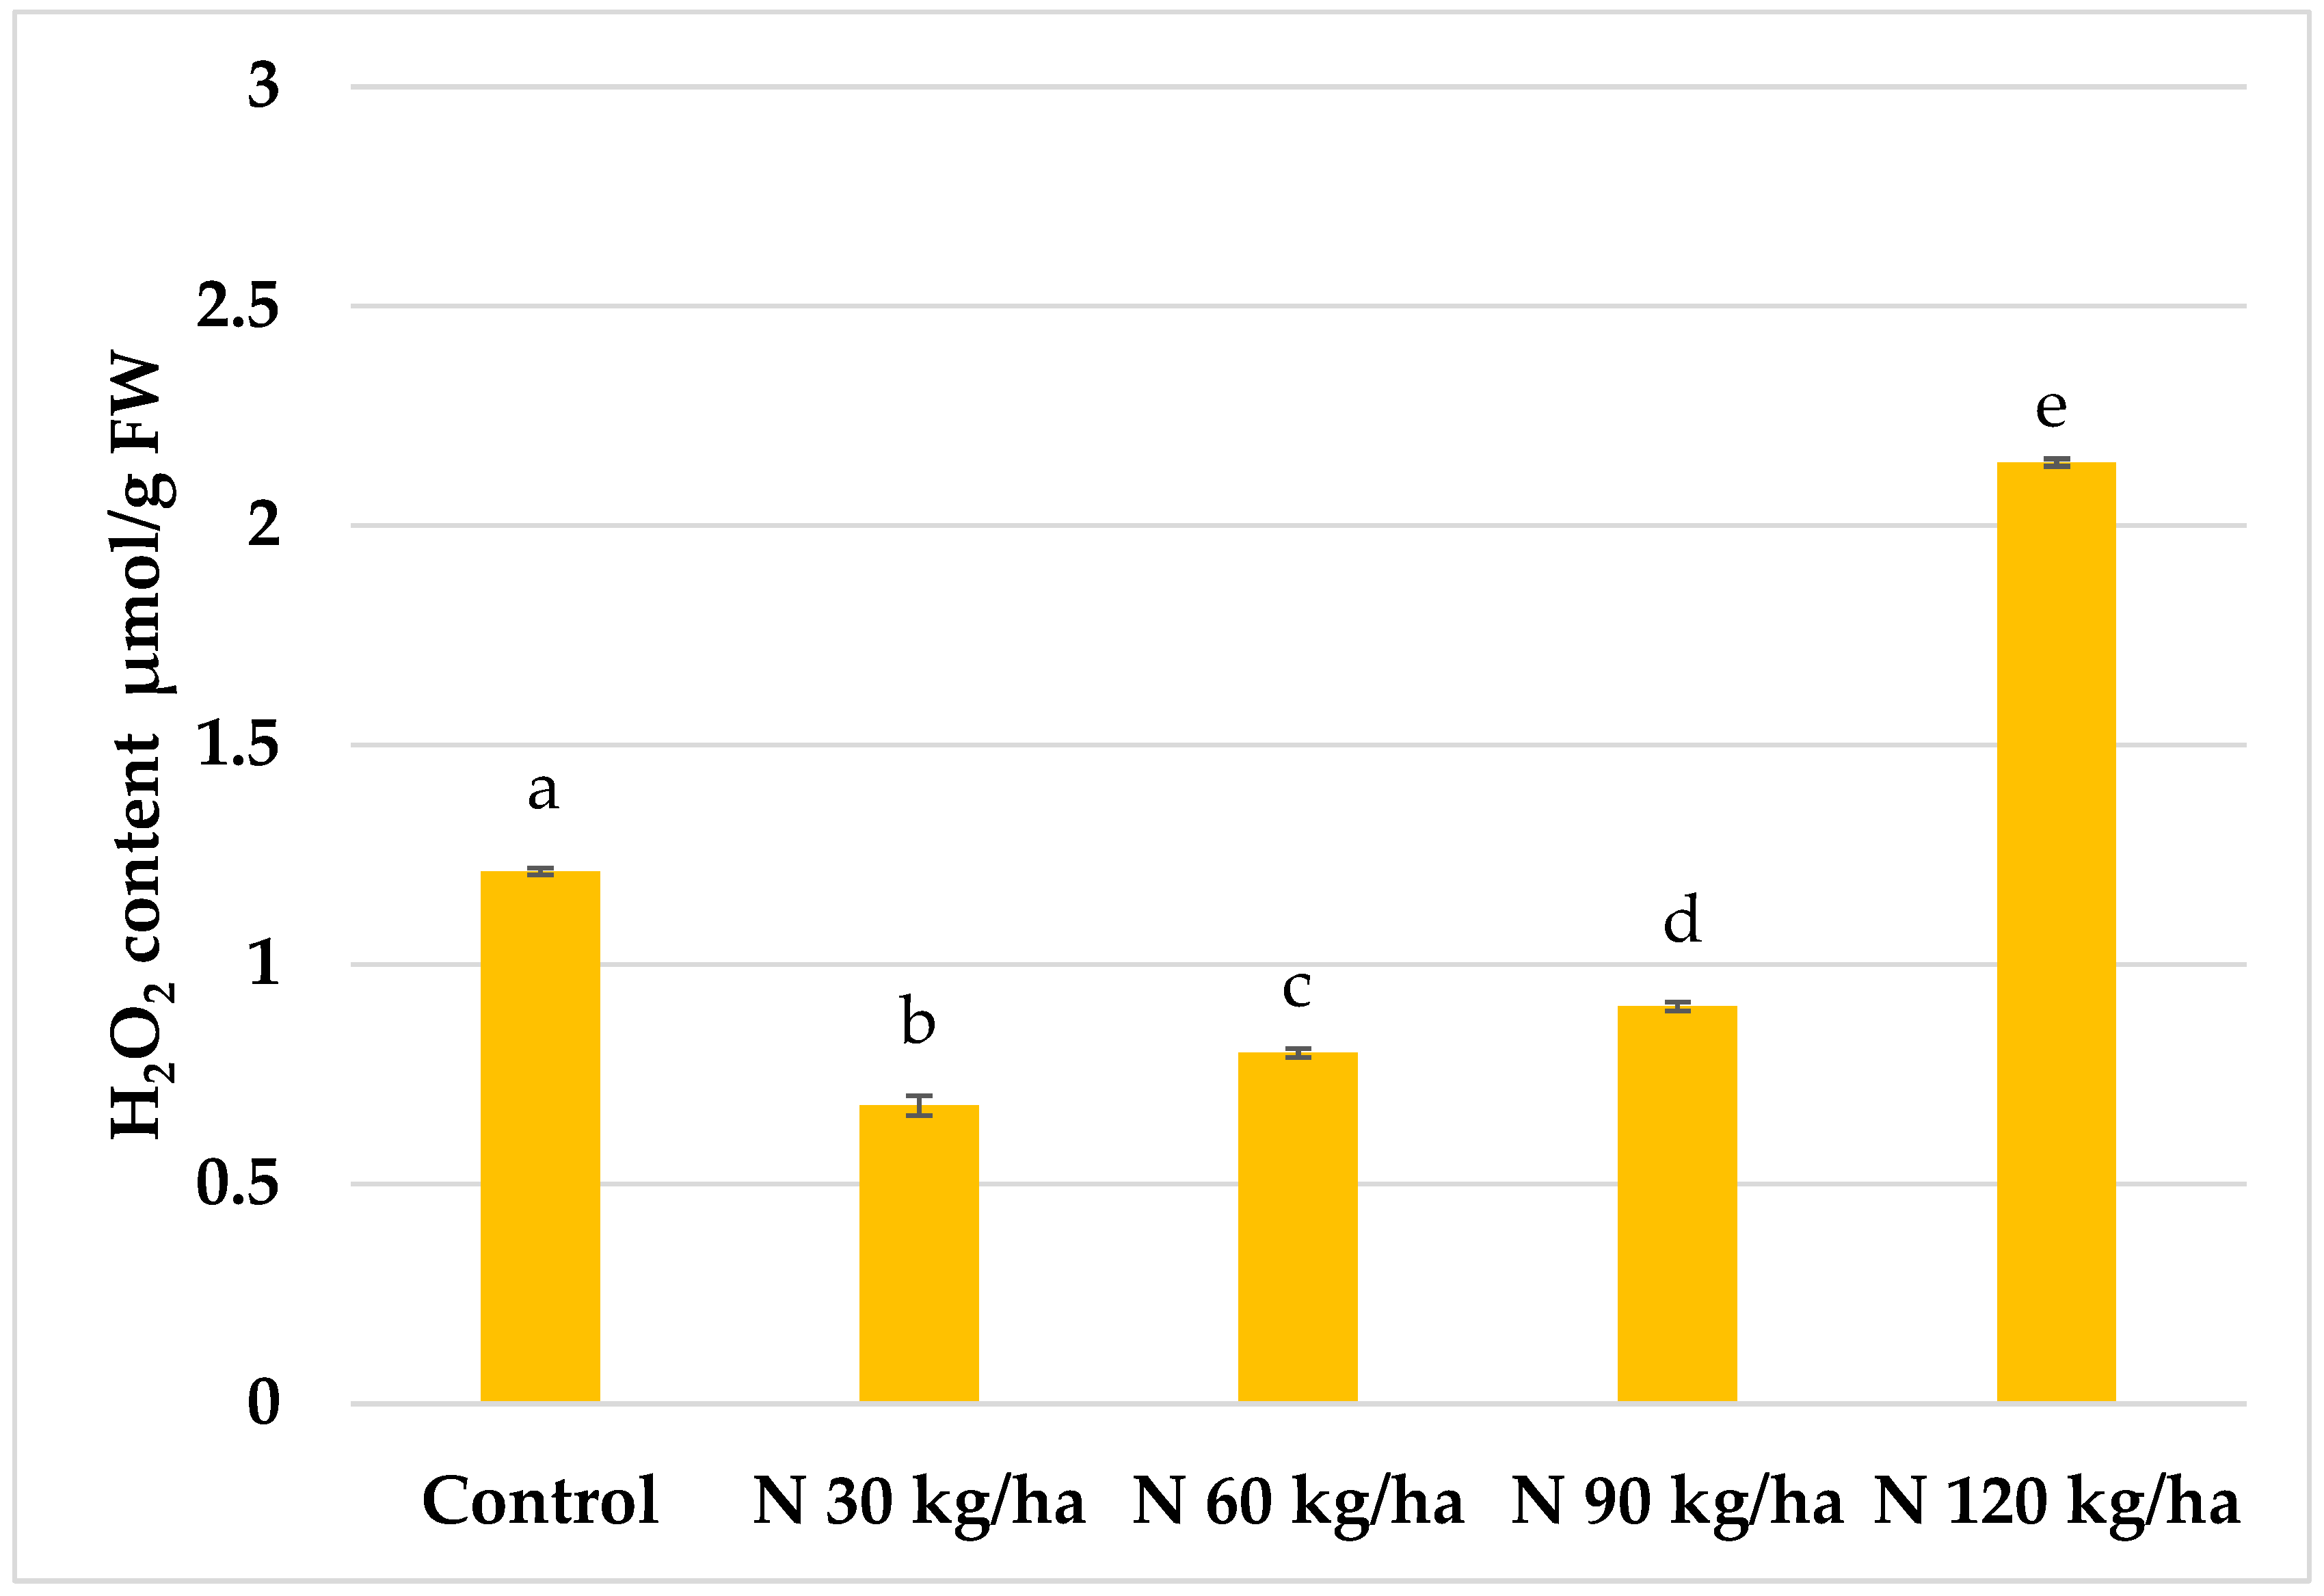
Figure 5.
Effect of different amounts of phytoplankton biomass on hydrogen peroxide content in common wheat plants. Statistically significant differences between treatment groups are indicated by different letters (Tukey’s test, p < 0.05; mean ± SD, n = 5).
Figure 5.
Effect of different amounts of phytoplankton biomass on hydrogen peroxide content in common wheat plants. Statistically significant differences between treatment groups are indicated by different letters (Tukey’s test, p < 0.05; mean ± SD, n = 5).
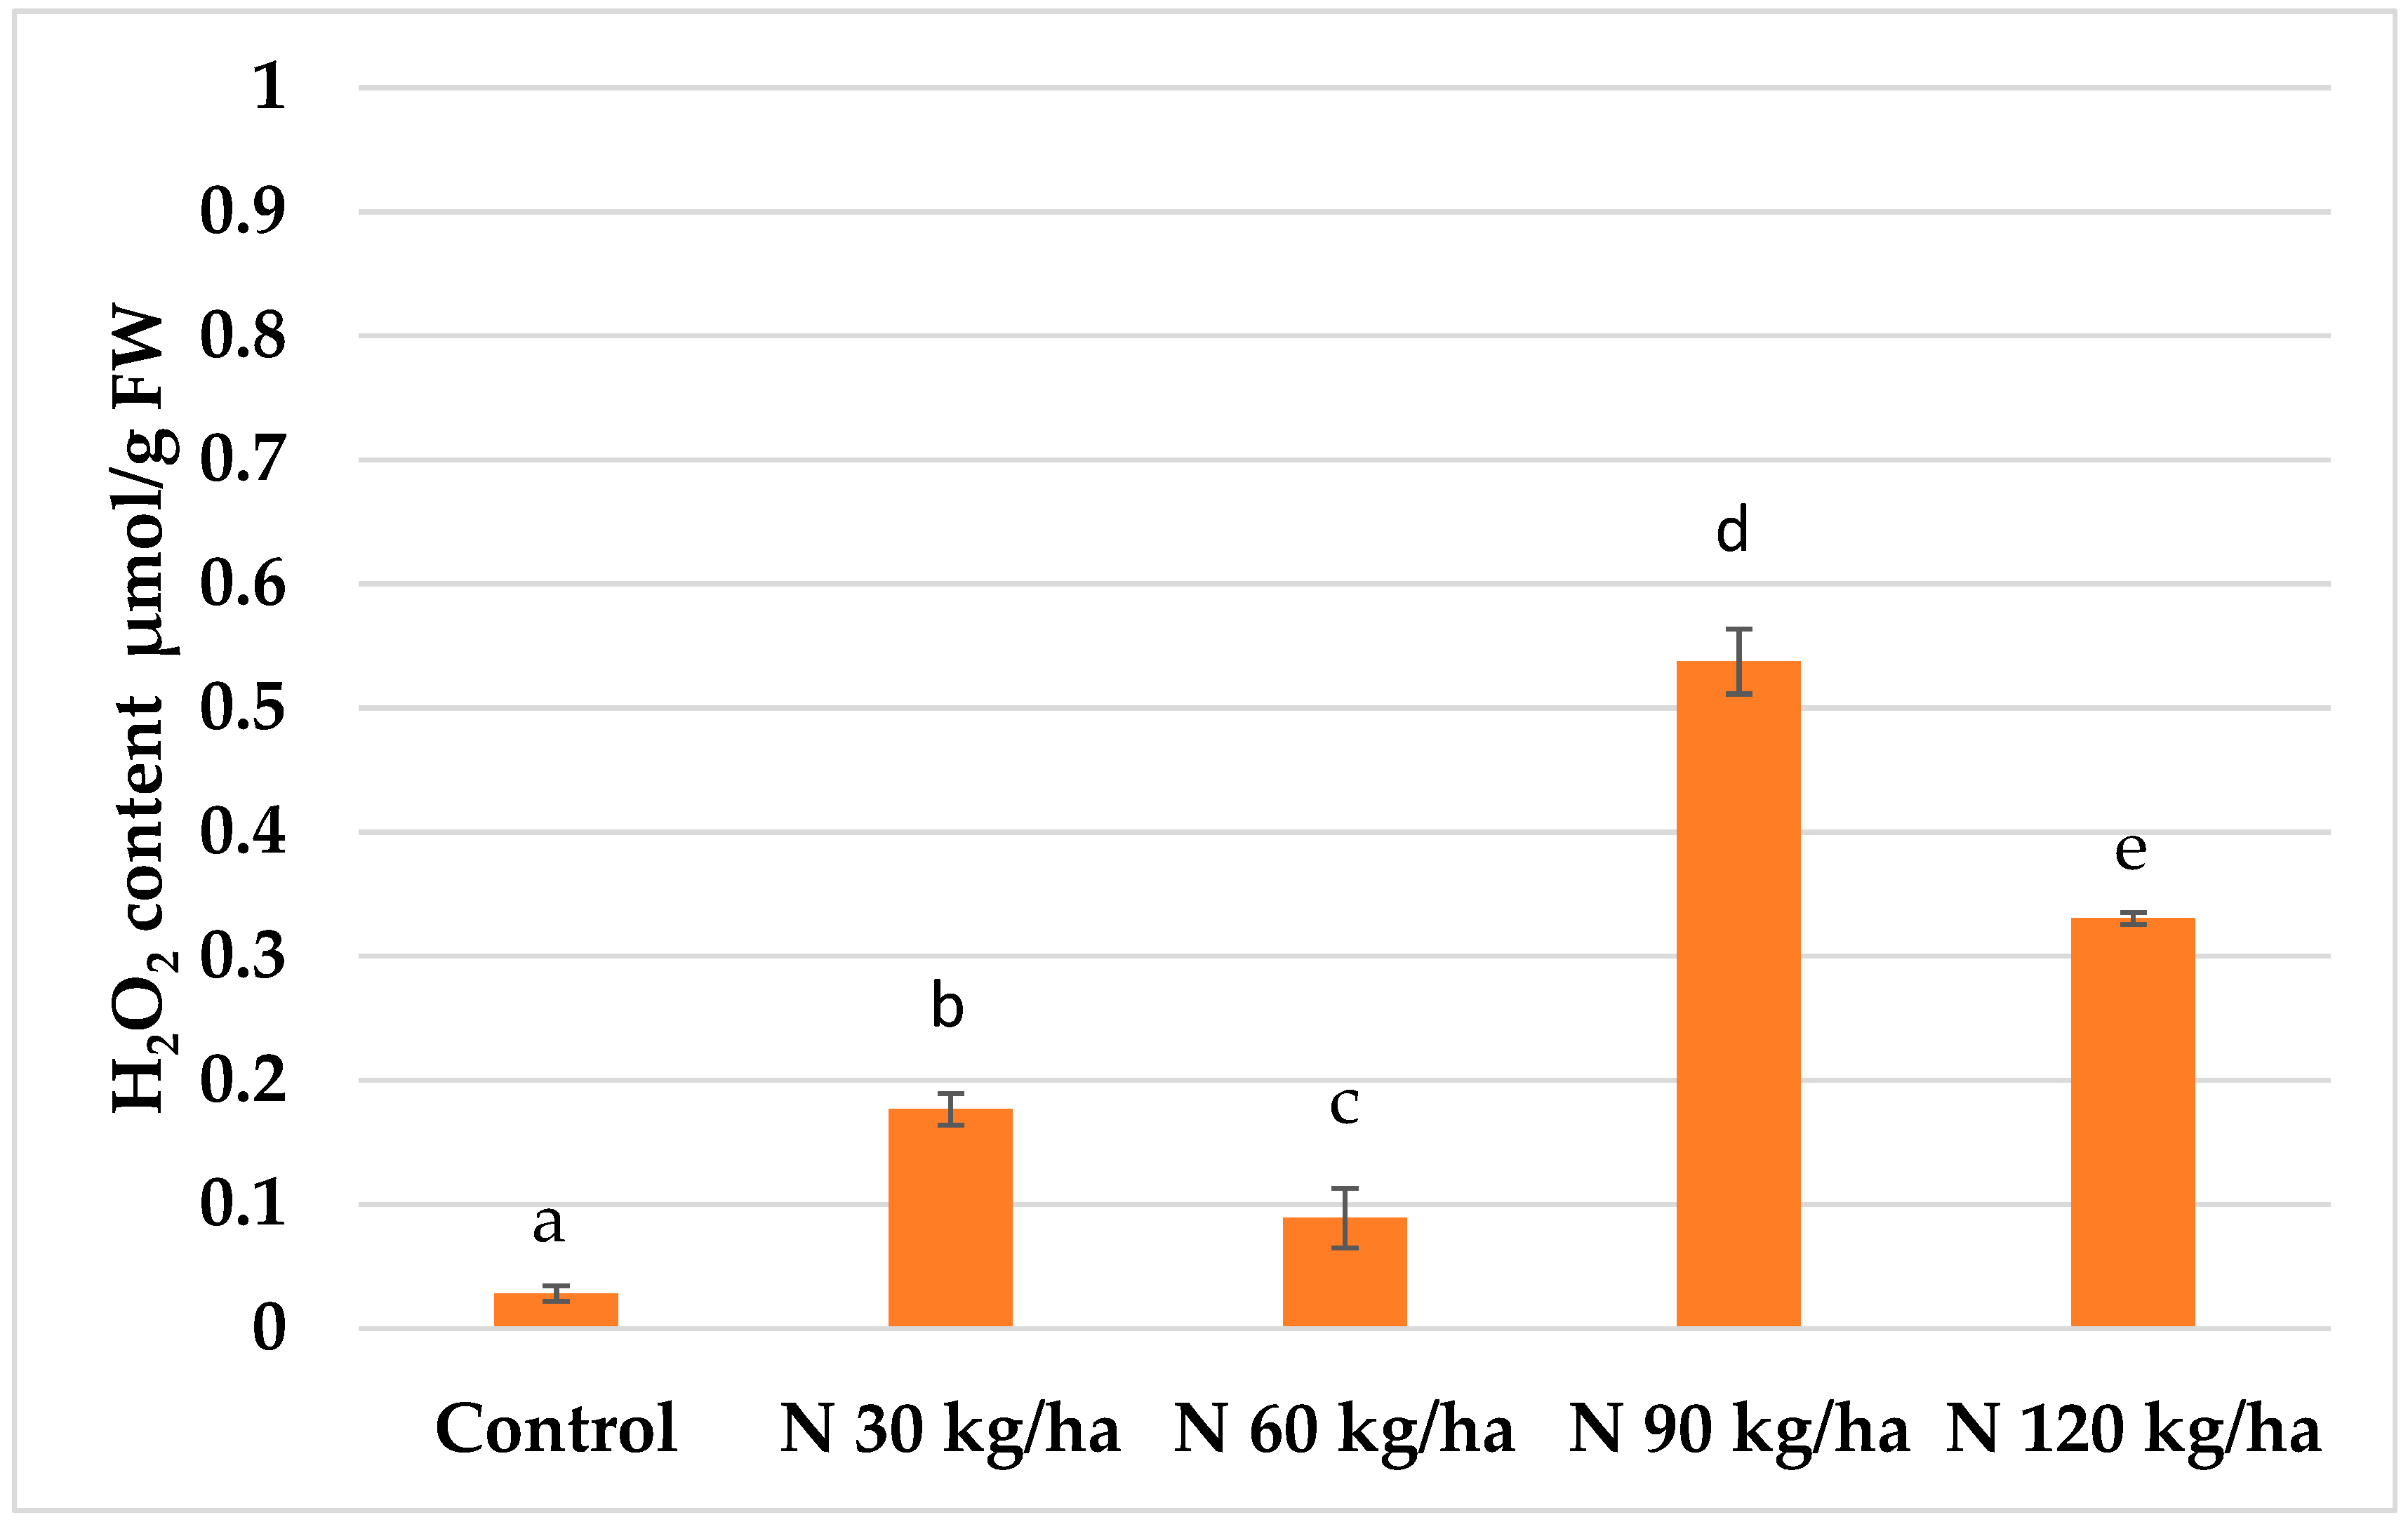
Figure 6.
Effect of different amounts of phytoplankton biomass on hydrogen peroxide content in pea plants. Statistically significant differences between treatment groups are indicated by different letters (Tukey’s test, p < 0.05; mean ± SD, n = 5).
Figure 6.
Effect of different amounts of phytoplankton biomass on hydrogen peroxide content in pea plants. Statistically significant differences between treatment groups are indicated by different letters (Tukey’s test, p < 0.05; mean ± SD, n = 5).
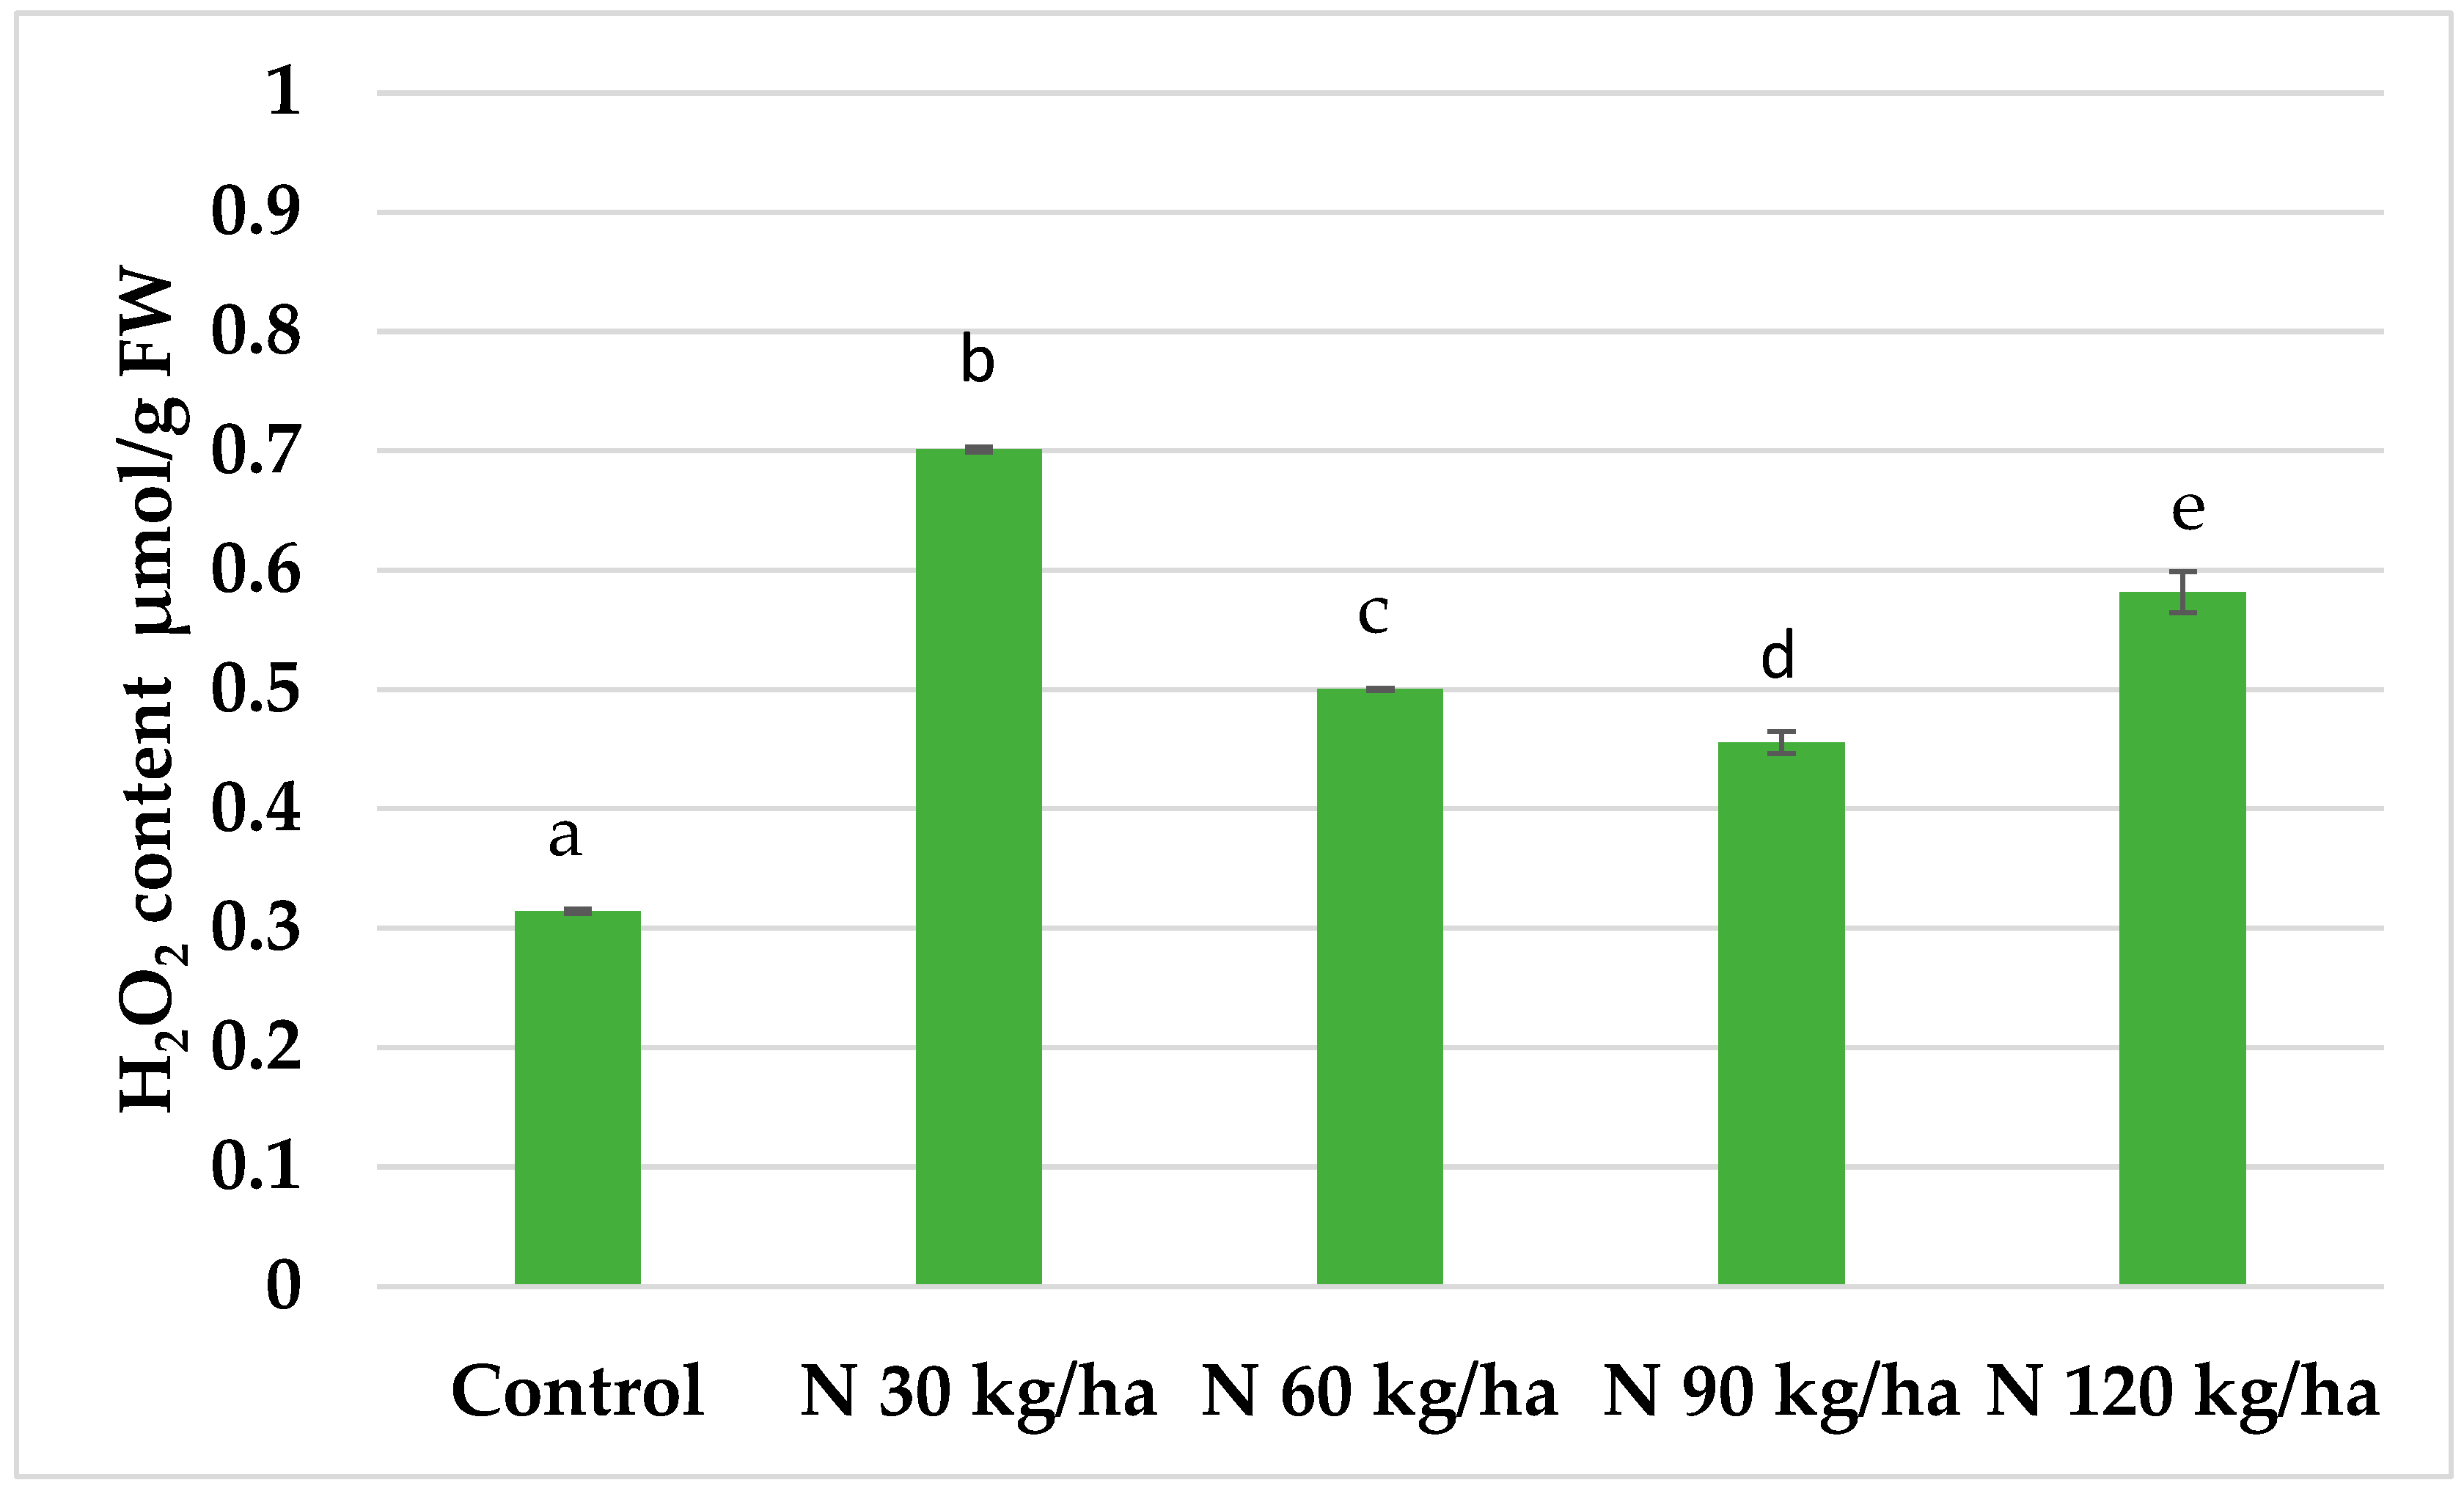
Figure 7.
Effect of different amounts of phytoplankton biomass on malondialdehyde (MDA) content in oilseed rape plants. Statistically significant differences between treatment groups are indicated by different letters (Tukey’s test, p < 0.05; mean ± SD, n = 5).
Figure 7.
Effect of different amounts of phytoplankton biomass on malondialdehyde (MDA) content in oilseed rape plants. Statistically significant differences between treatment groups are indicated by different letters (Tukey’s test, p < 0.05; mean ± SD, n = 5).
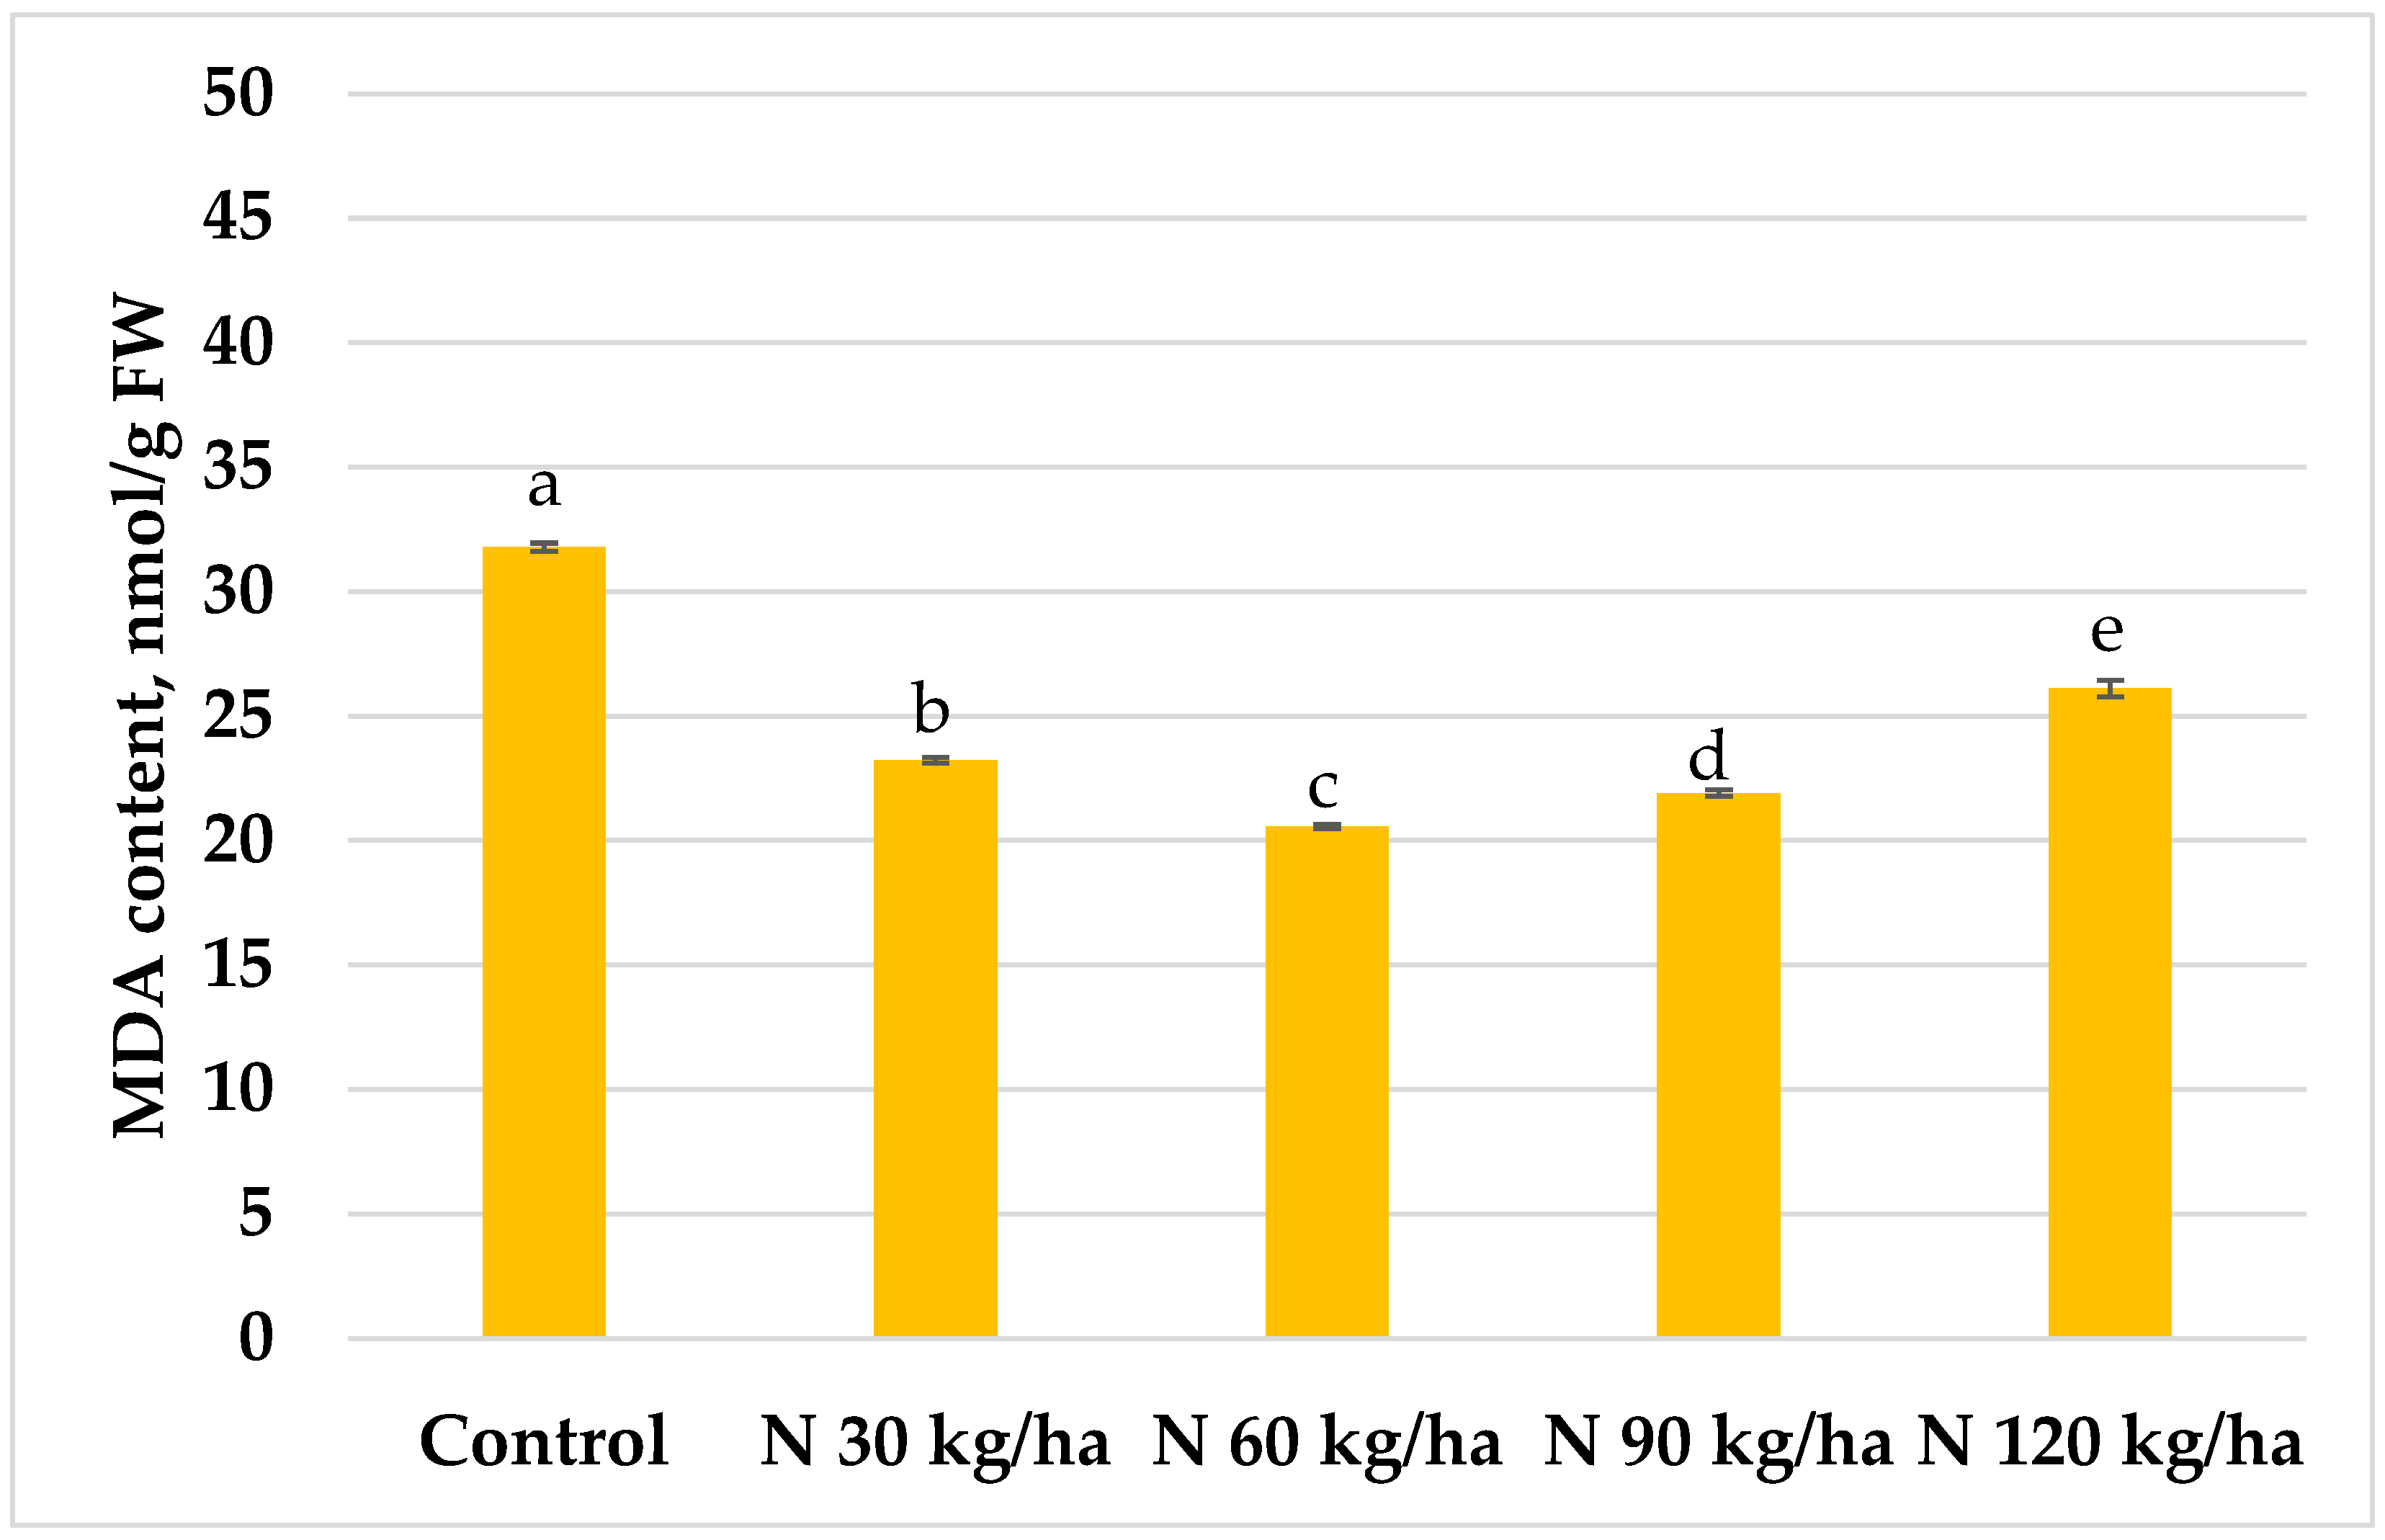
Figure 8.
Effect of different amounts of phytoplankton biomass on malondialdehyde (MDA) content in common wheat plants. Statistically significant differences between treatment groups are indicated by different letters (Tukey’s test, p < 0.05; mean ± SD, n = 5).
Figure 8.
Effect of different amounts of phytoplankton biomass on malondialdehyde (MDA) content in common wheat plants. Statistically significant differences between treatment groups are indicated by different letters (Tukey’s test, p < 0.05; mean ± SD, n = 5).
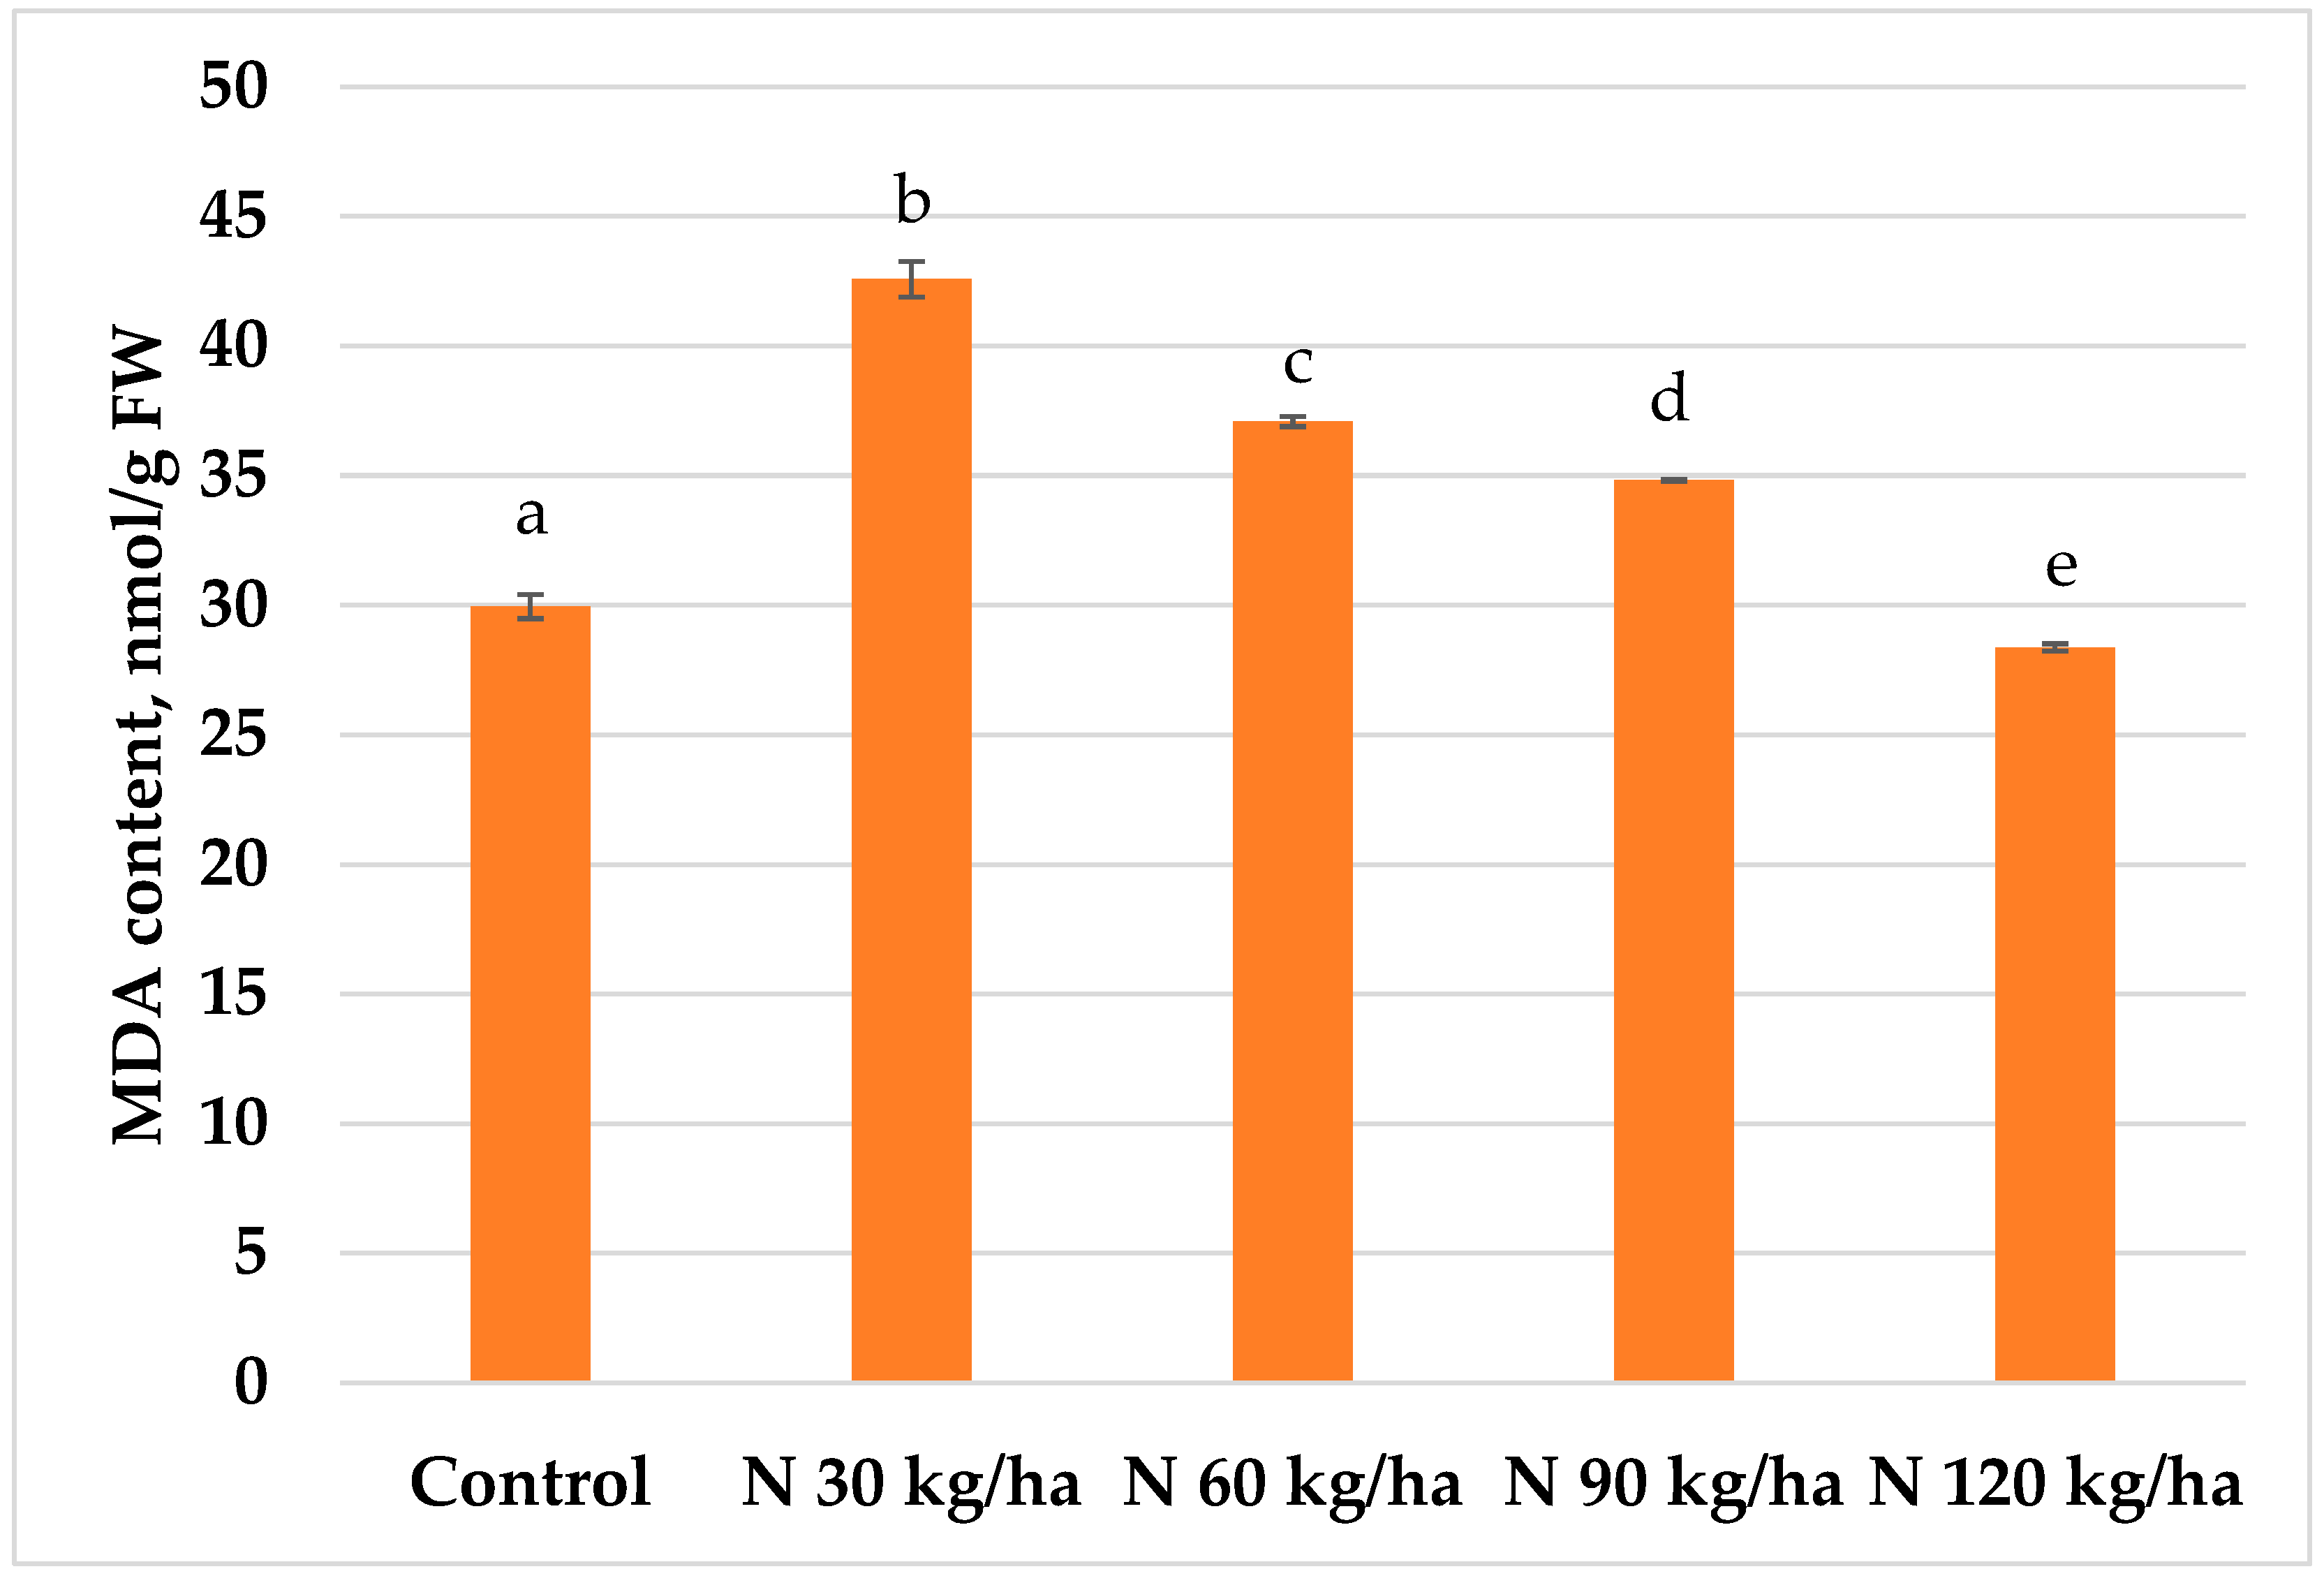
Figure 9.
Effect of different amounts of phytoplankton biomass on malondialdehyde (MDA) content in pea plants. Statistically significant differences between treatment groups are indicated by different letters (Tukey’s test, p < 0.05; mean ± SD, n = 5).
Figure 9.
Effect of different amounts of phytoplankton biomass on malondialdehyde (MDA) content in pea plants. Statistically significant differences between treatment groups are indicated by different letters (Tukey’s test, p < 0.05; mean ± SD, n = 5).
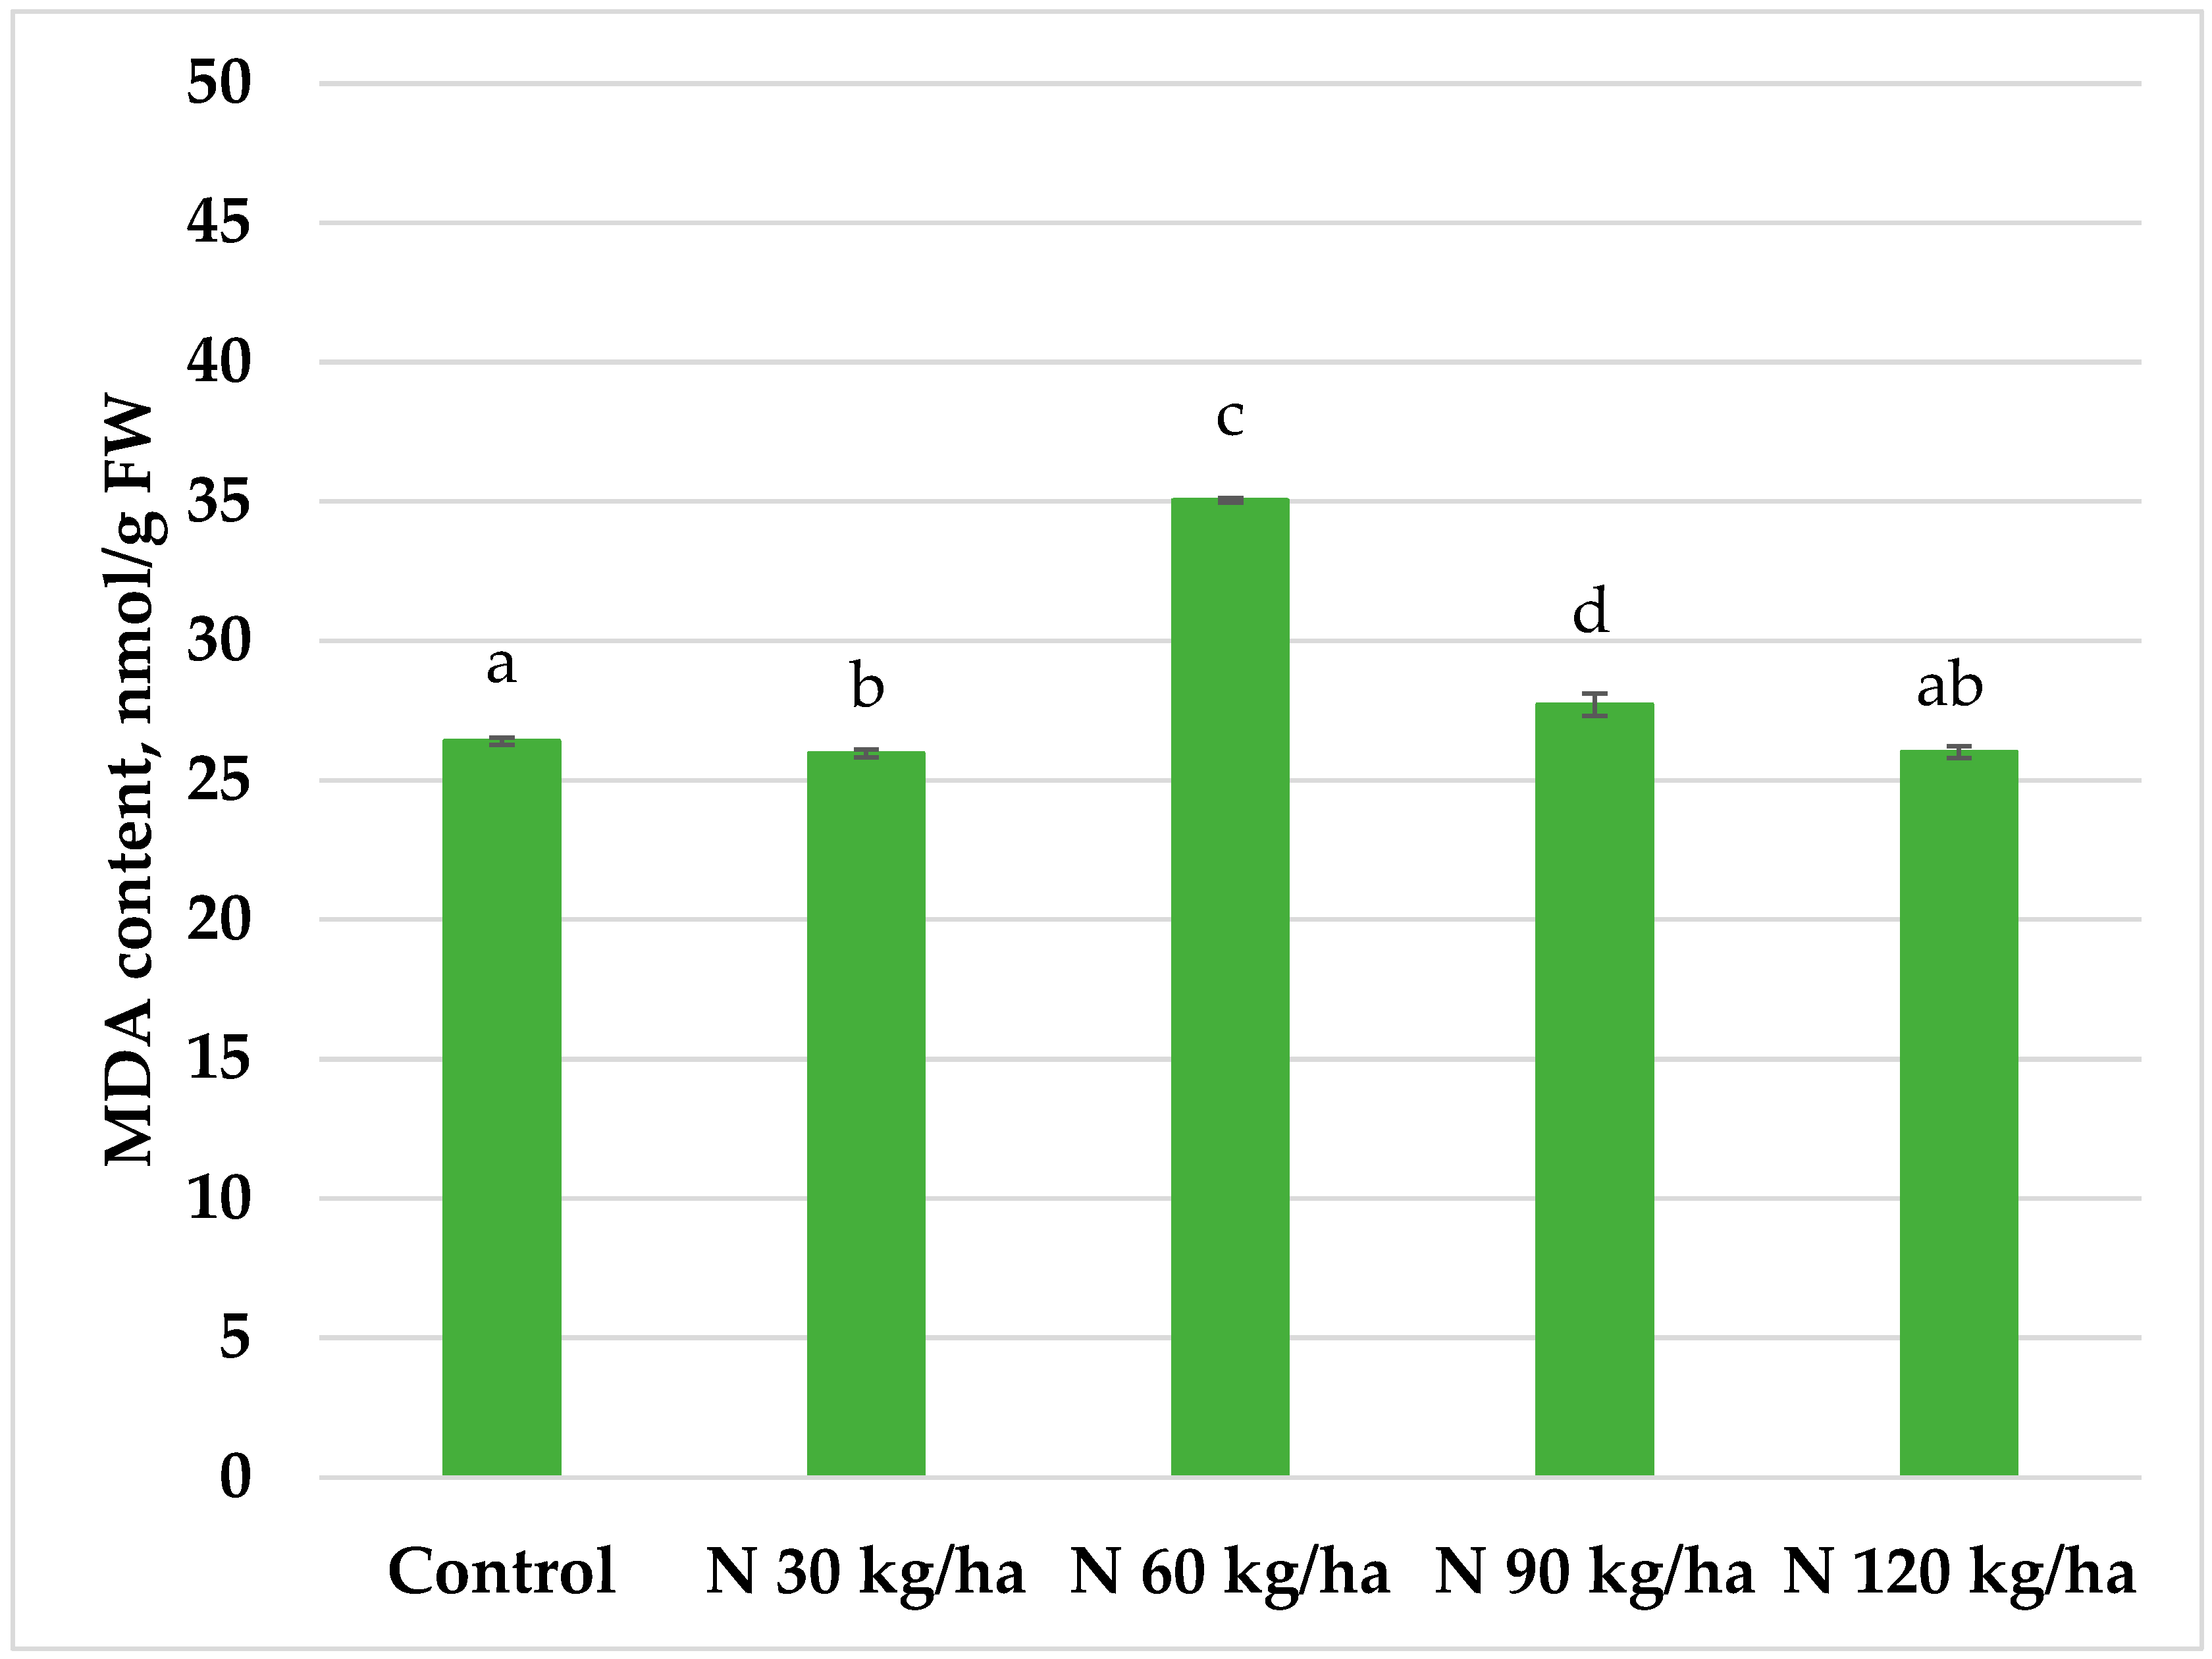
Figure 10.
Effect of different amounts of phytoplankton biomass on total phenols content (A) and antioxidant activity (B) in oilseed rape plants. Statistically significant differences between treatment groups are indicated by different letters (Tukey’s test, p < 0.05; mean ± SD, n = 5).
Figure 10.
Effect of different amounts of phytoplankton biomass on total phenols content (A) and antioxidant activity (B) in oilseed rape plants. Statistically significant differences between treatment groups are indicated by different letters (Tukey’s test, p < 0.05; mean ± SD, n = 5).
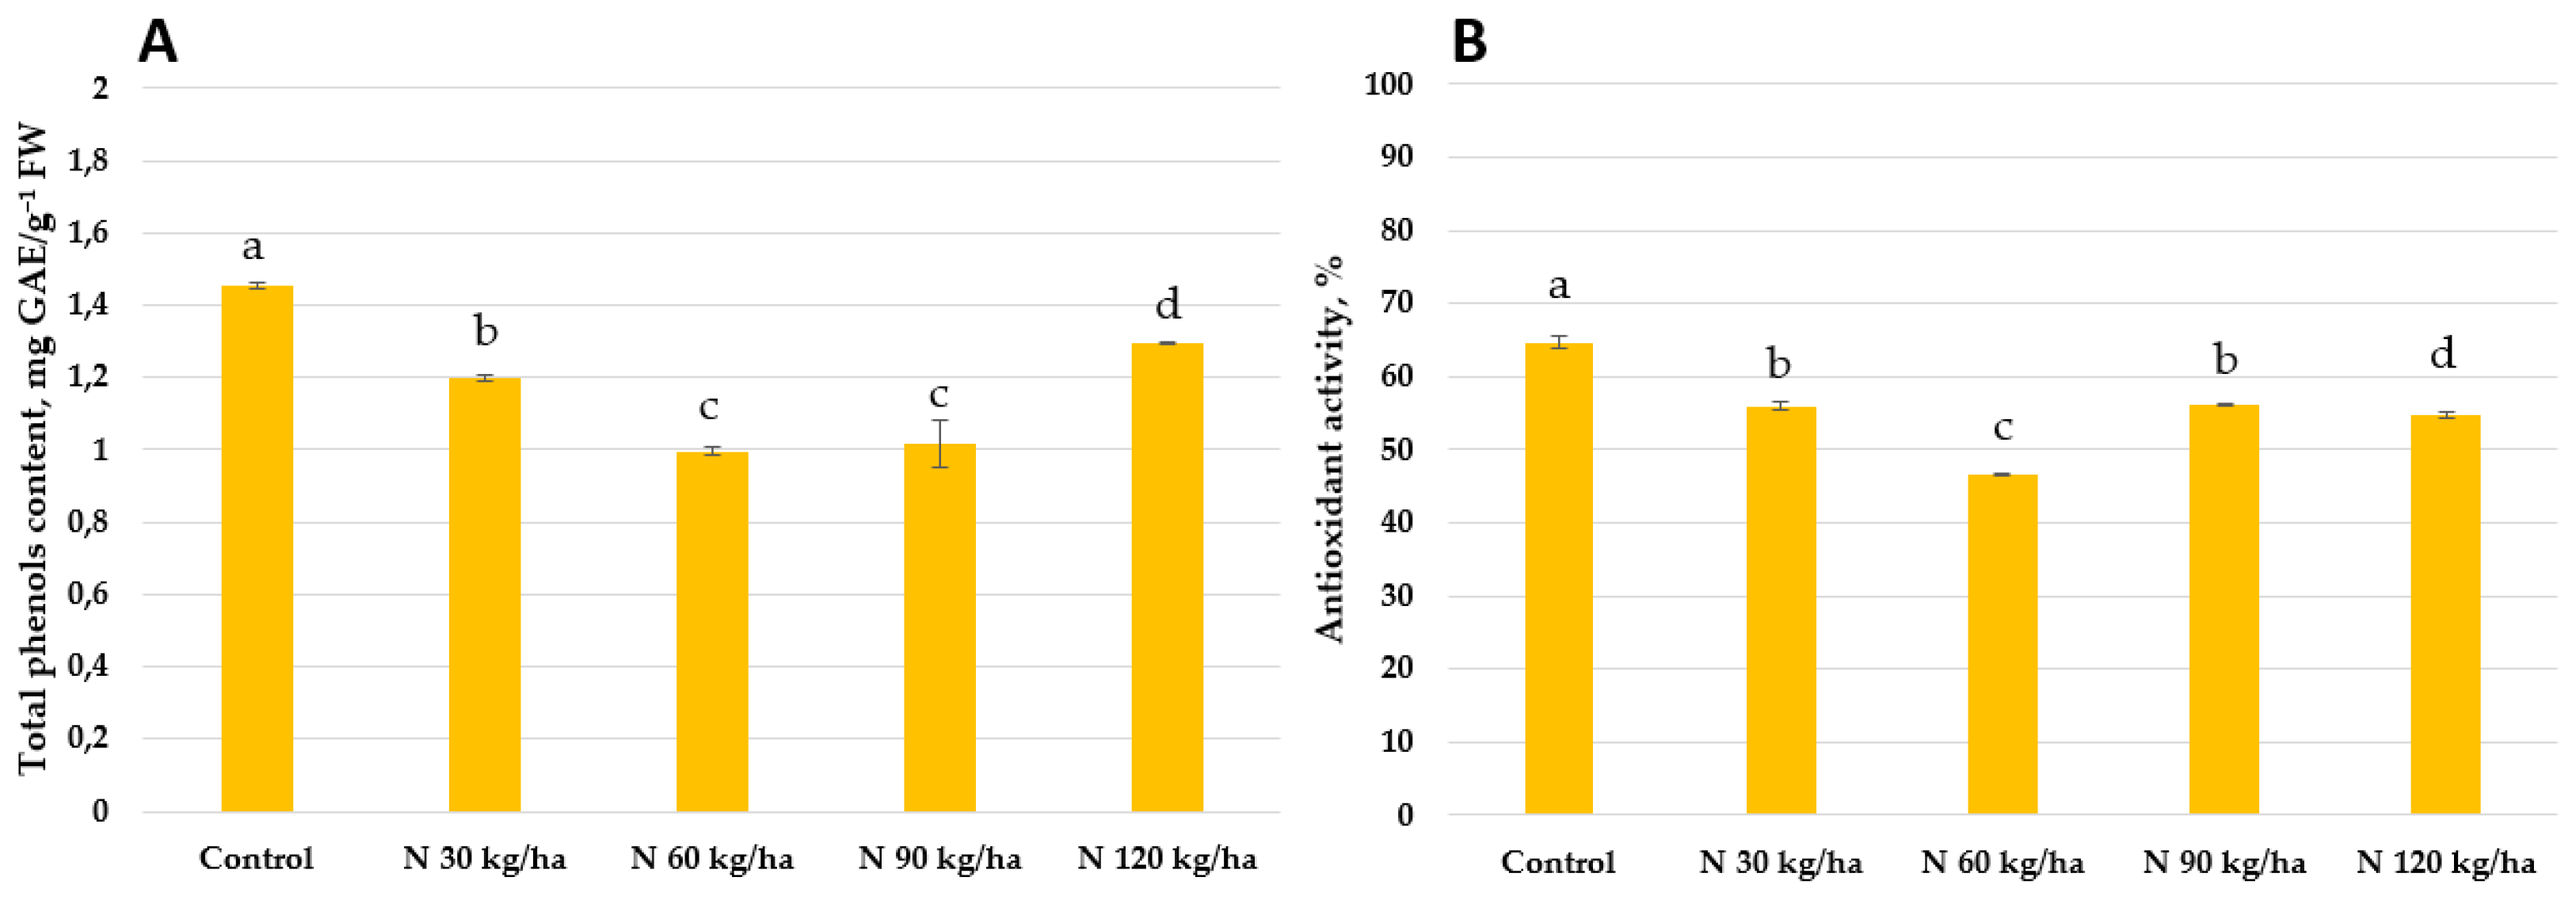
Figure 11.
Effect of different amounts of phytoplankton biomass on total phenols content (A) and antioxidant activity (B) in common wheat plants. Statistically significant differences between treatment groups are indicated by different letters (Tukey’s test, p < 0.05; mean ± SD, n = 5).
Figure 11.
Effect of different amounts of phytoplankton biomass on total phenols content (A) and antioxidant activity (B) in common wheat plants. Statistically significant differences between treatment groups are indicated by different letters (Tukey’s test, p < 0.05; mean ± SD, n = 5).
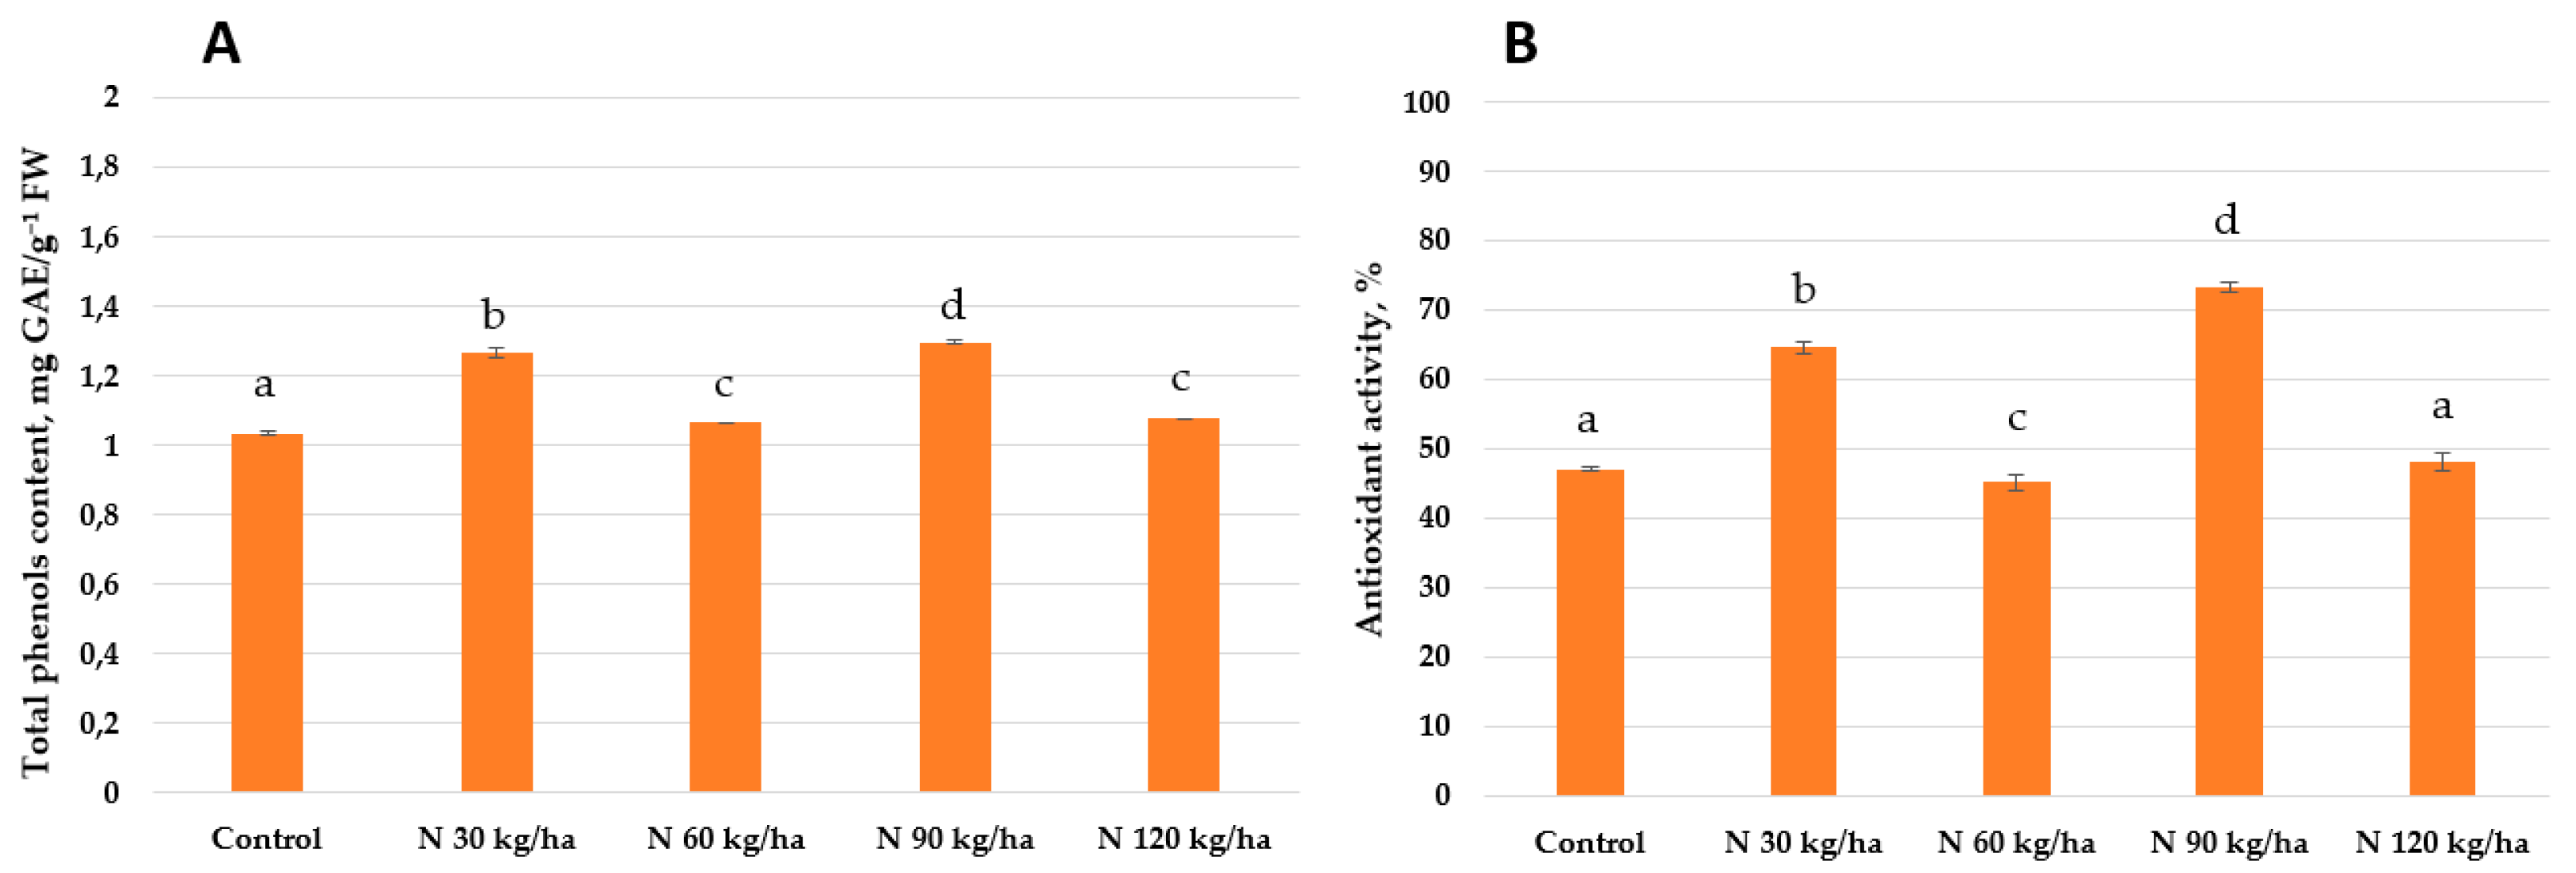
Figure 12.
Effect of different amounts of phytoplankton biomass on total phenols content (A) and antioxidant activity (B) in pea plants. Statistically significant differences between treatment groups are indicated by different letters (Tukey’s test, p < 0.05; mean ± SD, n = 5).
Figure 12.
Effect of different amounts of phytoplankton biomass on total phenols content (A) and antioxidant activity (B) in pea plants. Statistically significant differences between treatment groups are indicated by different letters (Tukey’s test, p < 0.05; mean ± SD, n = 5).
Disclaimer/Publisher’s Note: The statements, opinions and data contained in all publications are solely those of the individual author(s) and contributor(s) and not of MDPI and/or the editor(s). MDPI and/or the editor(s) disclaim responsibility for any injury to people or property resulting from any ideas, methods, instructions or products referred to in the content. |
© 2025 by the authors. Licensee MDPI, Basel, Switzerland. This article is an open access article distributed under the terms and conditions of the Creative Commons Attribution (CC BY) license (http://creativecommons.org/licenses/by/4.0/).
Copyright: This open access article is published under a Creative Commons CC BY 4.0 license, which permit the free download, distribution, and reuse, provided that the author and preprint are cited in any reuse.


