Submitted:
08 April 2025
Posted:
09 April 2025
You are already at the latest version
Abstract
Cobalt oxide nanoparticles (Co3O4 NPs) exhibit a variety of biomedical applications due to their special antioxidant, antibacterial, antifungal, anticancer, healing of wounds, and anti-diabetic characteristics. This work successfully prepared the Co3O4 NPs via simple galvanostatic deposition followed by annealing at 400 and 800oC for two hours. The galvanostatic deposition was carried out from a modified Watts bath. We used Fourier transform infrared spectroscopy (FTIR), X-ray diffraction (XRD), energy dispersive X-ray (EDX), scanning electron microscopy (SEM), and transmission electron microscopy (TEM) to examine the oxide's characterization properties. The nature of the oxide formed was strongly dependent on the annealing temperature. The powder formed at room temperature (25oC) is a mixture of Co(OH)2 and metallic Co. However, at 400 and 800oC, and according to the XRD patterns, the powder is primarily composed of the Co3O4 phase and a slight quantity of Co(OH)2 phase. The average particle size measured by TEM ranged from 14.85 nm at room temperature to 90.19 nm at 800 oC. Moreover, the study examined how the operating deposition parameters affected the galvanostatic deposition process. Furthermore, these baths produce NPs, a great antibacterial agent that fights a variety of gram-positive and gram-negative bacteria, especially Staphylococcus aureus and Escherichia coli in addition to their effectiveness in terms of antifungal activity.
Keywords:
galvanostatic deposition
; annealing temperature
; antibacterial
; antifungal
; cobalt
; nanomaterials
1. Introduction
Because of the special characteristics of their size, shape, dimension, and structure, metal and metal oxide nanoparticle synthesis and applications have attracted much attention [1,2,3,4]. High-purity metal and metal oxide nano-powders are produced chemically [5] and electrochemically [6,7] from aqueous solutions. Lithium-ion batteries, gas sensing, ceramic pigments, heterogeneous catalysts, and electrochemical devices like supercapacitors are just a few of the many technologically significant uses for Co3O4 [8,9,10]. It can also be applied selectively as a coating material for high-temperature solar collectors, outperforming black chrome coatings [11]. Moreover, the synthesized Co3O4 NPs exhibit superlative antibacterial and anti-fungal activity in the viewpoint of various biomedical applications [12,13,14,15,16]. Although it is possible to prepare the nanostructured cobalt oxide powder in various ways such as the thermal decomposition routes [16,17], the Taguchi method [18], and the hydrothermal synthesis method [19], most of these methods suffer from problems that may reduce the purity of the resulting powder and consequently affect their properties. Due to its ease of employment, rapid application, low cost, room temperature operation, and ability to predict chemical structure, the electrochemical deposition technique for synthesizing nanomaterials seems beneficial [20,21]. Additionally, neither the preparation nor the purification processes involved using surfactants, templates, or organic solvents. Cobalt oxides were directly electrodeposited anodically onto a glassy carbon electrode from a highly alkaline aqueous medium that contained gluconate ions as a ligand species [22,23]. The properties of these oxides during photoelectrochemical (PEC) water-splitting applications were determined. Observation showed that Co3O4 had the best photocatalytic properties among cobalt oxide phases produced by varying the annealing temperature for water-splitting reactions [24].
Gram-positive organisms often have thicker cell walls and are more resistant to different antibacterial treatments than Gram-negative species. Certain chosen nanoparticles have appealing antibacterial properties. Following contact with the bacterial cell, they change the permeability of the cell, creating pits and gaps, which impact DNA replication and inhibit respiratory chain enzyme function, ultimately leading to cell death [25,26,27]. This research goals to synthesize the cobalt oxide nanoparticles via galvanostatic electrodeposition from a modified Watts bath and study their morphology, composition, and antimicrobial activities. Moreover, the study examined how the operating deposition parameters, such as temperature, pH, current density, and the concentration of NO3- ions, affected the electrodeposition process.
2. Materials and Methods
2.1. The Synthesis of Co3O4 NPs
Electrochemically, the cobalt oxide was prepared via galvanostatic electrodeposition using a modified Watt’s bath at room temperature (25oC). The Watts bath consists of 0.63 M CoSO4, 0.09 M CoCl2, and 0.3M H3BO3. The impact of various KNO3 concentrations (0.05, 0.1, 0.15, and 0.2 M) on the cobalt oxide deposition has been examined in this work. All reagents used for the electrolytic solution were obtained from Sigma Aldrich, without additional purification, and bi-distilled water. Copper and platinum sheets served as the cathode and anode, respectively. Their respective dimensions are 2.7 cm × 2.3 cm × 1.0 cm. Grades 800–3000 of abrasive sheets were used to mechanize the copper substrates. After polishing, copper sheets were immersed in a pickling solution. After that, they were ultrasonically cleaned in acetone for five minutes. Then, to facilitate the deposition of the cobalt oxide, these samples were promptly immersed in the electrolytic bath after washing with distilled H2O so that the surface was free of any contaminants. Finally, a direct current (4.8 mA/cm2) was supplied by a D.C. power supply unit (GW instek model: GPS-3030DD) for 10 minutes. After that, the cobalt oxide powder was gathered and annealed at 400 (Co-400) and 800 (Co-800) degrees Celsius.
2.2. Characterization of the Cobalt Oxide
HRTEM (high-resolution transmission electron microscopy) (JEOL JEM-2100 EX II Electron Microscope) and HRSEM (high-resolution scanning electron microscopy) with Energy Dispersive X-ray analysis (EDS) were used to describe the powder’s morphology. Crystallinity and phase identification were assessed using an X-ray diffractometer (XRD), (Angstrom Advanced ADX-800 X-ray Diffraction Instrument). A Perkin-Elmer 293 Spectrophotometer was used to record the samples’ Fourier transform infrared spectra (FTIR). Moreover, using an automatic surface area and pore size analyzer (BELSORP MINI X), the surface of the cobalt oxide samples was characterized by N2 adsorption/desorption at liquid nitrogen temperature (-196oC). The samples were previously degassed until a constant weight was obtained.
2.3. Electrochemical Measurements
Electrochemical investigations were conducted using the 1000 Gamry Instrument Potentiostat/Galvanostat/ZRA. Silver/silver chloride (3 M KCl) served as the reference electrode. The LSV experiments were achieved in a cell containing a Pt disc (diameter of 0.25 cm) or copper sheet as a working electrode and a Pt wire as a counter electrode. Before every run, the Pt working electrode was polished with Al2O3 powder until a brilliant finish was gotten, and pure water was used to rinse it. The current-potential curves were obtained by moving the potential with a scan rate of 5 mVs-1 in an extra negative direction. Moreover, chronoamperometric analysis on the Pt working electrode was performed in Watt’s bath at different deposition potentials.
2.4. Biological Activities
2.4.1. Well-Diffusion Inhibition Assays
Gram-positive Staphylococcus aureus (ATCC 6538) and gram-negative Escherichia coli (ATCC25922) were obtained from Royal for Quality System, Egypt, and used as indicator bacterial strains. The bacterial strains were activated by growing overnight on nutrient broth at 37°C for 24 hours in a rotary shaker set to 180 rpm. They were then subcultured until their optical densities, as measured by a spectrophotometer at 610 nm, reached 0.02–0.05 (108 CFU ml−1). To create a seeded test media, the 18 - 24 h culture of indicator strains was mixed with sterilized Müller-Hinton agar earlier cooled to 45°C in a ratio of 1 ml of bacterial culture suspension per each 1 liter of media. Sterile cork-borers were used to punch 9-mm wells onto the surface of Müller-Hinton agar plates seeded with the indicator organisms. A 0.1 g sample of cobalt oxide was suspended in 1 mL of water to prepare a uniform suspension. From this suspension, 400 µL was added to the wells using a micropipette and allowed to freely diffuse for 45–60 min. All plates were kept at + 4ºC for 2 hours and then incubated overnight at the optimal growth temperature (37°C) of the indicator bacteria. All well-diffusion inhibition assays were conducted in triplicates and the presence of inhibition halos (clear zones) around the well was recorded as the antibacterial activity of the tested isolate.
2.4.2. Spread Plate Technique for Antifungal Assay
Aspergillus niger (MT103092) was obtained from the Royal for Quality System, Egypt. The strain was purified on Sabouraud dextrose agar and incubated at 28°C until full sporulation. The spore suspension was then prepared in distilled water with 2% agar and 0.5% Tween 80 and transferred to Czapek–Dox agar for phenotypic identification according to the macroscopic and microscopic morphology of their colonies. For the antifungal assay, fungal inocula were prepared following the M38-A2 protocol of the Clinical and Laboratory Standards Institute (CLSI M38-A2, 2008) [28]. Inoculum suspensions of Aspergillus Niger were prepared from the seven-day cultures grown on Sabouraud dextrose agar at 28ºC. The spore suspensions from each culture were prepared in a 0.89% saline solution and adjusted in a spectrophotometer until reaching an optical density with a transmittance of 80-82% at 520 nm (5 106 to 5 107 cells/ml). The assay was performed by spreading 100 µl of the fungal spore suspension evenly over the agar plate using a sterile glass spreader.
3. Results and Discussion
3.1. Surface Characterization
3.1.1. SEM and EDS
The morphology of the electrochemically prepared oxide nanoparticles is investigated using the HRSEM technique and illustrated in Figure 1. The powder obtained at room temperature (25oC) was annealed at 400 and 800oC. The studied cobalt oxide samples have a heterogeneous structure as shown in the zoom-out images (a-c). Zooming in, we can describe particles of Co-25 and Co-400 samples as spheres of different particle sizes as shown in Figure 1d,e). On the other hand, the Co-800 sample (Figure 1c,f) shows a drastic change in its morphology. The morphology changed into aggregated needle-like particles. Figure 1g–i shows the EDS of the prepared oxide samples and the weight percentage of elements. The EDS for all prepared oxide samples shows the existence of Co, O, and some residue from the initial reactants such as K and Cl. As shown in the tables inserted in Figure 1, as the temperature of annealing rises the amount of Co increases and that of O decreases gradually, indicating the removal of H2O from the crystals and formation of cobalt oxides. In addition, with annealing, the Cl- ion is removed while the K+ still exists.
3.1.2. XRD
The crystal microstructure of the cobalt oxide samples is clarified in Figure 2. The XRD patterns of the oxide prepared at room temperature (Co-25) show the formation of a mixture of Co(OH)2 and metallic Co through the chosen method of preparation. The Co(OH)2 shows a hexagonal crystal with XRD peaks observed at 2θ: 19.02°, 32.14°, 37.76°, 51.71°, 57.71°, 61.34°, 69.23°, 71.15°, and 81.17° matching to (001), (100), (101), (102), (110), (111), (103), (201), and (202) planes, respectively (JPCDs#03-0913). The identified metallic Co is also a hexagonal crystal with main peaks observed at 2θ: 41.68°, 44.76°, 47.56°, 75.94°, and 84.19° corresponding to (100), (002), (101), (110), and (103) planes, respectively (JPCDs#05-0727). For Co-400 and Co-800 samples, the XRD peaks of the cobalt oxide (Co3O4) are displayed (JPCDs#09-0418). Co3O4 has a cubic crystal with unit cell parameters a = b = c = 8.084 Å with main XRD peaks at 2θ: 18.99°, 31.24°, 36.83°, 59.35°, and 65.22° corresponding to (111), (220), (311), (511), and (440) planes, respectively. The background signal in XRD can arise from various factors, one of which is the heterogeneous nature of the prepared cobalt oxide samples. However, the Co3O4 peaks are more pronounced in Co-800 compared to Co-400.
3.1.3. FTIR
Figure 3 shows the FTIR spectra of cobalt oxide samples. All studied cobalt oxide samples exhibit nearly similar characteristic absorption bands, even though with varying intensities based on the temperature of annealing employed. The broad peaks at 3430 cm-1 and 1630 cm-1 were ascribed to H–O stretching and bending, respectively [29]. The FTIR spectra of cobalt hydroxides made using alternative methods [30,31] often only show two vibration bands for water molecules, around 3500 and 1616 cm-1, indicating a weak hydrogen bond interaction between the hydroxide and water molecules [32]. The peak at 573 cm-1 corresponds to the Co3+ of octahedral sites and 664 cm-1 is assigned to Co2+ of tetrahedral sites confirming the formation of cobalt oxide nanoparticles (Co3O4) [10,33,34]. The face-centered cubic structure’s monodisperse phase purity is demonstrated by the occurrence of two significant M-O stretching and bending frequencies at 1,481 and 831 cm-1 [35]. The intercalated Cl- ions may be responsible for the band at about 1384 cm-1 [30]. The small band detected at 2364 cm−1 refers to the existence of adsorbed CO2 molecules within the CO network, likely originating from residual air [36]. According to the FTIR spectra, the Co-25 sample has a huge absorption band of stretching H–O at 3430 cm-1 and a notable H–O bending band at 1630 cm-1 related to the electrochemically formed Co(OH)2 at room temperature. By annealing, the cobalt oxide nanoparticles are formed and enhanced gradually at the expense of Co(OH)2 as temperature increases. For Co-800, the characteristic absorption bands of Co3O4 at 573 and 664 cm-1 are significantly enhanced. Consequently, from the previous characterization study, it is evident that the primary phase formed during the electrodeposition process is Co(OH)₂, with a minor presence of metallic cobalt. Through annealing, the cobalt oxide (Co3O4) phase gradually develops as the Co(OH)2 phase diminishes due to the removal of H₂O. Consequently, the Co3O4 phase is more abundant in Co-800 compared to Co-400.
3.1.4. HRTEM
High-resolution transmission electron microscopy (HRTEM) investigations were performed on the prepared cobalt samples, along with their selected area electron diffraction (SAED) patterns, to confirm the presence of distinct cobalt phases and to investigate the morphology and crystal structures of the samples as shown in Figure 4a–i. The HRTEM images of the Co-25 sample (Figure 4a,d) show irregular spherical particles of varying sizes, with an average particle size of around 14.85 nm. In contrast, the Co-400 sample (Figure 4b,e) exhibits larger aggregated particles with an average particle size of about 45.85 nm. Meanwhile, the Co-800 sample (Figure 4c,f) demonstrates an aggregated stick-like morphology, with an average particle size of approximately 90.19 nm.
The SAED patterns for these samples are presented in Figure 4g–i. The SAED pattern of the Co-25 sample confirms the coexistence of metallic cobalt (Co) and cobalt hydroxide (Co(OH)₂) phases, formed during the electrochemical deposition process. The metallic cobalt phase features a hexagonal crystal structure with unit cell parameters a=b= 2.503 A˚ and c=4.060 A˚. Its main diffraction lines correspond to d-spacings of 1.91 Å, 1.15 Å, and 1.05 Å, attributed to the (101), (103), and (201) planes, respectively (JCPDS# 05-0727). The cobalt hydroxide (Co(OH)₂) phase also displays a hexagonal crystal structure with unit cell parameters a=b=3.179 A˚ and c= 4.649 A˚, and key d-spacings of 2.38 Å, 3.48 Å, and 1.60 Å, corresponding to the (101), (102), and (110) planes (JCPDS# 03-0913).
For the Co-400 and Co-800 samples (Figure 4h,i), the SAED patterns reveal the presence of cubic cobalt oxide (Co₃O₄) with unit cell parameters a = b = c = 8.084 A˚. This phase is characterized by d-spacings of 2.43 Å, 1.43 Å, 2.86 Å, and 1.55 Å, corresponding to the (311), (440), (220), and (511) planes (JCPDS# 09-0418). Notably, the SAED pattern of the Co-800 sample exhibits spot patterns, indicative of single crystals or highly oriented polycrystalline materials. The phase structures identified through SAED analysis align with those observed in the XRD results.
3.1.4. Analysis of Surface Area and Pore Size
Conventional N2 adsorption/desorption isotherms, demonstrated in Figure 5a, were performed at −196 °C for the various prepared cobalt oxide samples. By applying the Brunauer-Emmet-Teller (BET) method [37], the main surface parameters such as specific surface area (SBET), total pore volume (VP) at a relative vapor pressure (P/Po) ~ 0.95, and average pore width were evaluated and listed in Table 1.
All cobalt oxide samples exhibited a typical type III adsorption/desorption isotherm [38], Figure 5a, associated with a distinct nonporous surface texture and a very low specific surface area. This is confirmed by the almost flat pattern of the corresponding pore size distribution curve until 10 nm. Due to the wedge-shaped pores created by the loose stacking of flaky particles, this type III is linked to the Type H3 hysteresis loop [39]. Figure 5b shows the pore size distributions of the studied cobalt samples. The pore size distribution analysis indicates that the three cobalt samples have a wide distribution of mesopores with a peak maximum of around 75.6 nm for Co-25 and a relatively neglected micropores peak at 2.7 nm. According to Table 1 and Figure 5, the annealing at 400 oC increases SBET and Vp, in addition, to shifting the mesopores peak maximum to lower nm and the appearance of another maximum at 242.6 nm and slightly increasing the nanopore peak. Conversely, the annealing at 800 oC decreases SBET, Vp, and shifts the mesopores peak maximum to higher nm, with the elimination of the nanopores peak.
3.2. Electrochemical Studies
3.2.1. Potentiodynamic Polarization Behavior
The characteristics of the (current-potential) polarization behavior for the cobalt deposition over copper sheets with different concentrations of KNO3 are shown in Figure 6. The addition of KNO3 to the electrolytic bath greatly increases the cathodic current, indicating the accelerating role of NO3⁻ ions during the electrochemical reduction of Co²⁺ ions. As shown in the figure, as the KNO3 concentration increases, the onset potential and cathodic peak of deposition move towards the more noble potential, indicating the enhancement of the cobalt deposition.
Two of the most important operating parameters are the pH value and bath temperature. Figure 7 illustrates how the cathodic polarization curves are affected by pH variations (2.0–6.0). The current polarization curves decreases as the pH of the bath increases. There is a huge drop in the cathodic polarization current when the pH changes from 2.0 to 3.0, and the deposition potential of the peak shifts to more noble potentials. This could be explained by the finding that elevated pH causes a reduction of the concentration of free ions Co2+.
Figure 8 clearly shows how temperature (25–60°C) affects the current-potential curves. As the bath temperature increases, the polarization curves and the onset potential of the deposition process shift to more noble potentials. A reduction in the activation overpotential of reducible species could be one reason for this. Furthermore, as the bath temperature rises, so do the diffusion coefficients of the reducible species.
3.2.2. Chronoamperometric Analysis
The current-time transients from the modified Watts bath with 0.15 M KNO3 over the Pt electrode at different deposition potentials are displayed in Figure 9. There is a gradual decrease in the current-time transients as the applied potential decreases. The current gradually drops at any potential until it reaches a nearly constant value. The initial current drop is caused by the double-layer charging process [40]. Additionally, the results verify that mass transfer controls the rate of nuclei growth by showing that the steady-state current rises as the potential becomes more negative. A strong linearity is shown in Figure 10 when plotting –i1/2 against time t. The cobalt oxide deposit is caused by a mechanism that combines instantaneous nucleation with charge transfer-controlled three-dimensional growth. The slopes of these lines correspond to the charge transfer rate constant.
3.3. Biological Activities of Co3O4 NPs
3.3.1. Anti-Bacterial Activity
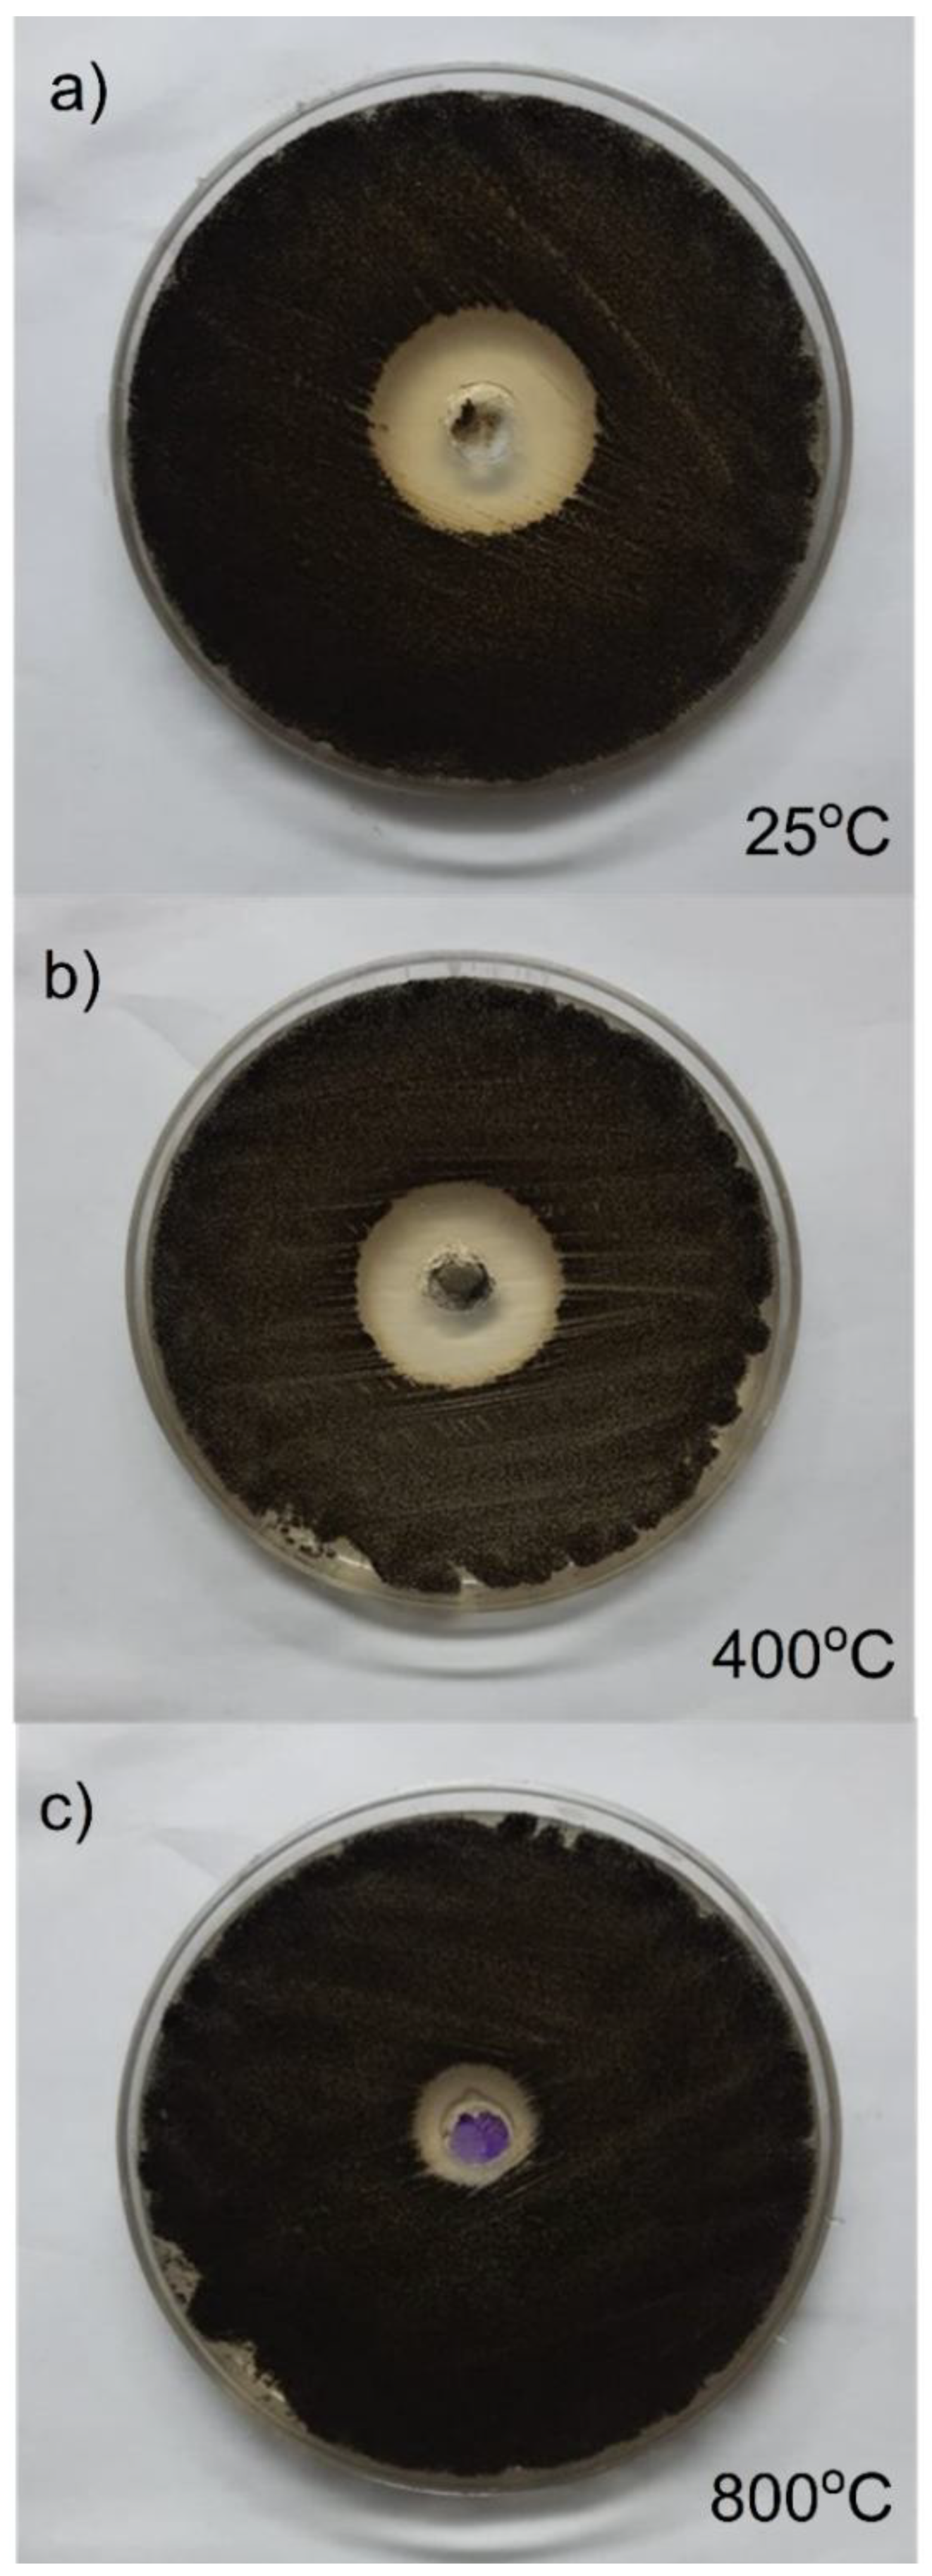
The Agar well diffusion technique was used to assess the generated cobalt oxide nanoparticles’ antibacterial activity against antimicrobials. The NPs have strong antibacterial properties because they are small and have a large surface area compared to larger molecules. By breaking down the cell membrane, the NPs prevent the bacterial production of proteins and exhibit dose-dependent membrane penetration [41,42]. A well diffusion assay was used to observe the antibacterial activity of the produced oxide NPs against S. aureus and E. coli. Figure 11 provides a representative example of an image displaying the inhibition zones. The produced oxide nanoparticles (NPs) demonstrated exceptional antibacterial activity against S. aureus and E. coli, as indicated in Table 2. The oxide made after annealing at 400 exhibits the best antibacterial activity because it has the largest surface area and total pore volume (8.0094 m2/g and 0.081076 m3/g, respectively). The outcome demonstrated that the NPs’ biocide efficacy against these bacteria is promising.
3.3.2. Anti-Fungal Activity
The rate at which bacteria and fungi are becoming resistant to the available medications and antibiotics is concerning. Strong antifungal agents are therefore required to eradicate fungi that are resistant to the current medications [43]. The antifungal properties of cobalt and cobalt oxide nanoparticles are among their many biomedical uses. The antifungal actions of green-synthesized Co NPs were assessed by Hou et al. (2020), who found that Co NPs exhibited potent antifungal activity against Candida krusei, Candida guilliermondii, Candida glabrata, and Candida albicans. Likewise, the synthesis of cobalt oxide nanoparticles (NPs) with H. rosa-sinensis flower extract and their antifungal properties have been documented. The outcome demonstrated that the produced NPs exhibited potent anti-A. niger and anti-A. flavus properties [44]. In our study, the produced oxide nanoparticles (NPs) demonstrated exceptional antifungal activity against Aspergillus niger, and the best antifungal effect is produced with the sample annealed at 400 oC as shown in Table 2.
Figure 12.
Aspergillus niger (MT103092) for Co oxide samples.
Mechanism of antimicrobial
Co3O4 NPs were found to exhibit good activity against both bacteria and fungi. The differences in susceptibility are explained by the different bacterial strains’ varying tolerance to oxidative stress. The primary factors influencing Co3O4 NPs’ antibacterial activity are their size and shape. There are multiple explanations for metal oxide nanoparticles’ antibacterial qualities. Reactive species like hydroxyl radicals and superoxide radical anions are created in aqueous solutions of Co3O4 NPs. The bacterium’s negatively charged surface interferes with essential biological functions like respiration and cell division by interacting with the radicals found in aqueous Co3O4 NPs. On the other hand, cobalt ions from cobalt oxides interact with the thiol group of essential bacterial enzymes, causing deactivation and cell death. An excited electron is produced when the surface of Co3O4 NPs interacts with absorbed O2. This electron combines with the oxygen ion to form the oxygen ion, which subsequently interacts with the H2O molecule to produce hydrogen peroxide. Consequently, H2O2 enters the cell, disrupting cytoplasmic functions and causing death [45,46].
4. Conclusions
Cobalt oxide NPs were successfully prepared by galvanostatic electrodeposition onto a copper substrate from a modified Watts bath, followed by annealing. The electrolytic bath contained CoSO4, CoCl2, H3BO3, and KNO3, and was operated at a pH of 4.5, with a low current density of 4.8 mA/cm². The addition of KNO₃ to the electrolytic bath significantly increases the cathodic current, indicating the accelerating role of NO₃⁻ ions during the electrochemical reduction of Co²⁺ ions. The deposited cobalt was subsequently annealed at 400°C and 800°C to produce the cobalt oxide (Co3O4) phase. The surface morphology and characterization of the cobalt samples were analyzed using HRSEM, XRD, FTIR, and BET techniques. The nature of the oxide formed was strongly dependent on the annealing temperature. The powder formed at room temperature (25oC) is a mixture of Co(OH)2 and metallic Co. However, at 400 and 800oC, and according to the XRD patterns, the powder is primarily composed of the Co3O4 phase and a slight quantity of Co(OH)2 phase. The average particle size measured by TEM ranged from 14.85 nm at room temperature to 90.19 nm at 800 oC. On the other hand, the produced oxide nanoparticles (NPs) demonstrated exceptional antibacterial activity against S. aureus and E. coli in addition to their effectiveness in terms of antifungal activity. The oxide made after annealing at 400 ° C exhibits the best antibacterial and antifungal activity because it has the largest surface area and total pore volume.
Author Contributions
Manal El Sayed: Conceptualization, Data curation, Writing – original draft, Writing – review & editing, Visualization, Investigation, Formal analysis, Methodology. Magdy A.M. Ibrahim: Conceptualization, Data curation, Writing – original draft, Writing – review & editing, Visualization, Investigation, Formal analysis, Methodology. Mahmoud A. El-Jemni: Conceptualization, Visualization, Investigation, Formal analysis, Methodology, Writing- review & editing, Visualization.
Data Availability Statement
All data generated or analyzed during this study are included in this published article.
Conflicts of Interest
The authors declare that they have no competing interests.
Ethics Approval and Consent to Participate
Not Applicable.
Consent for Publication
Not Applicable.
References
- El-Shafie, A.S.; Ahsan, I.; Radhwani, M.; Al-Khangi, M.A.; El-Azazy, M. Synthesis and Application of Cobalt Oxide (Co3O4)-Impregnated Olive Stones Biochar for the Removal of Rifampicin and Tigecycline: Multivariate Controlled Performance. Nanomaterials 2022, 12, 379. [Google Scholar] [CrossRef]
- Adekunle, A.S.; Oyekunle, J.A.; Durosinmi, L.M.; Oluwafemi, O.S.; Olayanju, D.S.; Akinola, A.S.; Obisesan, O.R.; Akinyele, O.F.; Ajayeoba, T.A. Potential of cobalt and cobalt oxide nanoparticles as nanocatalyst towards dyes degradation in wastewater. Nano-Structures Nano-Objects 2020, 21. [Google Scholar] [CrossRef]
- El Boraei, N.; Ibrahim, M. Black binary nickel cobalt oxide nano-powder prepared by cathodic electrodeposition; characterization and its efficient application on removing the Remazol Red textile dye from aqueous solution. Mater. Chem. Phys. 2019, 238, 121894. [Google Scholar] [CrossRef]
- El Boraei, N.F.; Ibrahim, M.; Kamal, R. Facile synthesis of mesoporous ncCoW powder via electrodeposition; characterization and its efficient application on hydrogen generation and organic pollutants reduction. Surfaces Interfaces 2023, 44. [Google Scholar] [CrossRef]
- Wahab, R.; Ahmad, N.; Alam, M.; Ahmad, J. The development of cobalt oxide nanoparticles based electrode to elucidate the rapid sensing of nitrophenol. Mater. Sci. Eng. B 2021, 265. [Google Scholar] [CrossRef]
- Samal, R.; Biswal, A.; Dash, B.; Sanjay, K.; Subbaiah, T.; Shin, S. Samal, R.; Biswal, A.; Dash, B.; Sanjay, K.; Subbaiah, T.; Shin, S. In Preparation and characterization of cobalt oxide by electrochemical technique, XIII International Seminar on Mineral Processing Technology (MPT-2013), 2013.
- Abdel-Samad, H.S.; El-Jemni, M.A.; El Rehim, S.S.A.; Hassan, H.H. Simply prepared α-Ni(OH)2-based electrode for efficient electrocatalysis of EOR and OER. Electrochimica Acta 2024, 503. [Google Scholar] [CrossRef]
- El-Jemni, M.A.; Abdel-Samad, H.S.; AlKordi, M.H.; Hassan, H.H. Normalization of the EOR catalytic efficiency measurements based on RRDE study for simply fabricated cost-effective Co/graphite electrode for DAEFCs. J. Electroanal. Chem. 2022, 918. [Google Scholar] [CrossRef]
- El-Jemni, M.A.; Abdel-Samad, H.S.; Essa, A.S.; Hassan, H.H. Controlled electrodeposited cobalt phases for efficient OER catalysis, RRDE and eQCM studies. Electrochimica Acta 2019, 313, 403–414. [Google Scholar] [CrossRef]
- Vijayakumar, S.; Ponnalagi, A.K.; Nagamuthu, S.; Muralidharan, G. Microwave assisted synthesis of Co3O4 nanoparticles for high-performance supercapacitors. Electrochimica Acta 2013, 106, 500–505. [Google Scholar] [CrossRef]
- Guo, L.; Huang, Q.; Li, X.-Y.; Yang, S. Iron nanoparticles: Synthesis and applications in surface enhanced Raman scattering and electrocatalysis. Phys. Chem. Chem. Phys. 2001, 3, 1661–1665. [Google Scholar] [CrossRef]
- Sharma, B.K.; Shah, D.V.; Roy, D.R. Green synthesis of CuO nanoparticles using Azadirachta indica and its antibacterial activity for medicinal applications. Mater. Res. Express 2018, 5, 095033. [Google Scholar] [CrossRef]
- Saliani, M.; Jalal, R.; Goharshadi, E.K. Effects of pH and Temperature on Antibacterial Activity of Zinc Oxide Nanofluid Against E. coliO157:H7 and Staphylococcus aureus. Jundishapur J. Microbiol. 2015, 8, e17115–e17115. [Google Scholar] [CrossRef] [PubMed]
- Ayanwale, A.P.; Estrada-Capetillo, B.L.; Reyes-López, S.Y. Evaluation of Antifungal Activity by Mixed Oxide Metallic Nanocomposite against Candida spp. Processes 2021, 9, 773. [Google Scholar] [CrossRef]
- Anuradha, C.; Raji, P. Facile-synthesis and characterization of cobalt oxide (Co3O4) nanoparticles by using Arishta leaves assisted biological molecules and its antibacterial and antifungal activities. J. Mol. Struct. 2022, 1262. [Google Scholar] [CrossRef]
- Das, D.; Saikia, B.J. Synthesis, characterization and biological applications of cobalt oxide (Co3O4) nanoparticles. Chem. Phys. Impact 2022, 6. [Google Scholar] [CrossRef]
- Farhadi, S.; Safabakhsh, J.; Zaringhadam, P. , Synthesis, characterization, and investigation of optical and magnetic properties of cobalt oxide (Co 3 O 4) nanoparticles. Journal of Nanostructure in Chemistry 2013, 3, 1–9. [Google Scholar] [CrossRef]
- Moradpoor, H.; Safaei, M.; Rezaei, F.; Golshah, A.; Jamshidy, L.; Hatam, R.; Abdullah, R.S. Optimisation of Cobalt Oxide Nanoparticles Synthesis as Bactericidal Agents. Open Access Maced. J. Med Sci. 2019, 7, 2757–2762. [Google Scholar] [CrossRef]
- Yetim, N.K. Hydrothermal synthesis of Co3O4 with different morphology: Investigation of magnetic and electrochemical properties. J. Mol. Struct. 2020, 1226, 129414. [Google Scholar] [CrossRef]
- Zhu, T.; Chong, M.N.; Phuan, Y.W.; Ocon, J.D.; Chan, E.S. Effects of electrodeposition synthesis parameters on the photoactivity of nanostructured tungsten trioxide thin films: Optimisation study using response surface methodology. J. Taiwan Inst. Chem. Eng. 2016, 61, 196–204. [Google Scholar] [CrossRef]
- Petrović, M.M.; Slipper, I.J.; Antonijević, M.D.; Nikolić, G.S.; Mitrović, J.Z.; Bojić, D.V.; Bojić, A.L. Characterization of a Bi2O3 coat based anode prepared by galvanostatic electrodeposition and its use for the electrochemical degradation of Reactive Orange 4. J. Taiwan Inst. Chem. Eng. 2015, 50, 282–287. [Google Scholar] [CrossRef]
- Casella, I. G.; Di Fonzo, D. A. , Anodic electrodeposition of cobalt oxides from an alkaline bath containing Co-gluconate complexes on glassy carbon. An electroanalytical investigation. Electrochimica acta 2011, 56, (22), 7536–7540. [Google Scholar] [CrossRef]
- Lisnund, S.; Blay, V.; Muamkhunthod, P.; Thunyanon, K.; Pansalee, J.; Monkrathok, J.; Maneechote, P.; Chansaenpak, K.; Pinyou, P. Electrodeposition of Cobalt Oxides on Carbon Nanotubes for Sensitive Bromhexine Sensing. Molecules 2022, 27, 4078. [Google Scholar] [CrossRef] [PubMed]
- Moridon, S.N.F.; Salehmin, M.I.; Mohamed, M.A.; Arifin, K.; Minggu, L.J.; Kassim, M.B. Cobalt oxide as photocatalyst for water splitting: Temperature-dependent phase structures. Int. J. Hydrogen Energy 2019, 44, 25495–25504. [Google Scholar] [CrossRef]
- Bao, Y.; Krishnan, K.M. Preparation of functionalized and gold-coated cobalt nanocrystals for biomedical applications. J. Magn. Magn. Mater. 2005, 293, 15–19. [Google Scholar] [CrossRef]
- Suganya, K.U.; Govindaraju, K.; Kumar, V.G.; Dhas, T.S.; Karthick, V.; Singaravelu, G.; Elanchezhiyan, M. Blue green alga mediated synthesis of gold nanoparticles and its antibacterial efficacy against Gram positive organisms. Mater. Sci. Eng. C 2015, 47, 351–356. [Google Scholar] [CrossRef] [PubMed]
- Reddy, N.J.; Vali, D.N.; Rani, M.; Rani, S.S. Evaluation of antioxidant, antibacterial and cytotoxic effects of green synthesized silver nanoparticles by Piper longum fruit. Mater. Sci. Eng. C 2014, 34, 115–122. [Google Scholar] [CrossRef]
- Rex, J. H. , Reference method for broth dilution antifungal susceptibility testing of filamentous fungi: approved standard. (No Title) 2008.
- Frost, R.L.; Kristof, J.; Paroz, G.N.; Kloprogge, J. Role of Water in the Intercalation of Kaolinite with Hydrazine. J. Colloid Interface Sci. 1998, 208, 216–225. [Google Scholar] [CrossRef]
- Hu, Z.-A.; Xie, Y.-L.; Wang, Y.-X.; Xie, L.-J.; Fu, G.-R.; Jin, X.-Q.; Zhang, Z.-Y.; Yang, Y.-Y.; Wu, H.-Y. , Synthesis of α-cobalt hydroxides with different intercalated anions and effects of intercalated anions on their morphology, basal plane spacing, and capacitive property. The Journal of Physical Chemistry C 2009, 113, (28), 12502–12508. [Google Scholar] [CrossRef]
- Nethravathi, C.; Viswanath, B.; Sebastian, M.; Rajamathi, M. Exfoliation of α-hydroxides of nickel and cobalt in water. J. Colloid Interface Sci. 2010, 345, 109–115. [Google Scholar] [CrossRef]
- Cui, H.; Ma, W.; Wang, L.; Xue, J. Preparation of α-Co(OH)2 monolayer nanosheets by an intercalation agent-free exfoliation process. J. Sol-Gel Sci. Technol. 2015, 78, 293–298. [Google Scholar] [CrossRef]
- Roth, W. , The magnetic structure of Co3O4. Journal of Physics and Chemistry of Solids 1964, 25, (1), 1–10. [Google Scholar] [CrossRef]
- Sundararajan, M.; Subramani, A.; Ubaidullah, M.; Shaikh, S.F.; Pandit, B.; Jesudoss, S.K.; Kamalakannan, M.; Yuvaraj, S.; Subudhi, P.S.; Dash, C.S. Synthesis, Characterization and In Vitro Cytotoxic Effects of Cu:Co3O4 Nanoparticles Via Microwave Combustion Method. J. Clust. Sci. 2022, 33, 1821–1830. [Google Scholar] [CrossRef]
- Allaedini, G.; Muhammad, A. Study of influential factors in synthesis and characterization of cobalt oxide nanoparticles. J. Nanostructure Chem. 2013, 3. [Google Scholar] [CrossRef]
- Li, W.-C.; Lu, A.-H.; Guo, S.-C. Characterization of the microstructures of organic and carbon aerogels based upon mixed cresol–formaldehyde. Carbon 2001, 39, 1989–1994. [Google Scholar] [CrossRef]
- Brunauer, S.; Emmett, P.H.; Teller, E. Adsorption of Gases in Multimolecular Layers. J. Am. Chem. Soc. 1938, 60, 309–319. [Google Scholar] [CrossRef]
- Rouquerol, J.; Avnir, D.; Fairbridge, C.W.; Everett, D.H.; Haynes, J.M.; Pernicone, N.; Ramsay, J.D.F.; Sing, K.S.W.; Unger, K.K. Recommendations for the characterization of porous solids (Technical Report). Pure Appl. Chem. 1994, 66, 1739–1758. [Google Scholar] [CrossRef]
- Xu, L.; Zhang, J.; Ding, J.; Liu, T.; Shi, G.; Li, X.; Dang, W.; Cheng, Y.; Guo, R. Pore Structure and Fractal Characteristics of Different Shale Lithofacies in the Dalong Formation in the Western Area of the Lower Yangtze Platform. Minerals 2020, 10, 72. [Google Scholar] [CrossRef]
- El Boraei, N.F.; Ibrahim, M.A.; Naghmash, M.A. Nanocrystalline FeNi alloy powder prepared by electrolytic synthesis; characterization and its high efficiency in removing Remazol Red dye from aqueous solution. J. Phys. Chem. Solids 2022, 167. [Google Scholar] [CrossRef]
- Shahzadi, T.; Zaib, M.; Riaz, T.; Shehzadi, S.; Abbasi, M.A.; Shahid, M. Synthesis of Eco-friendly Cobalt Nanoparticles Using Celosia argentea Plant Extract and Their Efficacy Studies as Antioxidant, Antibacterial, Hemolytic and Catalytical Agent. Arab. J. Sci. Eng. 2019, 44, 6435–6444. [Google Scholar] [CrossRef]
- Shriniwas, P. P.; Subhash, T. K. , Antioxidant, antibacterial and cytotoxic potential of silver nanoparticles synthesized using terpenes rich extract of Lantana camara L. leaves. Biochem. Biophys. Rep 2017, 10, 76–81. [Google Scholar]
- Ahmad, S.; Munir, S.; Zeb, N.; Ullah, A.; Khan, B.; Ali, J.; Bilal, M.; Omer, M.; Alamzeb, M.; Salman, S.M.; et al. Green nanotechnology: a review on green synthesis of silver nanoparticles — an ecofriendly approach. Int. J. Nanomed. 2019, ume 14, 5087–5107. [Google Scholar] [CrossRef]
- Anuradha, C.T.; Raji, P. Facile synthesis and characterization of Co3O4 nanoparticles for high-performance supercapacitors using Camellia sinensis. Appl. Phys. A 2020, 126, 1–12. [Google Scholar] [CrossRef]
- Ali, M.; Abad, W.; Roomy, H.; Abd, A. , Rapid synthesis of SeO2 nanoparticles and their activity against clinical isolates (gram positive, gram negative, and fungi). NanoWorld J. 2023, 9, 34–44. [Google Scholar]
- Ali, E. M.; Rasool, K. H.; Abad, W. K.; Abd, A. N. In Green Synthesis, Characterization and Antimicrobial activity of CuO nanoparticles (NPs) Derived from Hibiscus sabdariffa a plant and CuCl, Journal of Physics: Conference Series, 2021; IOP Publishing: p 012092.
Figure 1.
The HRSEM images for Co-25 (a and d), Co-400 (b and e), and Co-800 (c and f) and their analogous EDS g, h, and i, respectively.
Figure 1.
The HRSEM images for Co-25 (a and d), Co-400 (b and e), and Co-800 (c and f) and their analogous EDS g, h, and i, respectively.
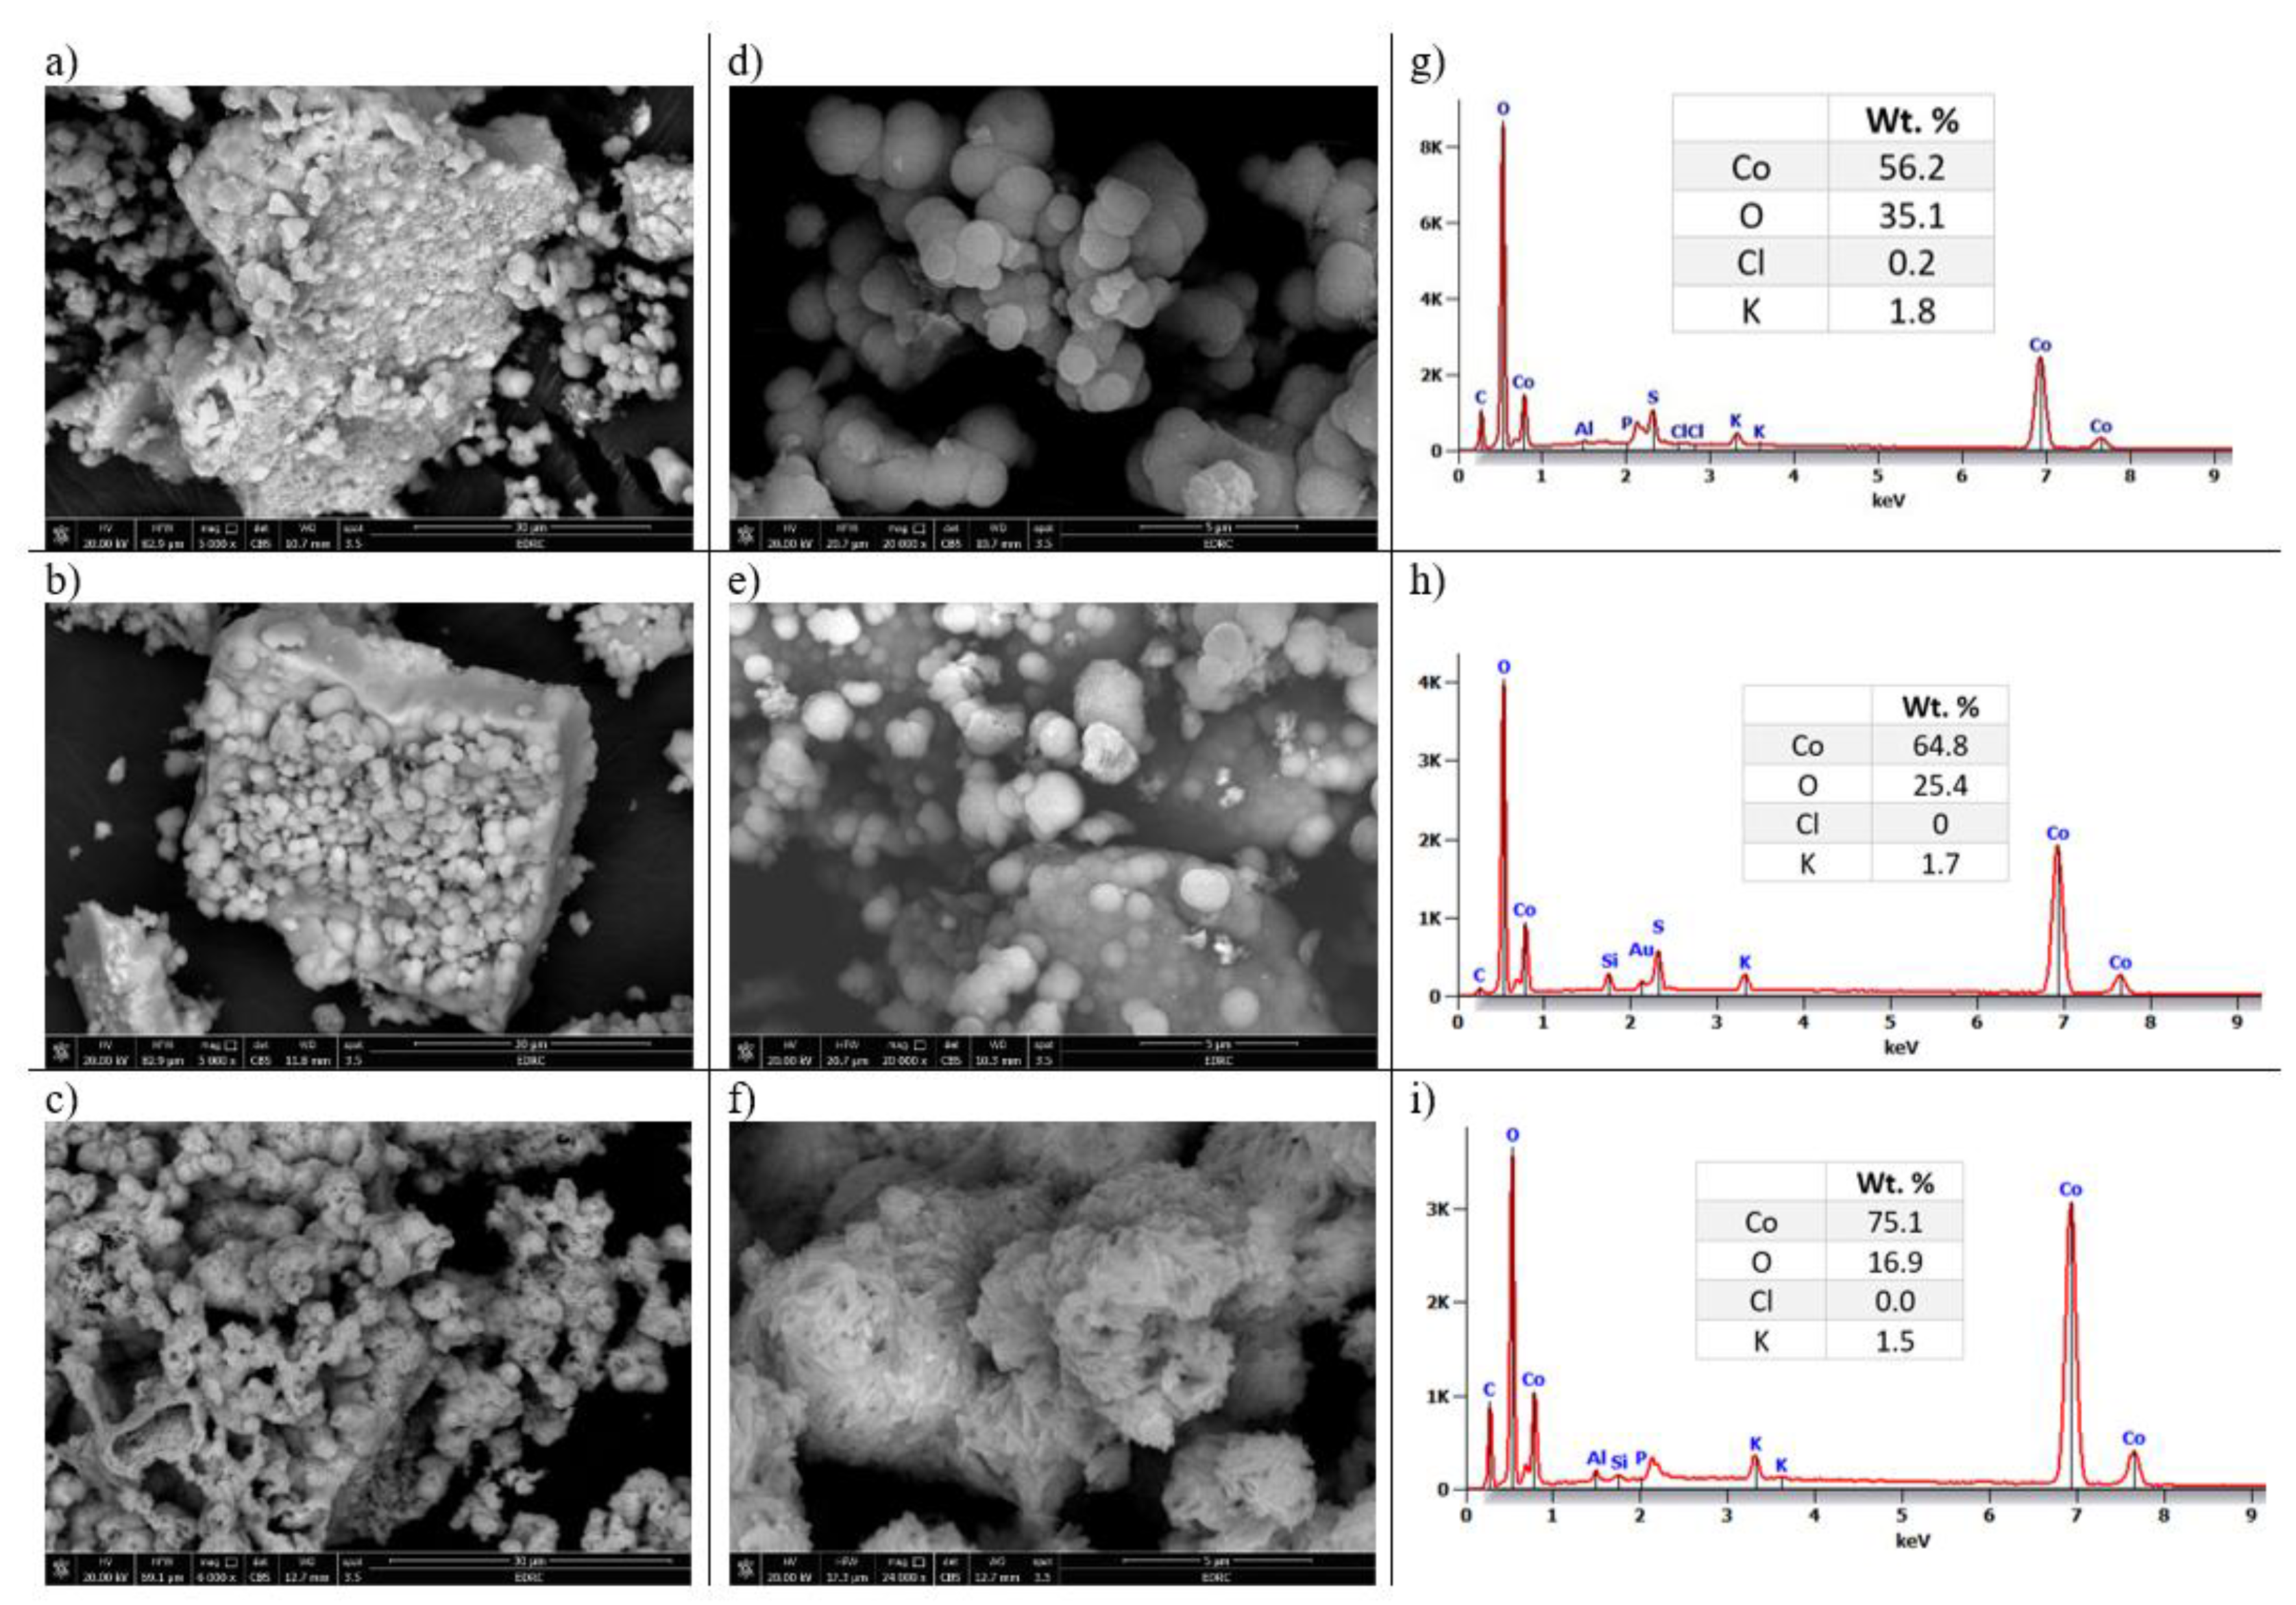
Figure 2.
XRD patterns for the prepared cobalt oxide samples.
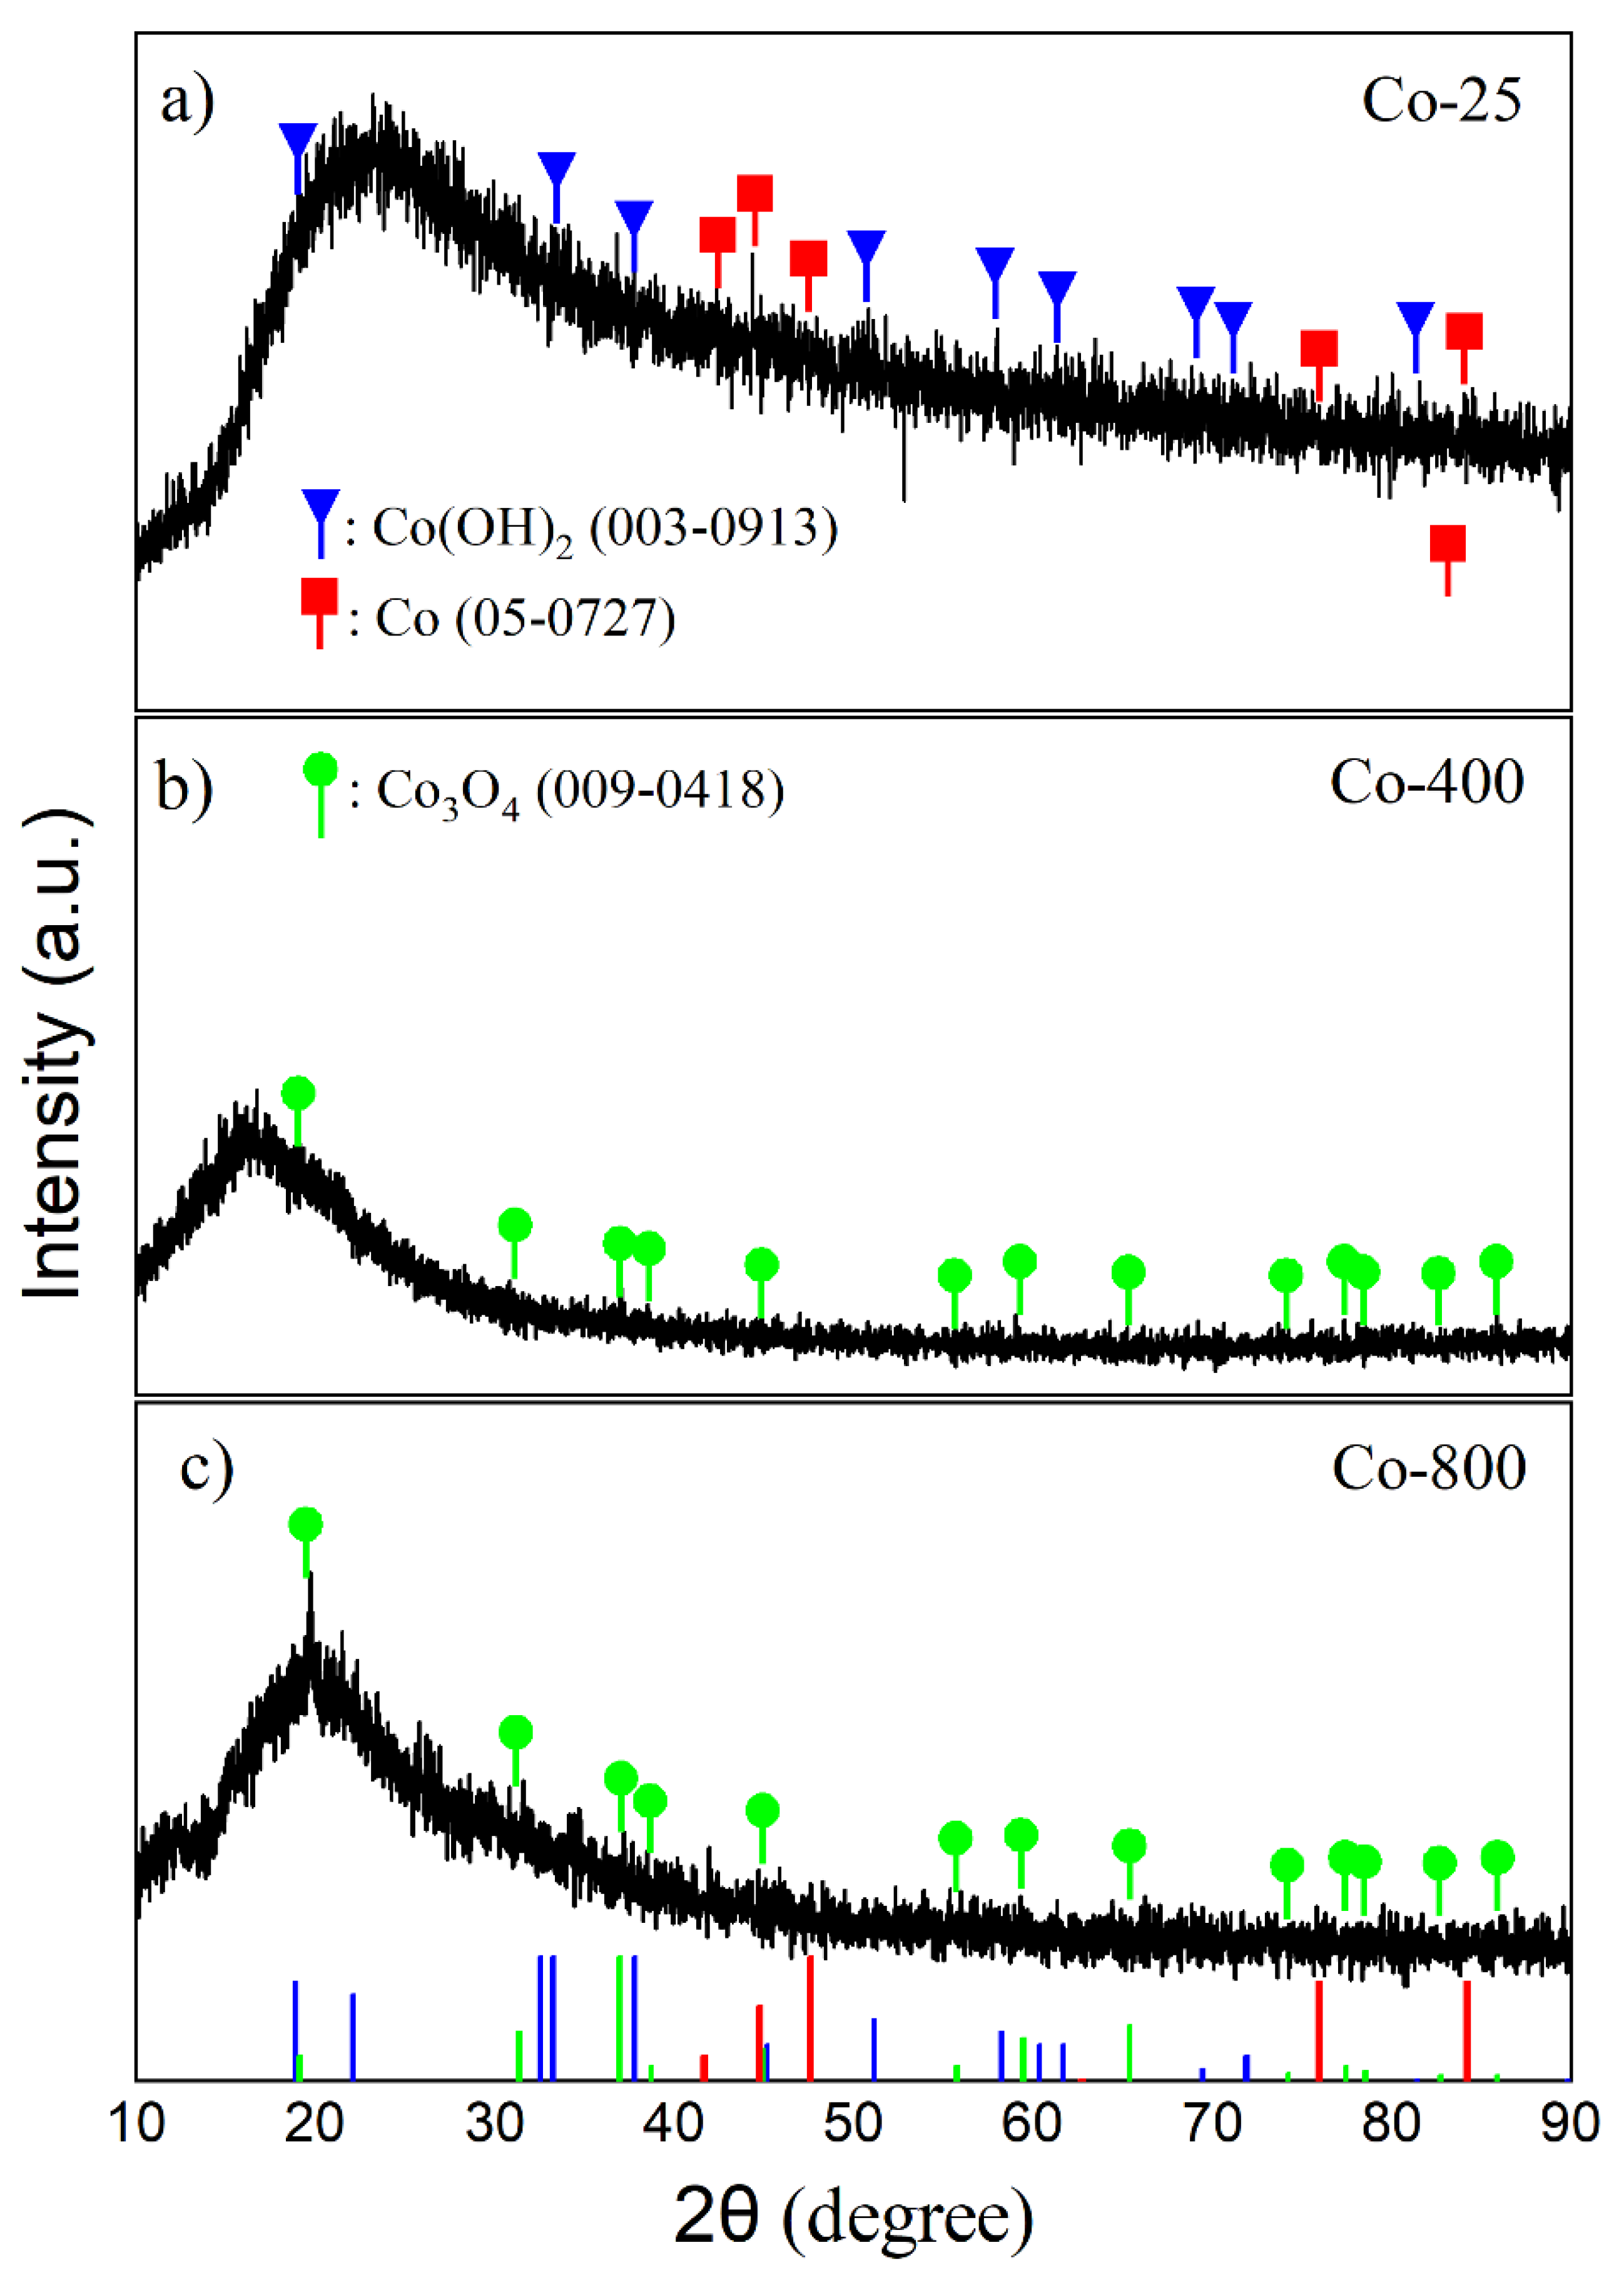
Figure 3.
FTIR spectra of cobalt oxide samples.
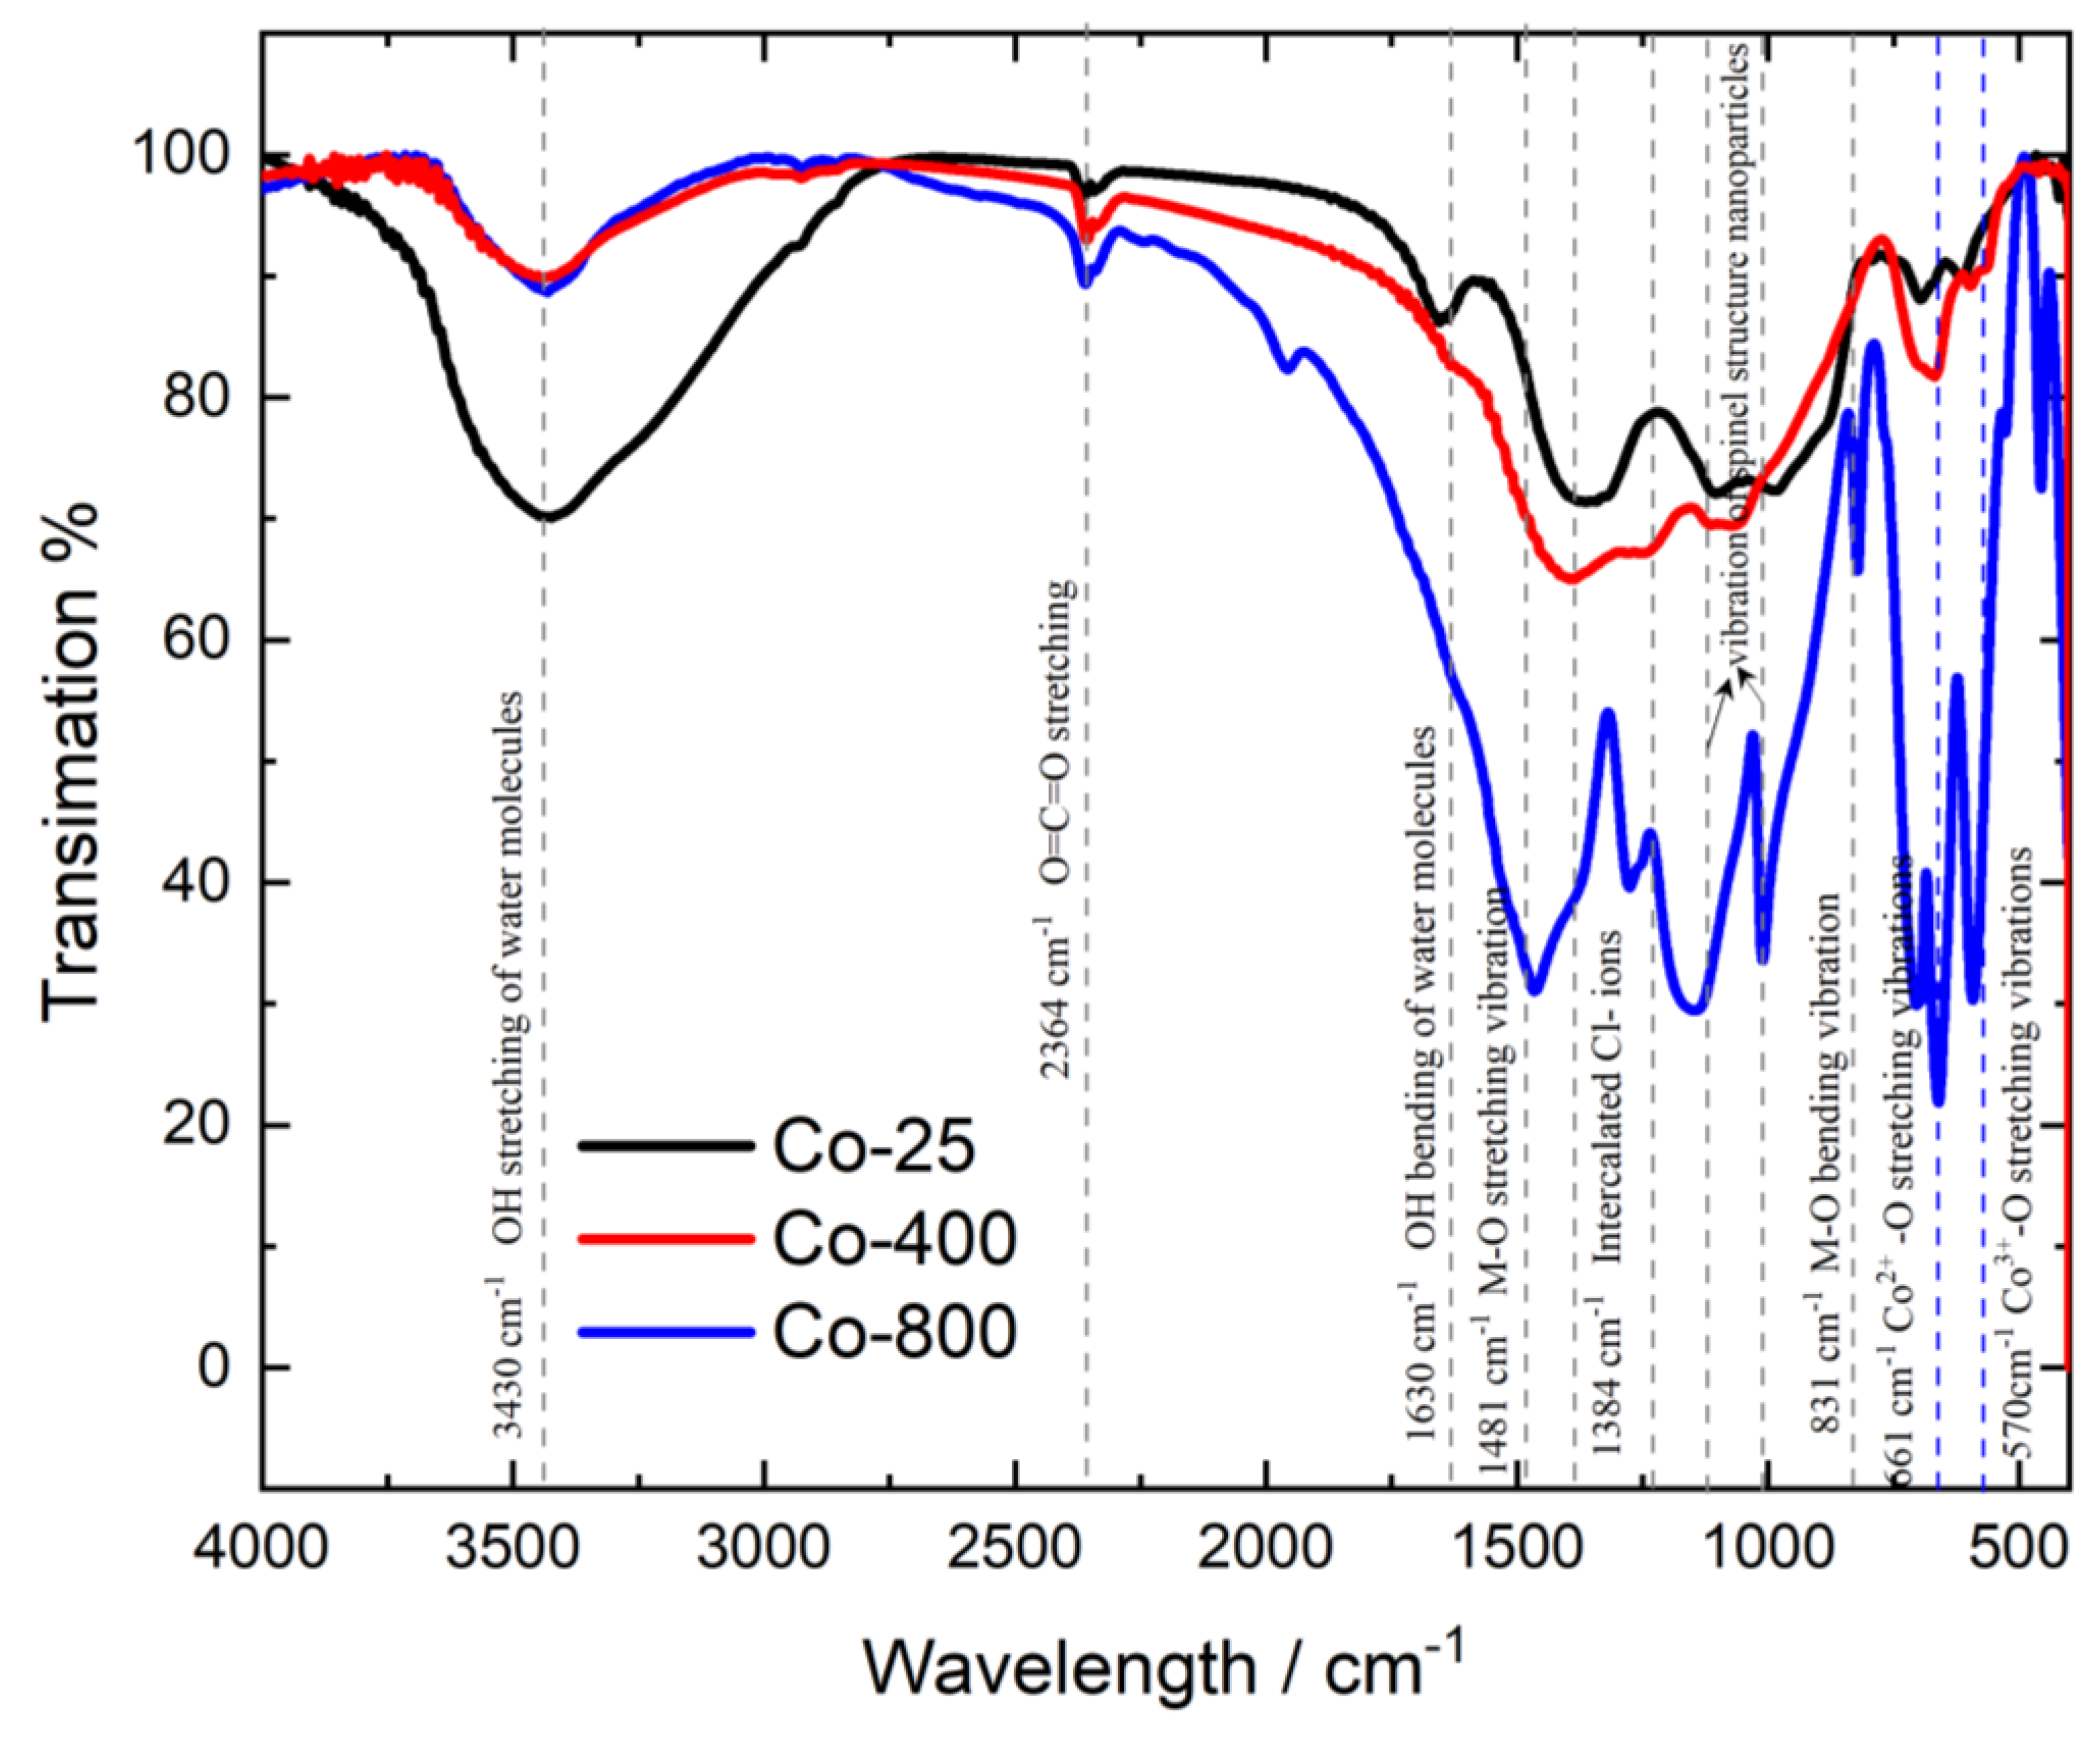
Figure 4.
HRTEM images of Co-25 (a and d), Co-400 (b and e), and Co-800 (c and f); and their SAED patterns (g – i), respectively.
Figure 4.
HRTEM images of Co-25 (a and d), Co-400 (b and e), and Co-800 (c and f); and their SAED patterns (g – i), respectively.
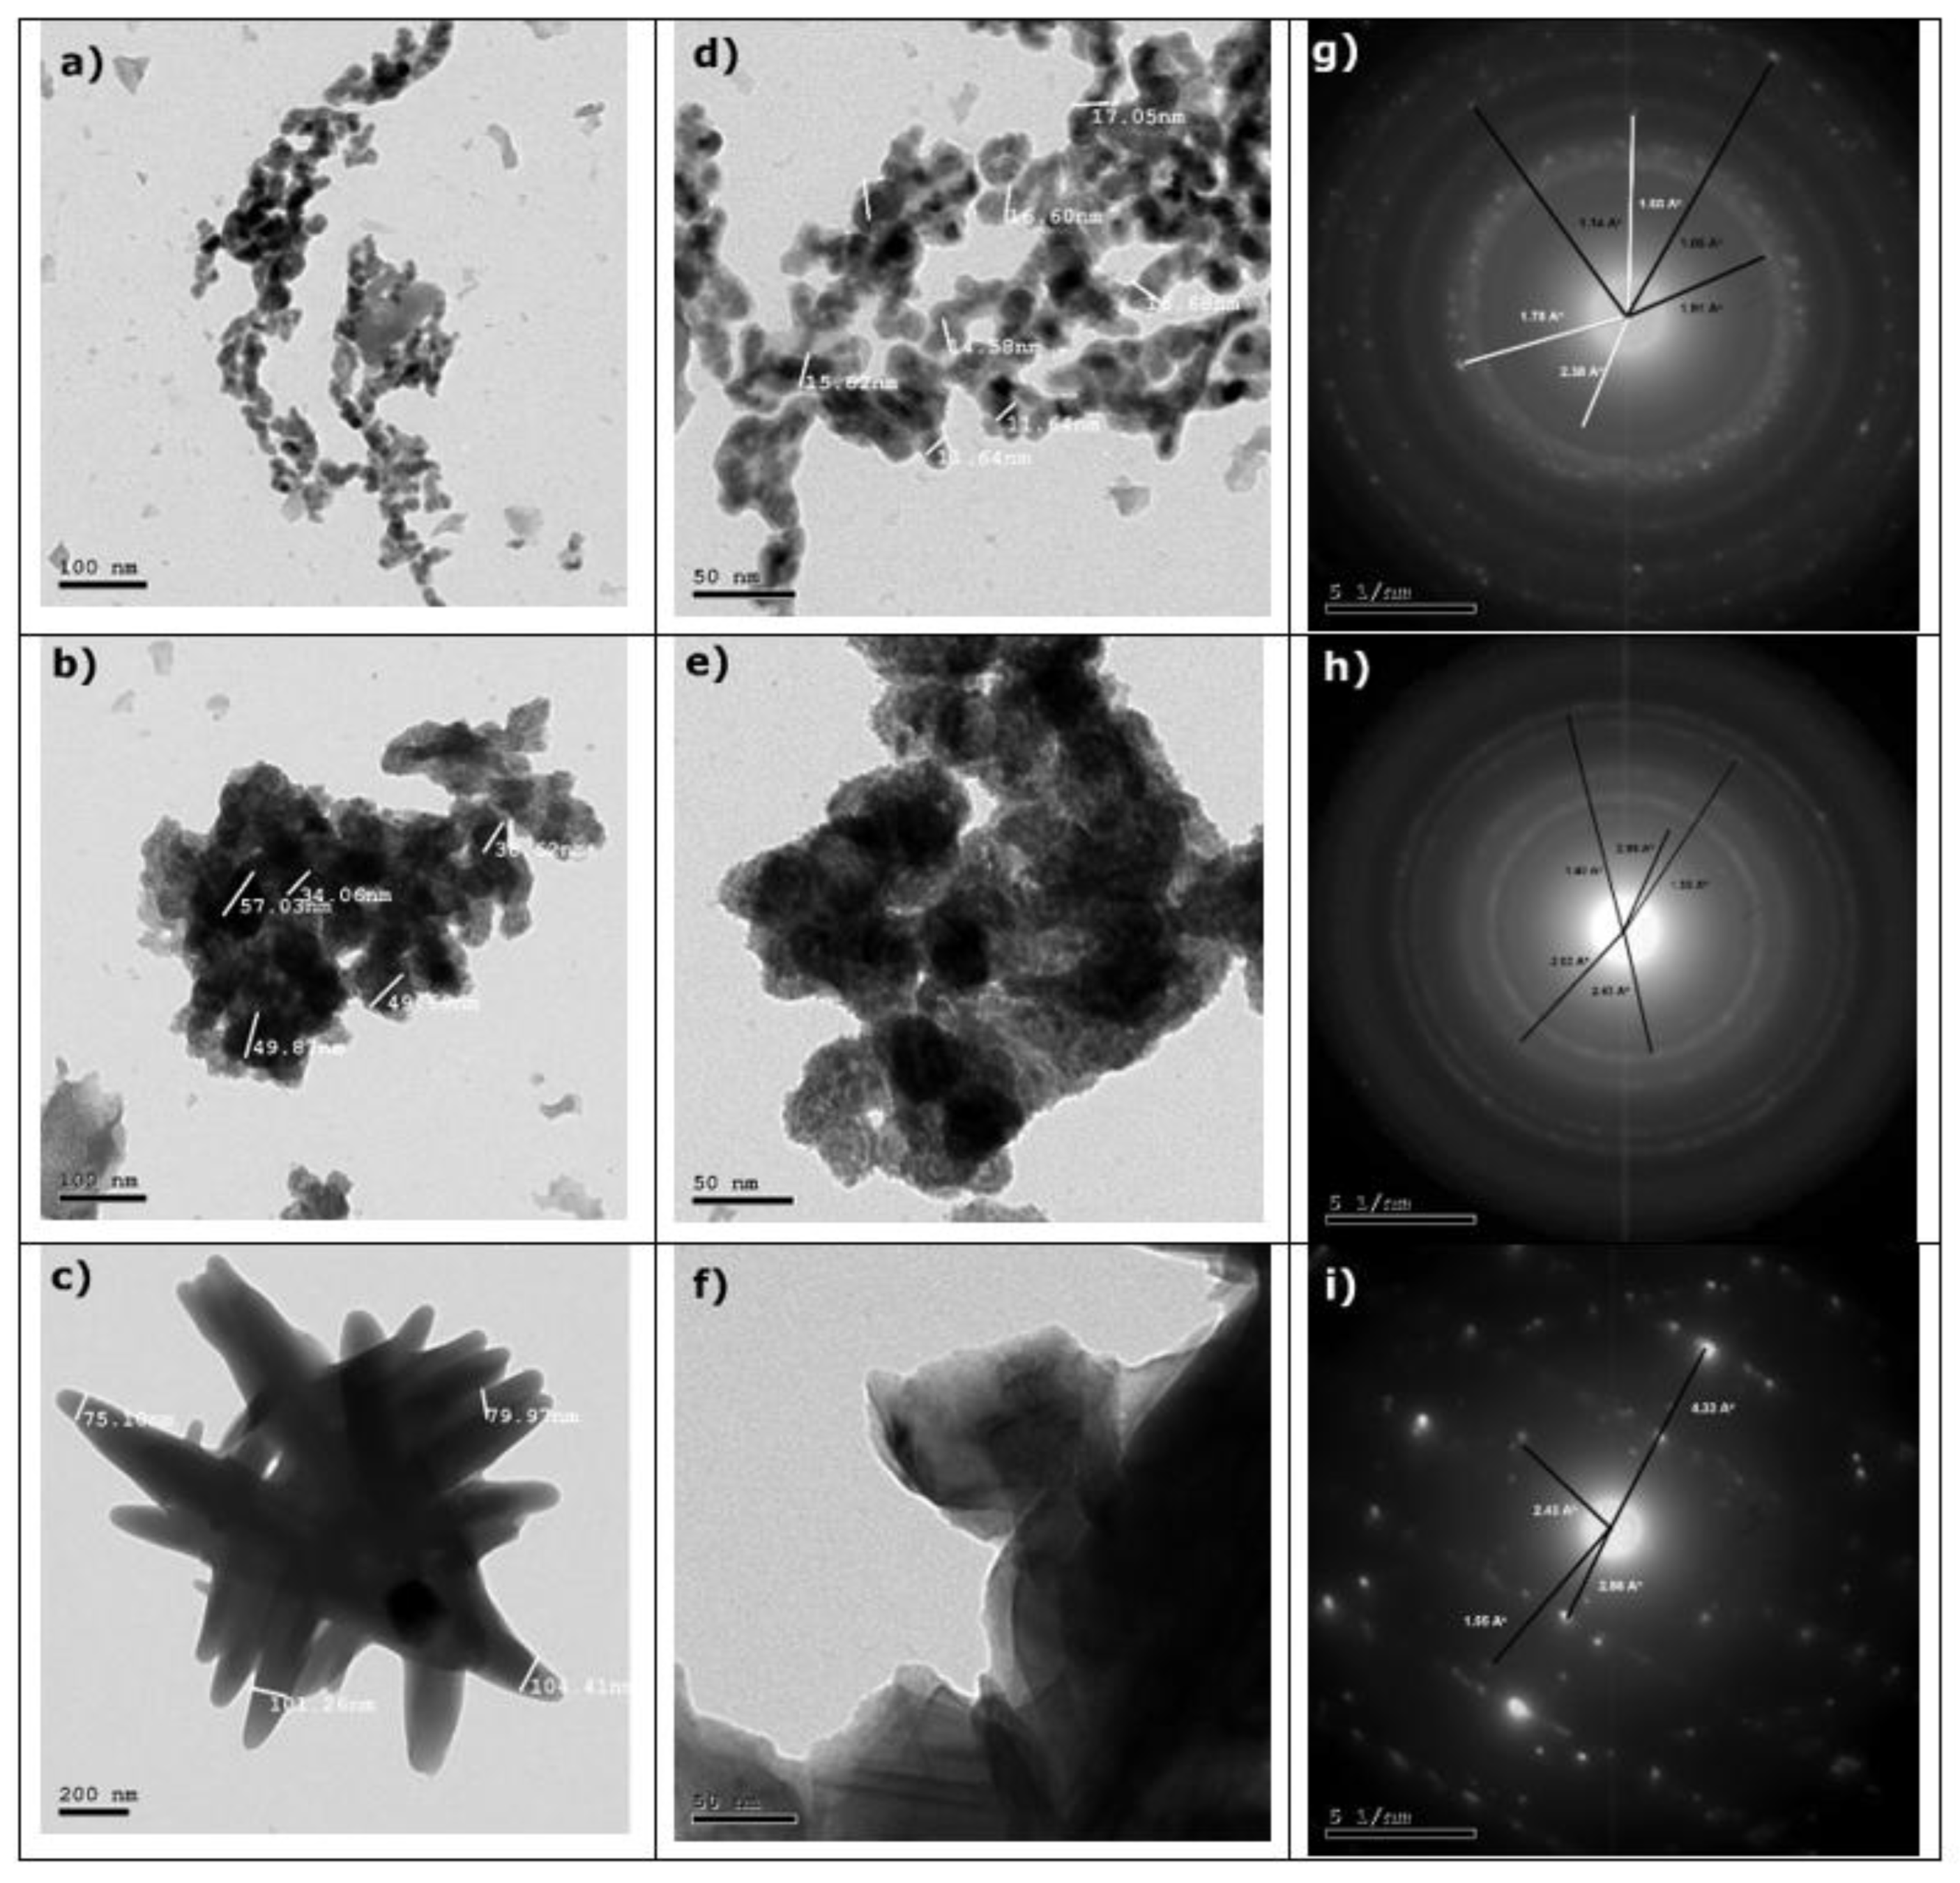
Figure 5.
N2 adsorption/desorption isotherms (a) and their corresponding pore size distribution curves (b) for cobalt oxide samples.
Figure 5.
N2 adsorption/desorption isotherms (a) and their corresponding pore size distribution curves (b) for cobalt oxide samples.
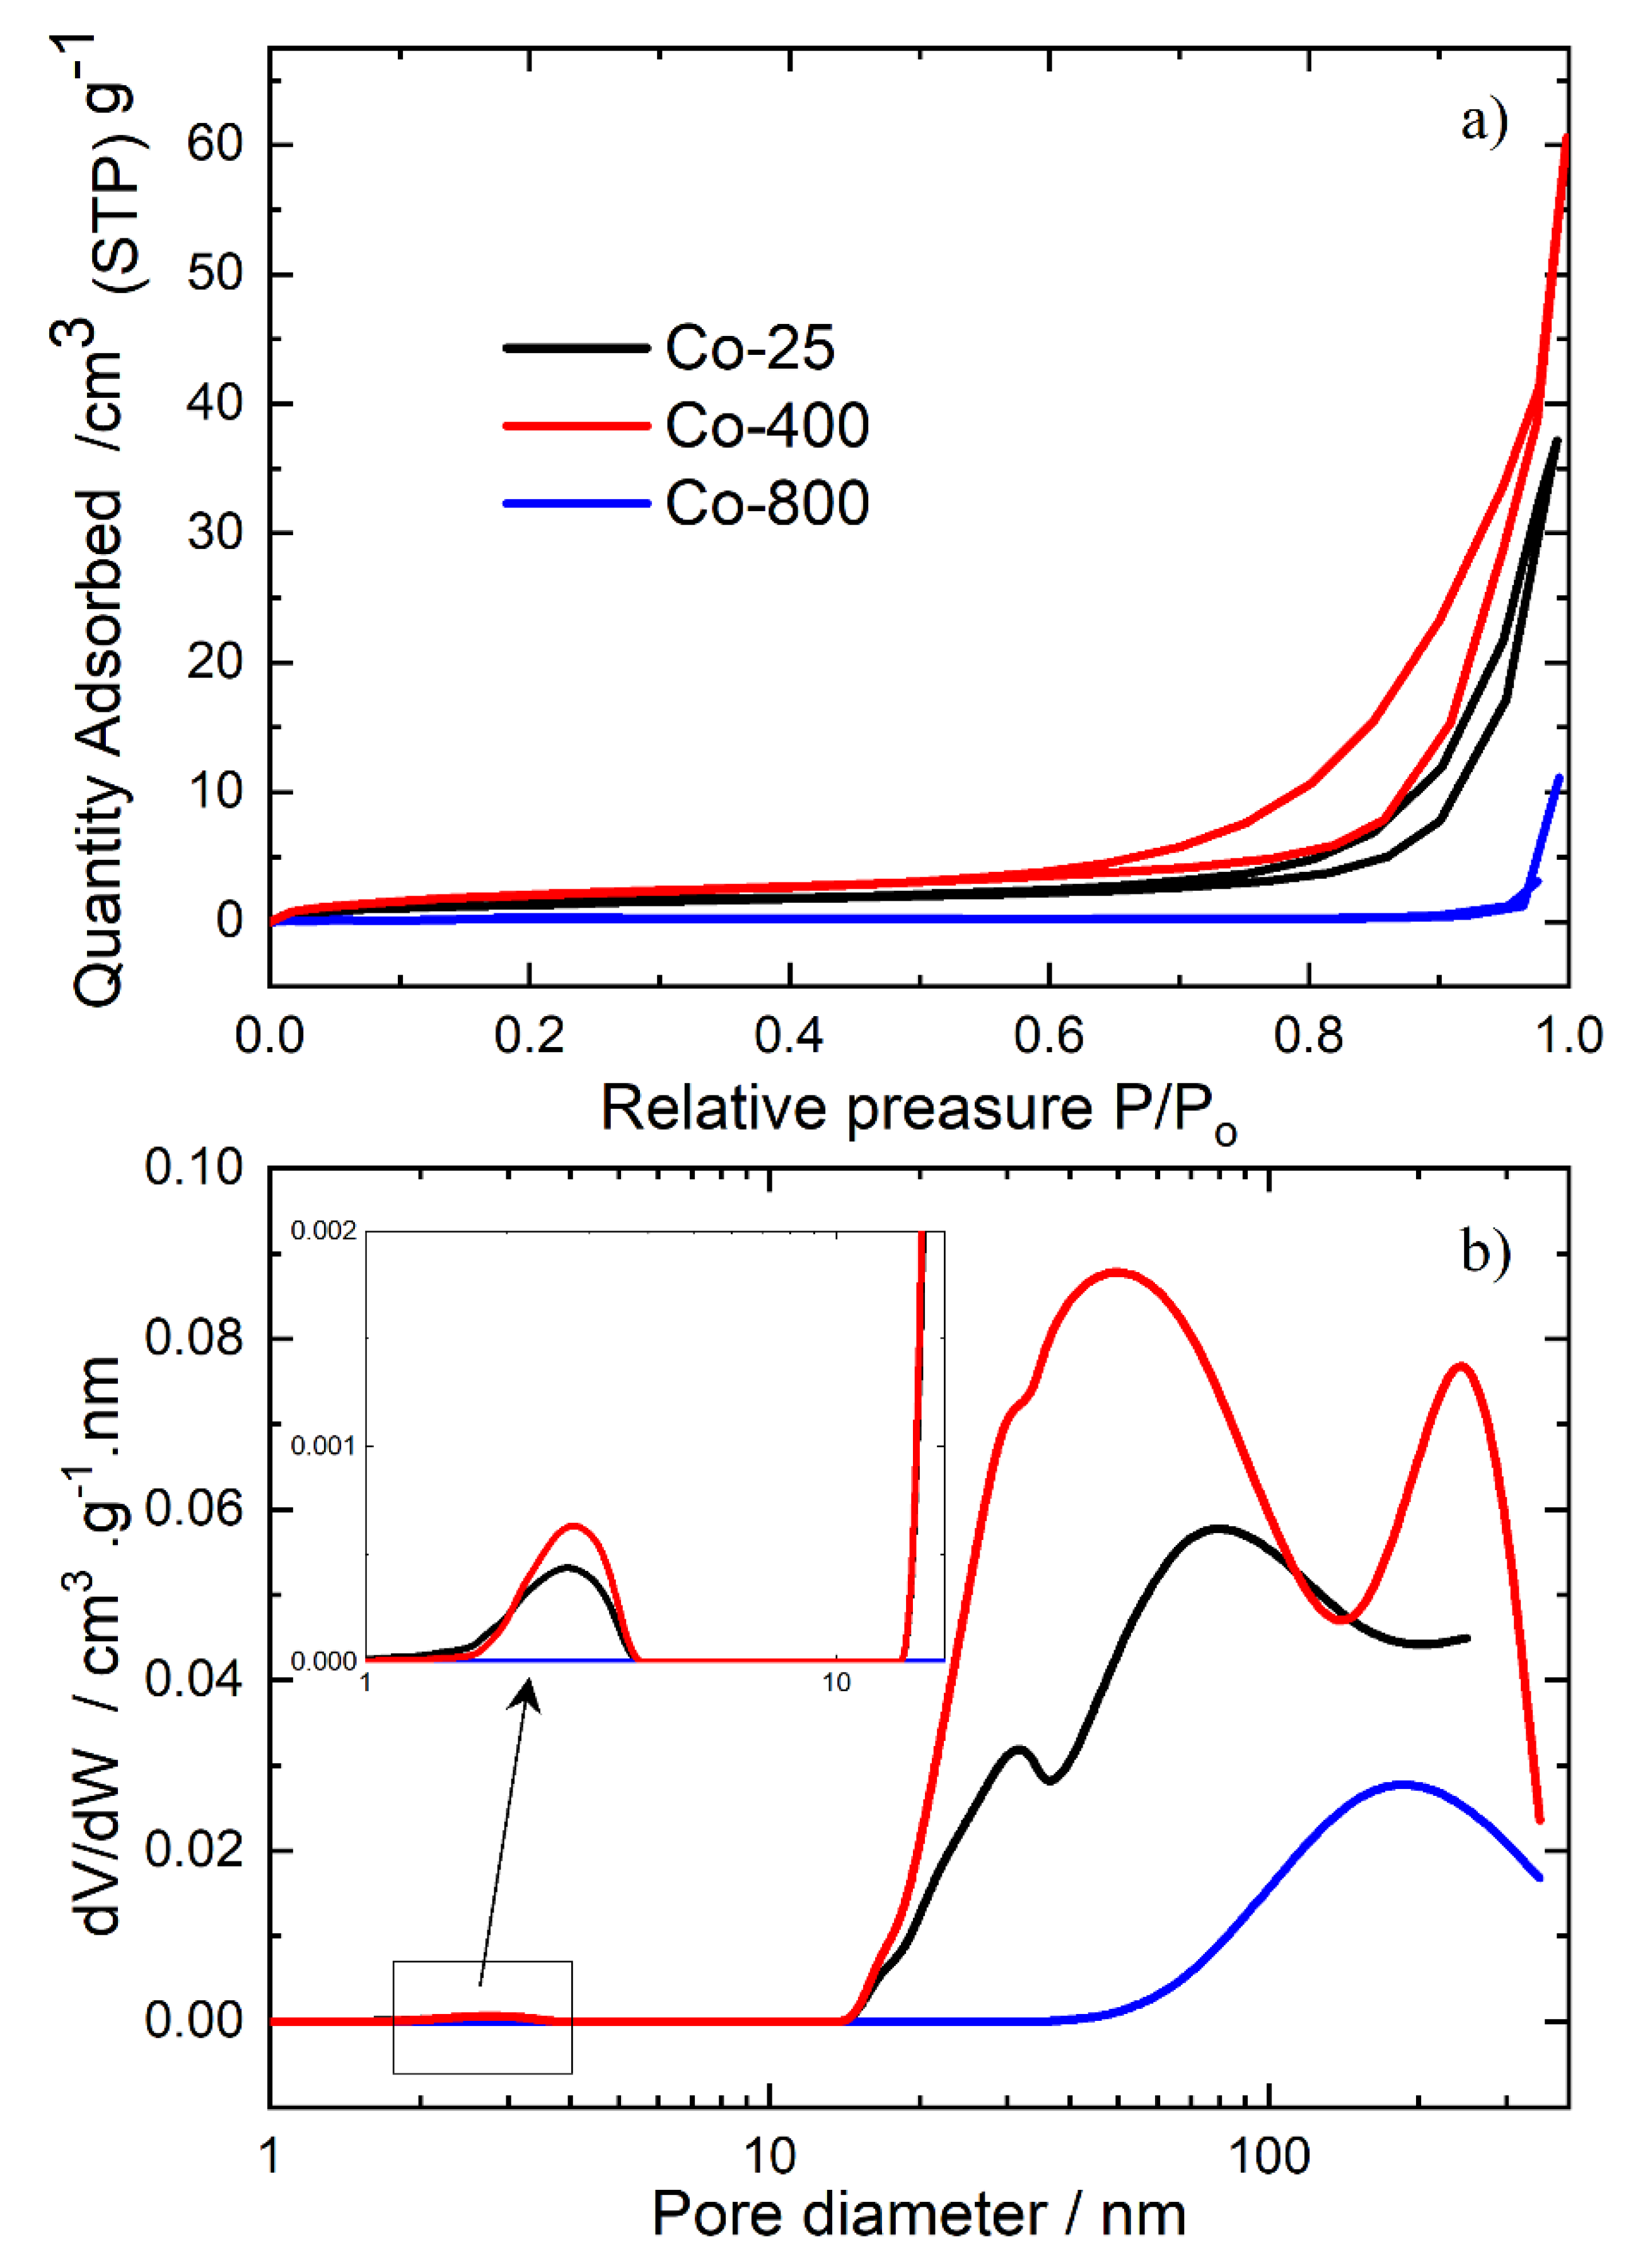
Figure 6.
Potentiodynamic cathodic polarization curves during cobalt deposition from Watts bath in the absence and presence of different concentrations of NO3- ions.
Figure 6.
Potentiodynamic cathodic polarization curves during cobalt deposition from Watts bath in the absence and presence of different concentrations of NO3- ions.
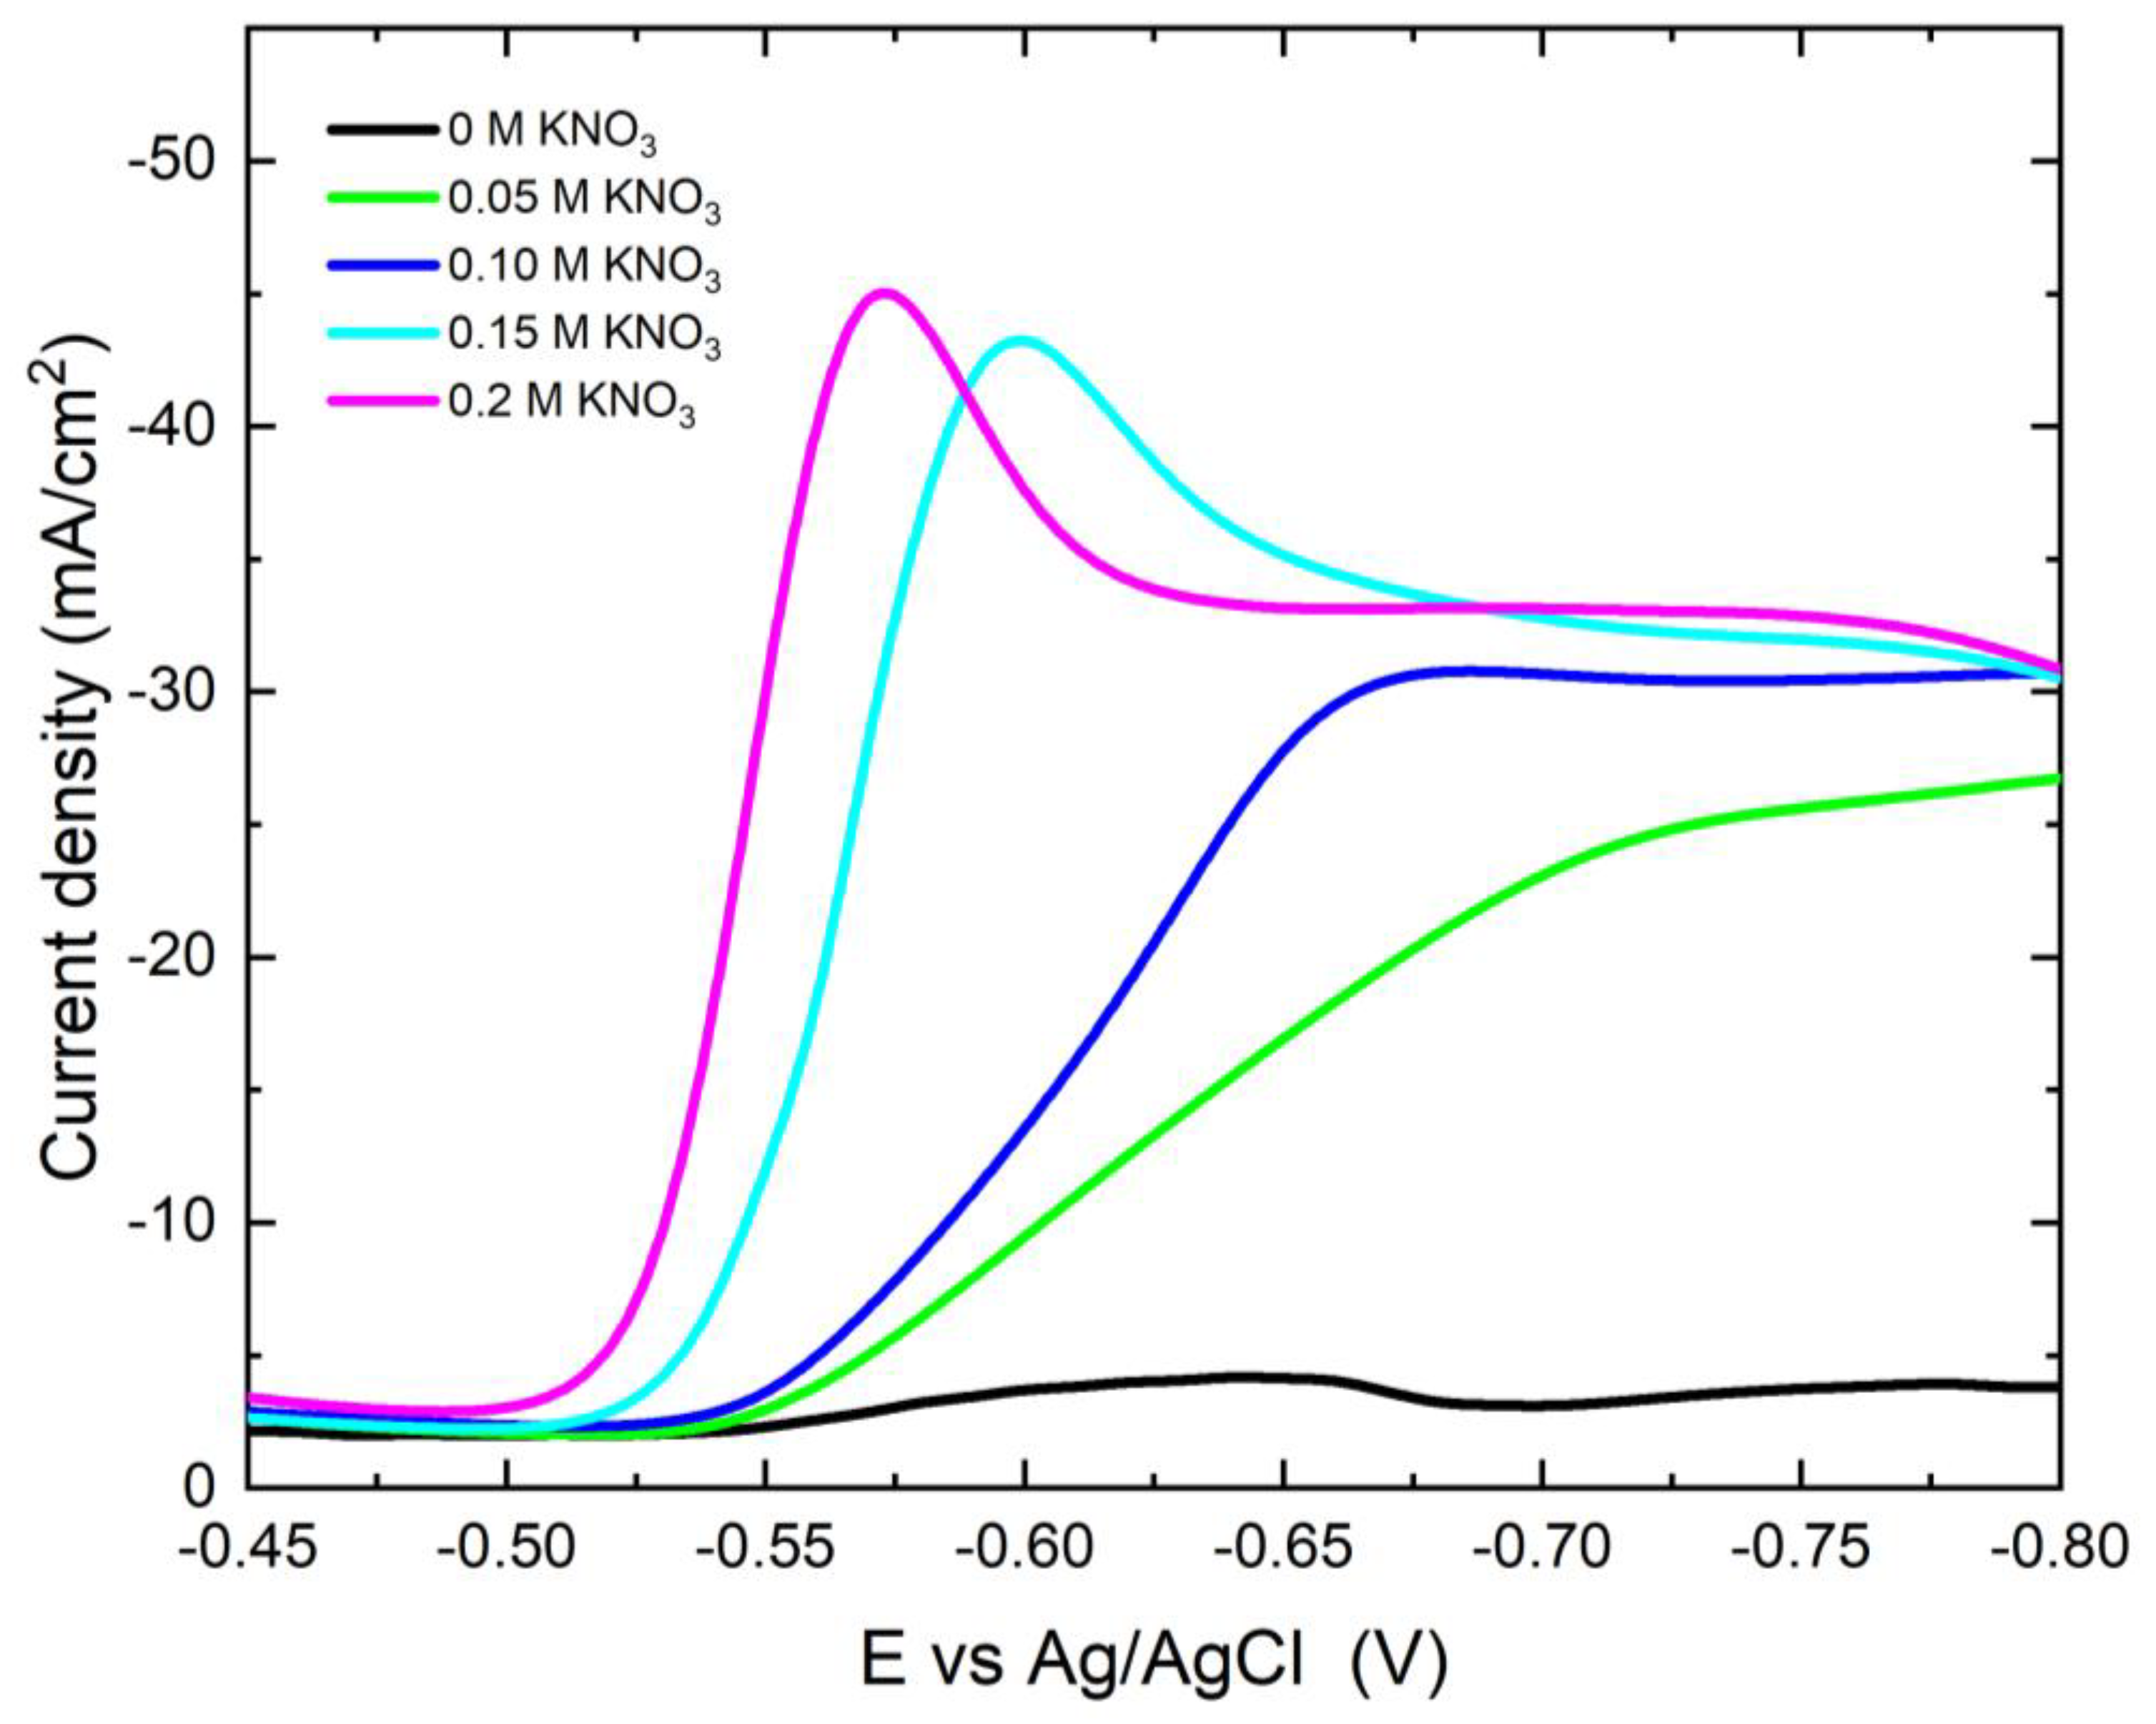
Figure 7.
Cathodic polarization curves during deposition of cobalt on Pt electrode from the modified Watts bath at different pH.
Figure 7.
Cathodic polarization curves during deposition of cobalt on Pt electrode from the modified Watts bath at different pH.
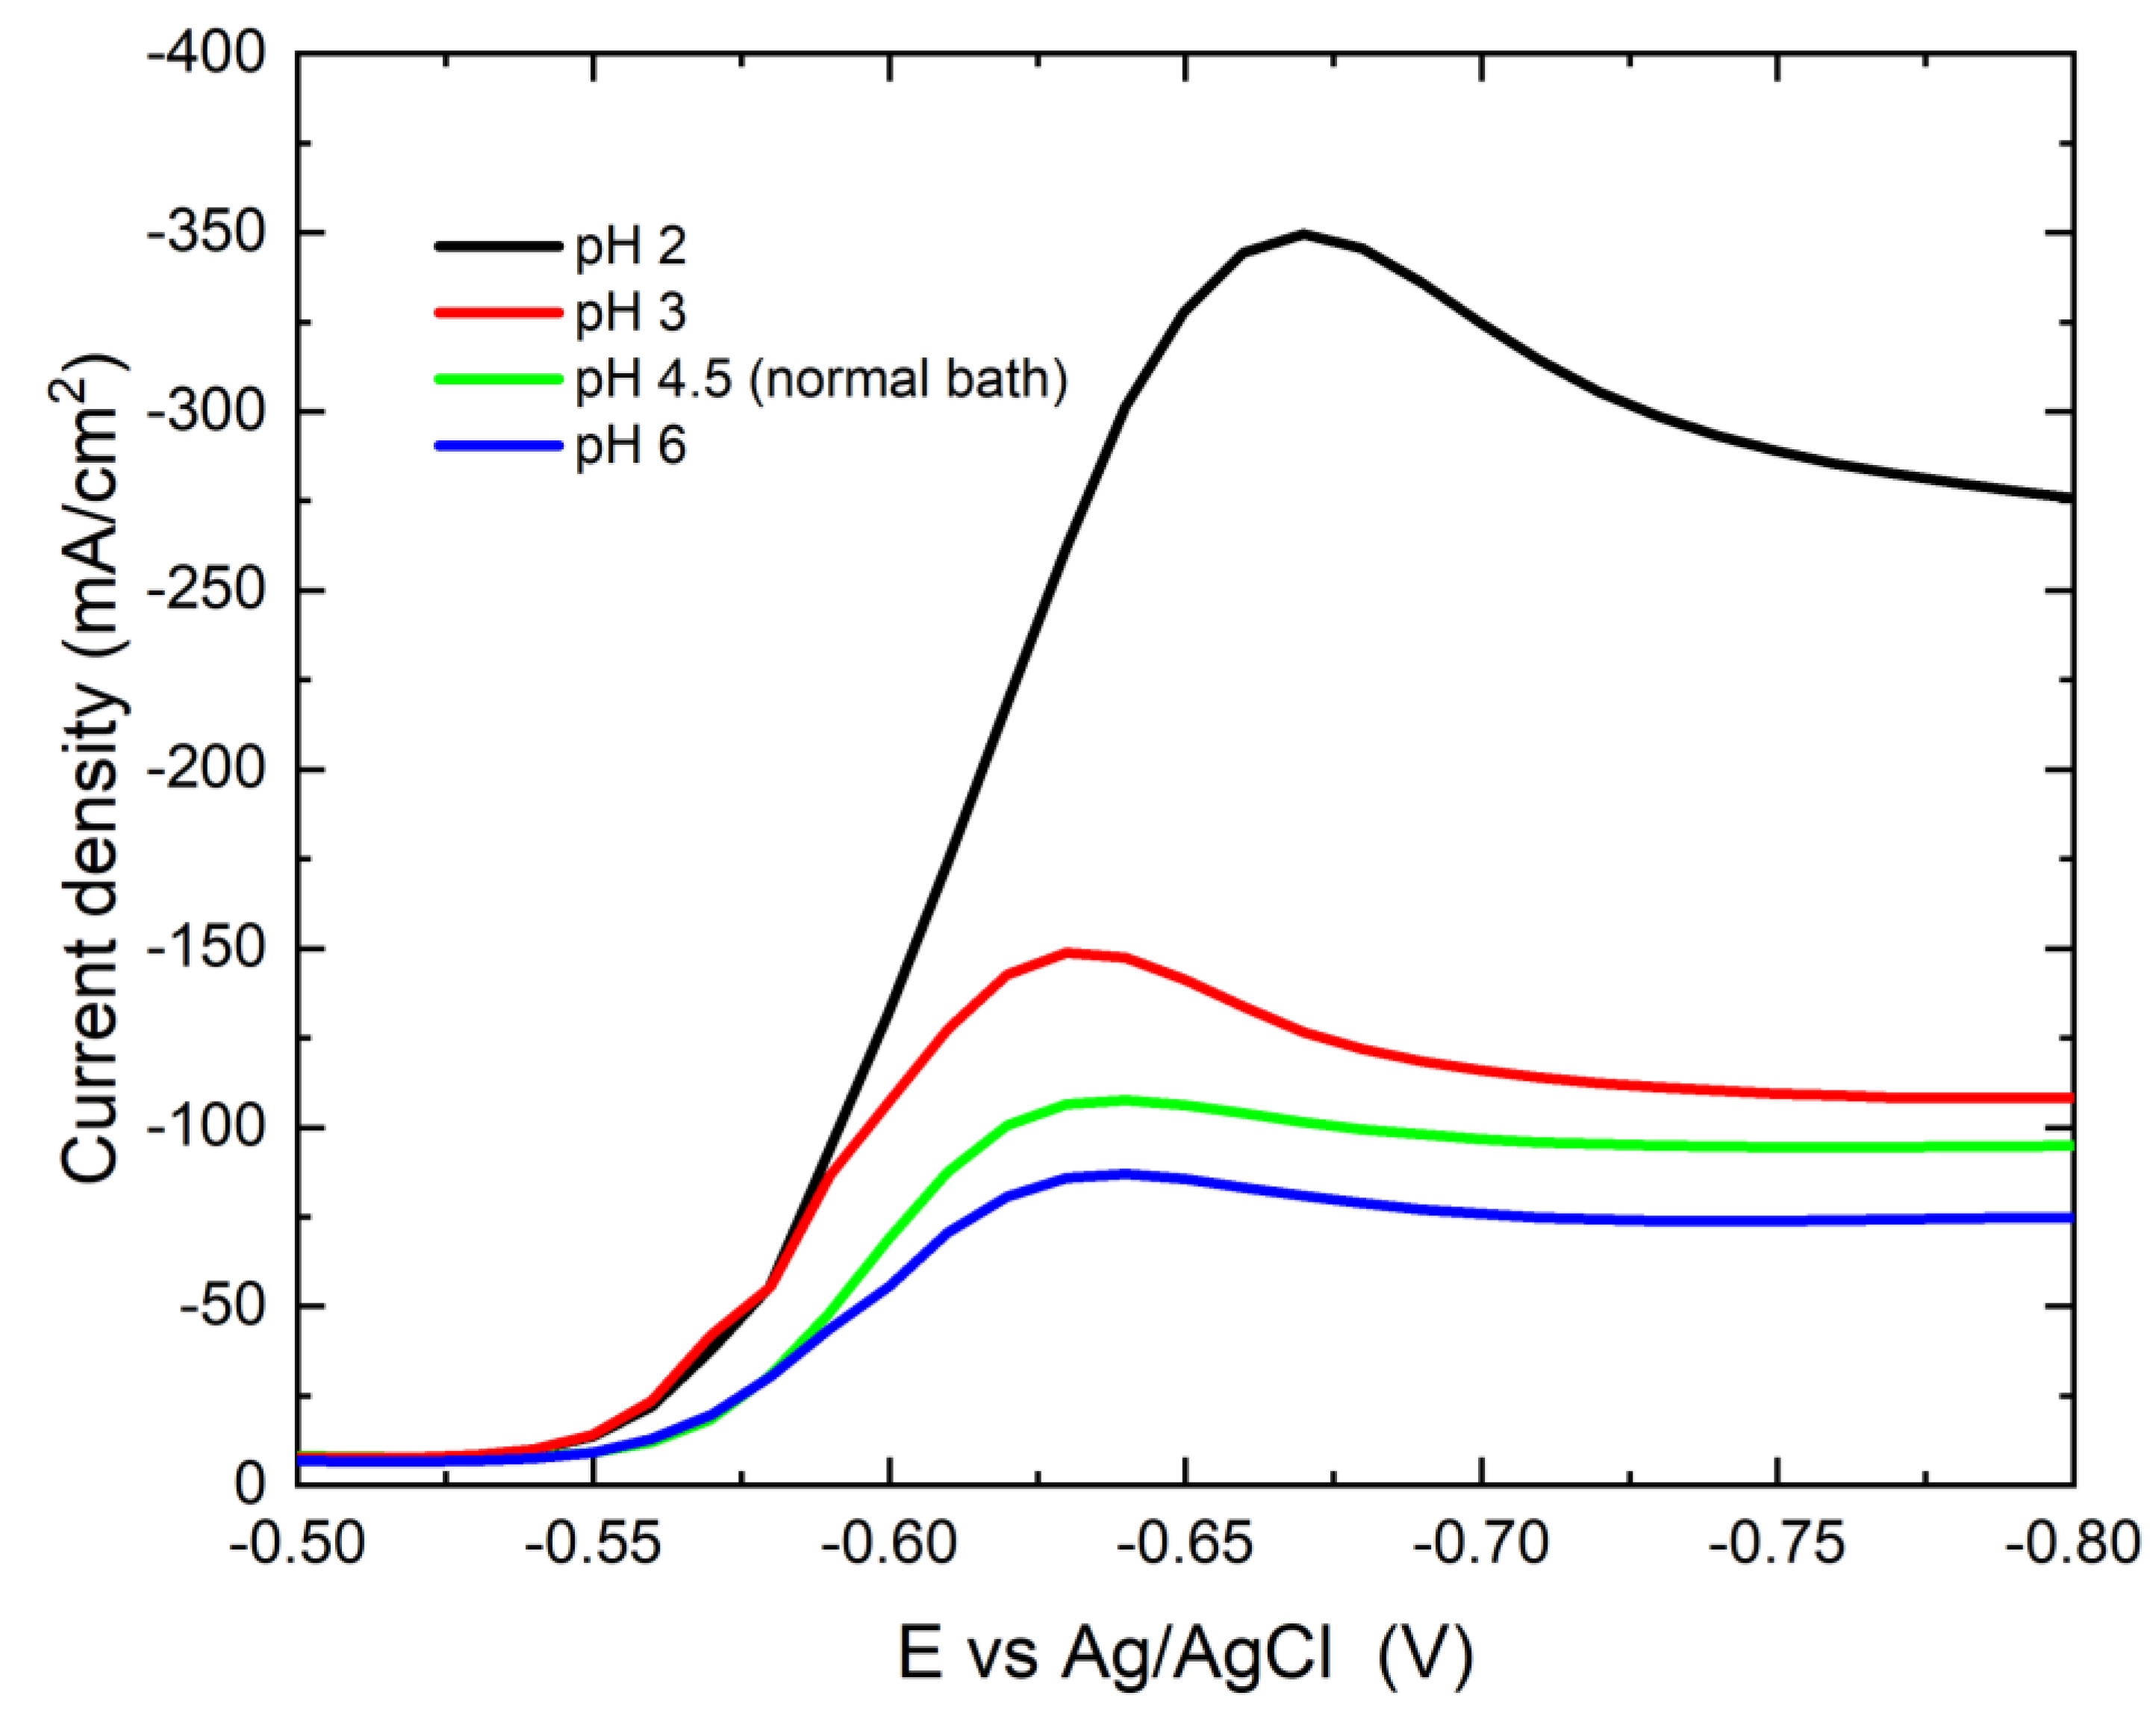
Figure 8.
Cathodic polarization curves during deposition of cobalt on Pt electrode from the modified watts bath at different temperatures.
Figure 8.
Cathodic polarization curves during deposition of cobalt on Pt electrode from the modified watts bath at different temperatures.
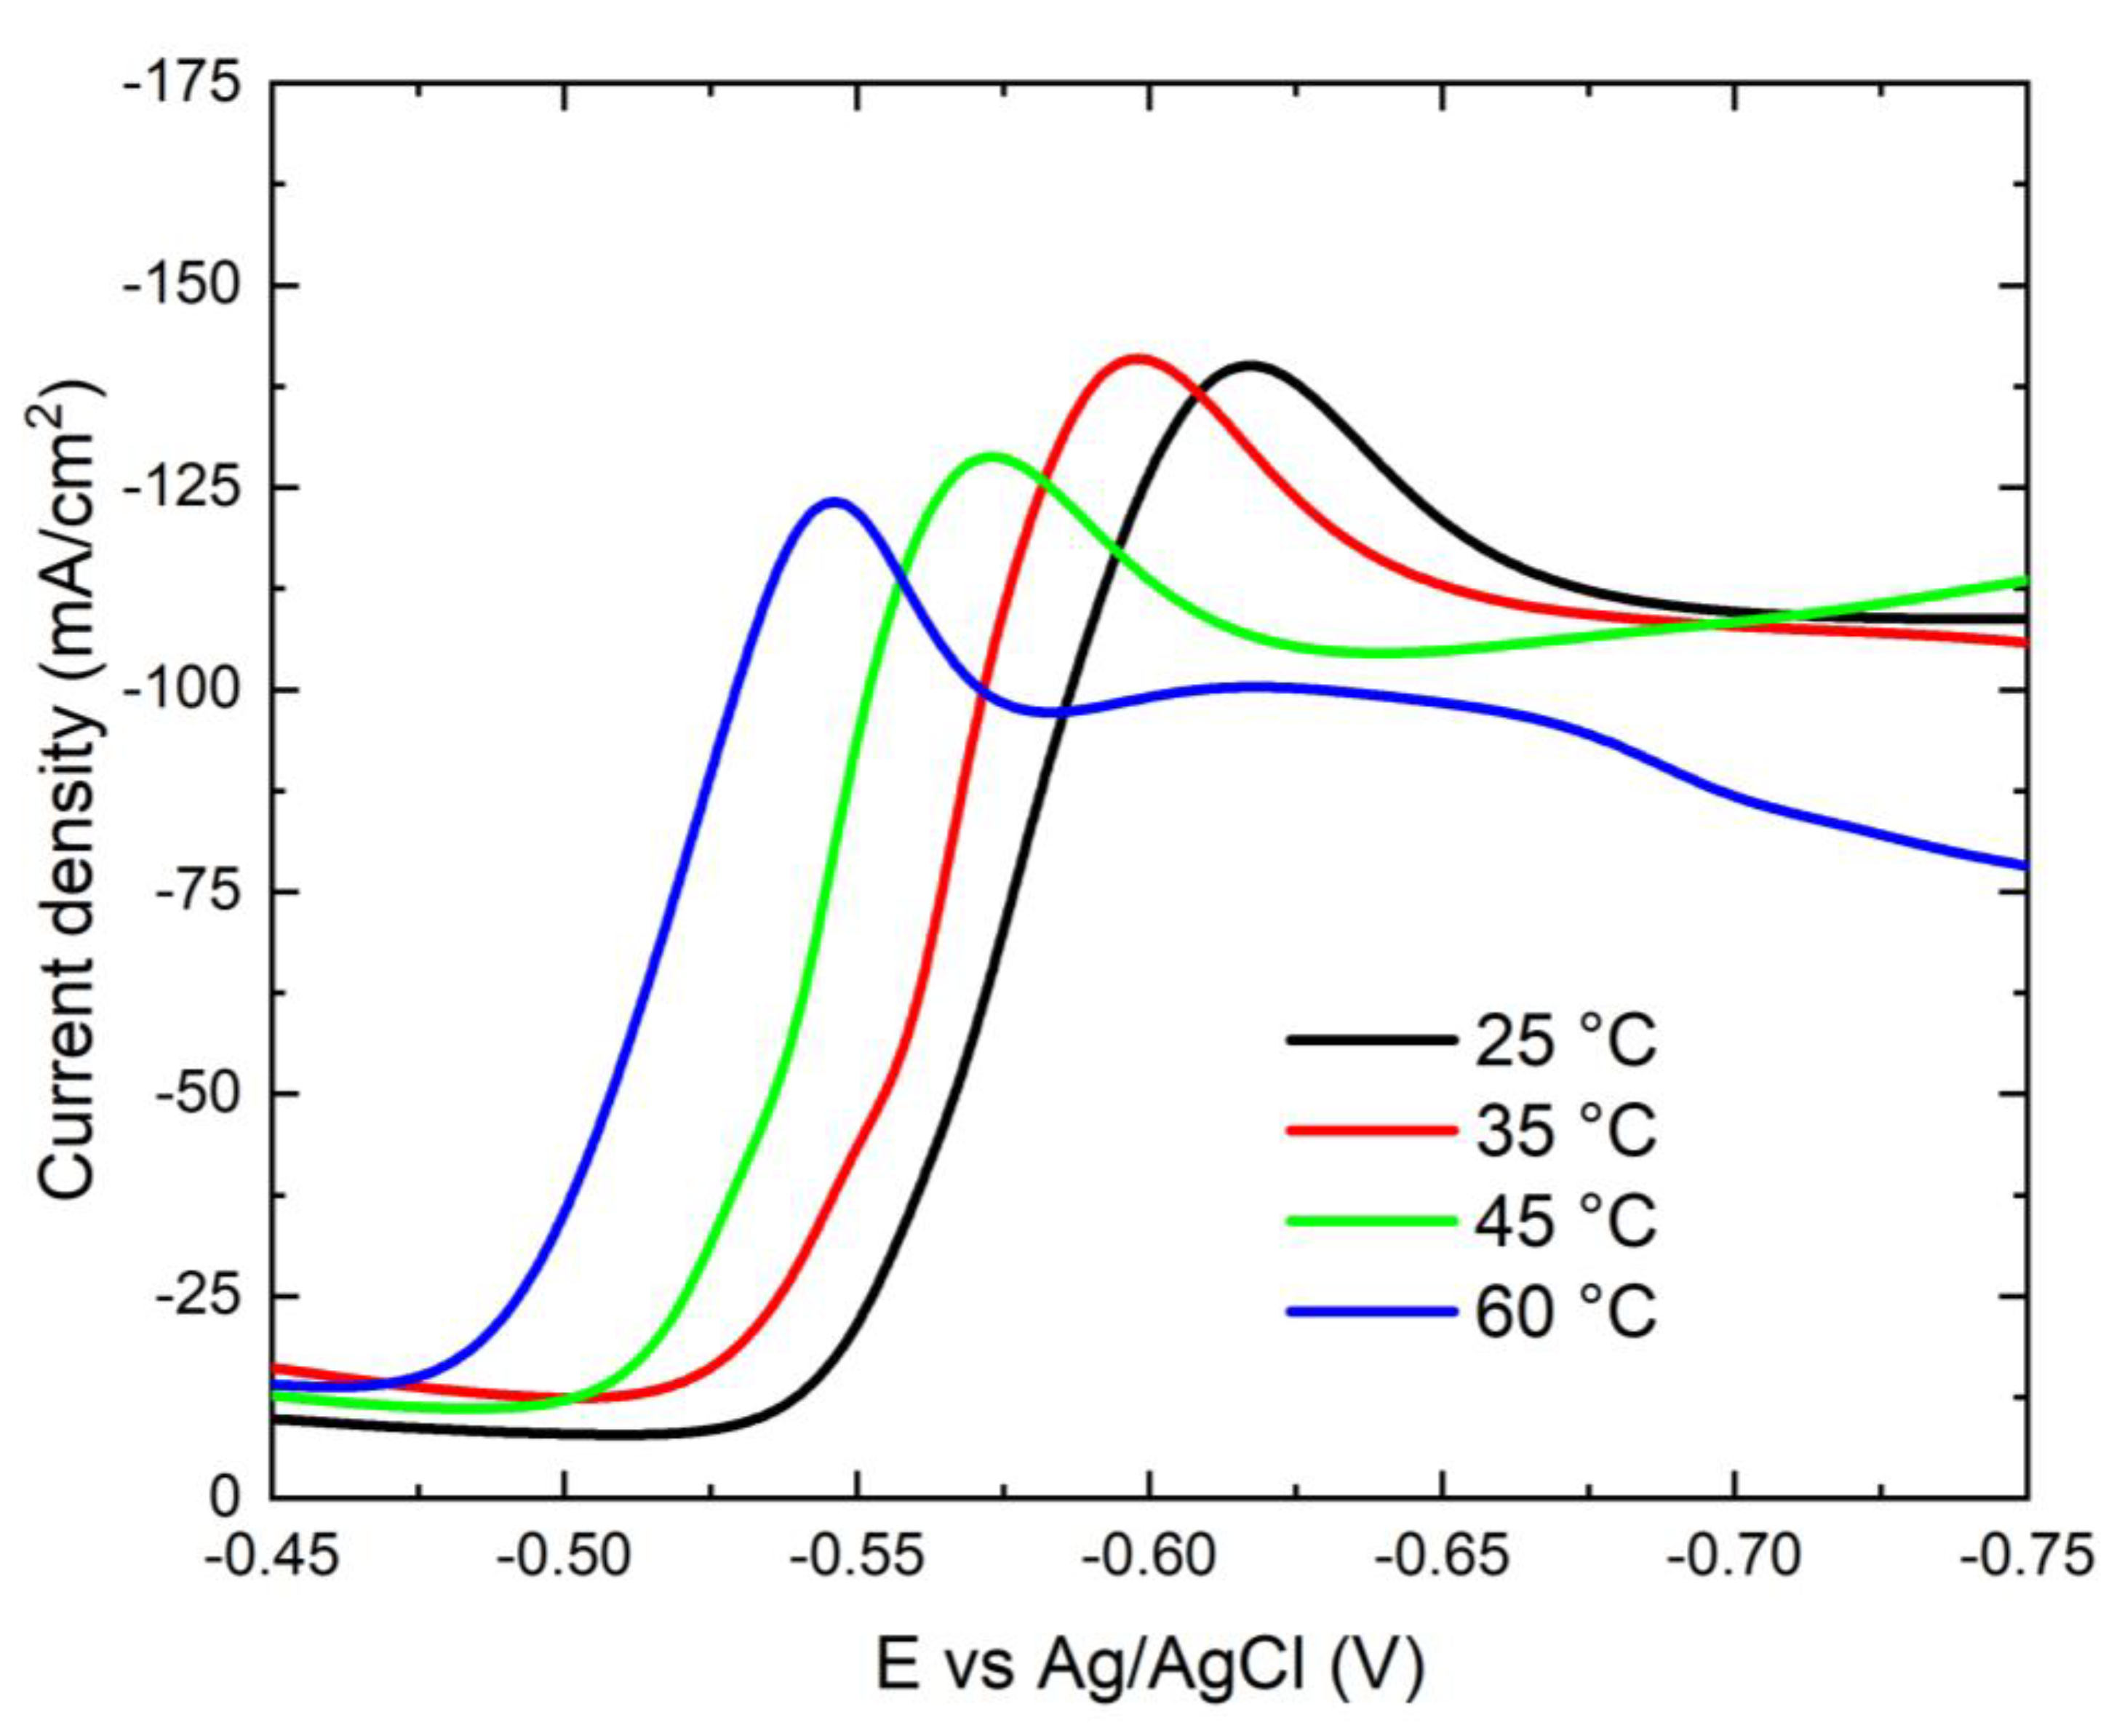
Figure 9.
Potentiostatic current-time transient curves for deposition of cobalt on Pt electrode from the modified Watts bath at different potentials.
Figure 9.
Potentiostatic current-time transient curves for deposition of cobalt on Pt electrode from the modified Watts bath at different potentials.
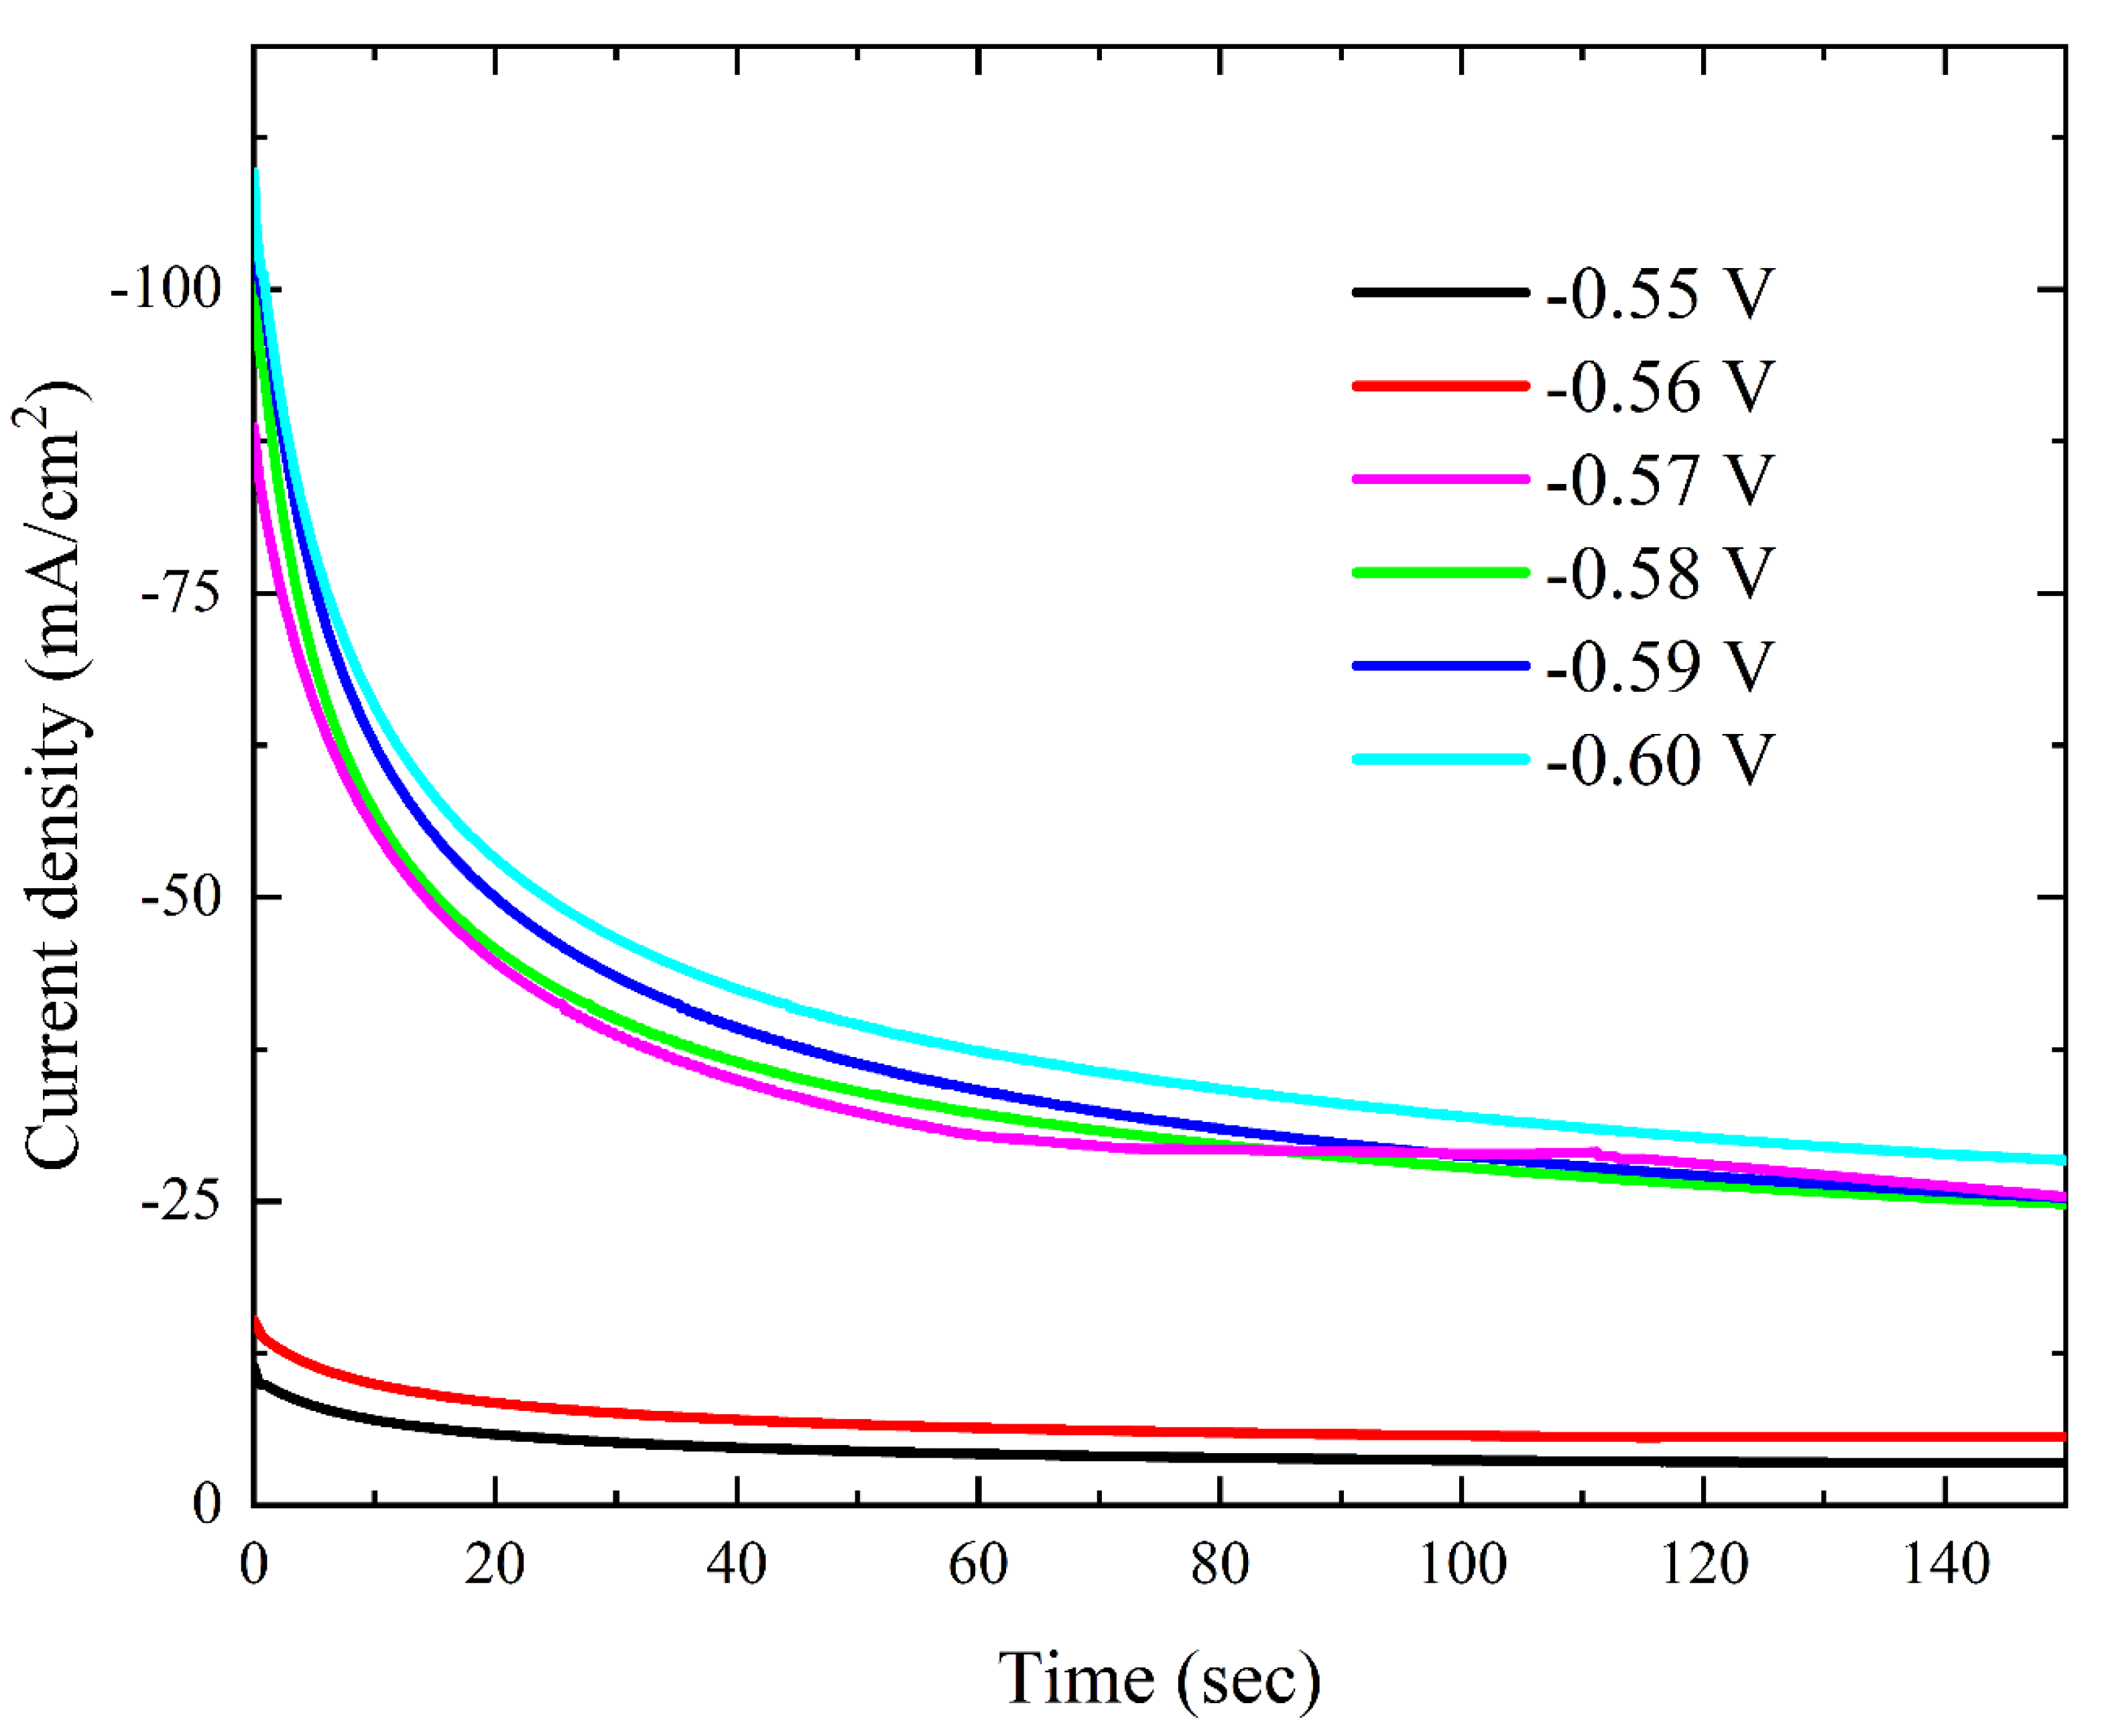
Figure 10.
Linear relationship between - i1/2 and t during deposition of cobalt oxide on Pt from the Watts bath with 0.15M KNO3 at different deposition potentials.
Figure 10.
Linear relationship between - i1/2 and t during deposition of cobalt oxide on Pt from the Watts bath with 0.15M KNO3 at different deposition potentials.
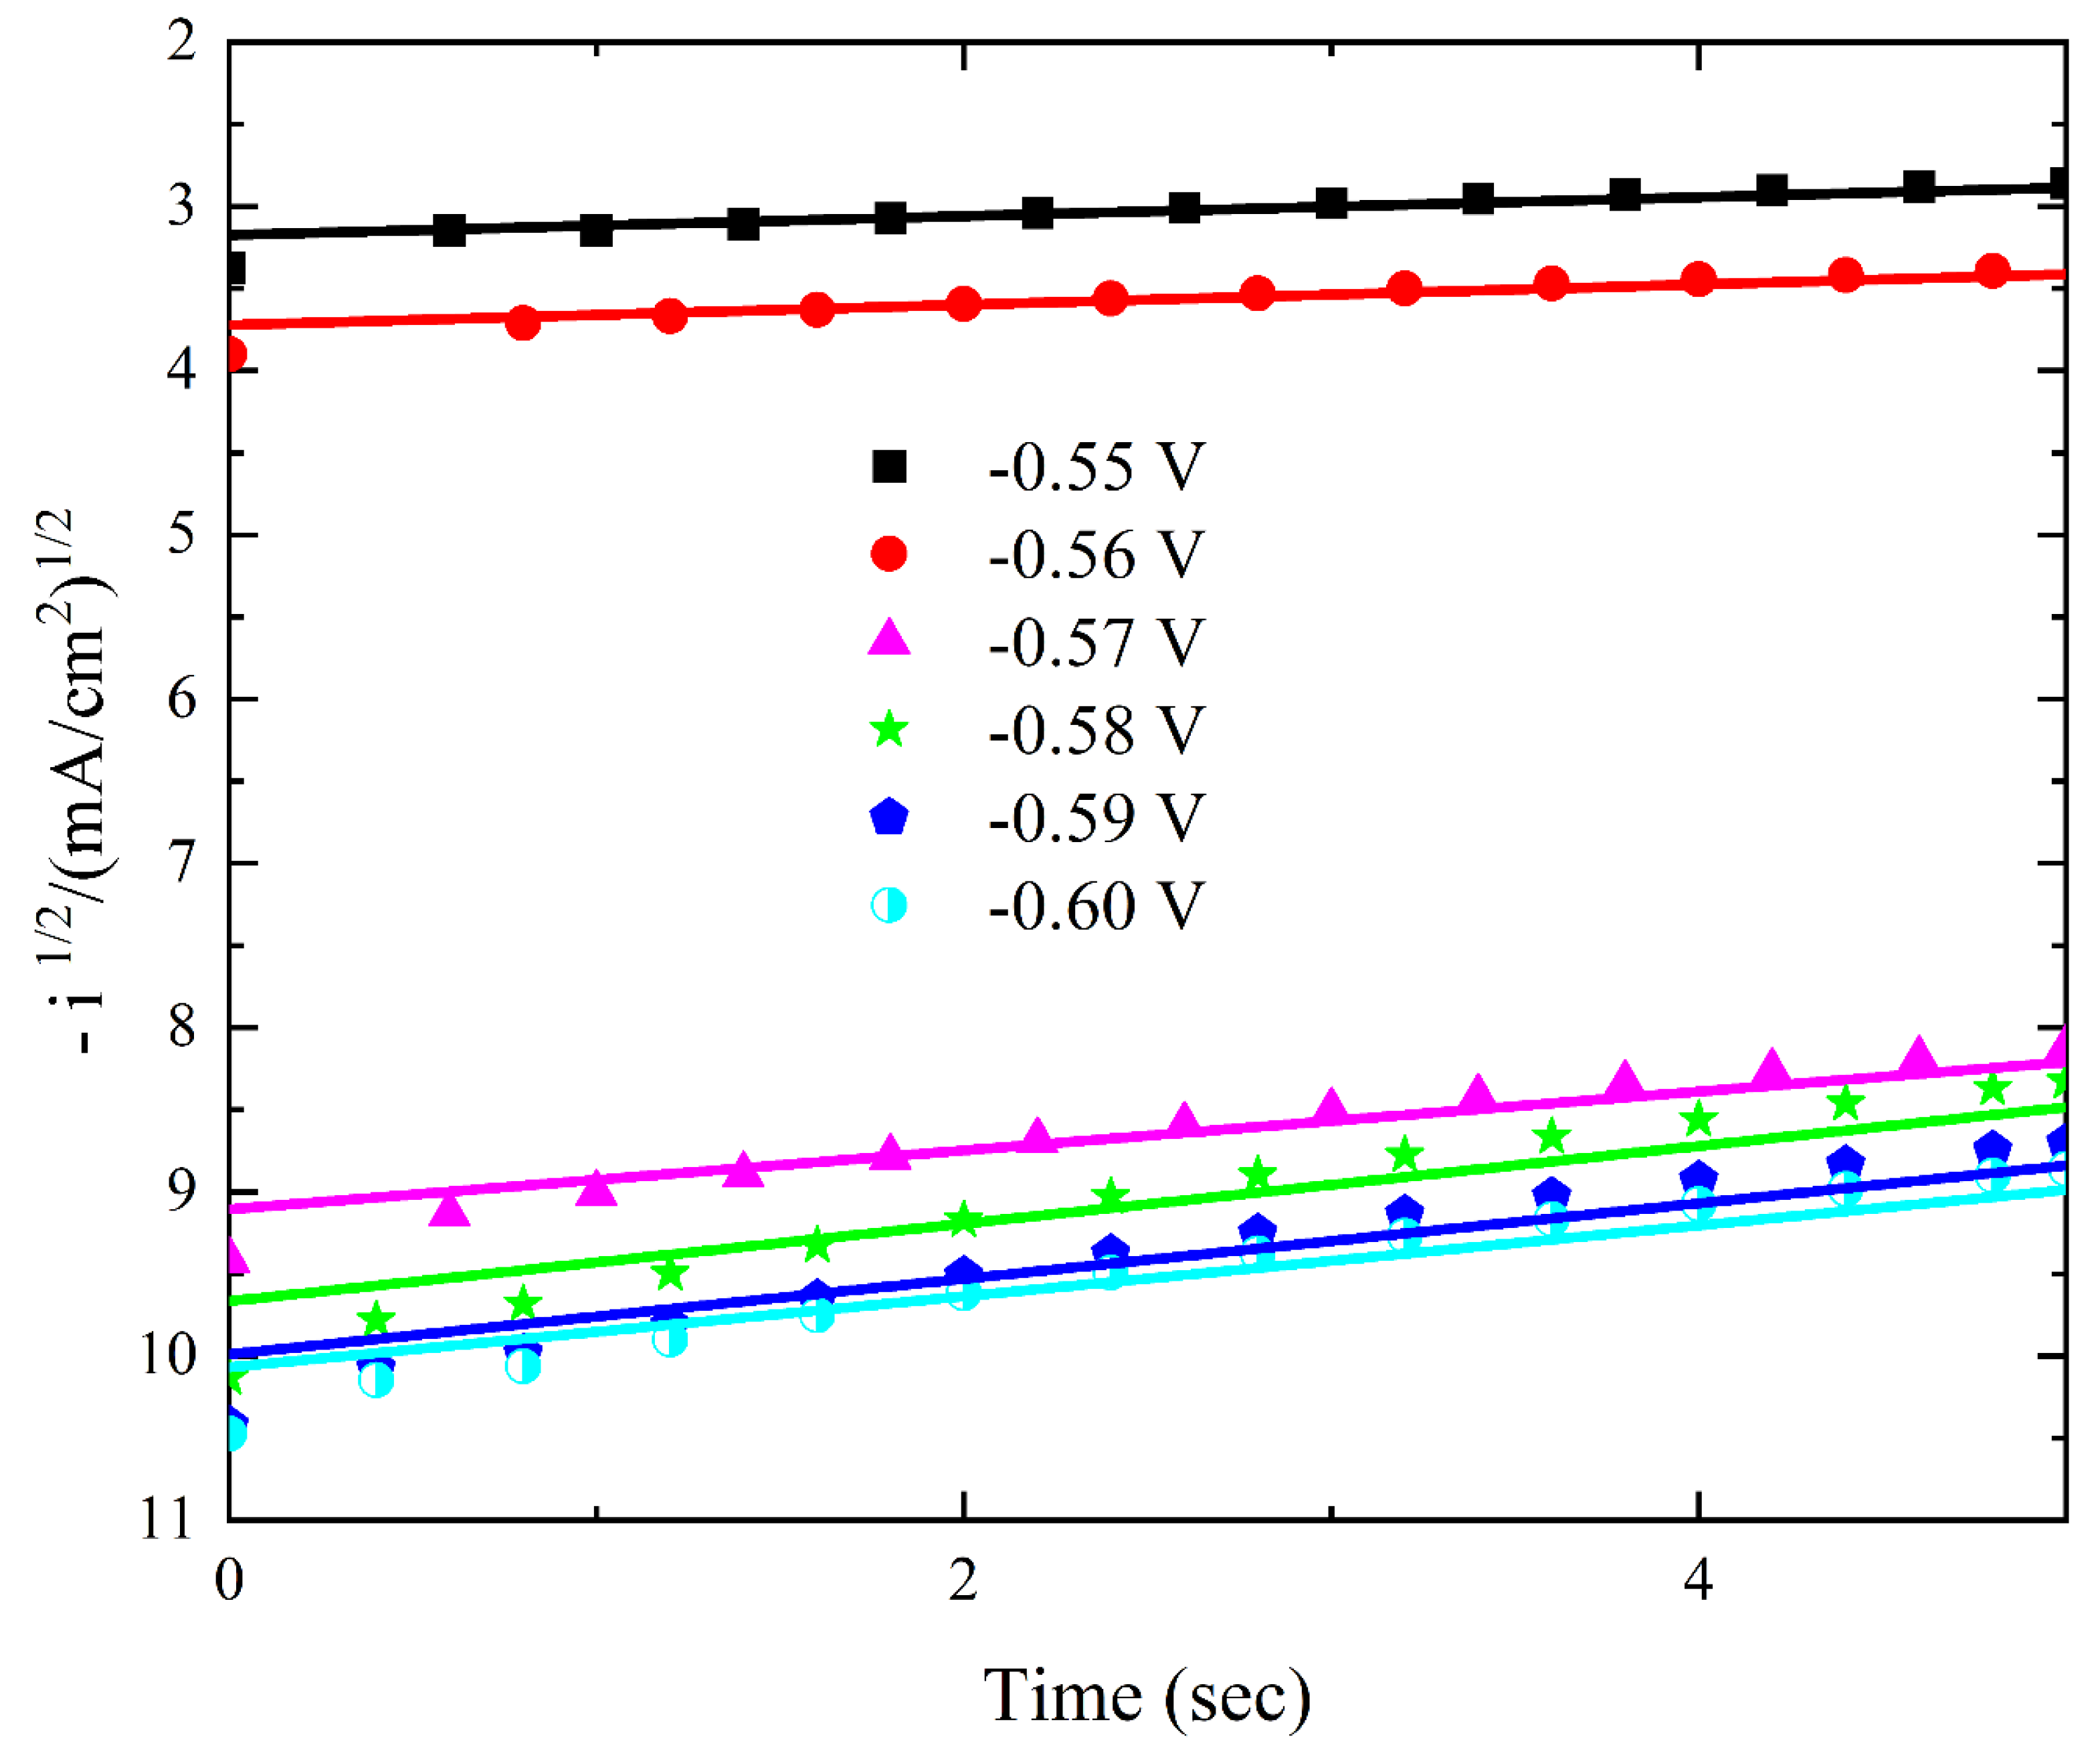
Figure 11.
Inhibition zone on an agar plate for Co-25 oC (a” -ve” and d”+ve”), Co-400oC (b” -ve” and e”+ve”) and Co-800 oC (c” -ve” and f” +ve”).
Figure 11.
Inhibition zone on an agar plate for Co-25 oC (a” -ve” and d”+ve”), Co-400oC (b” -ve” and e”+ve”) and Co-800 oC (c” -ve” and f” +ve”).
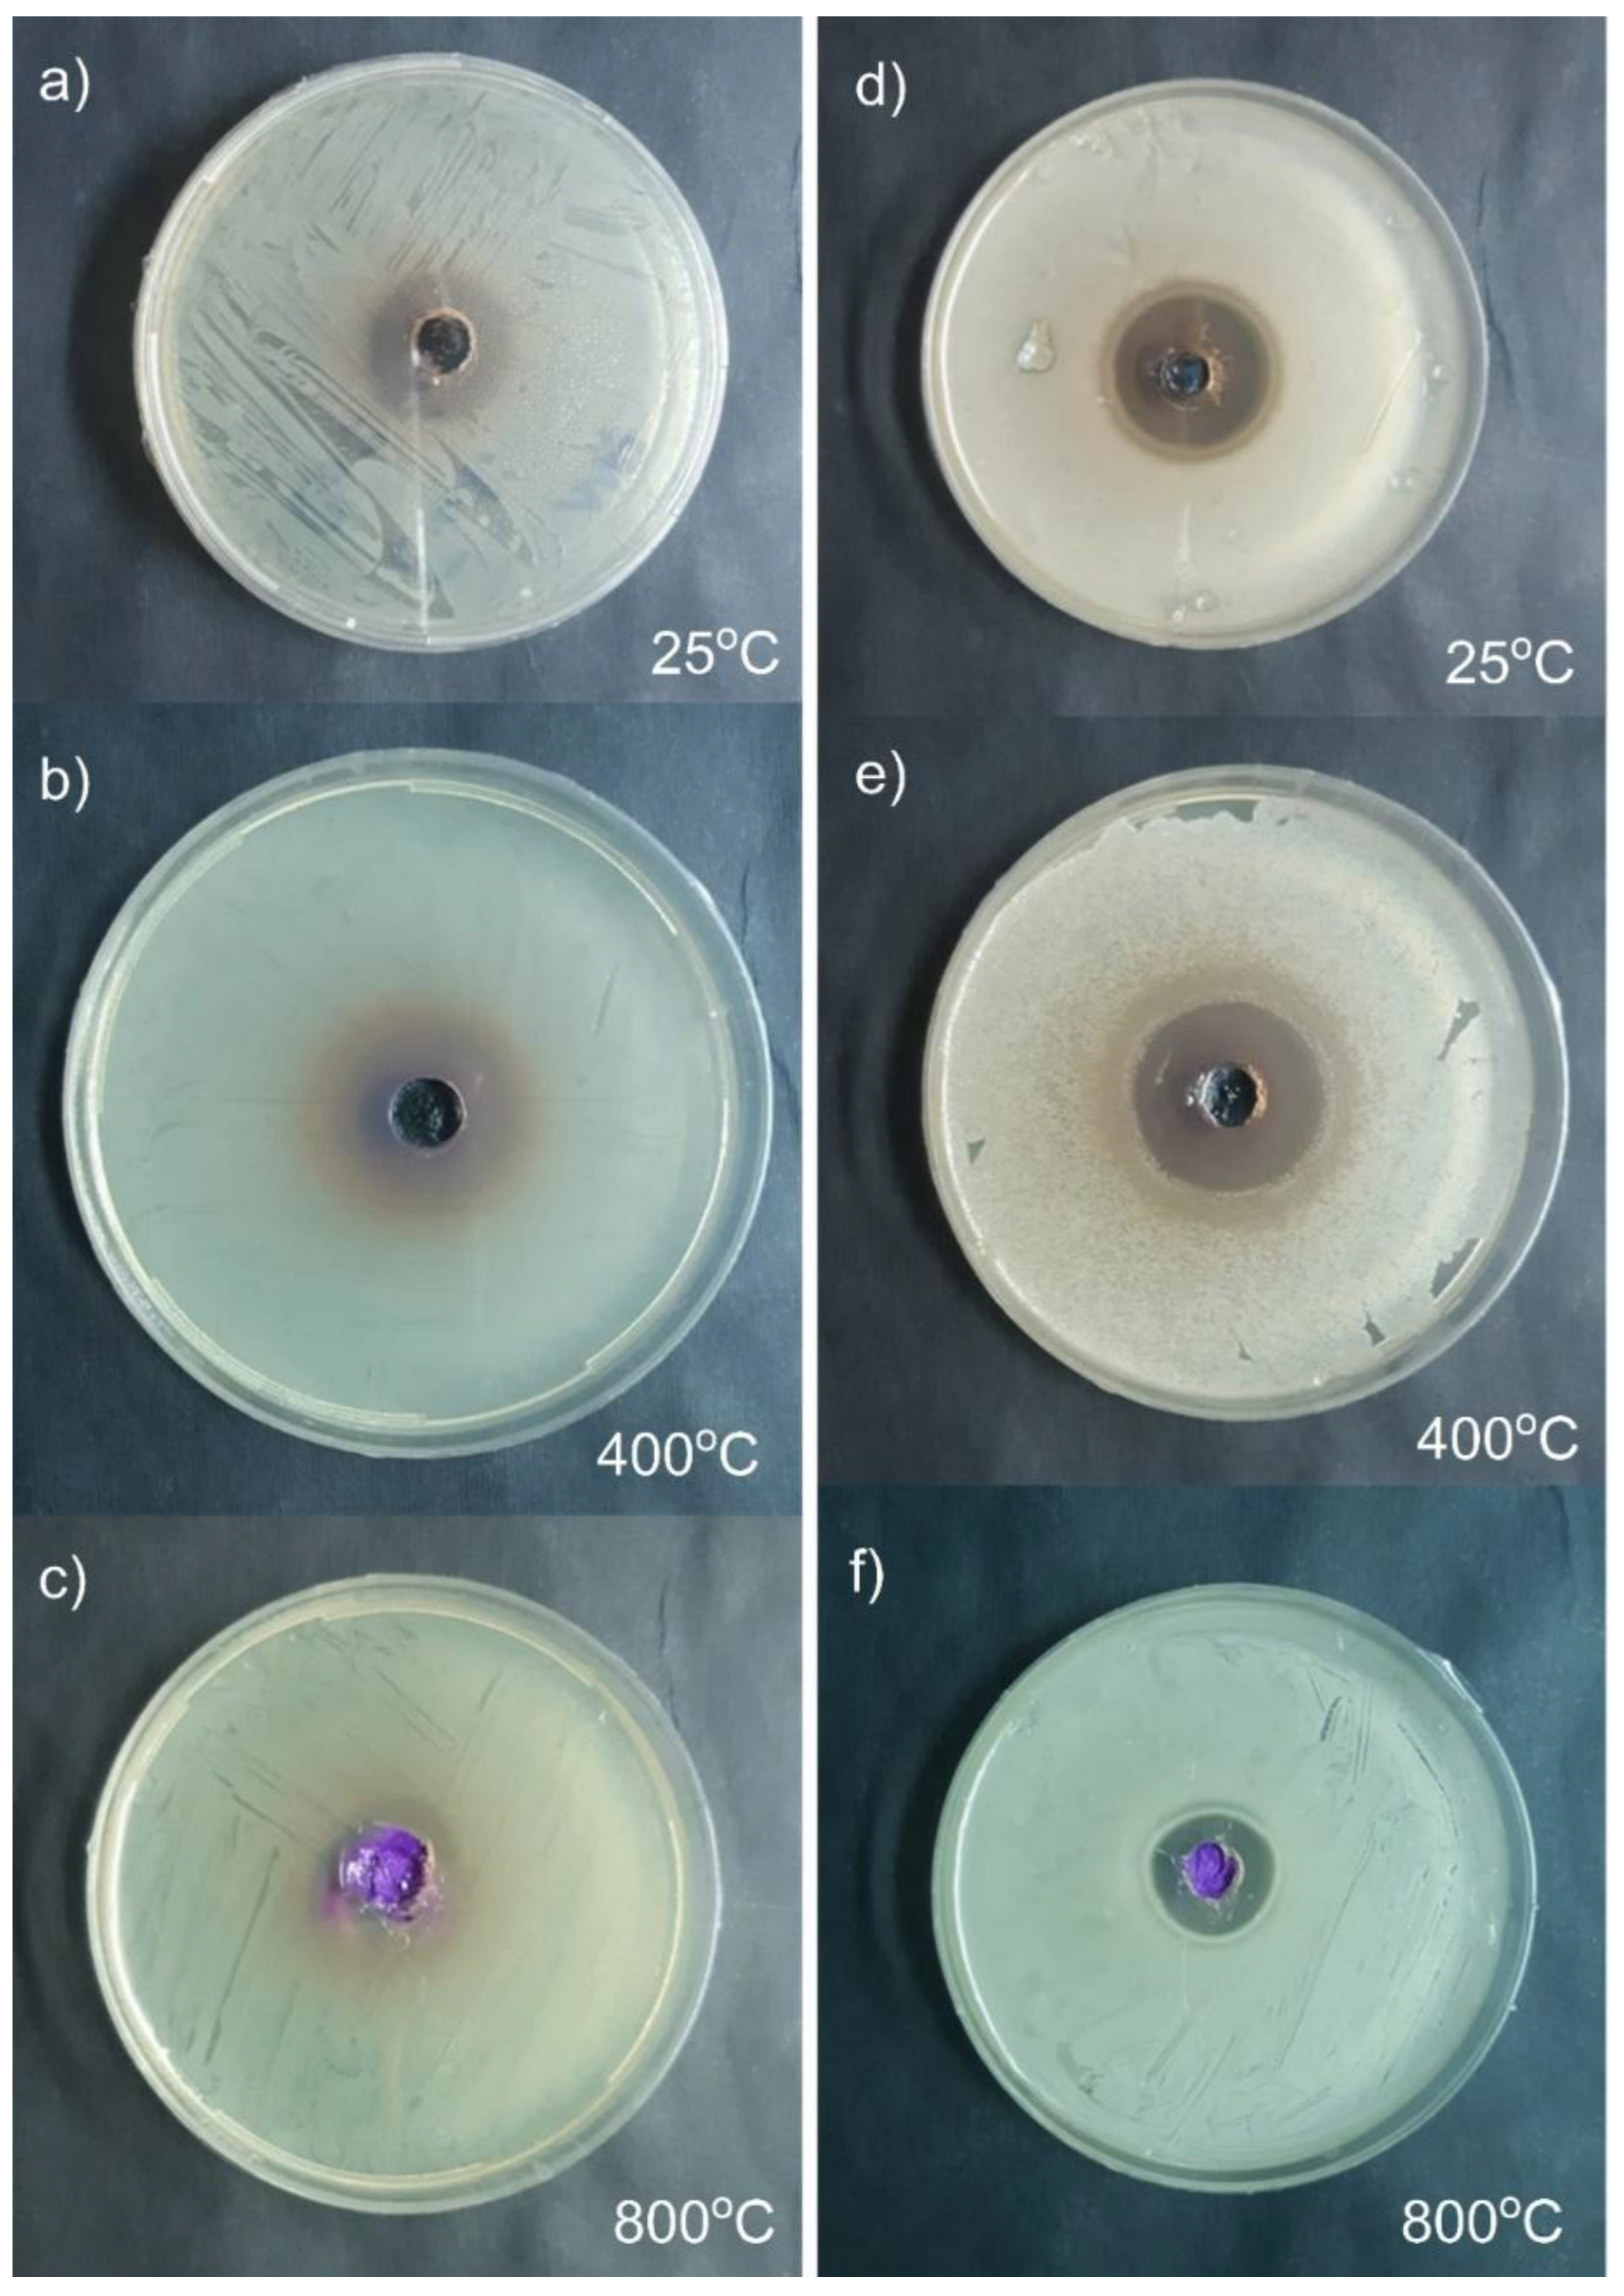

Table 1.
Surface area and pore size analysis of the prepared cobalt oxide samples.
| Sample | Specific surface area (SBET) | Average pore width |
Total pore volume (Vp) |
| m2 g-1 | nm | cm3 g-1 | |
| Co-25 | 4.9892 | 45.589 | 0.056863 |
| Co-400 | 8.0094 | 40.49 | 0.081076 |
| Co-800 | 0.81478 | 77.912 | 0.01587 |
Table 2.
The inhibition zone diameters of samples prepared at different annealing temperatures.
| ID Sample | Inhibition zone (cm) on agar plate | ||
| Gm (-ve) bacteria Esherichia coli ATCC25922 | Gm (+ve) bacteria Staphylococcus aureus ATCC 6538 |
Aspergillus niger MT103092 |
|
| 25 oC | 2.3 | 2.5 | 2.7 |
| 400 oC | 2.5 | 2.8 | 2.8 |
| 800 oC | 2.0 | 1.8 | 1.6 |
Disclaimer/Publisher’s Note: The statements, opinions and data contained in all publications are solely those of the individual author(s) and contributor(s) and not of MDPI and/or the editor(s). MDPI and/or the editor(s) disclaim responsibility for any injury to people or property resulting from any ideas, methods, instructions or products referred to in the content. |
© 2025 by the authors. Licensee MDPI, Basel, Switzerland. This article is an open access article distributed under the terms and conditions of the Creative Commons Attribution (CC BY) license (http://creativecommons.org/licenses/by/4.0/).
Copyright: This open access article is published under a Creative Commons CC BY 4.0 license, which permit the free download, distribution, and reuse, provided that the author and preprint are cited in any reuse.


