
Submitted:
07 April 2025
Posted:
08 April 2025
You are already at the latest version
Abstract
In practical machine learning (ML) applications, covariate shifts and dependencies can significantly impact model robustness and prediction quality, leading to performance degradation under distribution shifts. In industrial settings, it is crucial to account for covariates during the design of experiments to ensure reliable generalization. The presented dataset of undamaged and artificially damaged cylindrical roller bearings is designed to address the lack of data resources for targeting domain and distribution shifts in this field. The dataset considers multiple key covariates, including mounting position, load, and rotational speed. Each covariate consists of multiple levels optimized for group-based cross-validation. This allows the user to exclude specific groups in the training to validate and test the algorithm. Using this approach, algorithms can be evaluated for their robustness and the effect on the model caused by distribution shifts and their generalization capabilities under realistic conditions can be studied.
Keywords:
Machine Learning
; Robust Learning
; Domain Shift
; Bearing Dataset
1. Introduction
Roller bearings are widely used rotating machine elements that reduce friction and carry loads. Although bearings are considered robust and have long service life, incorrect usage can lead to unexpected bearing failure and, eventually, machine failure. Typical bearing failures are, e.g., wear, corrosion, or fracture and cracking [1]. Especially pitting corrosion, which forms small hole-like corrosion pits in the metal, can cause severe damage to the bearing and result in failure [2]. To investigate those damage characteristics with machine learning (ML), multiple datasets are publicly available, e.g.:
- NASA bearing dataset [3]: The dataset contains acceleration measurements with four bearings that are stressed with a constant load until their wear limit.
- Paderborn University Bearing Dataset [4]: The dataset contains acceleration, rotational speed, load, and torque measurements of 26 damaged (artificial and real) and six undamaged bearings in four scenarios.
- Case Western Reserve University Bearing Dataset [5]: The dataset contains measurements of an accelerometer for artificially damaged bearings with different damage sizes and loads.
The datasets mentioned above incorporate covariates to a limited extent, such as load or rotational speed. In real-world scenarios, several additional covariates may occur simultaneously and interact with each other. As a result, measurements could be inadequate for developing robust ML models. Therefore, these interactions must be taken into account during data collection. This justifies the need for a new dataset with a focus on covariates during the measurement process. The bearing dataset presented in this study consists of acceleration measurements of three cylindrical roller bearings (B10, B20, B30) successively measured on a testbed. Each bearing was first measured undamaged and later artificially damaged with a milling cutter to simulate pitting corrosion.
2. Methods
2.1. Bearing
Figure 1 shows an assembled cylindrical roller bearing of type NU206-E-XL-TVP2 (a), as investigated in the experiments, along with its disassembled components (b).
The inner ring has no ribs to secure the rolling element so that it can be easily separated. This approach enables the introduction of artificial damage to the inner ring without causing additional damage during the bearing’s mounting and dismounting. The corresponding basic frequency factors can be found in Table 1 [6].
Figure 2 presents microscope images of the artificial damages applied to bearings B10, B20, and B30, along with their dimensions, which are also included in the dataset.
In addition to the NU206-E-XL-TVP2, which is used as a loose bearing in the setup, a 1206-TVH is employed as a fixed bearing to compensate for axial forces and minor shaft misalignments. The NU207-E-XL-TVP2, another loose bearing, is used to apply the pulling force to the rotating shaft. All relevant frequency factors for the 1206-TVH and the NU207-E-XL-TVP2 are provided in Table A1.
2.2. Testbed
Figure 3 (a) shows the mechanical setup of the testbed. The corresponding components of the testbed (I. Mechanical System) and the data acquisition (II. Data Acquisition System) can be found in Table 2.
In the testbed, a servo motor (indicated in blue in Figure 3) drives two shafts that are connected by two couplings (yellow). Each shaft is supported by one fixed and one loose bearing located in the bearing housings (green). Two Force Introductions were constructed to apply an external force on the bearings. Figure 3 (b) shows an enlarged view of one Force Introduction with the components force-application-nut and locking-nut (light-green), force sensor (red), and bearing housing (green). The Force Introduction applies a pulling force on one shaft at a time by tightening the force-application-nut. Using a pulling force improves the signal path of the resulting vibrations to the accelerometer as the sensor is mounted on the top of the bearing housing [7].
The design of the testbed allows mounting the bearing in other bearing housings without disassembling it from the shaft (Figure 4) as disassembling and reassembling could influence the data.
To change the bearing position, the covers of the bearing houses and the couplings are removed. Next, the shaft with the mounted bearings is lifted out of the bearing housings and rotated by 180° so that the bearing is switched from Pos. A to Pos. B. The two shafts have the same dimensions, so they can be exchanged. This allows a bearing to be mounted in all four positions without dismounting it from the shaft. Note that the direction of rotation of the shaft is constant.
Before the experiments, the testbed was aligned using a Fixturlaser EVO (see figlaseralign). The resulting measurements are presented in tabtestbedalignment.
2.3. Identification of Influencing Factors
To identify relevant influencing factors on the data, a cause-effect graph [8] was used (see Figure 5).
All identified influences were further assigned to the groups constant, variable, and covariates.
Constant influences (grey) are maintained constant throughout the measurements. These include the bearing type (B1) and its lubrication (B7, defined amount of lubrication), the sensor type (S1) and its performance (S2), the data acquisition (D1–D4), and the tools (W2) used by the workers. To ensure that the influence of the tools remains constant, specific torque wrenches with preset torque were used for each type of screw.
Variable influences (blue) are covariates varied in a controlled manner during the experiment. In this study, the load on the bearing (B4), its rotational speed (B5), and its mounting position (S4) were varied. For the variable influences Load (B4) and Rotational Speed (B5), Latin Hypercube Sampling [9] was used to determine the levels and their order in the design of experiments (DoE), ensuring well-distributed coverage while avoiding temporal correlation. The range of these values was determined based on the maximum values provided in the manufacturer’s specifications, including a safety factor of 2. For rotational speed, the maximum was limited by the coupling and set to 1000 rpm, while the maximum load was restricted by the fixed bearing (1206-TVH) and set to 3700 N. Note that all bearings, especially the loose bearing (NU206-E-XL-TVP2), are designed to handle higher loads and are intentionally oversized to minimize wear effects, which could influence the results during the course of the experiments.
Covariates (orange) can only be tracked or influenced with extended effort. Manufacturing tolerances (B2) are considered by repeating the experiment with three different bearings. Bearing condition (B3) is addressed by using new bearings and measuring the undamaged condition before introducing any damage. The mounting of the sensor (S4) and the bearing (B6) is managed using the concept of Runs. In each run, the sensor is mounted three times in the same configuration, following the order: Run 1 (Positions A, B, C, D), Run 2 (Positions A, B, C, D), and Run 3 (Positions A, B, C, D). The influence of the worker’s skill was minimized through training and monitored via pictures of the configuration after modifications. Environmental influences (E1–E4) were reduced by conducting the measurements in a temperature-controlled laboratory, while temperature and humidity were recorded.
Figure 6 illustrates the variation of covariates in the DoE.
3. Data Description
The dataset is published on Zenodo [10] and consists of the three folders Data, Metadata and +functions as well as the two files info.mat and readdata.m. Figure 7 provides an overview of the dataset structure.
The Data folder contains 1151 measurement files, where each file contains the measurement of a three-axis accelerometer (20 kHz, 60 s) of a specific combination of covariates, which is named according to the syntax DamageCase_Bearing_Damage_Run_Position_Force_Speed_Worker, like e.g. Inner_Ring_B10_DSmall_R1_PA_F0_S706_W2.mat. Originally, 1152 combinations were planned, but one measurement file is missing due to corruption. The missing combination corresponds to Bearing 30, Damage Case 0, Run 1, Position B, Force Level 1, and Speed 392. In addition, the folders include images showing the testbed configuration and the dimensions of the damage. The folder structure reflects the testbed’s specific configurations. Measurement files are therefore sorted according to bearing number (B10, B20, B30), damage size (DNoD for no damage, DSmall for small damage), run (R1, R2, R3), and position (PA, PB, PC, PD).
The folder Metadata contains the calibration certificate of the accelerometer, the testbed’s alignment report, a text file listing all deviations from the initial DoE, and a text file containing further information about the warm-up phases of the testbed.
The file info.mat contains all the parameters recorded during the measurements. Table 3 lists the parameters of the measurements. Parameters 1–6 represent the controlled variables, while 7–12 correspond to the tracked covariates.
In addition, this file contains the following information:
- Timestamp: The measurement start time is automatically recorded using the internal clock of the data acquisition system (NI cRIO 9040).
- Measurement day and batches: One measurement day consists of 48 batches. Each batch consists of all speed cycles for a given configuration.
- Damage dimensions: Each damage was measured in two dimensions using a microscope. The resulting images are included in the corresponding folders and shown in figdamages. The info.mat contains the dimensions as Damage_width [mm] and Damage_length [mm].
- Filename: Name of the measurement file with the corresponding folder path.
The file readdata.mat is designed to load the data into MATLAB and internally uses functions from the +functions folder. The user can load all data or selectively load measurements with specific annotation e.g., only measurements from position Pos. A and force level F0. Furthermore, the user can reshape (split) measurements into segments. For example, if split into eight sub-measurements, each segment will contain at least 10 rotations [7].
After executing the script, the user receives the file dataset.mat with the variables data and target. The variable data is a 1x3 cell containing the measurements of the three axis X ({1,3}), Y ({2,3}) and Z ({3,3}), where the measurements are stored row-wise. The variable trainTarget contains the corresponding annotation (metadata) of the measurements in data.
4. User Notes
4.1. Validation
Validation of ML models is a crucial step to assess their generalization ability and prevent overfitting [11]. Leave-One-Group-Out cross-validation (LOGOCV) is considered a more realistic scenario than methods such as k-fold cross-validation [12].
The presented bearing dataset is designed explicitly for LOGOCV. Figure 8 illustrates how LOGOCV can be applied to the dataset by excluding certain bearing positions. This approach reflects real-world scenarios where the ML model should perform robustly regardless of the bearing’s mounting position.
In the example, two bearing positions are used for training, while a third, "unknown" position is used for validation in each fold of the LOGOCV. Subsequently, the model is tested on a fourth position that is entirely excluded from the training process. The resulting accuracy serves as an indicator of the ML model’s robustness to new mounting positions. Furthermore, other covariates such as load and speed levels, measurements from different bearings, or combinations of covariates can also be employed in a LOGOCV scenario.
4.2. Assembly Errors
During the measurements, certain assembly errors occurred. By using the pictures of the configuration, these assembly errors (cf. Table 3) could be identified. Figure 9 shows e.g. a configuration where the coupling is off-center.
Users can interpret these pictures as follows:
- The shaft with the bearing to be measured is indicated with a red off-centered ring (purple). A black off-centered ring (green) on the second shaft indicates the position of the fixed bearing. Due to the colored rings, the positions of all bearings can be tracked.
- The mounting of the sensor (blue) can be tracked by comparing the mounted position with the label in the dataset. In some measurements, the sensor is mounted upside down, which can be seen as a black surface on the top of the sensor (indicated in the data as sensor_flipped).
- The coupling in the middle (red) can be controlled on a centered mounting. Furthermore, it can be controlled if the coupling itself is mounted correctly, e.g., through the gap dimensions. Each side of the coupling has a corresponding engraving "R" for the right side and "L" for the left side, which are not visible in most of the pictures due to the camera’s low resolution. The coupling on the left side is always mounted on the motor side (screws covered), and only the shaft side is dismounted.
- The bearing housings have an engraving (e.g., A for Pos. A) on the cover and the body to check that the covers are mounted on the correct body in the correct orientation.
All screws that are not used to change the testbed configuration are covered (red tape).
4.3. Limitations
The following limitations apply to the bearing dataset:
- Despite numerous countermeasures, such as employee training, multiple assembly errors occurred during the measurements that were not part of the DoE. These assembly errors did not influence the function of the testbed but might cause changes in the data distribution. Therefore, they are transparently labeled in the data. As assembly errors also occur in real applications, users can try to identify those errors with their ML model as well and investigate their influence on the data.
- The damages on the inner ring of the bearing are artificial, meaning that the ML model is only valid for this specific error type.
5. Conclusions
The presented bearing dataset focuses on the variation of multiple covariates and allows users to evaluate their ML model in realistic validation scenarios to test their robustness. Assembly errors that occurred during the measurements are well documented, and their influence on the data can also be investigated. A first investigation of the bearing dataset [13] was able to detect bearing damage on position excluded from the training data (LOGOCV) with a validation error of 4.3 % (969 rpm, F1-F3).
Further studies can investigate the combination of multiple covariates in the LOGOCV as well as the transferability of ML-Models.
Author Contributions
Conceptualization, C.S., P.G., and Y.R.; methodology, C.S., Y.R., and P.G.; software, C.S.; validation, C.S., and P.G.; formal analysis, P.G.; investigation, C.S., and P.G.; resources, C.S., J.S., and P.G.; data curation, C.S., and P.G.; writing—original draft preparation, C.S.; writing—review and editing, P.G., J.S., Y.R., and A.S.; visualization, C.S. and P.G.; supervision, A.S.; project administration, A.S.; funding acquisition, A.S. All authors have read and agreed to the published version of the manuscript.
Funding
This research was performed in the context of project VProSaar (“Verteilte Produktion für die saarländische Automotivindustrie: Nachhaltig, Vernetzt, Resilient ”) carried out at the Centre for Mechatronics and Automation Technology gGmbH and funded by the Ministry of Economic Affairs, Innovation, Digital and Energy (MWIDE) and the European Fonds for Regional Development (EFRE).
Data Availability Statement
The dataset is available on Zenodo https://doi.org/10.5281/zenodo.11108503.
Acknowledgments
The authors sincerely thank Houssam El Moutaouakil for his valuable technical support during the measurements and Jannis Morsch for testing the dataset, providing insightful feedback on the paper and improving the source code. Furthermore, they would like to thank the research assistants Yage Zhang and Ali Ali Ahmad.
Conflicts of Interest
The authors declare no conflicts of interest.
Appendix A [
Appendix]

| Basic frequency factors [1/s] | 1206-TVH | NU207-E-XL-TVP2 |
|---|---|---|
| 5,79 | 5,70 | |
| 8,21 | 8,30 | |
| 2,76 | 2,61 | |
| 5,52 | 5,21 | |
| 0,41 | 0,41 | |
| 0,59 | 0,59 |
Figure A1.
Alignment process with the Fixturlaser EVO.
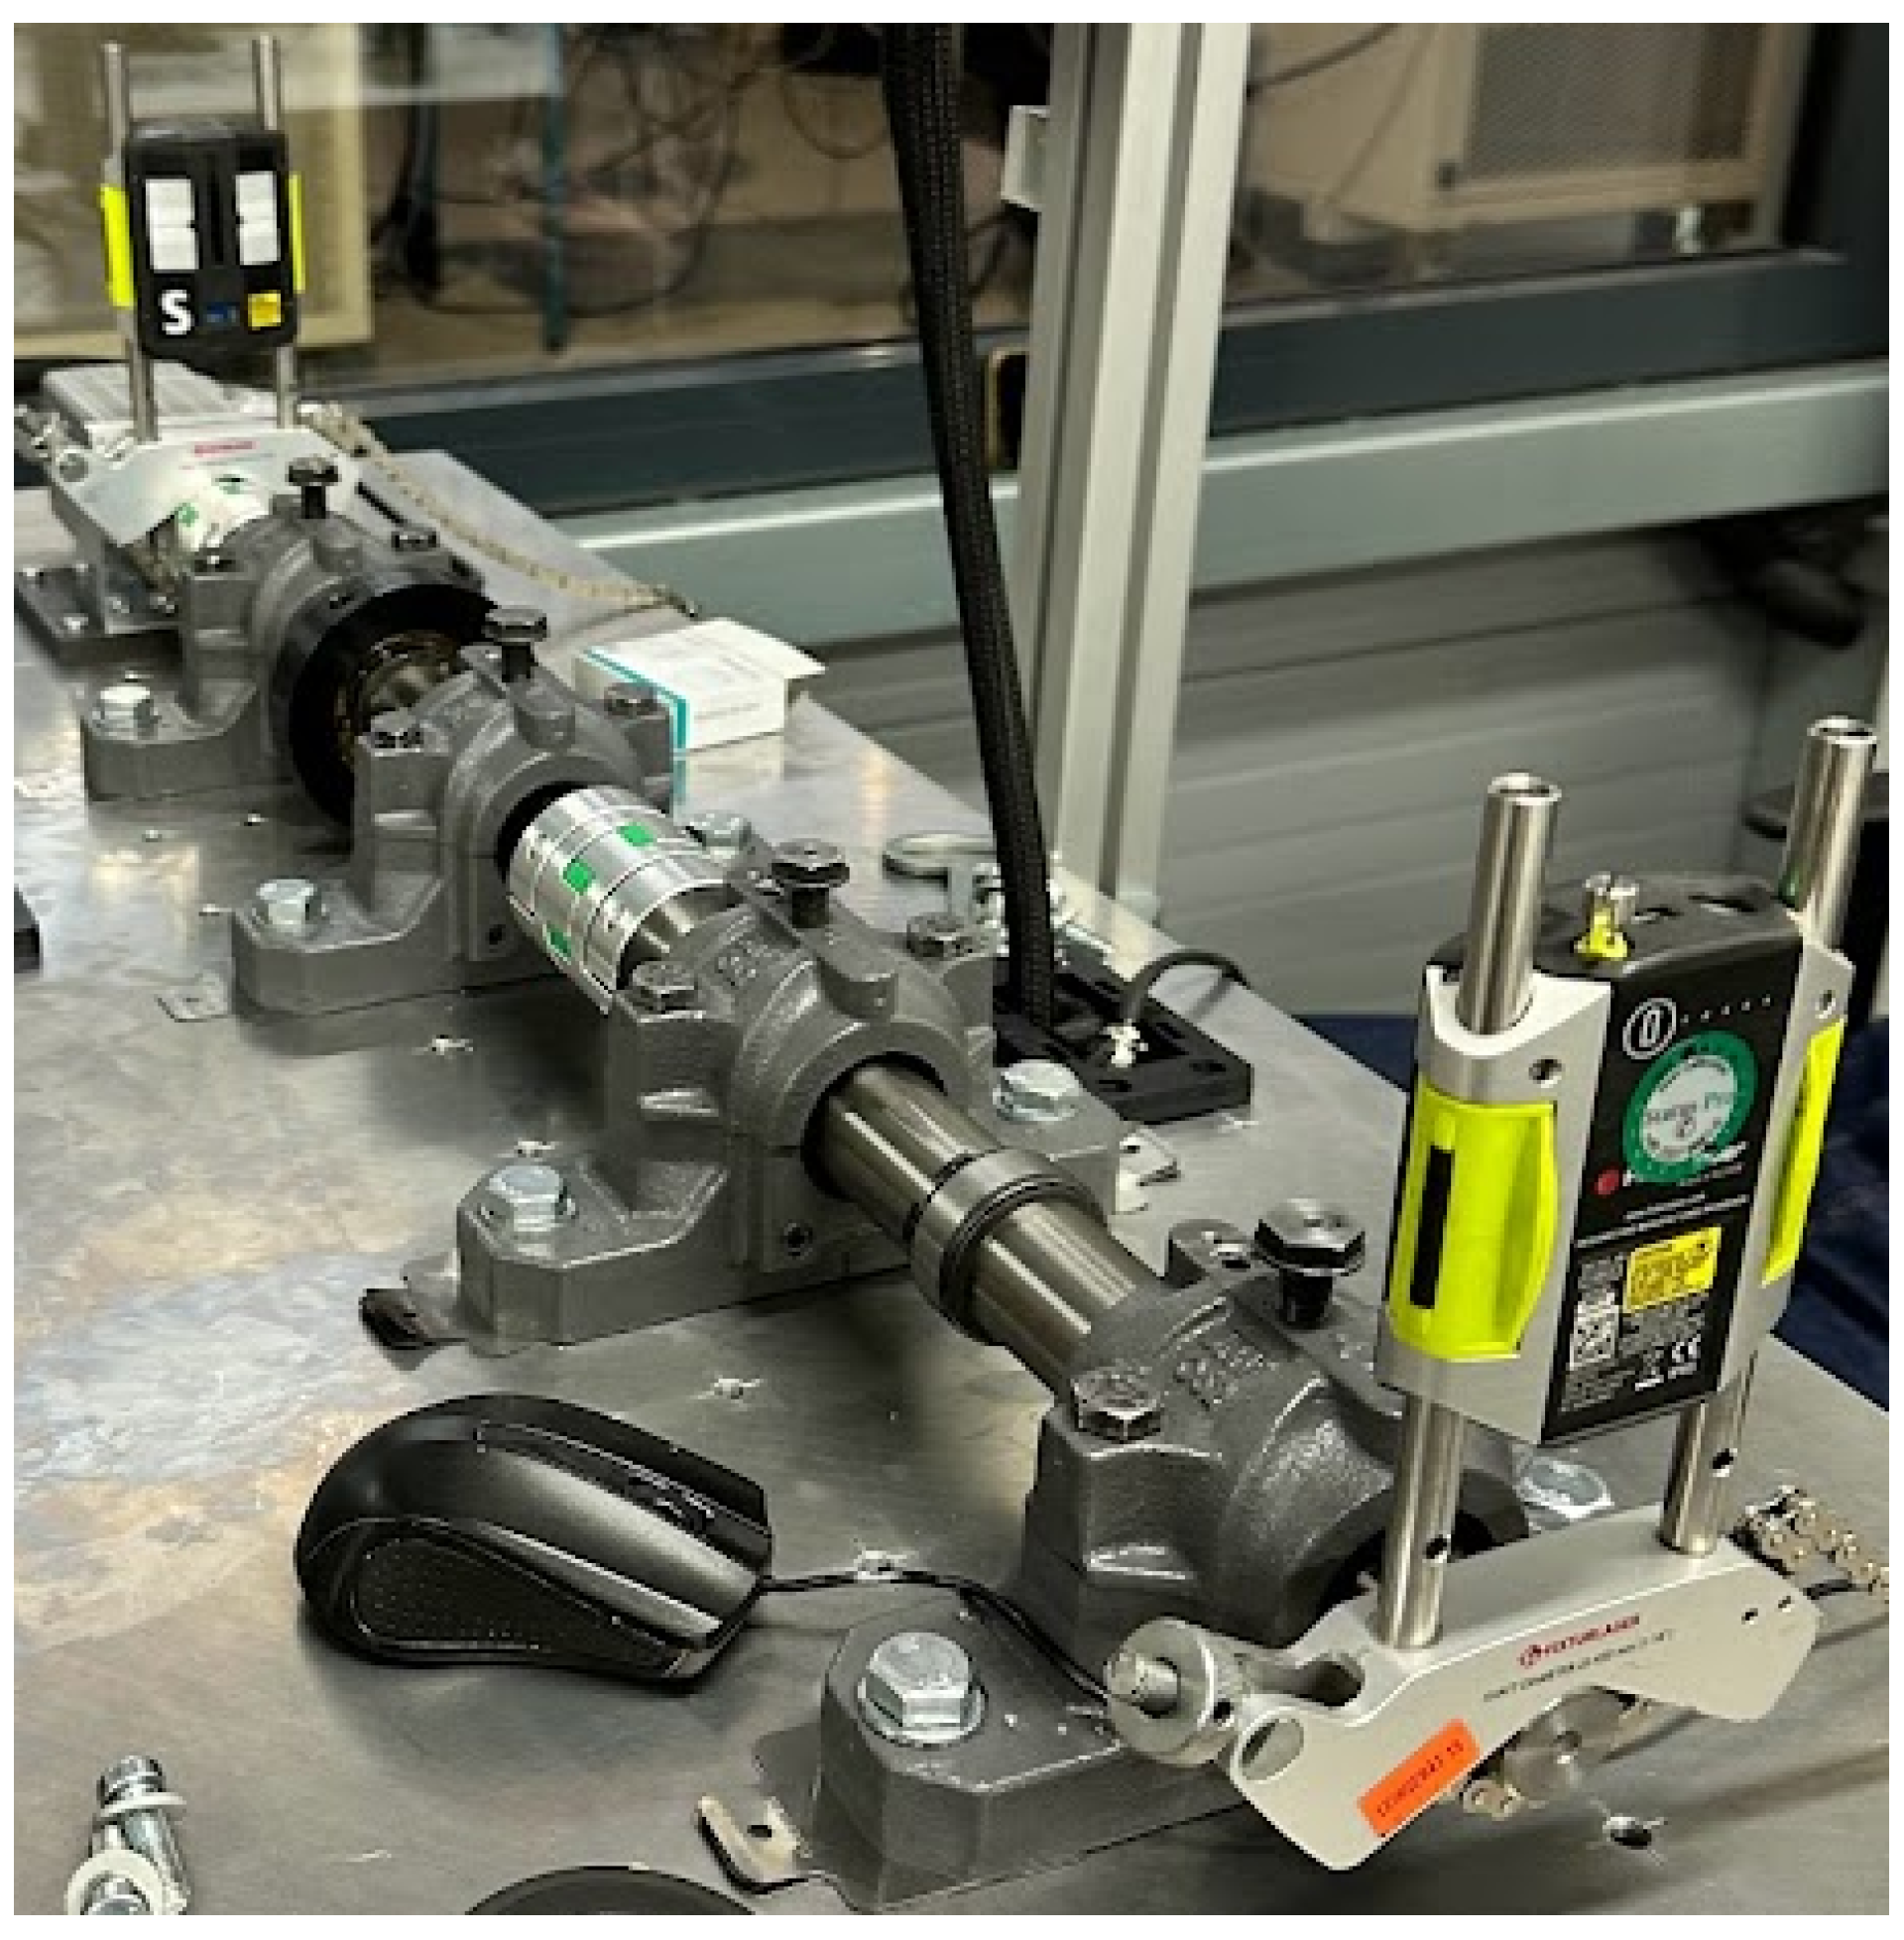
Table A2.
Results of the alignment measurement.
| Position | Measurement | Unit |
|---|---|---|
| Vertical Angle | -0.011 | ° |
| Vertical Offset | -0.079 | mm |
| Horizontal Angle | -0.021 | ° |
| Horizontal Offset | 0.063 | mm |
References
- International Organization for Standardization. ISO 15243:2017 Rolling bearings — Damage and failures — Terms, characteristics and causes, 2017.
- Xu, F.; Ding, N.; Li, N.; Liu, L.; Hou, N.; Xu, N.; Guo, W.; Tian, L.; Xu, H.; Lawrence Wu, C.M.; et al. A review of bearing failure Modes, mechanisms and causes. Engineering Failure Analysis 2023, 152, 107518. [Google Scholar] [CrossRef]
- Tyagi, V. NASA Bearing Dataset, 2007.
- Lessmeier, C.; Kimotho, J.K.; Zimmer, D.; Sextro, W. Condition Monitoring of Bearing Damage in Electromechanical Drive Systems by Using Motor Current Signals of Electric Motors: A Benchmark Data Set for Data-Driven Classification. PHM Society European Conference 2016, 3. [Google Scholar] [CrossRef]
- Case Western School of Engineering. Case Western Reserve University Bearing Data Set.
- Schaeffler Technologies AG & Co. KG. Zylinderrollenlager NU206-E-XL-TVP2, 2025.
- Schaeffler Monitoring Services GmbH. Condition Monitoring Praxis: Handbuch zur Schwingungs-Zustandsüberwachung von Maschinen und Anlagen, 1. auflage ed.; Vereinigte Fachverlage: Mainz, Deutschland, 2019. [Google Scholar]
- Ishikawa, K.; Ishikawa, K. Guide to quality control, 13. print ed.; Asian Productivity Organization: Tokyo, 1996. [Google Scholar]
- Loh, W.L. On Latin hypercube sampling. The Annals of Statistics 1996, 24, 2058–2080. [Google Scholar] [CrossRef]
- Schnur, C.; Goodarzi, P.; Robin, Y.; Schauer, J.; El Moutaouakil, H.; Ahmad, A.A.; Zhang, Y.; Schneider, T.; Schütze, A. A Cylindrical Roller Bearing Dataset with varying speed, force and position for robust and trasferable machine learning, 2025. [CrossRef]
- Maleki, F.; Muthukrishnan, N.; Ovens, K.; Reinhold, C.; Forghani, R. Machine Learning Algorithm Validation: From Essentials to Advanced Applications and Implications for Regulatory Certification and Deployment. Neuroimaging Clinics of North America 2020, 30, 433–445. [Google Scholar] [CrossRef] [PubMed]
- Goodarzi, P.; Schütze, A.; Schneider, T. Comparing AutoML and Deep Learning Methods for Condition Monitoring using Realistic Validation Scenarios, 2023. [CrossRef]
- Schnur, C. Methodisches Vorgehen zur Realisierung von maschinellen Lernprojekten im. Mittelstand. Dissertation, Universität des Saarlandes, Naturwissenschaftlich-Technische Fakultät, 2025. [Google Scholar]
- Schaeffler Technologies AG & Co. KG. Pendelkugellager 1206-TVH, 2025.
- Schaeffler Technologies AG & Co. KG. Zylinderrollenlager NU207-E-XL-TVP2, 2025.
Figure 1.
(a) Assembled cylindrical roller bearing and (b) disassembled into its components: outer ring, inner ring, rolling elements, and cage.
Figure 1.
(a) Assembled cylindrical roller bearing and (b) disassembled into its components: outer ring, inner ring, rolling elements, and cage.
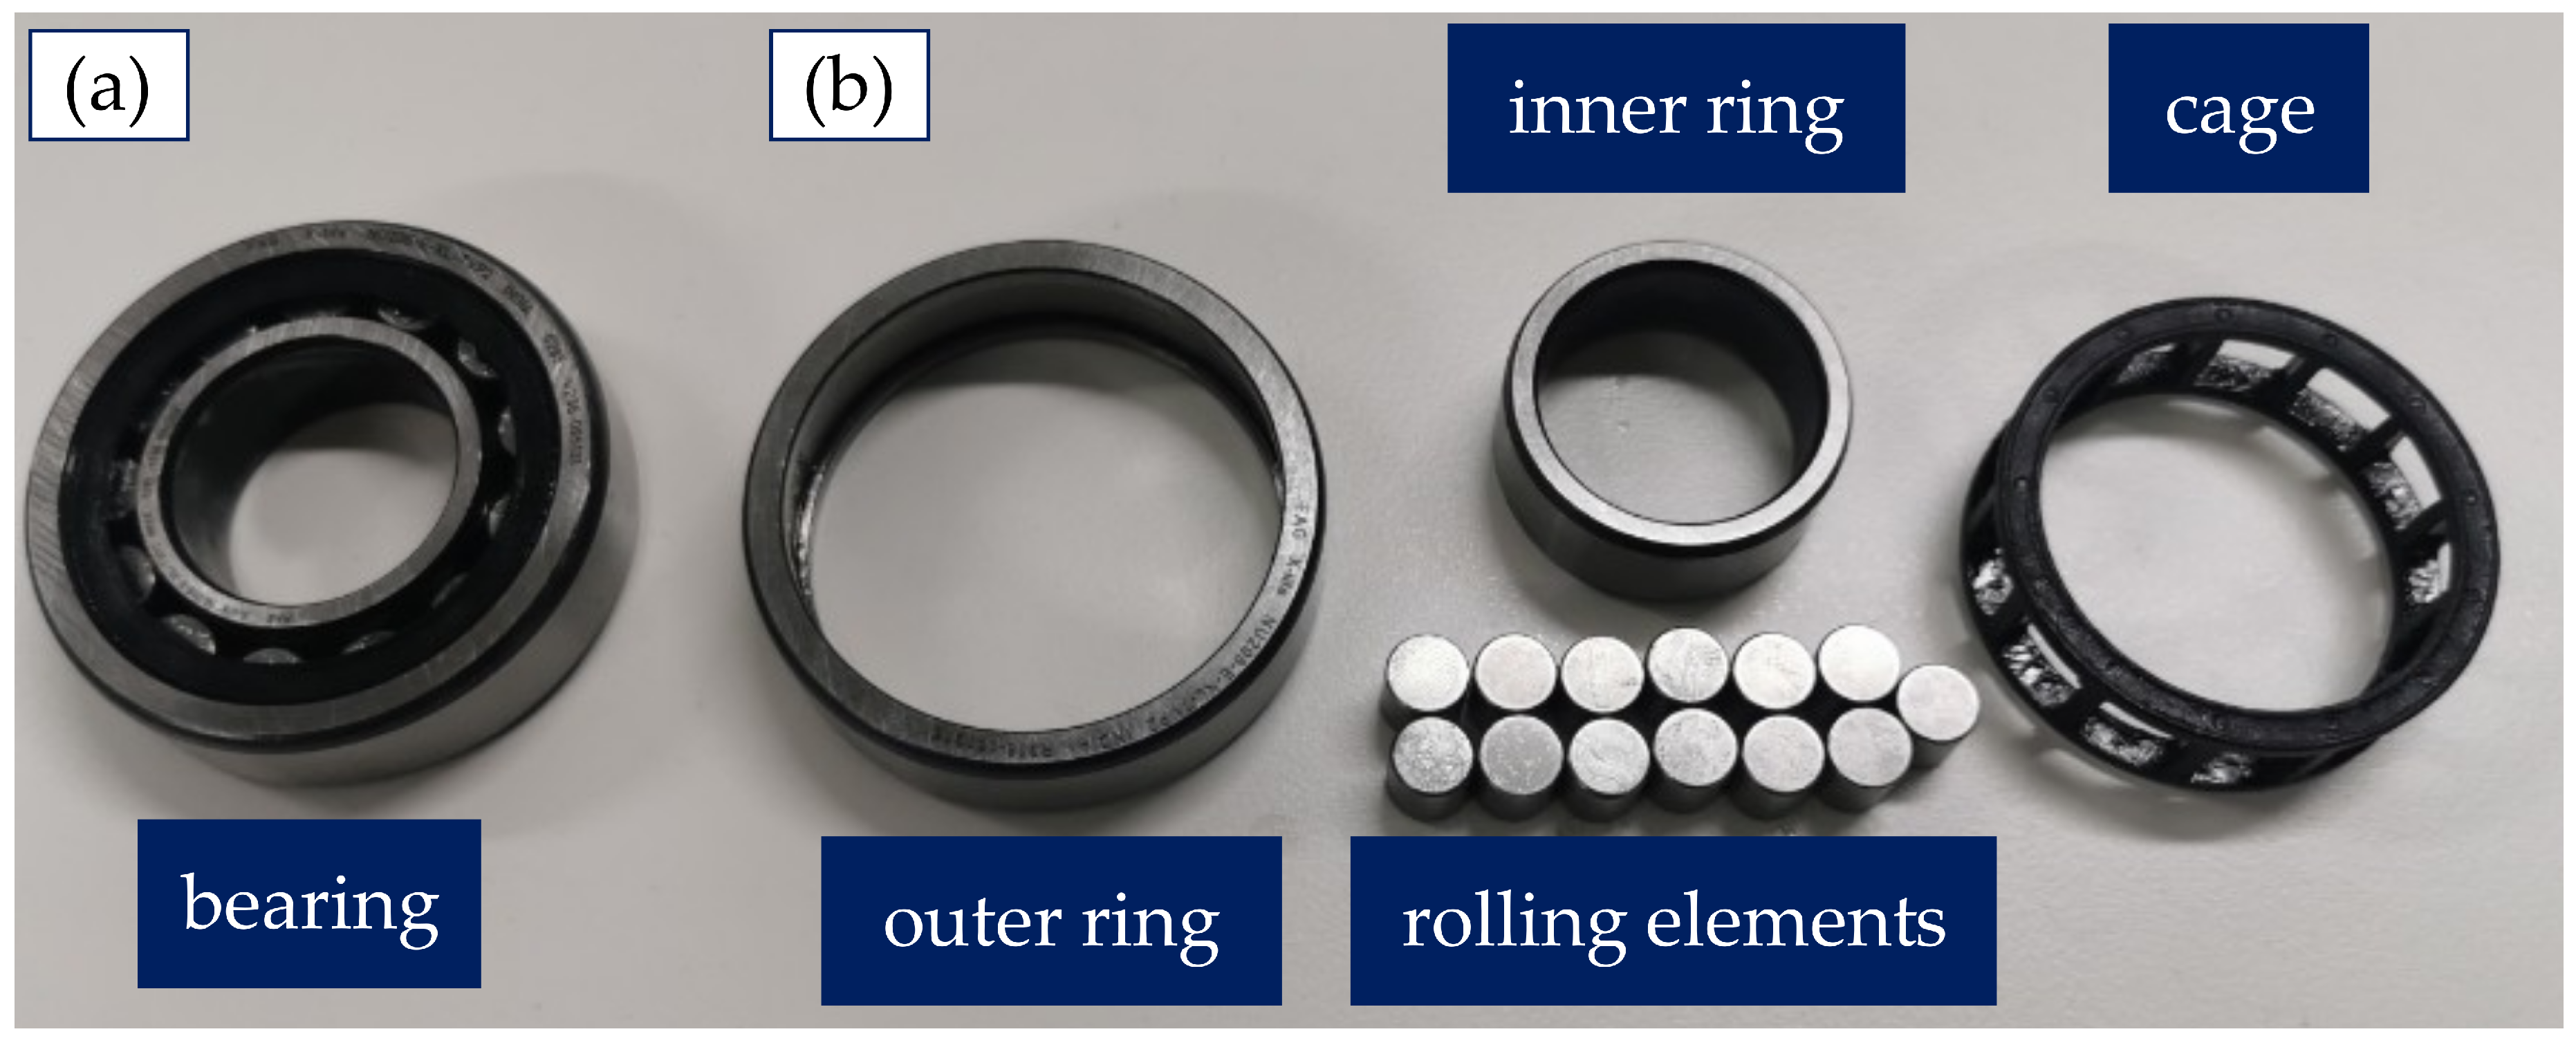
Figure 2.
Microscope images of the artificial damages introduced to bearings 10, 20, and 30, along with their respective dimensions.
Figure 2.
Microscope images of the artificial damages introduced to bearings 10, 20, and 30, along with their respective dimensions.
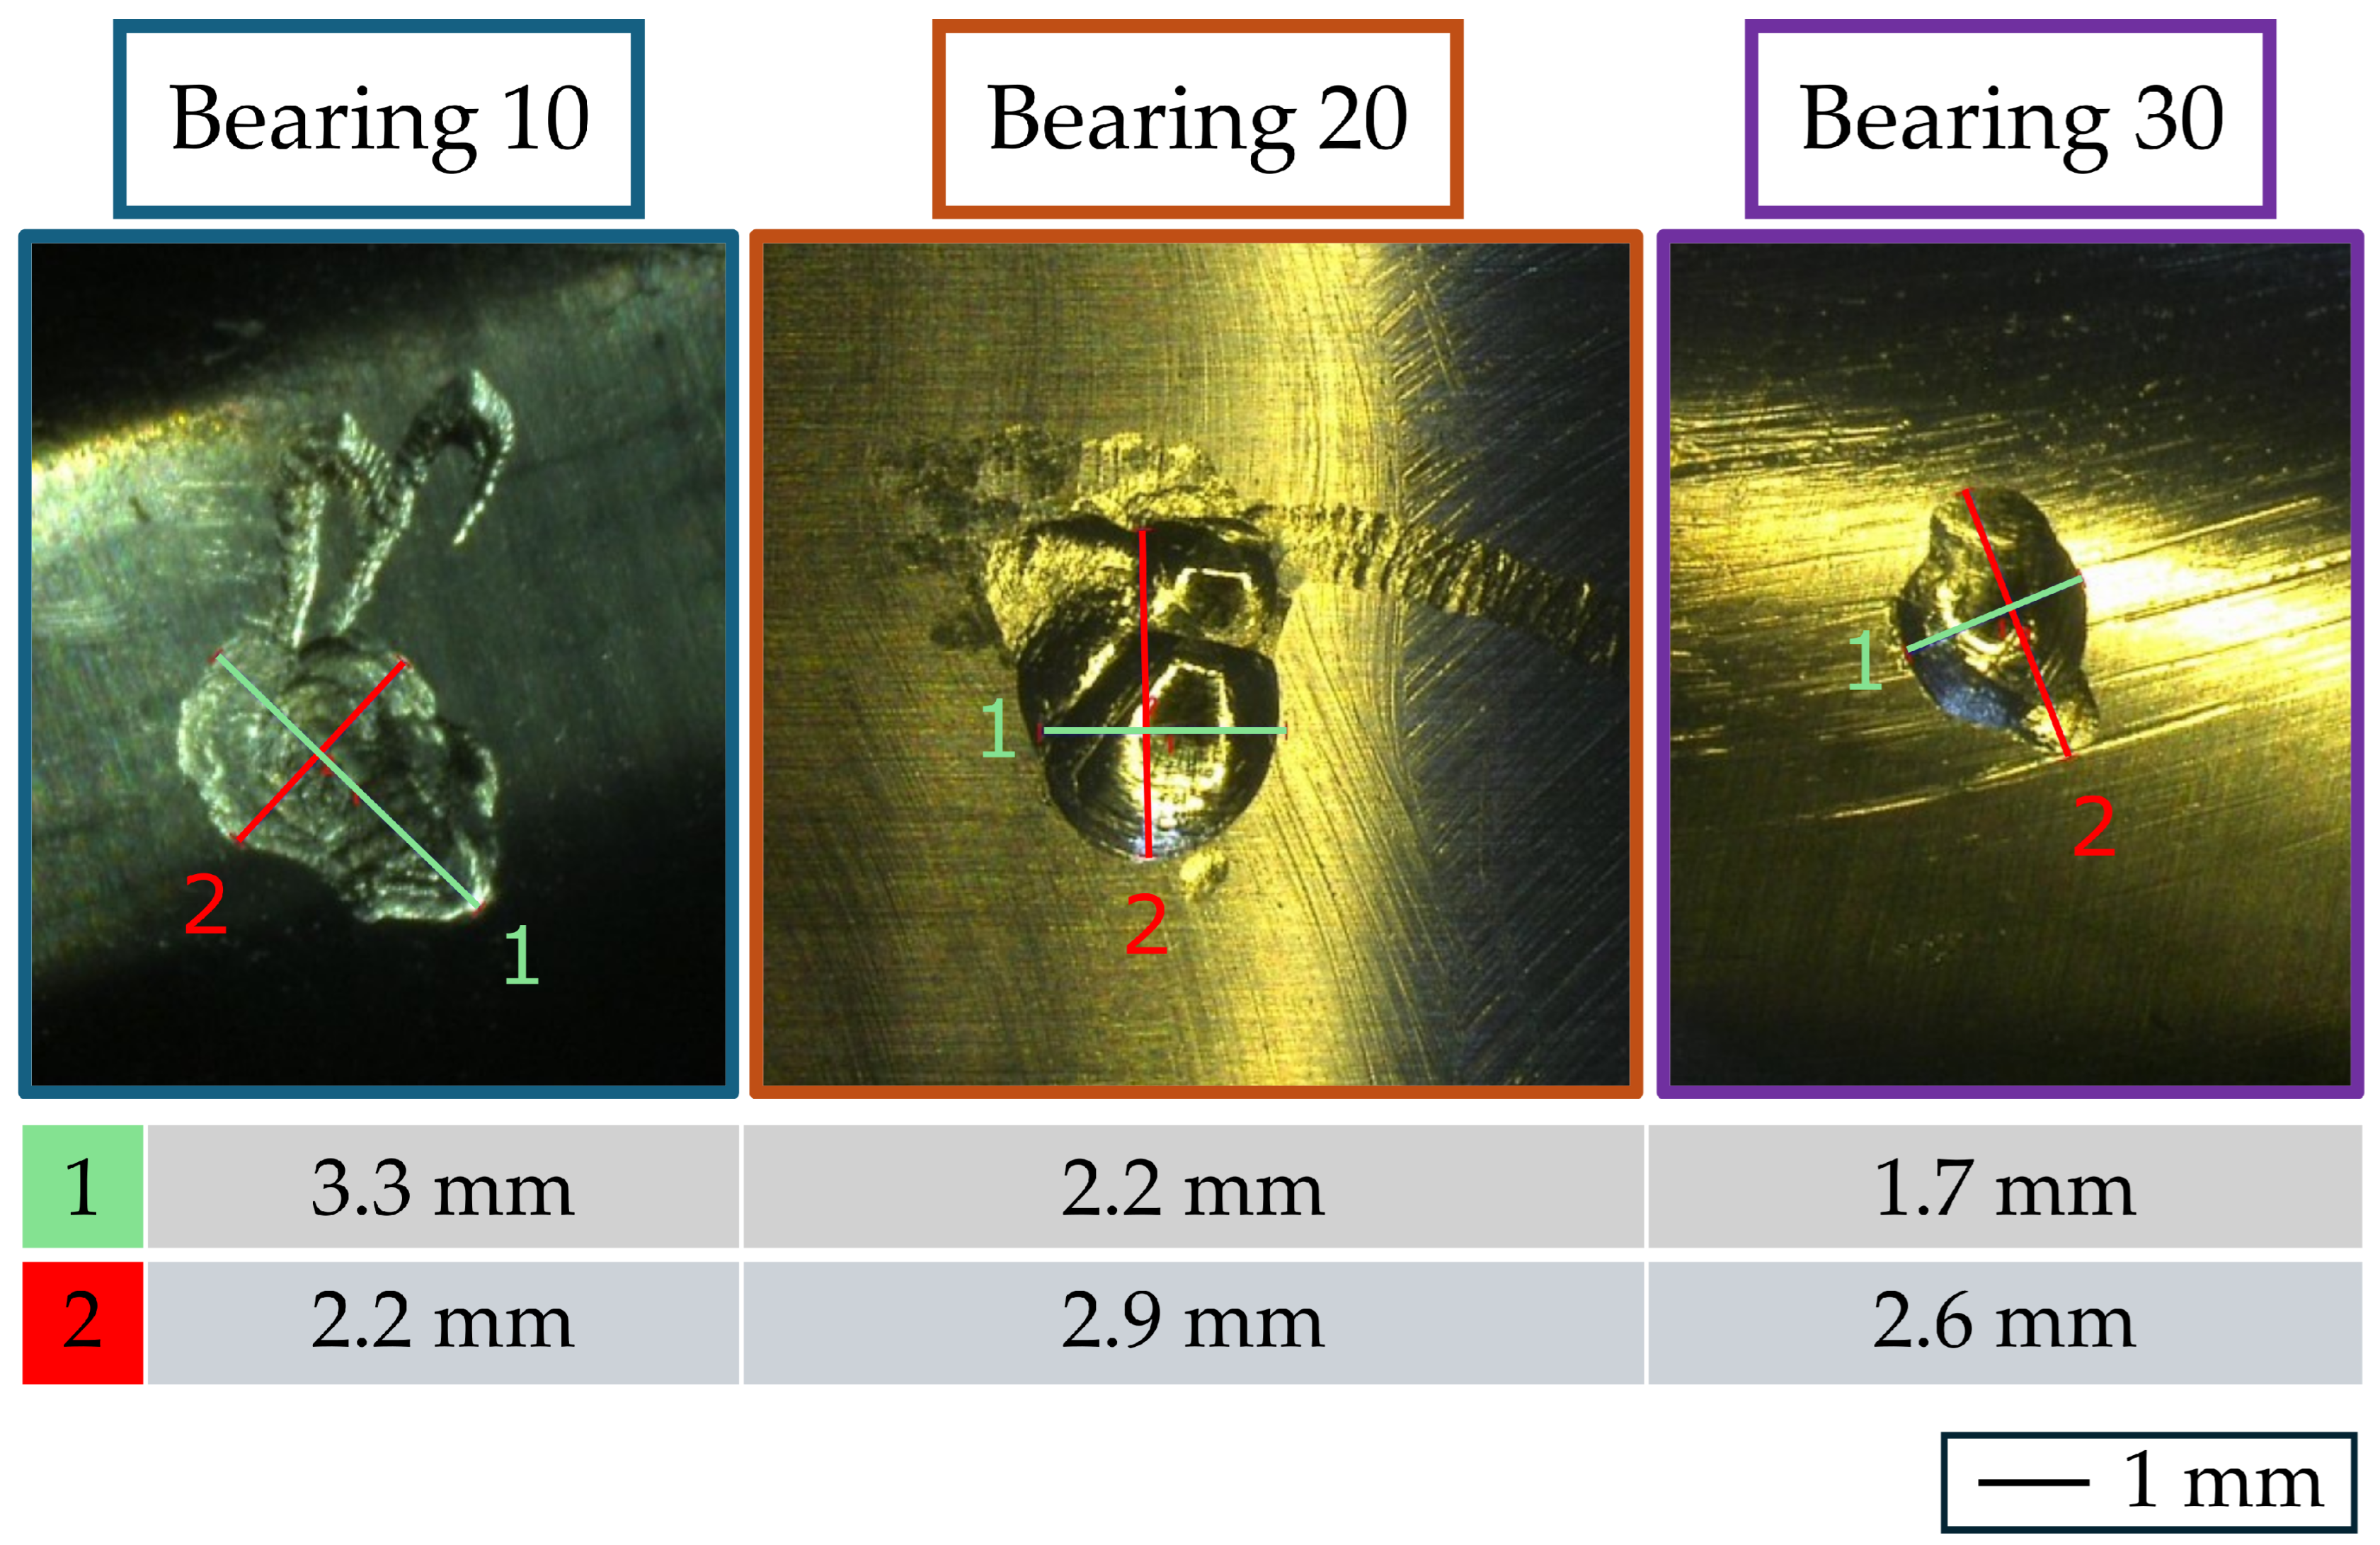
Figure 3.
(a) Mechanical setup of the testbed. (b) Enlarged view on the force introduction.
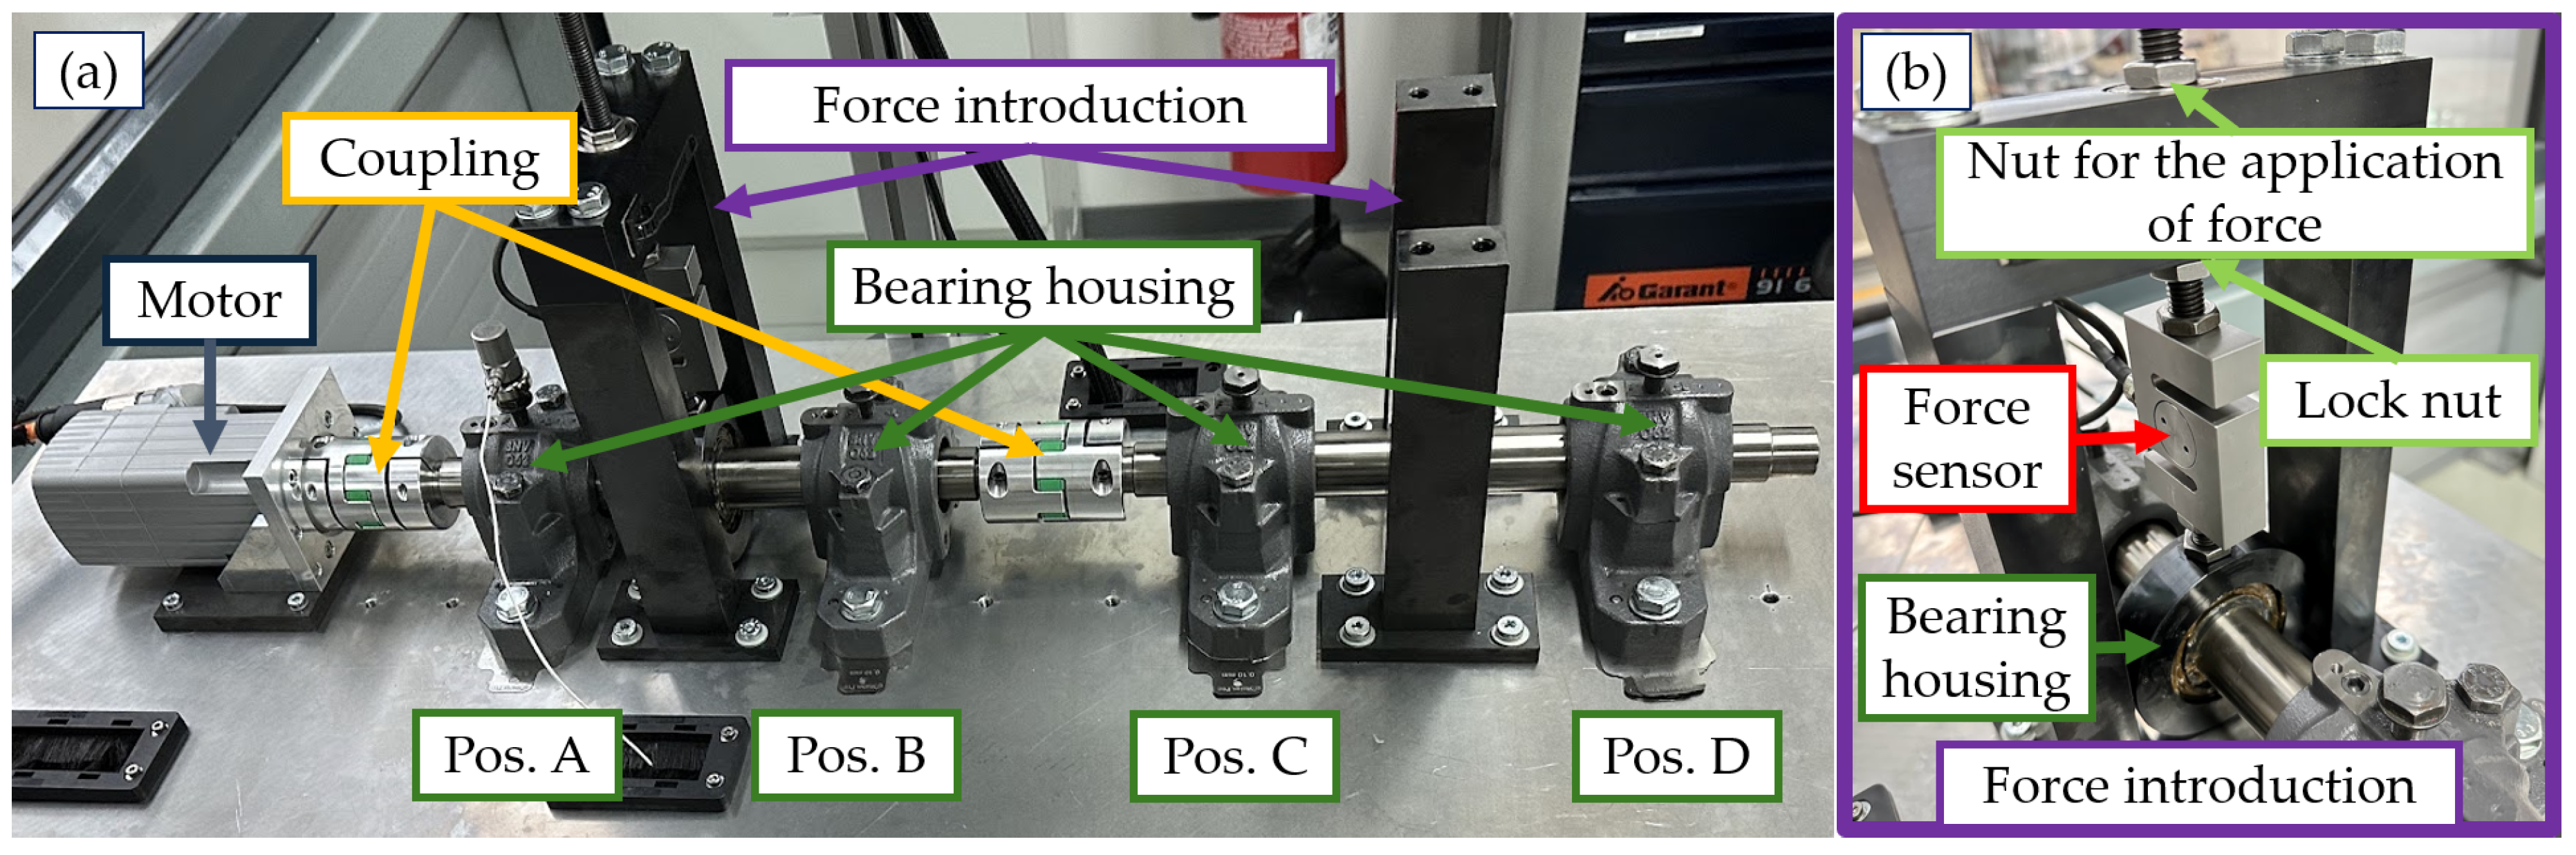
Figure 4.
Dismantled shaft before a position change.
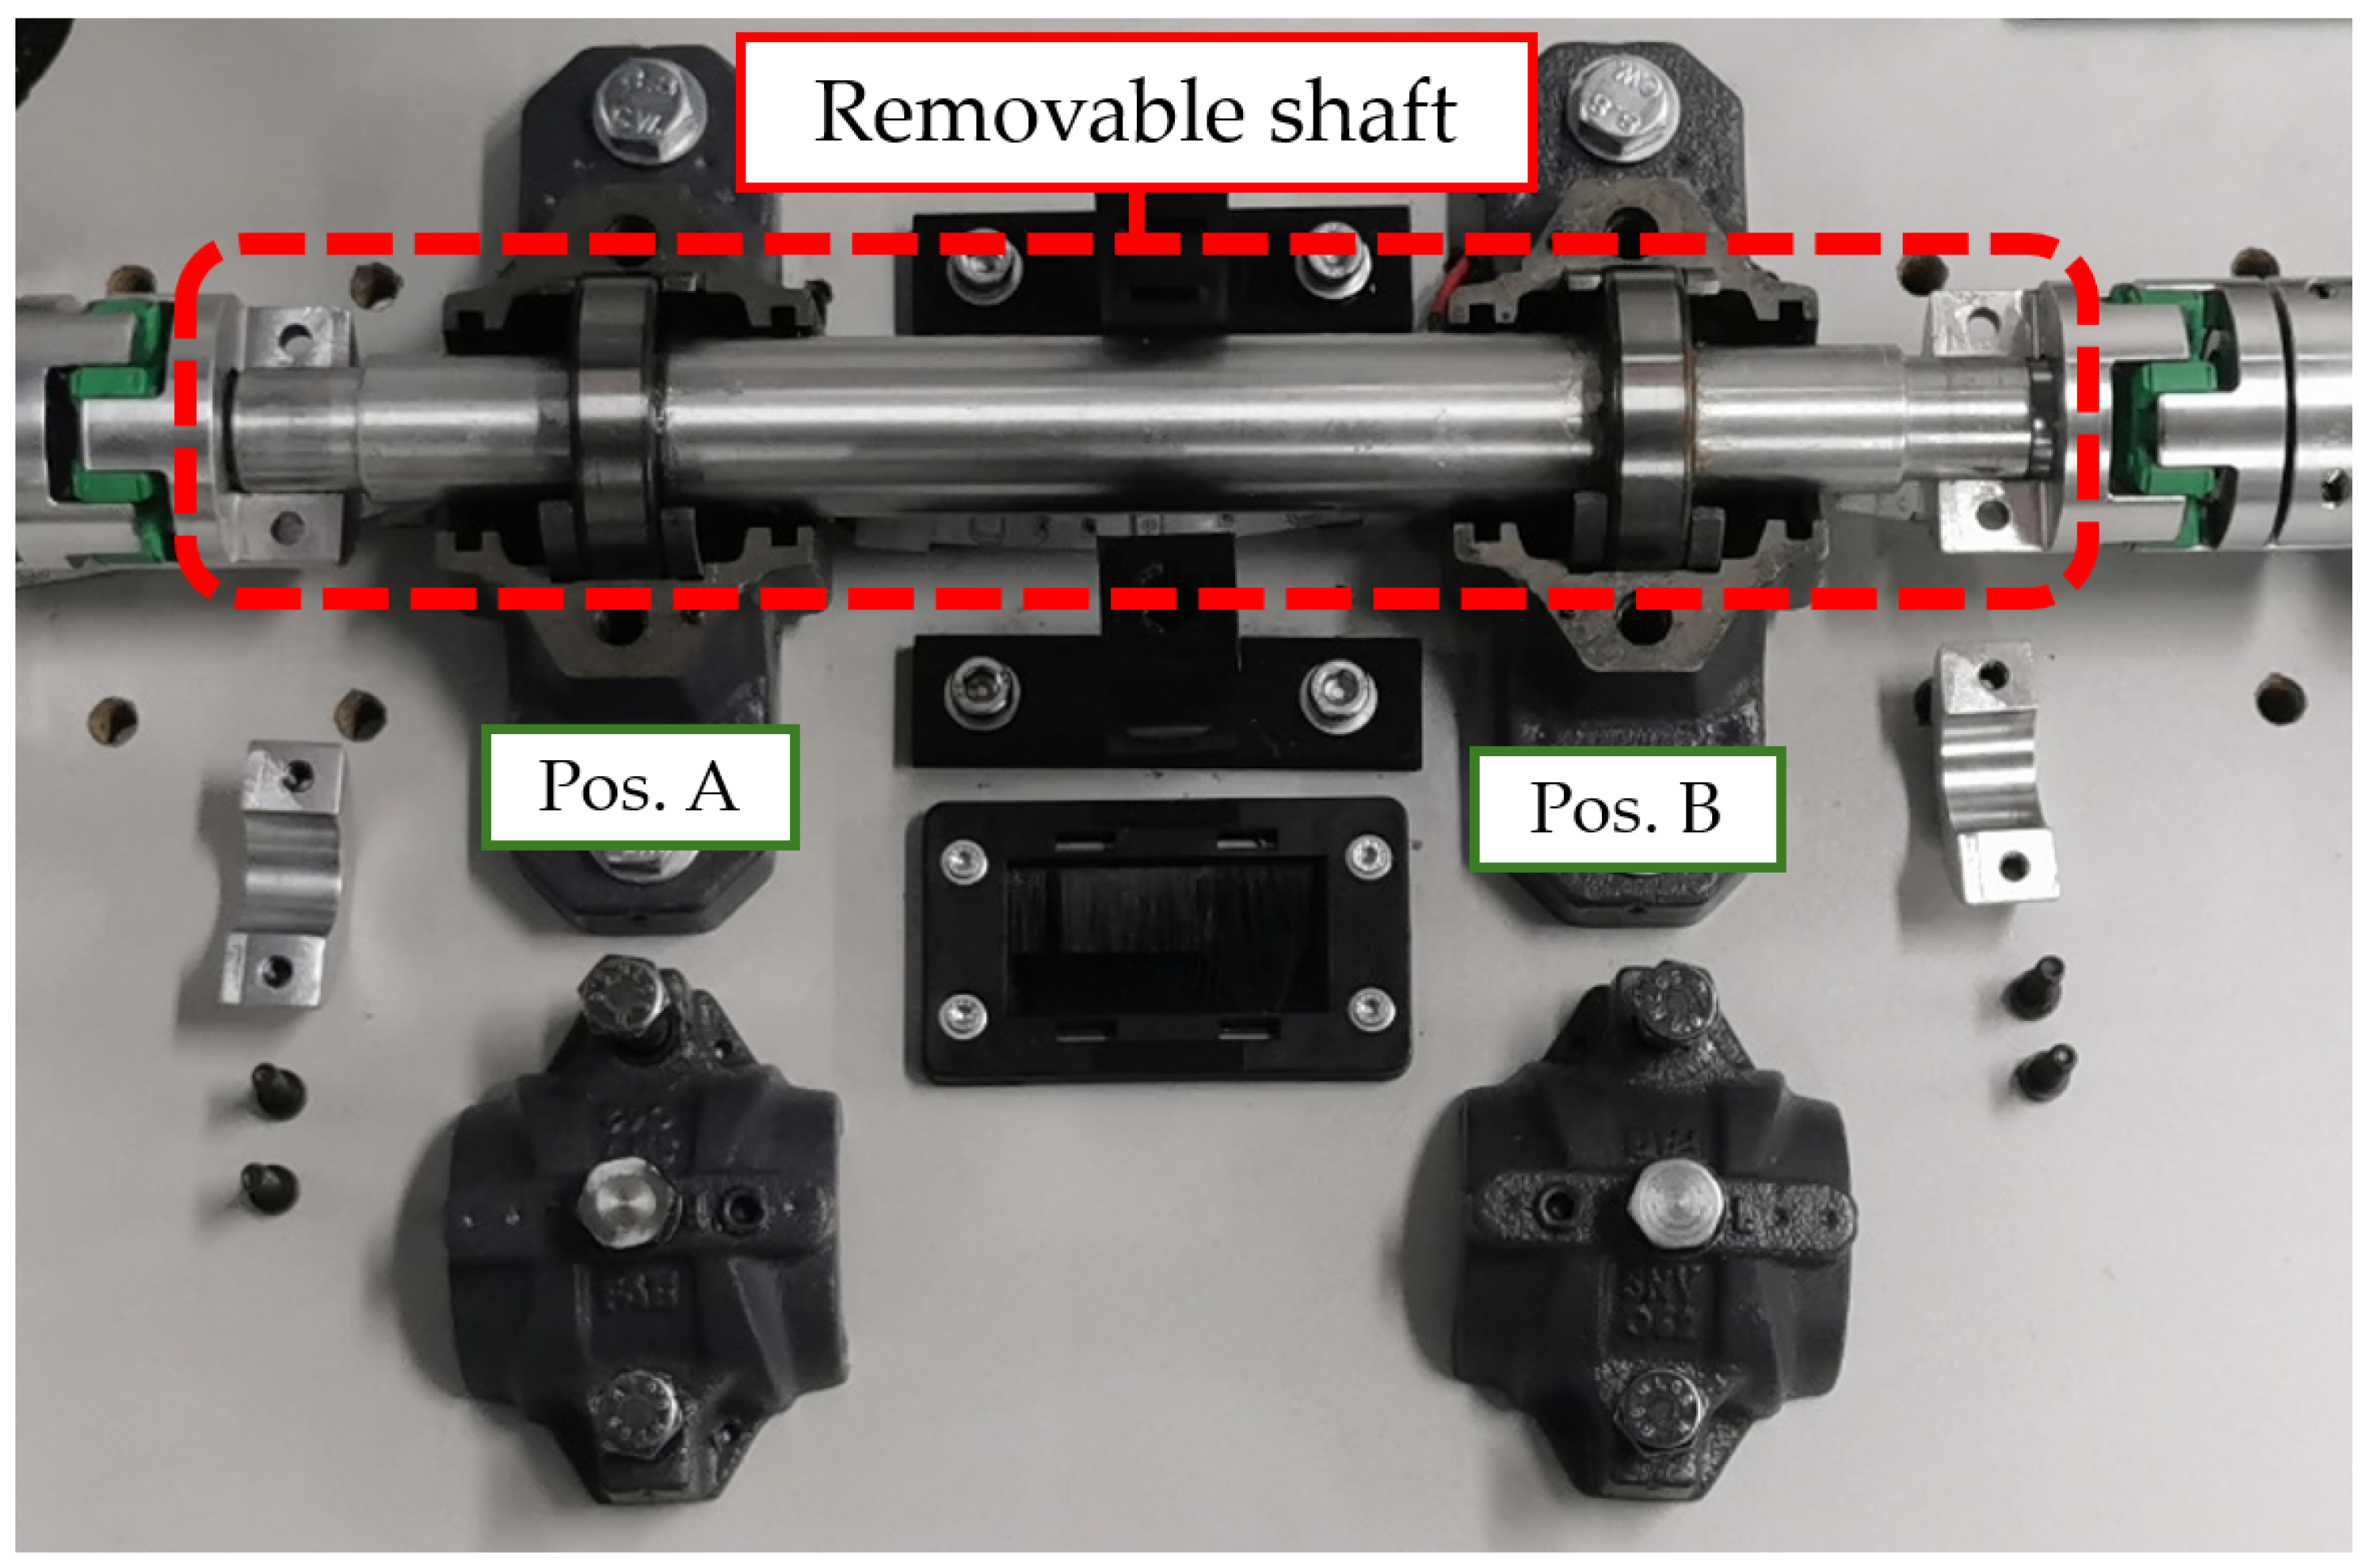
Figure 5.
Cause-effect graph illustrating the influencing factors on the measurement for cylindrical roller bearings.
Figure 5.
Cause-effect graph illustrating the influencing factors on the measurement for cylindrical roller bearings.
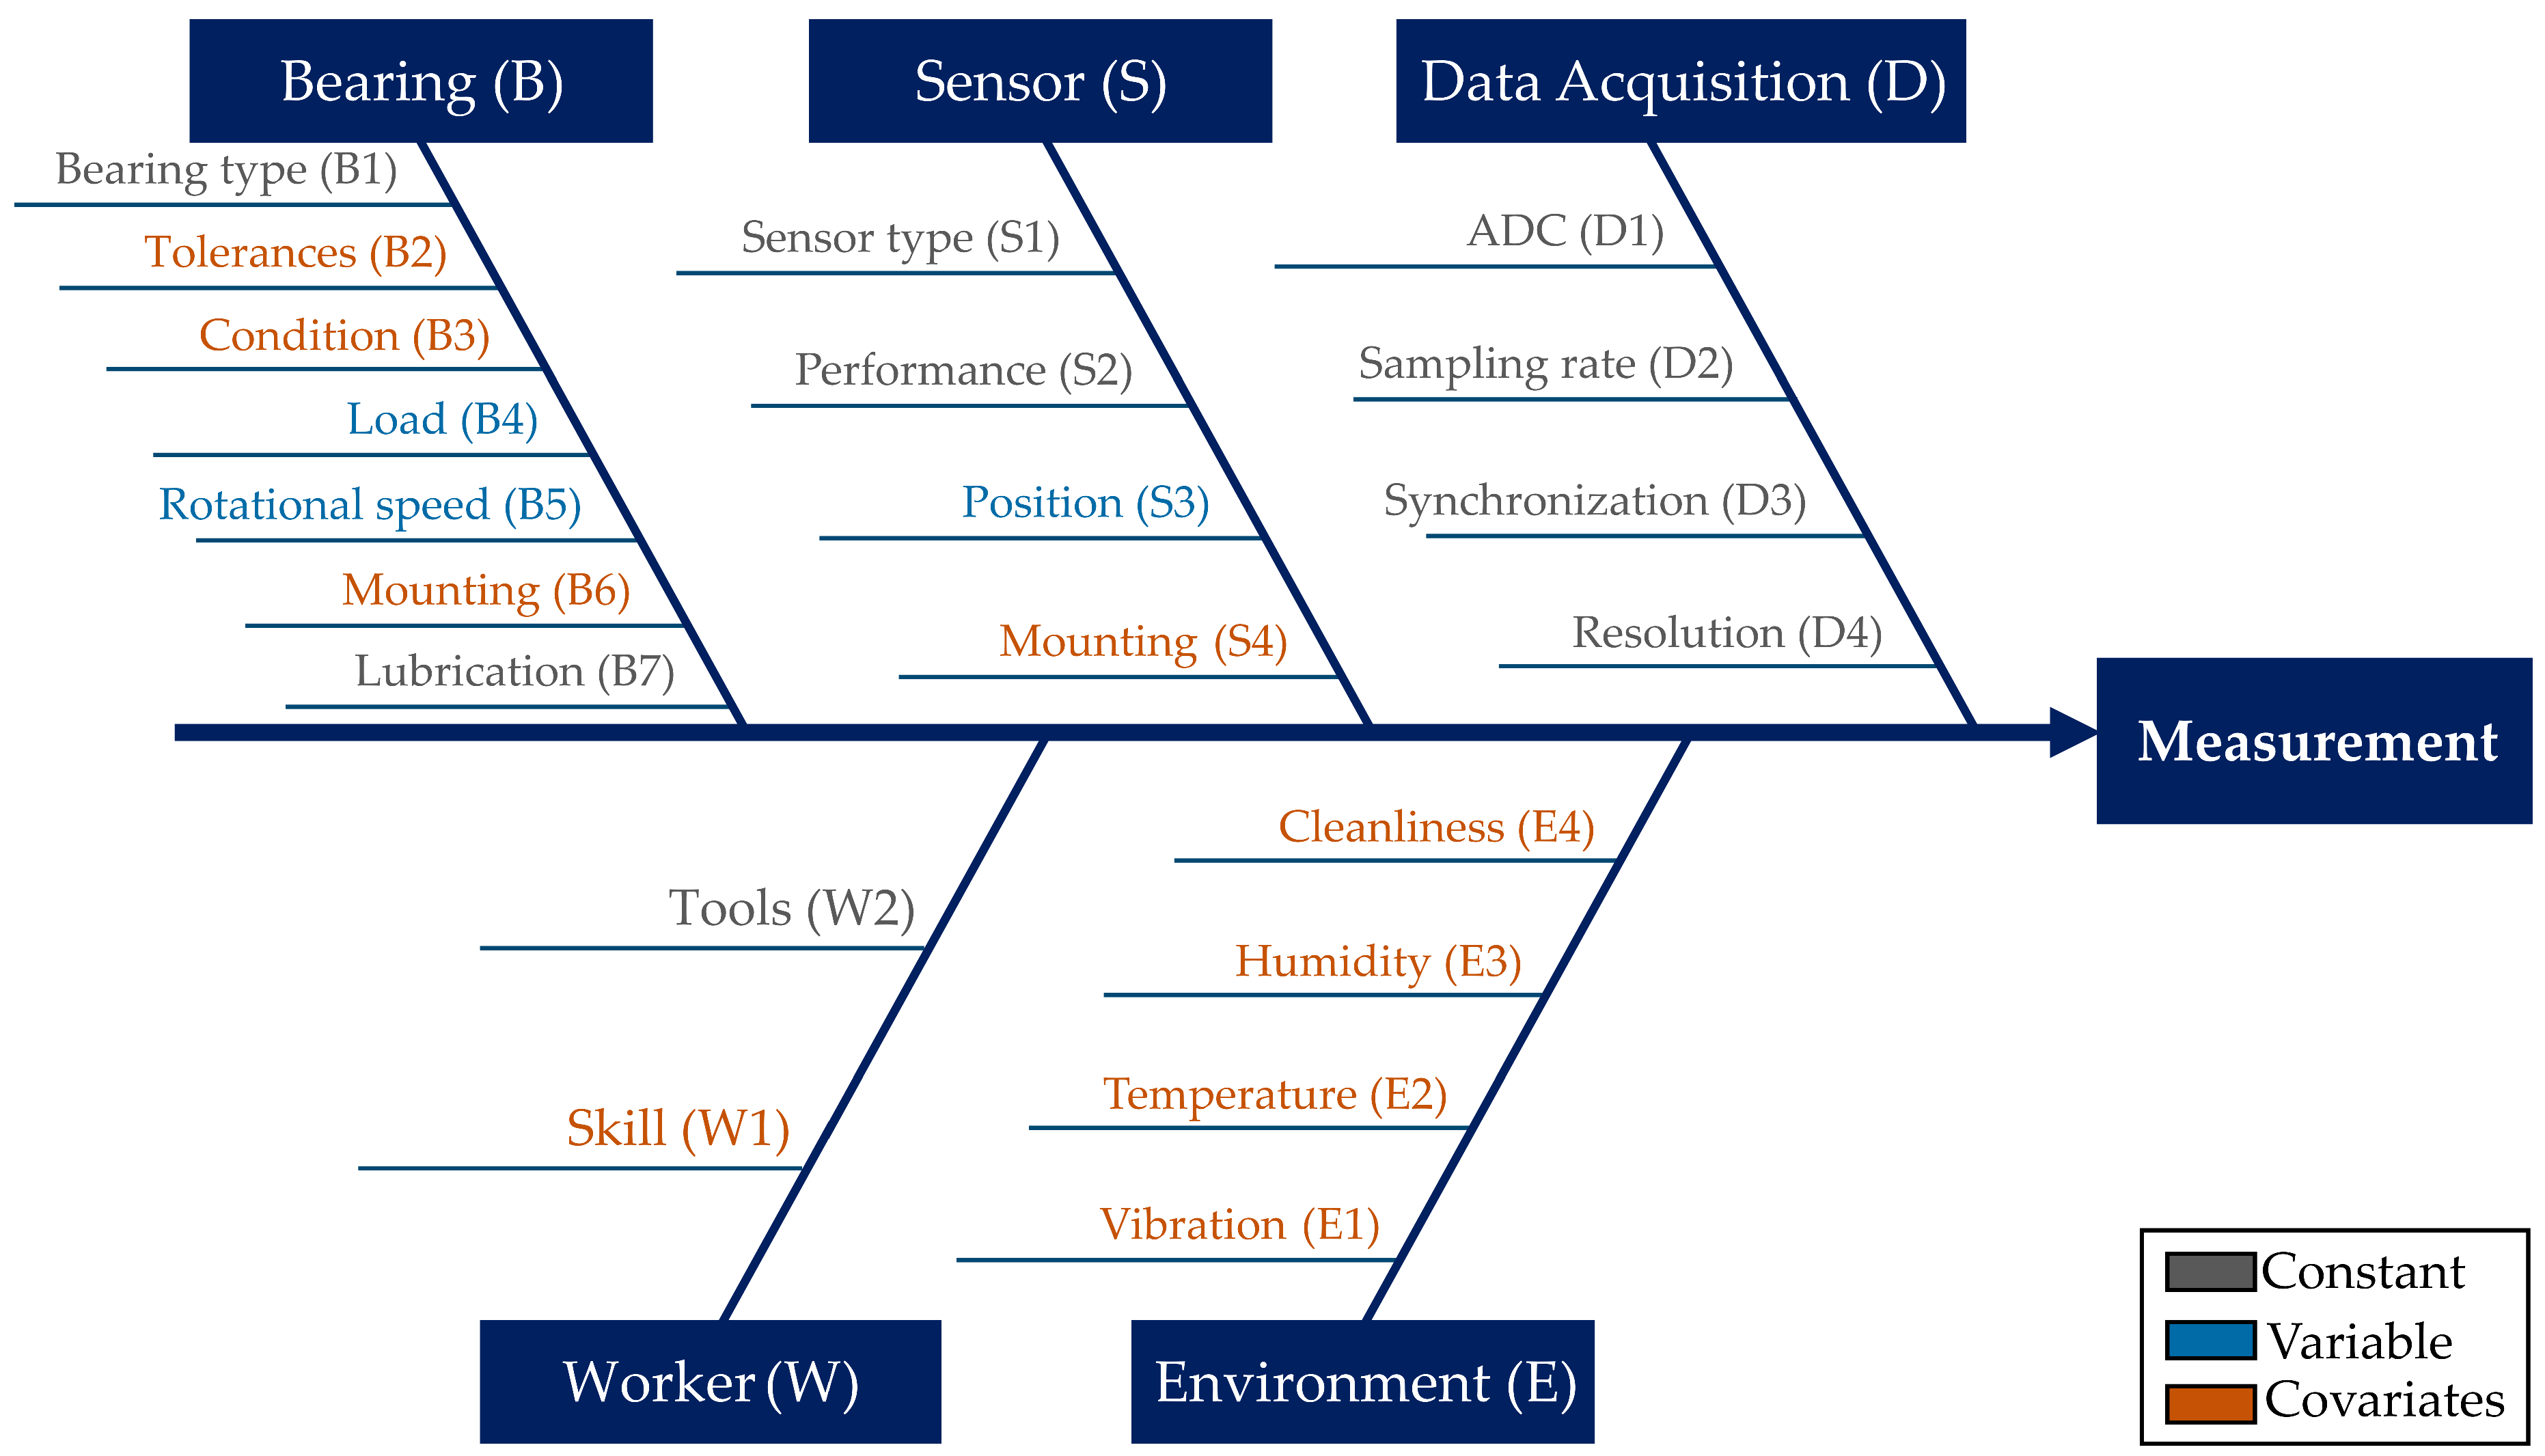
Figure 6.
Variation of the covariates in the DoE.
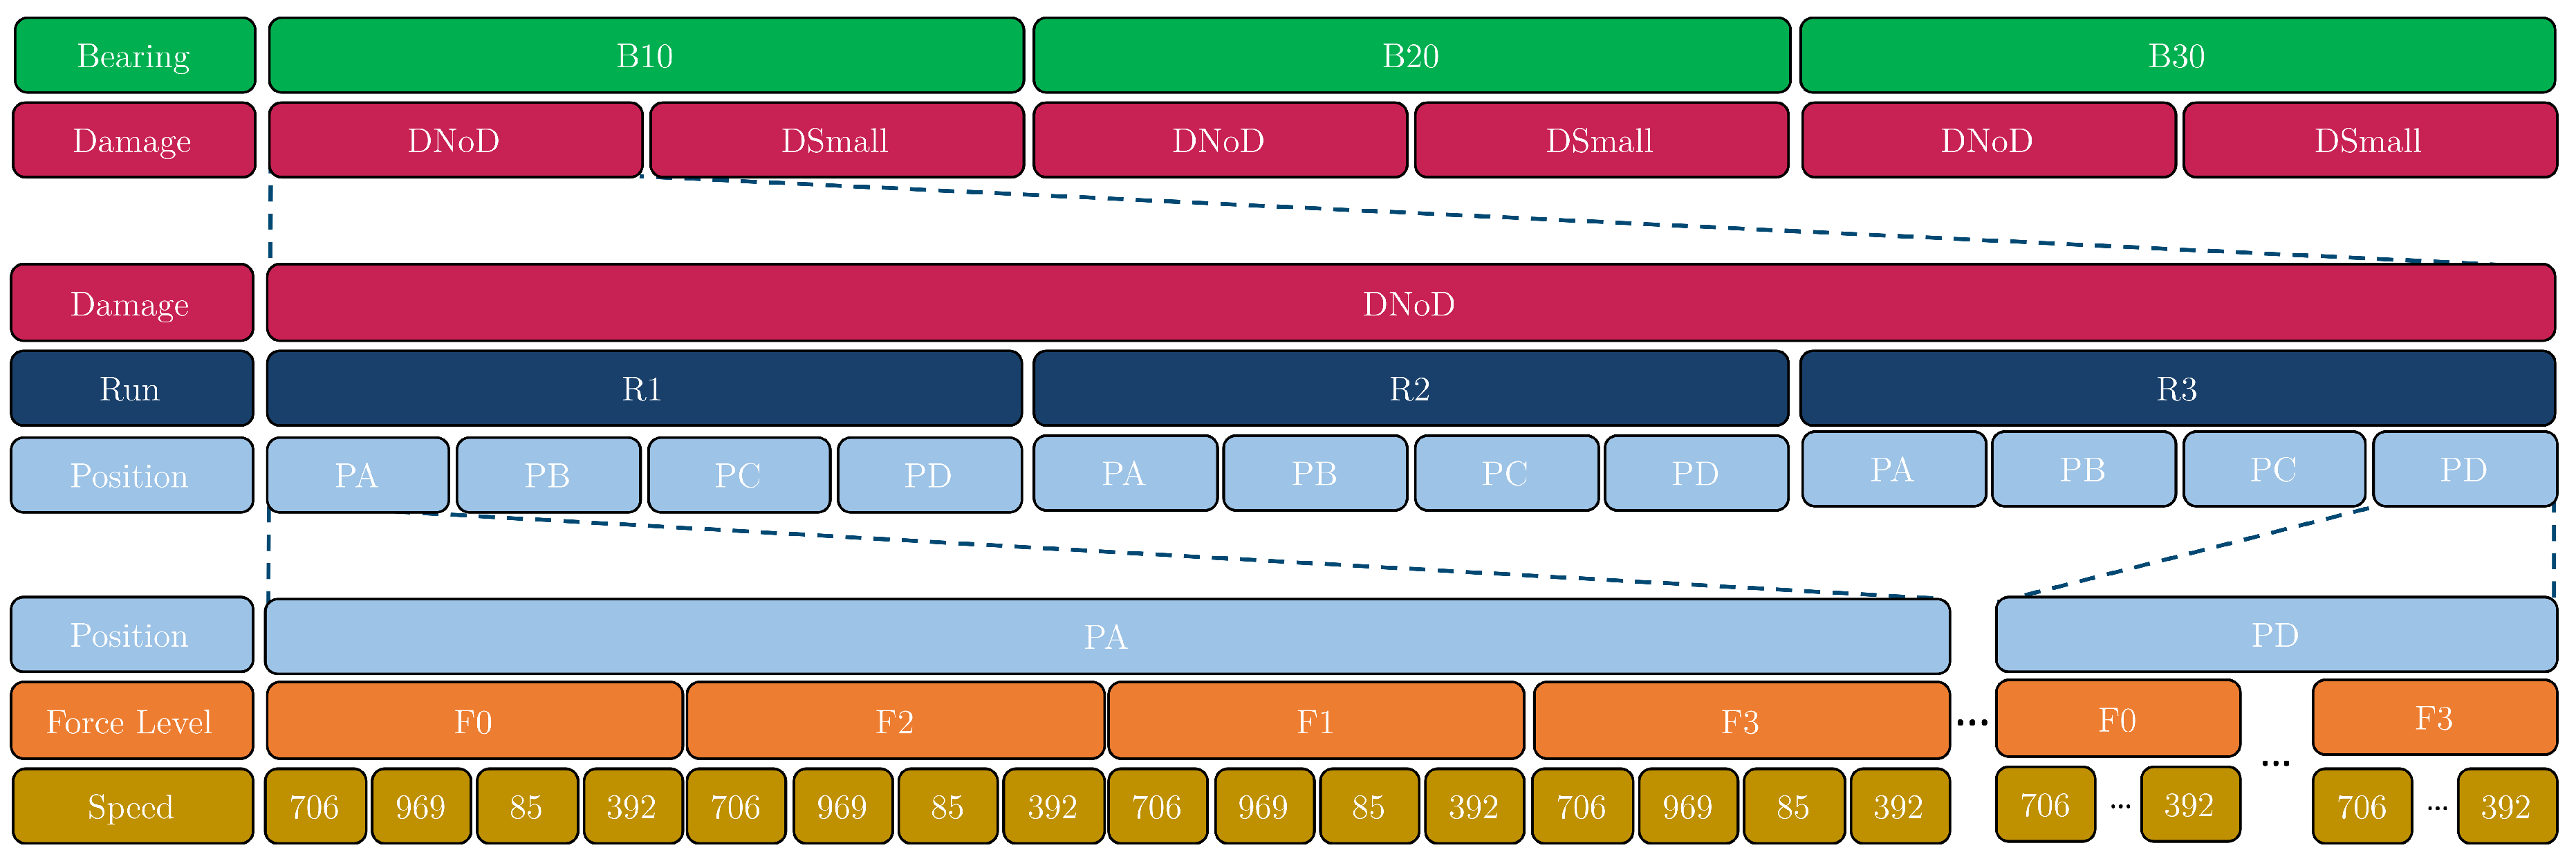
Figure 7.
Overview of the dataset’s folder structure.
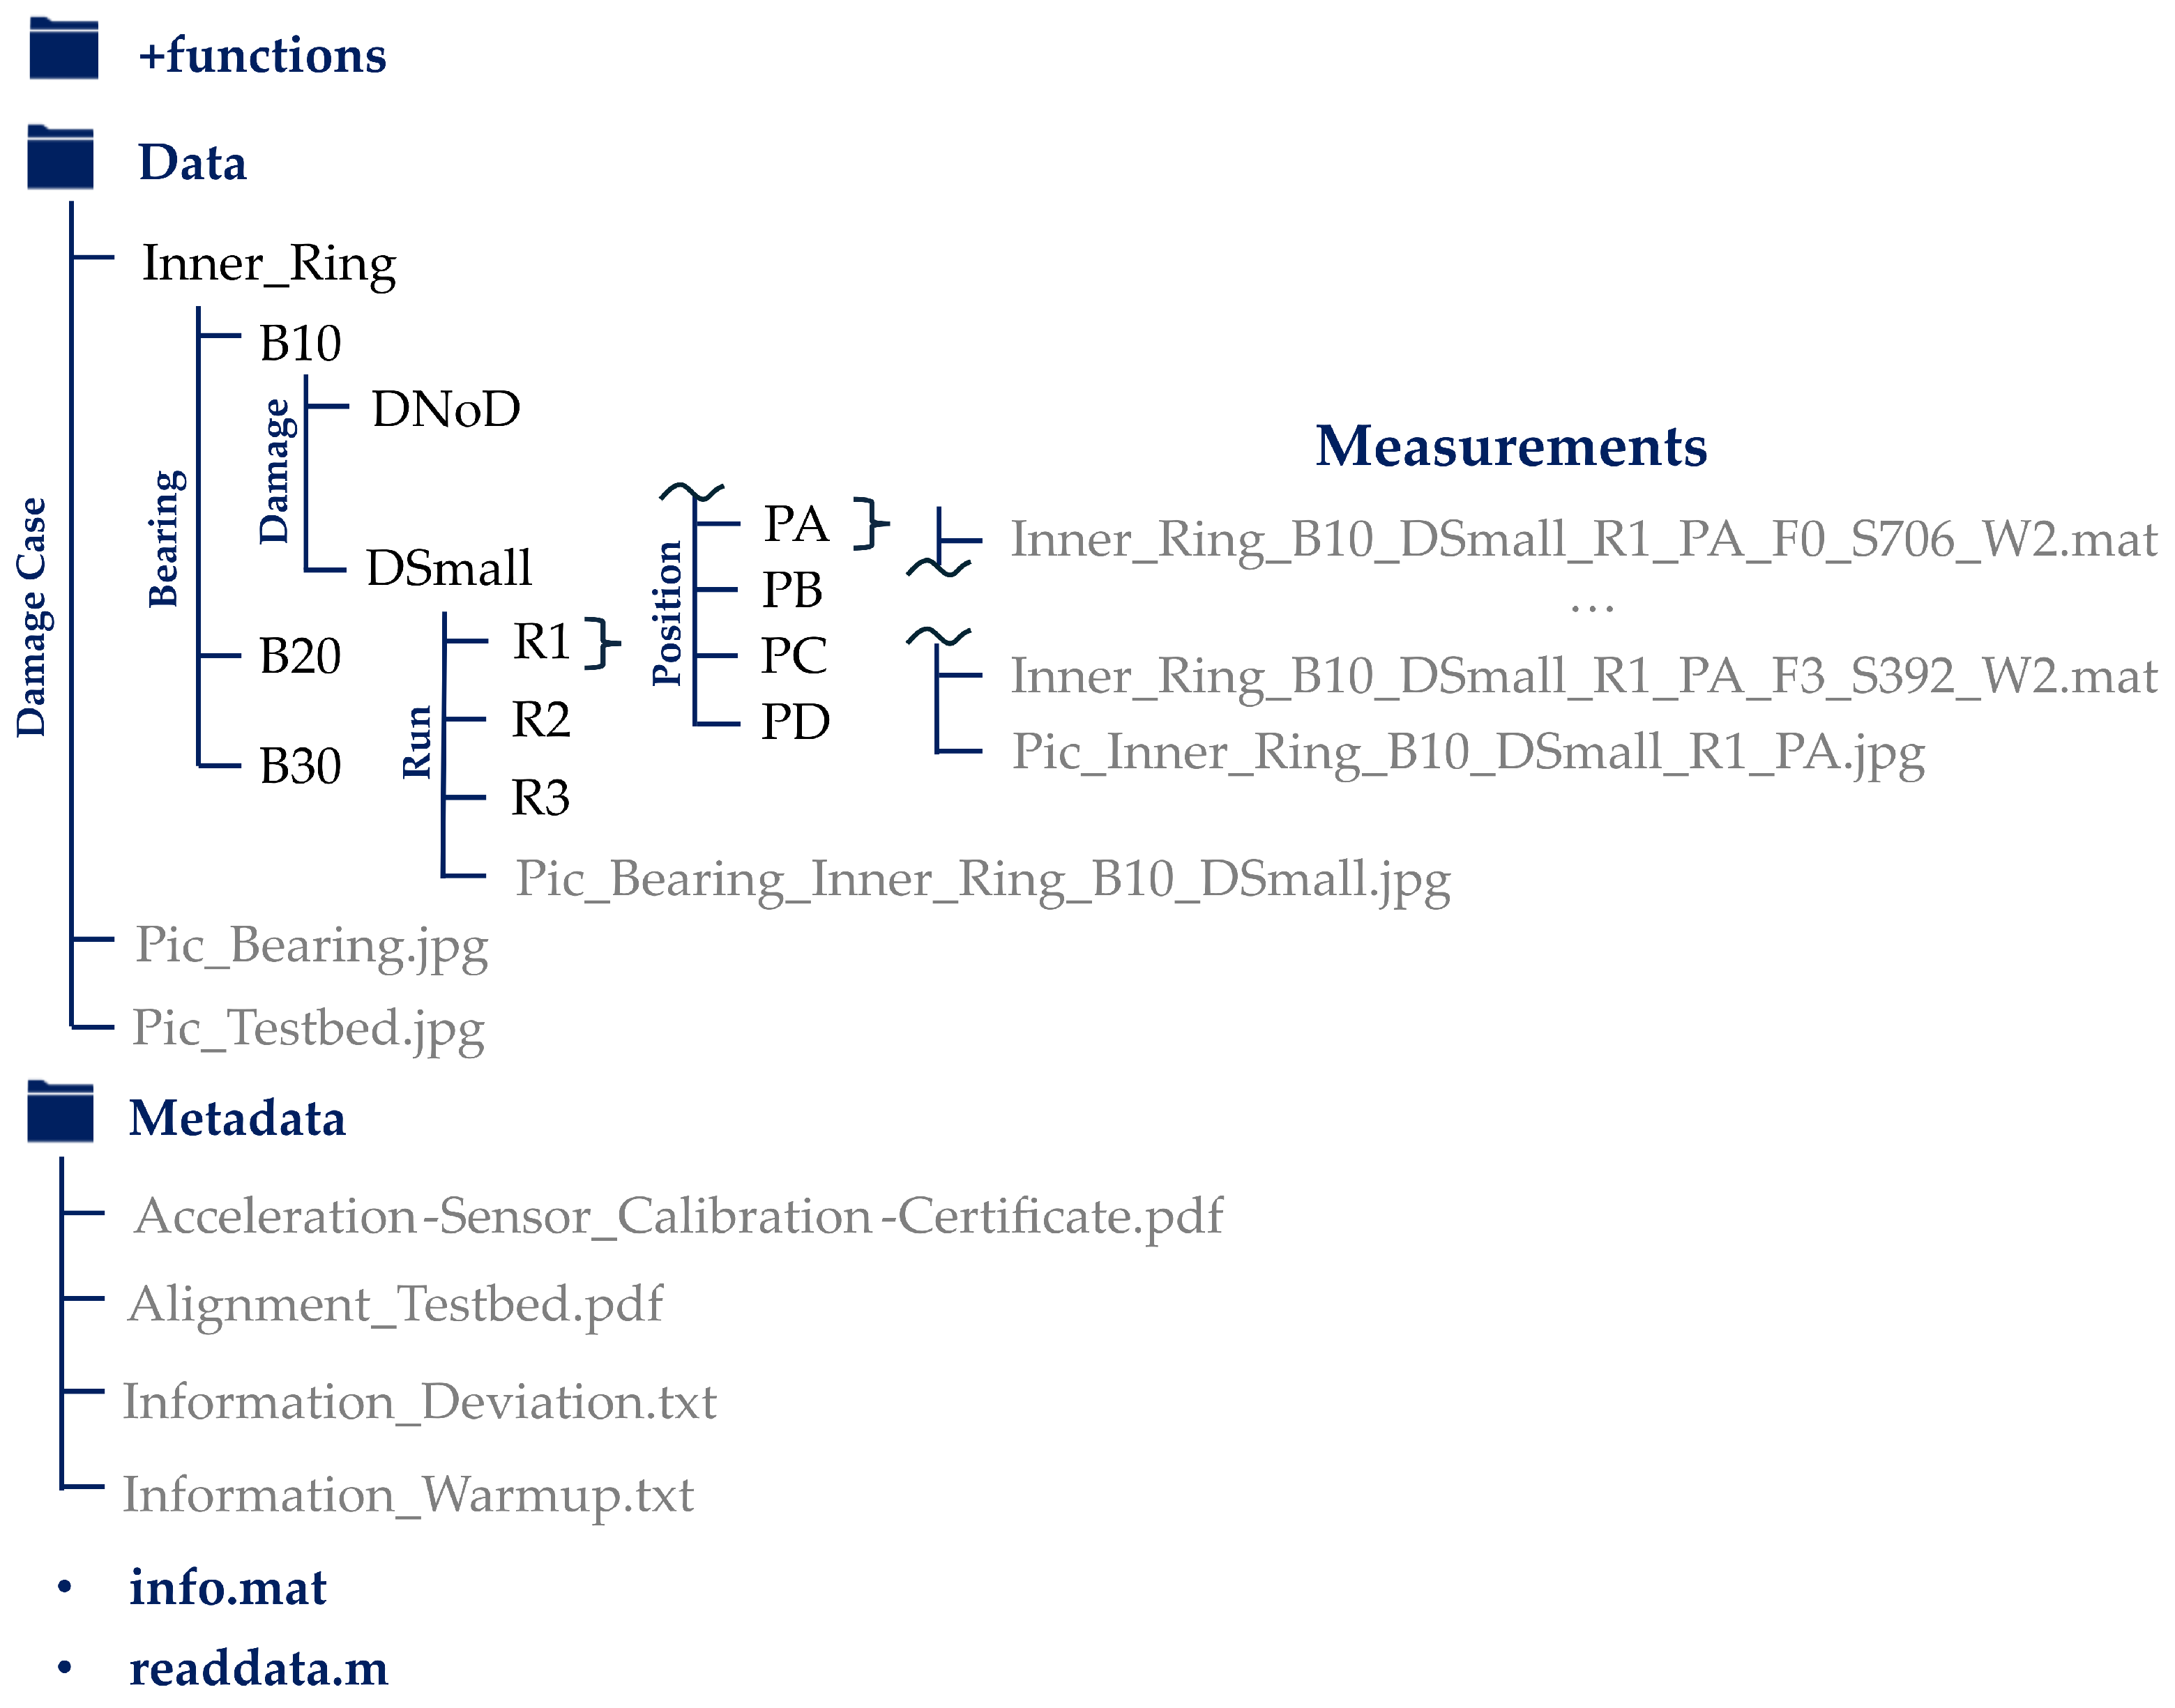
Figure 8.
Example of a LOGOCV for the bearing dataset.
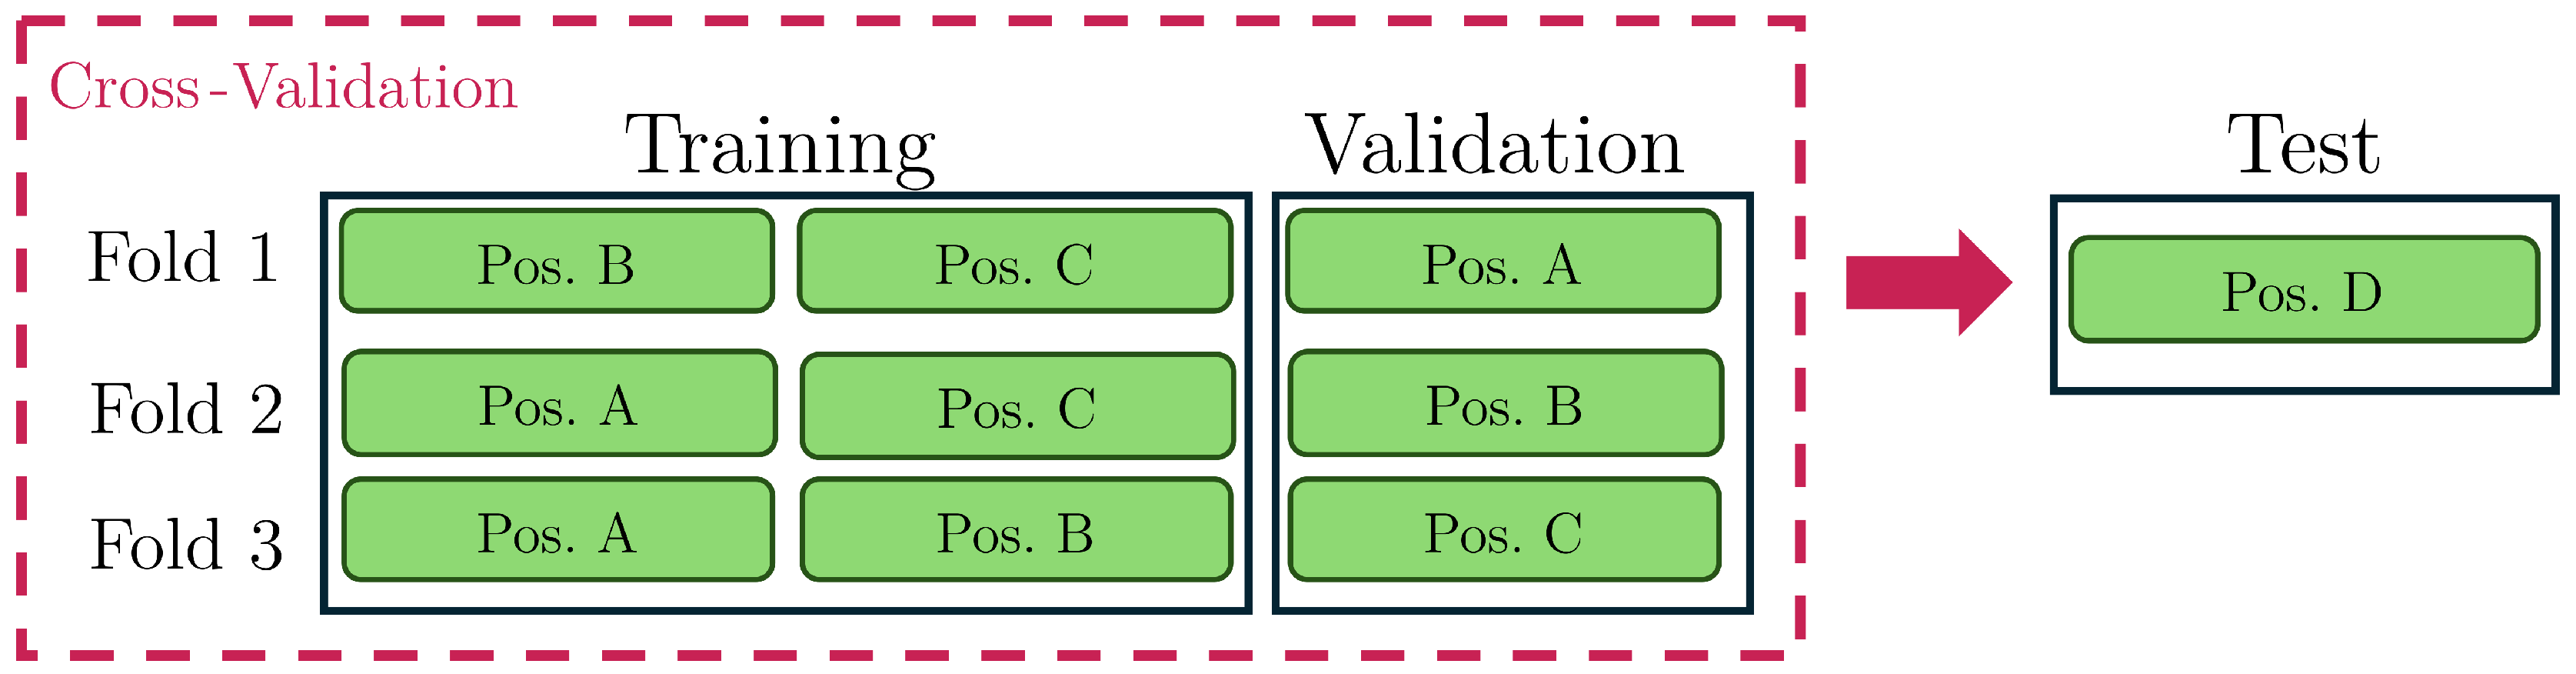
Figure 9.
Testbed configuration with the coupling mounted off-centered as assembly error.
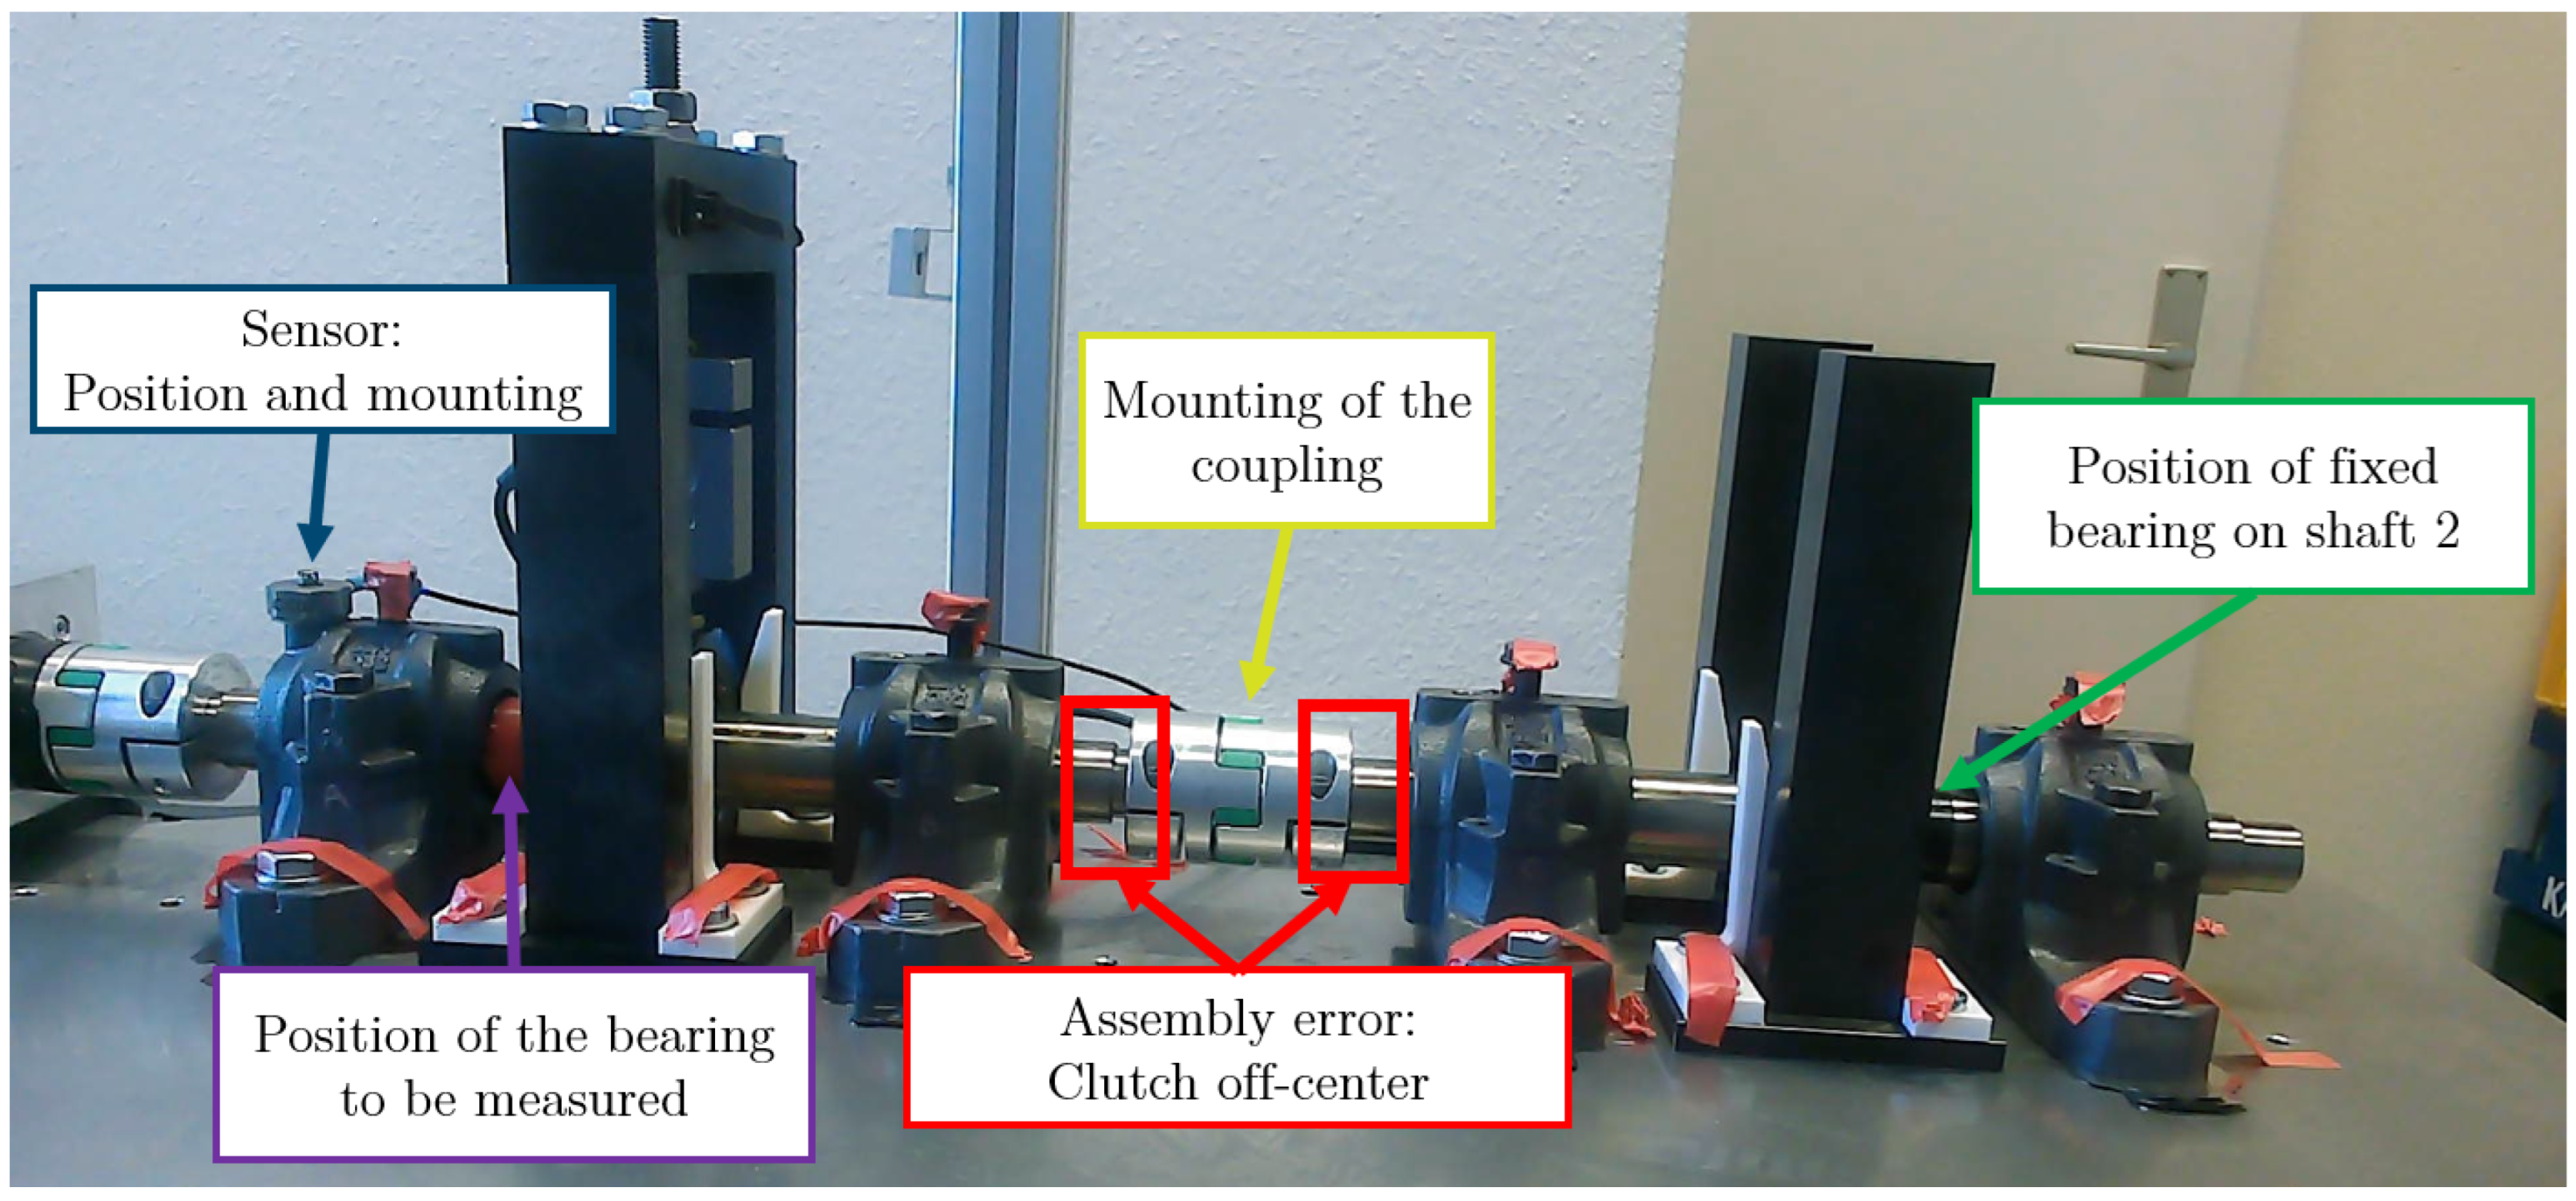
Table 1.
Basic frequency factors of the NU206-E-XL-TVP2 related to 1/s [6].
Table 1.
Basic frequency factors of the NU206-E-XL-TVP2 related to 1/s [6].
| Basic frequency factors | Abbreviation | Factor |
|---|---|---|
| Overrolling frequency factor on outer ring | 5.24 | |
| Overrolling frequency factor on inner ring | 7.76 | |
| Overrolling frequency factor on rolling element | 2.49 | |
| Ring pass frequency factor on rolling element | 4.97 | |
| Speed factor of rolling element set for rotating inner ring | 0.40 | |
| Speed factor of rolling element set for rotating outer ring | 0.60 |
Table 2.
Components of the testbed.
| Component | Model | Manufacturer |
|---|---|---|
| I. Mechanical System | ||
| Motor | EMMS-AS-70S-LS-RSB | Festo |
| Motor controller | CMMP-AS-C2-3A-M3 | Festo |
| Coupling | GWE 5106-24-11-25 | Ringfeder Power Transmission |
| Loose bearing (Cylindrical roller bearing) | NU206-E-XL-TVP2 | Schaeffler Technologies |
| Fixed bearing (Self-aligning ball bearing) | 1206-TVH | Schaeffler Technologies |
| Bearing Force-introduction (Cylindrical roller bearing) | NU207-E-XL-TVP2 | Schaeffler Technologies |
| II. Data Acquisition System | ||
| Accelerometer | 3233a | Dytran Instruments |
| Force Sensor | K-25 | Lorenz Messtechnik |
| Embedded Controller | cRIO 9040 | National Instruments |
| Vibration Input Module | NI-9232 | National Instruments |
| Voltage Input Module | NI-9215 | National Instruments |
Table 3.
Parameters for the design of experiments.
| Nr. | Parameter | Quantity | Label | Values |
|---|---|---|---|---|
| 1 | Bearing | 3 | B10, B20, B30 | 10, 20, 30 |
| 2 | Damage state | 2 | No damage, small damage | 0, 1 |
| 3 | Run (Position A to D) | 3 | R1, R2, R3 | 1, 2, 3 |
| 4 | Position | 4 | PA, PB, PC, PD | 1, 2, 3, 4 |
| 5 | Force level1 () | 4 | F0 , F2 , F1 , F3 | 0, 2, 1, 3 |
| 6 | Speed1 [rpm] | 4 | 706, 969, 85, 392 | 706, 969, 85, 392 |
| 7 | Worker | 2 | W1, W2 | 1,2 |
| 8 | Mounting sensor | 2 | Normal, flipped | 0, 1 |
| 9 | Mounting coupling | 4 | Normal, twisted, right-centered, left-centered | 0, 1, 2, 3 |
| 10 | Mounting second shaft | 2 | Normal, flipped | 0, 1 |
| 11 | Temperature [°C] | - | - | 21.6 - 22.7 |
| 12 | Rel. humidity [%] | - | - | 36.6 - 49.1 |
1 Randomized order of the parameters.
Disclaimer/Publisher’s Note: The statements, opinions and data contained in all publications are solely those of the individual author(s) and contributor(s) and not of MDPI and/or the editor(s). MDPI and/or the editor(s) disclaim responsibility for any injury to people or property resulting from any ideas, methods, instructions or products referred to in the content. |
© 2025 by the authors. Licensee MDPI, Basel, Switzerland. This article is an open access article distributed under the terms and conditions of the Creative Commons Attribution (CC BY) license (http://creativecommons.org/licenses/by/4.0/).
Copyright: This open access article is published under a Creative Commons CC BY 4.0 license, which permit the free download, distribution, and reuse, provided that the author and preprint are cited in any reuse.


