
Submitted:
04 April 2025
Posted:
07 April 2025
You are already at the latest version
Abstract
Nanostructures obtained as a by-product of the electrochemical synthesis of ZrO2 nanotube membranes have scarcely received any attention despite its enormous potential. This is mainly due to its size properties, morphology and composition. In the present work, we characterize these nanostructures and analyze its possible application as an additive in PVA-based coatings. The characterization was performed by XRF, SEM-EDS, TEM and XRD. The results showed that the nanostructures consist of tubular fragments generated during the formation of the ZrO2 membrane, with a dimension of 626.74 nm in width, a length of 1906.39 nm and a clear cubic structure. The ZrO2-PVA coating, which is prepared by using the spin coating technique, presented a uniform and homogenous particle distribution, which was later confirmed by FTIR, SEM and AFM. The optical transparency and thermal resistance were evaluated through UV-Vis and TGA, showing that the incorporation of ZrO2 as an additive improved its UV absorption properties and thermal stability during the pyrolysis stage. The results suggest that the ZrO2 nanostructures significantly improve the thermal and protective properties of the PVA-based coatings.

Keywords:
Zr nanostructures
; anodic synthesis
; PVA based coatings
; thermal resistance
1. Introduction
During the Zr anodic synthesis process to generate nanostructured ZrO2 surfaces (nanotubes, nanopeaks, nanopores), nanostructured by-products are also obtained, which accumulate and/or precipitate in the electrolyte solution. These by-products, which are generally ignored and thrown away, have received little to no research attention, mainly due to the predominant focus on the characteristics of synthesized nanostructures. The composition of said nanostructures has been deduced from the formation mechanisms of ZrO2 nanostructures, suggesting they might have valuable applications [1,2,3].
The physicochemical and morphological properties oh these nanostructures could significantly impact fields such as catalysis, biomaterials and coatings. In the coating field, the use of ZrO2 as an additive is known to improve abrasion resistance, thermal stability and its anti-corrosive properties [4,5,6]. Therefore, the use of these nanostructures could open up more opportunities for improving materials protection.
In this context, one of the materials that could most notably benefit from ZrO2 as an additive is Polyvinyl alcohol coating (PVA). The use of PVA as a coating material has great advantages such as being labeled as a green material, since it’s environmentally friendly and has a low ecological impact [7]. However, when used as coating, PVA shows some limitations, such as low thermal resistance and a tendency to wear out in extreme conditions [8,9]. When incorporating ZrO2 as an additive in PVA, it is expected to overcome these limitations, improving the coatings’ mechanical properties and thermal resistance, as well as enhancing its effectiveness in anti-corrosive protection [10,11,12].
In the present work, a detailed characterization of the composition of the generated nanostructures as a by-product of the anodic synthesis of Zr surfaces to produce ZrO2 nanotube membranes (ZrO2 NTs) was carried out, as well as an evaluation of its potential as an additive to PVA coatings. Through the characterization, we propose an innovative and sustainable application for these often overlooked Zr nanostructures, which could offer a significant improvement in the thermal and protective properties of the coating, thus contributing to the development of more efficient and long lasting materials.
2. Materials and Methods
2.1. Synthesis and Zr Nanostructure Recovery
The obtention of Zr nanostructures were collected from a removable membrane of a previously published ZrO2 NTs [3]. For its synthesis, a high purity Zr sheet (99.1%, Baoji Hanz Metal Material Co. Ltd. China) with a 0.05 mm thickness and a mirror-like finish was used. The sheet was cut into 3x5 cm rectangles. Furthermore, the samples underwent a cleaning process with distilled water and ethanol for 15 min each, followed by a 24h drying period.
For the anodic synthesis, the electrolyte consisted of a mixture of 1 M (NH4)2SO4 and 0.75 M NH4F in distilled water. The process was performed in a two-electrode cell, where the Zr sheet was used as a working electrode and Pt electrode acted as a counter electrode. Then, 40 ml of the electrolyte solution were added into the cell and the process was performed using a power source (DC power supply 305D, XPOWER) which supplied a constant voltage of 25 V during 20 min at room temperature.
After this time, the electrodes were unmounted from the cell and the electrolyte and its by-products from the synthesis were recovered. To separate the by-products from the electrolyte synthesis, a vacuum filtration system was performed by using a Whatmann No. 1 filter. The by-products resting in the filter were then washed with deionized water until neutralized. A total of 0.1907 ± 0.008 g of dried, filtered by-products were obtained and stored in a desiccator until its characterization and application.
2.2. Coating preparation
The PVA coating was prepared using the drop casting and spinning technique. In order to do so 10 g of PVA were dissolved in 100 ml of deionized water at 80 °C, leaving it to cool to room temperature. In an Eppendorf tube, a ZrO2 suspension was prepared, adding 0.5 g of the ZrO2 nanostructures with 1 ml of deionized water. The suspension underwent a sonication process with a probe (OMNI SONIC RUPTOR 400; 50% power, 50 Hz) for 10 min to secure a homogenous dispersion of the ZrO2 nanostructures. Lastly, 9 ml of the PVA solution and 1 ml of the ZrO2 suspension were mixed for 5 min using a vortex until a colloidal ZrO2-PVA solution was obtained.
0.04 g of the colloidal ZrO2-PVA solution was deposited into a 436 stainless steel sheet with 1x1 cm dimensions (Table S1) using a micropipette. To achieve a uniform coating, the spin coating technique was used at 1800 rpm for 30 sec. Finally, the coated sheets were left in a desiccator for 24 h until its characterization.
2.3. Elemental Composition of ZrO2 Nanostructure Analysis
The elemental composition and oxides of the ZrO2 nanostructures were determined by X-ray fluorescence spectroscopy (XRF). The XRF analysis was performed using a Shimadzu spectrometer equipped with a Rh X-ray tube using a voltage of 30 kV. Prior to analysis, 0.5 g of the ZrO2 nanostructures were placed in a 32 mm sample holder for subsequent measurement.
2.4. Morphological Characterization and Chemical Composition
The morphology, distribution and chemical composition of the ZrO2 nanostructures were characterized using scanning electron microscopy (SEM) coupled to an energy dispersive spectroscopy (EDS) system (JEOL-TESCAN-BRUCKER). The samples were prepared by manually depositing the ZrO2 nanostructures on a carbon ribbon with a lab spatula. For the capture of the micrographs, an accelerating voltage of 15 kV was used, with a working distance of 10 mm and using a secondary electron detector (BES). Chemical composition analysis was carried out with an acquisition time of 1.0 second, and the results were processed through Brucker qualitative and quantitative component classification software.
2.5. Morphological Characterization and Crystallinity
The morphology and size of the ZrO2 nanostructures were characterized through transmission electronic microscopy (TEM) by using a JEOL 2010 microscope operating at an accelerating voltage of 200 kV. The samples were prepared by depositing a drop of ZrO2 colloid into a carbon-coated Cu cell, followed by a drying process at room temperature in a desiccator. The ZrO2 nanostructures’ crystalline structure was studied through selected area electron diffraction (SAED), obtained during the TEM characterization.
The crystalline structure of ZrO2 nanostructures was determined through X-ray diffraction (XRD). The measurements were done using a BRUKER D8 ADVANCE diffractometer equipped with a Cu-Kα (λ1=1.54059 y λ2=1.54441) radiation source working at a 40 kV and 30 mA. The diffraction patterns were registered at a 2θ range of 5° to 100° with a step size of 0.01° and a time measurement of 1 s per step. The crystallographic phases were identified by comparing diffraction patterns obtained by the information provided by the Joint Committee on Powder Diffraction Standards (JCPDS), using JCPDS 98-005-3998 crystallographic chart.
2.6. Transparency Evaluation
In order to evaluate the ZrO2-PVA coating transparency, the coating was manually removed with a spatula. The obtained film was characterized through UV-Vis spectroscopy using an integrating sphere with a 6 mm opening in a Shimadzu 2600 spectrophotometer in transmittance mode. The scan was performed with a wavelength between 200 nm to 800 nm with a scanning speed of 0.5 nm/s. the results were compared with a film made purely with PVA.
2.7. ZrO2 Incorporation in the Polymeric Matrix
The presence of ZrO2 in the polymeric matrix and the functional groups of PVA were analyzed through Fourier Transformed Infrared (FTIR) spectroscopy, using a PerkinElmer Frontier equipment. To run the analysis, a drop of ZrO2-PVA solution was poured into the equipment’s attenuated total reflection (ATR) accessory and the water was left to evaporate. Furthermore, an analysis with a range of 4000 to 400 cm⁻¹ and a scanning speed of 0.1 cm⁻¹ was performed.
2.8. Quality and Surface Roughness of the Coating
The topography of the ZrO2 coating was compared to the un-coated stainless steel sample through atomic force microscopy (AFM) by using a Park Systems NX10 microscope. The pictures were taken using the no contact mode (NCM) at a scanning frequency of 0.8 Hz, c covering an area of 5 µm x 5 µm.
2.9. Thermic Resistance
The thermic resistance of ZrO2-PVA was compared to a pure PVA coating by thermogravimetric analysis (TGA), using a PerkinElmer STA 6000 instrument. An approximate of 5 mg of coating were placed in a Al2O3 crucible. The analysis was done under a flow of 19.5 ml/min, with a temperature range of 30 °C to 800 °C with a ramp of 10 °C/min.
3. Results and Discussion
3.1. Characterization of the ZrO2 Nanostructures
The chemical composition of the recovered ZrO2 nanostructures was characterized by XRF before and after undergoing a filtration process. The intention behind this study is to determine the origin of these by-products and to confirm their cleanliness after the filtration process.
In the elemental analysis (Figure 1a), before being filtered, the composition of the ZrO2 nanostructures consists mainly of S, Zr and P, aside from minor remains from the alloy (Hf, Ca y Cs). Likewise, the oxide analysis showed mainly SO3, ZrO2 and HfO2 (Figure 1b). This composition was expected and is originated from complexes such as [ZrF6]2- which are created during the formation of pores or tubes in Zr. As it was explained in our previous work, ammonium sulfate and ammonium fluoride are crucial in the catchment and precipitation of Zr, thus the creation of nanotubes [3].
On the other hand, the composition after being filtered (Figures 1c and d) shows the absence of S in the ZrO2 nanostructures. This is due to the S originated from the remaining ammonium sulfate has dissolved in water during the washing process, leaving particles in the main Zr composition.
By the SEM characterization, the shape and distribution of the ZrO2 nanostructures were determined (Figures 2a-c). In the same way, because of the mechanism described in our previous work, the ZrO2 nanostructure consists mainly of bars. These bars are tubes walls that have been fragmented during the anodic process (rupture and growth of the oxide layer).
Based on what was captured in the micrograph (Figure 2a), the bar distribution tends to be uniform, with a width of 626.74 nm and a length of 1906.39 nm (Figures 2b and c). The size obtained solely on the synthesis is within the range of the formed structures found in processes such as chemical conversion coating [13,14,15]. The EDS characterization determined the composition by area and by map a zone with ZrO2 bars (Figure 2d-g). The bars show a Zr, O and F composition, conjugating with the XRF analysis.
The TEM characterization confirmed that the by-products of the ZrO2 membrane synthesis are fragmented tubes, showing with greater detail the shape of the tube and wall thickness (Figure 3a). The micrographs captured by HR-TEM, SAED and XRF (Figure 3b-f) all show that the nanostructures are made up by a cubic structure and detected an interplanar spacing of 0.23 nm in correspondence to plane (200). Interestingly, this is the crystallinity of ZrO2 that requires the most energy in order to be obtained. However, due to the electrolyte and electrochemical parameters, the obtaining of this crystallinity was already shown in previous research [3,16].
3.2. Coating Characterization
3.2.1. Distribution and Topography
The incorporation of ZrO2 nanostructures into the polymeric PVA matrix was characterized by SEM-EDS. When comparing the coated and uncoated micrographs, the incorporation of the ZrO2-PVA coating is notorious (Figures 3a, b, d, e). Interestingly, the ZrO2 distribution is uniform throughout the surface, and when seen up-close (Figures 3e and f), the union is appreciated in different tube fragments, achieving a flower form. This correct ZrO2 distribution has the advantage of improving its mechanic properties, energy storage and dielectric response [17,18]. It is important to mention that the coating quality is maintained through the stainless steel area, which confirms that the used quantity and spin parameters were the correct ones for its application.
The AFM topographic characterization also highlights the differences of uncoated (Figure 4g-h) and coated (Figure 4i and j) stainless steel. Primarily, the coated surface looks smooth due to the polymeric surface distribution. In turn, they captured the ZrO2 structures on the surface, as in SEM microscopies (Figure 4d and e). The average roughness values (Ra) were 106.25 nm and 182.37 nm for the uncoated and coated surface, respectively. This increase in Ra is due to the dispersed ZrO2 particles in the polymeric matrix.
3.2.2. Coating Properties
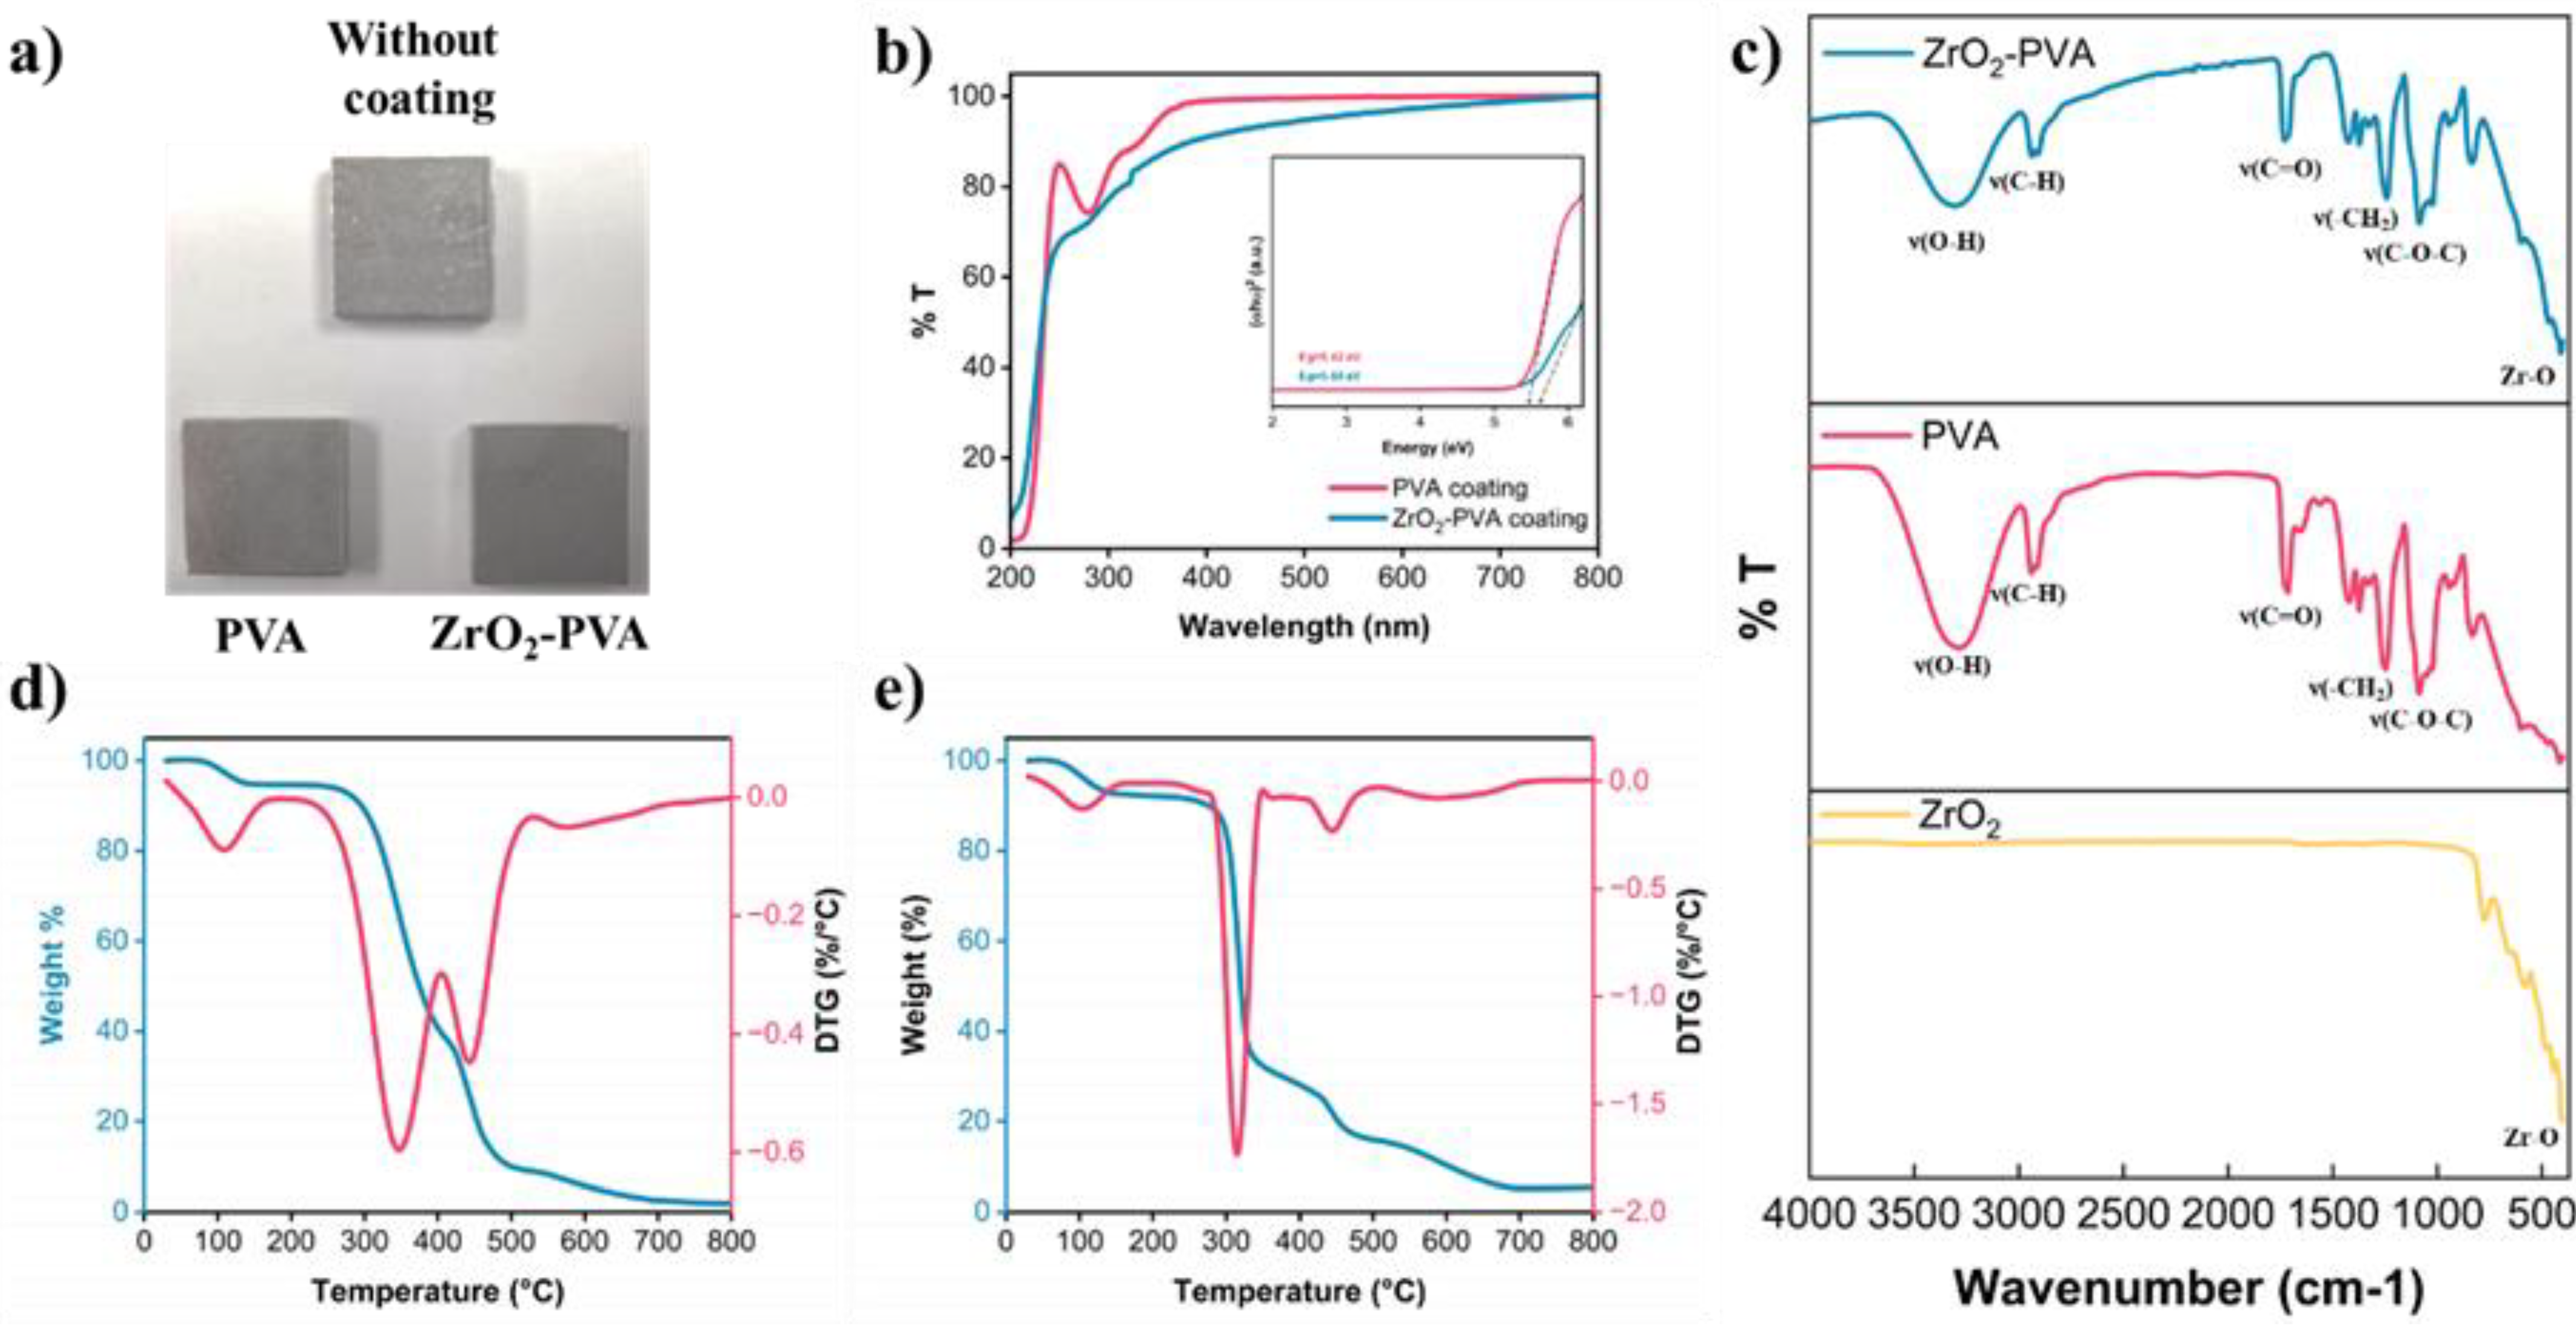
A visual inspection of the coatings reveals that both pure PVA and de ZrO₂-PVA coatings exhibit transparency (Figure 5a). The transmittance of these coatings was evaluated by UV-Vis spectroscopy (Figure 5b). In the UV region (200-400 nm), both coatings show low transmittance, indicating a high UV radiation absorption by the polymeric matrix. Notably, the ZrO₂-PVA coating shows a lower increase in transmittance between 300 and 400 nm, suggesting that the incorporation of ZrO₂ into the PVA matrix enhances UV absorption [19,20]. This is further supported by the increase in the optical band gap (Eg) to 5.60 eV with the addition of addition of ZrO2 (Figure 5b).
In the visible region (400-700 nm), the transmittance of both coatings increases significantly; however, the ZrO2-PVA coating shows a slightly lower transmittance, indicating that the addition of ZrO2 reduces the transparency of the coating.
In the region closer to the infrared (700-800 nm), both coatings achieve approximately 100% transmittance. These observations demonstrate that the addition of ZrO2 to the PVA matrix primarily improves UV absorption. This behavior is consistent with the expected performance of metal oxides, such as ZnO2, which is commonly used as a UV blocker. In particular, nanoparticulate aggregates in sunscreens generate a protective layer against UV radiation, remaining invisible to the human eye [21]. Other potential applications for these coatings, where UV absorption and transparency are critical, include optical devices and packaging materials [22,23].
FTIR characterization confirmed the integration of ZrO2 into the PVA matrix (Figure 5c). The spectrum of ZrO2 shows a band at 404 cm-¹, corresponding to Zr-O stretching. In the case of PVA, the characteristic bands of this polymer were observed, such as those located at 3310 cm-¹, 2940 cm-¹ and 2908 cm-¹, corresponding to O-H and C-H stretching, respectively [24,25]. Additionally, bands were identified at 1832 cm-¹, assigned to C=O stretches; at 1424 cm-¹, assigned to -CH₂ buckling; and at 1086 cm-¹, corresponding to C-O-C stretches. In the spectrum of the ZrO2-PVA compound, a merging of the characteristic bands of the individual spectra of PVA and ZrO2 was observed.
3.2.3. Thermal Stability
The thermal stability and decomposition behavior of PVA and ZrO2-PVA coatings were studied by thermogravimetric analysis (TGA) and derivative thermogravimetry (DTG). The TGA and DTG curves of pure PVA coating (Figure 5d) and ZrO2-PVA composite coating (Figure 5e) reveal distinctive thermal degradation patterns.
The TGA curve of pure PVA shows an initial weight loss around 100 °C, attributed to evaporation of absorbed moisture. Between 250 °C and 400 °C, a significant weight loss is observed, corresponding to the decomposition of the PVA main chain. This process involves the elimination of hydroxyl groups and depolymerization of the PVA chains. The maximum rate of decomposition, as evidenced by the DTG peak, occurs at around 340 °C [26,27].
In contrast, the TGA curve of the ZrO2-PVA composite coating shows a similar initial weight loss, also due to moisture evaporation. However, the main thermal degradation point shifts towards slightly lower temperatures (315 °C), indicating a significant influence of the ZrO2 particles on the initial decomposition of the PVA. Despite this initial shift in the pyrolysis stage, the presence of ZrO2 shifts the final pyrolysis stage (445 °C) and decreases the magnitude of weight loss in the final stages of thermal degradation, thus suggesting that these nanoparticles act as thermal barriers, providing additional stability to the PVA matrix [28,29].
Furthermore, the residual mass of the ZrO2-PVA compound at 800 °C is significantly higher (~20%) compared to pure PVA, which is due to the presence of thermally stable ZrO2 particles remaining after complete degradation of the organic matrix. These observations are in agreement with the expected behavior of inorganic nanomaterials, which improve the thermal performance of polymeric matrices [30]. The incorporation of ZrO2 into the PVA matrix not only improves the thermal stability of the coating, but also modifies its decomposition mechanism, as observed in the broader and more complex DTG profile. These findings suggest that ZrO2 nanoparticles act as physical barriers and stabilizers in the polymer matrix, which could be beneficial for applications requiring a high temperature performance.
The improved thermal stability of the ZrO2-PVA compound coating highlights its potential for advanced applications, especially in high-temperature environments where pure PVA may not be enough. The ceramic nature of ZrO2 contributes to a higher residual weight, providing structural integrity even after the degradation of the polymeric component. This property could improve the durability and longevity of the coating, making it suitable for use in extreme thermal conditions.
4. Conclusions
In the present study, we demonstrated the successful use of ZrO2 nanostructures as an additive in PVA-based coatings applied on 436 stainless steel. The characterization revealed that the nanostructures consist of ZrO2 tube fragments with cubic crystallinity, which are derived from the anodic synthesis of nanotubes, with average dimensions of 626.74 nm in width and 1906.39 nm in length. The obtained coating not only maintains the transparency of pure PVA, but also increases its UV range absorption capacity (Eg = 5.60 eV). In addition, it significantly improved the thermal stability, especially in the final pyrolysis stages. These results are supported by the structure and topography obtained by both SEM and AFM, which show how the homogeneous dispersion of ZrO2 nanostructures contributes to the observed functional improvements. Thus, ZrO2 nanostructures are positioned as a valuable additive to improve the thermal and protective properties of PVA-based coatings.
Supplementary Materials
The following supporting information can be downloaded at: www.mdpi.com/xxx/s1, Table S1: Composition of stainless steel 436 by laser-induced breakdown spectroscopy (LIBS); Table S2: Elemental characterization of ZrO2 nanostructures from XRF spectra before filtration; Table S3: Oxide characterization of ZrO2 nanostructures from XRF spectra before filtration; Table S4: Elemental characterization of ZrO2 nanostructures from XRF spectra after filtration; Table S5: Oxide characterization of ZrO2 nanostructures from XRF spectra after filtration; Table S6: Bands and assignation from FTIR spectra of ZrO2 and coatings.
Author Contributions
The following statements should be used “Conceptualization, B.V.-S. and J.S.-C.; methodology, B.V.-S.; software, J.S.-C.; validation, J.C.-S., M.C.-A and J.C-G.; formal analysis, B.V.-S.; investigation, J.S.-C.; resources, M.C.-A.; data curation, E.B.-P.; writing—original draft preparation, B.V.-S. and J.S.-C.; writing—review and editing, E.B.-P and J.C.-S.; visualization, J.C.-G.; supervision, J.S.-C.; project administration, B.V.-S.; funding acquisition, E.B.-P. All authors have read and agreed to the published version of the manuscript.” Please turn to the CRediT taxonomy for the term explanation. Authorship must be limited to those who have contributed substantially to the work reported.
Funding
This research received no external funding.
Institutional Review Board Statement
Not applicable.
Informed Consent Statement
Not applicable.
Acknowledgments
We thank to Instituto de Ingenieria of Universidad Autónoma de Baja California.
Conflicts of Interest
The authors declare no conflicts of interest.
References
- Fang, D.; Liu, S.; Luo, Z.; Xiong, C.; Xu, W. Facile Fabrication of Freestanding Through-Hole ZrO2 Nanotube Membranes via Two-Step Anodization Methods. Appl. Surf. Sci. 2012, 258, 6217–6223. [Google Scholar] [CrossRef]
- Li, L.; Yan, D.; Lei, J.; He, Y.; Xu, J.; Li, N.; Zhang, S. In Situ Investigation of Initial Stage Growth of Anodic ZrO2 Nanotubes by Spectroscopic Ellipsometry. Electrochem. Commun. 2014, 42, 13–16. [Google Scholar] [CrossRef]
- Salomón-Carlos, J.; Valdez-Salas, B.; Castillo-Saenz, J.; Beltrán-Partida, E. One-Step Synthesis of Freestanding and Translucent ZrO2 Nanotube Membranes by Direct Electrochemical Anodization. Mater. Lett. 2024, 368, 136635. [Google Scholar] [CrossRef]
- Catauro, M.; Barrino, F.; Bononi, M.; Colombini, E.; Giovanardi, R.; Veronesi, P.; Tranquillo, E. Coating of Titanium Substrates with ZrO2 and ZrO2-SiO2 Composites by Sol-Gel Synthesis for Biomedical Applications: Structural Characterization, Mechanical and Corrosive Behavior. Coatings 2019, 9, 200. [Google Scholar] [CrossRef]
- Sinitsyn, D. Yu.; Anikin, V.N.; Eremin, S.A.; Yudin, A.G. Protective Coatings Based on ZrO2–Y2O3 and Al2O3–TiO2 Systems with Modifying Additives on CCCM. Refract Ind Ceram 2017, 58, 194–201. [Google Scholar] [CrossRef]
- Song, X.; Ding, Y.; Zhang, J.; Jiang, C.; Liu, Z.; Lin, C.; Zheng, W.; Zeng, Y. Thermophysical and Mechanical Properties of Cubic, Tetragonal and Monoclinic ZrO2. J. Mater. Res. Technol. 2023, 23, 648–655. [Google Scholar] [CrossRef]
- Hallensleben, M.L. Polyvinyl Compounds, Others. In Ullmann’s Encyclopedia of Industrial Chemistry; Wiley-VCH, Ed.; Wiley, 2000. [CrossRef]
- Kwon, H.-J.; Hong, S.-M.; Park, S.-M.; Lee, C.W. Characterization of Acid-Modified Polyvinyl Alcohol and Its Application to Barrier-Coated Paper for Eco-Friendly Food Packaging. Food Packag. Shelf Life 2024, 43, 101271. [Google Scholar] [CrossRef]
- Suleiman, G.S.A.; Zeng, X.; Chakma, R.; Wakai, I.Y.; Feng, Y. Recent Advances and Challenges in Thermal Stability of PVA -based Film: A Review. Polym. Adv. Techs 2024, 35, e6327. [Google Scholar] [CrossRef]
- Mutlu, I.H.; Emre, M.C.; Kaya, A.O. A Comparison of the Corrosion Resistance of Galvanized Low Steel with Solgel Method Coated ZrO2, ZrO2+Polymer Coating. Kuwait J. Sci. 2023, 50, 524–538. [Google Scholar] [CrossRef]
- Petousis, M.; Moutsopoulou, A.; Korlos, A.; Papadakis, V.; Mountakis, N.; Tsikritzis, D.; Ntintakis, I.; Vidakis, N. The Effect of Nano Zirconium Dioxide (ZrO2)-Optimized Content in Polyamide 12 (PA12) and Polylactic Acid (PLA) Matrices on Their Thermomechanical Response in 3D Printing. Nanomaterials 2023, 13, 1906. [Google Scholar] [CrossRef]
- Simon, S.M.; Chandran, A.; George, G.; Sajna, M.S.; Valparambil, P.; Kumi-Barmiah, E.; Jose, G.; Biju, P.R.; Joseph, C.; Unnikrishnan, N.V. Development of Thick Superhydrophilic TiO2 –ZrO2 Transparent Coatings Realized through the Inclusion of Poly(Methyl Methacrylate) and Pluronic-F127. ACS Omega 2018, 3, 14924–14932. [Google Scholar] [CrossRef] [PubMed]
- Saei, E.; Ramezanzadeh, B.; Amini, R.; Kalajahi, M.S. Effects of Combined Organic and Inorganic Corrosion Inhibitors on the Nanostructure Cerium Based Conversion Coating Performance on AZ31 Magnesium Alloy: Morphological and Corrosion Studies. Corros. Sci. 2017, 127, 186–200. [Google Scholar] [CrossRef]
- Valdez, B.; Kiyota, S.; Stoytcheva, M.; Zlatev, R.; Bastidas, J.M. Cerium-Based Conversion Coatings to Improve the Corrosion Resistance of Aluminium Alloy 6061-T6. Corros. Sci. 2014, 87, 141–149. [Google Scholar] [CrossRef]
- Zhao, Y.; Chen, X.-H.; Hu, J.-M. A Novel and Facile Method for Constructing Micro-Nano Porous Phytic Acid Pretreatment Layer on Metal Surface. Corros. Sci. 2021, 186, 109464. [Google Scholar] [CrossRef]
- Tsuchiya, H.; Macak, J.M.; Taveira, L.; Schmuki, P. Fabrication and Characterization of Smooth High Aspect Ratio Zirconia Nanotubes. Chem. Phys. Lett. 2005, 410, 188–191. [Google Scholar] [CrossRef]
- Rani, G.E.; Murugeswari, R.; Siengchin, S.; Rajini, N.; Kumar, M.A. Quantitative Assessment of Particle Dispersion in Polymeric Composites and Its Effect on Mechanical Properties. J. Mater. Res. Technol. 2022, 19, 1836–1845. [Google Scholar] [CrossRef]
- Wu, L.; Cai, Z.; Li, L.; Wang, X. Breakdown Strength and Energy Density Enhancement in Polymer-Ceramic Nanocomposites: Role of Particle Size Distribution. Compos. Sci. Technol. 2021, 212, 108868. [Google Scholar] [CrossRef]
- Bashir, A.; Farooq, M.; Malik, A.; Naseem, S.; Bhatti, A.S. UV-A Treatment of ZrO2 Thin Films Fabricated by Environmental Friendlier Water-Based Solution Processing: Structural and Optical Studies. Coatings 2021, 11, 821. [Google Scholar] [CrossRef]
- De Sá, R.G.; Arantes, T.M.; De Macedo, E.F.; Dona’, L.M.; Pereira, J.C.F.; Hurtado, C.R.; Varghese, R.J.; Oluwafemi, O.S.; Tada, D.B. Photoprotective Activity of Zirconia Nanoparticles. Colloids Surf. B: Biointerfaces 2021, 202, 111636. [Google Scholar] [CrossRef]
- Nohynek, G.J.; Lademann, J.; Ribaud, C.; Roberts, M.S. Grey Goo on the Skin? Nanotechnology, Cosmetic and Sunscreen Safety. Crit. Rev. Toxicol. 2007, 37, 251–277. [Google Scholar] [CrossRef]
- Aegerter∗, M.A.; Al-Dahoudi, N.; Solieman, A.; Kavak, H.; Oliveira, P. Transparent Conducting Coatings Made by Chemical Nanotechnology Processes. Mol. Cryst. Liq. Cryst. 2004, 417, 105–114. [Google Scholar] [CrossRef]
- Szyszka, B.; Dewald, W.; Gurram, S.K.; Pflug, A.; Schulz, C.; Siemers, M.; Sittinger, V.; Ulrich, S. Recent Developments in the Field of Transparent Conductive Oxide Films for Spectral Selective Coatings, Electronics and Photovoltaics. Curr. Appl. Phys. 2012, 12, S2–S11. [Google Scholar] [CrossRef]
- Horti, N.C.; Kamatagi, M.D.; Nataraj, S.K.; Wari, M.N.; Inamdar, S.R. Structural and Optical Properties of Zirconium Oxide (ZrO2 ) Nanoparticles: Effect of Calcination Temperature. Nano Ex. 2020, 1, 010022. [Google Scholar] [CrossRef]
- Mansur, H.S.; Sadahira, C.M.; Souza, A.N.; Mansur, A.A.P. FTIR Spectroscopy Characterization of Poly (Vinyl Alcohol) Hydrogel with Different Hydrolysis Degree and Chemically Crosslinked with Glutaraldehyde. Mater. Sci. Eng. C 2008, 28, 539–548. [Google Scholar] [CrossRef]
- Mohsin, M.; Hossin, A.; Haik, Y. Thermal and Mechanical Properties of Poly(Vinyl Alcohol) Plasticized with Glycerol. J Appl. Polym. Sci 2011, 122, 3102–3109. [Google Scholar] [CrossRef]
- Tsioptsias, C.; Fardis, D.; Ntampou, X.; Tsivintzelis, I.; Panayiotou, C. Thermal Behavior of Poly(Vinyl Alcohol) in the Form of Physically Crosslinked Film. Polymers 2023, 15, 1843. [Google Scholar] [CrossRef]
- Channe, S.S.; Singh, R.; Kulkarni, S.G. Effect of Metal Oxide Nanoparticles on Thermal Behavior of Polyvinyl Alcohol. Polym. Bull. 2024, 81, 3403–3438. [Google Scholar] [CrossRef]
- Rezaei, A.; Katoueizadeh, E.; Zebarjad, S.M. Investigating of the Influence of Zinc Oxide Nanoparticles Morphology on the Properties of Electrospun Polyvinyl Alcohol/Chitosan (PVA/CS) Nanofibers. J. Drug Deliv. Sci. Technol. 2023, 86, 104712. [Google Scholar] [CrossRef]
- Davar, F.; Majedi, A.; Mirzaei, A. Polyvinyl Alcohol Thin Film Reinforced by Green Synthesized Zirconia Nanoparticles. Ceram. Int. 2018, 44, 19377–19382. [Google Scholar] [CrossRef]
Figure 1.
Chemical characterization of the ZrO2 nanostructures. a) XRF elemental analysis before the cleaning process, b) XRF oxide composition before the cleaning process, c) XRF elemental analysis after the cleaning process, d) XRF oxide composition after the cleaning process.
Figure 1.
Chemical characterization of the ZrO2 nanostructures. a) XRF elemental analysis before the cleaning process, b) XRF oxide composition before the cleaning process, c) XRF elemental analysis after the cleaning process, d) XRF oxide composition after the cleaning process.
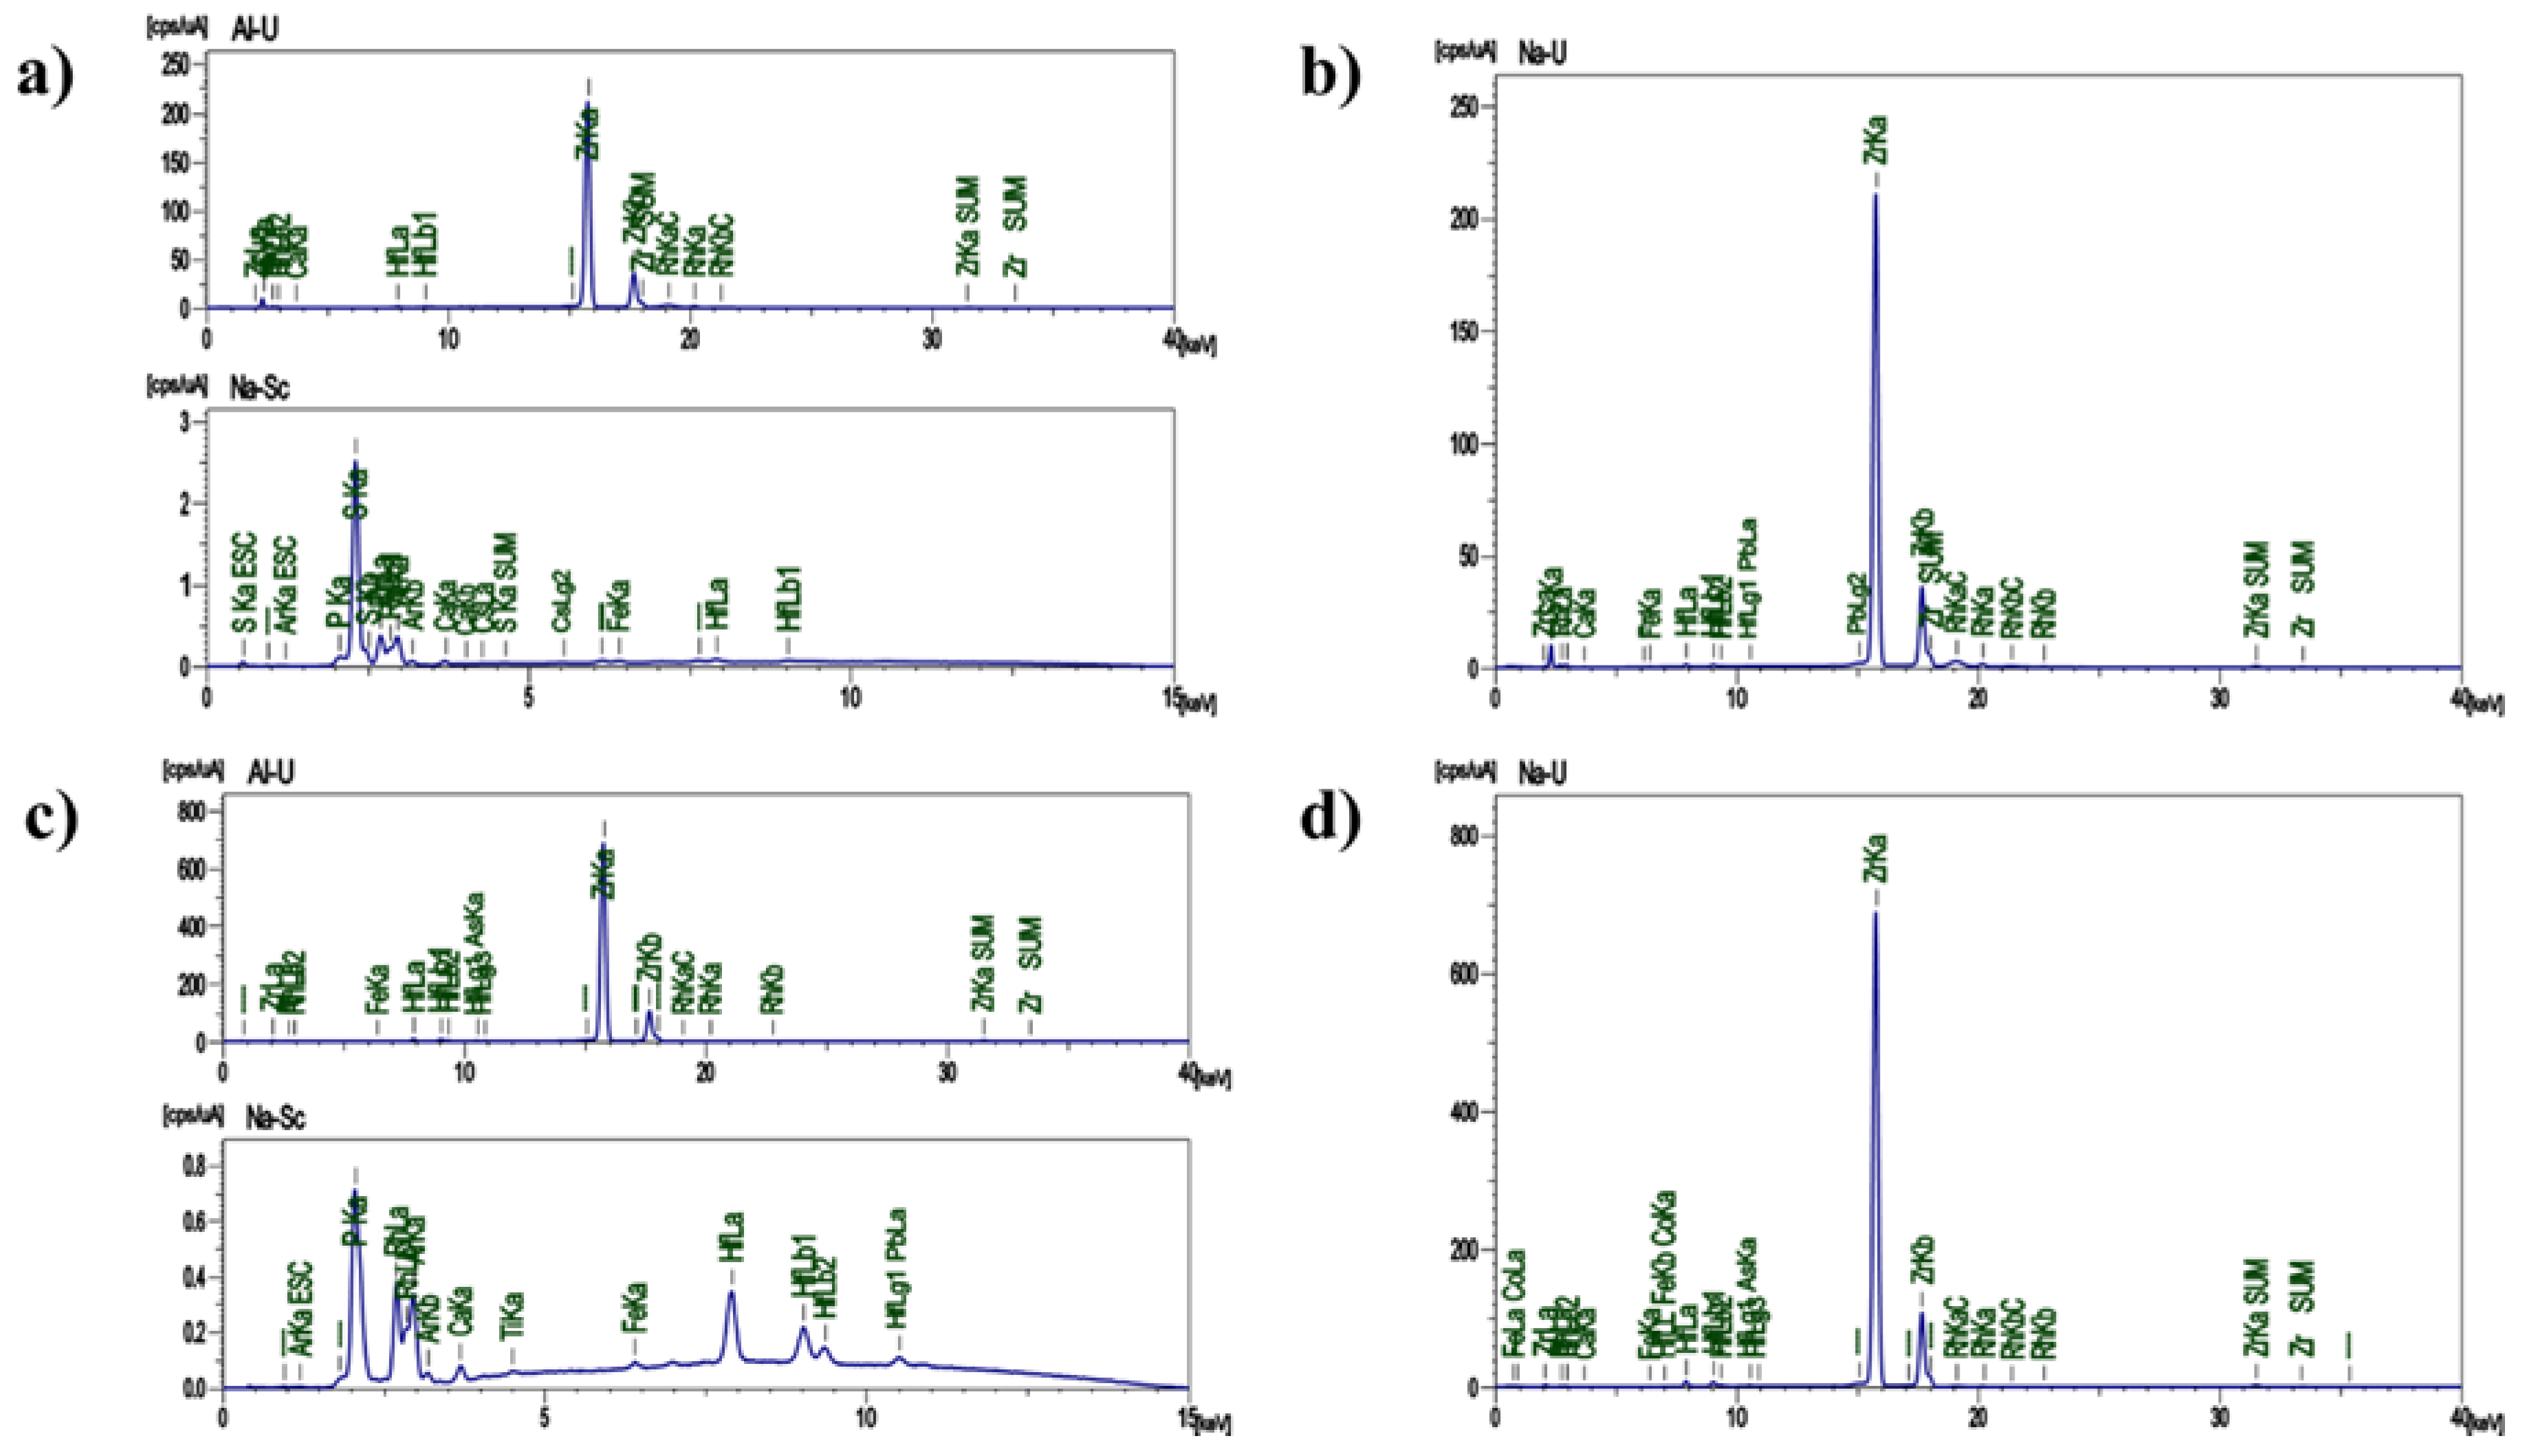
Figure 2.
Morphological characterization and composition by SEM-EDS. a) ZrO2 nanostructures micrograph, b) Length distribution of the tube fragments, c) Width distribution of the tube fragments, e) EDS map of Zr, f) EDS map of O, EDS map of F, h) EDS spectra of the fragments.
Figure 2.
Morphological characterization and composition by SEM-EDS. a) ZrO2 nanostructures micrograph, b) Length distribution of the tube fragments, c) Width distribution of the tube fragments, e) EDS map of Zr, f) EDS map of O, EDS map of F, h) EDS spectra of the fragments.
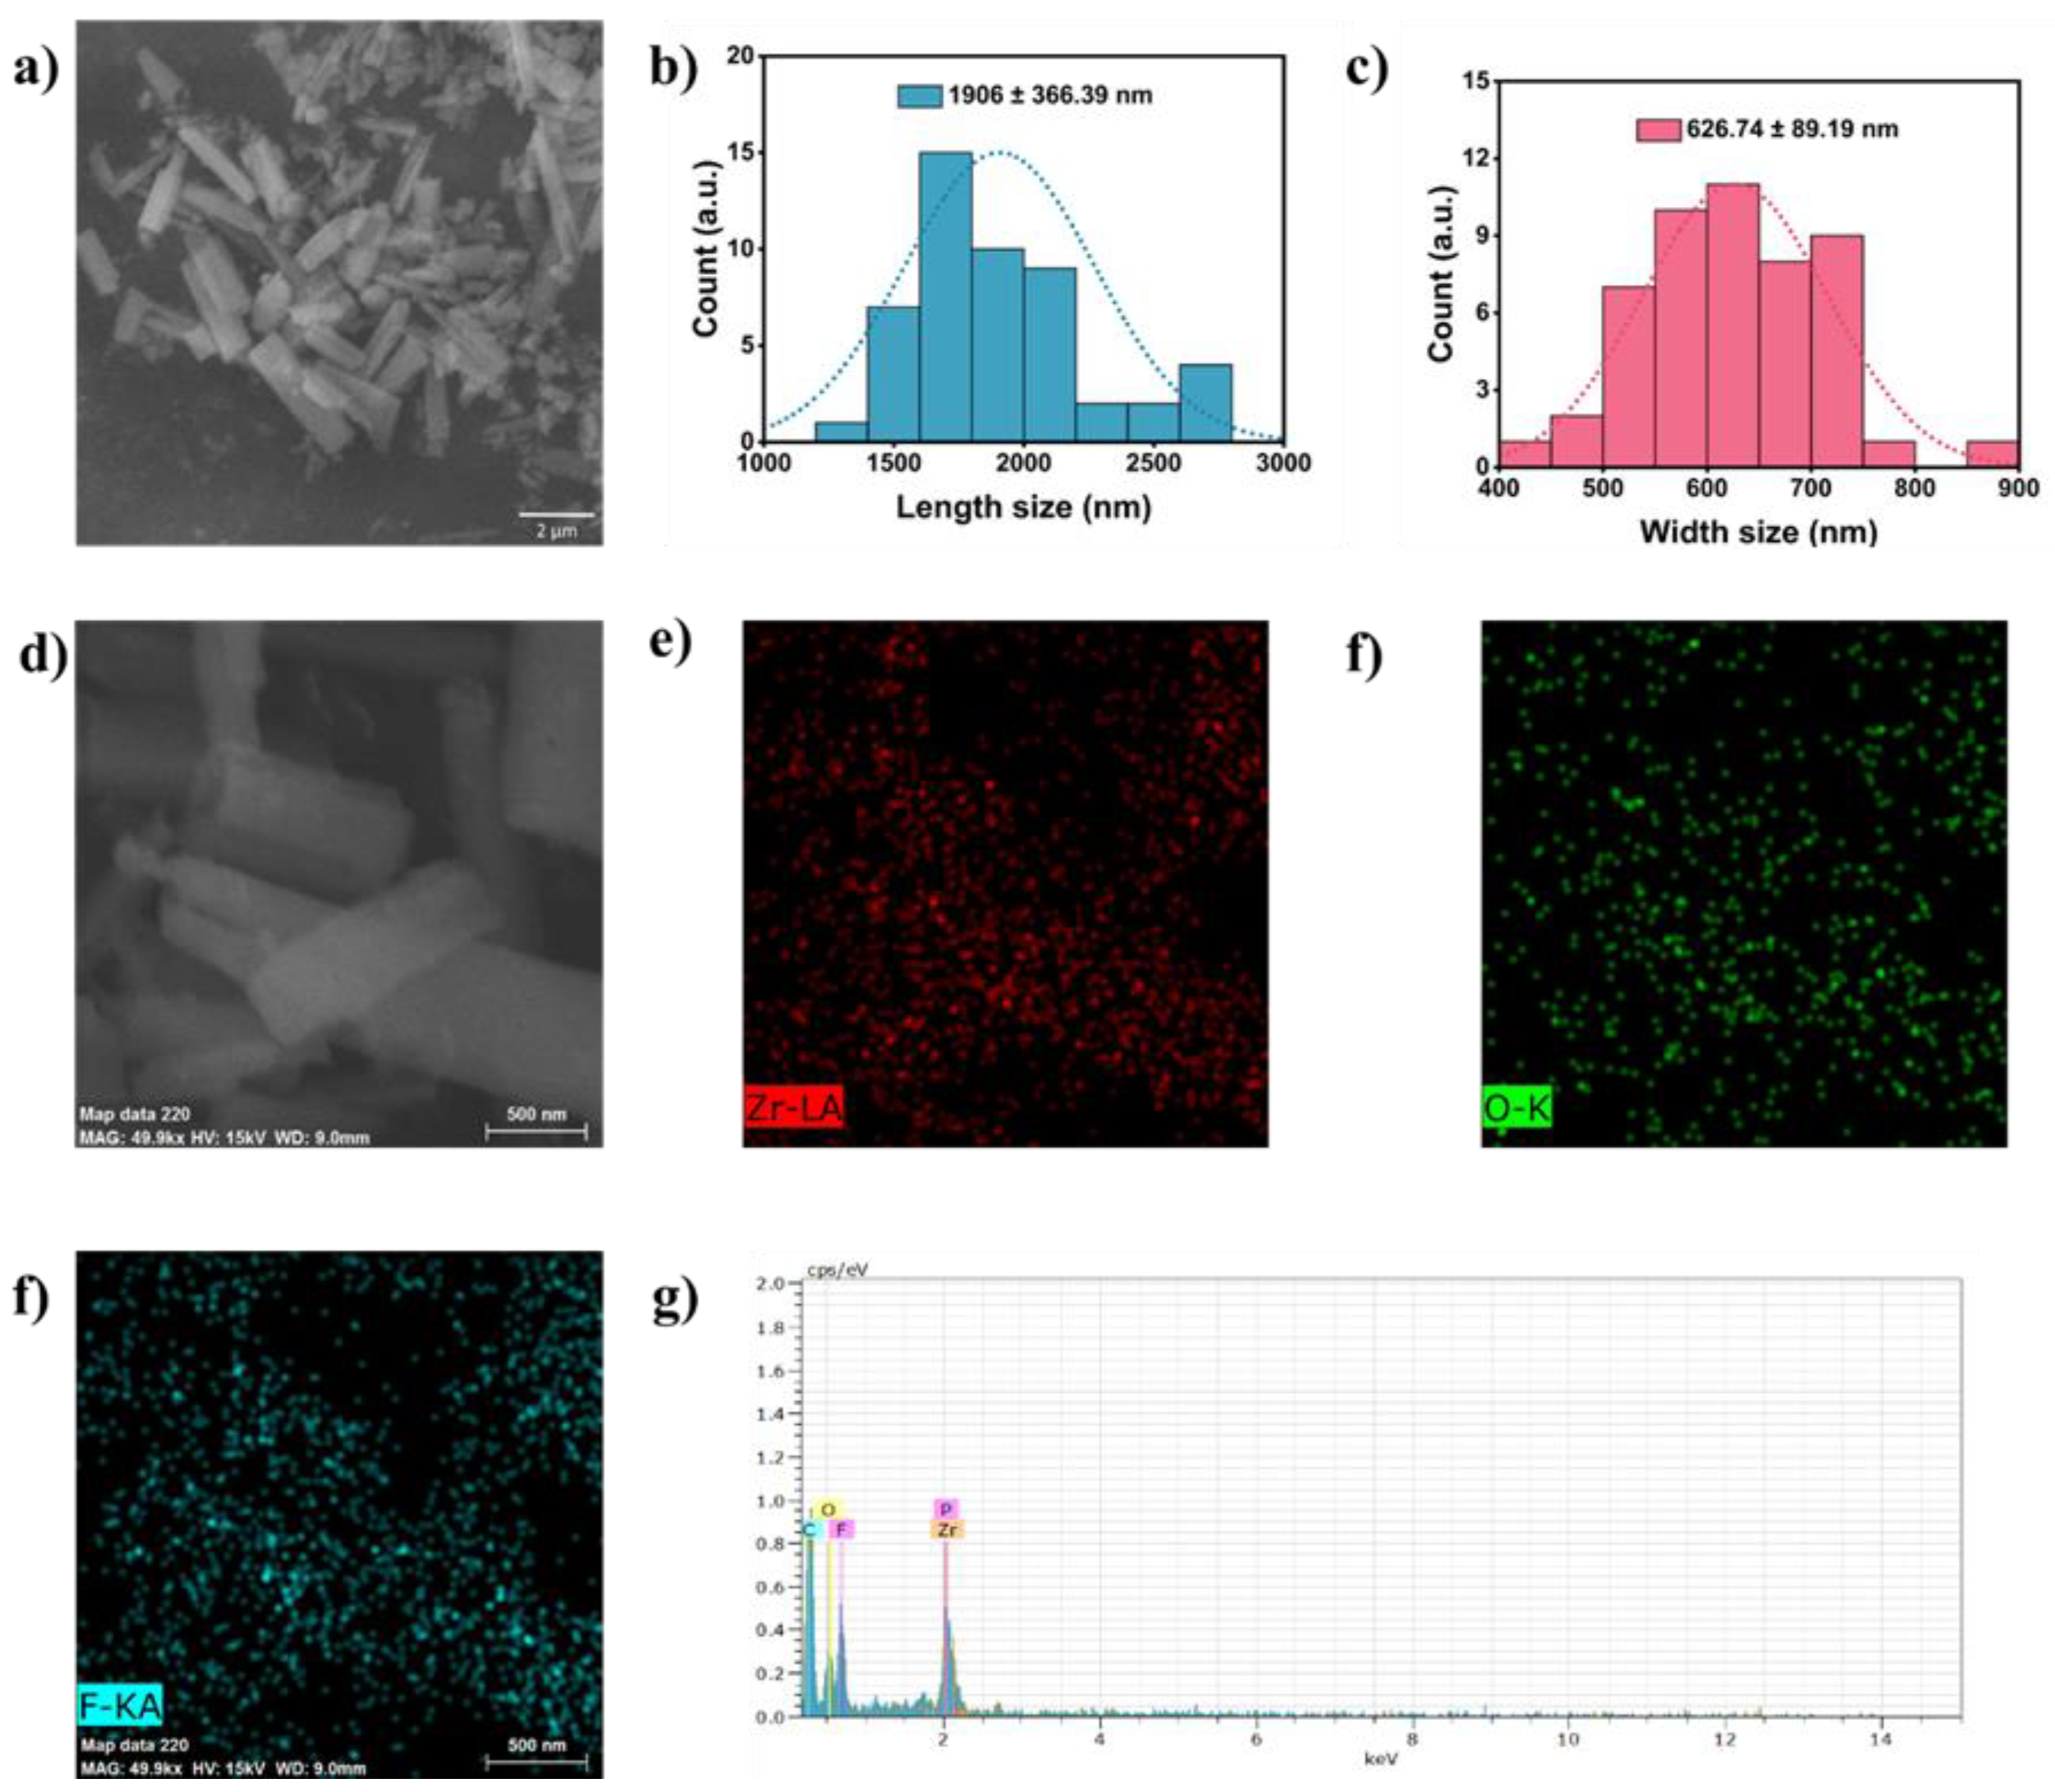
Figure 3.
TEM-EDS-XRD Characterization of the de ZrO2 nanostructures. a) TEM micrograph of a tube fragment, b) HR-TEM micrograph of a tube fragment area, c) Fourier Transform (FFT) of the HR-TEM image, d) Profile of the interplanar spacing (d-spacing), e) Selected area electron diffraction (SAED) pattern, f) XRD crystallographic pattern.
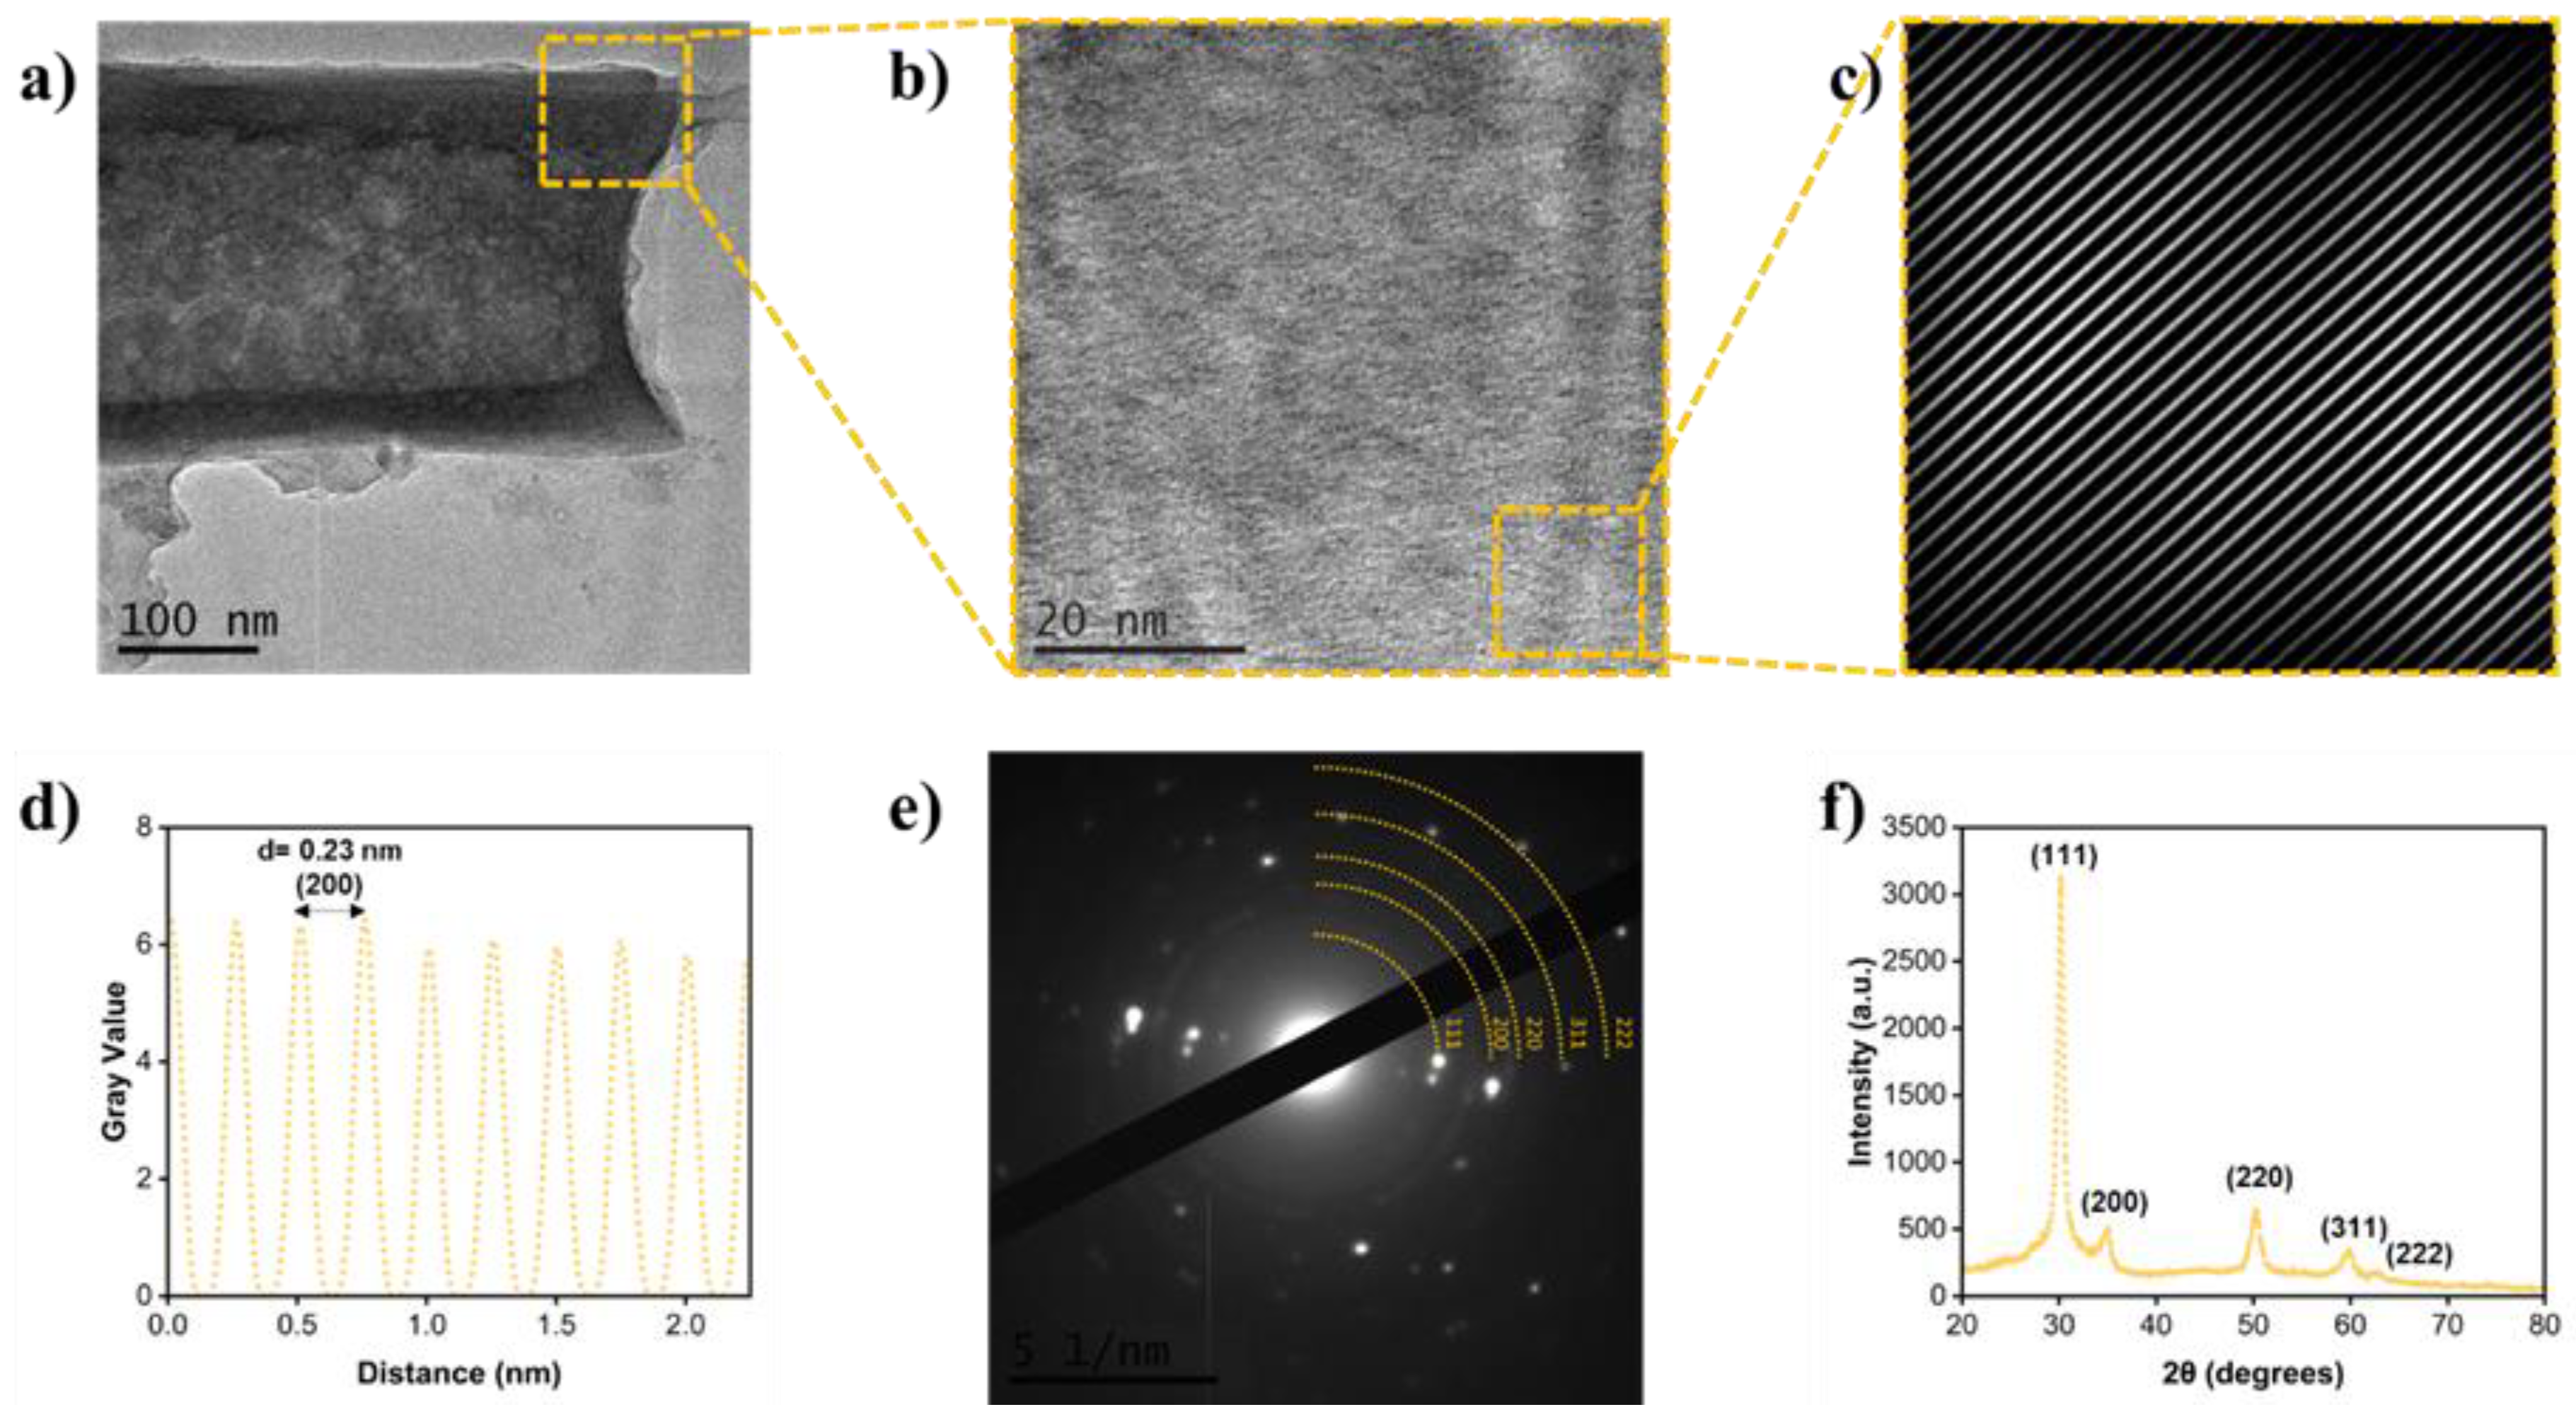
Figure 4.
Stainless Steel characterization before and after the ZrO₂-PVA coating. a) SEM micrograph of the stainless steel surface, b) Stainless steel surface close-up, c) EDS spectra of the metallic surface, d) SEM micrograph of the ZrO₂-PVA coating, e) Close-up of the coated surface, f) EDS spectra of the coated surface, g) AFM image of the metallic surface, h) 3D image of the metallic surface, i) AFM image of the coated surface and j) 3D image of the coated surface.
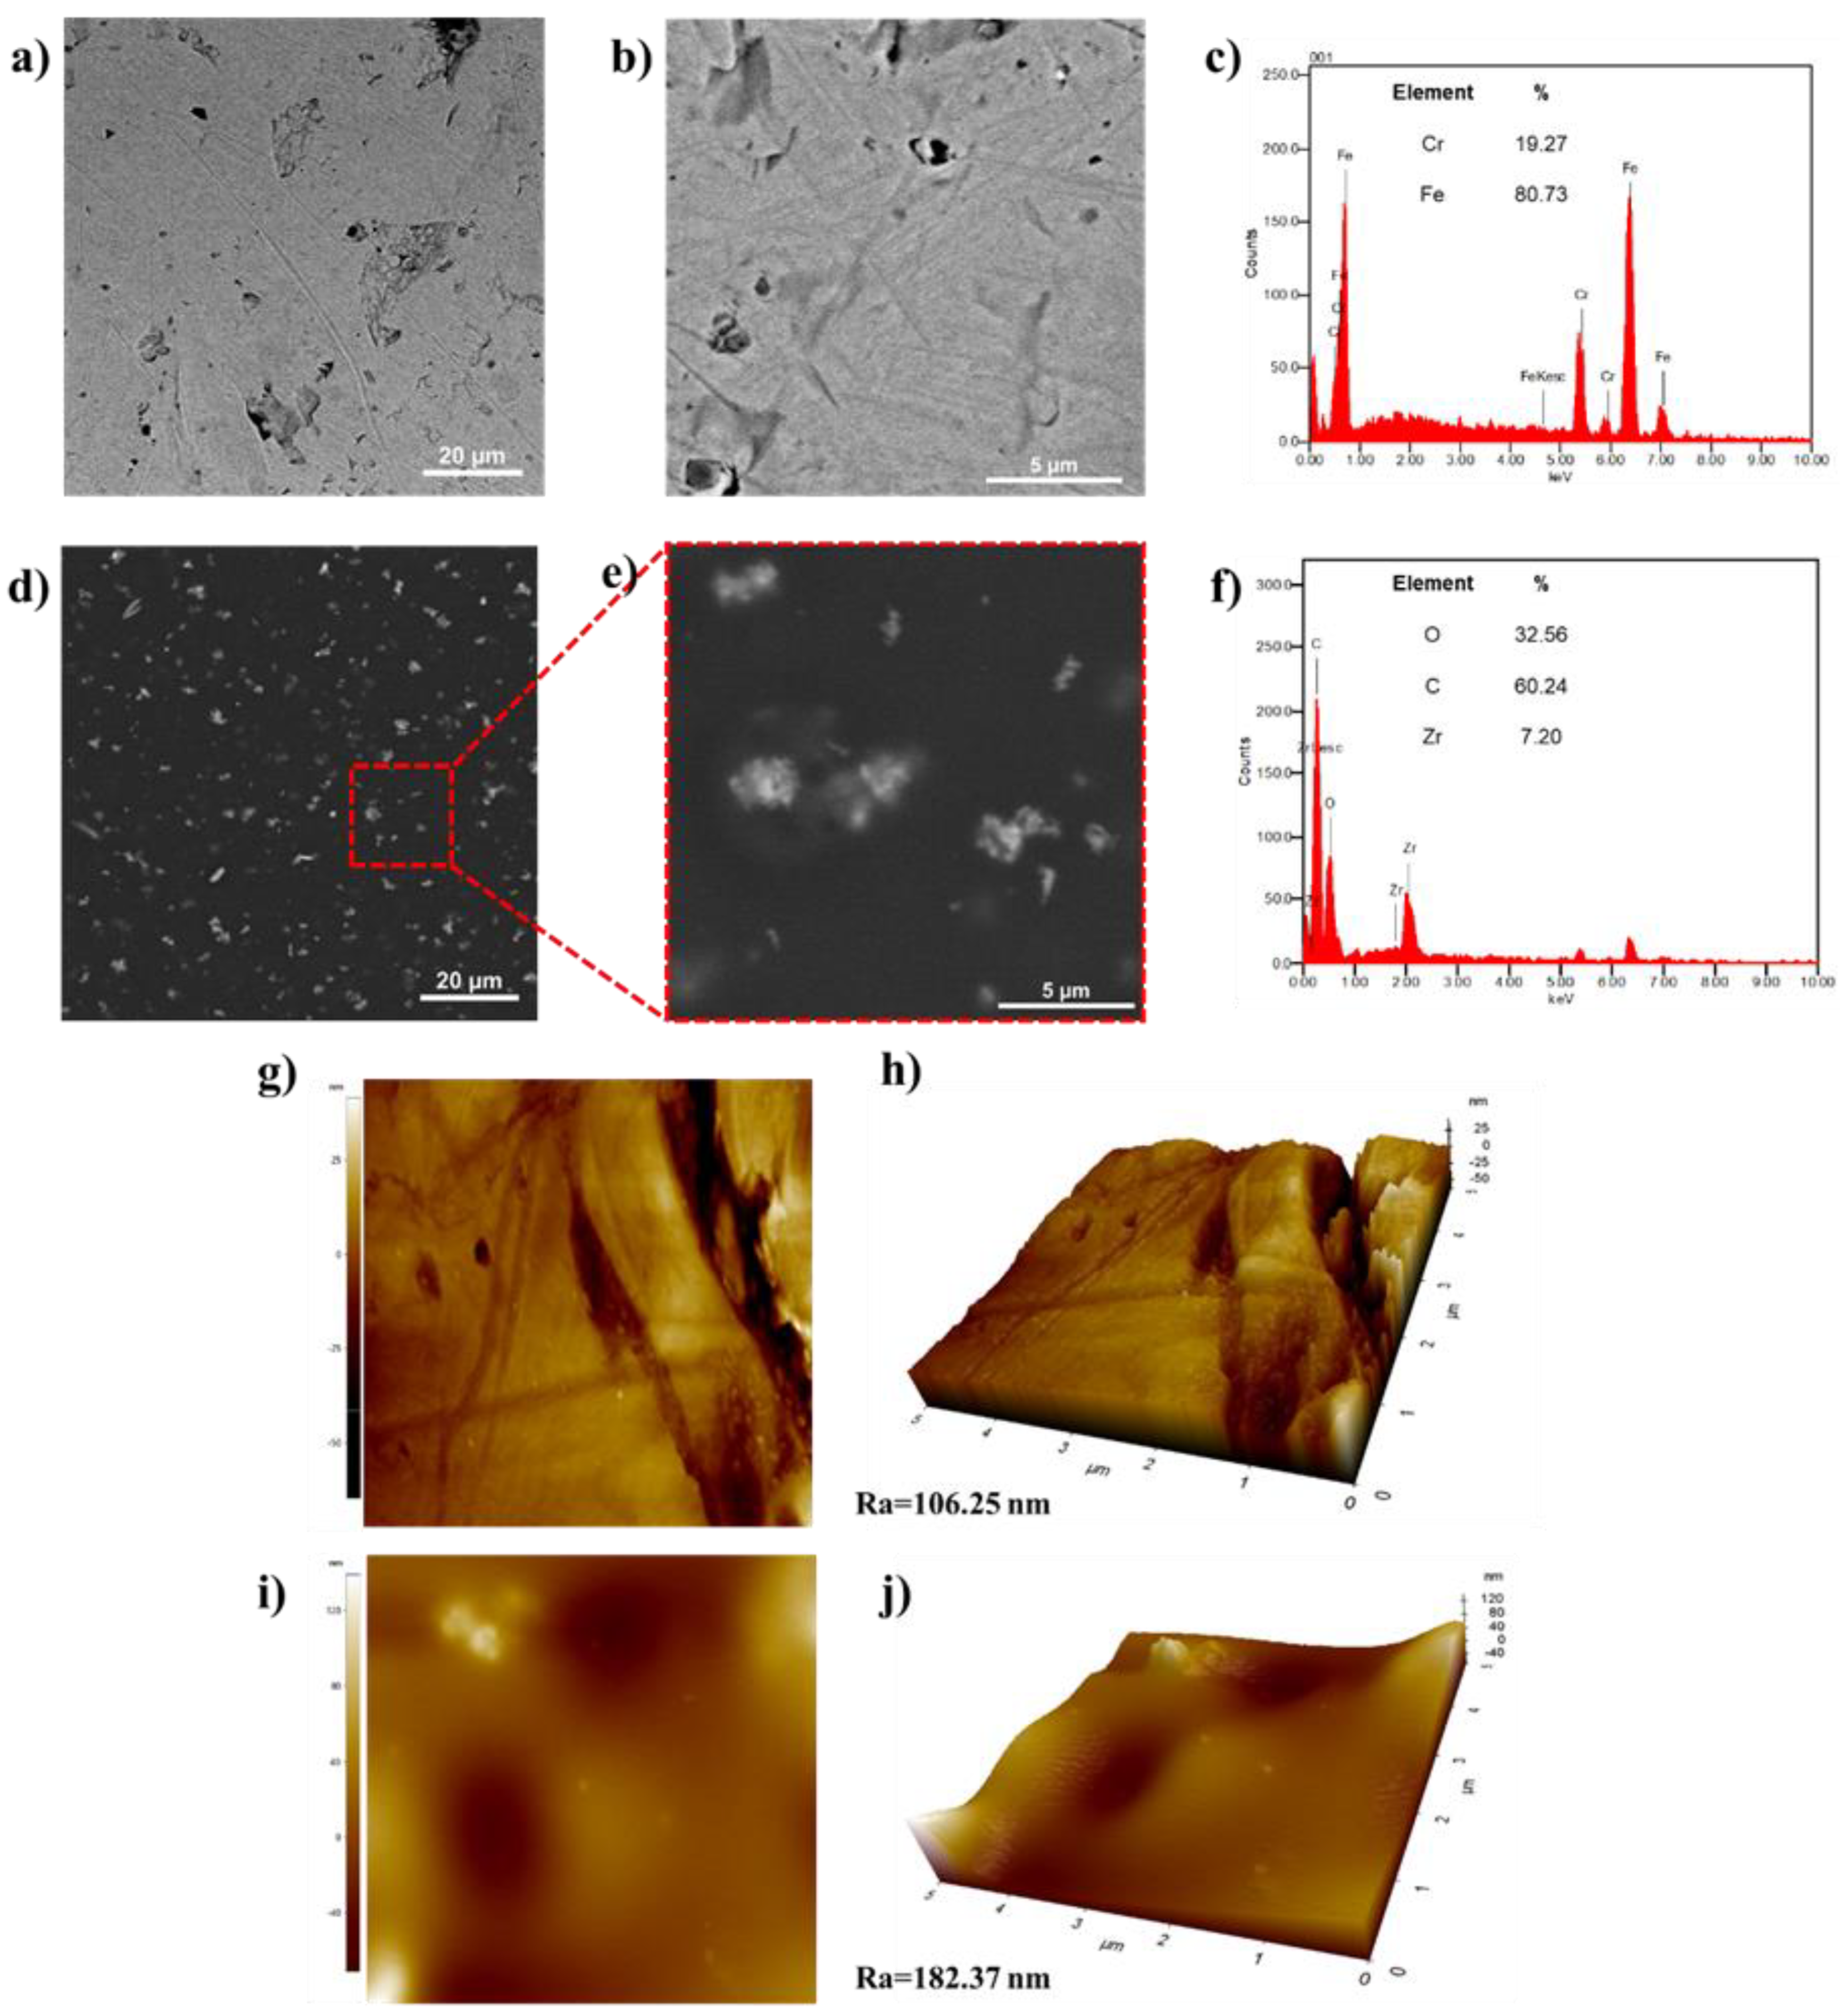
Figure 5.
Comparison between PVA and ZrO₂-PVA coatings. a) Visual inspection of the coated and uncoated steel, b) Transmission of the UV-Vis spectra and Tauc plot, c) FTIR spectra of ZrO2 and coatings, d) PVA coating TGA-DTG, e) ZrO₂-PVA coating TGA-DTG.
Figure 5.
Comparison between PVA and ZrO₂-PVA coatings. a) Visual inspection of the coated and uncoated steel, b) Transmission of the UV-Vis spectra and Tauc plot, c) FTIR spectra of ZrO2 and coatings, d) PVA coating TGA-DTG, e) ZrO₂-PVA coating TGA-DTG.
Disclaimer/Publisher’s Note: The statements, opinions and data contained in all publications are solely those of the individual author(s) and contributor(s) and not of MDPI and/or the editor(s). MDPI and/or the editor(s) disclaim responsibility for any injury to people or property resulting from any ideas, methods, instructions or products referred to in the content. |
© 2025 by the authors. Licensee MDPI, Basel, Switzerland. This article is an open access article distributed under the terms and conditions of the Creative Commons Attribution (CC BY) license (http://creativecommons.org/licenses/by/4.0/).
Copyright: This open access article is published under a Creative Commons CC BY 4.0 license, which permit the free download, distribution, and reuse, provided that the author and preprint are cited in any reuse.


