
Submitted:
04 April 2025
Posted:
07 April 2025
You are already at the latest version
Abstract
Cave environments represent extreme and underexplored ecosystems where fungi play a crucial role in nutrient cycling and ecological dynamics. This study provides the first comprehensive assessment of fungal diversity in air samples from caves across Portugal, with six samples from five locations being assessed through culture-dependent and metabarcoding approaches. From the five bat roosts studied, eleven morphologically distinct fungal taxa were isolated, with genera such as Aspergillus, Penicillium, and Chaetomium identified. Concurrently, Oxford Nanopore sequencing of the internal transcribed spacer (ITS) region of fungal rDNA revealed 286 genera, with Aspergillus, Candida, and Calyptella dominating across sites. Diversity indices and community composition analyses, including Principal Coordinate Analysis (PCoA) and hierarchical clustering, highlighted distinct fungal profiles influenced by site-specific environmental factors and human activity. The data underscores the dual role of fungi in bat roosts as essential decomposers emphasizing their adaptability to oligotrophic conditions. These findings advance our understanding of subterranean fungal ecology and stress the need for targeted conservation efforts to protect cave ecosystems from anthropogenic impacts.
Keywords:
fungi
; caves
; metabarcoding
; biodiversity
; ecology
1. Introduction
Bat-inhabited natural and anthropogenic habitats, such as caves, mines, and tunnels, are unique microbiological ecosystems shaped by interactions between the environment, bats, and microbes (Jurado et al., 2010). These environments, with stable microclimates and limited nutrients, support specialized microorganisms. Bats contribute with organic matter through guano, corpses, skin, and fur shedding, which serve as nutrients for microbial communities (De Mandal et al., 2015). They also act as vectors and reservoirs, dispersing microorganisms within and between habitats. This dynamic foster oligotrophic, extremophilic communities unique to subterranean environments (Dimkić et al., 2021; Mühldorfer, 2013).
Bat activity significantly influences fungal diversity, with studies showing a positive correlation between bat abundance and airborne fungi concentration (Kokurewicz et al., 2016). Bats elevate fungal concentrations in underground environments, particularly during hibernation (Borzęcka et al., 2021). Their guano creates conditions that support fungal dispersal and growth, including opportunistic pathogens, which pose risks to both wildlife and human health (Dimkić et al., 2021). Understanding the relationship between bats and fungi is essential for insights into fungal ecology and pathogen transmission.
Bat habitats of anthropogenic origin, such as attics chimneys and abandoned buildings, serve as alternative roosting sites for bats population (Voigt et al., 2016). These structures often provide stable temperatures, protection from predators, and seclusion for hibernation or reproduction. The presence of bats in anthropogenic bat roosts creates a unique microbiological environment influenced by bat activity (Voigt et al., 2016). Organic matter, such as guano, urine, and shed fur or skin accumulates in these spaces, fostering the growth of diverse microbial communities, including fungi, bacteria, and archaea (Dimkić et al., 2021).
On the other hand, natural caves are unique and structured ecosystems with distinct zones influenced by surrounding rock formations, subterranean water, and karst landscapes (Wasti et al., 2021; Zhao et al., 2018). These subterranean habitats differ markedly from surface environments due to their constant darkness, seasonally stable temperatures, high humidity, and minimal organic matter (Zhang et al., 2017). The nutrient-poor conditions in bat roosts create challenging living environments, but these spaces also provide a stable climate, which makes them uniquely suited for specialized life forms (Soares & Niemiller, 2020). Although relatively isolated, bat roosts are influenced by various external factors, including air currents, water flow, and human visitors (Gabriel & Northup, 2013; Zhang et al., 2018).
Together, bat roosts and other subterranean environments represent some of Earth’s most challenging and underexplored ecosystems (Soares & Niemiller, 2020). Despite the difficulties posed by these extreme conditions, they offer a unique habitat for studying microbial survival, adaptation, and ecological roles in nutrient-limited environments (Ogórek et al., 2013; Wasti et al., 2021).
However, the increasing transformation of natural bat roosts into tourist destinations, often referred to as “show bat roosts” presents a significant anthropogenic threat to these unique subterranean ecosystems (Cigna, 2016; Mammola et al., 2022; Piano et al., 2023). Tourism introduces substantial biological disturbances, as microbial propagules are transported by visitors on their clothing, shoes, and skin. This influx leads to biological contamination across multiple cave surfaces and environments, including cave air (Piano et al., 2023; Porca et al., 2011), water (Ando & Murakami, 2020; Piano et al., 2023), soil (Kukla et al., 2018; Piano et al., 2023), and even speleothems (Bercea et al., 2019; Piano et al., 2023). Additionally, human activity modifies cave substrates (Kukla et al., 2018), enabling the establishment of non-native microbial communities. Opening bat roosts to visitors can also alter their microclimatic conditions, with tourists contributing to increased air temperatures, higher CO₂ levels (Hoyos et al., 1998; Ogórek et al., 2013) and introducing organic matter and new microorganisms. These factors collectively support the growth of microbial communities within bat roosts (Ogórek, 2012; Ogórek et al., 2013). Moreover, elevated fungal concentrations, particularly in visitor areas such as lunchrooms, suggest that human food remnants, like crumbs, may provide a nutrient source that supports these foreign microbial populations (Griffin et al., 2014).
Cave fauna can be classified into four main categories: troglobionts, eutroglophiles, subtroglophiles, and trogloxenes (Zhang et al., 2018). Troglobionts are organisms that inhabit bat roosts exclusively, having evolved specific adaptations to these underground habitats and completing their entire life cycle within them (Lunghi et al., 2014; Sket, 2008; Zhang et al., 2018). Eutroglophiles are surface-dwelling species that can establish permanent, self-sustaining populations in bat roosts. Subtroglophiles have a close association with cave environments but depend on surface habitats for certain life stages or essential functions, such as dispersal, feeding, or reproduction. Finally, trogloxenes are species that typically reside outside bat roosts but may be found in subterranean habitats on occasion; however, they do not reproduce within bat roosts (Lunghi et al., 2014; Sket, 2008).
Microorganisms, especially fungi, play a crucial role in cave ecosystems, providing energy to cave fauna through decomposition and nutrient cycling within these nutrient-limited environments (Stupar et al., 2023; Zhang et al., 2018). Fungi are among the dominant organisms in bat roosts, owing to their high spore dissemination rates, ability to colonize diverse substrates, and adaptability to a wide range of pH levels (Ogórek et al., 2013; Wasti et al., 2021). The fungal composition within bat roosts varies depending on the degree of isolation and specific environmental conditions (Ogórek et al., 2013). Some fungal species are essential to cave mycobiota, serving as decomposers and participating in feeding strategies for cave fauna, while others can pose health risks to mammals. For instance, Pseudogymnoascus destructans causes white-nose syndrome in bats, and Histoplasma capsulatum can lead to systemic histoplasmosis in humans (Rodrigues et al., 2020; Stupar et al., 2023). Additionally, certain species of genera such as Aspergillus, Rhizopus, and Fusarium are known pathogens in humans, while others like Alternaria, Acremonium, Cladosporium, and Penicillium act deleteriously as allergens (Ogórek et al., 2013; Zhang et al., 2018)
Fungal spores, frequently found suspended as airborne particles, are prevalent in bat roosts and represent a major component of the microbial diversity within these environments (Hoyos et al., 1998; Ogórek et al., 2013, 2018; Stupar et al., 2023). These spores can also be carried by water, bats, arthropods, and human visitors. Human visits contribute organic material that supports certain fungi, allowing them to survive and spread even in previously uncontaminated areas (Griffin et al., 2014; Ogórek et al., 2013). This phenomenon highlights the complex and often delicate balance of microbial communities in subterranean ecosystems, where fungi play a vital role as both beneficial and potentially harmful inhabitants.
In this context, the aim of this study was to provide baseline data on fungal diversity across various bat underground roosts in Portugal and to explore their ecological relationships. This research represents the first comprehensive assessment of cave fungi in Portugal. Gaining insight into the ecological roles and interactions of these fungi can help cave managers implement better management practices.
2. Material and Methods
2.1. Sampling Location
Air sampling took place in July 2022, at five locations across central and southern Portugal, including one large historical building, two mines and two caves, located in the municipalities of Montemor-o-Novo, Ansião, Tomar, and Moura (Figure 1). The bat species inhabiting each cavity are depicted in Table 1.
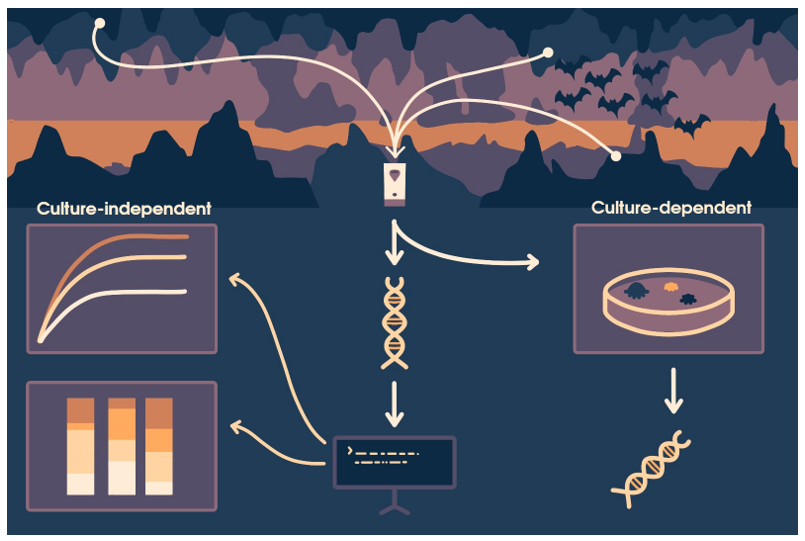
For air samples, a Coriolis Compact® air sampler was used in each location, positioned in the center of each cave/building at a height of approximately 1.3 meters. Sampling was conducted for 60 minutes with an airflow rate of 50 L/min. Air samples were collected on a dry medium, with 4 ml of sterile PBS added to the collection cones after each sampling. The samples were immediately stored at 4°C for transport to the laboratory for further analysis (Hemnani et al., 2023). After collecting every sample, the sampler was cleaned and decontaminated according to the manufacturer’s instructions. Briefly, a wipe dampened with a surfactant–water solution was used to clear the external parts of the sampler. After that, the sampler was wiped down with a soft cloth to remove any excess.
2.2. Fungal Culture-Dependent Characterization
The samples were plated onto Sabourad Dextrose Agar (SDA), supplemented with 100 µg/mL of Penicillin-Streptomycin Solution, and incubate at 25 ± 1°C for 7 to 28 days. Plating process were carried out in triplicate. Colonies that developed were classified into Morphological Taxonomic Units (MTU) and counted. Pure isolates were obtained on SDA, followed by morphological and genetic analysis. Samples were examined under a microscope and morphological characterization was carried out using morphological identification keys (Domsch, 1993; Klich, 2002; Raper, 1965).
2.3. Sequencing of Fungal Isolates
DNA extraction from fungal samples began by scraping off the mycelium from the cultures and diluting it (10%) in ATL buffer. The mixtures were incubated at 100ºC for 10 minutes, followed by centrifugation at 8000 × g for 5 minutes. After centrifugation, 140 μL of the supernatant was used for DNA extraction and purification using the QIAamp DNA Mini Kit (Qiagen, Hilden, Germany) according to the manufacturer’s instructions. Automated extraction was carried out using the QIAcube® platform (Qiagen).
The internal transcribed spacer (ITS) region of fungal rDNA was amplified using the primers ITS1 (5ʹ-TCCGTAGGTGAACCTGCGG-3ʹ) and ITS4 (5ʹ-TCCTCCGCTTATTGATATGC-3ʹ). PCR reactions were performed on a thermocycler (Bio-Rad, Hercules, CA, USA). Reactions mixtures were prepared using SpeedySupreme NZYTaq 2x Green Master Mix (NZYTech, Lisbon, Portugal) according to the manufacturer's instructions. PCR conditions included an initial denaturation at 95°C for 5 minutes, followed by 35 cycles at 94°C for 30 seconds, 55°C for 30 seconds, and 72°C for 1 minute, ending with a final extension at 72°C for 10 minutes.
Following PCR amplification, DNA fragments were separated by electrophoresis on 1.5% agarose gels stained with Xpert Green Safe DNA gel dye (GRiSP®, Porto, Portugal). The electrophoresis was run at a constant voltage of 120 V for 25 minutes. The results were visualized by exposing the gels to UV light. PCR products were purified using the GRS PCR & Gel Band Purification Kit (GRiSP®).
After purification, bidirectional sequencing was performed with the Sanger method using the appropriate internal primers for the target gene. Sequences were then aligned with the help of the BioEdit Sequence Alignment Editor v7.1.9 software package, version 2.1v and compared with those in the NCBI (GenBank) nucleotide database (http://blast.ncbi.nlm.nih.gov/Blast).
2.4. DNA Extraction and Molecular Identification of the Air Samples
Simultaneously, DNA extraction from the air samples was performed using 140 μL of the air samples, according to the QIAamp DNA Mini Kit (Qiagen, Hilden, Germany). Automated extraction was carried out using the QIAcube® platform (Qiagen).
PCR based on the ITS region followed by gel electrophoresis was performed as above described. The final DNA concentration was determined using a Qubit 4.0 fluorometer (Thermo Fisher Scientific, Waltham, MA, USA) with the Quant-iT™ 1X dsDNA Assay Kit, high sensitivity (HS) (Thermo Fisher Scientific, Waltham, MA, USA), utilizing 2 μL of the DNA elution from each sample as input.
2.5. Oxford Nanopore Sequencing of ITS
Premium PCR sequencing was conducted using Oxford Nanopore Technology on a PromethION 24 instrument equipped with an R10.4.1 flow cell. The library preparation utilized the Native Barcoding Kit 96 V14 (SQK-NBD114.96), followed by custom analysis and annotation. The raw FASTQ reads were basecalled in super-accurate mode using ont-doradod-for-promethion v7.4.12, applying a minimum Q-score of 10, with adapters and barcodes trimmed via MinKNOW.
2.6. Taxonomic Classification and Refinement
Sequence analysis was performed on an MSI GE66 Raider running Ubuntu 24.04.1 LTS. It was equipped with an Intel Core i9 (16 core) processor, 64 GB of RAM, a GeForce RTX 2070 SUPER mobile GPU with 8 GB RAM, and a 1 TB SSD hard drive.
Initial quality control of sequencing reads was performed using NanoPlot 1.43.0 (De Coster & Rademakers, 2023). Sequencing adapters and barcodes were removed using Porechop 0.2.4 (Wick, 2017/2024). To filter the reads, NanoFilt v.2.8.0 (De Coster & Rademakers, 2023) was employed, applying a minimum average quality score threshold of 8 and a minimum read length of 360 bases across all samples.
Taxonomic classification of the fungal reads was performed using Kraken2 2.0.8-beta (Wood et al., 2019) with the UNITE database 10.0 (Abarenkov et al., 2024), using standard settings. Kraken 2 assigns taxonomic labels to reads by examining the k-mers within a read and querying a database with information on those k-mers for different species. The UNITE ITS database is a comprehensive resource for fungal taxonomy and molecular identification, specifically focused on the ITS region of ribosomal RNA genes. Taxonomic abundance estimates generated by Kraken2 were refined using Bracken 2.6.2 (Lu et al., 2017), which employs Bayesian re-estimation to improve accuracy based on sequence length and classification depth.
2.7. Data Analysis
Principal Coordinate Analysis (PCoA) was performed using Bray-Curtis dissimilarity to visualize the variation in fungal taxon composition across six samples. PCoA plots were generated to assess the relationships and differences between the samples. Additionally, rarefaction curve analysis was conducted to assess the alpha diversity of fungal taxa across the samples, visualizing the relationship between sequencing depth and species richness.
2.8. Custom Scripts for Data Manipulation and Visualization
Custom Python scripts were developed for data manipulation and visualization, utilizing the following libraries: pandas, glob, plotly.express, plotly. graph_objects, os, re, numpy, scipy. optimize, skbio.stats.ordination, skbio.stats.distance, matplotlib, seaborn, scipy.spatial.distance, and scipy.cluster.hierarchy. The analysis utilized Bracken output files for taxonomic abundance estimation. All bioinformatics scripts are publicly available at https://github.com/GmoreiraVet/Guitools (Moreira, 2025).
3. Results
3.1. Culturable Results
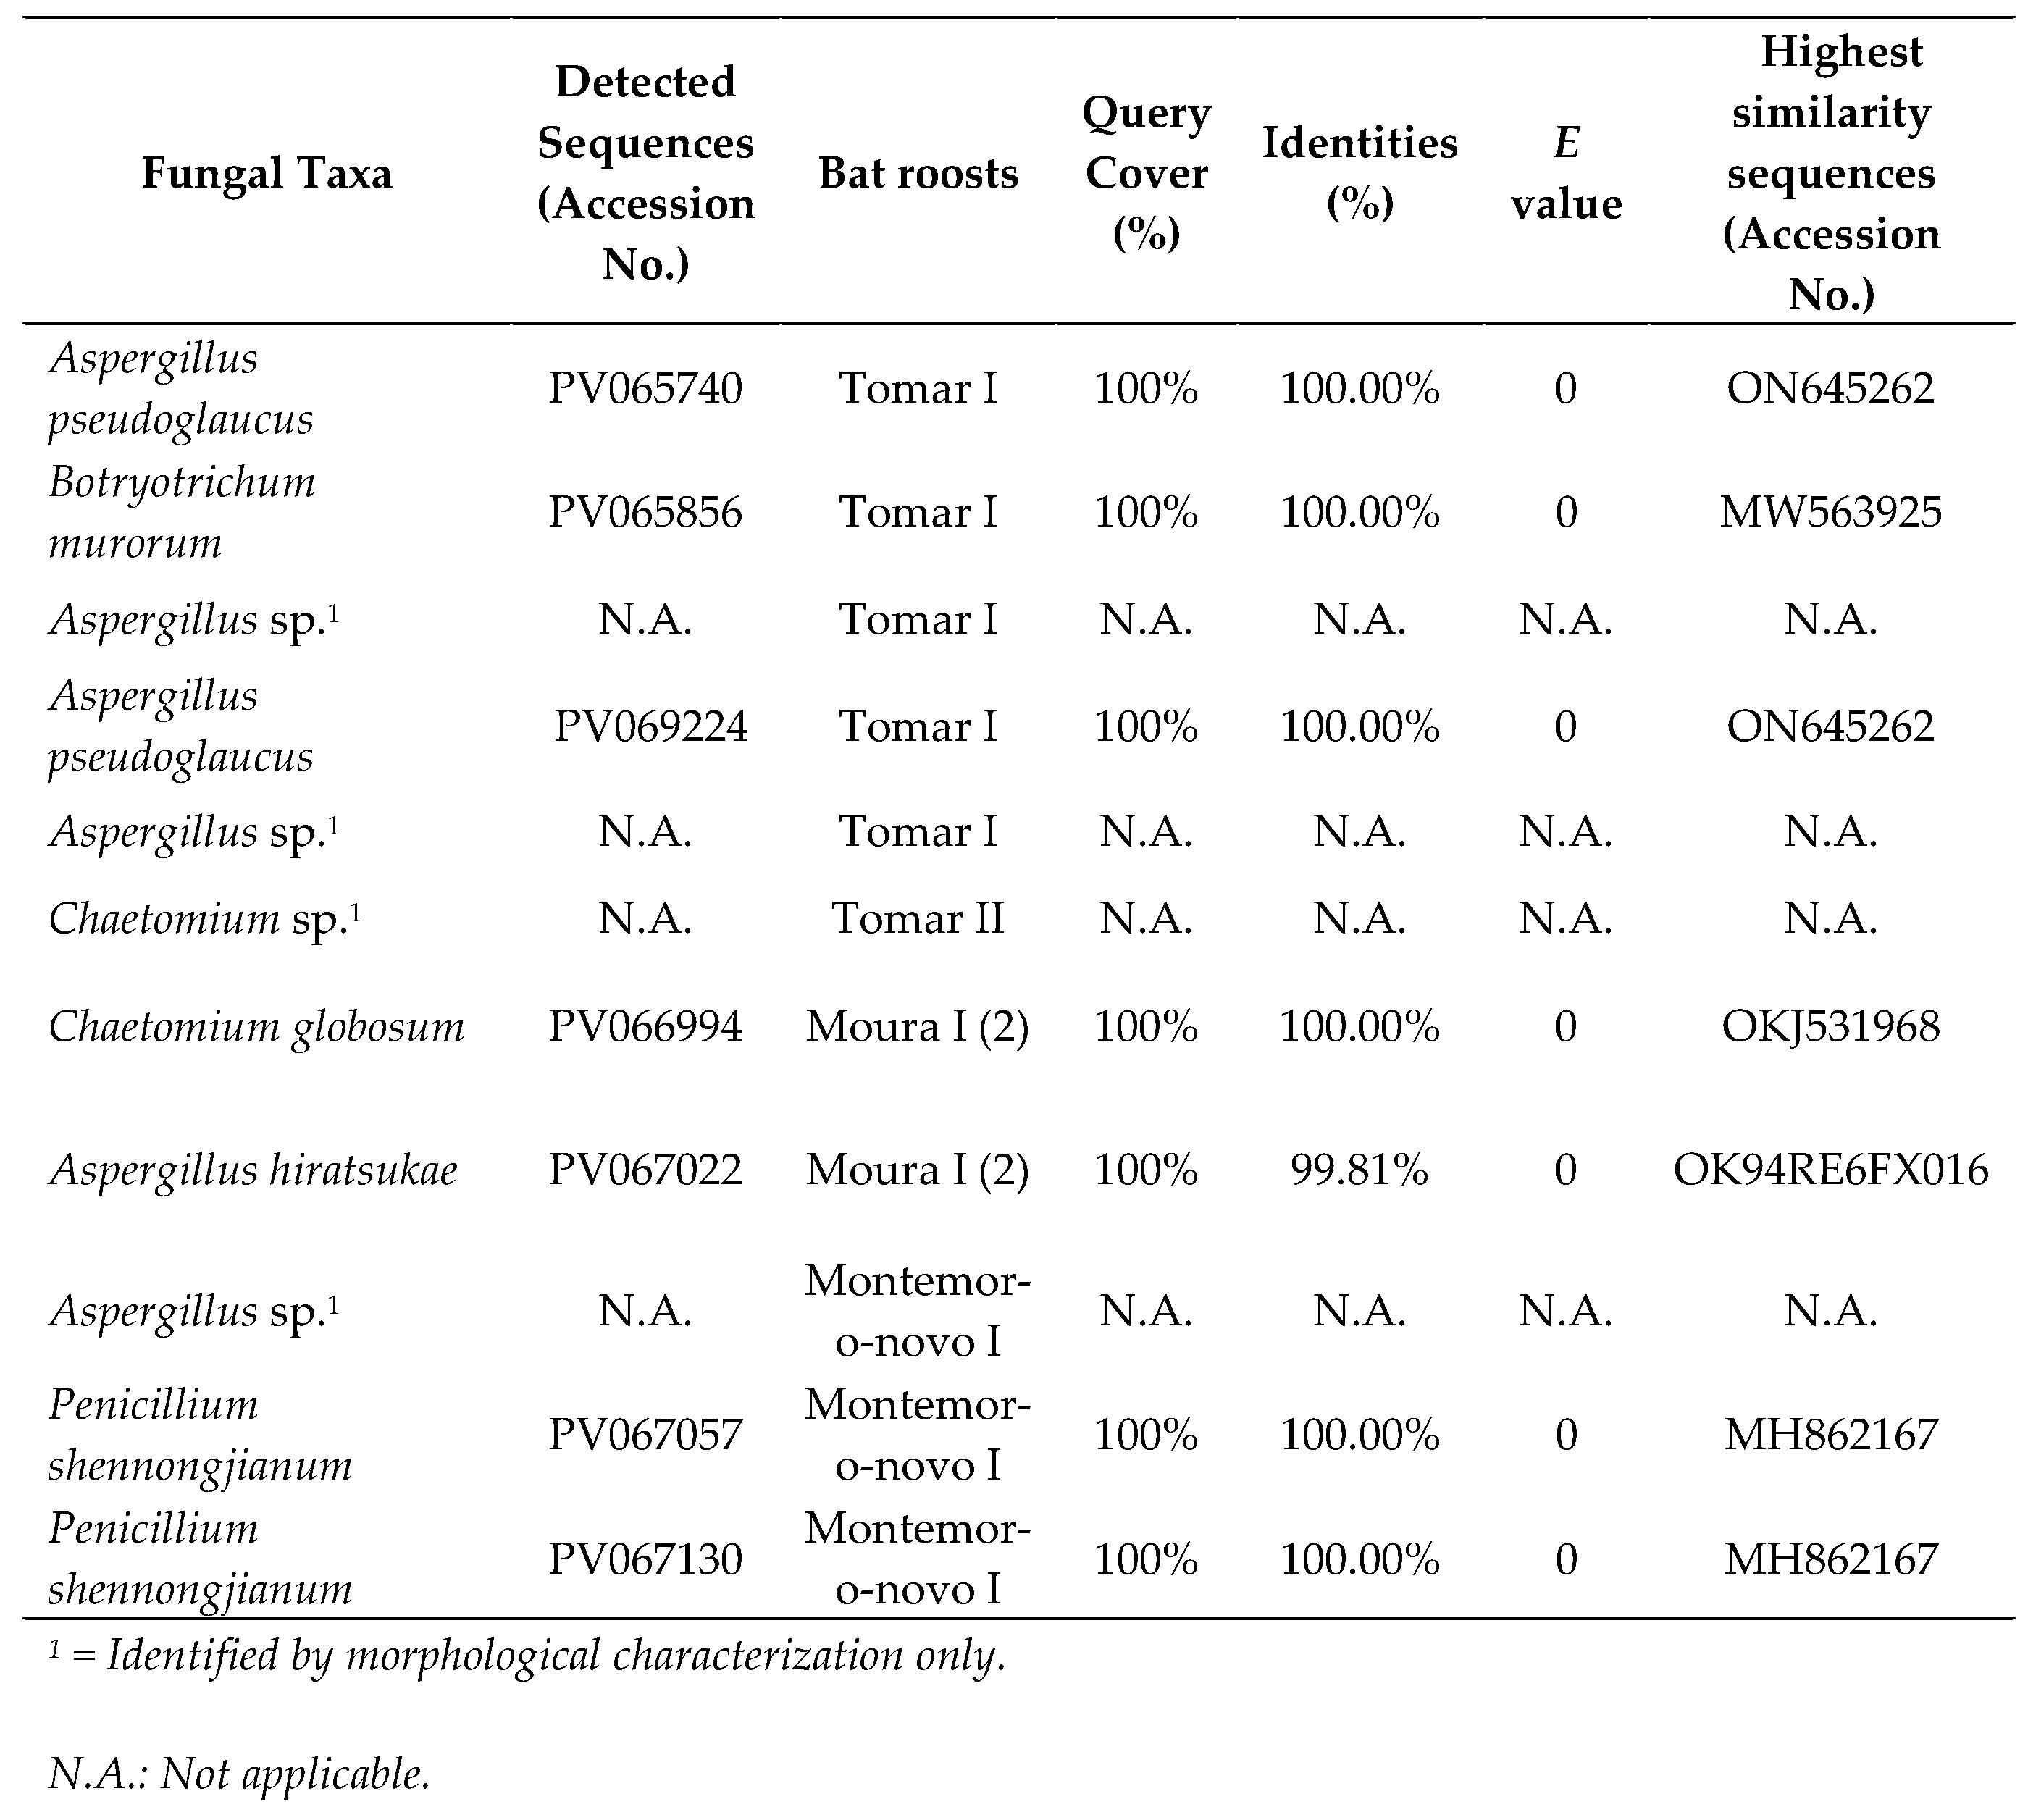
In total, 11 morphologically distinct fungal isolates (pure cultures) were obtained from the 123 colonies that developed from the six samples from the five locations. These 11 fungal isolates were classified into 4 genera based on morphological characteristics. Of the 11 DNA-extracted fungi, only 4 were not successfully sequenced. BLASTn sequence analysis confirmed the identification of the remaining species (Table 1). All BLASTn had identity matches of 100.00%, except for Aspergillus hiratsukae (99.81%). Additionally, no colony growth was observed on samples Ansião I and Montemor-o-Novo I (1).

Table 1.
Culturable cave fungi BLASTn (GenBank) analysis.
 |
3.2. Oxford Nanopore Sequencing
3.2.1. Fungal Taxonomy by Metabarcoding and ONT Sequencing
We detected a total of 286 unique genera across all sampled sites. In Ansião I cave, 99 genera were found, followed by 70 in Tomar I, 83 in Tomar II cave, 119 in Moura I (1), 53 in Moura I (2) and finally 91 in Montemor-o-novo I mine. The top genera across all samples can be found in Table 2, along with their corresponding read counts, as estimated by bracken. A comprehensive visualization of the abundance and taxonomy of fungi across all sampling sites is provided in Figure 2, illustrating the relative abundance of fungal genera across the different locations. The plot highlights major taxonomic groups and their proportional contributions to the detected fungal community.
3.2.2. Fungal Diversity
The rarefaction curves of sequences (Figure 3) obtained from all sampling sites approached an asymptote, indicating that the data effectively captured the diversity present. Samples MP1, CC, and GA exhibited higher Shannon index values, suggesting greater diversity compared to samples MP2, MN, and GN, which showed relatively lower diversity (Figure 4).
The PCoA graph (Figure 5), based on Bray-Curtis dissimilarity, reveals distinct clustering of samples, with samples T I, A, M I (1) and T II grouping closely together. In contrast, M and M I (2) are positioned separately from this cluster, exhibiting divergence along the X-axis, though remaining relatively close along the Y-axis.
Two visualizations were employed to illustrate the taxonomic composition across sampling sites. The heatmap depicts the relative abundance of the top 15 taxa, with hierarchical clustering used to identify patterns of similarity among samples (Figure 6). The stacked bar chart provides a comparative view of the relative abundance of these taxa across sites, emphasizing the distribution of dominant taxa while incorporating an 'Other' category to represent less prevalent taxa (Figure 7). These visualizations offer complementary perspectives on the fungal community composition and its variation between sites.
4. Discussion
Bat roosts, characterized by their extreme ecosystems, provide habitats that support the most unique fungal communities (Wasti et al., 2021; Zhang et al., 2017). Despite extensive research into fungal diversity in various environments, cave air remains underexplored (Soares & Niemiller, 2020). The present study evaluates fungal diversity in air samples from six different locations of five bat roosts, revealing a range of fungal taxa using both culture-dependent and independent methods. A total of 11 fungal taxa were isolated from culturable samples, representing genera such as Aspergillus, Penicillium and Chaetomium. The fungal taxa identified from culturable methods in this study are consistent with previous reports of fungi adapted to extreme environments (Cantrell et al., 2011). For instance, Aspergillus pseudoglaucus and Penicillium shennongjianum are known for their resilience and ability to thrive in nutrient-poor conditions (Siqueira et al., 2018; Vu et al., 2019).
On the other hand, metabarcoding using Nanopore sequencing identified 286 different genera: 99 from Ansião I sample, 70 from Tomar I sample, 83 from Tomar II, 119 from Moura I (1), 53 from Moura I (2), and 91 from Montemor-o-novo I (Table 2), belonging to the phyla Ascomycota, Basidiomycota and Mucoromycota. Dominant genera in the air samples included Aspergillus, Candida and Calyptella being the most frequently detected. These findings align with the adaptability of taxa such as Aspergillus, Candida, and Calyptella to nutrient-poor and oligotrophic environments, such as bat roosts (Ogórek et al., 2013; Wasti et al., 2021). The PCoA revealed distinct clustering among the fungal communities in the samples. Ansião I, Tomar I, Tomar II and Moura I (1) samples formed a closely associated group, indicates that these samples have similar microbial community compositions despite their differing ecological characteristics. Ansião I and Tomar I are more open and exposed to daylight, while Tomar II and Moura I (1) are deeper and darker. This unexpected similarity suggests that factors beyond climatic conditions, such as the presence of bats, may play a key role in shaping fungal communities. In contrast, Moura I (2) and Montemor-o-novo I exhibited unique fungal profiles, suggesting a more distinct microbial community potentially influenced by their specific environmental characteristics, including variations in nutrient availability, humidity, or visitor factor. These samples, Moura I (2) and Montemor-o-novo I, were the furthest from the exterior, characterized by drier conditions and high proximity to bats. This separation along PC1 and PC2, which explained 28.60% and 23.61% of the variance, respectively, reflects the influence of local environmental factors on fungal diversity. The fungal profile of Moura I (1) and Moura I (2) revealed notable differences, reflecting their distinct environmental characteristics. Although both samples were collected within the same location, they originate from different sites with contrasting conditions. Moura I (1), being more open and exposed to daylight, likely supports fungal communities adapted to fluctuating light and moisture conditions. In contrast, Moura I (2), located furthest from the exterior and characterized by drier conditions, fosters microbial communities better suited to stable, shape fungal diversity, even within the same broader location.
In terms of richness of diversity across the six samples, the rarefaction curves validate the adequacy of sequencing depth, ensuring that the observed diversity is reliable (Figure 3). Meanwhile, the Shannon index highlights diversity differences across sites, revealing ecological or environmental factors influencing fungal communities (Figure 4). For example, higher diversity at Moura I (1), Tomar I, and Ansião I, all samples collected near the exterior, could reflect more favorable or variable habitats, while the lower diversity at Moura I (2), Montemor-o-novo I, and Tomar II, collected from deeper zones, might result from environmental or resource limitations. Together, they emphasize the interplay between sufficient sampling and ecological factors shaping fungal diversity in oligotrophic cave environments. As discussed earlier, although Moura I (1) and Moura I (2) were both collected within the same broader location, they were sampled from different sites with contrasting environmental conditions: Moura I (1) is more open and exposed to daylight, while Moura I (2) is located furthest from the exterior and characterized by drier conditions, highlighting the impact of microhabitat variability.
The heatmap, combined with hierarchical clustering dendrograms for both fungal taxa and sampling sites (Figure 6), provides a comprehensive overview of the relative abundance and community structure of fungal taxa across the six sampling sites. The clustering patterns reveal distinct relationships between sites, as well as differences in taxon distribution, which may reflect underlying ecological or environmental drivers.
Some genera, such as Buckleyzyma, and Calyptella, are present only in Moura I (2). These fungi thrive in plant-rich habitats, where they can infect host plants, leading to disease development. The presence of these genera in Mour I (2) may reflect the unique surrounding environment, which includes extensive olive groves, distinguishing this location from the others, where the environmental conditions or host availability may be less conducive to their growth. Buckleyzyma and Calyptella might rely on the proximity of living plants for infection, utilizing plant tissues as nutrients and possibly contributing to plant stress or decay (Chen et al., 2024; Gallego-Clemente et al., 2023). Their exclusive presence in Moura I (2) may indicate that this location supports a unique plant community or microenvironment favorable to the establishment and proliferation of these plant pathogens.
Additionally, the heatmap reveals a distinct dominance of Peltula in Tomar II, as well as the dominance of Aspergillus and Sterigmatomyces in Montemor-o-novo I. This dominance could reflect unique ecological or environmental characteristics at Tomar II, such as the availability of specific nutrients, pH levels, or climatic conditions that favor the proliferation of certain fungi. The bat roost is located near a river in a rainy region, a setting quite distinct from Montemor-o-novo I and Moura I, which are drier and more isolated. Such location-specific patterns underscore the potential for localized environmental factors to shape fungal community structures (Moore et al., 2021).
The presence of Penicillium and Aspergillus across most samples, as indicated in the heatmap, highlights their ecological adaptability and ubiquity (Krijgsheld et al., 2012; Rabha & Jha, 2018). These genera appear prominently in various sampling locations, suggesting that they are not limited to specific environments but can thrive in a wide range of conditions. The heatmap shows a consistent presence of these fungi, reflecting their ability to colonize different substrates and survive in diverse ecological conditions. This widespread distribution further supports their role as generalist organisms, able to proliferate in areas with varying levels of organic matter, moisture, and temperature (Krijgsheld et al., 2012; Rabha & Jha, 2018). Their adaptability and efficient spore dispersal mechanisms likely contribute to their success in such varied environments, allowing them to dominate in most of the samples surveyed.
The clustering observed in the heatmap and the clustering in the PCoA plot differ, which can be explained by differences in the underlying analytical methods. The heatmap focuses on a subset of relatively abundant or selected fungal taxa, highlighting differences driven by dominant taxa. In contrast, the PCoA analysis uses the full dataset, including rarer taxa, to calculate Bray-Curtis dissimilarities, reflecting broader community-level patterns. Additionally, the PCoA captures only 52.21% of the total variance in fungal community composition, meaning that much of the variation is not represented, potentially obscuring relationships seen in the heatmap. The heatmap allows for taxon-specific insights, which can influence site clustering. Meanwhile, PCoA condenses the data into two principal coordinates, potentially flattening subtle differences that are more evident in the heatmap's hierarchical clustering.
The compositional differences between samples are effectively illustrated using a stacked bar plot, which visually highlights the relative abundance of genera. In the case of Montemor-o-novo I and Tomar II, the dominance of just two genera is immediately apparent, as their segments occupy most of the bars, with only minor contributions from other genera. This stark dominance supports the lower diversity values observed for these sites in the PCoA graph. In contrast, the composition of Moura I (2) is markedly different, as shown by the more evenly distributed contributions of multiple genera in its bar. This pattern reflects a higher community diversity, consistent with the greater distance of Moura I (2) from Montemor-o-novo I and Tomar II in the PCoA graph. Interestingly, these samples come from a region hosting one of the largest bat colonies in the country, which may contribute to this diversity. Together, these visualizations complement each other, demonstrating how differences in microbial composition correlate with variations in diversity indices across the sampling sites.
The abundance of Aspergillus, Candida, and Calyptella in cave air samples reflects the unique adaptations and ecological roles of these genera. Aspergillus species are known for their remarkable resilience, capable of surviving in nutrient-depleted environments by utilizing a wide range of organic substrates. This adaptability allows them to thrive in the oligotrophic conditions characteristic of bat roosts, where they may contribute to nutrient cycling by decomposing organic matter brought into the ecosystem (Hagiwara et al., 2016). Candida, a genus commonly associated with opportunistic colonization, thrives in microhabitats with varying nutrient availability and moisture, which are often found in cave environments. Its versatility may also allow it to utilize specific substrates present in aerosols or biofilms within bat roosts (Morschhäuser, 2024). Calyptella, though less commonly studied, is often associated with specialized ecological niches and may play a unique role in fungal community dynamics, potentially interacting with cave biota or contributing to biofilm formation. Together, these genera highlight the interplay of adaptability and niche specialization in shaping fungal diversity within subterranean ecosystems.
The sampling locations were bat roosts frequented by bats, and previous studies have demonstrated a positive correlation between the number of bats and the concentration of airborne fungi (Kokurewicz et al., 2016). For instance, the presence of bats significantly elevates the levels of aeromycota, as their movement, guano, and shedding of skin or fur serve as nutrient sources and dispersal mechanisms for fungal spores (Kokurewicz et al., 2016). Myotis myotis, the most common bat species in Europe, has been shown to contribute to elevated fungal concentrations in underground environments (Borzęcka et al., 2021). These fungi, carried or propagated by bats, can include opportunistic pathogens that may affect both wildlife and human health. Moreover, the guano-rich environment created by bats fosters a unique microbiome, supporting the growth of fungi adapted to oligotrophic and extreme conditions typically found in bat roosts (Borzęcka et al., 2021).
Fungi observed in the culturable dataset were not among the most abundant in the metabarcoding analysis results, highlighting the complementary strengths of both approaches. Culture-based methods favor fast-growing or spore-forming fungi, while metabarcoding analysis captures a broader taxonomic range, including unculturable taxa (Keck et al., 2022). The fungal diversity detected in Portuguese bat roosts underscores their ecological significance as reservoirs of unique and potentially novel species. The presence of taxa unclassifiable beyond higher taxonomic ranks points to the potential for discovering undescribed fungi in these environments. This study, the first to comprehensively assess cave air fungal diversity in Portugal, highlights the interplay between ecological and anthropogenic factors shaping these communities. It emphasizes the need for conservation measures, such as restricting access to sensitive cave areas and minimizing human impact, to preserve native microbial diversity.
5. Conclusions
This study highlights the diverse fungal communities present in Portuguese bat roosts, uncovering 286 genera through metabarcoding alongside several culturable taxa, including Aspergillus and Penicillium. The results reveal the influence of environmental factors, such as nutrient availability and climatic conditions, as well as human activities like tourism, on fungal diversity and community structure. These findings underscore the ecological importance of fungi in nutrient cycling and their adaptability to oligotrophic environments. Furthermore, the identification of site-specific taxa reflects the unique ecological niches within cave ecosystems. To preserve these fragile environments and their microbial diversity, conservation strategies, such as limiting human impact and regular monitoring, are essential to mitigate anthropogenic disturbances and ensure the sustainability of these subterranean habitats.
Author Contributions
J.T.B. data curation, formal analysis, investigation, validation, visualization, writing – original draft, writing – review & editing; G.M. data curation, formal analysis, investigation, validation, visualization, writing – original draft, writing – review & editing; E.P. validation, visualization, writing – review & editing; P.G.S. resources, writing – review & editing; H.R. data curation, resources, writing – review & editing; J.M. writing – review & editing; S.I.V.S. writing – review & editing; J.R.M. conceptualization, funding acquisition, methodology, project administration, resources, supervision, validation, visualization, writing – review & editing.
Institutional Review Board Statement
Informed Consent Statement
Data Availability Statement
The data presented in this study are available on request from the corresponding author.
Acknowledgments
This work was supported by the project PRR-C05-i03-I-000190 – RumiRes: Epidemiological Surveillance and Awareness of Antimicrobial Resistance and Drug Residues in Small Ruminants in the Central Region.
Conflicts of Interest
The authors declare no conflicts of interest.
References
- Abarenkov: K., Zirk, A., Piirmann, T., Pöhönen, R., Ivanov, F., Nilsson, R. H., & Kõljalg, U. (2024). UNITE general FASTA release for Fungi. Version 04.04.2024. UNITE Community. [CrossRef]
- Borzęcka, J., Piecuch, A., Kokurewicz, T., Lavoie, K. H., & Ogórek, R. (2021). Greater mouse-eared bats (Myotis myotis) hibernating in the nietoperek bat reserve (poland) as a vector of airborne culturable fungi. Biology, 10(7). [CrossRef]
- Cantrell, S. A., Dianese, J. C., Fell, J., Gunde-Cimerman, N., & Zalar, P. (2011). Unusual fungal niches. Mycologia, 103(6), 1161–1174. [CrossRef]
- Chen, M., Ding, Z., Zhou, M., Shang, Y., Li, C., Li, Q., Bu, T., Tang, Z., & Chen, H. (2024). The diversity of endophytic fungi in Tartary buckwheat (Fagopyrum tataricum) and its correlation with flavonoids and phenotypic traits. Frontiers in Microbiology, 15(March), 1–16. [CrossRef]
- De Coster, W., & Rademakers, R. (2023). {NanoPack2}: population-scale evaluation of long-read sequencing data. Bioinformatics, 39(5), btad311. [CrossRef]
- De Mandal, S., Zothansanga, Panda, A. K., Bisht, S. S., & Senthil Kumar, N. (2015). First report of bacterial community from a Bat Guano using Illumina next-generation sequencing. Genomics Data, 4, 99–101. [CrossRef]
- Dimkić, I., Fira, D., Janakiev, T., Kabić, J., Stupar, M., Nenadić, M., Unković, N., & Grbić, M. L. (2021). The microbiome of bat guano: for what is this knowledge important? Applied Microbiology and Biotechnology, 105(4), 1407–1419. [CrossRef]
- Domsch, K. H. (1993). Compendium of soil fungi. IHW- Verlag 1, 630–643.
- Gallego-Clemente, E., Moreno-González, V., Ibáñez, A., Calvo-Peña, C., Ghoreshizadeh, S., Radišek, S., Cobos, R., & Coque, J. J. R. (2023). Changes in the Microbial Composition of the Rhizosphere of Hop Plants Affected by Verticillium Wilt Caused by Verticillium nonalfalfae. Microorganisms, 11(7). [CrossRef]
- Hagiwara, D., Sakamoto, K., Abe, K., & Gomi, K. (2016). Signaling pathways for stress responses and adaptation in Aspergillus species: stress biology in the post-genomic era. Bioscience, Biotechnology, and Biochemistry, 80(9), 1667–1680. [CrossRef]
- Jurado, V., Laiz, L., Rodriguez-Nava, V., Boiron, P., Hermosin, B., Sanchez-Moral, S., & Saiz-Jimenez, C. (2010). Pathogenic and opportunistic microorganisms in caves. International Journal of Speleology, 39(1), 15–24. [CrossRef]
- Keck, F., Blackman, R., Bossart, R., Brantschen, J., Couton, M., Hürlemann, S., Kirschner, D., Locher, N., Zhang, H., & Altermatt, F. (2022). Meta-analysis shows both congruence and complementarity of DNA and eDNA metabarcoding to traditional methods for biological community assessment. Molecular Ecology, 31, 1820–1835. [CrossRef]
- Klich, M. A. (2002). Biogeography of Aspergillus species in soil and litter. Mycologia, 94(1), 21–27. [CrossRef]
- Kokurewicz, T., Ogórek, R., Pusz, W., & Matkowski, K. (2016). Bats Increase the Number of Cultivable Airborne Fungi in the “Nietoperek” Bat Reserve in Western Poland. Microbial Ecology, 72(1), 36–48. [CrossRef]
- Krijgsheld, P., Bleichrodt, R., Veluw, G., Wang, F., Müller, W., Dijksterhuis, J., & Wösten, H. (2012). Development in Aspergillus. Studies in Mycology, 74, 1–29. [CrossRef]
- Lu, J., Breitwieser, F. P., Thielen, P., & Salzberg, S. L. (2017). Bracken: estimating species abundance in metagenomics data. PeerJ Computer Science, 3, e104. [CrossRef]
- Moore, J. A. M., Anthony, M. A., Pec, G. J., Trocha, L. K., Trzebny, A., Geyer, K. M., van Diepen, L. T. A., & Frey, S. D. (2021). Fungal community structure and function shifts with atmospheric nitrogen deposition. Global Change Biology, 27(7), 1349–1364. [CrossRef]
- Moreira, G. (2025). GmoreiraVet/Guitools: v1.1.1. Zenodo. [CrossRef]
- Morschhäuser, J. (2024). Adaptation of Candida albicans to specific host environments by gain-of-function mutations in transcription factors. PLoS Pathogens, 20(11), e1012643. [CrossRef]
- Mühldorfer, K. (2013). Bats and Bacterial Pathogens: A Review. Zoonoses and Public Health, 60(1), 93–103. [CrossRef]
- Ogórek, R., Lejman, A., & Matkowski, K. (2013). Fungi isolated from Niedźwiedzia Cave in Kletno (Lower Silesia, Poland). International Journal of Speleology.
- Rabha, J., & Jha, D. (2018). Metabolic Diversity of Penicillium. 217–234. [CrossRef]
- Raper, K. B. (1965). The Genus Aspergillus. The Williams and Wilkins Co.
- Siqueira, J. P. Z., Sutton, D. A., Gené, J., García, D., Wiederhold, N., & Guarro, J. (2018). Species of Aspergillus section Aspergillus from clinical samples in the United States. Medical Mycology, 56(5), 541–550. [CrossRef]
- Soares, D., & Niemiller, M. L. (2020). Extreme Adaptation in Caves. Anatomical Record, 303(1), 15–23. [CrossRef]
- Voigt, C. C., Phelps, K. L., Aguirre, L. F., Schoeman, M. C., Vanitharani, J., & Zubaid, A. (2016). Bats and buildings: The conservation of synanthropic bats. In Bats in the Anthropocene : Conservation of Bats in a Changing World (pp. 427–453).
- Vu, D., Groenewald, M., de Vries, M., Gehrmann, T., Stielow, B., Eberhardt, U., Al-Hatmi, A., Groenewald, J. Z., Cardinali, G., Houbraken, J., Boekhout, T., Crous, P. W., Robert, V., & Verkley, G. J. M. (2019). Large-scale generation and analysis of filamentous fungal DNA barcodes boosts coverage for kingdom fungi and reveals thresholds for fungal species and higher taxon delimitation. Studies in Mycology, 92, 135–154. [CrossRef]
- Wasti, I. G., Khan, F. A. A., Bernard, H., Hassan, N. H., Fayle, T., & Sathiya Seelan, J. S. (2021). Fungal communities in bat guano, speleothem surfaces, and cavern water in Madai cave, Northern Borneo (Malaysia). Mycology, 12(3), 188–202. [CrossRef]
- Wick, R. (2024, November). rrwick/{Porechop}. https://github.com/rrwick/Porechop (2017).
- Wood, D. E., Lu, J., & Langmead, B. (2019). Improved metagenomic analysis with {Kraken} 2. Genome Biology, 20(1), 257. [CrossRef]
- Zhang, Z. F., Liu, F., Zhou, X., Liu, X. Z., Liu, S. J., & Cai, L. (2017). Culturable mycobiota from Karst caves in China, with descriptions of 20 new species. In Persoonia (Vol. 39, Issue 1, pp. 1–31). [CrossRef]
Figure 1.
Geographical distribution of guano samples collected in bat-inhabited natural and anthropogenic bat roosts in Portugal. Coordinate System: WGS 84 / UTM Zone 29N (EPSG: 32629). A: Ansião I; T I: Tomar I; T II: Tomar II; MN: Montemor-o-Novo I; M: Moura I.
Figure 1.
Geographical distribution of guano samples collected in bat-inhabited natural and anthropogenic bat roosts in Portugal. Coordinate System: WGS 84 / UTM Zone 29N (EPSG: 32629). A: Ansião I; T I: Tomar I; T II: Tomar II; MN: Montemor-o-Novo I; M: Moura I.
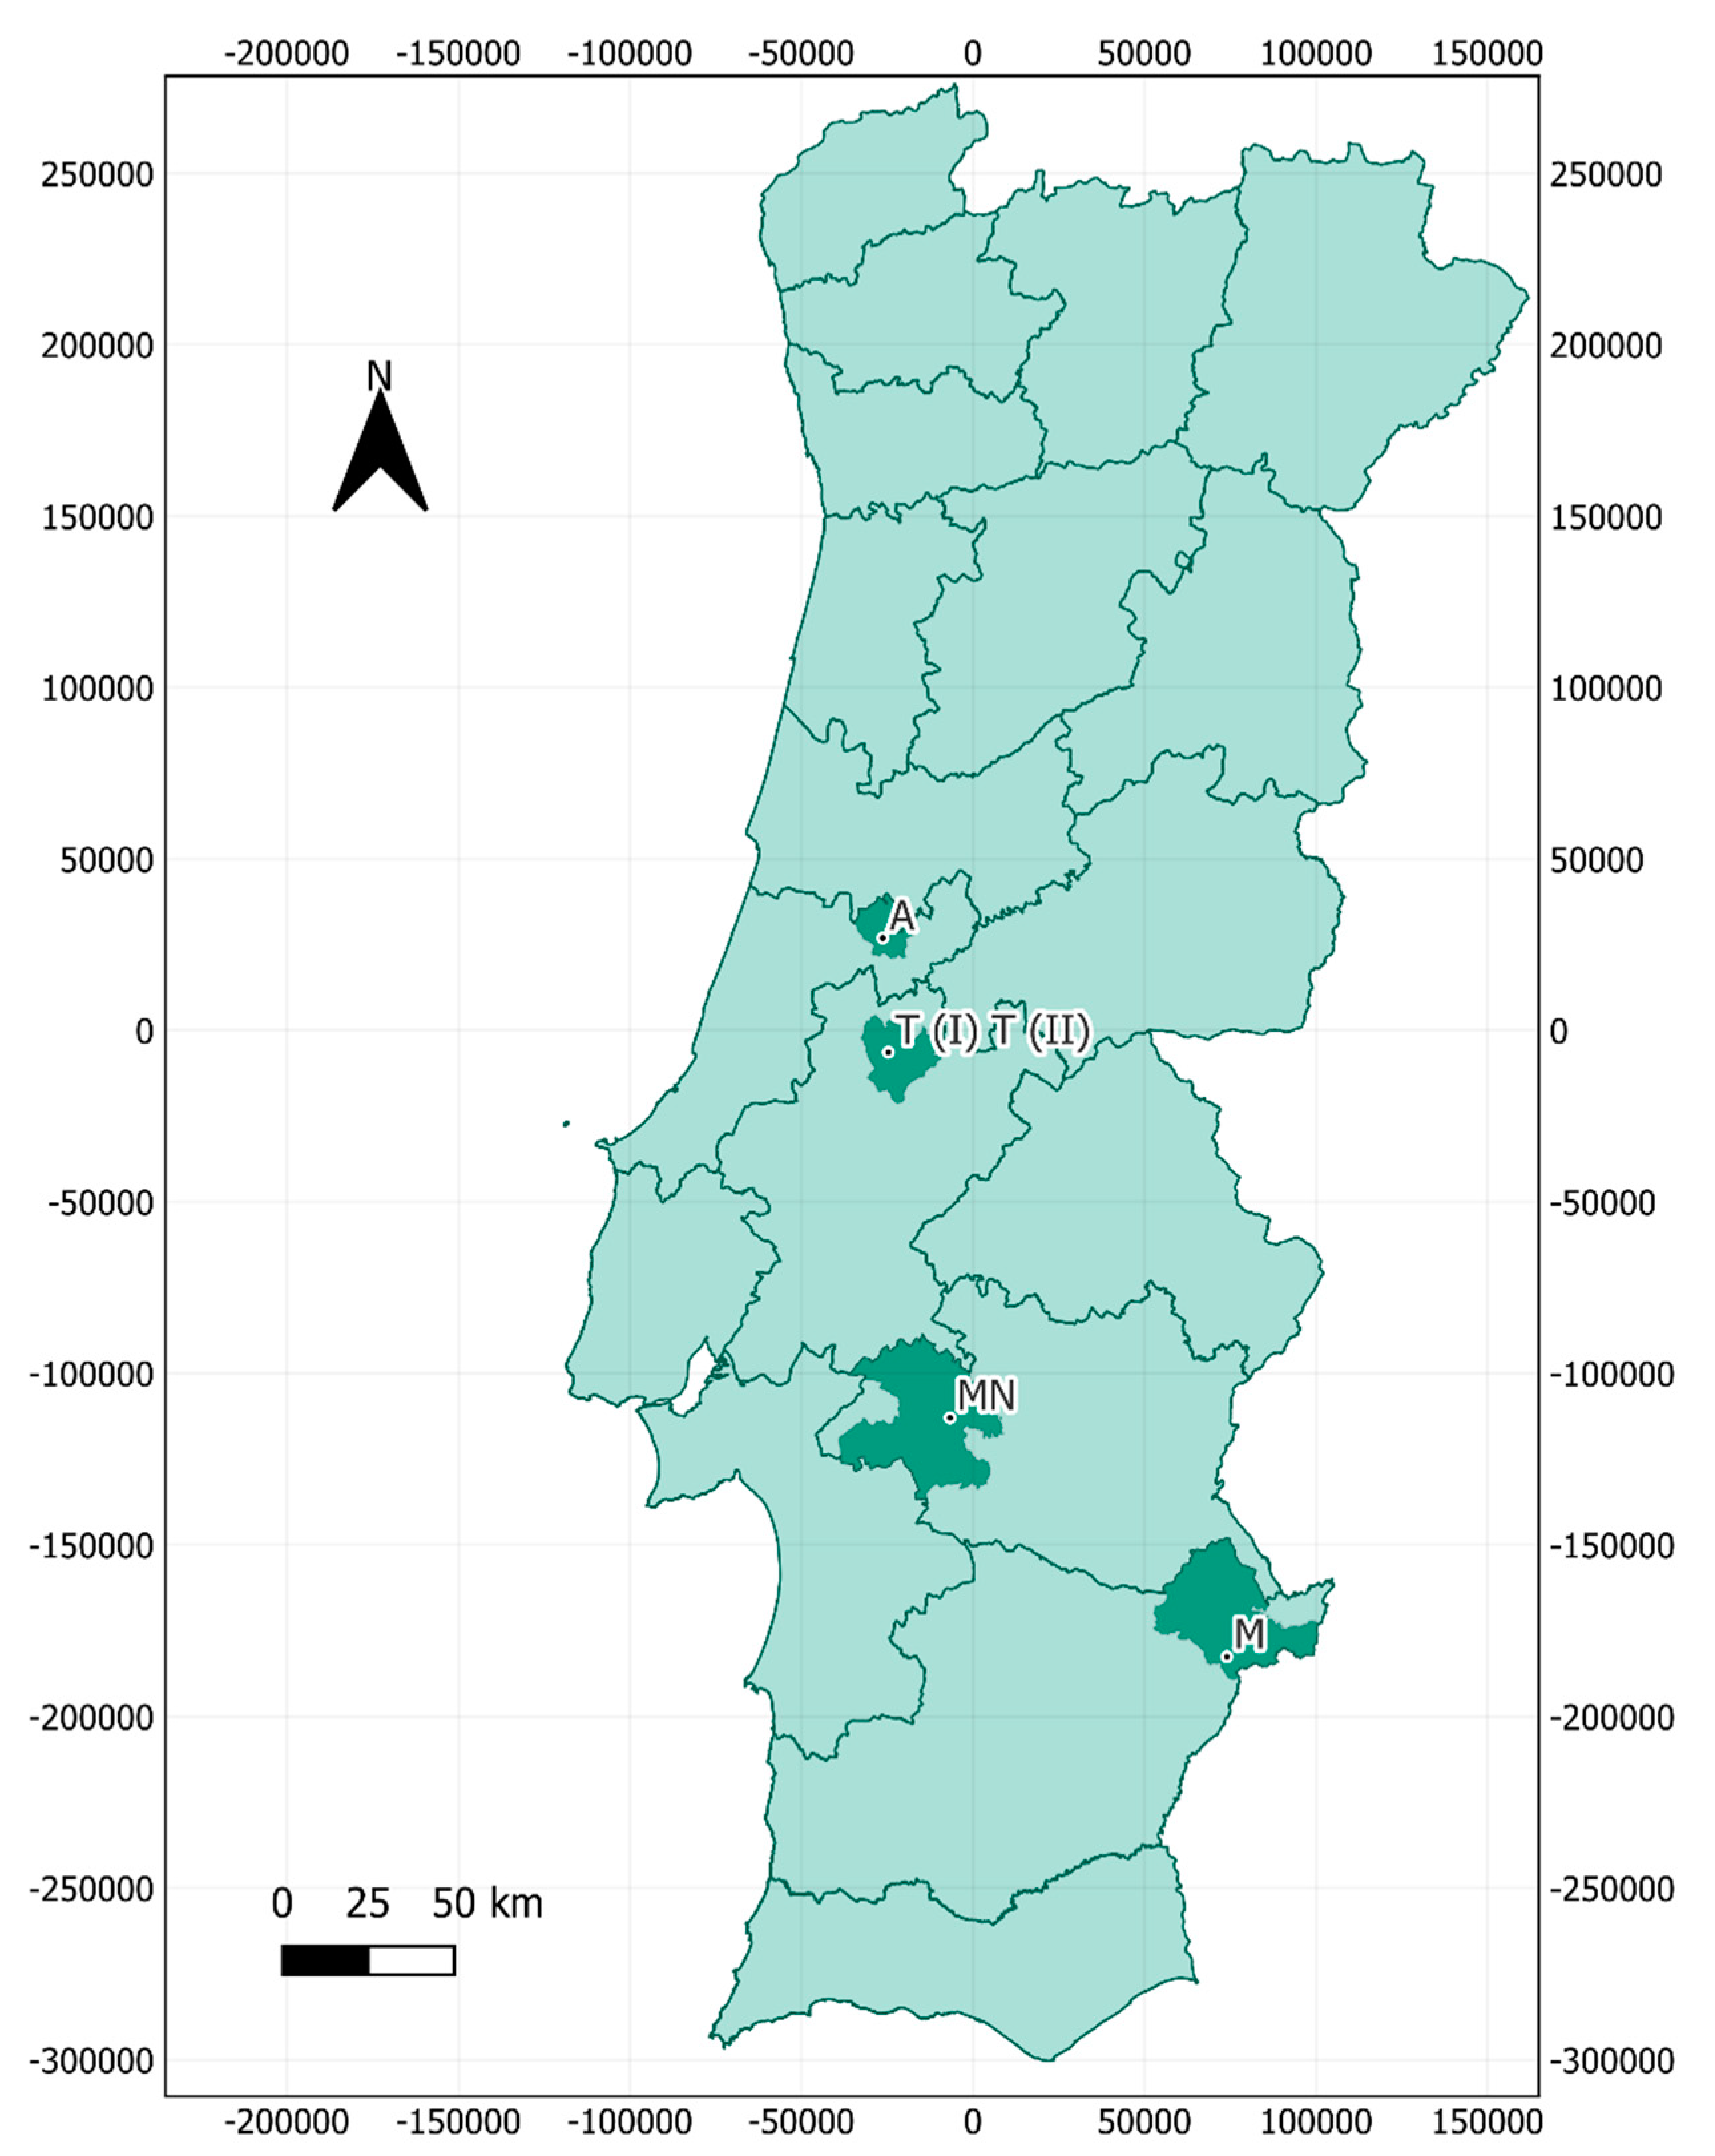
Figure 2.
Sankey plot showing the distribution of the top 15 genera across all samples, illustrating the relative abundance of each genus among all samples.
Figure 2.
Sankey plot showing the distribution of the top 15 genera across all samples, illustrating the relative abundance of each genus among all samples.
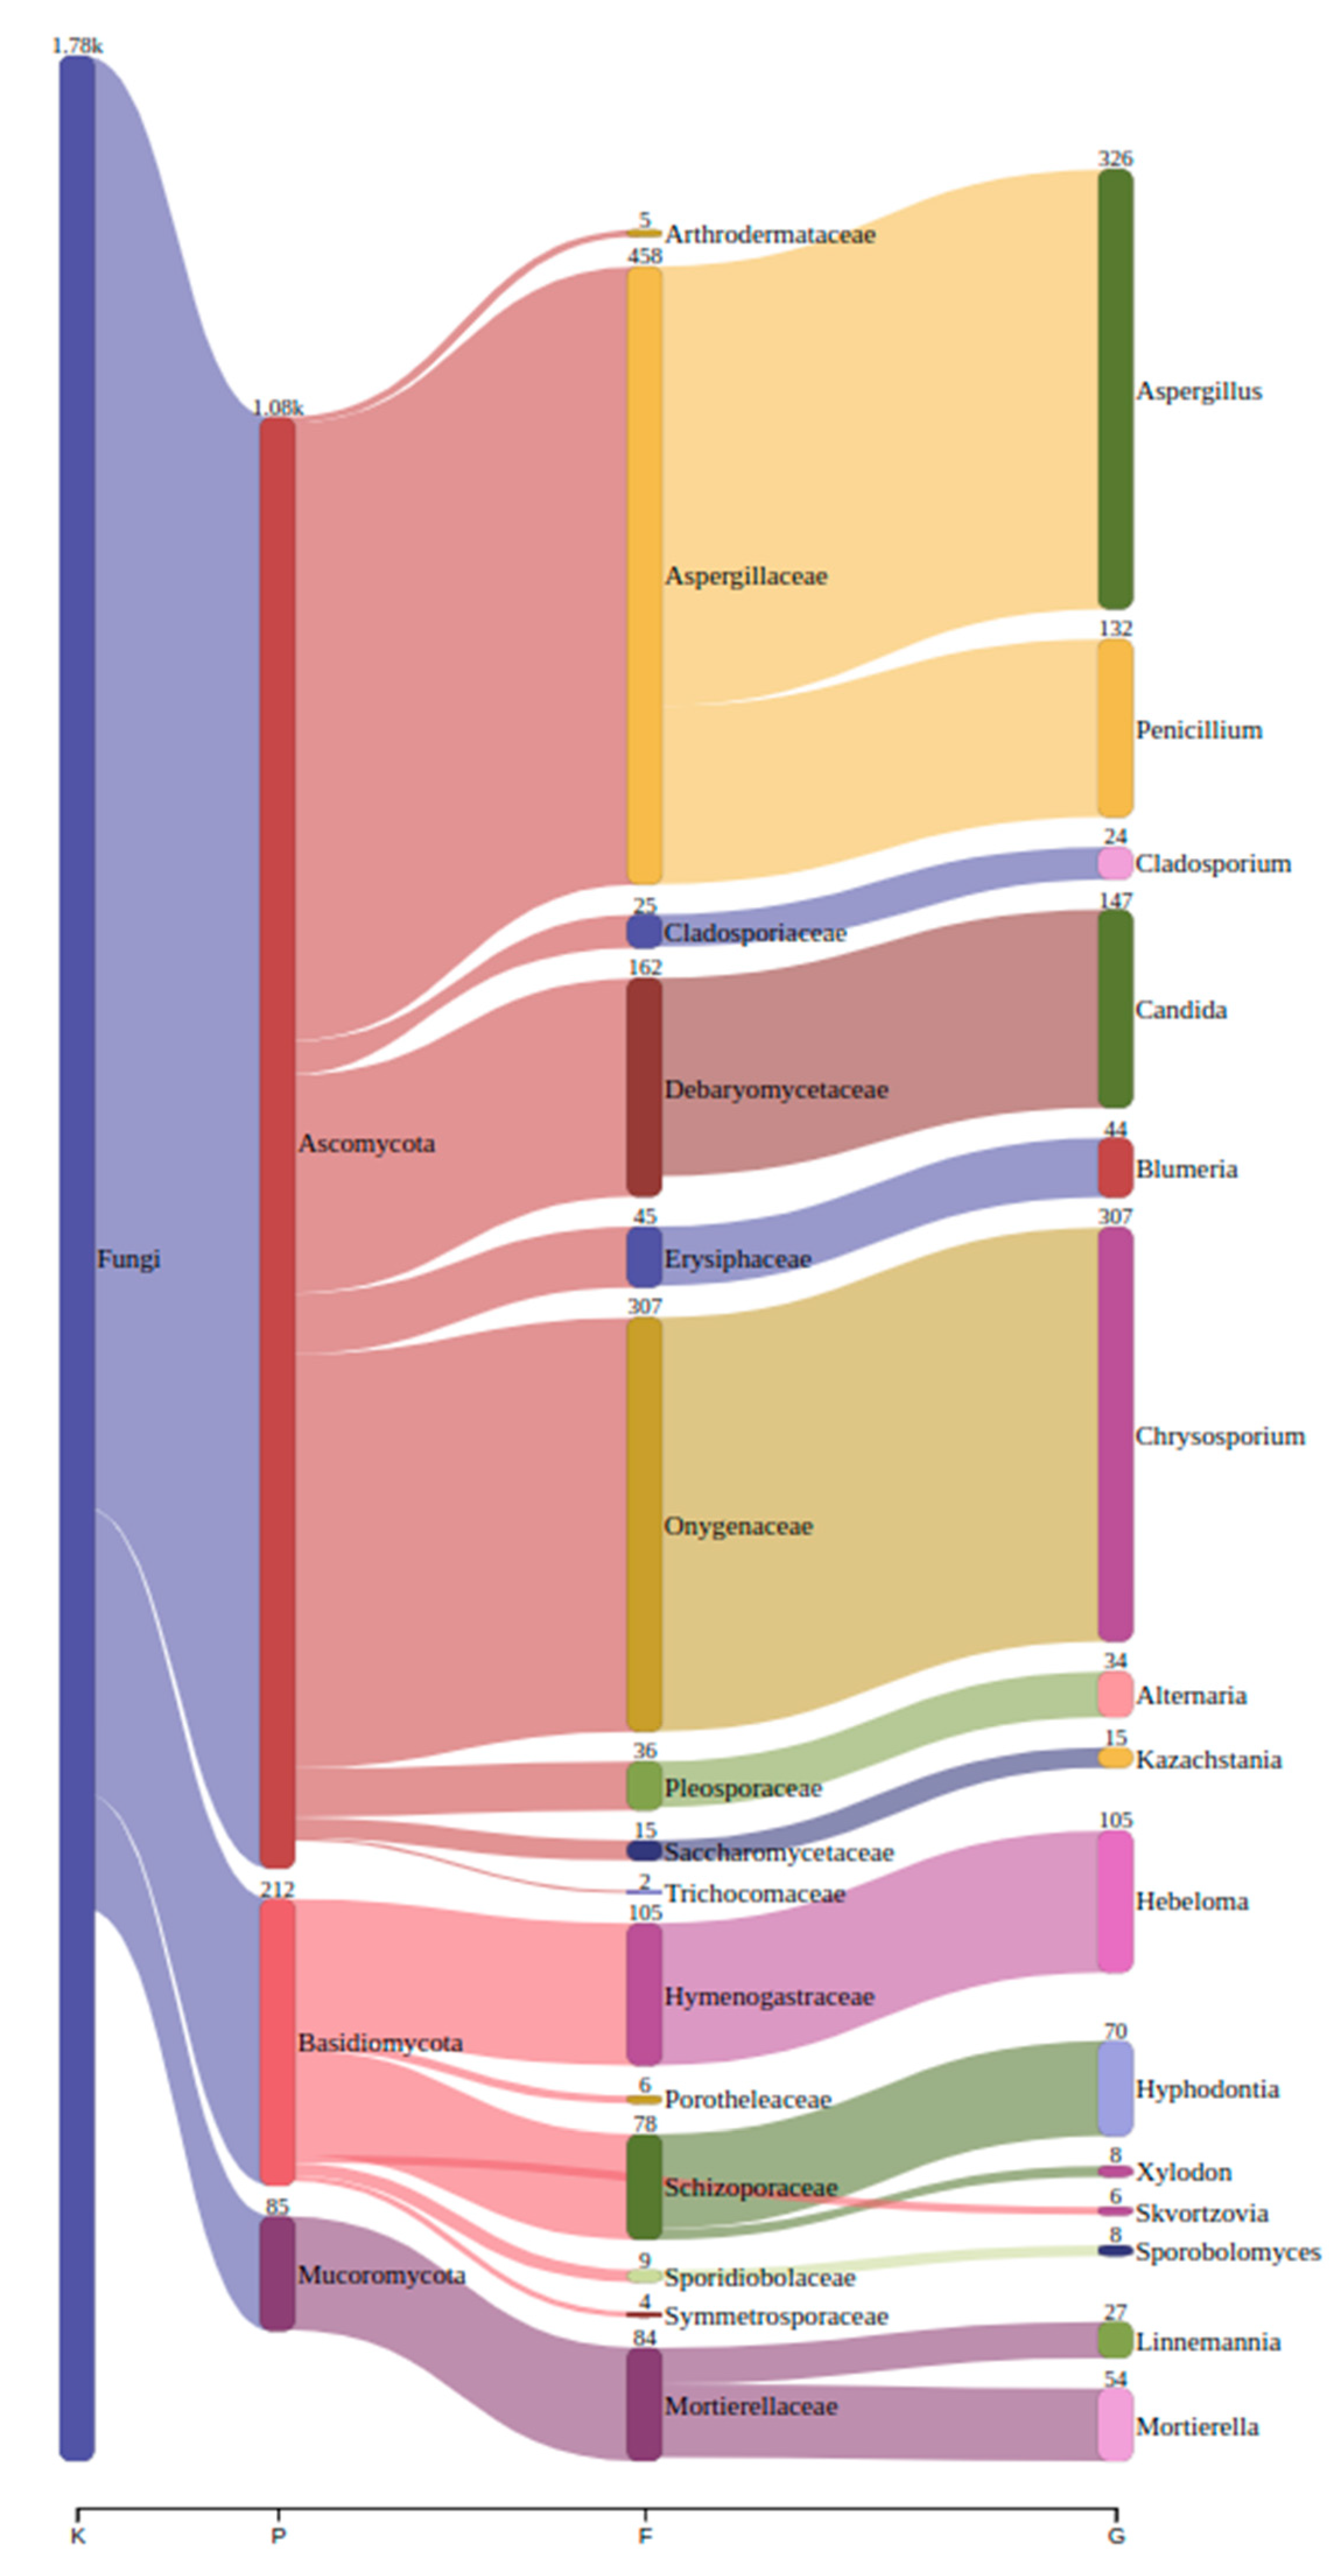
Figure 3.
Rarefaction curve shows fungal richness as a function of sequencing depth, highlighting diversity across sampling sites.
Figure 3.
Rarefaction curve shows fungal richness as a function of sequencing depth, highlighting diversity across sampling sites.
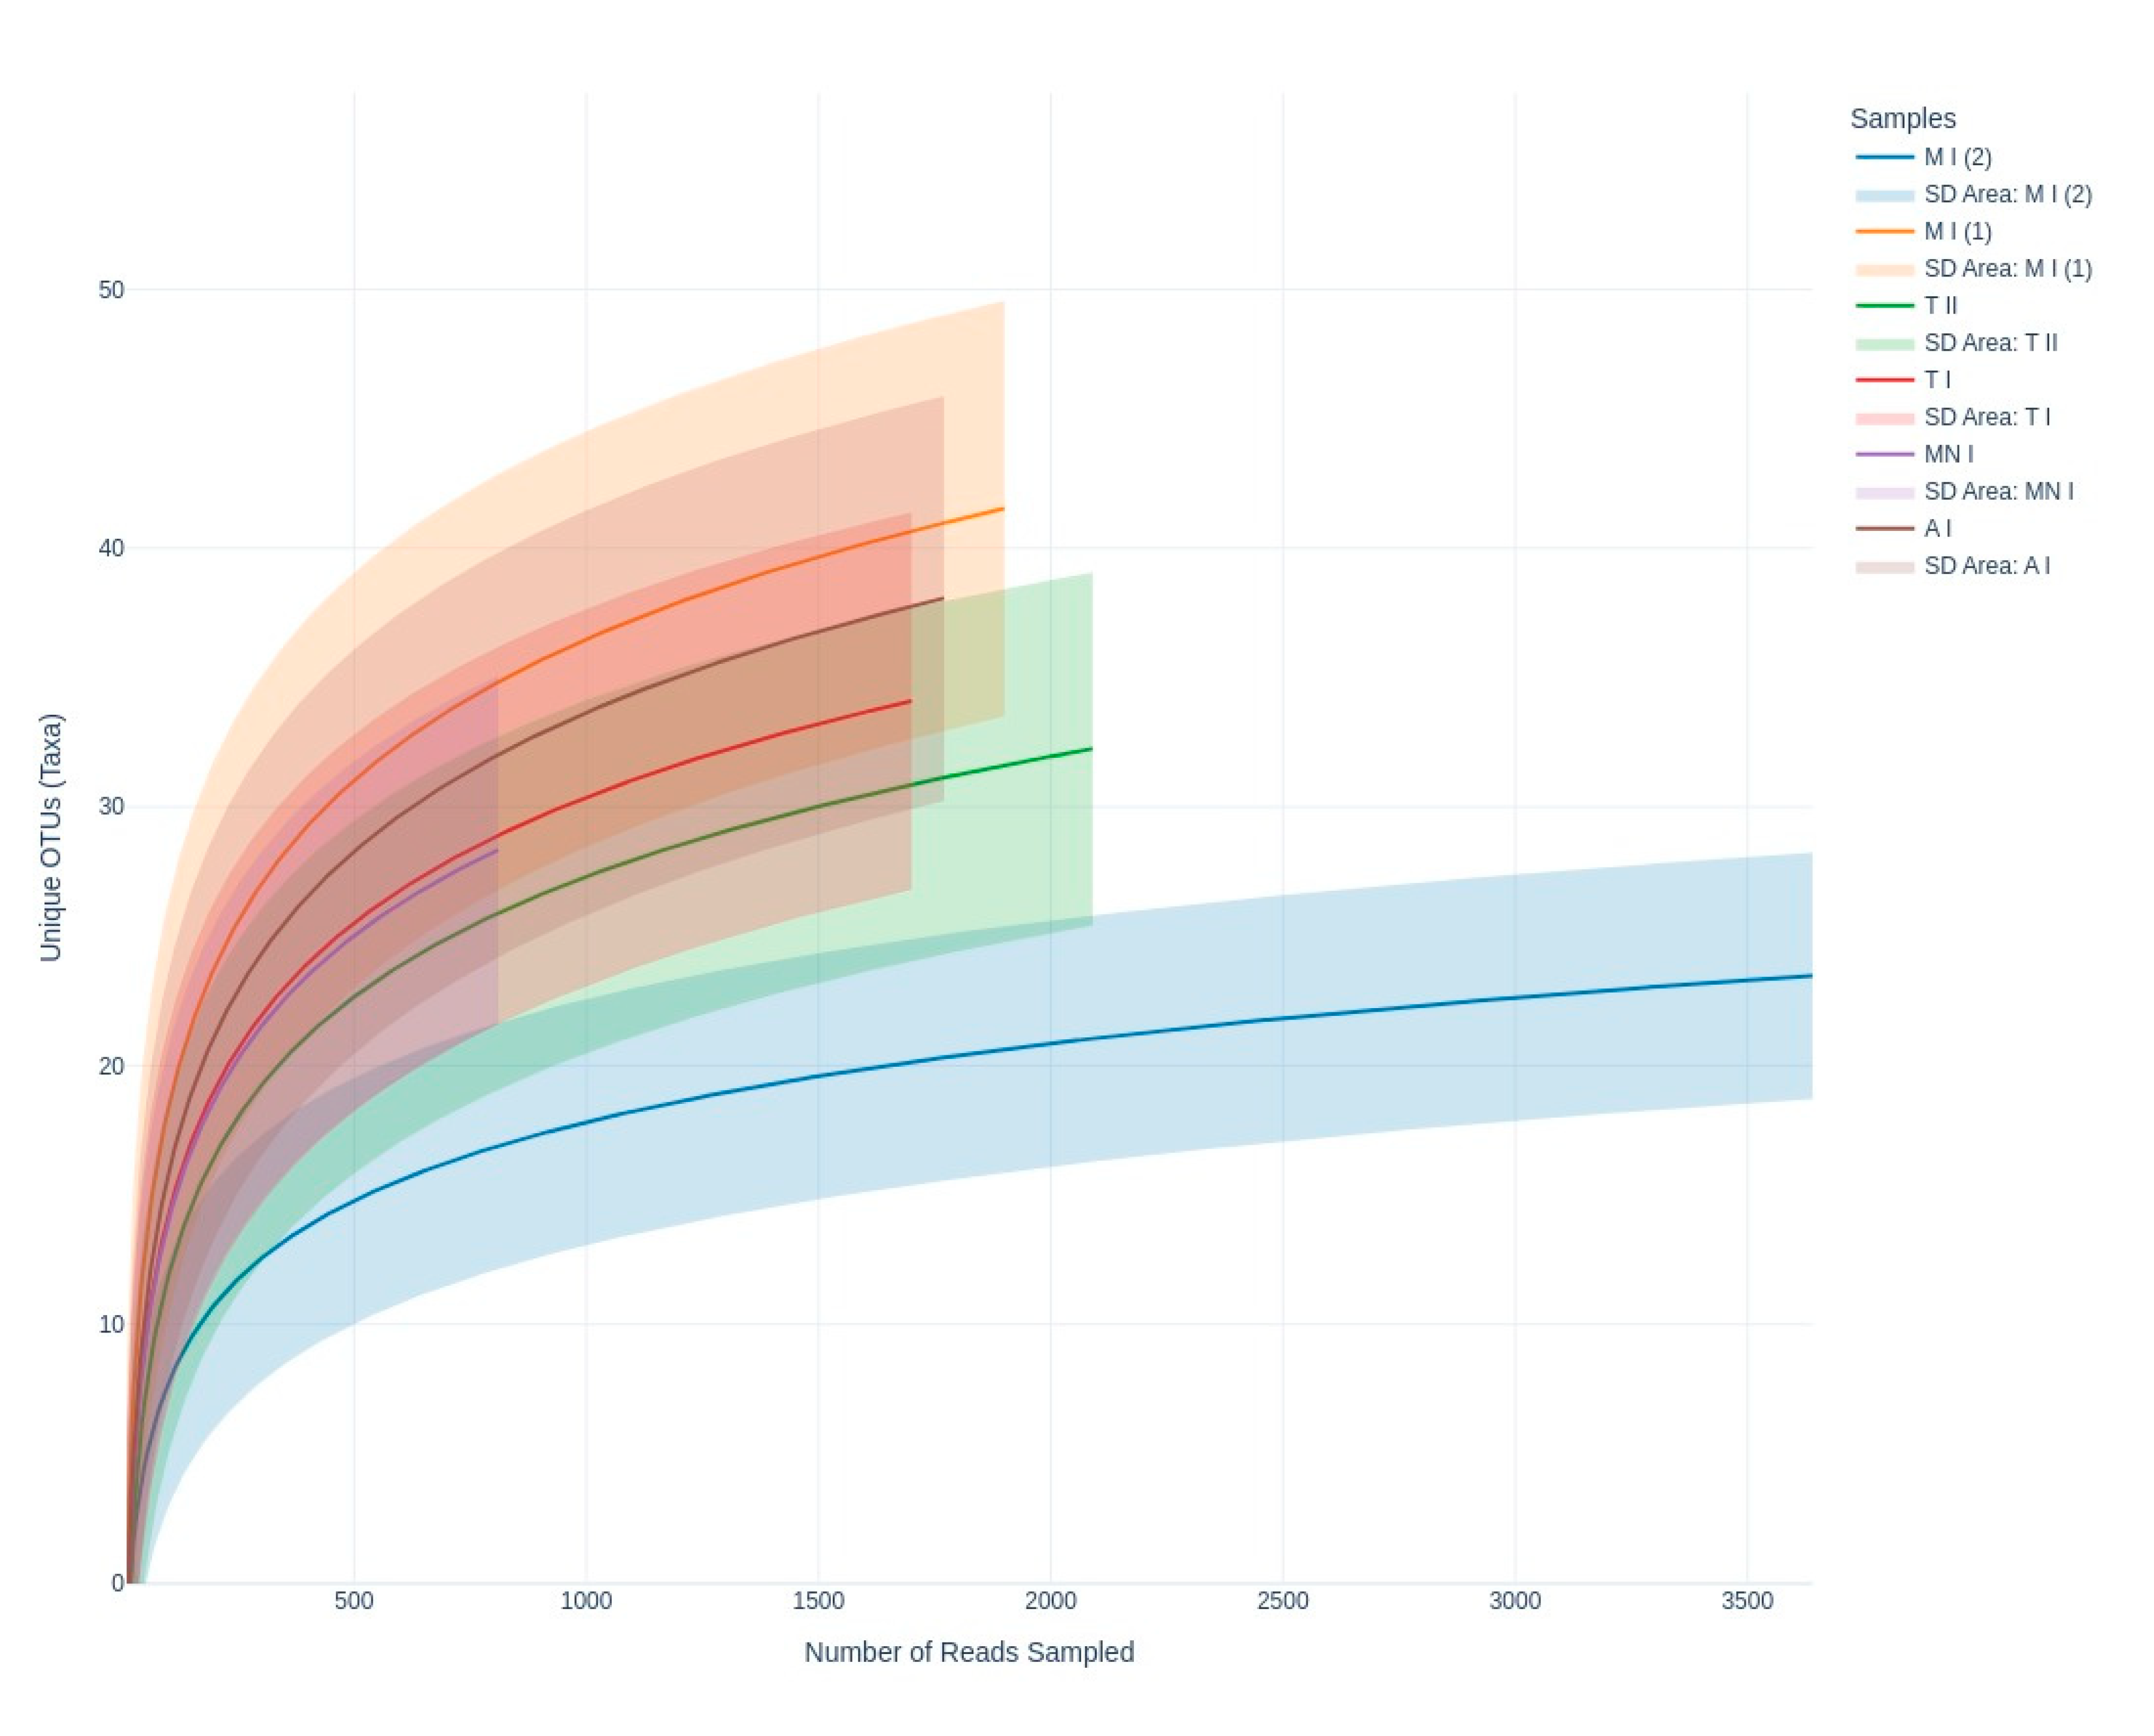
Figure 4.
Shannon index curve illustrates fungal community diversity across sequencing depth, emphasizing evenness and richness among sampling sites.
Figure 4.
Shannon index curve illustrates fungal community diversity across sequencing depth, emphasizing evenness and richness among sampling sites.
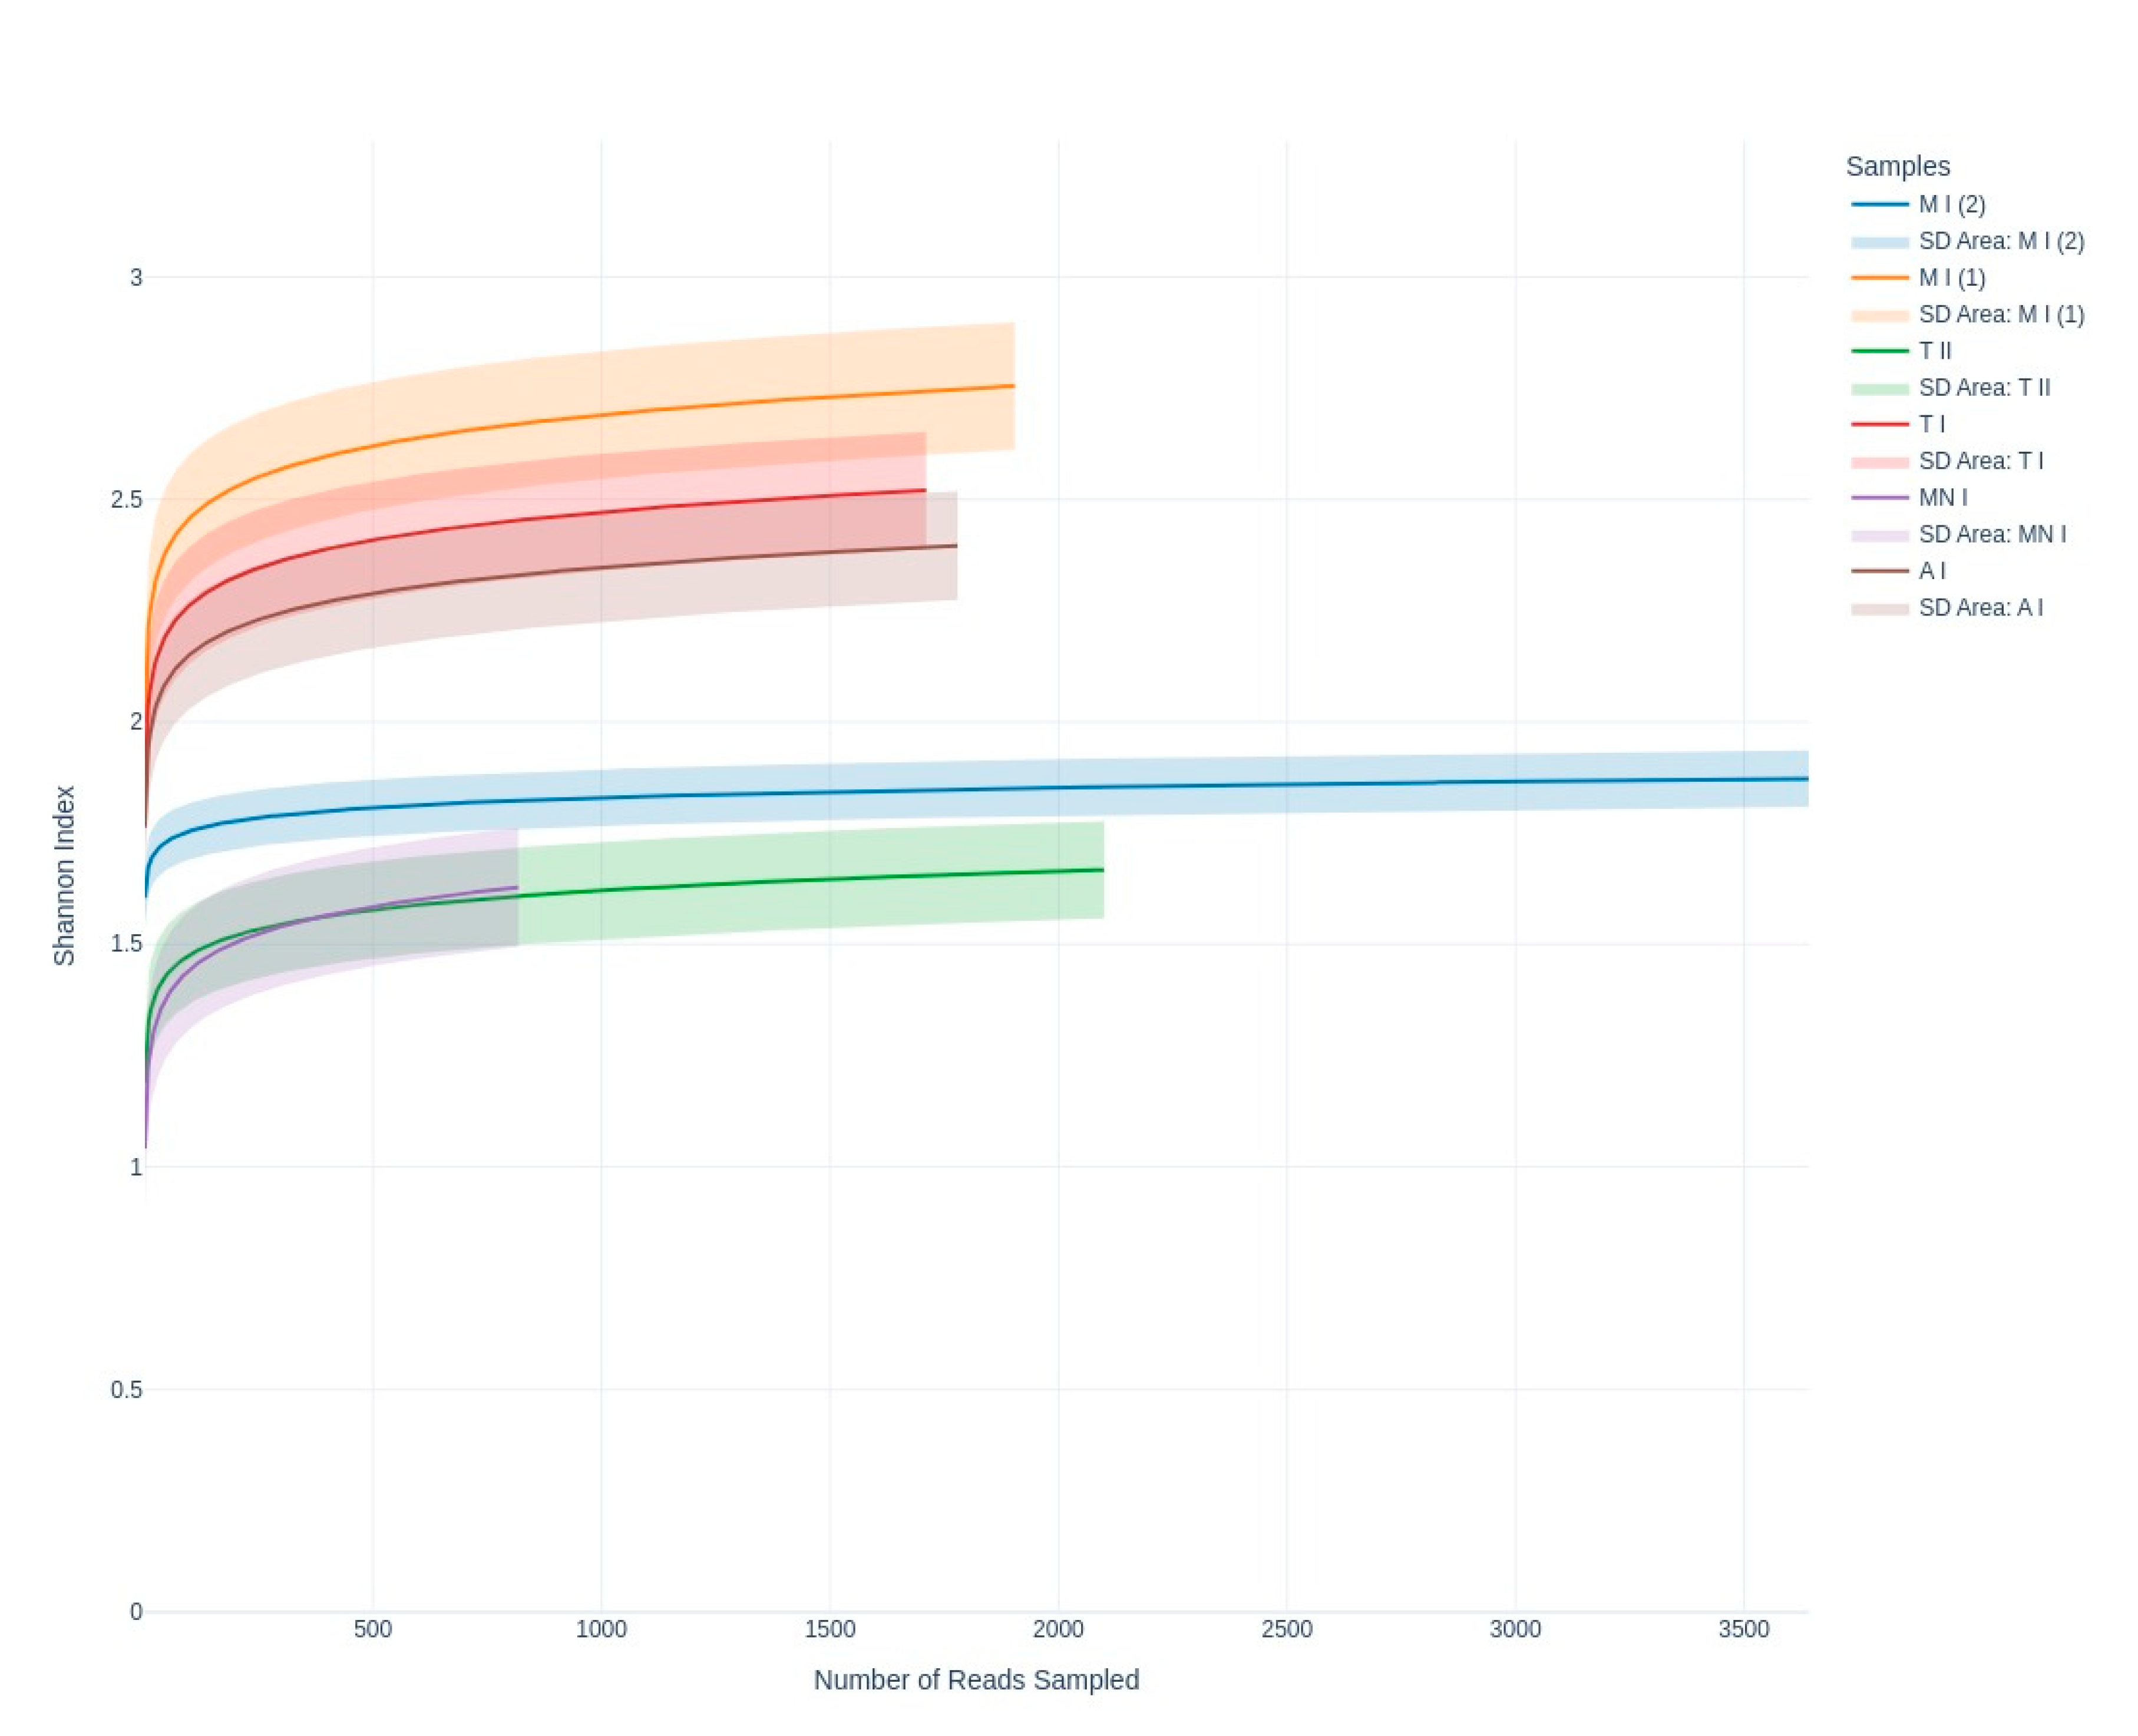
Figure 5.
Principal Coordinate Analysis (PCoA) of Bray-Curtis Dissimilarity plot is based on beta diversity, illustrating fungal community composition across six air samples. PC1: 28.60% variance; PC2: 23.61% variance.
Figure 5.
Principal Coordinate Analysis (PCoA) of Bray-Curtis Dissimilarity plot is based on beta diversity, illustrating fungal community composition across six air samples. PC1: 28.60% variance; PC2: 23.61% variance.
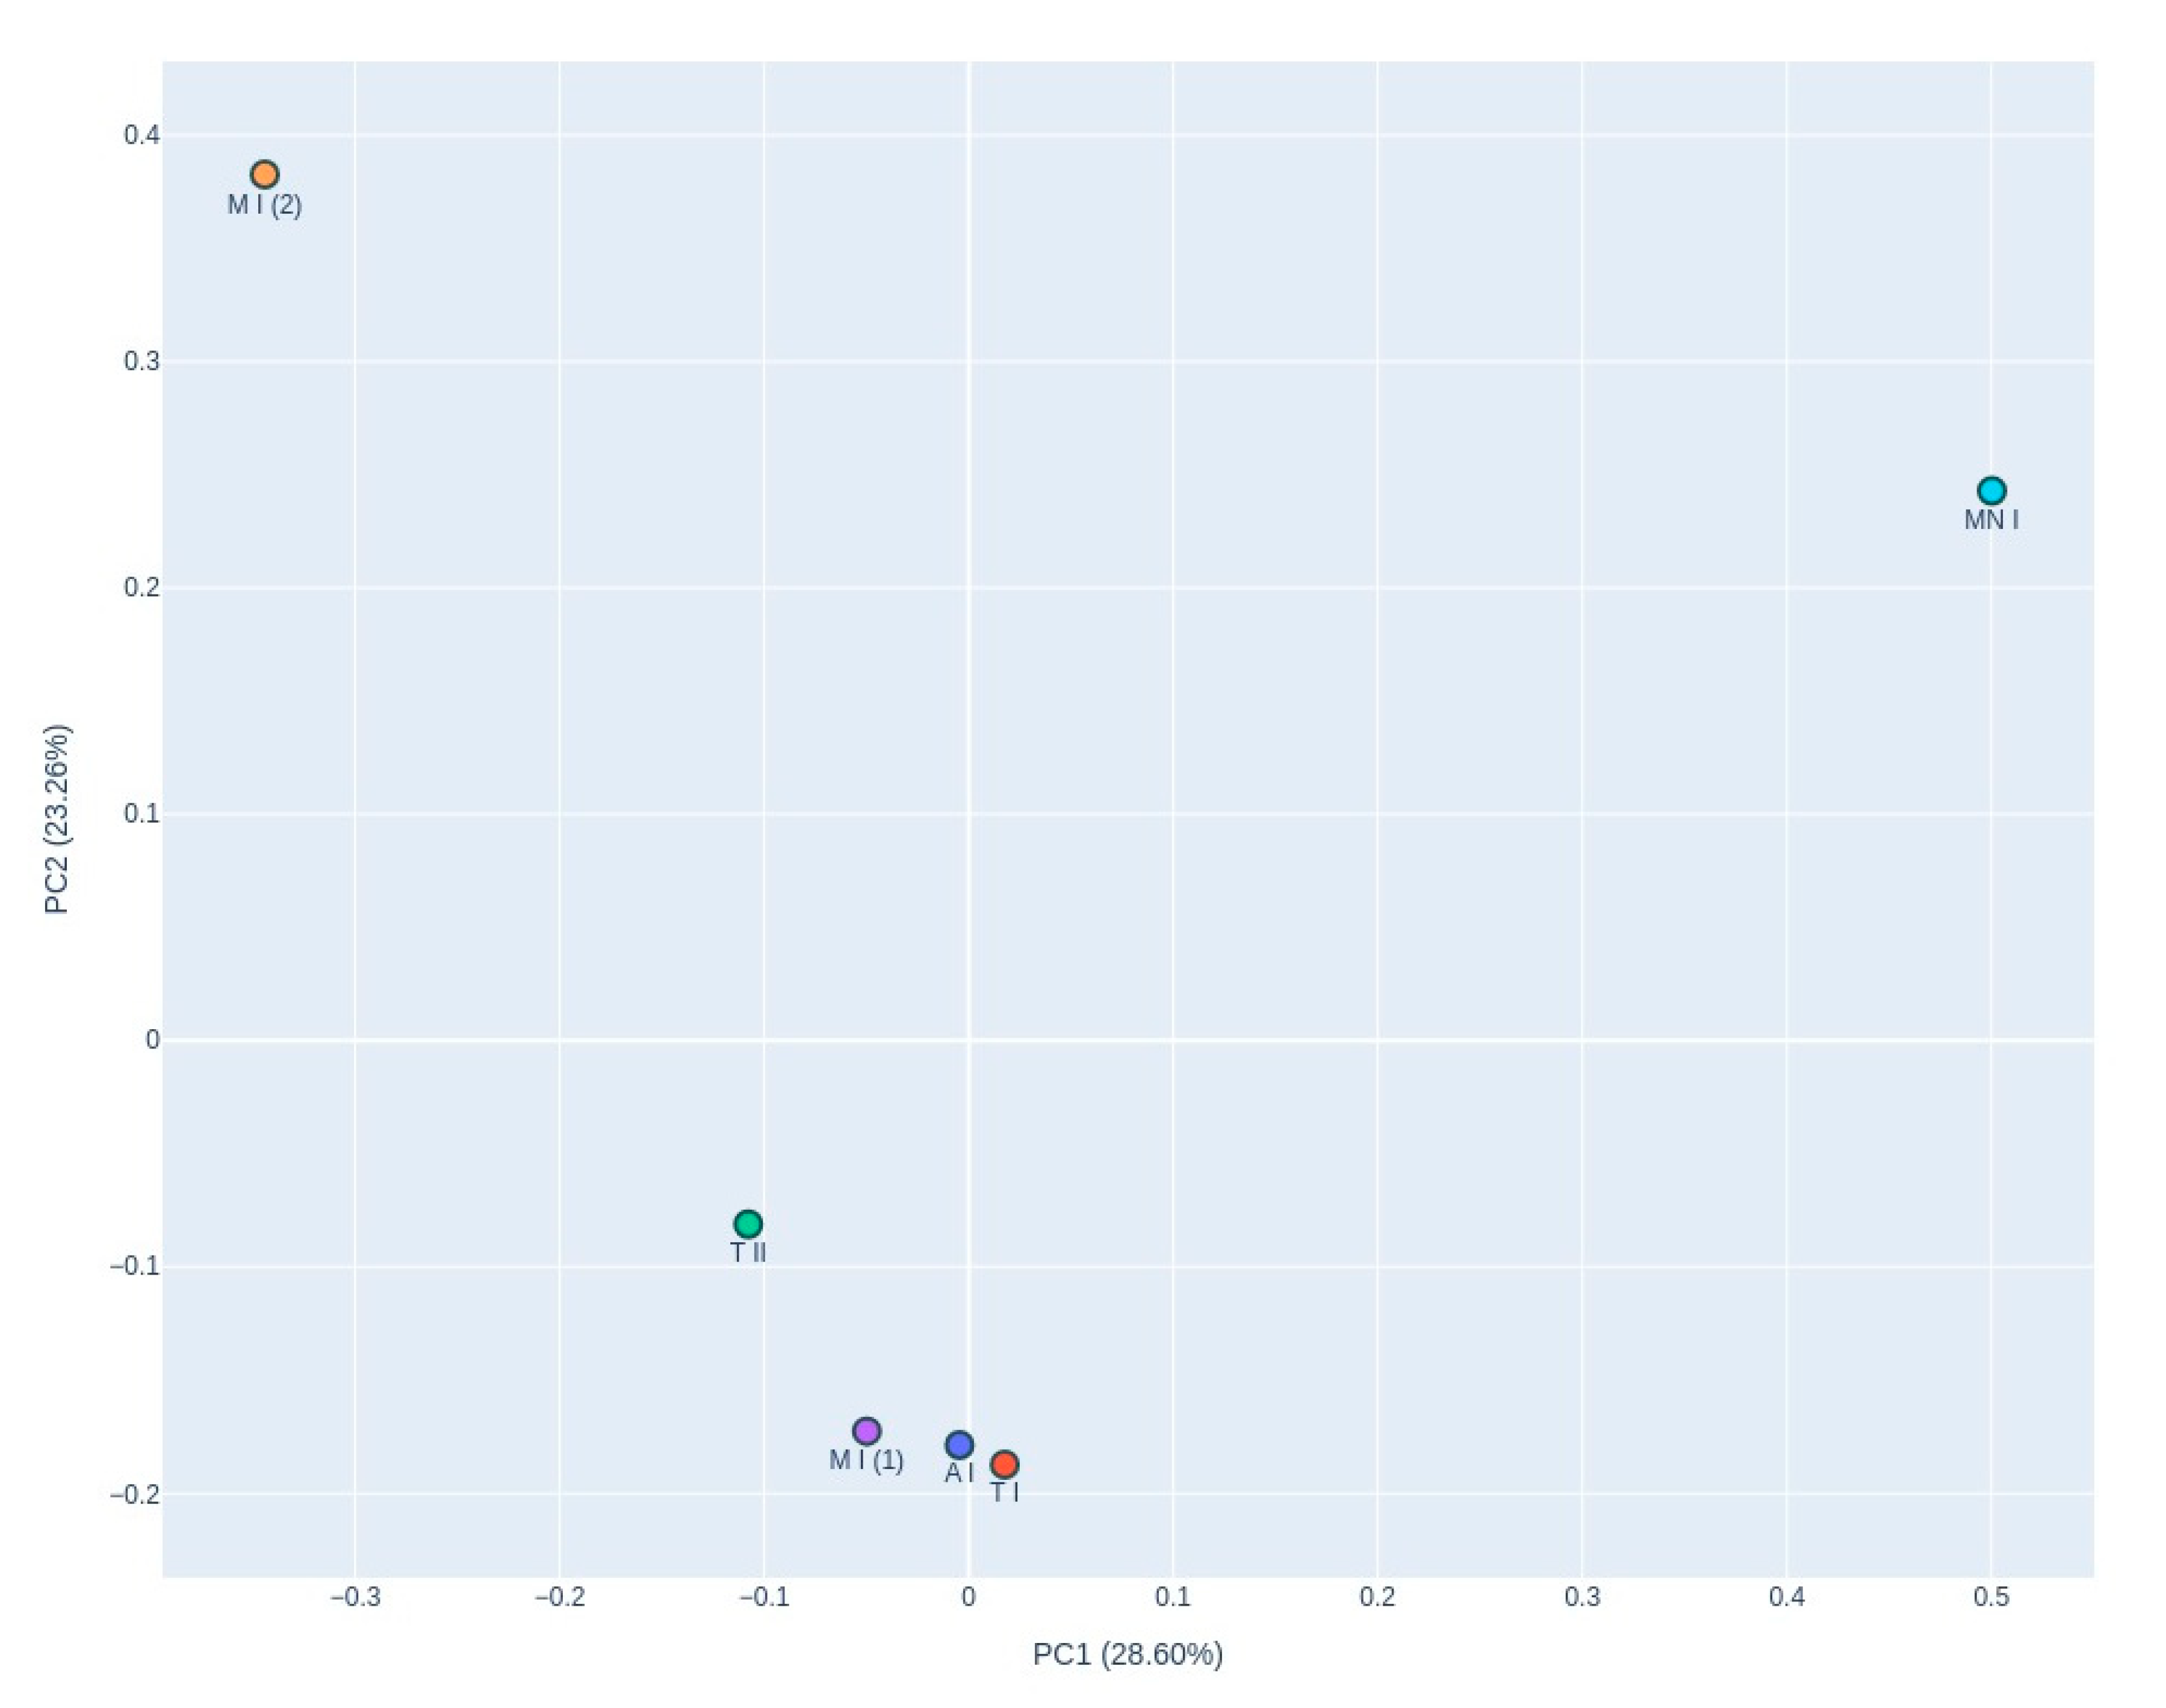
Figure 6.
Clustergram of taxonomic abundance at the genus level, showing the top 15 taxa across sampling sites. The dendrograms represent hierarchical clustering of taxa (rows) and samples (columns) based on Bray-Curtis dissimilarity.
Figure 6.
Clustergram of taxonomic abundance at the genus level, showing the top 15 taxa across sampling sites. The dendrograms represent hierarchical clustering of taxa (rows) and samples (columns) based on Bray-Curtis dissimilarity.
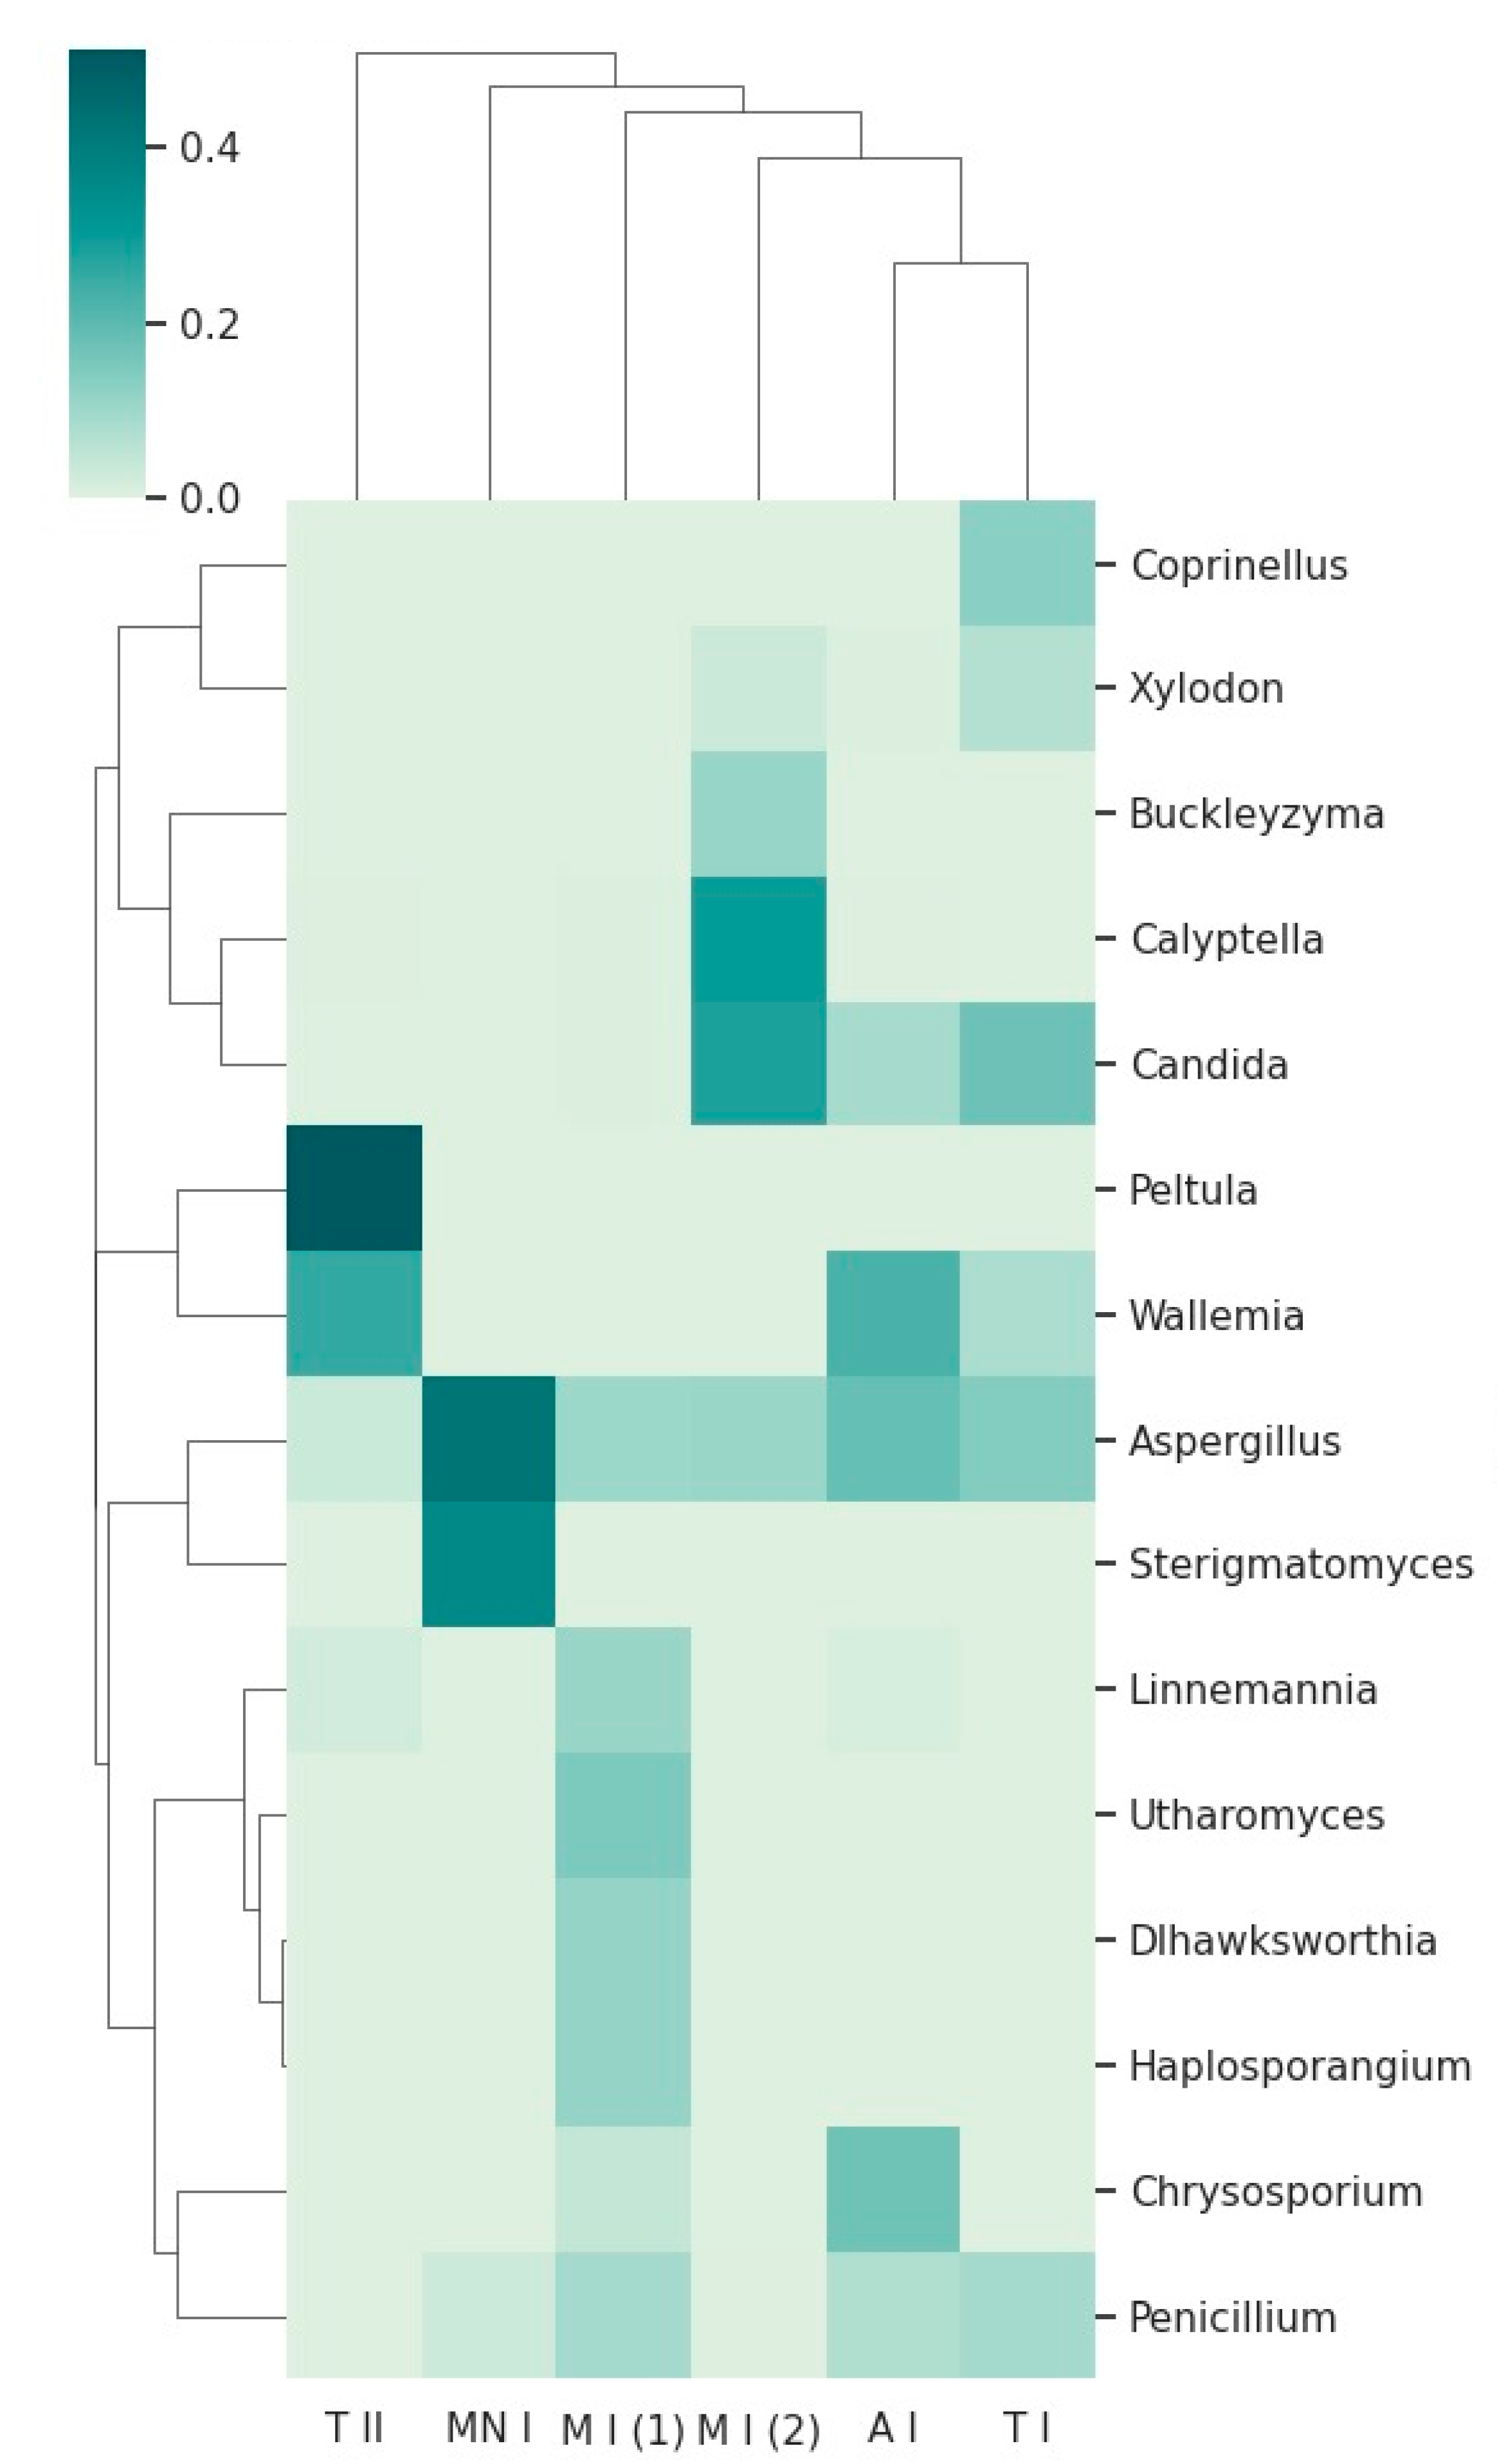
Figure 7.
Stacked bar chart displaying the relative abundance of the top 15 taxa (and 'Other' category) across sampling sites. Each bar represents a sample, with taxa contributions stacked according to their relative abundance. The color-coded segments of each.
Figure 7.
Stacked bar chart displaying the relative abundance of the top 15 taxa (and 'Other' category) across sampling sites. Each bar represents a sample, with taxa contributions stacked according to their relative abundance. The color-coded segments of each.
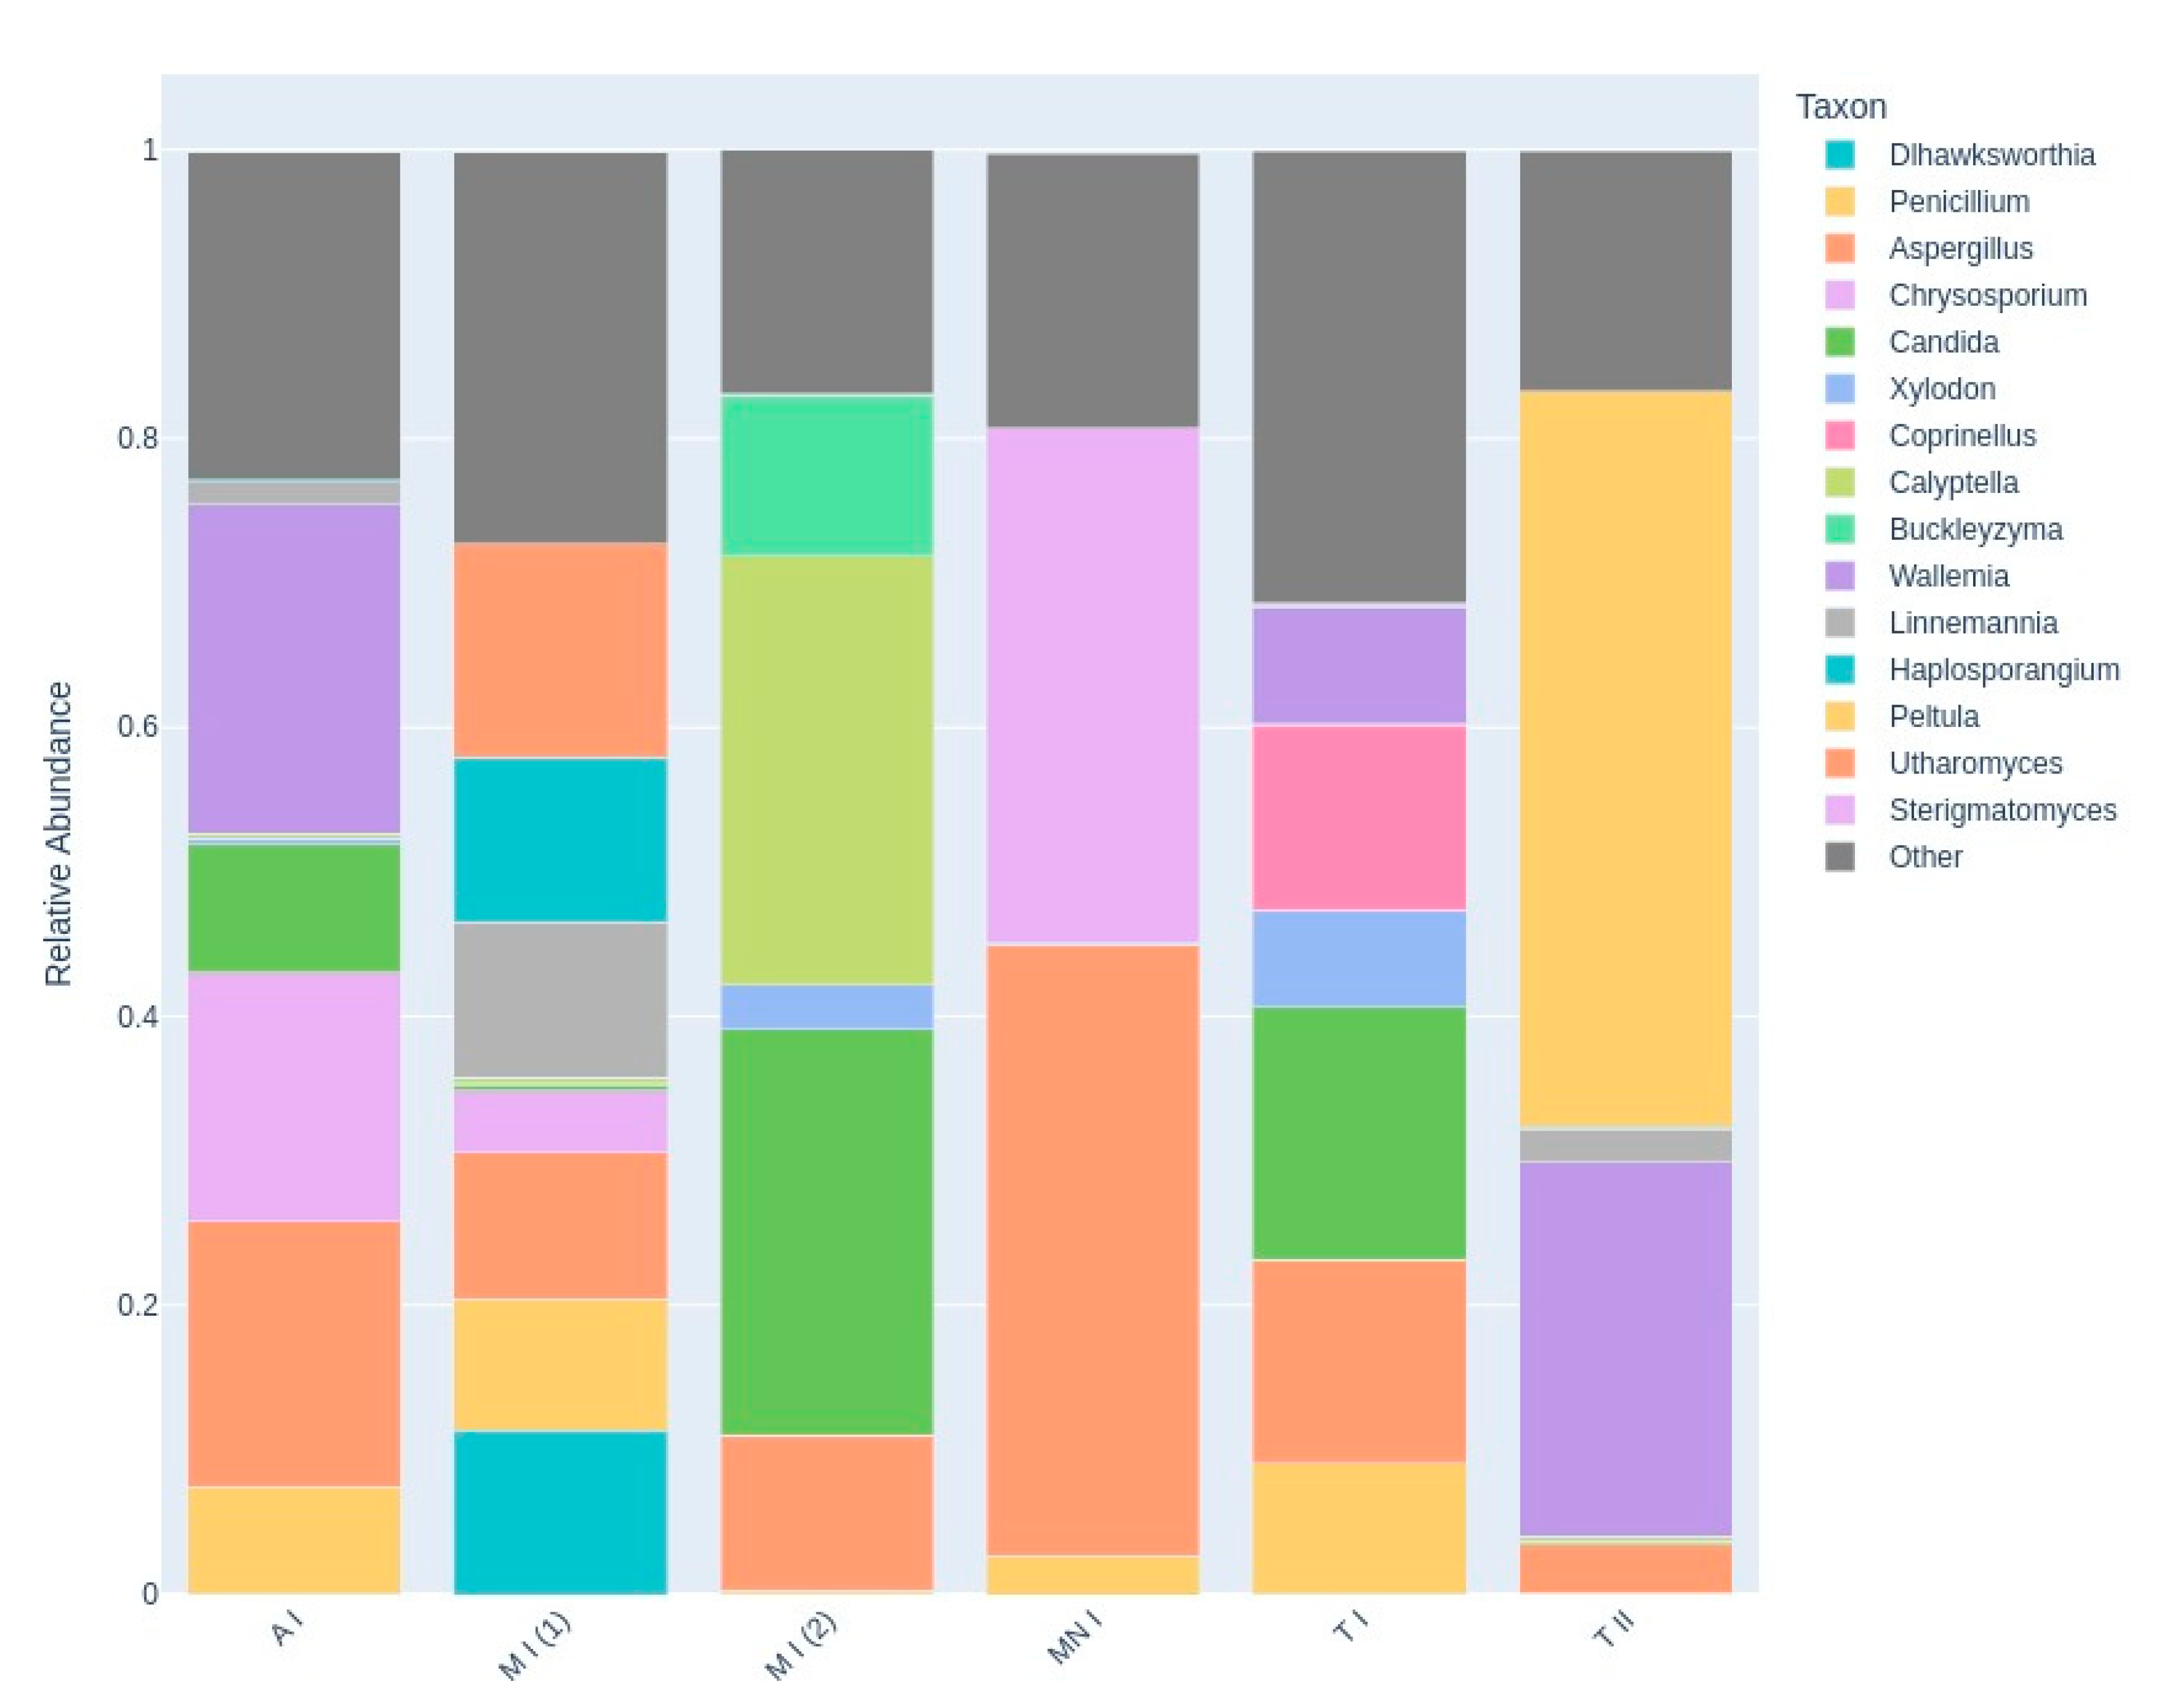
Table 1.
Bat species inhabiting each cavity studied.
| Bat species |
|---|
| Myotis myotis |
| Miniopterus schreibersii |
| Rhinolophus ferrumequinum |
| Rhinolophus mehelyi |
Table 2.
Summary of unique genera and top 3 genera per sample.
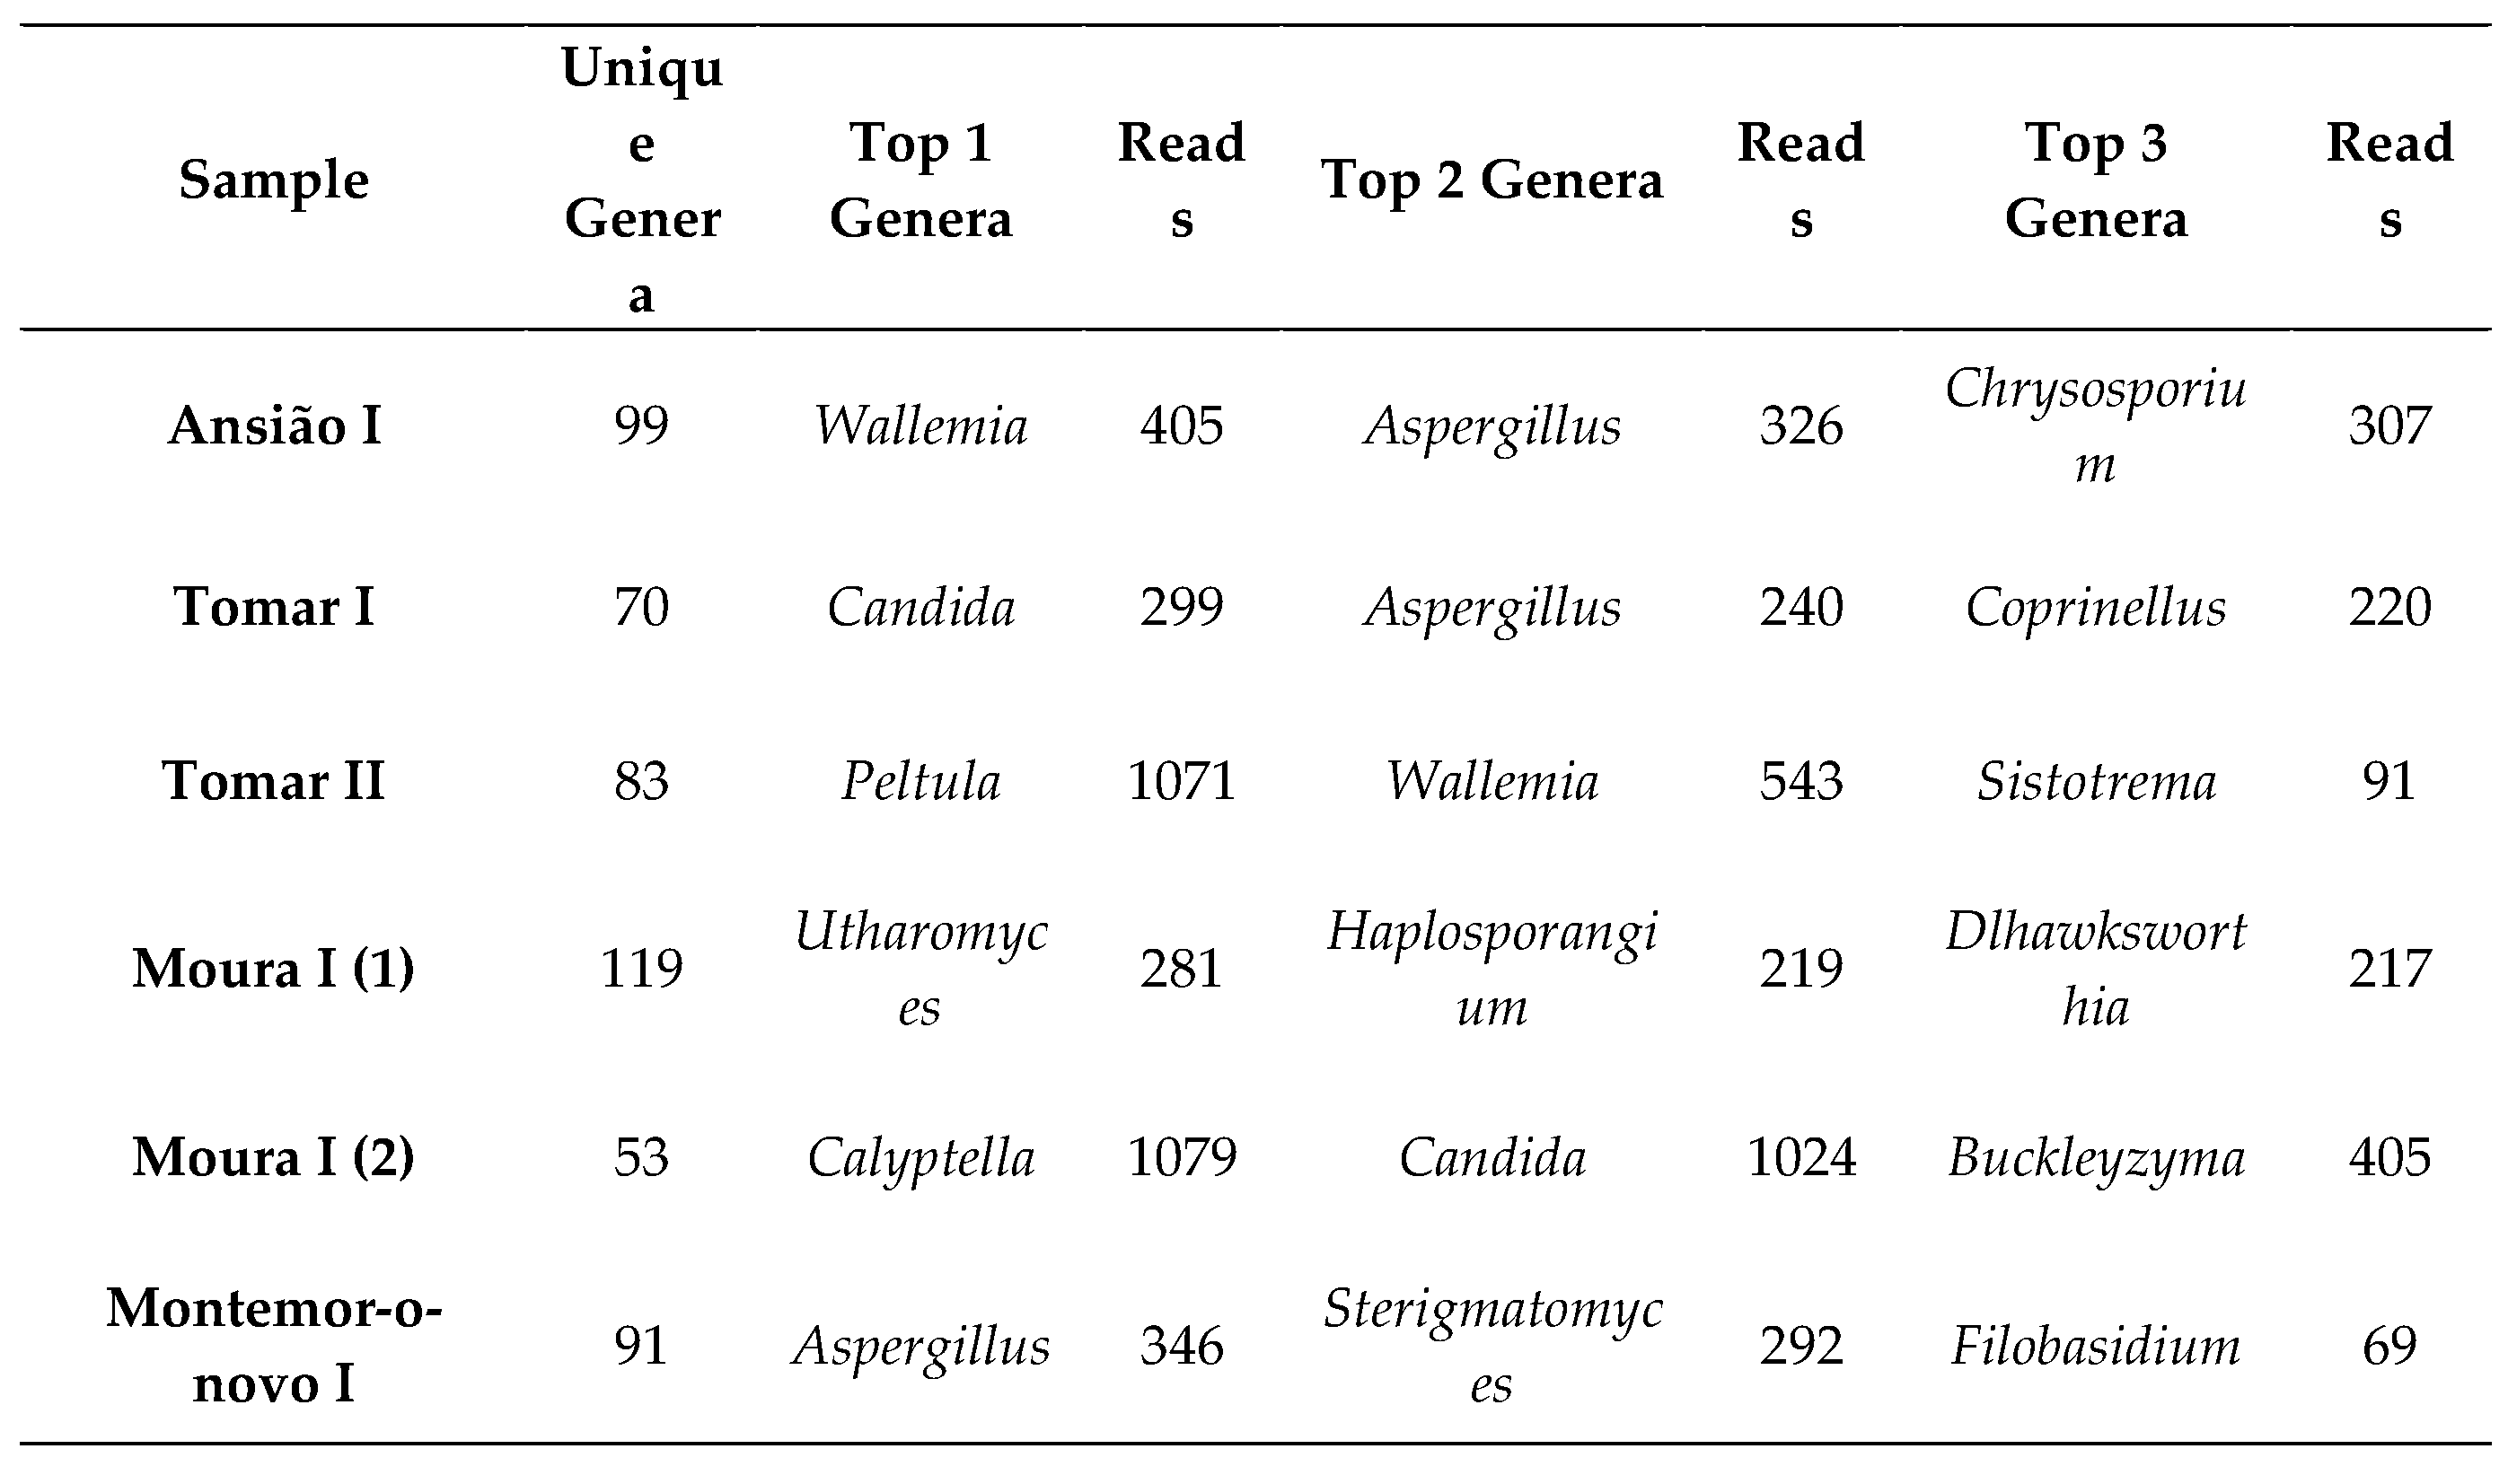 |
Table 3.
Top genera across all samples.
 |
Disclaimer/Publisher’s Note: The statements, opinions and data contained in all publications are solely those of the individual author(s) and contributor(s) and not of MDPI and/or the editor(s). MDPI and/or the editor(s) disclaim responsibility for any injury to people or property resulting from any ideas, methods, instructions or products referred to in the content. |
© 2025 by the authors. Licensee MDPI, Basel, Switzerland. This article is an open access article distributed under the terms and conditions of the Creative Commons Attribution (CC BY) license (http://creativecommons.org/licenses/by/4.0/).
Copyright: This open access article is published under a Creative Commons CC BY 4.0 license, which permit the free download, distribution, and reuse, provided that the author and preprint are cited in any reuse.


