
Submitted:
07 April 2025
Posted:
07 April 2025
You are already at the latest version
Abstract
Recently, worldwide attention toward hydrogen and its derivatives as alternative carbon-free or low-carbon options for the electricity sector, the transport sector, and the industry sector increased. Several projects in the field of low-emissions hydrogen production (particularly electrolysis-based green hydrogen) were either constructed or were analyzed in terms of feasibility. This study aims at summarizing some expectations of the level at which hydrogen and its derivatives can spread into the global economy, under two scenarios. The first scenario corresponds to a business-as-usual (BAU) pathway, where the world proceeds with the same existing policies and targets for emissions and low-carbon energy transition. This forms a lower bound for the level of hydrogen role. The second scenario corresponds to an emissions-conscious pathway, where governments cooperate to implement necessary changes to decarbonize the economy by 2050 with net zero (or even negative) emissions of carbon dioxide; thus, limiting the rise in the global mean surface temperature to 1.5 °C by 2100 compared to pre-industrial periods. This forms an upper bound for the level of hydrogen role.The study utilizes the latest release (edition year 2023, 26th edition) of the annual comprehensive report of IEA (International Energy Agency), which is WEO (World Energy Outlook), as well as the latest release (edition year 2023, 3rd edition) of the annual comprehensive report of IRENA (International Renewable Energy Agency), which is WETO (World Energy Transitions Outlook). For the IEA-WEO report, the business-as-usual scenario is STEPS (Stated “Energy” Policies Scenario), and the emissions-conscious scenario is NZE (Net Zero Emissions by 2050). For the IRENA-WETO report, the business-as-usual scenario is PES (Planned Energy Scenario), and the emissions-conscious scenario is 1.5°C.Through the results presented here, it becomes possible to infer the realistic range of producing and utilizing hydrogen and its derivatives. In addition, the study allows estimating the difference between the models used in WEO and WETO, through identifying different predictions for similar variables. The study covers miscellaneous variables related to energy and emissions other than hydrogen, which are helpful in establishing a good view about how the world may look like in 2030 and 2050. Some barriers (such as the uncompetitive levelized cost of electrolysis-based green hydrogen) and drivers (such as the German H2Global initiative) for the hydrogen economy are also discussed. The study finds that a large-scale utilization of hydrogen or its derivatives as a source of energy is highly uncertain, and it can be reached slowly with more than two decades to mature.
Keywords:
Hydrogen
; IEA
; IRENA
; STEPS
; NZE
; PES
; 1.5°C
; Scenario
; Net Zero Emissions
1. Nomenclature (in Alphabetical Order)
1.5°C (by IRENA) It is a normative forecasting model, showing a possible pathway to limit the global temperature rise to 1.5 °C by 2100 relative to pre-industrial level. It simultaneously implies bringing CO₂ emissions to a nearly net zero (slightly negative) value by 2050. As a reference, the global average rise of the earth’s surface temperature in 2021 reached around 1.2 °C above the pre-industrial level.
Blue hydrogen A type of hydrogen produced though abated fossil-based hydrogen production, where hydrogen is obtained from a fossil fuel (such as by steam-methane reforming “SMR” of natural gas, or by autothermal reforming “ATR” of natural gas), but the process is combined with a form of CCS/CCUS to largely reduce the CO2 emissions to the atmosphere.
BMWK German: Bundesministerium für Wirtschaft und Klimaschutz (English: Federal Ministry for Economic Affairs and Climate Action). In December 2021, it replaced the former BMWi.
BMWi German: Bundesministerium für Wirtschaft und Energie (English: Federal Ministry for Economic Affairs and Energy). In December 2021, it was replaced by BMWK.
CCS Carbon capture and storage (or sequestration)
CCUS Carbon capture, utilization (or usage), and storage
Clean hydrogen A term used by IRENA to refer collectively to: (1) green hydrogen, and (2) blue hydrogen. This is approximately equivalent to “low-emissions hydrogen” or LEH for IEA.
CO2 Carbon dioxide
e-fuel Electricity-based fuel (or electrofuel)
EJ Exajoule (1018 J)
e-SAF Electricity-based sustainable aviation fuel
EU European Union
gCO2 Gram of carbon dioxide
GEC (by IEA) Global Energy and Climate
Green hydrogen A type of hydrogen produced by either (1) electrolysis of water, with the required electricity generated from a renewable energy source, or (2) biomass gasification using renewable energy for powering the process. The electrolysis-based green hydrogen is the dominant type of both categories, and often the term “green hydrogen” refers exclusively to electrolysis-based hydrogen.
Gt CO2 Gigatonne (1012 kg) of carbon dioxide
GW Gigawatt (109 W)
HINT.CO Hydrogen Intermediary Network Company GmbH
HPA Hydrogen purchase agreement
HRS Hydrogen refueling station
HSA Hydrogen sales agreement
IEA International Energy Agency
IRENA International Renewable Energy Agency
kg H2 Kilogram of hydrogen
kWh Kilowatt-hour (3.6 MJ)
L Liter
LCOH Levelized cost of hydrogen
LEA Low-emissions ammonia. It is a low-emissions hydrogen-based liquid fuel (NH3) produced from low-emissions hydrogen (such as electrolysis-based hydrogen with the consumed electricity to produce it comes from low-emissions electricity generation sources).
LEH Low-emissions hydrogen. It is a term used by IEA to refer collectively to: (1) green hydrogen, (2) blue hydrogen, (3) pink hydrogen, and (4) turquoise hydrogen. This is approximately equivalent to “clean hydrogen” according to IRENA terms.
LELs Low-emissions hydrogen-based liquid fuels.
LHV Lower heating value (of a fuel)
Mb/d Million barrels of crude oil (petroleum) per day. 1 barrel has a volume of 42 U.S. gallons (about 159 liters).
Mboe/d Million barrels of oil equivalent per day. If 1 tonne of oil equivalent (toe) has 7.40 boe, and 1 toe has a lower heating value (LHV) of 41,868 MJ, then 1 boe is equivalent to a LHV of 5,658 MJ (1,572 kWh). However, there is no universal value of boe.
MJ Megajoule (106 J)
Mt H2 Million tonnes of hydrogen
NFPA National Fire Protection Association. It is a US-based global nonprofit professional organization, and an internationally-recognized leader in providing fire safety standards.
NZE (by IEA) Net Zero Emissions by 2050. It is a normative forecasting model, predicting the necessary mix of clean energy technologies to reach net zero energy-related CO2 emissions by 2050. NZE corresponds to an increase of 1.5 °C in the average global surface temperature in 2100 (with a 50% probability), with limited overshoot before that.
PEM Proton exchange membrane (also called polymer electrolyte membrane)
PES (by IRENA) Planned Energy Scenario. It is an exploratory forecasting model, predicting the expected developments in the energy system and the dependent emissions based on currently existing governments’ energy plans and targets.
Pink hydrogen A type of hydrogen produced by electrolysis of water, with the needed electric power generated from a nuclear power plant
PtG or P2G Power-to-gas
PtL or P2L Power-to-liquid
PtX or P2X Power-to-X (X is a generic energy carrier)
PWh Petawatt-hour (3.6 EJ)
Renewables Renewable energy sources, including hydroelectric energy, solar energy, wind energy, bioenergy, geothermal energy, and ocean/marine energy (from tides or from waves)
SMR Steam-methane reforming
STEPS (by IEA) Stated (Energy) Policies Scenario. It is an exploratory forecasting model, predicting the expected developments in the energy system and the dependent emissions based on currently existing sector-by-sector energy policies and measures by different countries or geographical regions. STEPS corresponds to an increase of 2.4 °C in the average global surface temperature in 2100 (with a 50% probability).
TFC/TFEC Total final energy consumption. IEA uses the abbreviation “TFC”, while IRENA uses the abbreviation “TFEC”. It is the sum of consumption by the end-use sector, for example by the industry sector (such as manufacturing, mining, chemicals production, blast furnaces), and by the transport sector.
Turquoise hydrogen A type of hydrogen produced through a pyrolysis process (called methane pyrolysis, methane splitting, or methane cracking), when the gaseous methane (or natural gas) is heated electrically such that it is broken down into gaseous hydrogen and solid carbon. The process does not release carbon dioxide emissions (like green hydrogen), but it is based on a fossil fuel (like blue hydrogen).
TW Terawatt (1,000 GW)
WEO (by IEA) World Energy Outlook
WETO (by IRENA) World Energy Transitions Outlook
yr Year
2. Introduction
2.1. Background
Due to anthropogenic greenhouse gas (GHG) emissions, particularly carbon dioxide (CO2), the global average surface temperature (both land and sea) of the earth increased; and this rise reached about 1.2 °C in 2020 compared to 1850 as a baseline for the pre-industrial periods (Marzouk, 2021; Matthews and Wynes, 2022; Meinshausen et al., 2022; Marzouk, 2022). In relation to this, the global average atmospheric CO2 concentration in 2020 reached 415 ppm (parts per million), compared to its pre-industrial level of 285 ppm, around 1850 (Chen, 2021). When the average temperature increases by an amount, the local temperature (especially on the land rather than the sea) may actually increase by a multiple of that amount. Thus, the relatively small amount of the average surface temperature rise can be misleading in terms of describing the size of the global warming problem (NASA, 2024; IPCC, 2024), which extends to the broader problem of climate change through altered pattern of other climate variables besides the temperature (Vitousek, 1994). In order to properly combat CO2 emissions that cause global warming, it is important to understand the dependence of these CO2 emissions on their source activities, such as electricity generation and industrial processes.
The International Energy Agency (IEA) adopts the Global Energy and Climate (GEC) model as a large-scale simulation tool to replicate how energy markets function and to generate detailed long-term scenarios for the global energy system as well as the dependent emissions. The IEA’s GEC model replaced in 2021 a couple of older models that used to be implemented in parallel to each other, which are the IEA’s World Energy Model (WEM), and the IEA’s Energy Technology Perspectives (ETP) model (IEA, 2023a). The specific energy-emissions scenarios (or pathways) covered by GEC include (1) the Stated Policies Scenario, or Stated Energy Policies Scenario (STEPS) and (2) the Net Zero Emissions by 2050 Scenario (NZE). STEPS predicts the direction of energy system progression assuming that the current policies remain in action and no additional mitigating changes are seriously taken to curb the climate change through limiting energy-based and process-based emissions (IEA, 2023b). Such type of forecasting that has a clear starting point and a clear assumption that guides the progression path but does not aim to reach a specific target is described as "exploratory". On the other hand, NZE shows a predicted set of changes for the global energy sector that enable reaching the global target of net zero CO2 emissions by 2050. Additionally, NZE is consistent with limiting the global average temperature rise to 1.5 °C, with at least a 50% probability (IEA, 2023c). Such type of forecasting that has a clear starting point and a clear end point (target), while it predicts a path to reach that target is described as "normative". The World Energy Outlook (WEO) is an annual public report published by IEA, where modeling is used to provide in-depth analysis for different aspects of the global energy system. Although an edition of WEO was published in 1977, it became a regular annual publication in 1998 (IEA, 2023d; FAO, 2023). Thus, the 1st edition is considered here to be the first one in the series form, which is the 1998 edition. The 2023 edition of IEA’s WEO is the 26th edition (released in October 2023). It is the latest edition at the time of preparing the current study (IEA, 2023e).
The International Renewable Energy Agency (IRENA) started an annual report series in 2021, which is titled World Energy Transitions Outlook (WETO). Thus, WETO-2021 was the 1st edition, while WETO-2023 is the 3rd edition. It is the latest edition at the time of preparing the current study (IRENA, 2023). In its 3rd edition, the WETO publication has been divided into two volumes, with volume 1 focusing on the progress across all energy sectors, and suggests (based on available technologies) a set of actions that need to be implemented by 2030 in order to limit the global average temperature rise to 1.5 °C by 2100 relative to pre-industrial levels, through achieving net zero emissions by 2050. Volume 2 of WETO-2023 is based on econometric modeling by IRENA, and it focuses on socio-economic impacts of the proposed 1.5°C pathway by IRENA, compared to current policy settings, which is referred to as Planned Energy Scenario (PES) by IRENA. Thus, volume 1 of WETO-2023 aims at addressing the technological and regulatory aspects of the energy transition, while volume 2 of WETO-2023 gives attention to the socio-economic implications of such energy transition (like its effect on employment and on welfare). In the present study, only volume 1 is covered, because volume 2 is outside the scope of the present study. It might be useful to add that WETO-2021, WETO-2022, and WETO-2023 (volume 1 only) were made available in an interactive online version in addition to the offline version (in the form of a PDF document). WETO-2021 was released in June 2021, WETO-2022 was released in March 2022, volume 1 of WETO-2023 was released in June 2023, and volume 2 of WETO-2023 was released in November 2023.
While hydrogen and its derived synthetic fuels (or e-fuels, electrofuels) do not currently represent a significant part of the energy market, efforts have been made toward more exploitation of these emerging energy carriers, particularly for environmental reasons, and thus to establish a large-scale hydrogen economy with alternatives to conventional fossil fuels (Tseng et al., 2005; Bockris, 2013; Oliveira et al., 2021; Squadrito et al., 2023; Marzouk, 2023a; Fajín and Cordeiro, 2024; Garlet et al., 2024).
Hydrogen can be produced in a clean way that releases no or little emissions. Electrolysis-based green hydrogen requires electricity to power water electrolyzers that split water into molecular hydrogen and molecular oxygen. The electricity should be from a renewable energy source, such as solar energy or wind energy, in order for the produced hydrogen to be described as green (Kakoulaki et al., 2021; Marzouk, 2022a; Schrotenboer et al., 2022). Furthermore, derived products from green hydrogen can be also described as green (or electricity-based), such as green ammonia (or e-ammonia), green methanol (or e-methanol), and green kerosene (or e-kerosene), which may also be called e-SAF: electricity-based sustainable aviation fuel (Salmon and Bañares-Alcántara, 2021; Schmidt et al., 2023). Blue hydrogen is produced from a fossil fuel, but with reduced CO2 emissions through a carbon capture technology. Environmentally, electrolysis-based green hydrogen is a preferable option than blue hydrogen, where a complete elimination of indirect CO2 emissions is not possible, because the extraction of the feedstock fossil fuels itself is a source of CO2 emissions (Longden et al., 2022). On the other hand, green hydrogen is more expensive than blue hydrogen, although this may be reversed if green hydrogen electrolyzers and renewable energy costs sufficiently drop in the future (Newborough and Cooley, 2021; Yu et al., 2021).
Applications of hydrogen and its derived products include electricity generation via fuel cells (Crespi et al., 2021), electricity generation via gas turbines (Pilavachi et al., 2009), fuel cell electric vehicles – FCEVs (Marzouk, 2023b), fuel cell electric unmanned aerial vehicles – UAVs (Çalışır et al., 2023), iron industry through direct reduction iron – DRI (Cavaliere et al., 2024), oil refining (Moradpoor et al., 2023), ammonia (NH3) production via the power-to-liquid (PtL) concept (Bahnamiri et al., 2022; Pagani et al., 2024), alternative synthetic non-fossil fuels derived from electrolysis-based green hydrogen (via PtL, PtG, PtX) like e-methane or e-kerosene (Ueckerdt et al., 2021; Yilmaz et al., 2022; Atsonios et al., 2023; Nemmour et al., 2023), and electricity storage by combining electrolyzers for hydrogen production and fuel cells for subsequent electricity production at the time of demand (Boretti, 2024).
The combustion of hydrogen (or its dissociation followed by oxidation in PEM fuel cells) does not release any carbon dioxide, which is an environmental advantage over any carbonaceous fuel (Zhou et al., 2006; Marzouk, 2023c). The replacement of fossil fuels with hydrogen (like replacing natural gas with gaseous hydrogen for heating homes and for cooking, or replacing gasoline/petrol with hydrogen for cars) helps in mitigating direct CO2 emissions, which in turn helps in stopping global warming and supports sustainability (Fernández et al., 2018; Field and Derwent, 2021; Marzouk, 2023d). Such decarbonization (even partial) of the energy or buildings sector improves the outdoor environment quality, and consequently the indoor environment quality (Lee and Chang, 2000; Cheng et al., 2019; Mundackal and Ngole-Jeme, 2022; Marzouk, 2022b).
Despite the apparently attractive shift toward hydrogen and its derivatives (in the electricity sector, the transport sector, the industry sector, and the buildings sector), expansion in the utilization of hydrogen and its derivatives is hampered by some barriers that need to be addressed before the investment in hydrogen and its products can be accelerated globally (Rand and Dell, 2007; Ball and Wietschel, 2009; Mazloomi and Gomes, 2012; Yue et al., 2021; Ishaq et al., 2022).
One of the barriers for large-scale hydrogen economy is the relative high cost per unit energy of hydrogen compared to other conventional energy sources. Based on the lower heating value (LHV), 1 kg of hydrogen has 120 MJ or 33.3 kWh (Chiesa et al., 2005). On the other hand, gasoline (petrol) has a volumetric LHV of 32.4 MJ/L or 9.00 kWh/L (Dupuis et al., 2019) and a gravimetric LHV of 43.0 MJ/kg or 11.9 kWh/kg (Amaral et al., 2021). Thus, for energy equivalence, 1 kg of hydrogen (1 kg H2) can replace 2.79 kg of gasoline or 3.70 L or approximately 1 U.S. gallon (Bothast and Schlicher, 2005). Based on recent data, the price of 1 U.S. gallon of regular gasoline in the USA is nearly US$ 3.1 (EIA, 2024). Thus, 1 kg H2 should be sold at this rate in order to be both economically and thermally equivalent to gasoline. In the Sultanate of Oman, the recent price of gasoline is nearly 0.23 OMR/L (NSS, 2024). Thus, 1 kg H2 should be sold at a price of OMR 0.85 (less than 1 Omani rial) in order to be both economically and thermally equivalent to gasoline. The levelized cost of hydrogen (LCOH) largely depends on the country, the hydrogen production technology, and the hydrogen production capacity (Khouya, 2020; Minutillo et al., 2021). However, recent studies suggest that for electrolysis-based green hydrogen, LCOH can be in the range of 1.35-7.7 USD globally (Abdin, 2022; BloombergNEF, 2020), 16.4-51.8 RMB (or 2.3-7.3 USD assuming a rate of 7.10 RMB/USD) in China (Fan et al., 2022; XE, 2024a), 2.17 OMR (or 5.63 USD assuming a rate of 2.60 USD/OMR) in Oman (Marzouk, 2023e), and €1.0 (or 1.1 USD assuming a rate of 1.1 USD/EUR) in Atacama Desert, Chile or €2.7 (or 3.0 USD assuming a rate of 1.1 USD/EUR) in Helsinki, Finland (Vartiainen et al., 2022; XE, 2024b). It is expected that the production cost of hydrogen falls down in the future, due to the increase in the electrolyzers manufacturing scale, the maturity of electrolyzers supply chains, and the decline in the cost of renewable electricity for powering electrolyzers (Hydrogen Council, 2020; Janssen et al., 2022; Hydrogen Council, 2023). However, the listed costs do not suggest that hydrogen is globally competitive compared to conventional alternatives, but also the gap is not dramatic. Green hydrogen is more expensive than blue hydrogen (about twice or trice the cost), which is partly due to the cost of the renewable electricity required for powering the electrolyzers, and partly due to the cost of electrolysis system that consists of the electrolyzers and their auxiliary components, such as cooling units (IRENA, 2020).
A second barrier for the hydrogen economy is the water consumption needed for hydrogen production regardless of the technology; such as for supplying electrolysis water, for supplying steam in the steam reforming process, for supplying liquid coolant water, or for the auxiliary carbon capture, utilization, and storage (CCUS) process. For example, PEM-based electrolysis may consume 17.5 L of water, and require about 8.2 L of additional recirculating water for producing 1 kg H2. Alkaline-based electrolysis may consume 22.3 L of water, and require about 9.9 L of additional recirculating water for producing 1 kg H2. Natural gas steam-methane reforming (SMR) combined with CCUS may consume 32.2 L of water, and require about 4.5 L of additional recirculating water for producing 1 kg H2. Without CCUS, the water requirements for SMR of natural gas may drop from 32.2 L to 17.5 L (consumption) and from about 4.5 L to about 2.5 L (reuse). Coal gasification with CCUS may consume 49.4 L of water, and require about 30.8 L of additional recirculating water for producing 1 kg H2. Without CCUS, the water requirements for coal gasification drop from 49.4 L to 31.0 L (consumption) and from about 30.8 L to about 18.8 L (reuse) (IRENA and Bluerisk, 2023). This matter can be specifically important for countries with limited access to renewable potable water. Despite this apparent concern, a recent study (Beswick et al., 2021) showed that if only electrolysis-based green hydrogen is produced (no blue hydrogen, thus no CCS/CCUS), then globally there should be no water problem even if the global production of hydrogen reaches 2,300 Mt H2/yr, with negligible amount of water consumed relative to the amount of water available. It should be noted that this mentioned study assumed that 1 kg H2 requires only 9 kg of water (consumption). This is just the theoretical demand based on stoichiometric (perfect) splitting of water, with zero water loss and with zero additional water needs for auxiliary processes. Therefore, this mentioned study assumed that the global water demand for hydrogen production does not exceed about 20,500 Mt of freshwater (or 20.5 billion m3 of freshwater) per year.
A third barrier that hinders the rapid growth of the hydrogen economy is the lack of adequate governmental regulatory framework for low-emissions hydrogen and its derivatives (as relatively new commodities). This barrier is related to licensing and coordination with local authorities for hydrogen production projects and related infrastructure, such as hydrogen pipelines and hydrogen storage facilities. This barrier is also concerned about establishing internationally recognized standards for the export/import of hydrogen and its derivatives, certification of hydrogen grade with clearly defining what low-emissions hydrogen (or clean hydrogen or sustainable hydrogen) is, and international trade of not only hydrogen and its derivatives but also electrolyzers and equipment for electricity generation using renewable energy (dena and WEC, 2022; IEA, 2023f; IRENA and WTO, 2023).
There are minor issues that affect hydrogen economy growth, such as the safety concerns regarding the handling of hydrogen (Galassi et al., 2012; Abohamzeh et al., 2021). Hydrogen is a flammable gas that has the most hazardous flammability level (level 4) in the National Fire Protection Association (NFPA) 704 diamond classification. This level indicates a substance that burns readily at atmospheric pressure and normal ambient temperature (NOAA, 2024). Another issue is building sufficient competence and specialized skills to ensure qualified personnel are available to work in the various stages of the hydrogen supply chain, from the production to the end-use (Beasy et al., 2023; Sandri et al., 2024). Increasing the public awareness and acceptance of the transition to hydrogen and its derivatives is a third issue, where people behavior should adapt to the alternatives provided by hydrogen and its derivatives. This include, for example, the use of a hydrogen refueling station (HRS) instead of a traditional gas station (petrol station), and the willingness to choose a fuel cell electric vehicle rather than a conventional gasoline vehicle (Ricci et al., 2008; Gordon et al., 2002).
Despite the mentioned barriers, there are also drivers that encourage the development of a hydrogen economy. Such hydrogen economy drivers include formal or voluntary aims to adopt environmentally-friendly solutions and emissions mitigation, and local (national) incentives or subsidies (Dolci et al., 2019; Bartlett and Krupnick, 2020). The H2Global Foundation (H2Global Stiftung in German) is an international incentivizing scheme for accelerating a global hydrogen market. Through the H2Global funding instruments, large green electrolysis-based green hydrogen production projects outside the European Union (EU) can apply for a 10-year fixed-price hydrogen purchase agreement (HPA) where they guarantee they can market their production of green hydrogen-derived product to the German government-backed off-taker company HINT.CO (Hydrogen Intermediary Network Company GmbH), which is a subsidiary of the German non-profit project H2Global Foundation. HINT.CO acts as an intermediary, by purchasing hydrogen-derived products (lot 1: green ammonia, lot 2: green methanol, lot 3: green kerosene or electricity-based sustainable aviation fuel – e-SAF) from a supplier outside EU through auction-based HPAs, and then selling that green hydrogen product in Germany or another EU country through auction-based hydrogen sales agreements (HSAs), whose duration is limited to a maximum of 1 year. The H2Global Foundation was established in June 2021. It was financially supported by the Federal Ministry for Economic Affairs and Energy in Germany (BMWi: Bundesministerium für Wirtschaft und Energie), which in December 2021 became the Federal Ministry for Economic Affairs and Climate Action (BMWK: Bundesministerium für Wirtschaft und Klimaschutz). The German ministry provides the necessary financial aid to cover any gap between the selling price of the green hydrogen product (in EU) and the production cost of it (outside EU). The initial governmental funding grant in 2021 was €900 million (BMWK, 2022a; BMWK, 2022b). In the first HPA tender (started 30 November 2022), only green ammonia (lot 1) was demanded, and the 10 contract years were 2024-2033 (TED, 2022).
2.2. Aims and Contributions of the Study
The primary aim of the current study is to describe the expected size of the hydrogen role in the future, within the energy economy in general and in specific sectors such as the transport sector. This helps in answering questions like:
- Can clean hydrogen and its derivatives totally replace conventional fuels?
- What level of hydrogen production (and demand) is needed to reach net zero CO2 emissions?
- If the governments do not take additional emissions mitigation actions, does hydrogen still have a chance of being appreciably utilized?
- What is the expected share of hydrogen and its derived e-fuels in the total final energy consumption (TFEC)?
- Is electrolysis-based green hydrogen expected to dominate hydrogen production?
- Is low-emissions hydrogen expected to be mostly consumed regionally (within the same region) or mostly traded (exported/imported) from one region to another?
- What is the expected annual production of low-emissions hydrogen in 2030 and 2050?
- What is the expected electrolyzers electric capacity for producing green hydrogen in 2030 and 2050, for reaching net zero CO2 emissions?
- Are hydrogen and its derivatives more suitable to one sector compared to another?
The second aim of the current study is to assess the gap between the future predictions of the energy models by IEA and IRENA, when similar sets of assumption are implied. This helps in answering questions like:
- Is IEA-STEPS scenario identical to IRENA-PES scenario?
- Is IEA-NZE scenario identical to IRENA-1.5°C scenario?
The third and final aim of the current study is to present miscellaneous forecasting data related to various variables in the global energy system, as well as the CO2 emission, in 2030 or 2050. This helps in answering questions like:
- What is the expected annual electricity generation in 20230 and 20250?
- What is the expected electricity capacity in 20230 and 20250?
- What is the expected share of renewable energy in the total electricity generation in 2030 and 2050?
- What is the expected annual CO2 emissions in 2030 and 2050 if the status quo of mitigation actions is maintained?
The above stated aims are also viewed as the contributions made by the current to the broad fields of hydrogen energy, energy transition, and emissions forecasting.
3. Research Method
The current study relies on analysis of existing data. However, as a result of the data processing, novel sets of results are derived from the collected raw data through careful data curation, data inspection and validation, deriving new data through mathematical processes, extracting data from published charts by digitizing them, and preparing customized tables and charts that particularly fit the aims of the study. In addition, many resources in the literature were used for auxiliary purposes, such as for discussing barriers and drivers with regard to clean or low-emissions hydrogen advancement.
Although the raw data come exclusively from two sources (IEA’s WEO-2023 report, and IRENA’s WETO-2023 report), this should not be considered as a drawback. It is actually aligned with the scope of the study; whose second aim is to identify the gap of the two sources when describing a similar quantity. In addition, either annual report is considered a comprehensive flagship publication issued by a reputable expert organization. This reduces concerns about the reliability of the raw data. In addition, having many sources of raw data may raise a problem of disparity and mismatch of terminology. In fact, this matter was already faced here with even two sources. For example, the use of “low-emissions hydrogen” (by IEA) versus the use of “clean hydrogen” (by IRENA). Finally, the use of raw data issued by international organizations (rather than local research groups) enabled access to global data not focusing on a particular country or region. All the data presented in the coming parts are thus global, which is considered a favored feature in the current study.
4. Results (Parts 1 of 4): Non-Hydrogen Common Quantities in IEA and IRENA
In this part, some data that appear commonly in IEA and IRENA reports are presented together. This facilitates the identification of any difference in the reported predictions. There are four quantities covered in this part, which are: (1) global carbon dioxide emissions, (2) global electric energy generation, (3) global electric power generation capacity, and (4) global total final energy consumption.
4.1. CO2 Emissions
Carbon dioxide (CO2) emissions form an important variable to consider in global energy scenarios. Although such emissions by themselves are not among traditional energy sources, they depend on the energy production and consumption. Also, global CO2 emissions can be used to set a target for an energy scenario (as in the case of NZE). Thus, it is reasonable to start the results sections in the current study by this important environmental indicator.
Figure 1 and Figure 2 show historical (past) records for the global CO2 emissions, as well as predicted values in 2030 and 2050, under the four covered scenarios (STEPS, NZE, PES, and 1.5°C). The first observation to make here is that the 1.5°C scenario does not reach exactly 0 Gt CO2 in 2050, but a slightly a negative value of -0.2 Gt CO2. The second observation is that the STEPS scenario predicts less CO2 emissions than PES for either 2030 and 2050. In particular, in 2030, STEPS predicts a decline in CO2 emissions compared to PES, whereas PES predicts the opposite situation. Thus, it can be stated that IEA-STEPS is more optimistic than IRENA-PES with regard to CO2 emissions. On the other hand, IRENA-1.5°C is more optimistic than IEA-NZE with regard to CO2 emissions, with the 1.5°C scenario predicting less CO2 emissions than NZE for both years of 2030 and 2050.
4.2. Electricity Generation
The total amount of electricity generation is also an important element in the energy system. More electricity generation implies electrification of processes that were relying on fossil fuels. It also implies more exploitation of renewable energy resources, which are commonly exploited in the form of electricity.
Figure 3 and Figure 4 show the trends of global total electricity generation as predicted by the four covered scenarios. The gap between the IEA's scenarios (STEPS and NZE) in 2050 is larger than its counterpart for the IEA's scenarios (PES and 1.5°C). The reason is that STEPS overestimates the electricity generation compared to PES, while NZE underestimates it compared to 1.5°C. Despite this, both NZE and 1.5°C scenarios expected an accelerated rate of electricity generation between 2030 and 2050 compared to the period before 2030. According to either NZE or 1.5°C, the world electricity generation in 2050 is expected to be more than twice its value in 2030. On the other hand, the STEPS and PES scenarios expect a nearly fixed rate of growth in electricity generation from now till 2050, with the annual electricity generation in 2050 is about 1.5 times its 2030 value. According to IRENA, the annual global total electricity generation in 2020 was 26.991 PWh, which is compatible with the reported IEA’s value of 28.346 PWh for the following year of 2021 (then increased to 29.033 PWh in 2022).
4.3. Electricity Capacity
Related to the electricity generation (as energy), the electricity capacity (as power) is also an indication of the size of the electricity sector.
Figure 5 and Figure 6 show the global electricity capacity expectation till 2050 based on the four covered scenarios. In 2030 and 2050, NZE and 1.5°C predict similar values near 15 TW and 36 TW, respectively (36.956 TW for NZE, and 35.339 TW for 1.5°C). However, PES underestimates the electricity capacity compared to STEPS for both 2030 (by 19% of the STEPS value of 14.462 TW) and 2050 (by 24% of the STEPS value of 25.956 TW).
4.4. Total Final Energy Consumption
Figure 7 shows the expected growth in the global total final energy consumption (TFEC) till 2050 based on the two covered IEA scenarios. IRENA-WETO has only predictions in 2050 for the 1.5°C scenario, as well as the historical value of 2020, which are visualized in Figure 8 (but no information for the PES scenario or for 2030). The 1.5°C predicted annual value is 353 EJ in 2050, compared to a higher value of 374 EJ in 2020. This is larger than (but close to) the NZE value of 343 EJ in 2050 (compared to the higher value IEA value of 442 EJ in 2022), and it is much lower than the 2050 STEPS value of 536 EJ. Although the predicted decline in TFEC from now till 2050 is not huge, it actually reflects a big boost in energy efficiency and better use of the total primary energy supply (TPES) from natural resources, because the consumption declines despite the anticipated population growth and the extended urbanization level.
IRENA also gives additional details about the share of four energy carriers in that TFEC. In 2020, clean hydrogen and its derived fuels had practically no contribution to TFEC. However, their share is expected to be 14% in 2050. Simultaneously, the share of fossil fuels in TFEC is expected to shrink from 63% in 2020 to 12% (but not totally eliminated) in 2050. IRENA-WETO explains the presence of fossil fuels use in 2050 by clarifying that these are (1) natural gas, which is expected to remain in use mainly within the industry sector and the transport sector; (2) crude oil, whose derived products are expected to be mainly in use within the industry sector and the transport sector; and (3) coal, which is expected to remain in use within the industry sector for producing cement, chemicals, and iron. Thus, in the expected share of clean hydrogen and its derivatives in TFEC in 2050 exceeds the share of all fossil fuels. The electrification level (as expressed by the percentage of electricity in TFEC) is expected to grow from 22% in 2020 to 51% in 2050 according to the 1.5°C scenario.
5. Results (Part 2 of 4): Additional IEA Non-Hydrogen Quantities
This part provides a selected set of results that correspond only to the IEA-WEO report (no similar ones appeared in IRENA-WETO). Although they are not directly connected to hydrogen, they are presented here as useful variables that influence modeling the energy and emissions pathways.
Figure 9 shows the expected trend of world population, which is expected to reach 9.681 billion in 2050 (compared to 7.95 billion in 2022). This population profile is independent of the specific energy scenario (it is the same for STEPS and NZE).
Figure 10 shows an expected decline in the CO₂ intensity of electricity generation, whose global average in 2022 was 460 gCO2/kWh. In STEPS (although it is a relatively passive scenario in terms of not taking new steps for emissions mitigation and energy transition), this CO₂ intensity of electricity generation is expected to drop to 131 gCO2/kWh in 2050. In NZE, the CO₂ intensity of electricity generation is even expected to be negative in 2050, where generating electricity leads effectively to absorbing atmospheric CO₂. This can happen as a result, for example, of using BECCS (bioenergy combined with carbon capture, utilization, and storage), which has negative CO₂ emissions.
Figure 11 shows an expected decline in the global conventional crude oil demand, which was 62.8 Mb/d in 2022. In NZE, this is expected to fall to 15.8 Mb/d (but not totally eliminated, as explained earlier). In the case of STEPS, crude oil demand nearly remains the same (there is a slow decline to 61.3 Mb/d in 2020, and then to 58.2 Mb/d in 2050).
6. Results (Part 3 of 4): Additional IRENA Non-Hydrogen Quantities
Similar to the previous part, this part includes additional IRENA-specific results that are beneficial in depicting the expected progress in the global energy systems, which is still useful for discussing potential developments in hydrogen and its derivatives (for example, through setting benchmarking levels for comparisons with the hydrogen results).
As its full name implies, IRENA pays attention to renewable energy resources. Figure 12 shows the IRENA’s expectation for the global renewable electricity (electricity generation from renewables), and the share of that generation to the total electricity generation (from renewables, nuclear fuels, and fossil fuels). In PES and 1.5°C, the share of renewable electricity is expected to grow from 28% in 2020 to 73% and 91% in 2050, respectively. Furthermore, the 1.5°C scenario forecasts a rapid increase in the share of renewable electricity to reach 68% in 2030 (thus, close to the share of PES in 2050).
Figure 13 has similar types of information, but for the renewables-based electricity capacity. Renewables share in the total electricity capacity according to PES and 1.5°C is expected to grow from 37% in 2020 to 80% and 94% in 2050, respectively. As was the case for electricity generation, the expected 2030 share according to 1.5°C (77%) is close to the 2050 share according to PES (80%). For renewables, having a higher capacity share than the share in the electricity generated can be explained by the relatively lower capacity factor for power plants operating by renewable energy sources (particularly solar energy and wind energy) compared to conventional fossil-fired power plants and nuclear power plants. Thus, the nominal (nameplate) installed electric power capacity is not fully exploited most of the time.
Figure 14 shows a breakdown of the global total electricity generation by source according to the 1.5°C scenario. As mentioned previously, the share of renewables is expected to increase from 28% in 2020 to 91% in 2050. The figure gives additional information about the share of nuclear power, which is expected to decrease from 10% in 2020 to only 4% in 2050; and about the share of fossil fuels, which is expected to decrease from 62% in 2020 to only 5% in 2050.
Figure 15 shows the expected growth in the global electrification percentage in the total final energy consumption (TFEC). In 2020, it was 22%. In either the PES or the 1.5° scenario, this percentage is expected to increase. For the 1.5° scenario, about half (51%) of TFEC is expected to be in the form of directly use of electricity in 2050. This is an advantage due to the eliminated direct CO2 emissions (compared to any carbonaceous fuel). For the PES scenario, the TFEC electrification percentage is expected to increase by only 6 percentage points in 2050, reaching 28% (about half the predicted share by the 1.5° scenario).
7. Results (Part 4 of 4): Hydrogen Specific Quantities
The last set of results concerns hydrogen, and thus it is the most important part of the overall results in the current study. This set is divided into three topics: (1) hydrogen production, (2) hydrogen demand and international trade from one geographic region to another, and (3) hydrogen use (in the electricity sector, in TFEC, in the transport sector, in the industry sector, and in the buildings sector).
7.1. Hydrogen Production
Figure 16 shows a breakdown of the global annual hydrogen (regardless of the emissions being abated or unabated) production in 2019, 2020, and 2021; by the production technology (according to IEA data). It can be seen that the total amount of produced hydrogen was nearly constant (approximately 90 Mt H2) in the three consecutive years. It even decreases slightly in 2020 compared to 2019. There was no green hydrogen production, and the share of blue hydrogen was very small, while gray hydrogen (from fossil fuels without CCUS) being the dominant portion. Based on this figure, the annual global low-emissions hydrogen (LEH) or clean hydrogen (which practically was blue hydrogen only) was about 0.6 Mt H2 (by-product hydrogen is excluded).
Figure 17 and its companion Table 1 show the expected profile of annual global low-emissions hydrogen (LEH) production, and the share of electrolysis-based green hydrogen in this LEH, according to IEA modeling. In 2022, there was only 1 Mt H2 (rounded to the nearest integer) of LEH produced, with practically zero green hydrogen contained in this. Regardless of the IEA scenario (STEPS or NZE), electrolysis-based green hydrogen is expected to dominate (more than 70%) the production of LEH in the future, with a share of 73% in 2050 according to STEPS, and a higher share of 78% in 2050 according to NZE. According to NZE, in 2050, it is expected that LEH production reaches 420 Mt H2. For STEPS, the expected LEH production is less than 10% of that for NZE, either in 2030 or 2050 (22 Mt H2). This is an important observation, where fast growth in LEH production requires support by policymakers through taking emissions mitigation actions and fostering energy transitioning.
Table 2 summarizes the historical (2020) and the expected (2030 and 2050) annual global production of clean hydrogen, according to IRENA’s PES and 1.5°C scenarios. The reported annual production in 2020 (0.7 Mt H2) is not very different from the 0.6 Mt H2 mentioned earlier in the same year (based on IEA data). In 2050, the PES estimation of annual clean hydrogen production is 21 Mt H2 (compared to 30 Mt H2 of LEH according to STEPS), and the 1.5°C estimation is 523 Mt H2 (compared to 420 Mt H2 of LEH according to NZE). Despite the differences in these estimation pairs, the two IRENA scenarios agree with the two IEA scenarios that there is a huge suppression in the production of clean hydrogen or LEH if energy transition is not activated through adopting adequate measures to reach zero CO2 emissions in 2050.
Figure 18 shows the expected electrolyzers capacity for producing green hydrogen, according to the IRENA-1.5°C scenario. From zero capacity in 2020, a capacity of 513 GW is expected in 2030, which is further expected to increase 11 times to reach 5,647 GW or 5.647 TW (16.0% of the 35.339 TW electricity generator capacity according to 1.5°C, as mentioned earlier).
7.2. Hydrogen Demand and Far-Distance Trade
Figure 19 shows a breakdown of the global annual hydrogen demand in 2019, 2020, and 2021; by the demand sector (according to IEA data). It can be seen that the demand within each sector remained nearly the same over the three years. Refining was the largest demanding application, with a share of more than 40% in each of the three years. The second largest demanding application is ammonia production, with a share of more than 35% in each of the three years. The third largest demanding application was methanol production, with a share of about 15% in each of the three years. The fourth largest demanding application was iron production, with a small share of about 5% in each of the three years.
Table 3 presents the global demand for low-emissions hydrogen-based liquid fuels (LELs), and its ratio to the conventional crude oil demand (which was discussed earlier), based on IEA modeling. The use of conventional crude oil demand here is just for benchmarking, and the ratio shown is not a fraction (not limited to an upper limit of 100%). Despite the expected large ratio of 38.0% in 2050 according to NZE, one reason for such a high ratio is the big decline in the demand for conventional crude oil (from 62.8 Mb/d in 2022 to 15.8 Mb/d in 2050, thus a drop to about 25% only of the recent demand). However, the expected demand of 6.0 Mboe/d for low-emissions hydrogen-based liquid fuels in 2050 according to NZE is approximately 10% of the recent 2022 demand for conventional crude oil, which makes LELs a clear contributor among liquid fuels. Thus, the role of LELs as liquid fuels (for any purposes) is much better than the role of LEH and LEA in the narrow purpose of electricity generation.
Figure 20 shows the expected annual global region-to-region trade (far distance trade) of LEH and its derived energy products, according to IEA data. It also shows the computed share of this traded LEH and its derivative products in the demand for LEH and its derivative products. Similar to the case of LEH production, there is a huge gap between the STEPS scenario and the NZE scenario in terms of the amount of anticipated traded LEH and its derivatives. This emphasizes the sensitivity of the LEH market to the attention given by policymakers to emissions mitigation. The share of this region-to-region traded LEH in the global LEH demand is limited to 21% for both scenarios, in either 2030 or 2050.
7.3. Hydrogen Use
With regard to the utilization of hydrogen, Table 4 gives the IEA’s past (2010, 2021, 2022) and future expectations (2030, 2050) for the global electricity generation (by direct combustion or through fuel cells) from low-emissions hydrogen (LEH) and derived low-emissions ammonia (LEA) as a low-emissions liquid fuel and hydrogen carrier. The table also gives the share of this type of electricity generation in the total electricity generation. Regardless of the energy forecasting scenario (STEPS or NZE), the combined role of LEH and LEA in electricity generation is of minor importance, with the best estimate being only 2% (more precisely 1.51%) in 2050 according to NZE.
Table 5 has a similar structure of the previous table with also IEA’s results, but it is for the global electricity capacity (rather than the global electricity generation). It affirms the relatively weak role of low-emissions hydrogens and derived low-emissions ammonia in the electricity sector, with only 1% combined share (more precisely 1.16%, with 427 GW by LEH and LEA compared to the expected total electricity capacity of 36,956 GW) in 2050 according to NZE.
Moving from IEA data to IRENA data, Table 6 shows the IRENA’s past and expected global share of clean hydrogen (both direct use and indirect use as derived e-fuels) in the total final energy consumption (TFEC). The two IRENA’s TFEC values mentioned earlier (past value for 2020, and expected future value for 2050 according to 1.5°C) are included in the table. Similar to a previous remark made when discussing IEA results for the expected future LEH production and discussing IRENA results for the expected future clean hydrogen production, unless the 1.5°C scenario is realized, the role of clean hydrogen and its derivatives can be very limited in TFEC (less than 1% energy share, even in 2050).
Finally, sector-specific estimations of the past and expected global share of clean hydrogen (both direct use and indirect use as derived e-fuels) in the final energy consumption (FEC) within three sectors are presented, still using IRENA data. Table 7 shows that the transport sector has good potential for utilizing clean hydrogen or its derived fuels, with the share in transport-FEC is expected to reach 24% in 2050 according to the 1.5°C scenario. Thus, hydrogen can play a noticeable role in decarbonizing the transport sector, such as through fuel cell electric vehicles and trains. Table 8 shows the share for the industry sector, where the maximum expected share in industry-FEC (17%) is also appreciable. The direct reduced iron (DRI) for example is one way where clean hydrogen becomes an important feedstock for producing iron in a clean way compared to the conventional use of carbon as a reduction agent of the iron ore (iron oxides). Table 9 shows the share for the buildings sector. Unlike the previous two sectors, the expected share of clean hydrogen and its derived e-fuels in the buildings-FEC is negligible (less than 1%) in either 2030 or 2050, and in either PES or 1.5°C scenario.
8. Conclusions
In the current study, various barriers and drivers for a large-scale hydrogen economy (especially electrolysis-based green hydrogen) were discussed. Selective analysis of the most-recent editions (2023) of the World Energy Outlook (WEO, 26th edition) of the International Energy Agency (IEA), and the World Energy Transitions Outlook (WETO, 3rd edition, volume 1 of two volumes) of the International Renewable Energy Agency (IRENA) was presented. The following findings can be stated:
- IEA’s Stated Policies Scenario (STEPS), and IRENA’s Planned Energy Scenario (PES) can vary noticeably in their predictions for 2030 and 2050 (with the deviation exceeding 20%, such as the total electricity capacity in 2050), but can also be consistent (the deviation is less than 1% such as the total electricity generation in 2030).
- IEA’s Net Zero Emissions by 2050 (NZE), and IRENA’s 1.5°C pathway are overall similar (but not identical) in terms of their examined forecasting. For example, their deviation in the predicted global total final energy consumption (TFEC) in 2050 was only about 10 EJ, which is less than 3% of either reported value.
- Fossil fuels (coal, crude oil, and natural gas) are not expected to be totally phased out in the situation of net-zero global emissions of carbon dioxide (CO2), but their use is expected to be mostly limited within the transport sector or in some industries.
- If the current energy policies and targets remain in place, the share of renewable energy resources in the global electricity generation is expected to increase from 28% in 2020 to nearly 50% in 2030 and nearly 75% in 2050%.
- Carbon dioxide emissions per kWh of generated electricity being expected to decline from about 460 gCO2 (global average) in 2021 to about 300 gCO2 in 2030, and to decline further to about 130 gCO2 in 2050.
- The future of hydrogen (particularly green hydrogen) is largely speculative, with a very wide range of possible development (from being negligible to being as important as fossil fuels and biomass), depending on whether or not governments take serious actions for mitigating the global carbon dioxide emissions by 2050, through decarbonizing various sectors.
- With fully decarbonized global economy (in terms of net zero CO2 emissions) in 2050, green and blue hydrogen production may exceed 500 Mt H2/yr (with about 80% of this being green hydrogen from water electrolysis, with a global electrolyzers capacity exceeding 5,000 GW).
- With fully decarbonized global economy (in terms of net zero CO2 emissions) in 2050, the share of green and blue hydrogen in the global total final energy consumption may reach 14%, which is a little more than the share of fossil fuels, and a little less than the share of biomass. The share of direct electricity use at that time is expected to be approximately one-half.
- Hydrogen has a better chance of being exploited within the transport sector and the industry sector, but not in the buildings sector.
- Electrolysis-based green hydrogen is expected to dominate the hydrogen production technologies, with a share around 75%.
Author Contributions
Not applicable (this research has a single author).
Funding
Not applicable (this research received no funding).
Institutional Review Board Statement
Not applicable (this research does not involve humans, animals, or environmental hazards).
Informed Consent Statement
Not applicable (this research does not involve humans).
Data Availability Statement
This research does not have accompanying supplementary materials.
Conflict of Interest
Not applicable (this research was conducted in the absence of any commercial or financial relationships that causes a conflict of interest).
References
- Marzouk, O.A. Assessment of global warming in Al Buraimi, sultanate of Oman based on statistical analysis of NASA POWER data over 39 years, and testing the reliability of NASA POWER against meteorological measurements. Heliyon 2021, 7, E06625. [Google Scholar] [CrossRef] [PubMed]
- Matthews, H.D. , Wynes, S. Current global efforts are insufficient to limit warming to 1.5 °C. Science 2022, 376, 1404–1409. [Google Scholar] [CrossRef] [PubMed]
- Meinshausen, M. , Lewis, J., McGlade, C., Gütschow, J., Nicholls, Z., Burdon, R., Cozzi, L., Hackmann, B. Realization of Paris Agreement pledges may limit warming just below 2 °C. Nature 2022, 604, 304–309. [Google Scholar] [CrossRef]
- Marzouk, O.A. (2022). Chronologically-Ordered Quantitative Global Targets for the Energy-Emissions-Climate Nexus, from 2021 to 2050. 2022 International Conference on Environmental Science and Green Energy (ICESGE). Virtual, 10-. 1-6. 1 December. [CrossRef]
- Chen, J.M. Carbon neutrality: toward a sustainable future. The Innovation. 2021, 2, 100127. [Google Scholar] [CrossRef]
- NASA [United States National Aeronautics and Space Administration] - Earth Observatory (2024). World of Change: Global Temperatures. Available online: https://earthobservatory.nasa.gov/world-of-change/global-temperatures (accessed on 5 January 2024).
- IPCC [Intergovernmental Panel on Climate Change] (2024). Climate Change 2014 Synthesis Report Fifth Assessment Report - Future changes, risks and impacts. Available online: https://ar5-syr.ipcc.ch/topic_futurechanges.php (accessed on 5 January 2024).
- Vitousek, P.M. Beyond global warming: ecology and global change. Ecology 1994, 75, 1861–1876. [Google Scholar] [CrossRef]
- IEA [International Energy Agency] (2023a). Global Energy and Climate Model - Documentation 2023. Available online: https://iea.blob.core.windows.net/assets/ff3a195d-762d-4284-8bb5-bd062d260cc5/GlobalEnergyandClimateModelDocumentation2023.pdf (accessed on 5 January 2024).
- IEA [International Energy Agency] (2023b). Stated Policies Scenario (STEPS) – Global Energy and Climate Model. Available online: https://www.iea.org/reports/global-energy-and-climate-model/stated-policies-scenario-steps (accessed on 5 January 2024).
- IEA [International Energy Agency] (2023c). Net Zero Emissions by 2050 Scenario (NZE) – Global Energy and Climate Model. Available online: https://www.iea.org/reports/global-energy-and-climate-model/net-zero-emissions-by-2050-scenario-nze (accessed on 5 January 2024).
- IEA [International Energy Agency] (2023d). World Energy Outlook - Previous editions. Available online: https://www.iea.org/reports/world-energy-outlook-2023#previous-editions (accessed on 27 December 2023).
- FAO [Food and Agriculture Organization of the United Nations] (2023). World Energy Outlook Series. Available online: https://www.fao.org/forestry/energy/catalogue/search/detail/fr/c/1305396 (accessed on 26 December 2023).
- IEA [International Energy Agency] (2023e). World Energy Outlook 2023. Annual Report (26th Edition). Available online: https://iea.blob.core.windows.net/assets/42b23c45-78bc-4482-b0f9-eb826ae2da3d/WorldEnergyOutlook2023.pdf (accessed on 27 December 2023).
- IRENA [International Renewable Energy Agency] (2023). World Energy Transitions Outlook 2023: 1.5°C Pathway, Volume 1. Annual Report (Third Edition). Available online: https://mc-cd8320d4-36a1-40ac-83cc-3389-cdn-endpoint.azureedge.net/-/media/Files/IRENA/Agency/Publication/2023/Jun/IRENA_World_energy_transitions_outlook_v1_2023.pdf (accessed on 26 December 2023).
- Tseng, P. , Lee, J., Friley, P. A hydrogen economy: opportunities and challenges. Energy 2005, 30, 2703–2720. [Google Scholar] [CrossRef]
- Bockris, J.O.M. The hydrogen economy: Its history. International Journal of Hydrogen Energy 2013, 38, 2579–2588. [Google Scholar] [CrossRef]
- Oliveira, A.M. , Beswick, R.R., Yan, Y. A green hydrogen economy for a renewable energy society. Current Opinion in Chemical Engineering 2021, 33, 100701. [Google Scholar] [CrossRef]
- Squadrito, G. , Maggio, G., Nicita, A. The green hydrogen revolution. Renewable Energy 2023, 216, 119041. [Google Scholar] [CrossRef]
- Marzouk, O.A. 2030 Ambitions for Hydrogen, Clean Hydrogen, and Green Hydrogen. Engineering Proceedings 2023, 56, 14. [Google Scholar] [CrossRef]
- Fajín, J.L. , Cordeiro, M.N.D. Renewable hydrogen production from biomass derivatives or water on trimetallic based catalysts. Renewable and Sustainable Energy Reviews 2024, 189, 113909. [Google Scholar] [CrossRef]
- Garlet, T.B. , Savian, F.S., Ribeiro, J.L.D., Siluk, J.C.M. Unlocking Brazil's green hydrogen potential: Overcoming barriers and formulating strategies to this promising sector. International Journal of Hydrogen Energy 2024, 49, 553–570. [Google Scholar] [CrossRef]
- Kakoulaki, G. , Kougias, I., Taylor, N., Dolci, F., Moya, J., Jäger-Waldau, A. Green hydrogen in Europe–A regional assessment: Substituting existing production with electrolysis powered by renewables. Energy Conversion and Management 2021, 228, 113649. [Google Scholar] [CrossRef]
- Marzouk, O.A. Tilt sensitivity for a scalable one-hectare photovoltaic power plant composed of parallel racks in Muscat. Cogent Engineering 2022, 2, 2029243. [Google Scholar] [CrossRef]
- Schrotenboer, A.H. , Veenstra, A.A.T., uit het Broek, M.A.J., Ursavas, E. A Green Hydrogen Energy System: Optimal control strategies for integrated hydrogen storage and power generation with wind energy. Renewable and Sustainable Energy Reviews 2022, 168, 112744. [Google Scholar] [CrossRef]
- Salmon, N. , Bañares-Alcántara, R. Green ammonia as a spatial energy vector: a review. Sustainable Energy & Fuels 2021, 5, 2814–2839. [Google Scholar] [CrossRef]
- Schmidt, P.R.; Weindorf, W., Failer, S., Astono, Y., Ullmann, A. (2023). E-SAF: Techno-Economics of PtL and PtH₂ - Focus North America and Europe. Report by LBST – Ludwig-Bölkow-Systemtechnik GmbH. Available online: https://en.lbst.de/wp-content/uploads/2023/12/DA_E-SAF_Report_final_2023_12_04.pdf (accessed on 8 January 2024).
- Longden, T. , Beck, F.J., Jotzo, F., Andrews, R., Prasad, M. ‘Clean’ hydrogen? – Comparing the emissions and costs of fossil fuel versus renewable electricity based hydrogen. Applied Energy. 2022, 306, 118145. [Google Scholar] [CrossRef]
- Newborough, M. , Cooley, G. Developments in the global hydrogen market: The spectrum of hydrogen colours. Fuel Cells Bulletin 2020, 2020, 16–22. [Google Scholar] [CrossRef]
- Yu, M. , Wang, K., Vredenburg, H. Insights into low-carbon hydrogen production methods: Green, blue and aqua hydrogen. International Journal of Hydrogen Energy 2021, 46, 21261–21273. [Google Scholar] [CrossRef]
- Crespi, E. , Guandalini, G., Gößling, S., Campanari, S. Modelling and optimization of a flexible hydrogen-fueled pressurized PEMFC power plant for grid balancing purposes. International Journal of Hydrogen Energy 2021, 46, 13190–13205. [Google Scholar] [CrossRef]
- Pilavachi, P.A. , Stephanidis, S.D., Pappas, V.A., Afgan, N.H. Multi-criteria evaluation of hydrogen and natural gas fuelled power plant technologies. Applied Thermal Engineering 2009, 29, 2228–2234. [Google Scholar] [CrossRef]
- Marzouk, O.A. Growth in the Worldwide Stock of E-Mobility Vehicles (by Technology and by Transport Mode) and the Worldwide Stock of Hydrogen Refueling Stations and Electric Charging Points between 2020 and 2022. Key Engineering Materials 2023, 469, 89–96. [Google Scholar] [CrossRef]
- Çalışır, D. , Ekici, S., Midilli, A., Karakoc, T.H. Benchmarking environmental impacts of power groups used in a designed UAV: Hybrid hydrogen fuel cell system versus lithium-polymer battery drive system. Energy 2023, 262, 125543. [Google Scholar] [CrossRef]
- Cavaliere, P. , Perrone, A., Dijon, L., Laska, A., Koszelow, D. Direct reduction of pellets through hydrogen: Experimental and model behaviour. International Journal of Hydrogen Energy 2024, 49, 1444–1460. [Google Scholar] [CrossRef]
- Moradpoor, I. , Syri, S., Santasalo-Aarnio, A. Green hydrogen production for oil refining–Finnish case. Renewable and Sustainable Energy Reviews 2023, 175, 113159. [Google Scholar] [CrossRef]
- Bahnamiri, F.K. , Khalili, M., Pakzad, P., Mehrpooya, M. Techno-economic assessment of a novel power-to-liquid system for synthesis of formic acid and ammonia, based on CO2 electroreduction and alkaline water electrolysis cells. Renewable Energy 2022, 187, 1224–1240. [Google Scholar] [CrossRef]
- Pagani, G. , Hajimolana, Y., Acar, C. Green hydrogen for ammonia production–A case for the Netherlands. International Journal of Hydrogen Energy 2024, 52, 418–432. [Google Scholar] [CrossRef]
- Ueckerdt, F. , Bauer, C., Dirnaichner, A., Everall, J., Sacchi, R., Luderer, G. Potential and risks of hydrogen-based e-fuels in climate change mitigation. Nature Climate Change 2021, 11, 384–393. [Google Scholar] [CrossRef]
- Yilmaz, H.Ü. , Kimbrough, S.O., van Dinther, C., Keles, D. Power-to-gas: Decarbonization of the European electricity system with synthetic methane. Applied Energy 2022, 323, 119538. [Google Scholar] [CrossRef]
- Atsonios, K. , Li, J., Inglezakis, V.J. Process analysis and comparative assessment of advanced thermochemical pathways for e-kerosene production. Energy 2023, 278, 127868. [Google Scholar] [CrossRef]
- Nemmour, A. , Inayat, A., Janajreh, I., Ghenai, C. Green hydrogen-based E-fuels (E-methane, E-methanol, E-ammonia) to support clean energy transition: A literature review. International Journal of Hydrogen Energy 2023, 48, 29011–29033. [Google Scholar] [CrossRef]
- Boretti, A. A market opportunity in power generation for hydrogen energy storage systems. International Journal of Hydrogen Energy 2024, 49, 166–172. [Google Scholar] [CrossRef]
- Zhou, B. , Huang, W., Zong, Y., Sobiesiak, A. Water and pressure effects on a single PEM fuel cell. Journal of Power Sources 2006, 155, 190–202. [Google Scholar] [CrossRef]
- Marzouk, O.A. Adiabatic Flame Temperatures for Oxy-Methane, Oxy-Hydrogen, Air-Methane, and Air-Hydrogen Stoichiometric Combustion using the NASA CEARUN Tool, GRI-Mech 3.0 Reaction Mechanism, and Cantera Python Package. Engineering, Technology & Applied Science Research 2023, 13, 11437–11444. [Google Scholar] [CrossRef]
- Fernández, Y.F. , López, M.A.F., Blanco, B.O. Innovation for sustainability: the impact of R&D spending on CO2 emissions. Journal of Cleaner Production 2018, 172, 3459–3467. [Google Scholar] [CrossRef]
- Field, R.A. , Derwent, R.G. Global warming consequences of replacing natural gas with hydrogen in the domestic energy sectors of future low-carbon economies in the United Kingdom and the United States of America. International Journal of Hydrogen Energy 2021, 46, 30190–30203. [Google Scholar] [CrossRef]
- Marzouk, O.A. Zero Carbon Ready Metrics for a Single-Family Home in the Sultanate of Oman Based on EDGE Certification System for Green Buildings. Sustainability 2023, 15, 13856. [Google Scholar] [CrossRef]
- Lee, S.C. , Chang, M. Indoor and outdoor air quality investigation at schools in Hong Kong. Chemosphere 2000, 41, 109–113. [Google Scholar] [CrossRef]
- Cheng, Y. , Zhang, S., Huan, C., Oladokun, M.O., Lin, Z. Optimization on fresh outdoor air ratio of air conditioning system with stratum ventilation for both targeted indoor air quality and maximal energy saving. Building and Environment 2019, 147, 11–22. [Google Scholar] [CrossRef]
- Mundackal, A. , Ngole-Jeme, V.M. Evaluation of indoor and outdoor air quality in university academic buildings and associated health risk. International Journal of Environmental Health Research 2022, 32, 1076–1094. [Google Scholar] [CrossRef]
- Marzouk, O.A. Compilation of Smart Cities Attributes and Quantitative Identification of Mismatch in Rankings. Journal of Engineering 2022, 2022, 5981551. [Google Scholar] [CrossRef]
- Rand, D.A.J. , Dell, R.M. (2007). Hydrogen Energy: Challenges and Prospects. Royal Society of Chemistry (RSC) Publishing.
- Ball, M. , Wietschel, M. The future of hydrogen–opportunities and challenges. International Journal of Hydrogen Energy 2009, 34, 615–627. [Google Scholar] [CrossRef]
- Mazloomi, K. , Gomes, C. Hydrogen as an energy carrier: Prospects and challenges. Renewable and Sustainable Energy Reviews 2012, 16, 3024–3033. [Google Scholar] [CrossRef]
- Yue, M. , Lambert, H., Pahon, E., Roche, R., Jemei, S., Hissel, D. Hydrogen energy systems: A critical review of technologies, applications, trends and challenges. Renewable and Sustainable Energy Reviews 2021, 146, 111180. [Google Scholar] [CrossRef]
- Ishaq, H. , Dincer, I., Crawford, C. A review on hydrogen production and utilization: Challenges and opportunities. International Journal of Hydrogen Energy 2022, 47, 26238–26264. [Google Scholar] [CrossRef]
- Chiesa, P. , Lozza, G., Mazzocchi, L. Using hydrogen as gas turbine fuel. Journal of Engineering for Gas Turbines and Power 2005, 127, 73–80. [Google Scholar] [CrossRef]
- Dupuis, D.P. , Grim, R.G., Nelson, E., Tan, E.C., Ruddy, D.A., Hernandez, S., Westover, T., Hensley, J.E., Carpenter, D. High-octane gasoline from biomass: experimental, economic, and environmental assessment. Applied Energy 2019, 241, 25–33. [Google Scholar] [CrossRef]
- Amaral, L.V. , Santos, N.D.S.A., Roso, V.R., Sebastião, R.C.O., Pujatti, F.J.P. Effects of gasoline composition on engine performance, exhaust gases and operational costs. Renewable and Sustainable Energy Reviews 2021, 135, 110196. [Google Scholar] [CrossRef]
- Bothast, R.J. , Schlicher, M.A. Biotechnological processes for conversion of corn into ethanol. Applied Microbiology and Biotechnology 2005, 67, 19–25. [Google Scholar] [CrossRef]
- EIA [U.S. Energy Information Administration] (2024). Gasoline and Diesel Fuel Update. Available online: https://www.eia.gov/petroleum/gasdiesel (accessed on 7 January 2024).
- NSS [National Subsidy System - Sultanate of Oman] (2024). Fuel Price - January'24. Available online: https://nss.gov.om/site/home?ln=EN (accessed on 7 January 2024).
- Khouya, A. Levelized costs of energy and hydrogen of wind farms and concentrated photovoltaic thermal systems. A case study in Morocco. International Journal of Hydrogen Energy 2020, 45, 31632–31650. [Google Scholar] [CrossRef]
- Minutillo, M. , Perna, A., Forcina, A., Di Micco, S., Jannelli, E. Analyzing the levelized cost of hydrogen in refueling stations with on-site hydrogen production via water electrolysis in the Italian scenario. International Journal of Hydrogen Energy 2021, 46, 13667–13677. [Google Scholar] [CrossRef]
- Abdin, Z. , Khalilpour, K., & Catchpole, K. Projecting the levelized cost of large scale hydrogen storage for stationary applications. Energy Conversion and Management 2022, 270, 116241. [Google Scholar] [CrossRef]
- BloombergNEF (2020). Hydrogen Economy Outlook. Available online: https://data.bloomberglp.com/professional/sites/24/BNEF-Hydrogen-Economy-Outlook-Key-Messages-30-Mar-2020.pdf (accessed on 11 May 2023).
- Fan, J.-L. , Yu, P., Li, K., Xu, M., Zhang, X. A levelized cost of hydrogen (LCOH) comparison of coal-to-hydrogen with CCS and water electrolysis powered by renewable energy in China. Energy 2022, 242, 123003. [Google Scholar] [CrossRef]
- XE.com Inc. (2024a). 1 USD to CNY - Convert US Dollars to Chinese Yuan Renminbi. Available online: https://www.xe.com/currencyconverter/convert/?Amount=1&From=USD&To=CNY (accessed on 7 January 2024).
- Marzouk, O.A. Levelized cost of green hydrogen (LCOH) in the Sultanate of Oman using H2A-Lite with polymer electrolyte membrane (PEM) electrolyzers powered by solar photovoltaic (PV) electricity. E3S Web of Conferences 2023, 469, 00101. [Google Scholar] [CrossRef]
- Vartiainen, E. , Breyer, C., Moser, D., Medina, E.R., Busto, C., Masson, G., Bosch, E., Jäger-Waldau, A. True cost of solar hydrogen. Solar RRL 2022, 6, 2100487. [Google Scholar] [CrossRef]
- XE.com Inc. (2024b). 1 EUR to USD - Convert Euros to US Dollars. Available online: https://www.xe.com/currencyconverter/convert/?Amount=1&From=EUR&To=USD (accessed on 7 January 2024).
- Hydrogen Council (2020). Path to hydrogen competitiveness - A cost perspective. Available online: https://hydrogencouncil.com/wp-content/uploads/2020/01/Path-to-Hydrogen-Competitiveness_Full-Study-1.pdf (accessed on 11 May 2023).
- Janssen, J.L.L.L.C.C. , Weeda, M., Detz, R.J., van der Zwaan, B. Country-specific cost projections for renewable hydrogen production through off-grid electricity systems. Applied Energy 2022, 309, 118398. [Google Scholar] [CrossRef]
- Hydrogen Council (2023). Hydrogen Insights 2023. Available online: https://hydrogencouncil.com/wp-content/uploads/2023/05/Hydrogen-Insights-2023.pdf (accessed on 28 June 2023).
- IRENA [International Renewable Energy Agency] (2020). Green Hydrogen Cost Reduction: Scaling up Electrolysers to Meet the 1.5°C Climate Goal. Available online: https://www.irena.org/-/media/Files/IRENA/Agency/Publication/2020/Dec/IRENA_Green_hydrogen_cost_2020.pdf (accessed on 22 May 2023).
- IRENA and Bluerisk [International Renewable Energy Agency, and Bluerisk – a water strategy and data analytics consultancy] (2023). Water for hydrogen production. Joint Report. Available online: https://mc-cd8320d4-36a1-40ac-83cc-3389-cdn-endpoint.azureedge.net/-/media/Files/IRENA/Agency/Publication/2023/Dec/IRENA_Bluerisk_Water_for_hydrogen_production_2023.pdf (accessed on 25 December 2023).
- Beswick, R.R. , Oliveira, A.M., Yan, Y. Does the green hydrogen economy have a water problem? ACS Energy Letters 2021, 6, 3167–3169. [Google Scholar] [CrossRef]
- dena and WEC [Deutsche Energie-Agentur GmbH – German Energy Agency, and World Energy Council – Germany section] (2022). Global Harmonisation of Hydrogen Certification - Overview of global regulations and standards for renewable hydrogen. Report. Available online: https://www.weltenergierat.de/wp-content/uploads/2022/01/dena_WEC_Harmonisation-of-Hydrogen-Certification_digital_final.pdf (accessed on 25 December 2023).
- IEA [International Energy Agency] (2023f). Global Hydrogen Review 2023. Annual Report. Available online: https://www.iea.org/reports/global-hydrogen-review-2023 (accessed on 18 October 2023).
- IRENA and WTO [International Renewable Energy Agency, and World Trade Organization] (2023). International trade and green hydrogen - Supporting the global transition to a low-carbon economy. Joint Report. Available online: https://mc-cd8320d4-36a1-40ac-83cc-3389-cdn-endpoint.azureedge.net/-/media/Files/IRENA/Agency/Publication/2023/Dec/IRENA_WTO_International_trade_green_hydrogen_2023.pdf (accessed on 25 December 2023).
- Galassi, M.C. , Papanikolaou, E., Baraldi, D., Funnemark, E., Håland, E., Engebø, A., Haugom, G.P., Jordan, T., Tchouvelev, A.V. HIAD–hydrogen incident and accident database. International Journal of Hydrogen Energy 2012, 37, 17351–17357. [Google Scholar] [CrossRef]
- Abohamzeh, E. , Salehi, F., Sheikholeslami, M., Abbassi, R., Khan, F. Review of hydrogen safety during storage, transmission, and applications processes. Journal of Loss Prevention in the Process Industries 2021, 72, 104569. [Google Scholar] [CrossRef]
- NOAA [National Oceanic and Atmospheric Administration] (2024). Computer-Aided Management of Emergency Operations (CAMEO) Chemicals | Online Database of Hazardous Materials | Chemical Datasheet | Hydrogen. Available online: https://cameochemicals.noaa.gov/chemical/8729 (accessed on 7 January 2024).
- Beasy, K. , Emery, S., Pryor, K., Vo, T.A. Skilling the green hydrogen economy: A case study from Australia. International Journal of Hydrogen Energy 2023, 48, 19811–19820. [Google Scholar] [CrossRef]
- Sandri, O. , Holdsworth, S., Wong, P.S.P., Hayes, J. Upskilling plumber gasfitters for hydrogen: An empirical study using the Theory of Planned Behavior. Renewable Energy 2024, 221, 119800. [Google Scholar] [CrossRef]
- Ricci, M. , Bellaby, P., Flynn, R. What do we know about public perceptions and acceptance of hydrogen? A critical review and new case study evidence. International Journal of Hydrogen Energy 2008, 33, 5868–5880. [Google Scholar] [CrossRef]
- Gordon, J.A. , Balta-Ozkan, N., Nabavi, S.A. Homes of the future: Unpacking public perceptions to power the domestic hydrogen transition. Renewable and Sustainable Energy Reviews 2022, 164, 112481. [Google Scholar] [CrossRef]
- Dolci, F. , Thomas, D., Hilliard, S., Guerra, C.F., Hancke, R., Ito, H., Jegoux, M., Kreeft, G., Leaver, J., Newborough, M., Proost, J., Robinius, M., Weidner, E., Mansilla, C., Lucchese, P. Incentives and legal barriers for power-to-hydrogen pathways: An international snapshot. international Journal of Hydrogen Energy 2019, 44, 11394–11401. [Google Scholar] [CrossRef]
- Bartlett, J.; Krupnick, A. (2020). Decarbonized Hydrogen in the US Power and Industrial Sectors: Identifying and Incentivizing Opportunities to Lower Emissions. RRF (Resources for the Future) Report. Available online: https://media.rff.org/documents/RFF_Report_20-25_Decarbonized_Hydrogen.pdf (accessed on 8 January 2024).
- BMWK [German: Bundesministerium für Wirtschaft und Klimaschutz, English: Federal Ministry for Economic Affairs and Climate Action] (2022a). H2Global - Term Sheet: Hydrogen Purchase Agreements (Draft 7 July 2022) - Work in Progress / Subject to Alignment with BMWK. Available online: https://www.bmwk.de/Redaktion/DE/Downloads/h2global/draft-term-sheet-hpa-market-consultation-h2global.pdf (accessed on 31 July 2023).
- BMWK [German: Bundesministerium für Wirtschaft und Klimaschutz, English: Federal Ministry for Economic Affairs and Climate Action] (2022b). Newsletter Energiewende - What exactly is H2Global? Available online: https://www.bmwk-energiewende.de/EWD/Redaktion/EN/Newsletter/2022/01/Meldung/direkt-account.html (accessed on 8 January 2024).
- TED [Tenders Electronic Daily] (2022). Supplies - 675894-2022 - TED Tenders Electronic Daily. Available online: https://ted.europa.eu/udl?uri=TED:NOTICE:675894-2022:TEXT:EN:HTML&tabId=0 (accessed on 8 January 2024).
Figure 1.
Global CO2 emissions, including industrial processes and flaring emissions (data source: IEA).
Figure 1.
Global CO2 emissions, including industrial processes and flaring emissions (data source: IEA).
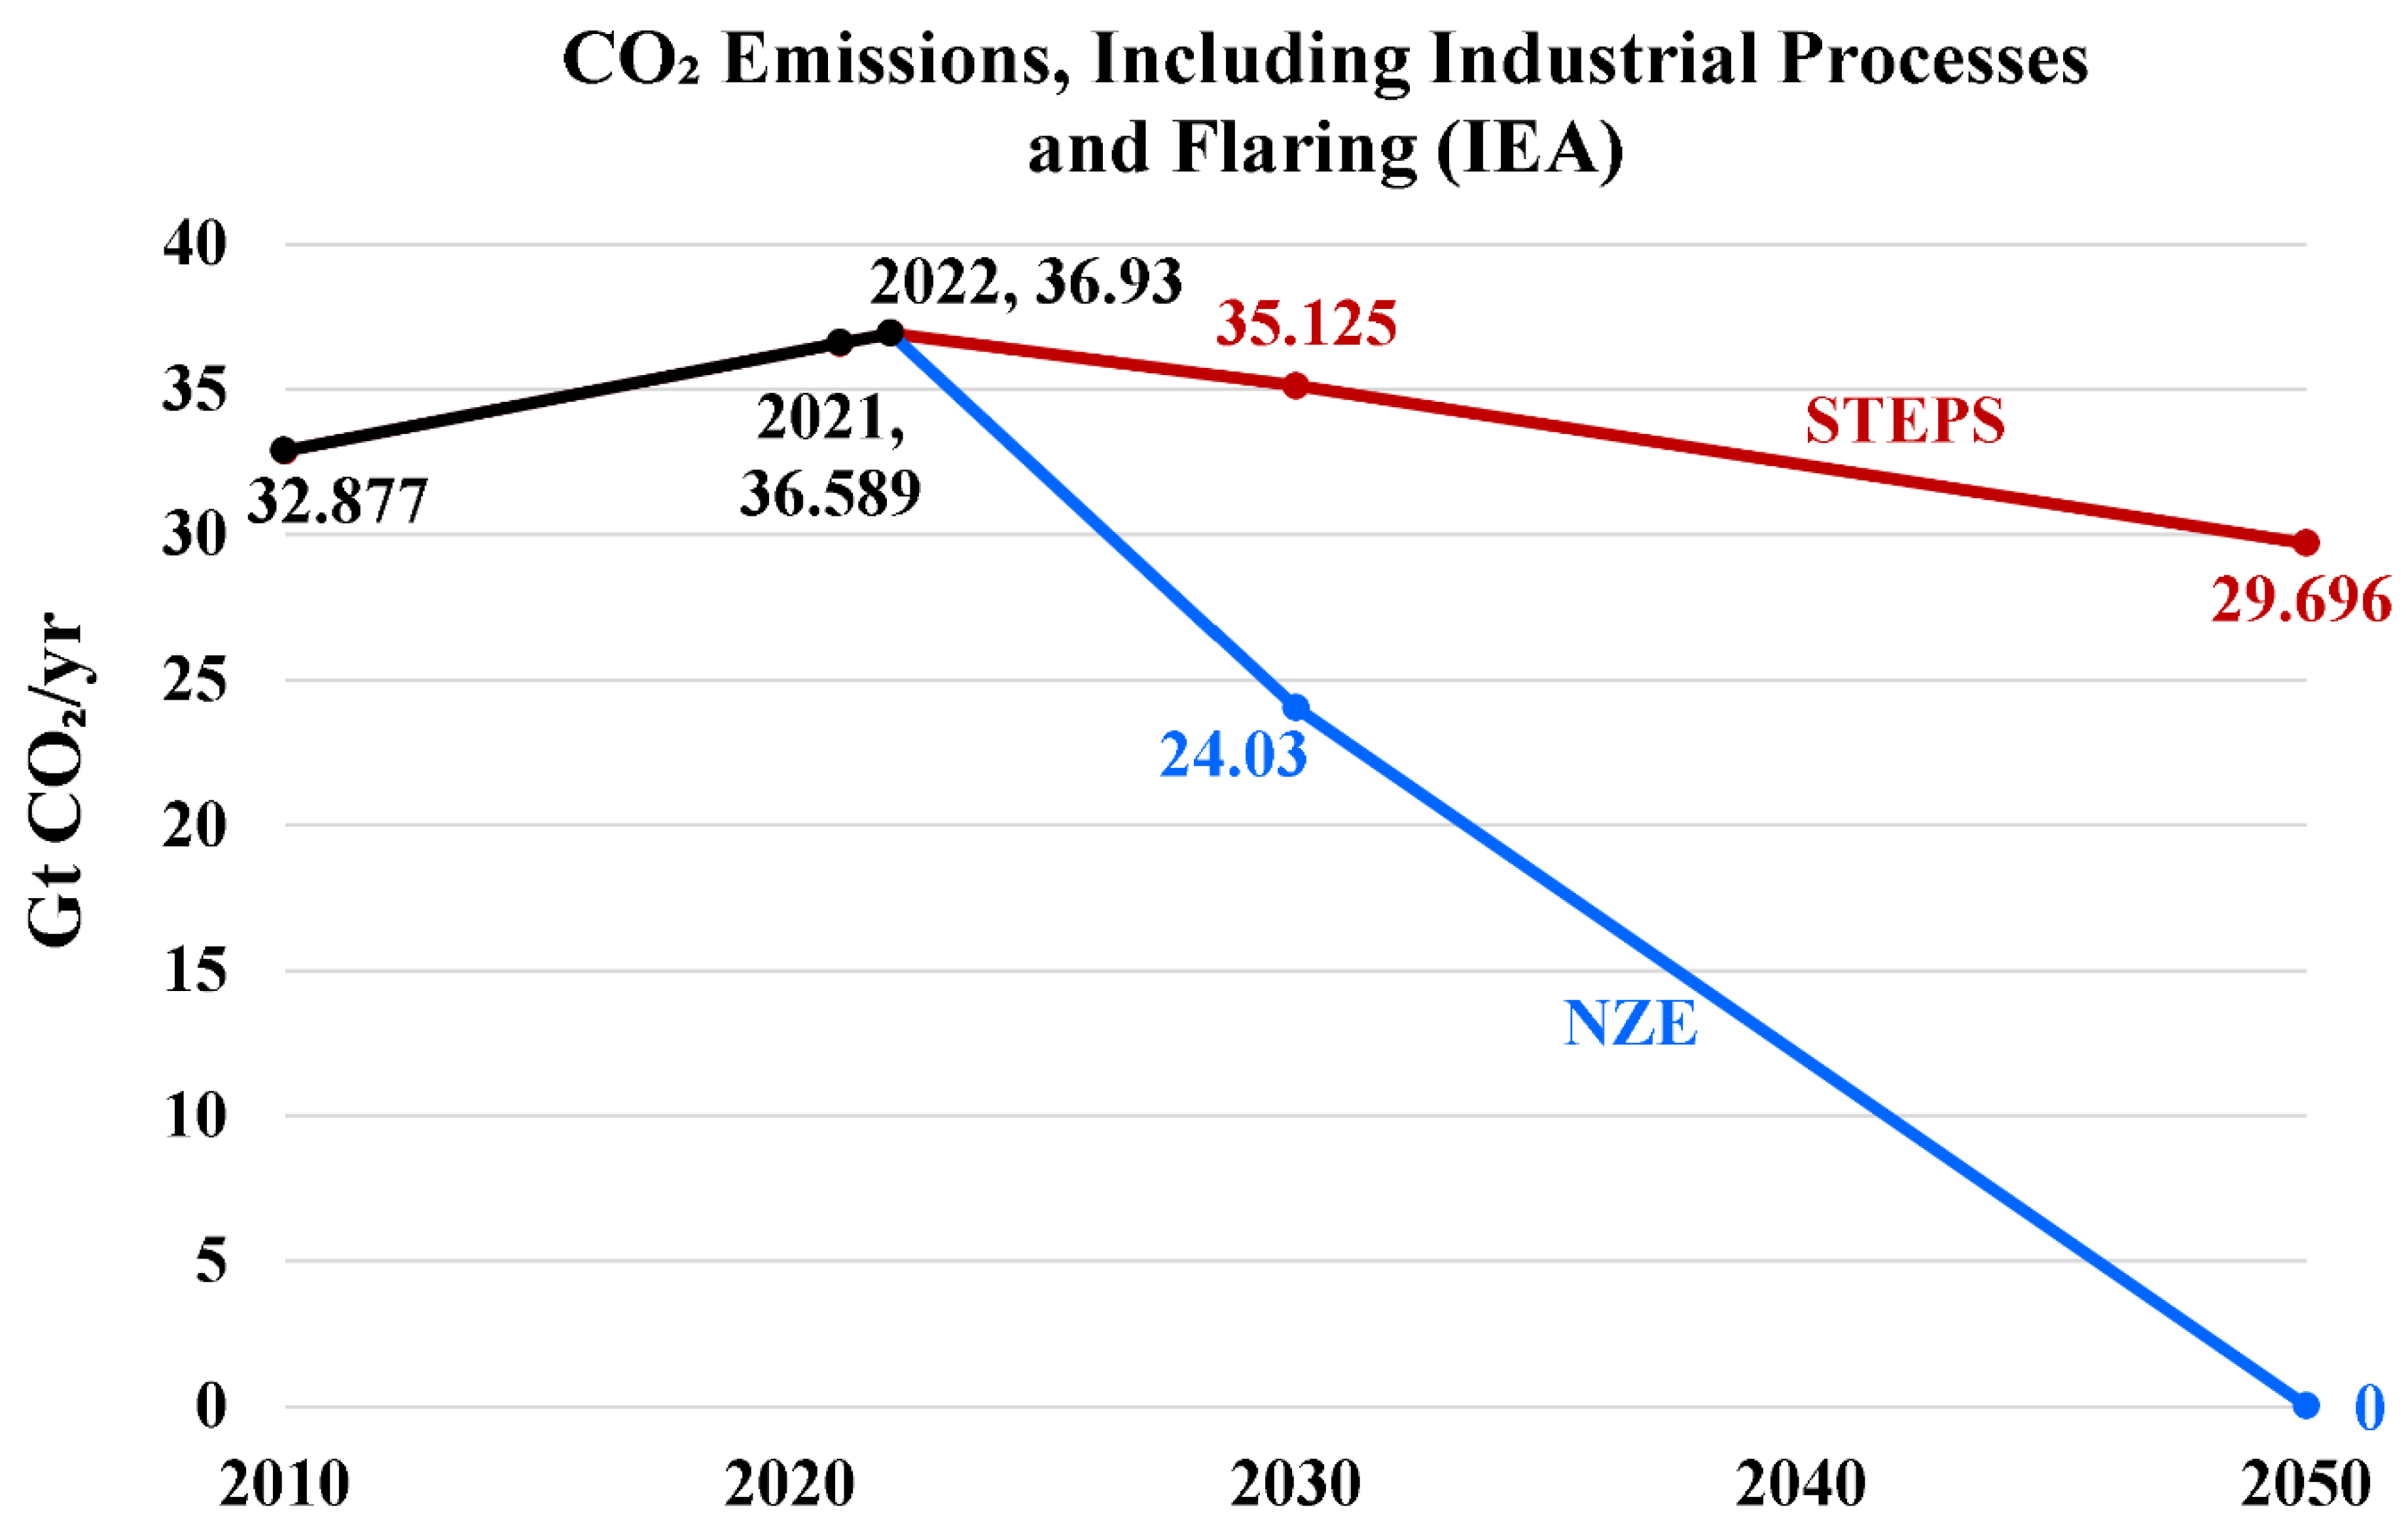
Figure 2.
Global net annual CO2 emissions, related to energy and process activities (data source: IRENA).
Figure 2.
Global net annual CO2 emissions, related to energy and process activities (data source: IRENA).
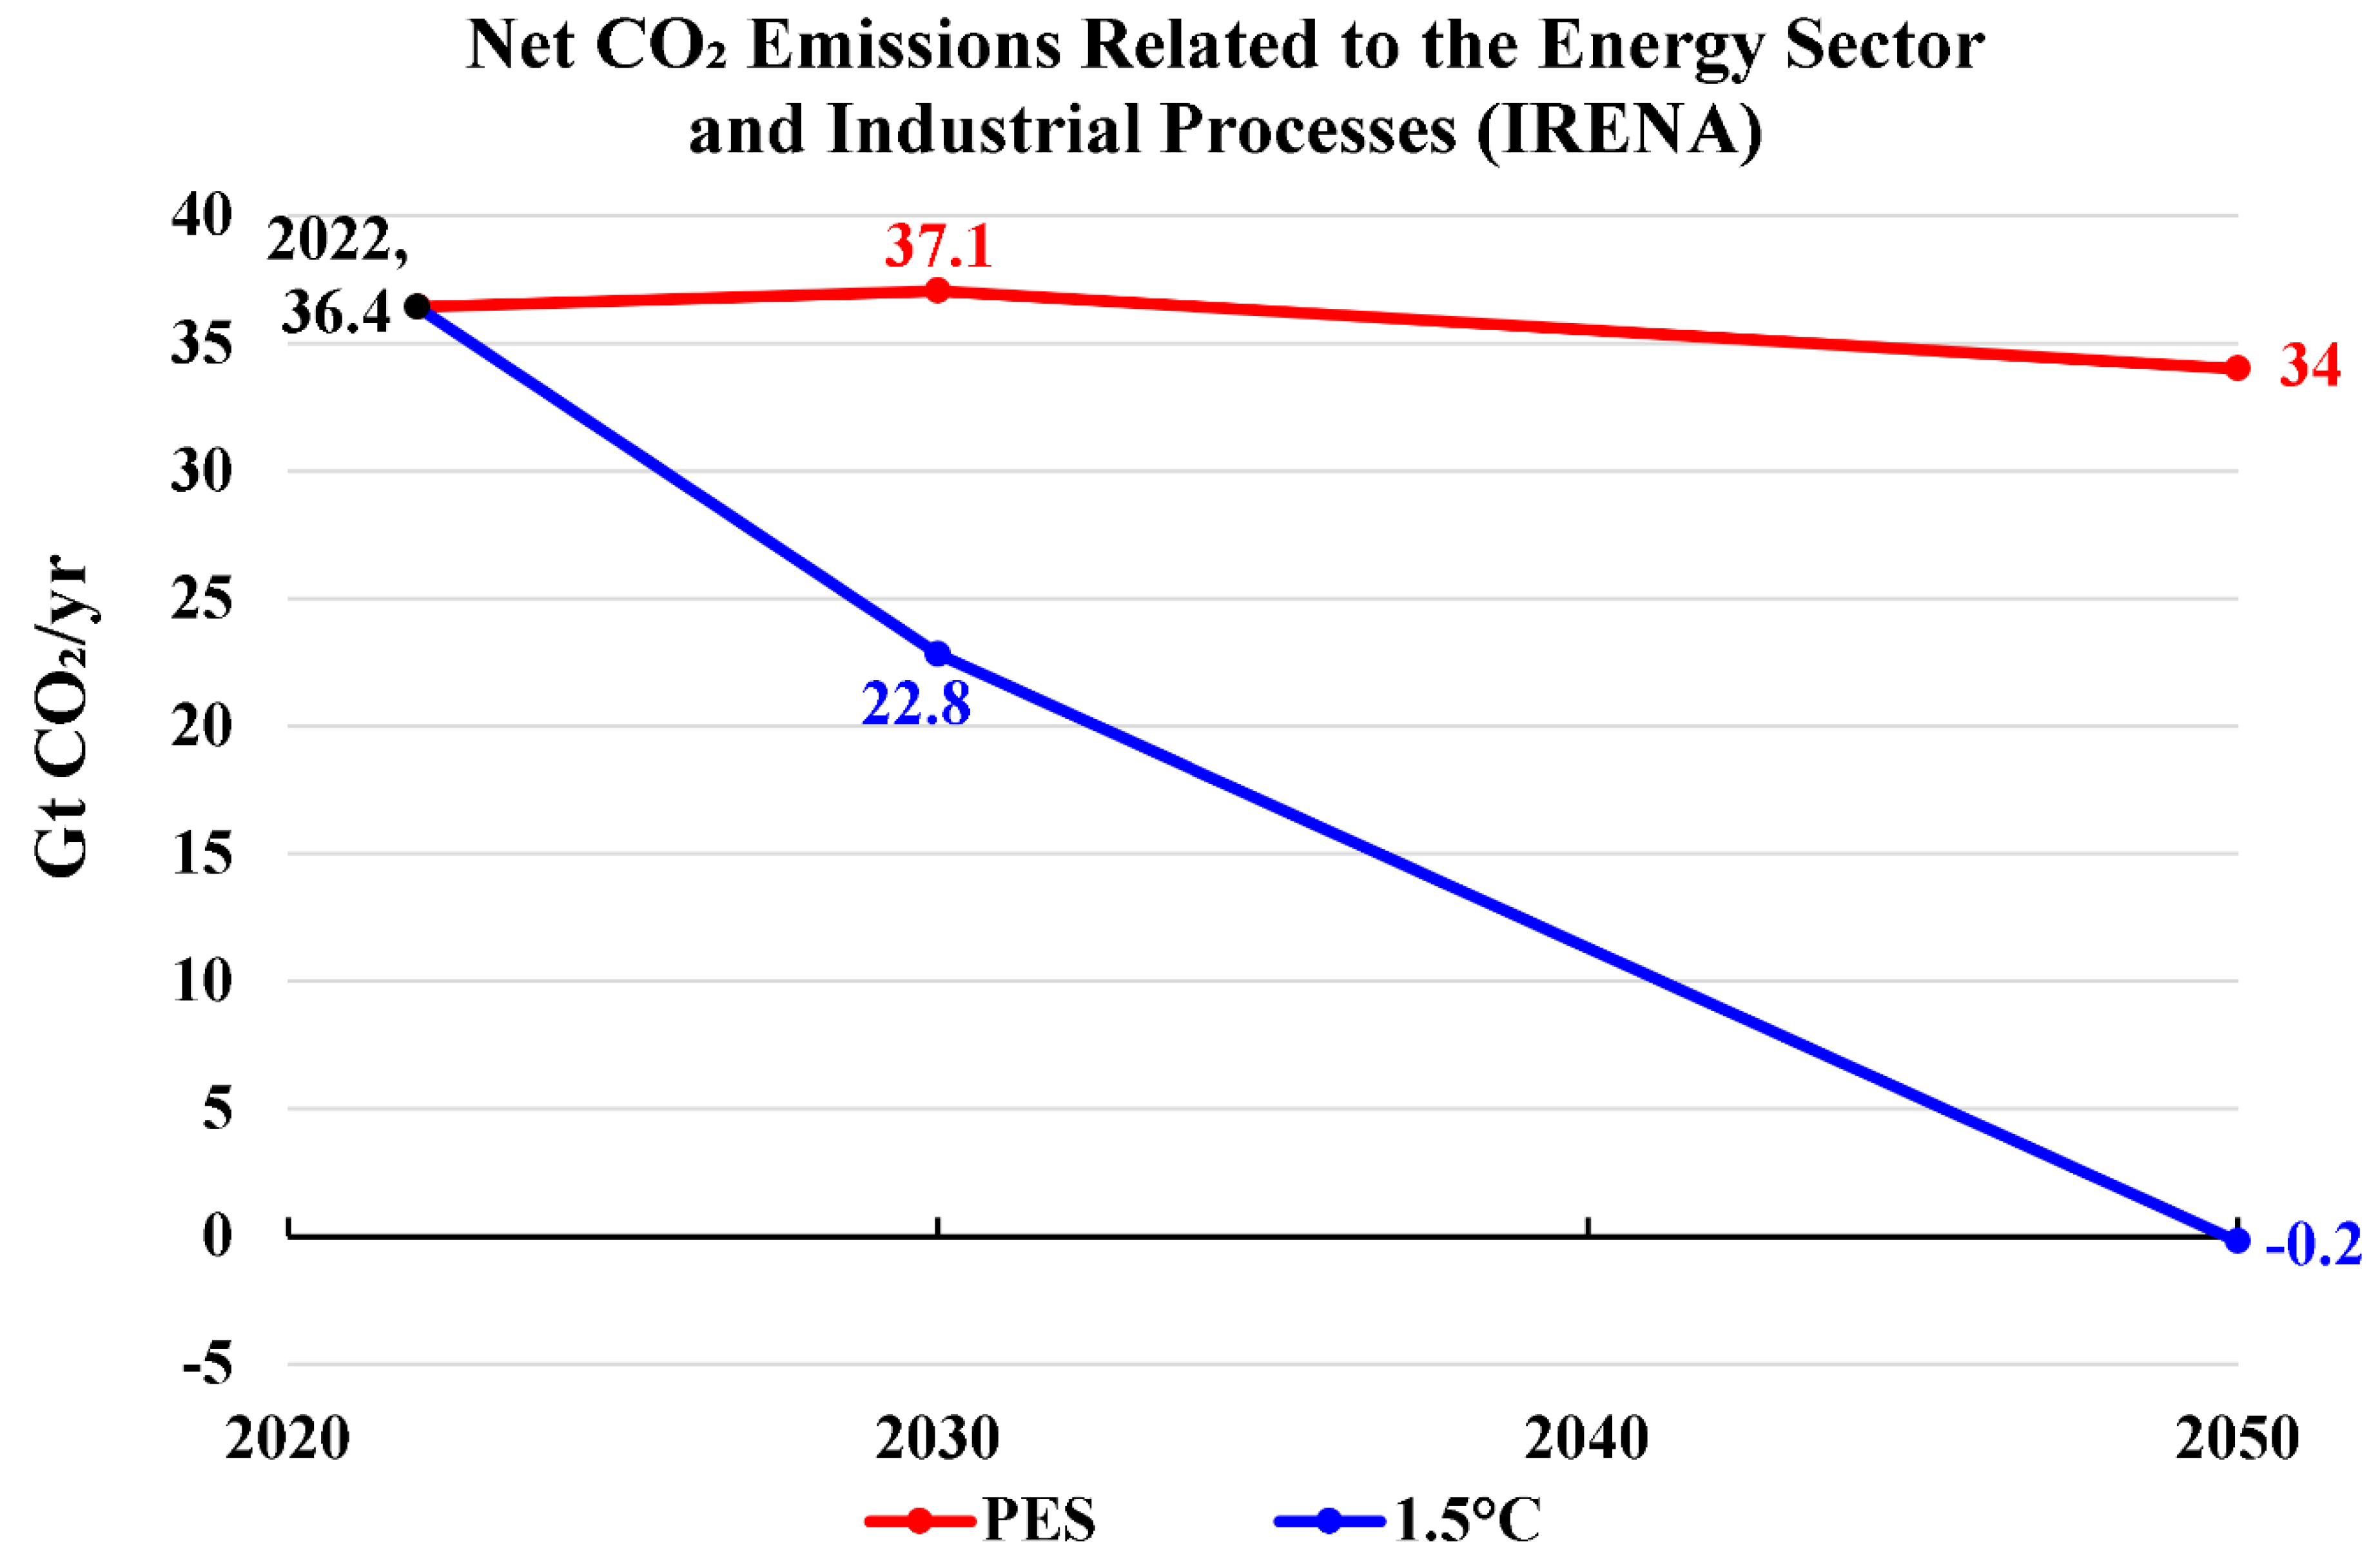
Figure 3.
Global total electricity generation (data source: IEA).
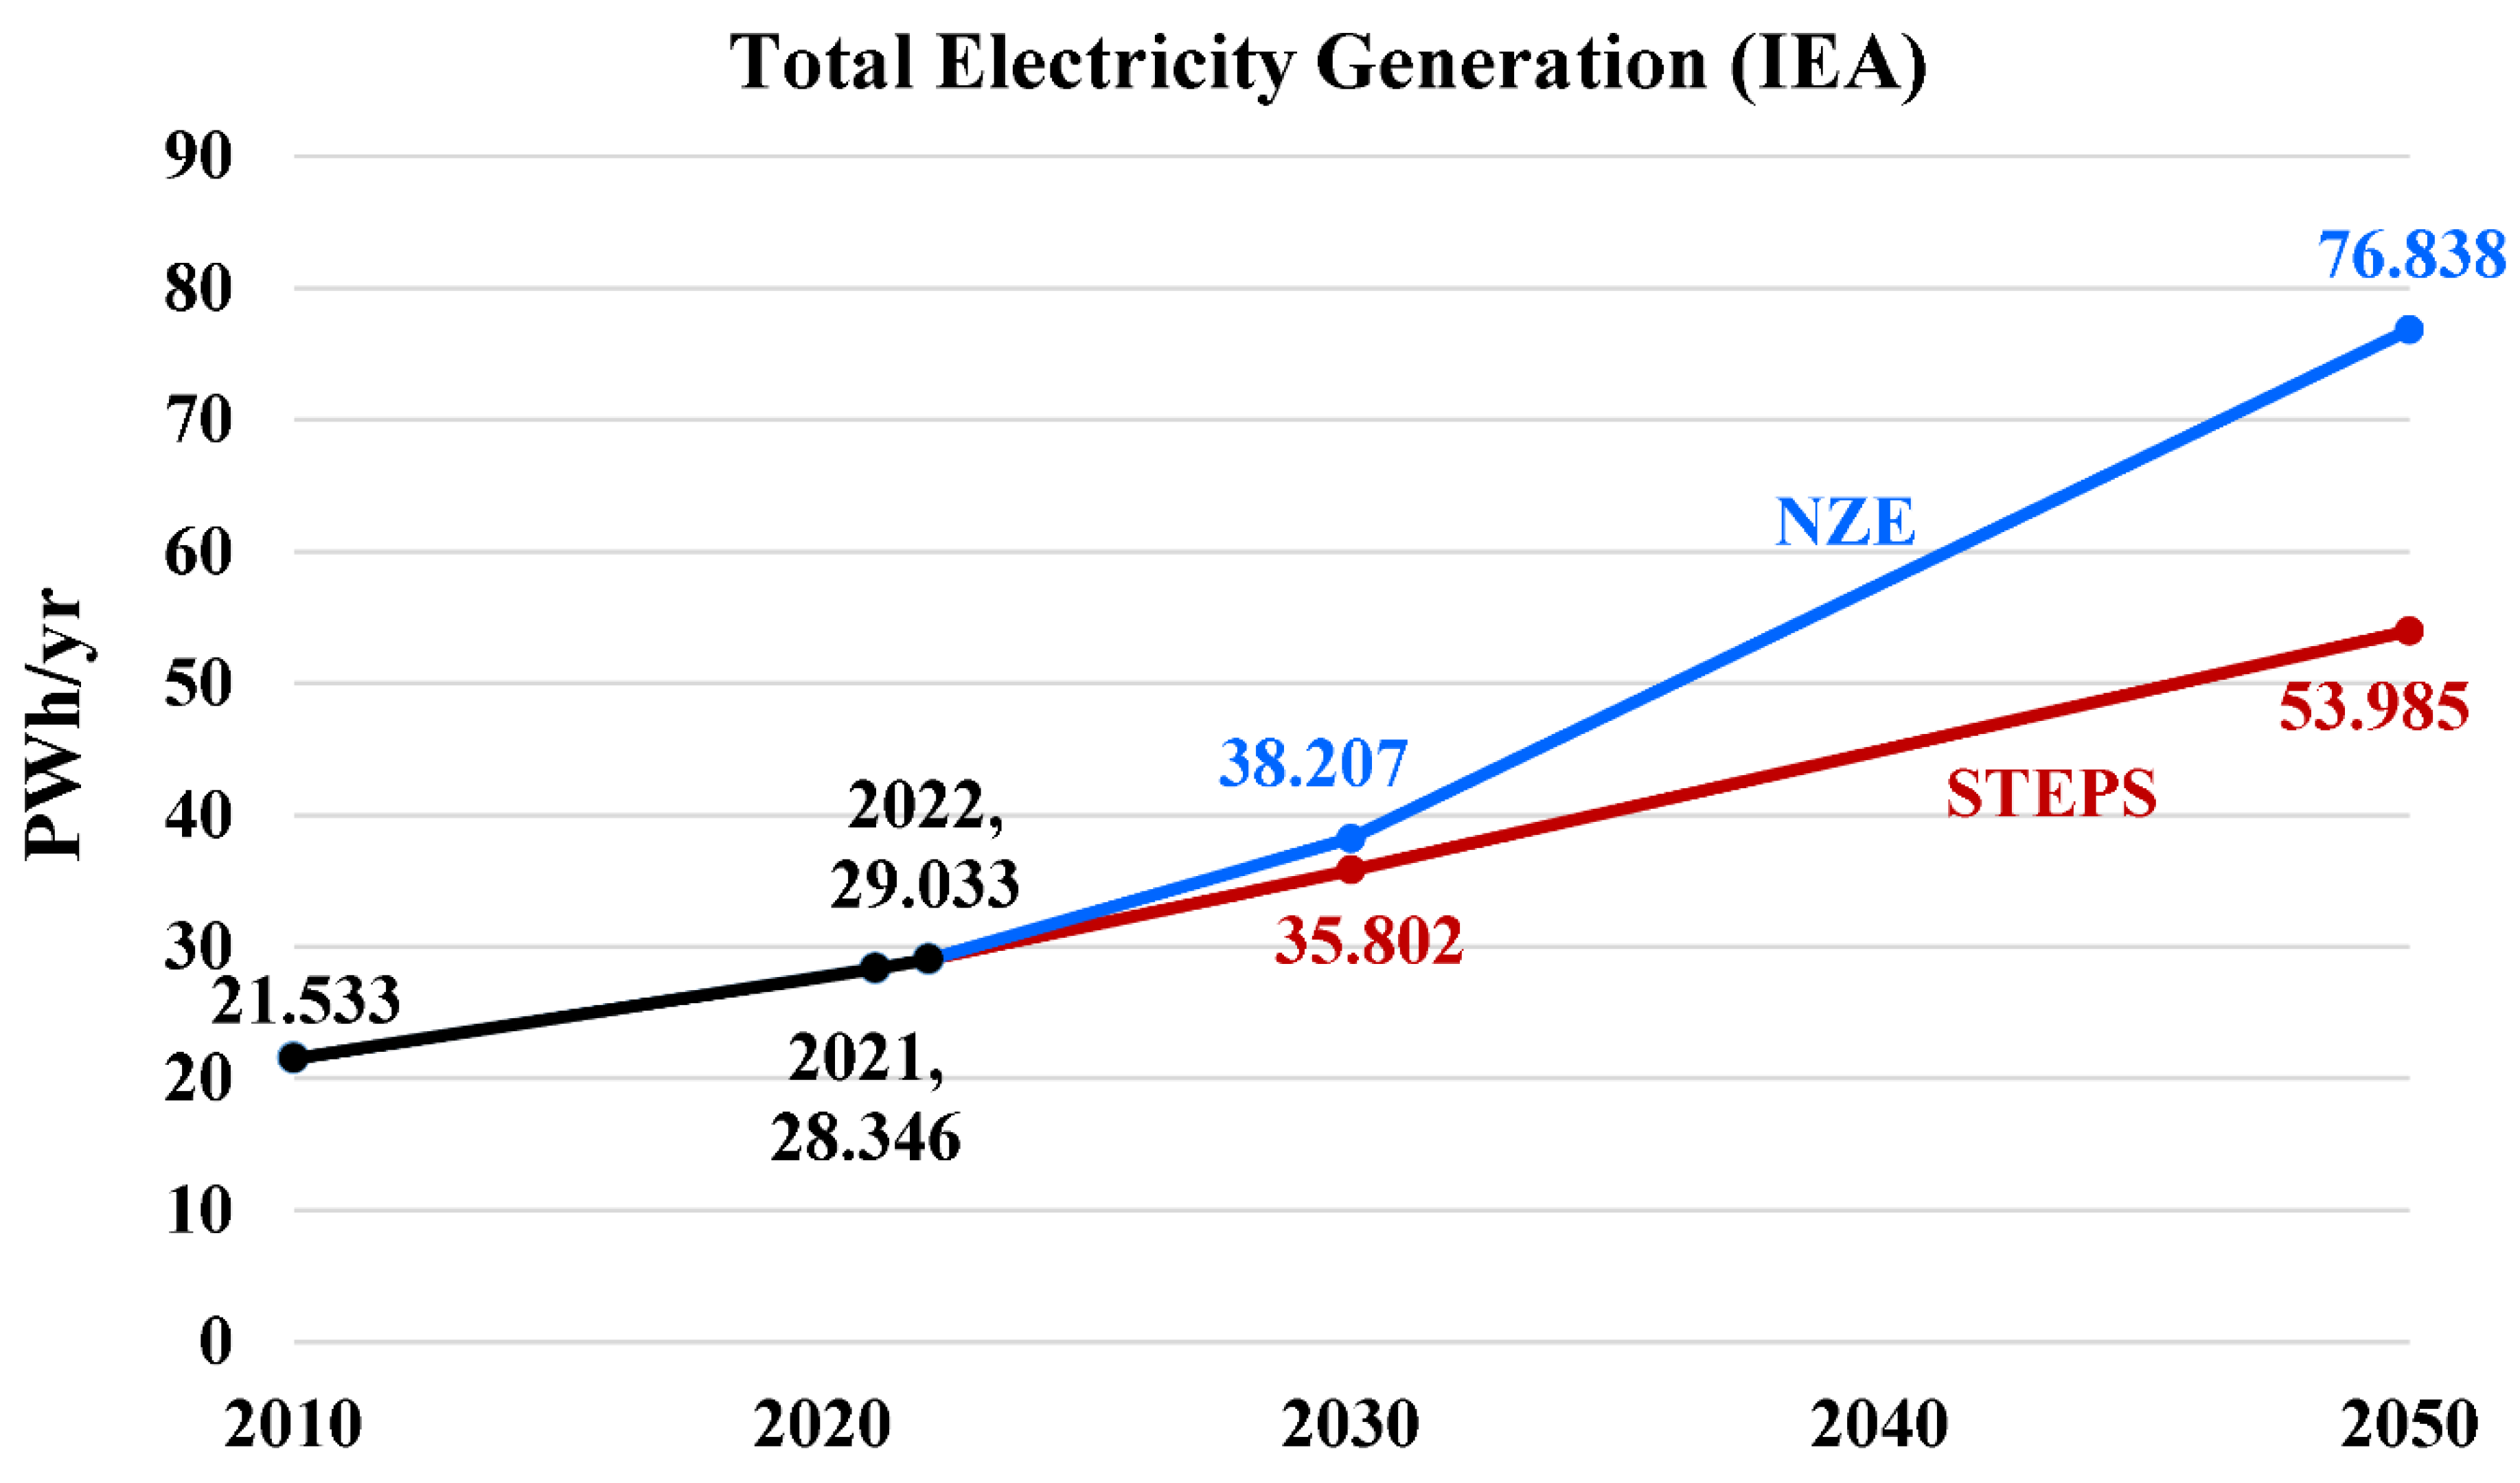
Figure 4.
Global total electricity generation (data source: IRENA).
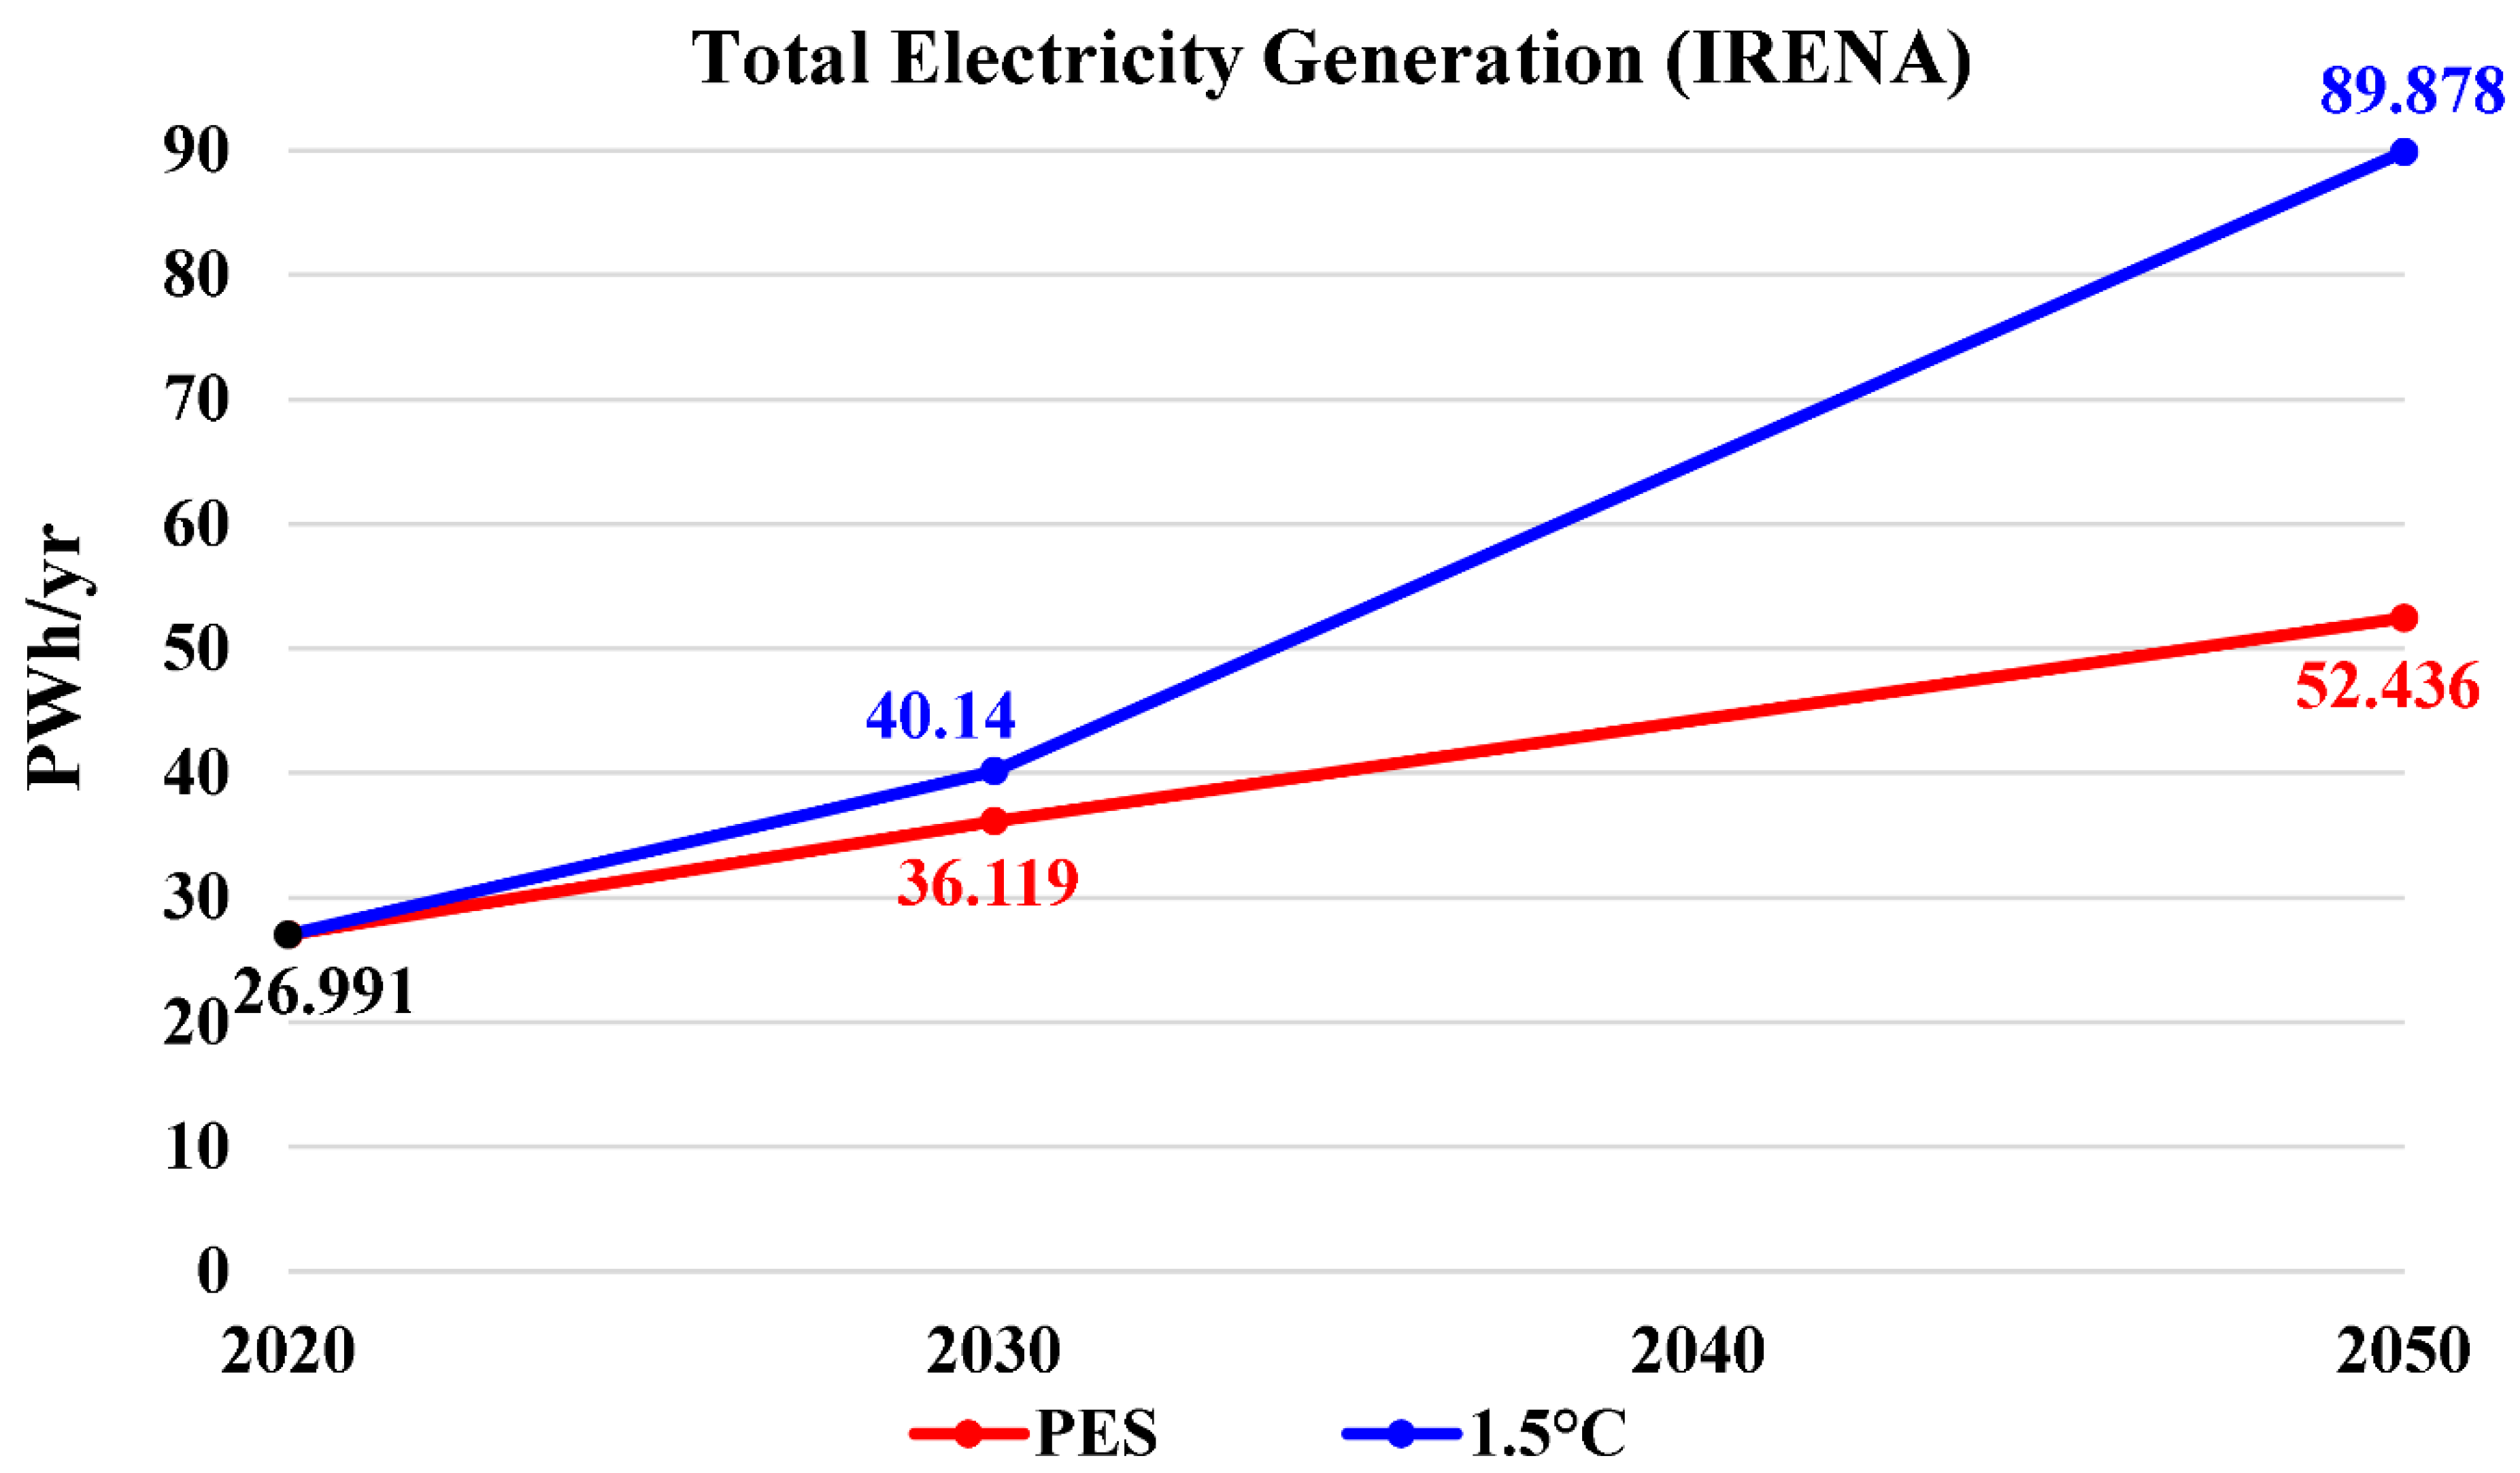
Figure 5.
Global total electricity capacity (data source: IEA).
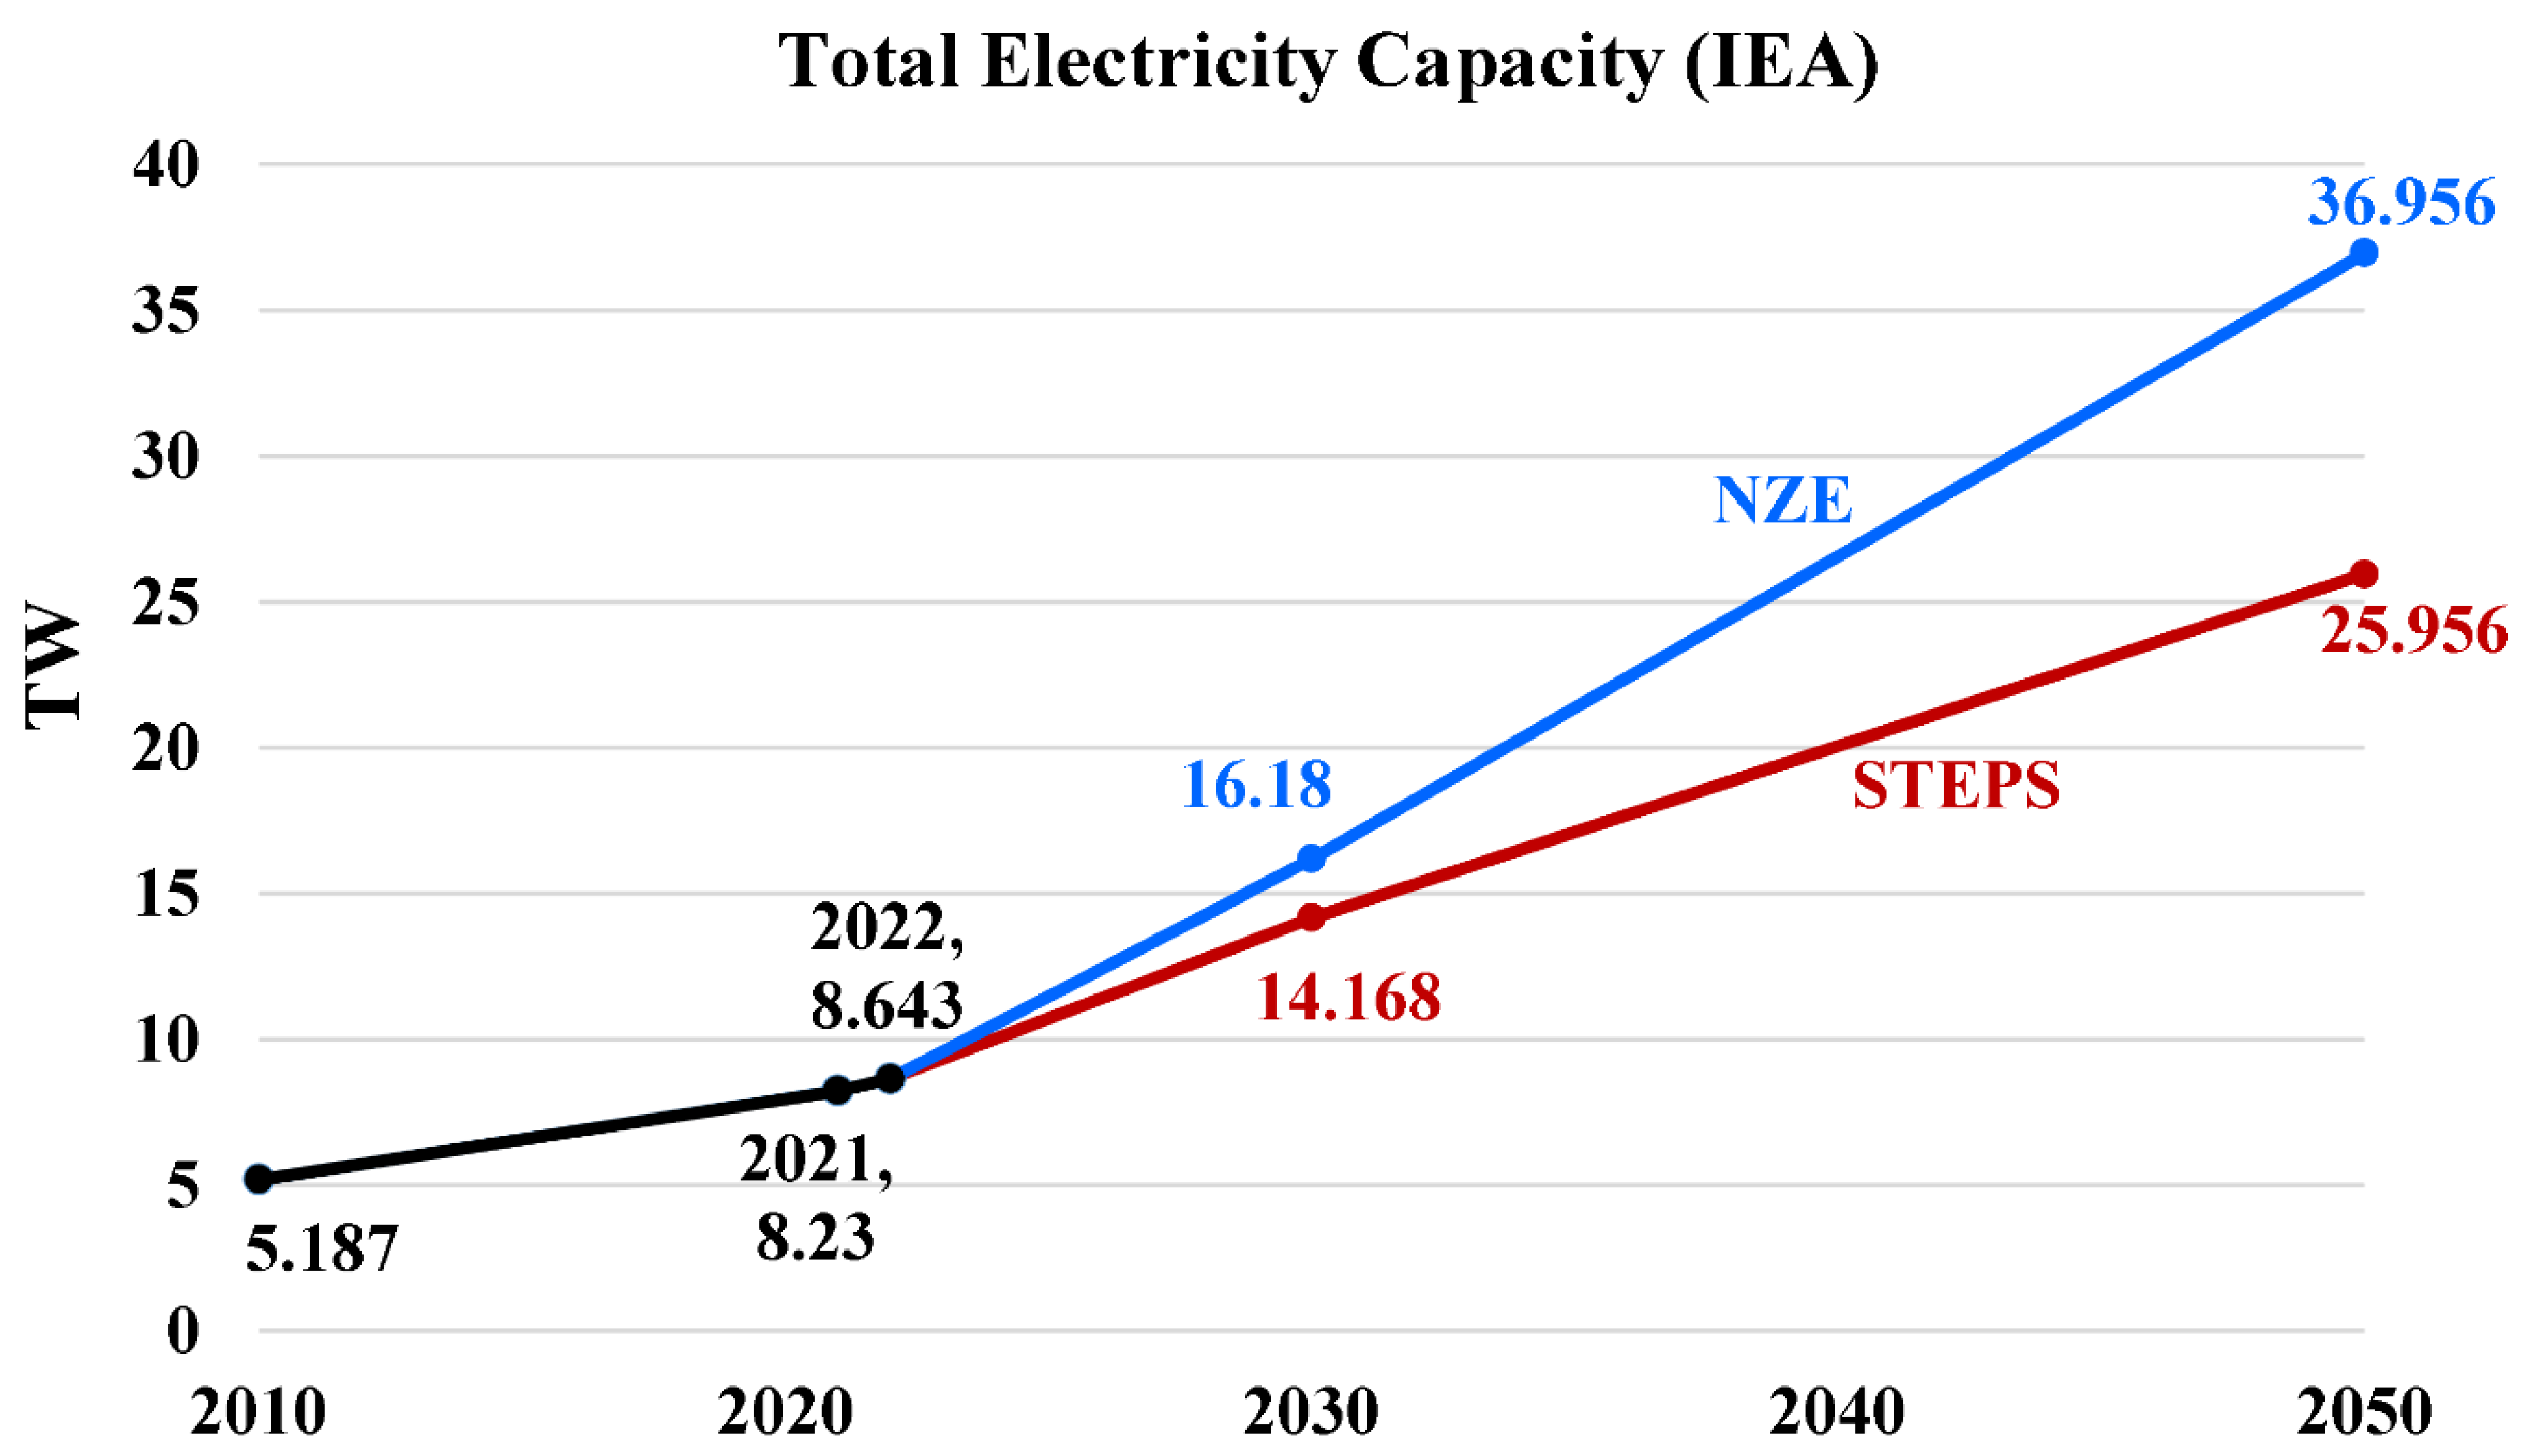
Figure 6.
Global total installed electricity capacity (data source: IRENA).
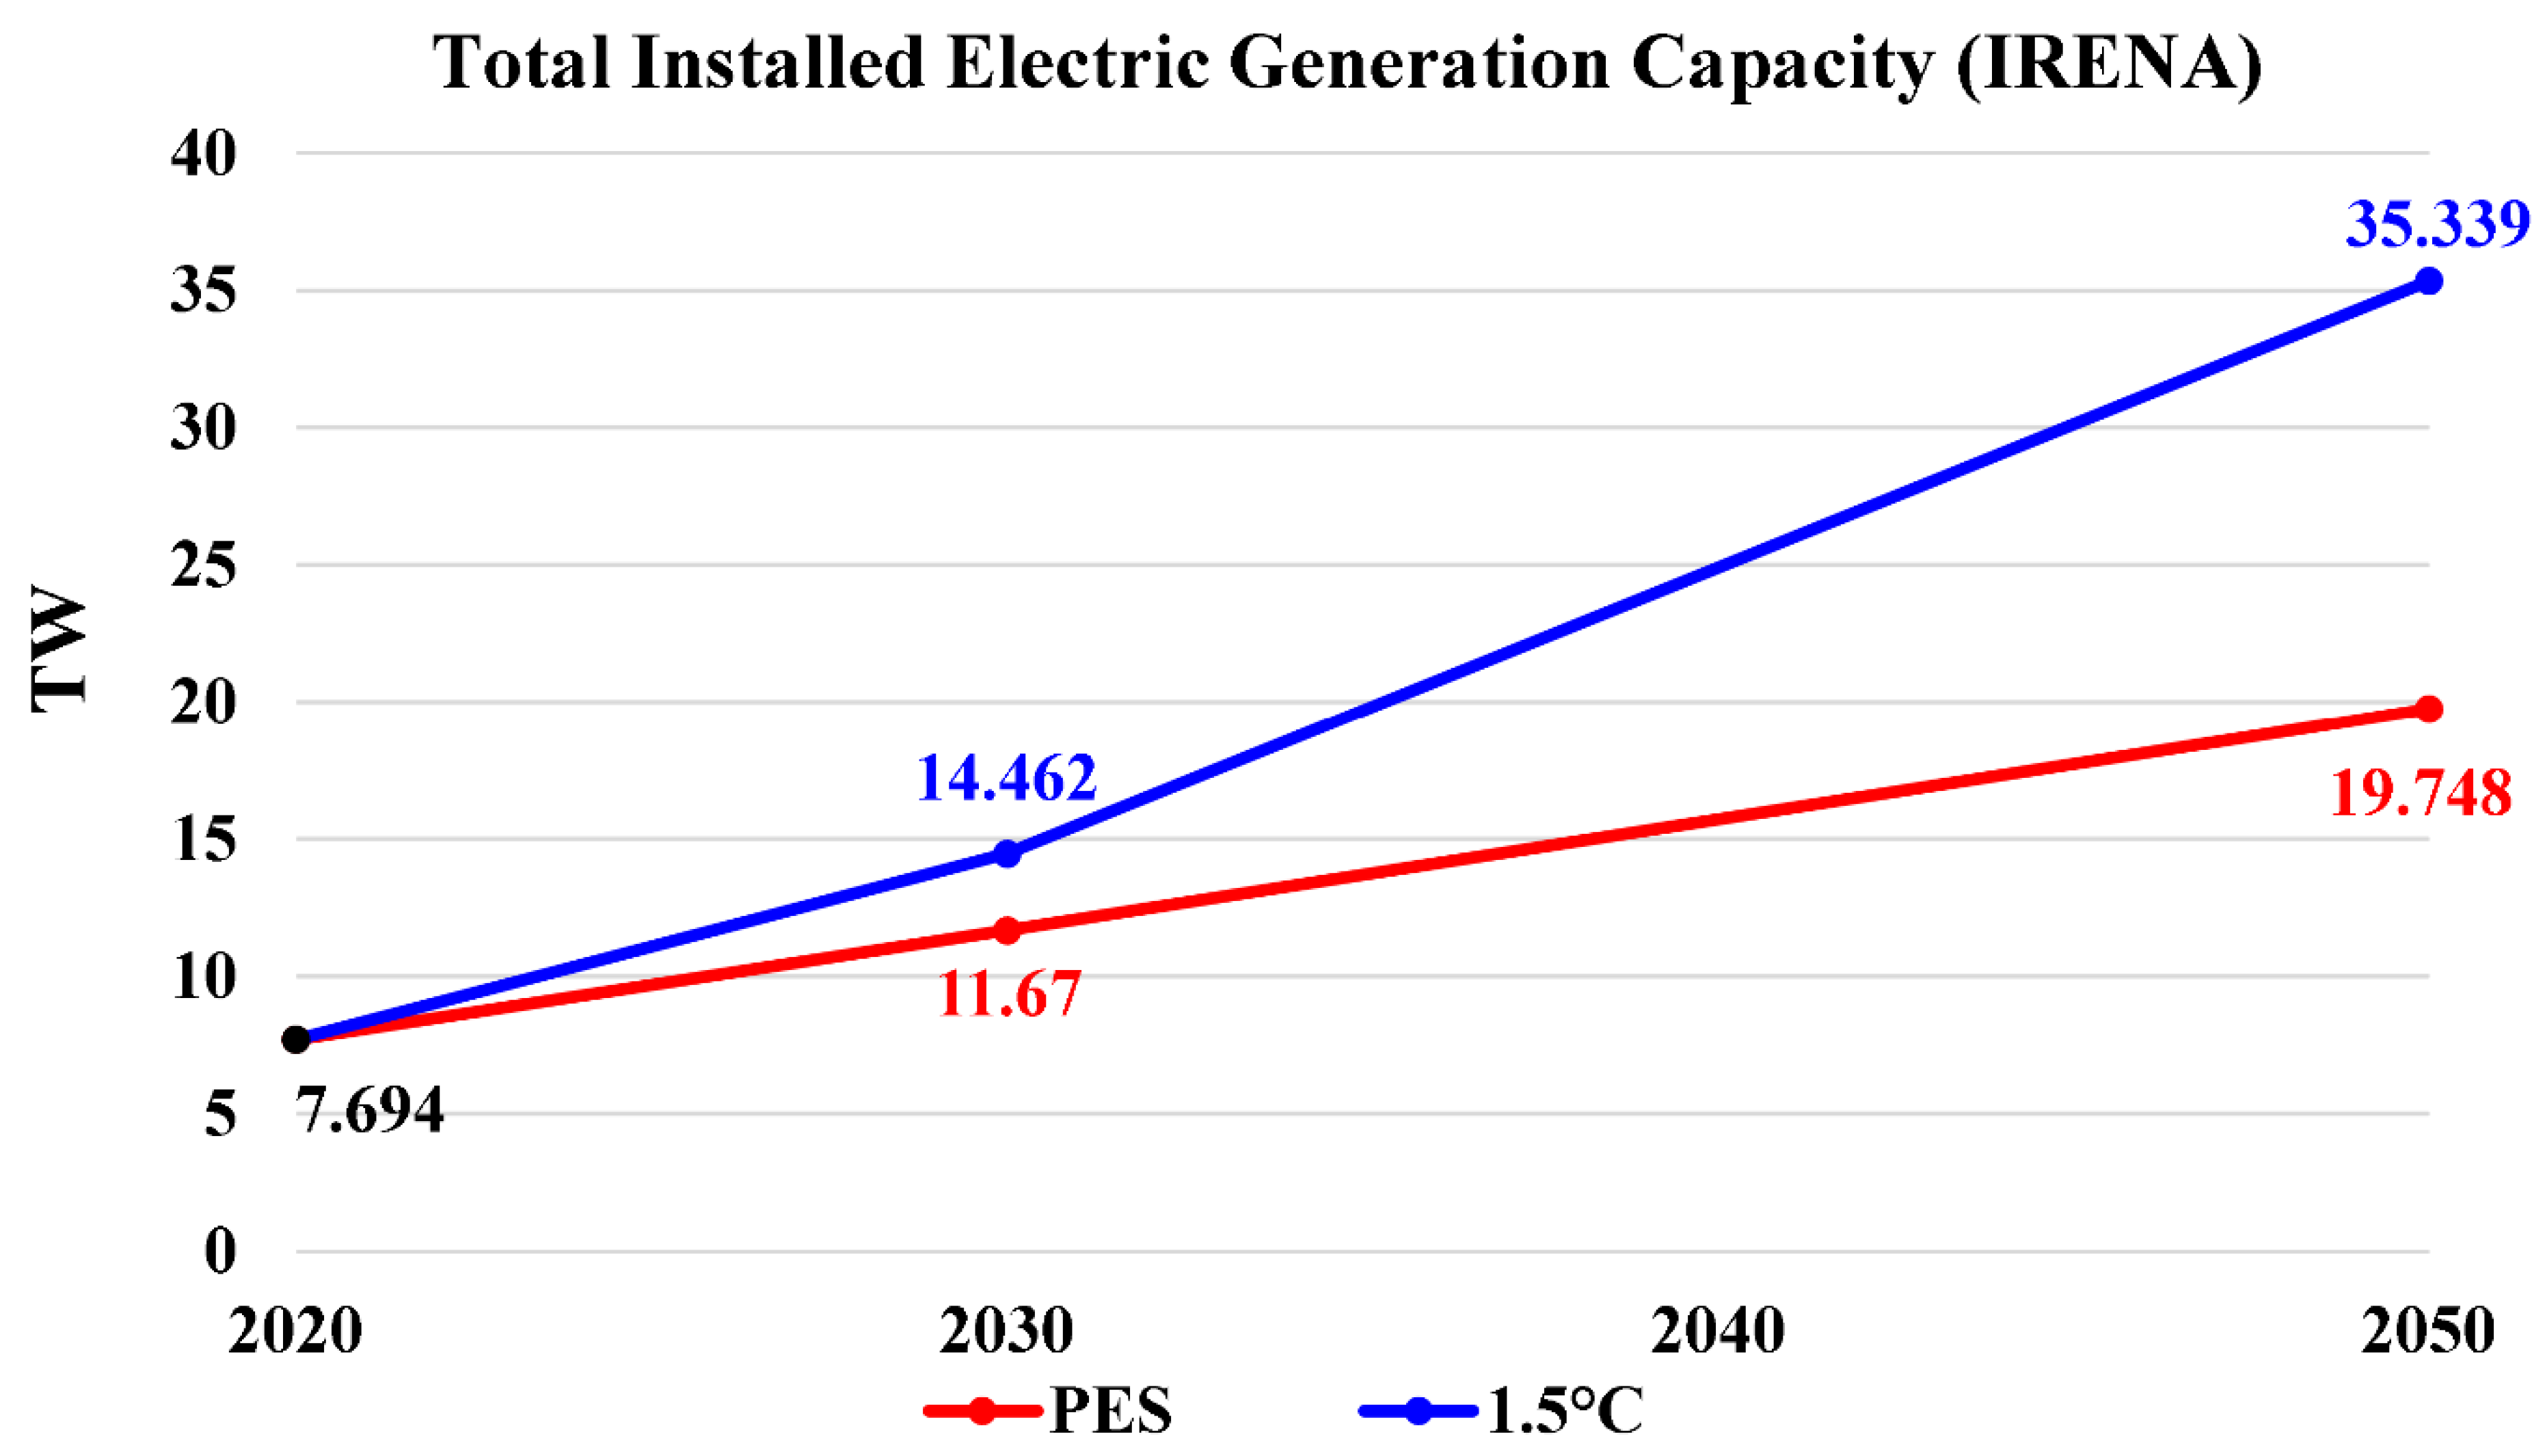
Figure 7.
Global total final consumption of energy (data source: IEA).
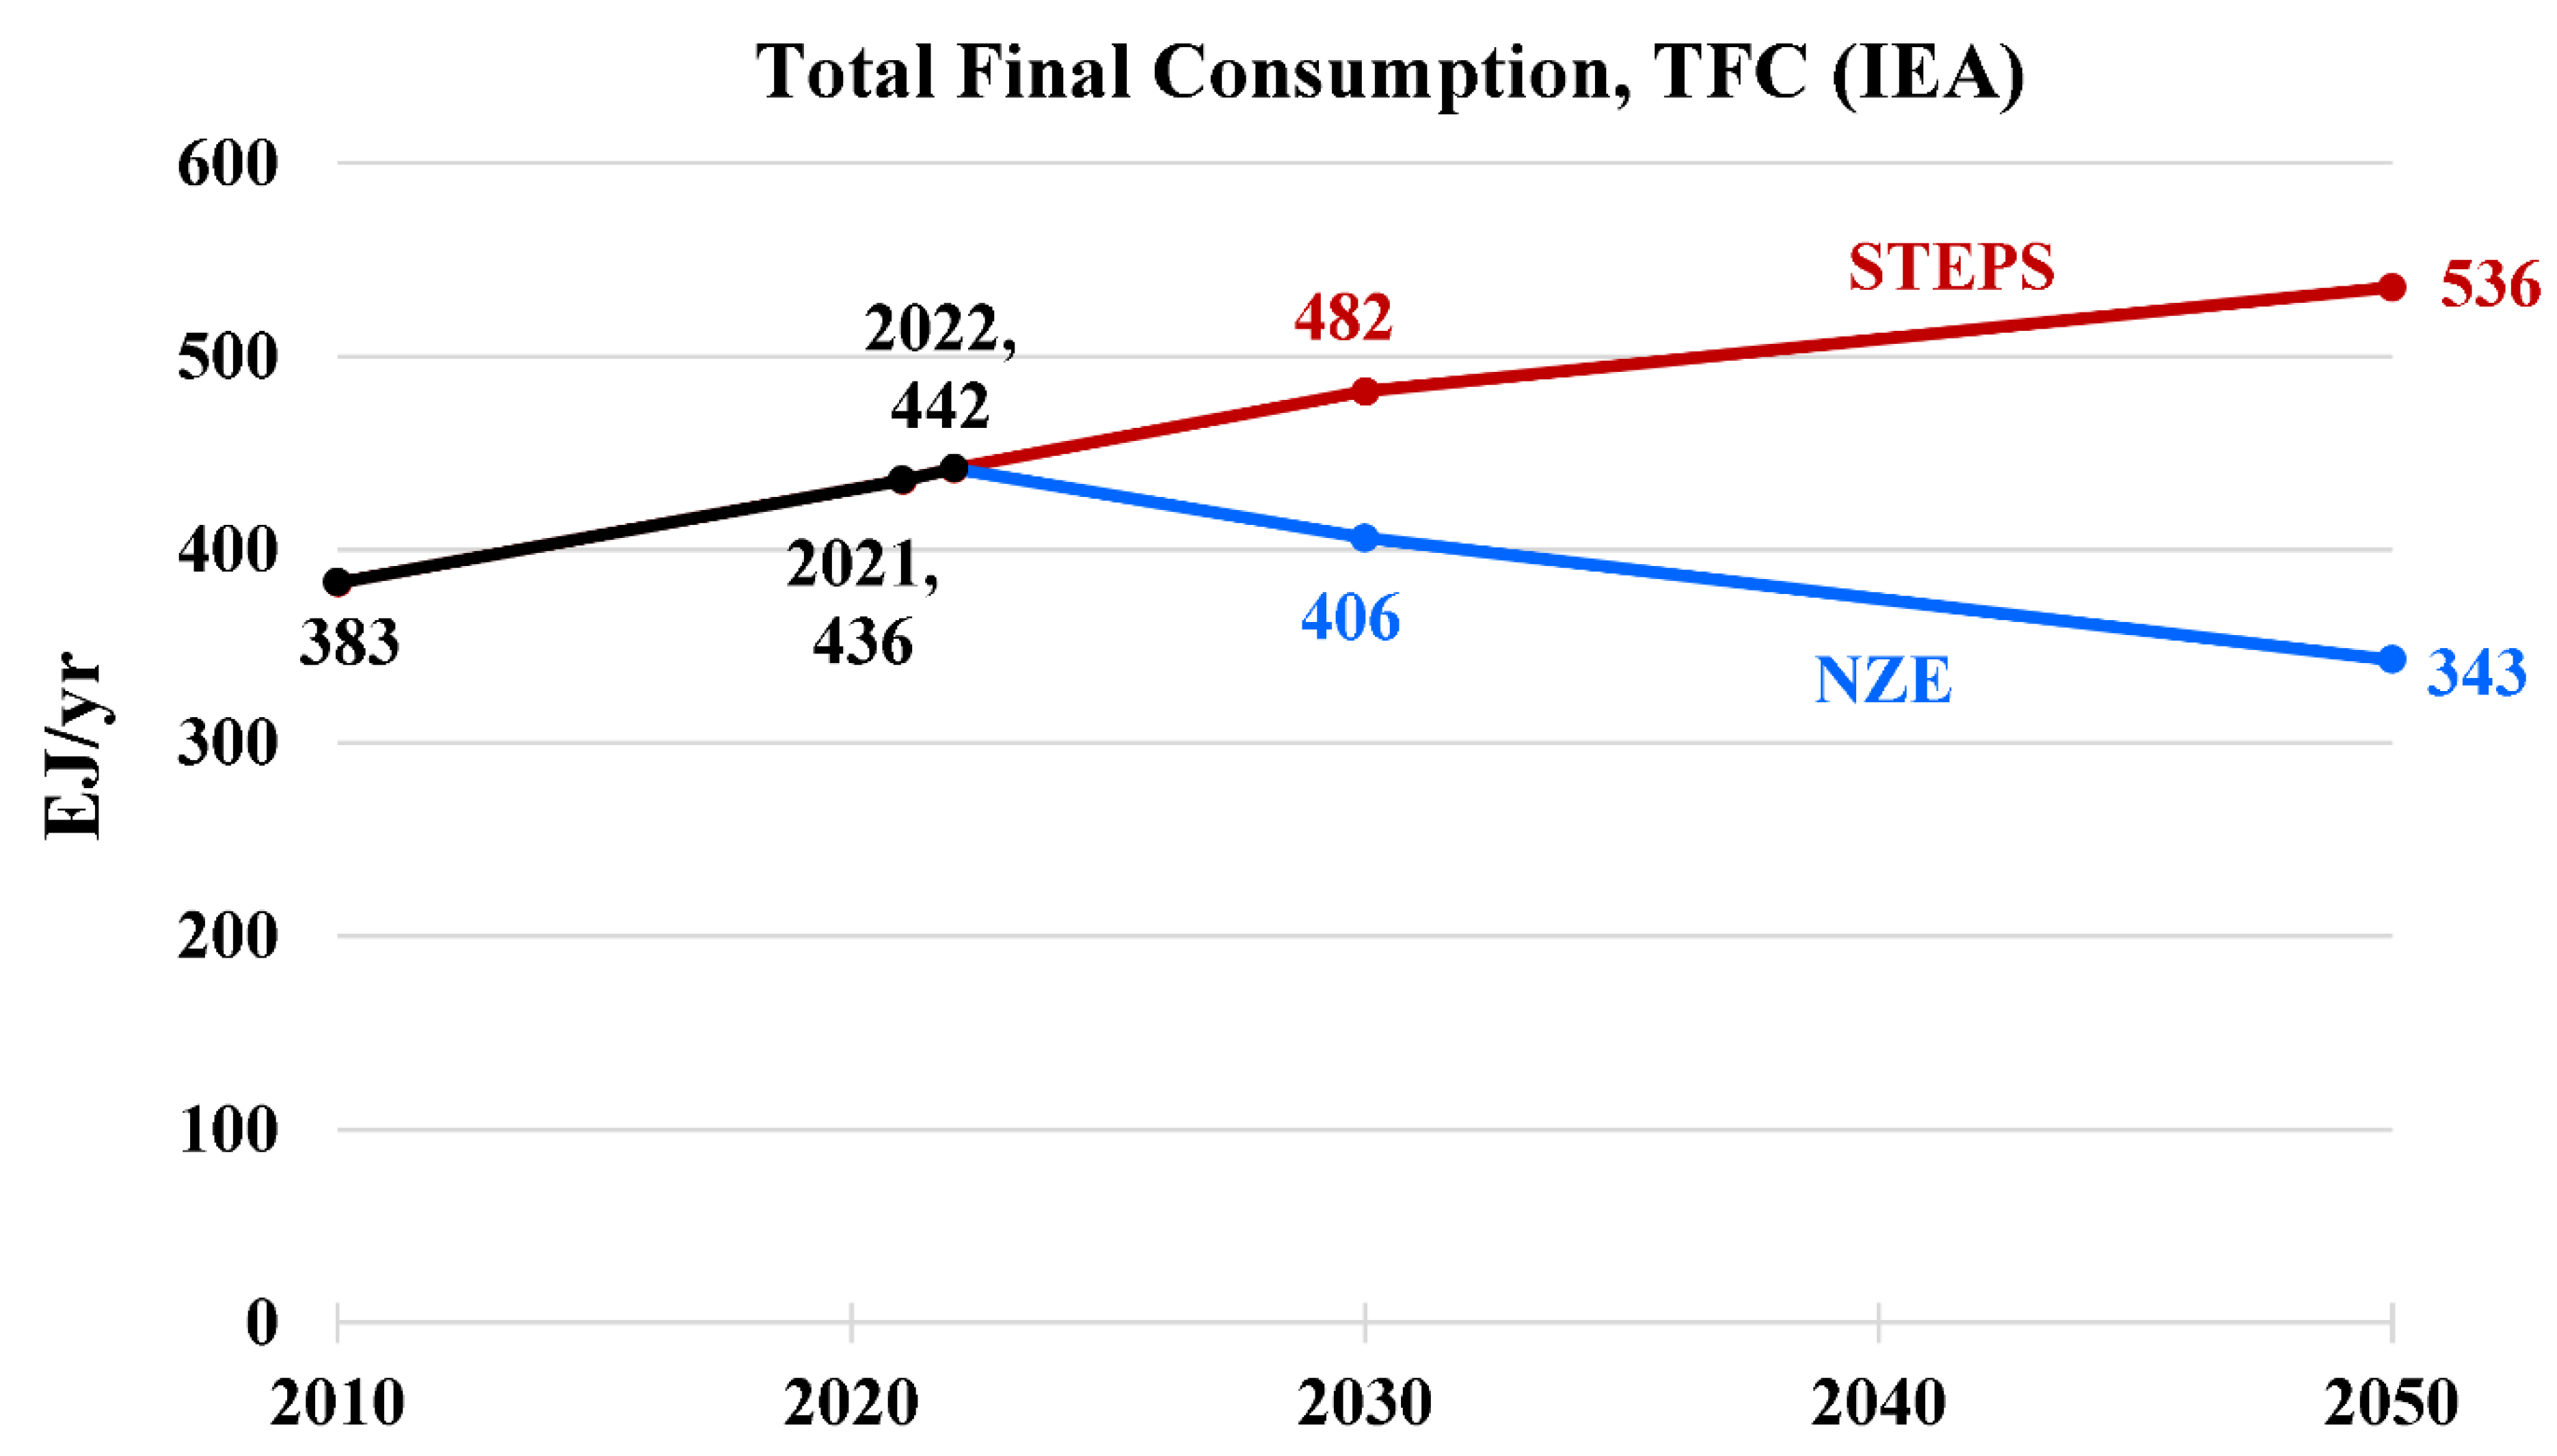
Figure 8.
Breakdown of the global total final energy consumption by energy carrier (data source: IRENA). Hydrogen in the figure refers to clean hydrogen (electrolysis-based green hydrogen and blue hydrogen). E-fuels in the figure refer to e-ammonia (green ammonia) and e-methanol (green methanol).
Figure 8.
Breakdown of the global total final energy consumption by energy carrier (data source: IRENA). Hydrogen in the figure refers to clean hydrogen (electrolysis-based green hydrogen and blue hydrogen). E-fuels in the figure refer to e-ammonia (green ammonia) and e-methanol (green methanol).
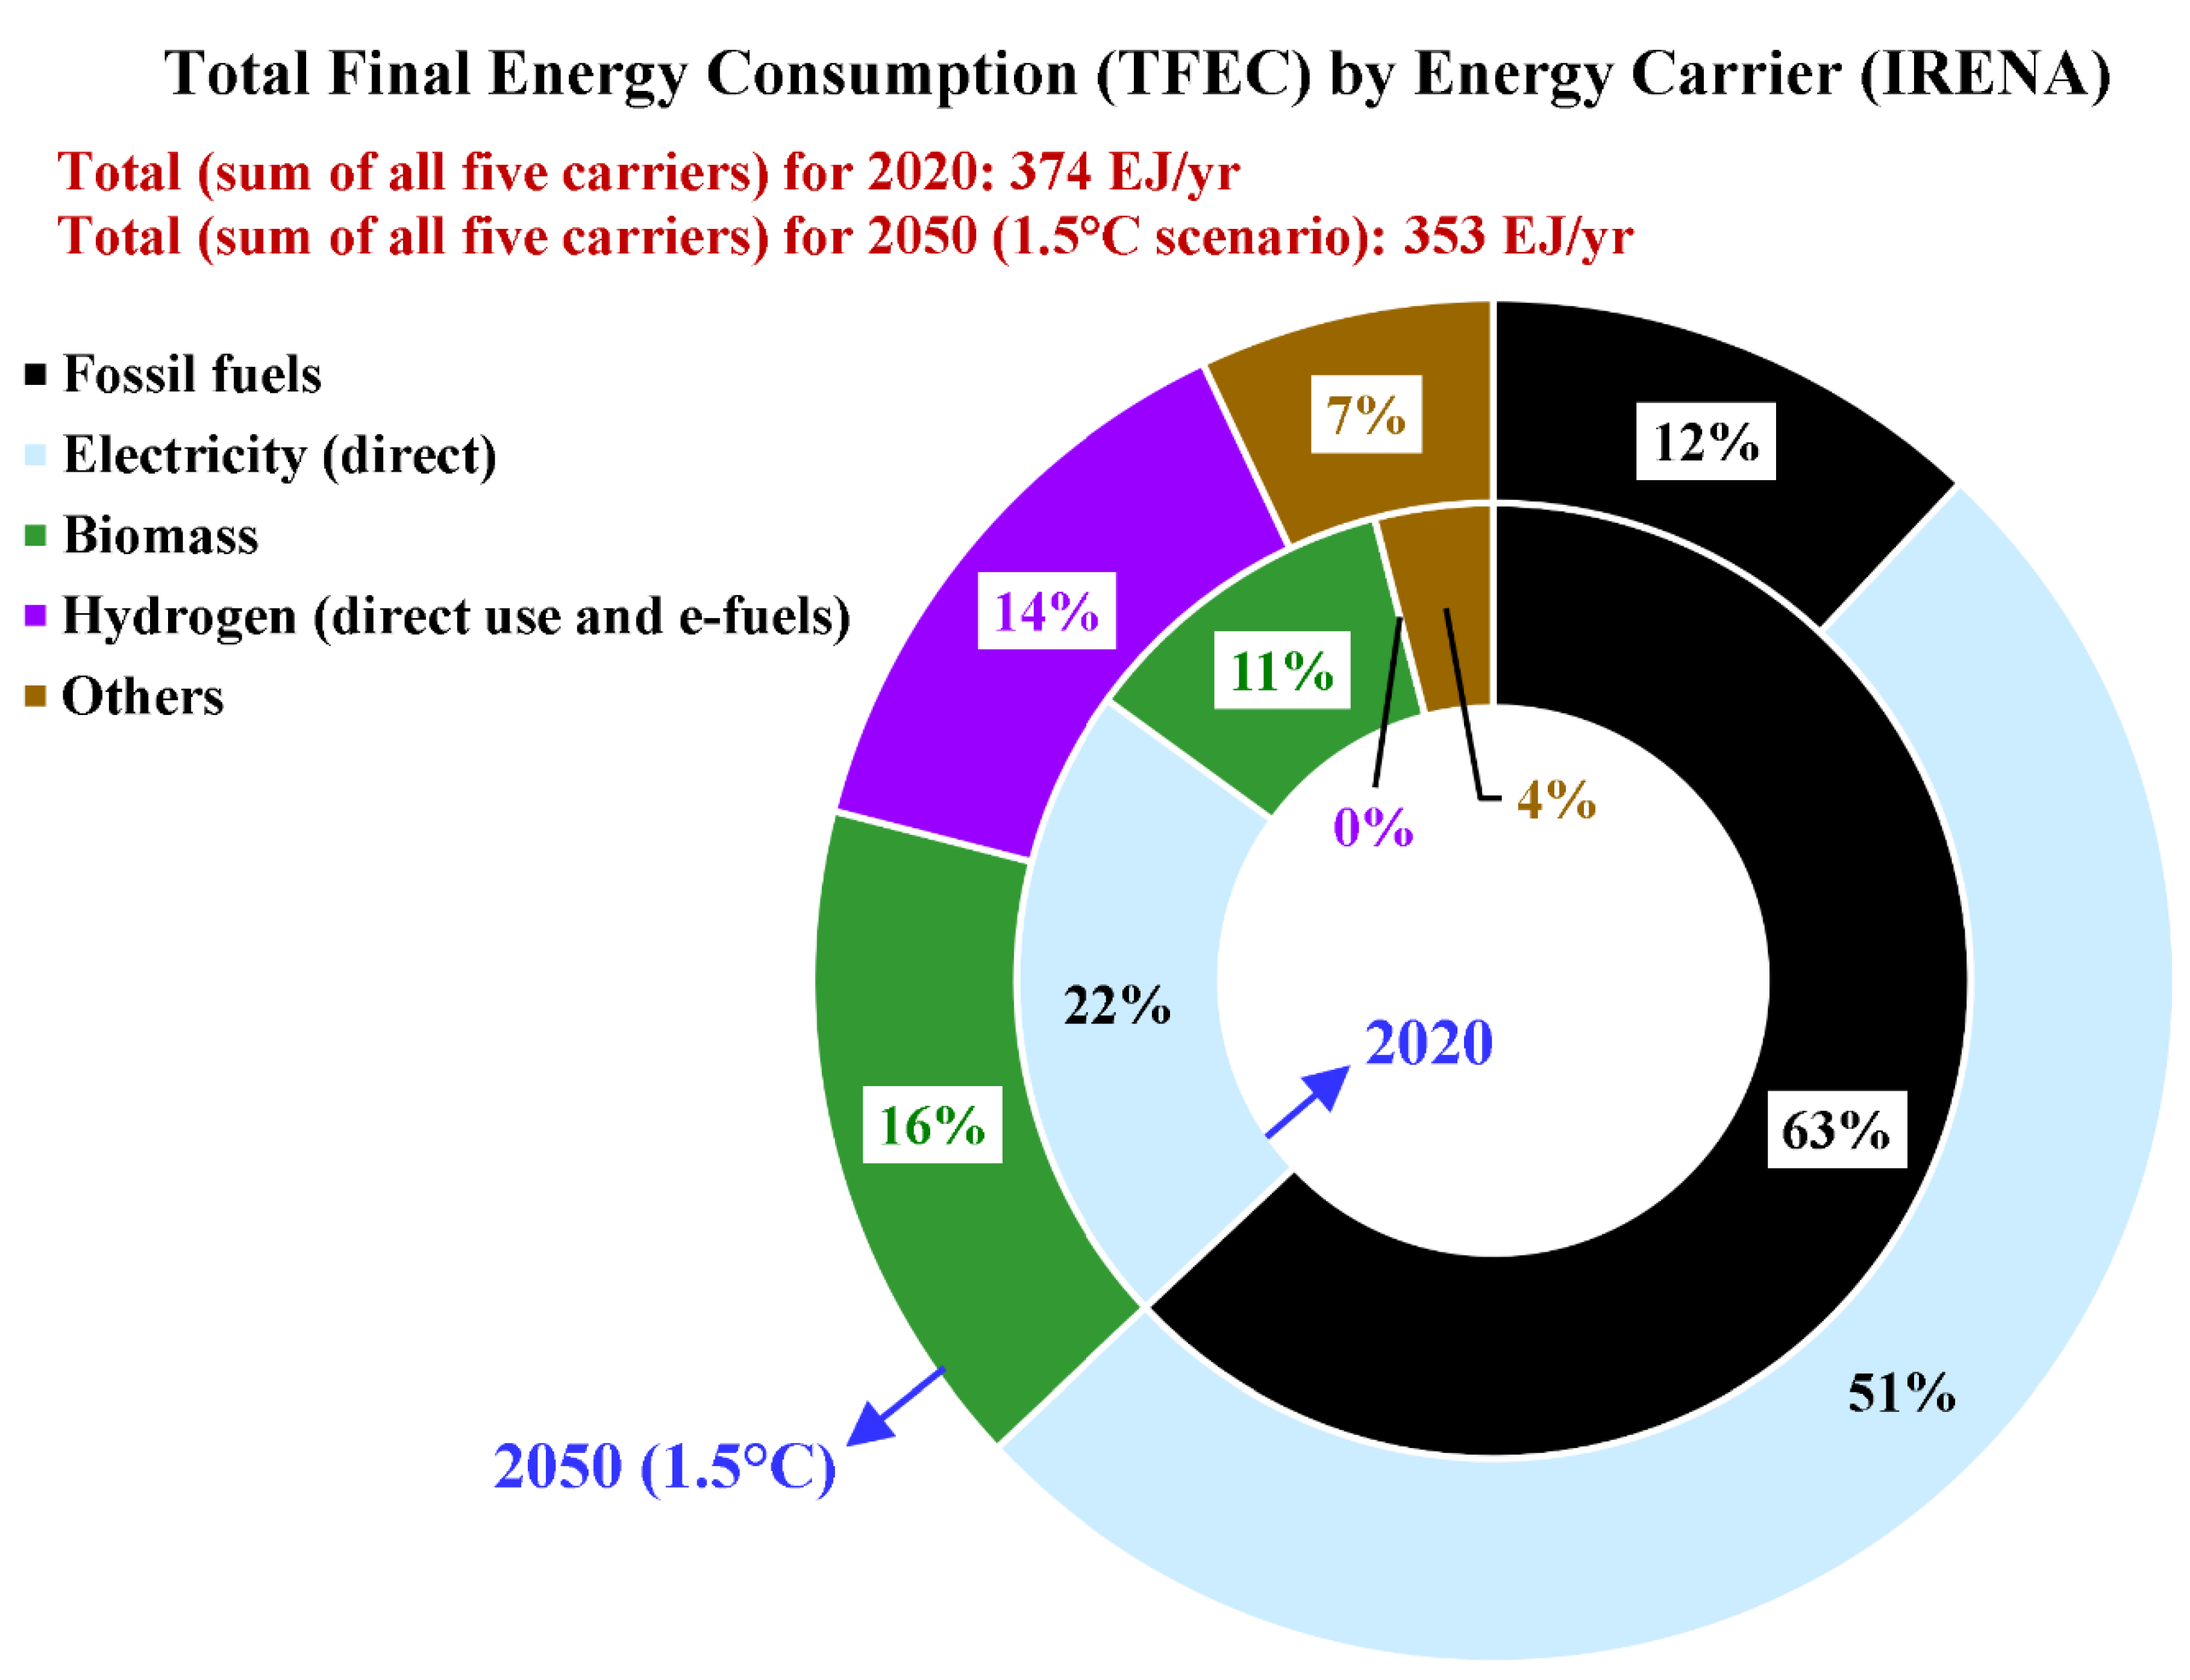
Figure 9.
World population (data source: IEA).
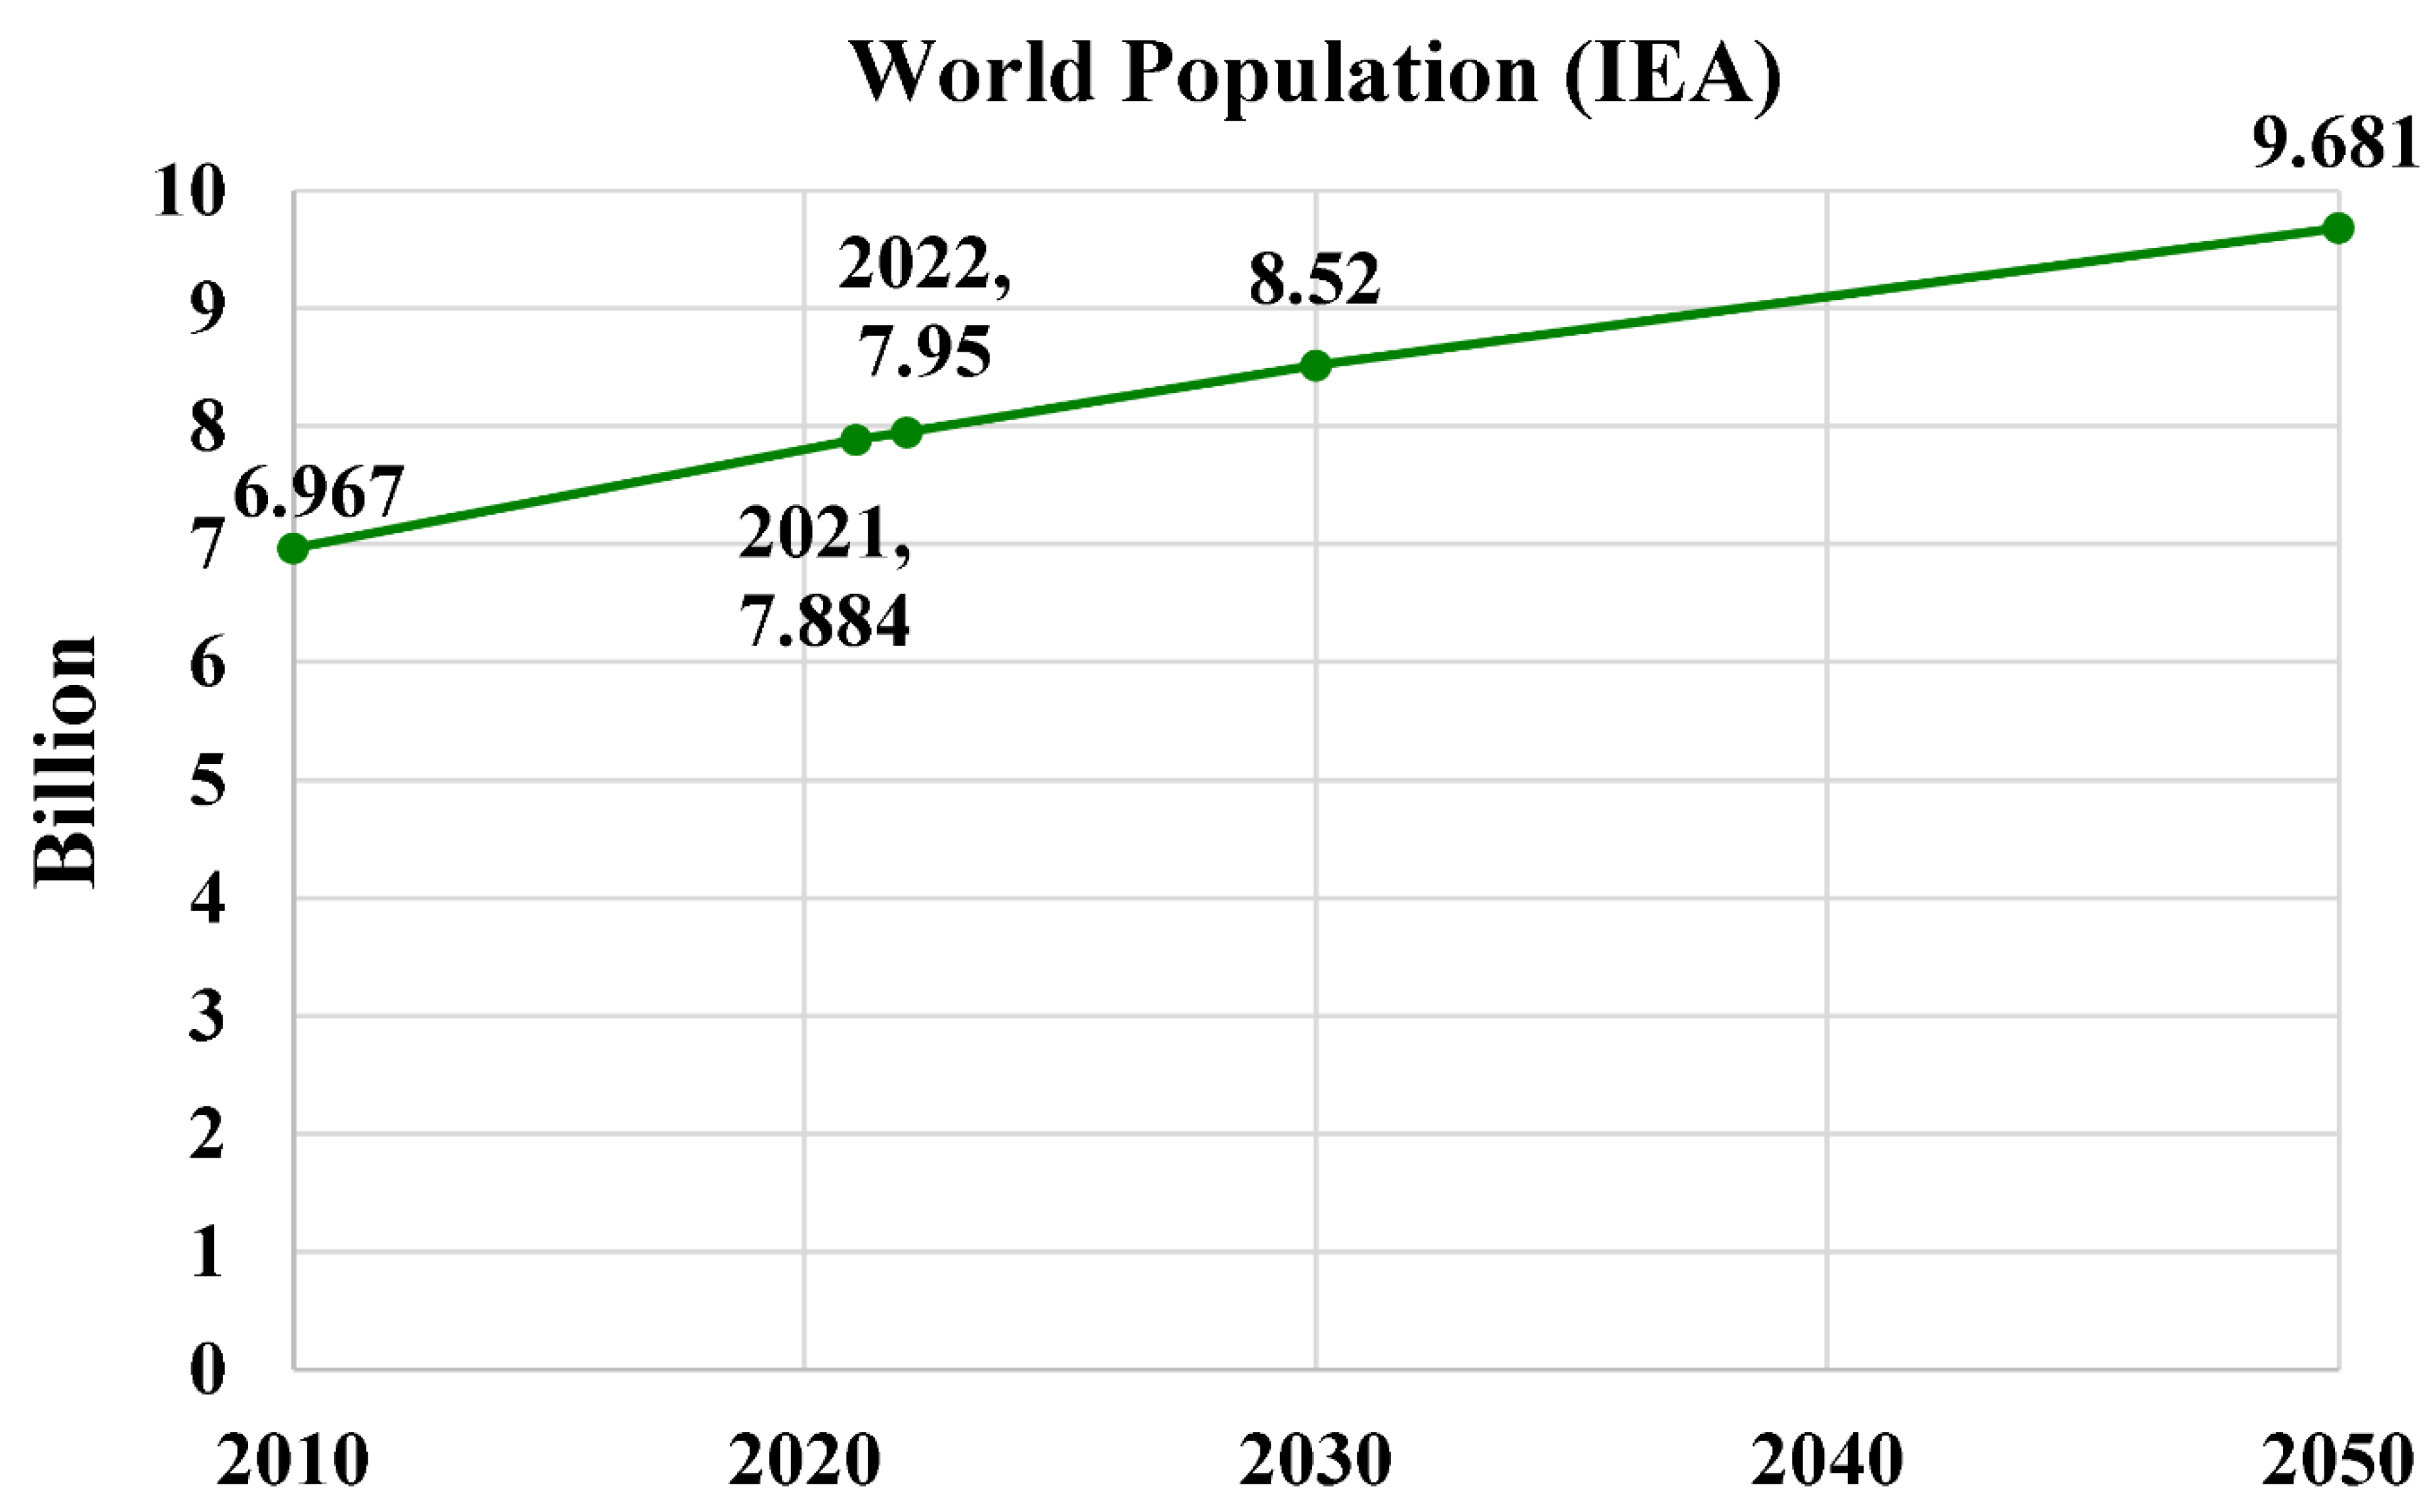
Figure 10.
Global CO₂ intensity of electricity generation (data source: IEA).
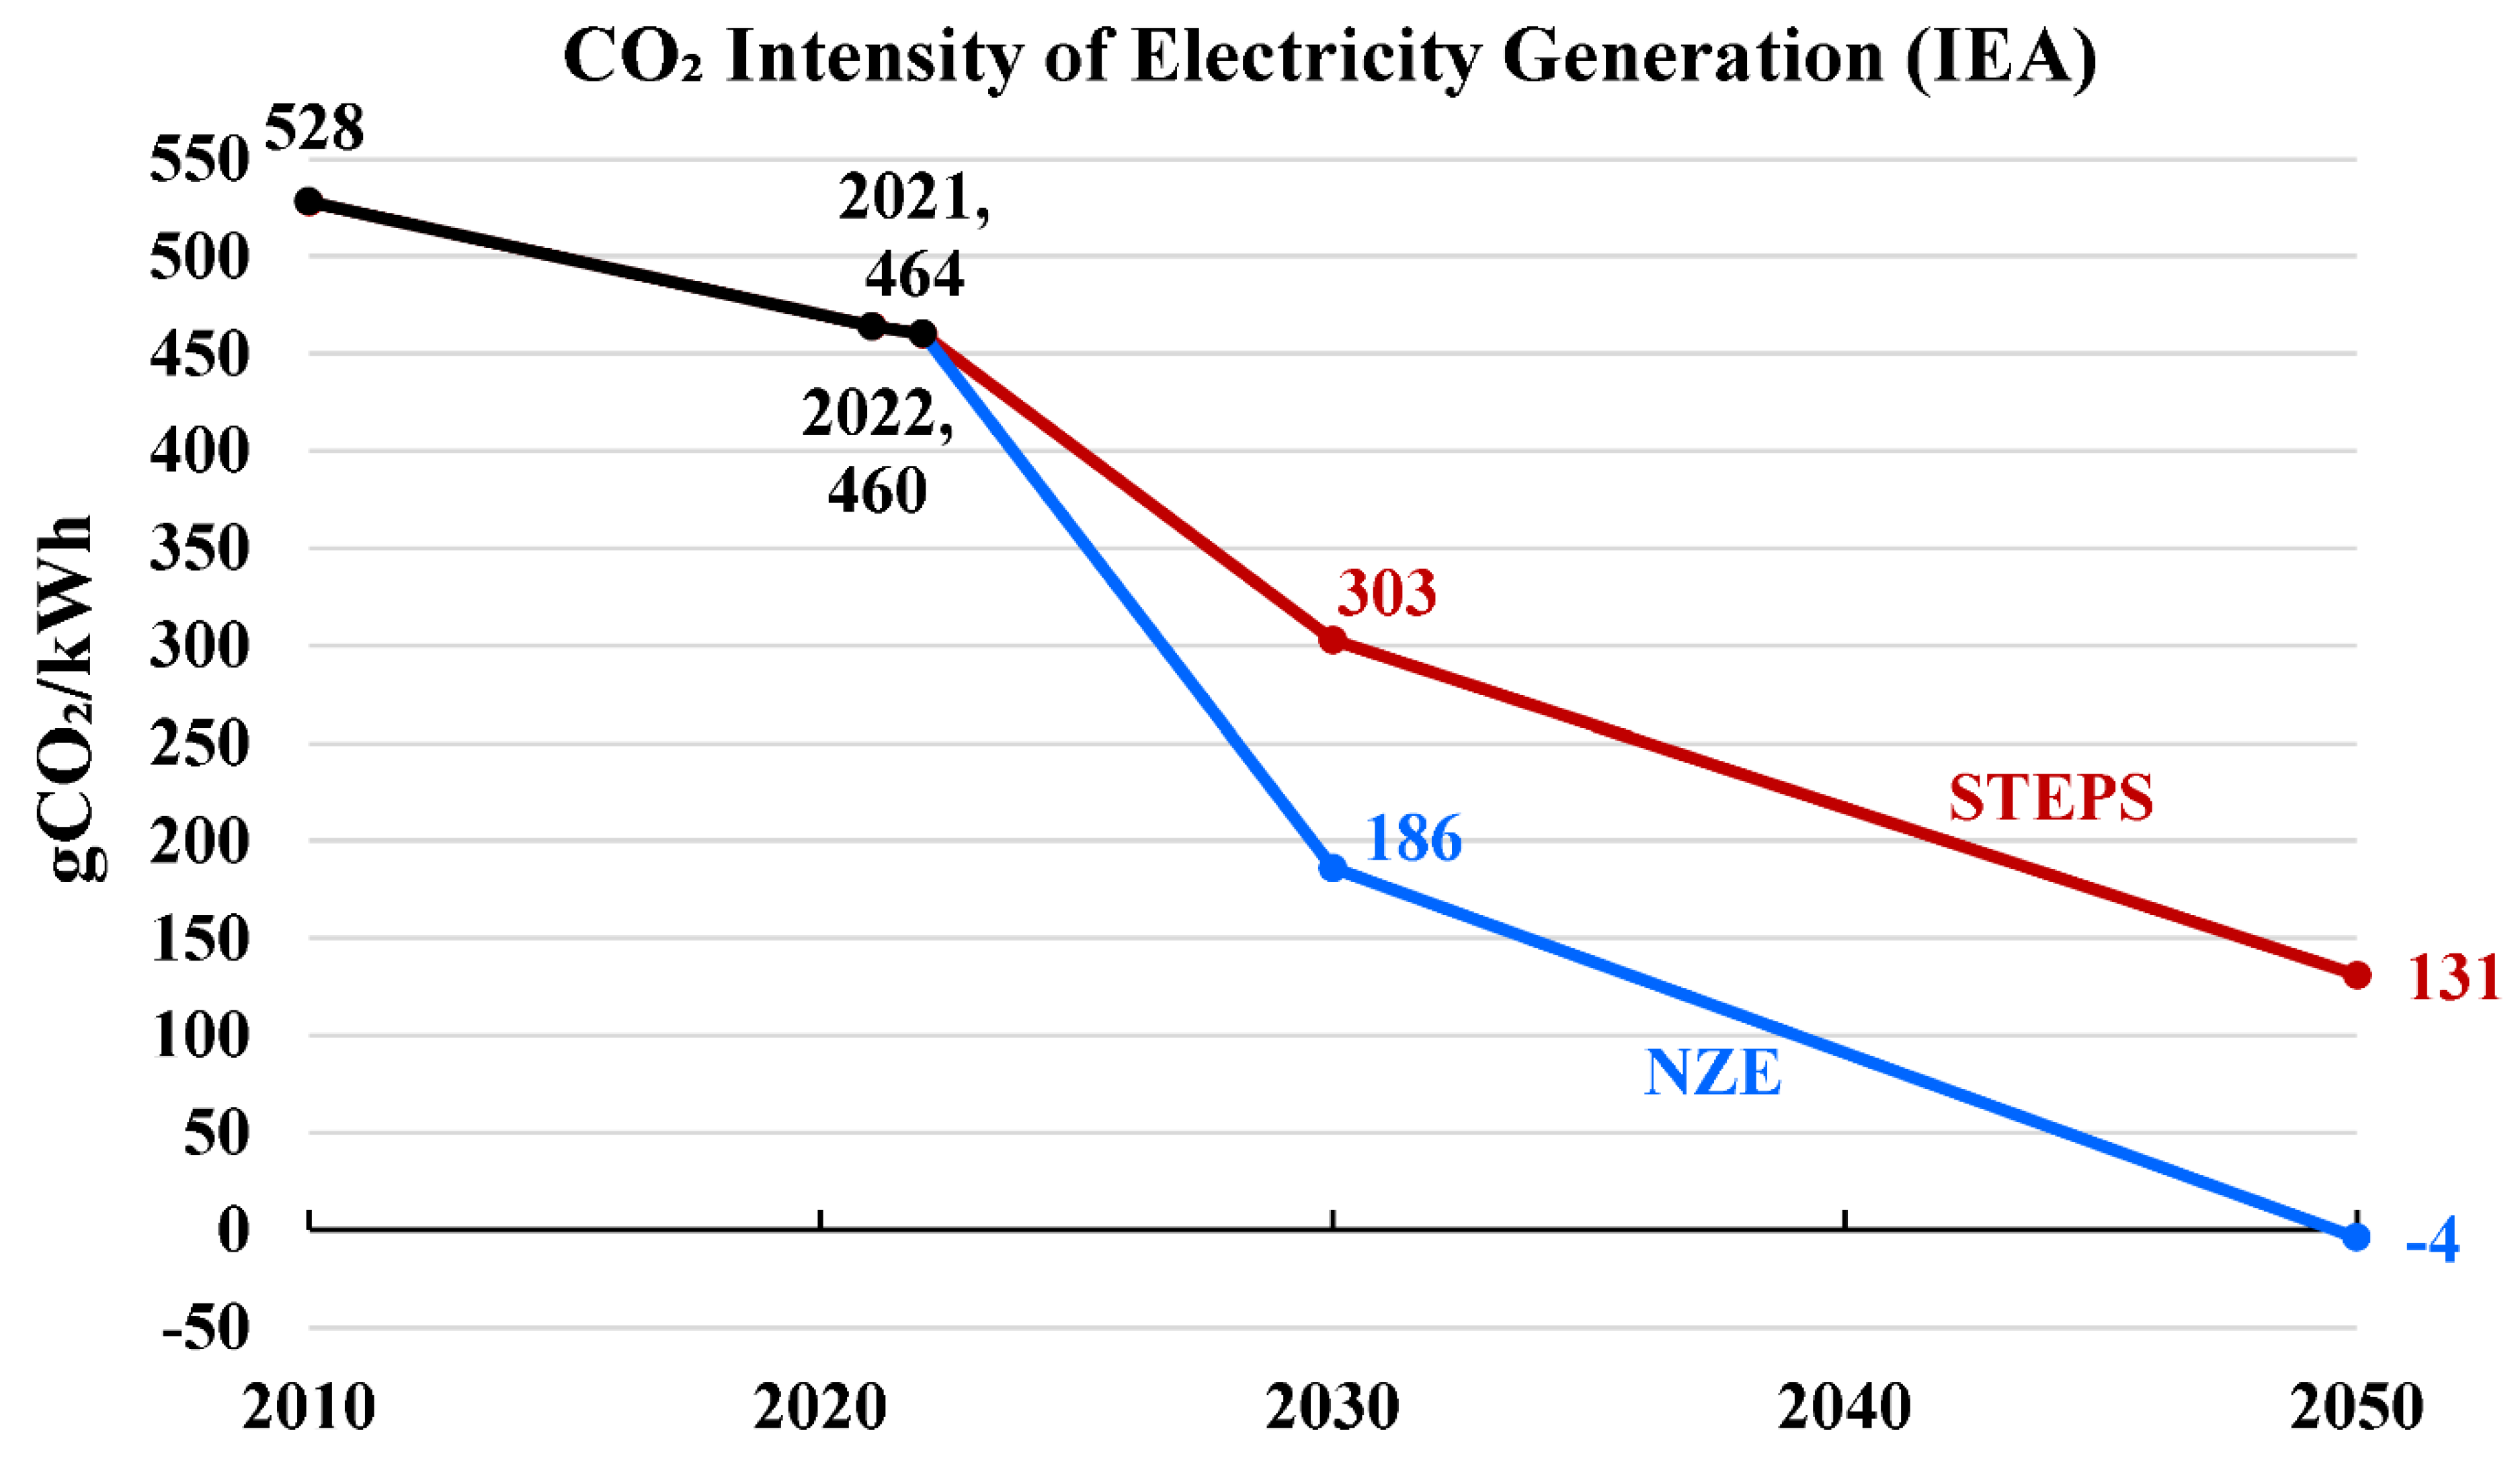
Figure 11.
Global demand for conventional crude oil (data source: IEA).
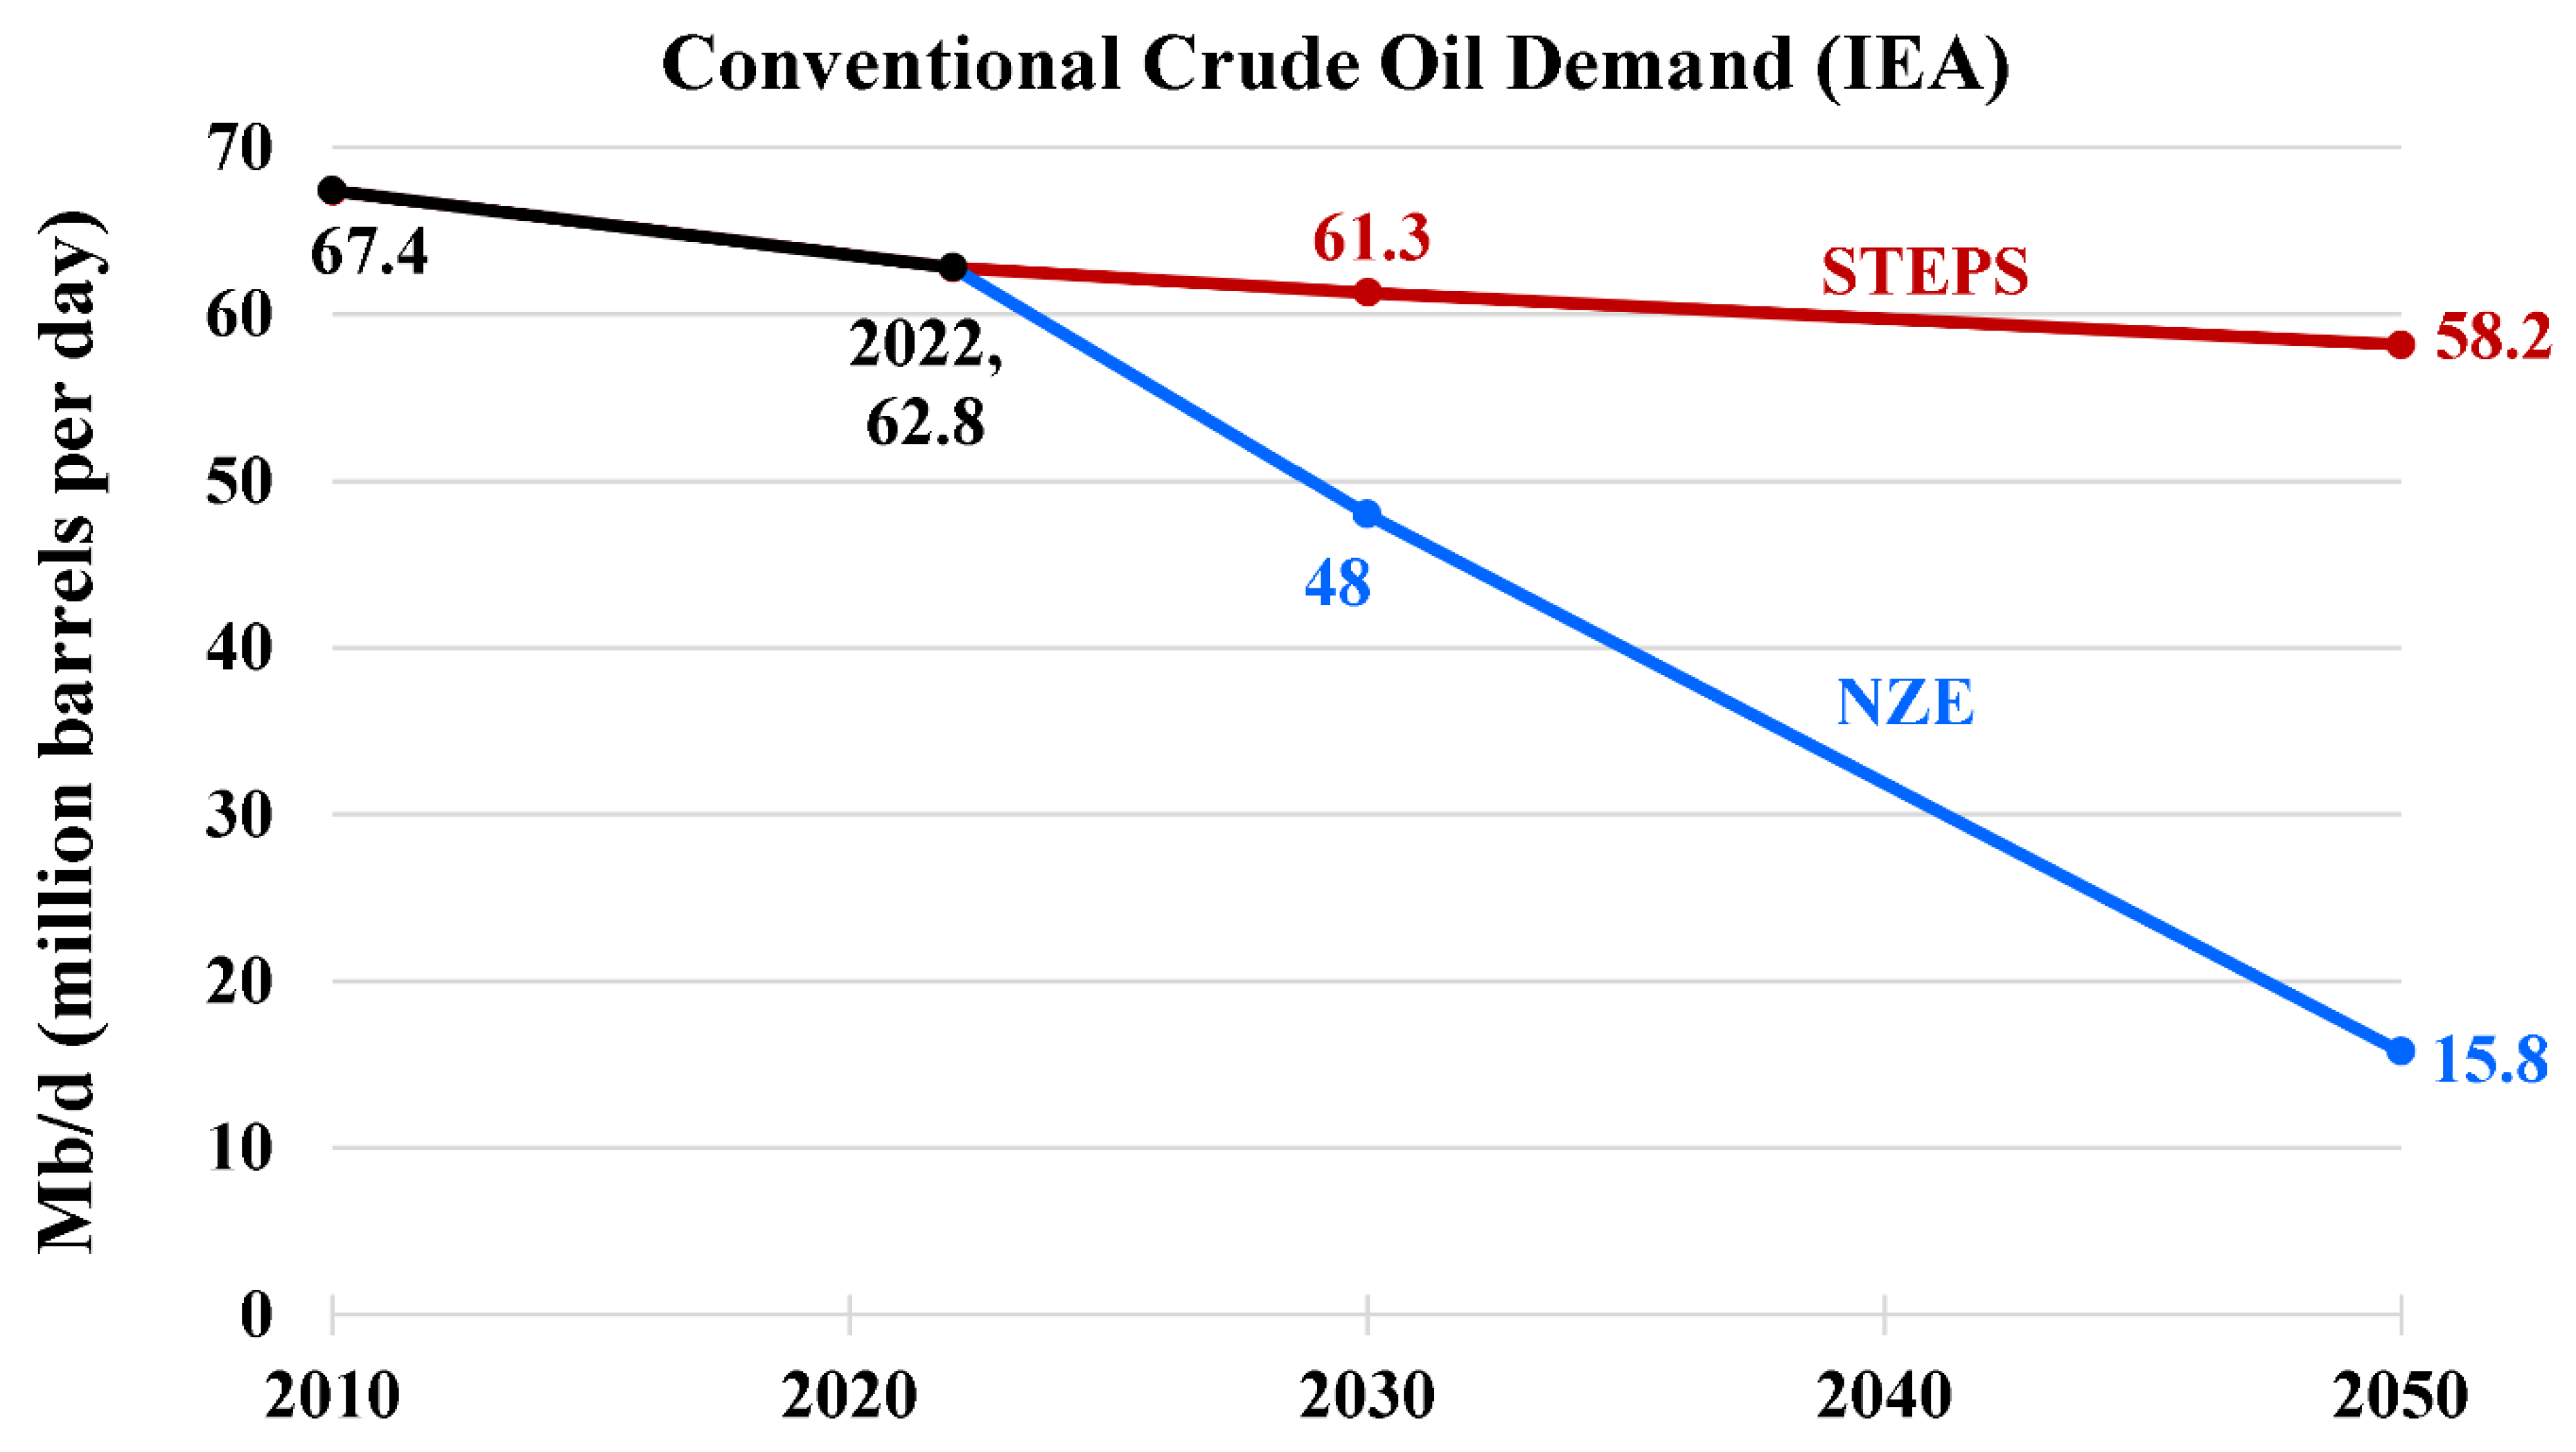
Figure 12.
Global electricity generation from renewables, and its share in total electricity generation (data source: IRENA).
Figure 12.
Global electricity generation from renewables, and its share in total electricity generation (data source: IRENA).
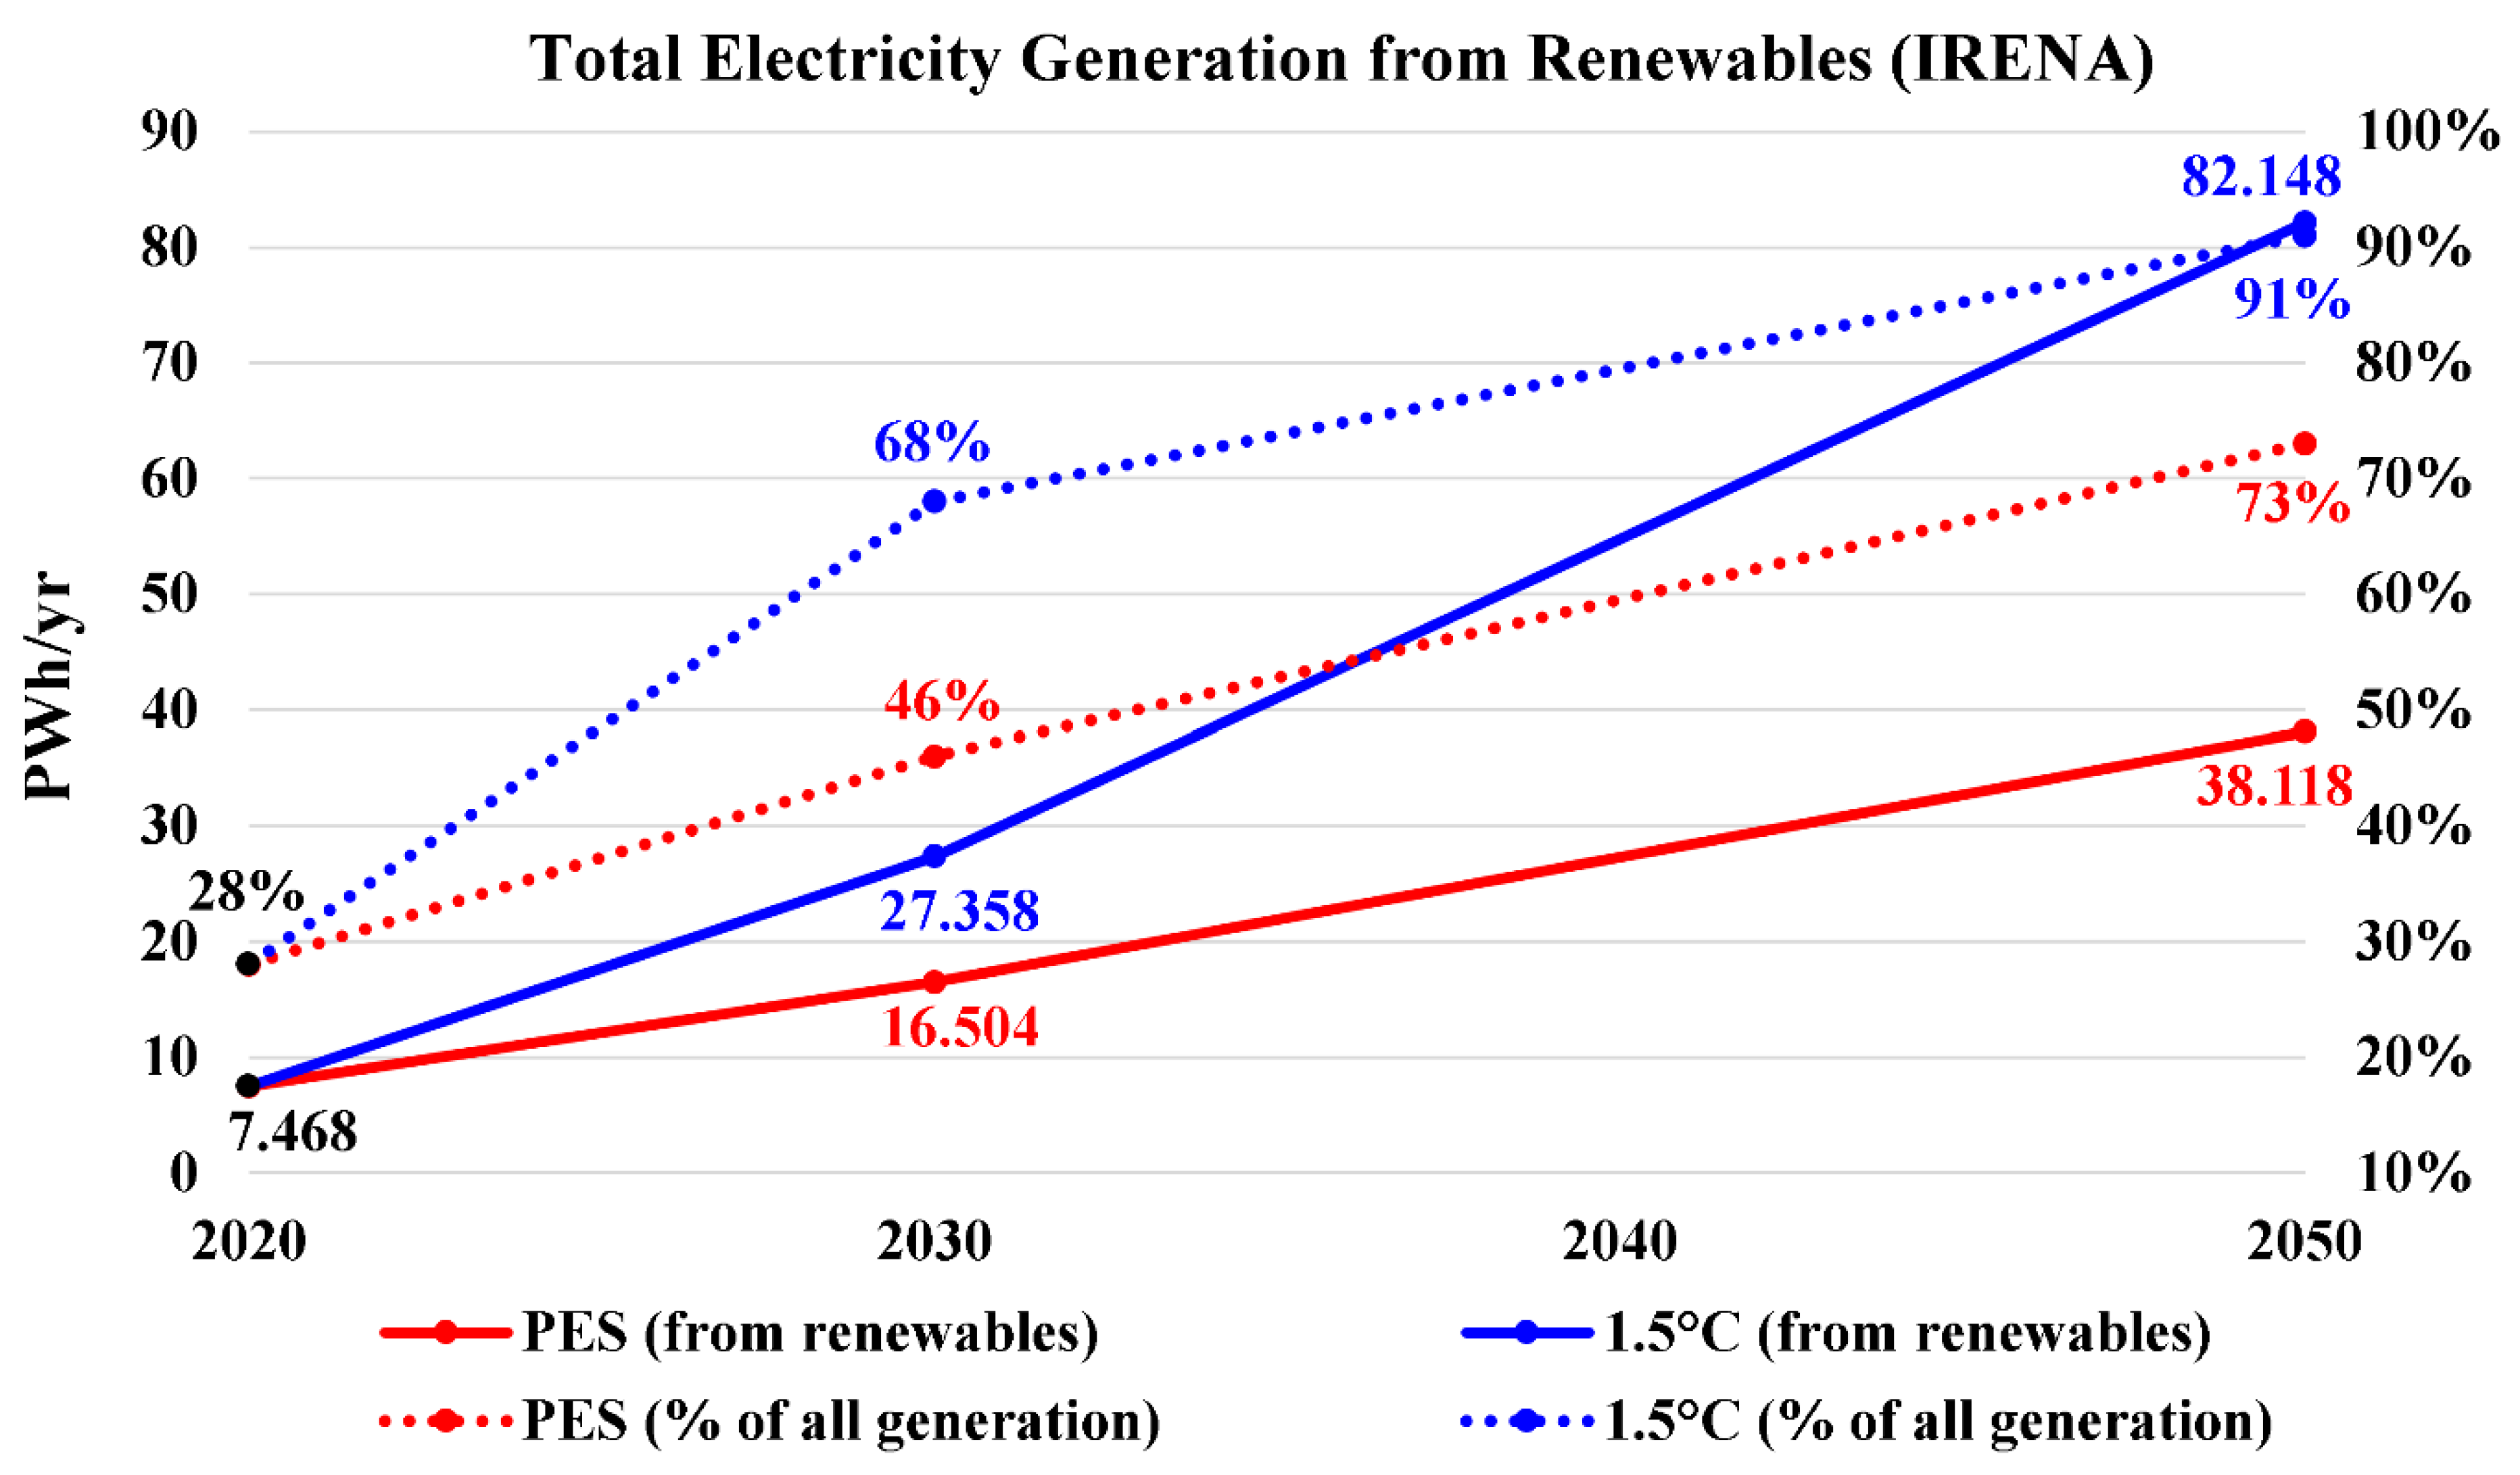
Figure 13.
Global total installed electricity capacity by renewables, and its share in total electricity capacity (data source: IRENA).
Figure 13.
Global total installed electricity capacity by renewables, and its share in total electricity capacity (data source: IRENA).
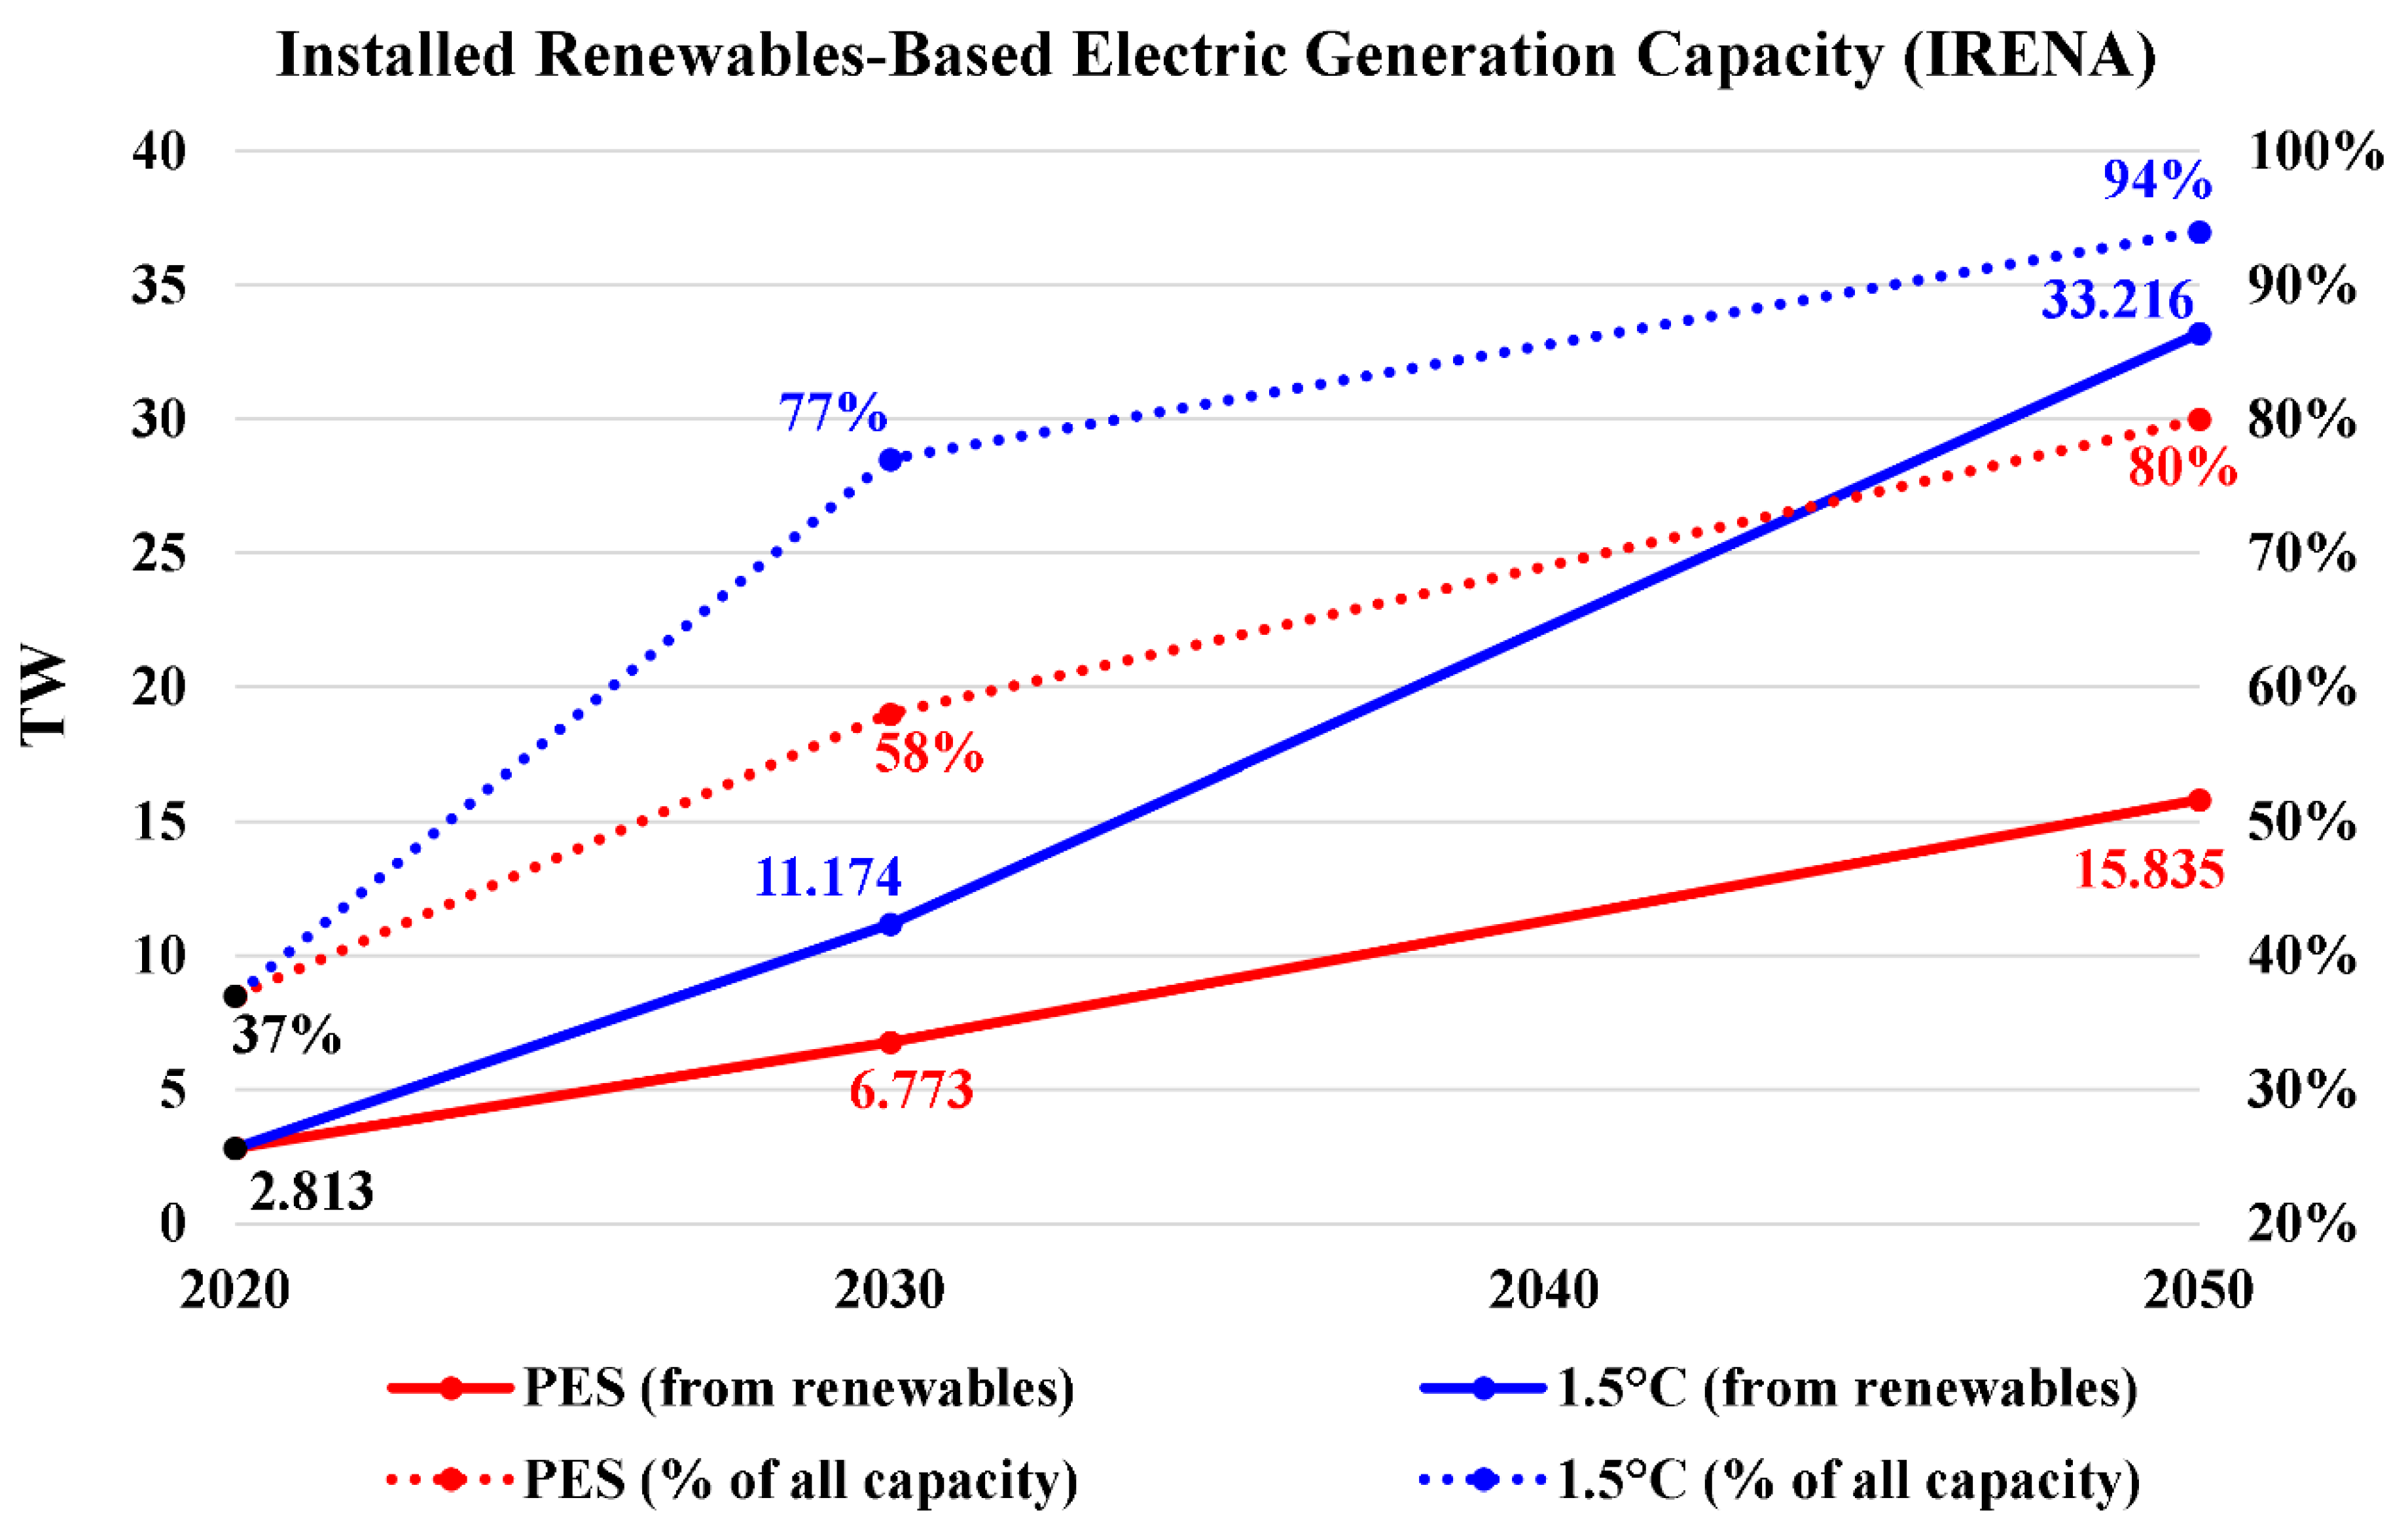
Figure 14.
Breakdown of total electricity generation by source (data source: IRENA).
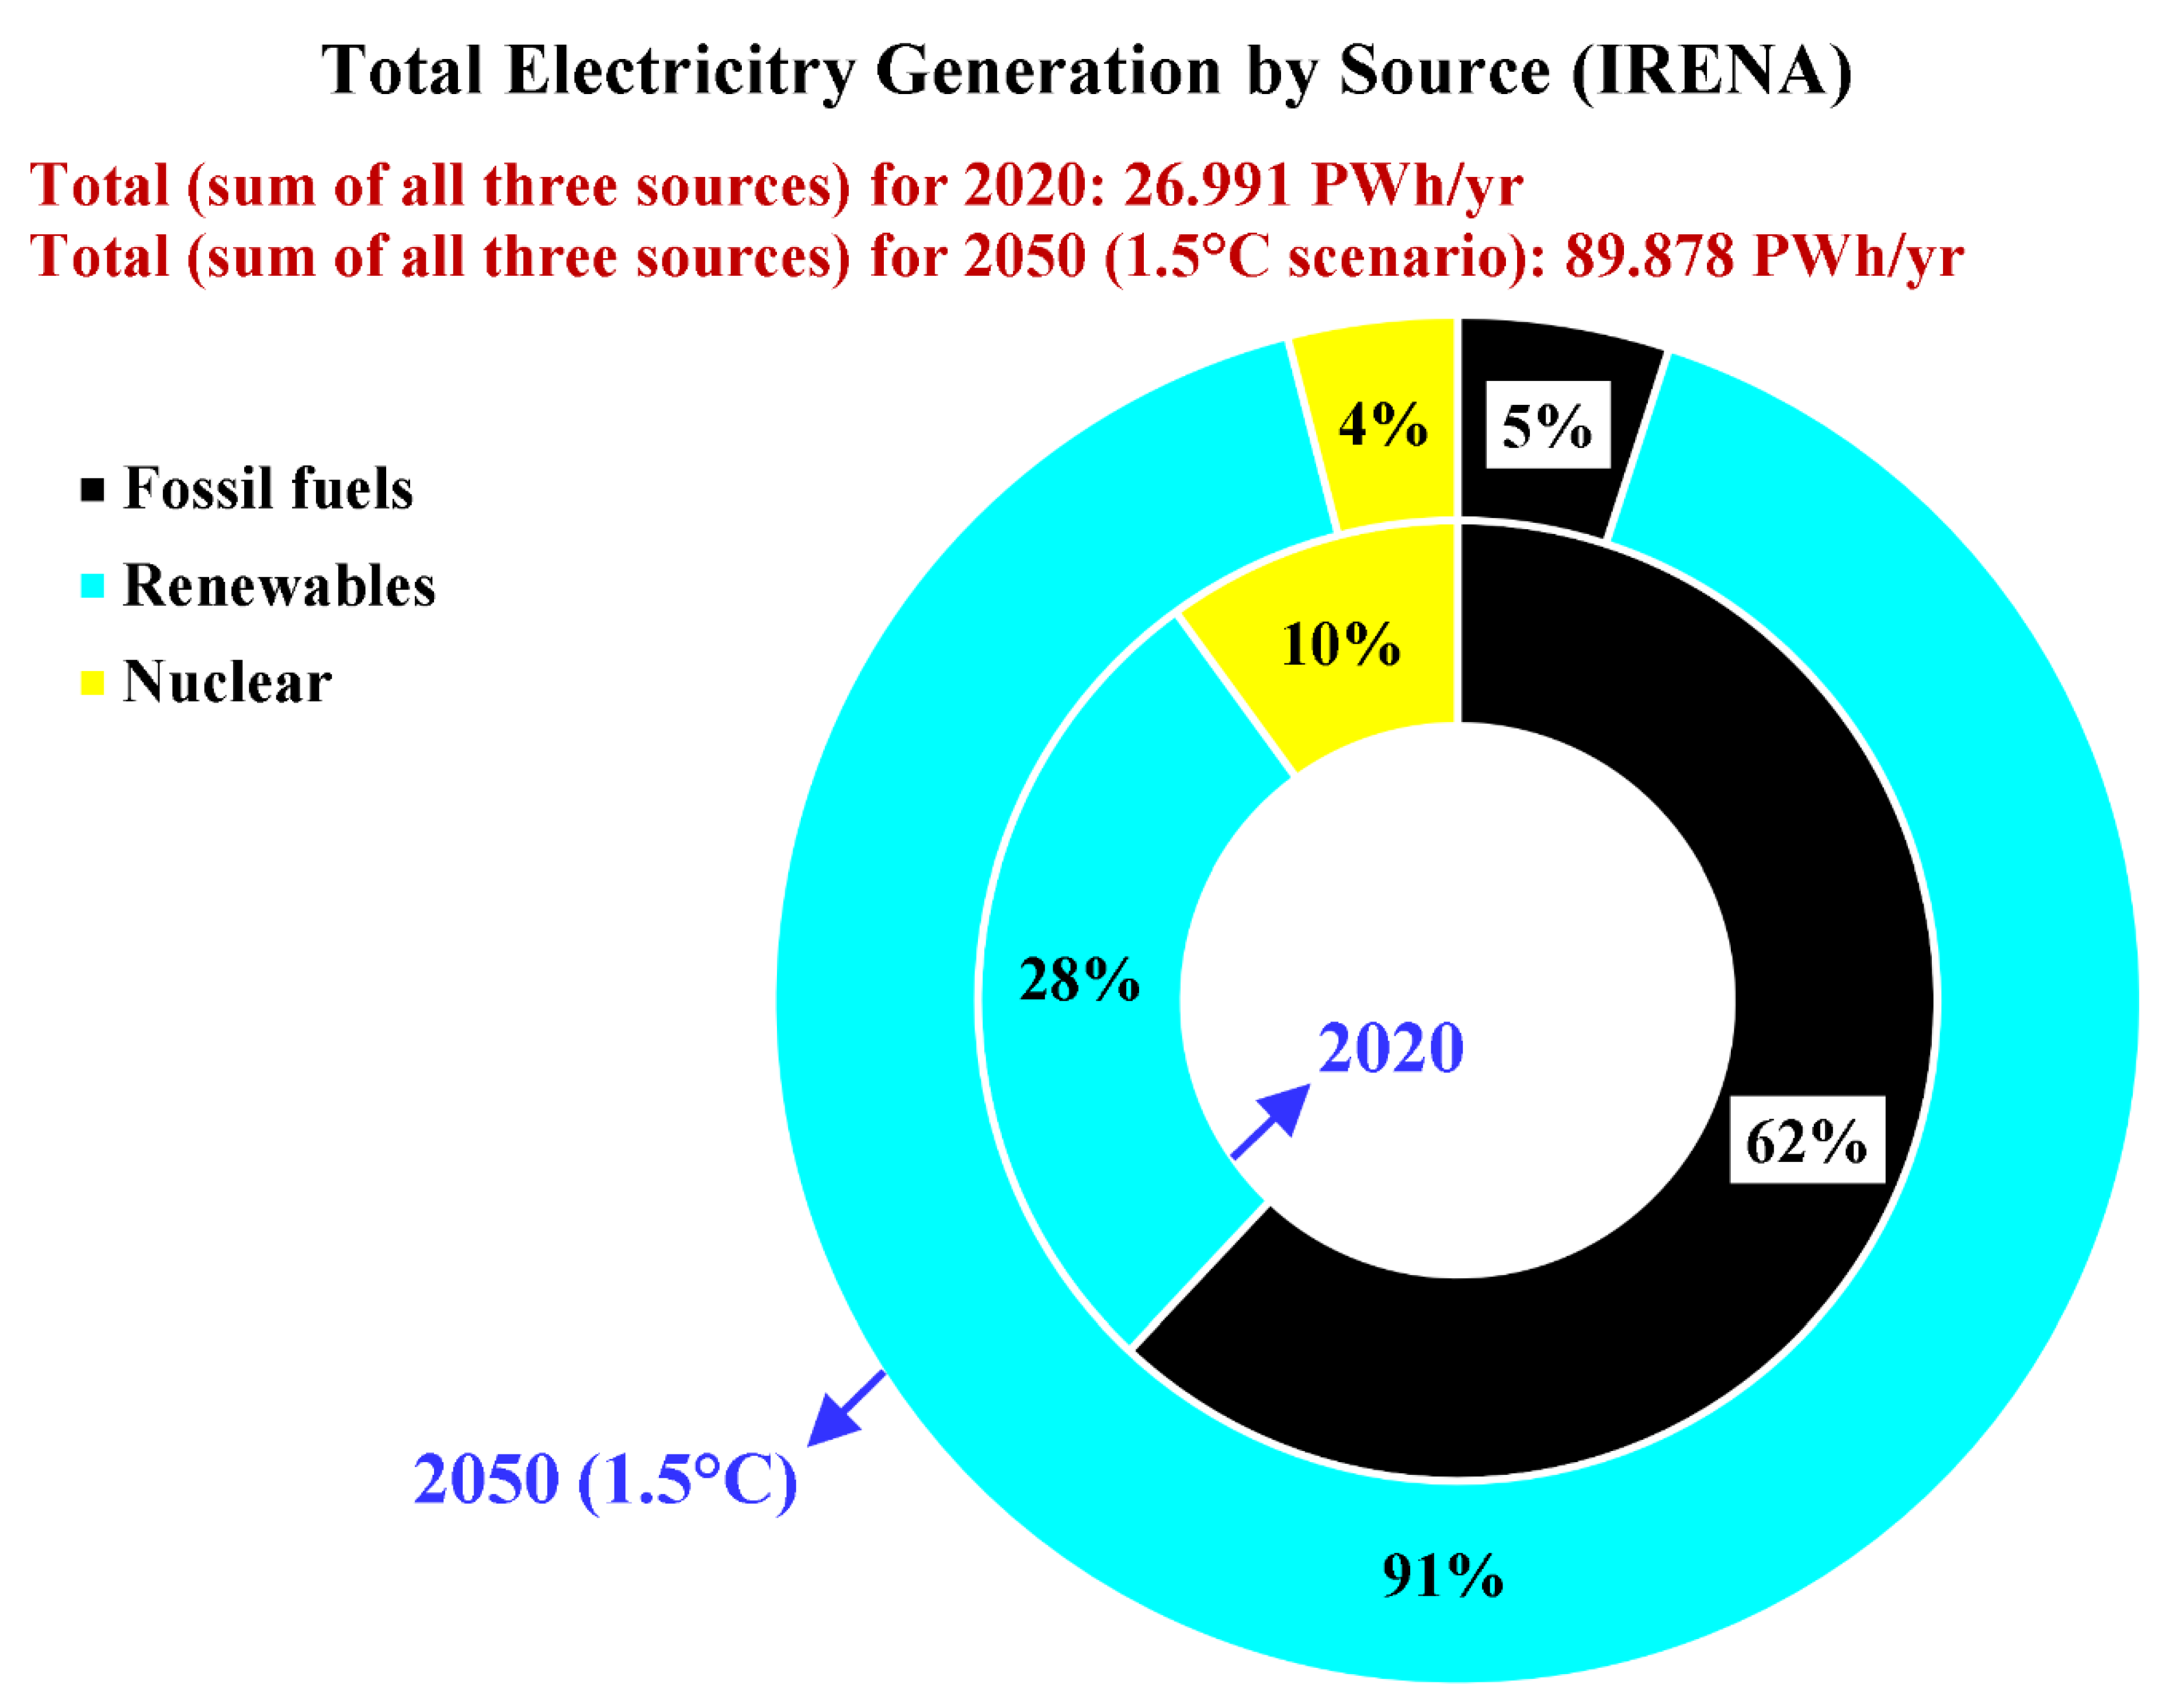
Figure 15.
Global electrification percentage in total final energy consumption (data source: IRENA).
Figure 15.
Global electrification percentage in total final energy consumption (data source: IRENA).
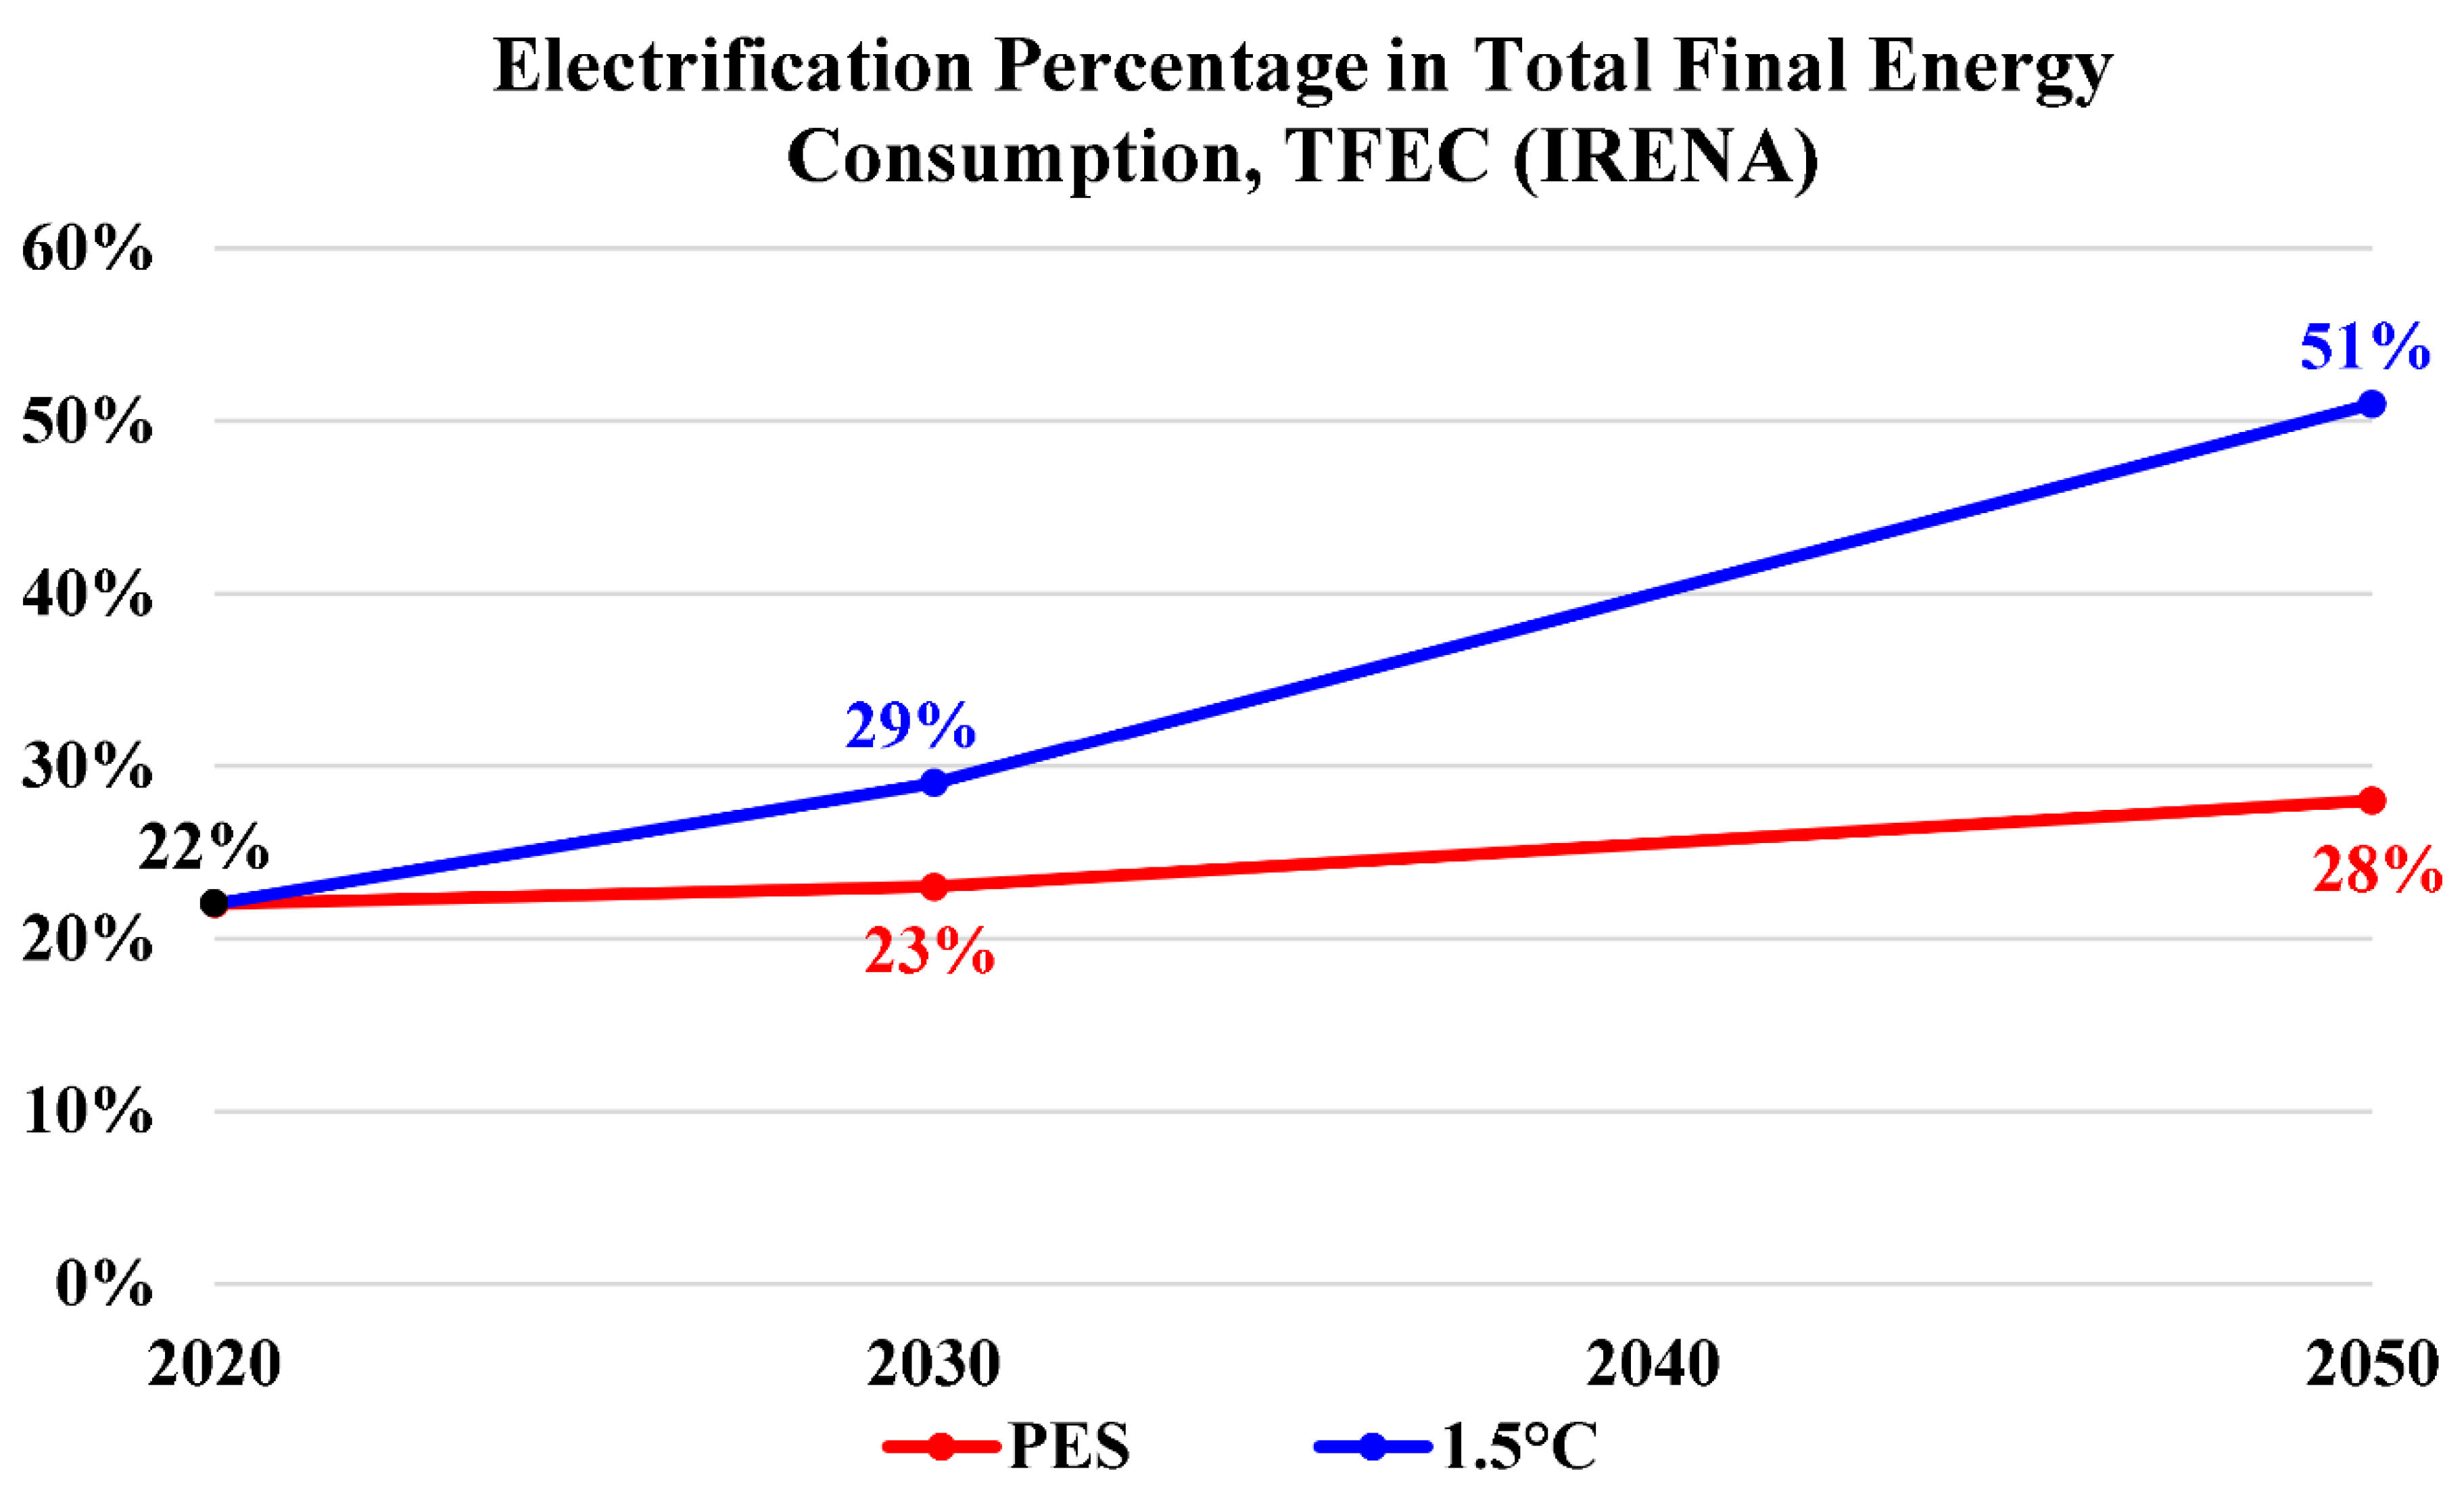
Figure 16.
Global hydrogen production by technology, historical values (data source: IEA).
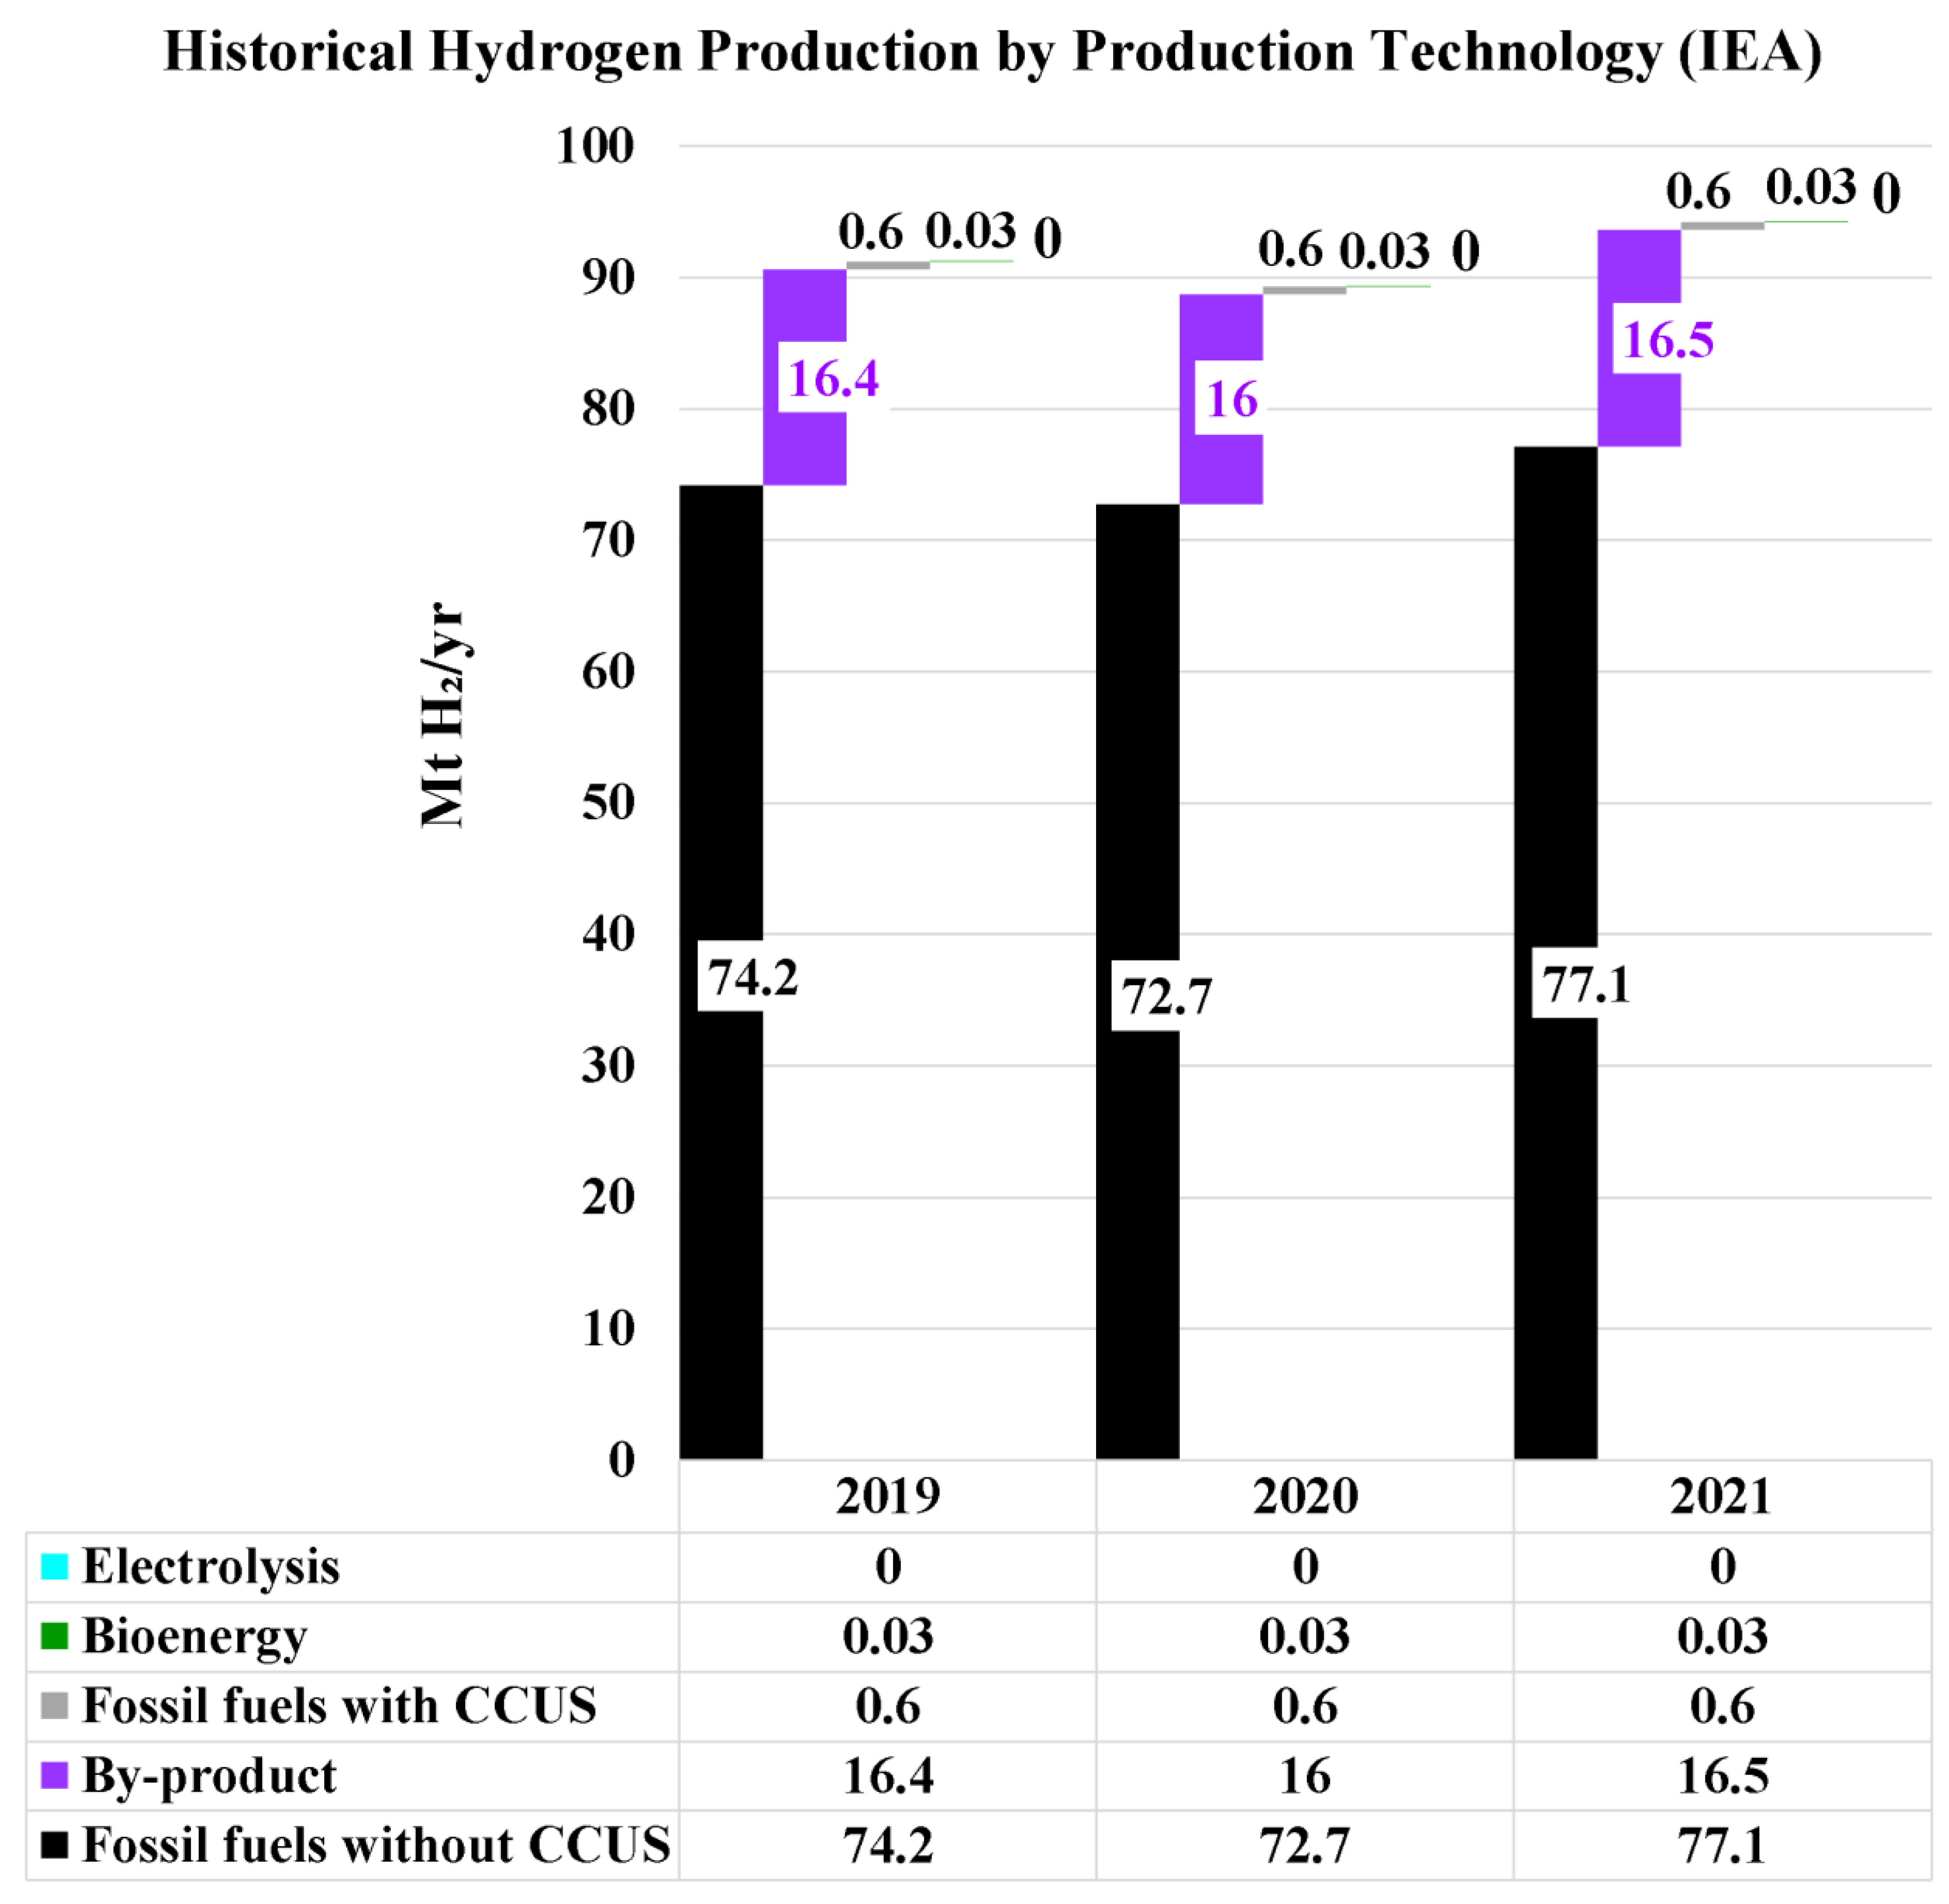
Figure 17.
Global low-emissions hydrogen production, and the portion of electrolysis-based green hydrogen in this (data source: IEA).
Figure 17.
Global low-emissions hydrogen production, and the portion of electrolysis-based green hydrogen in this (data source: IEA).
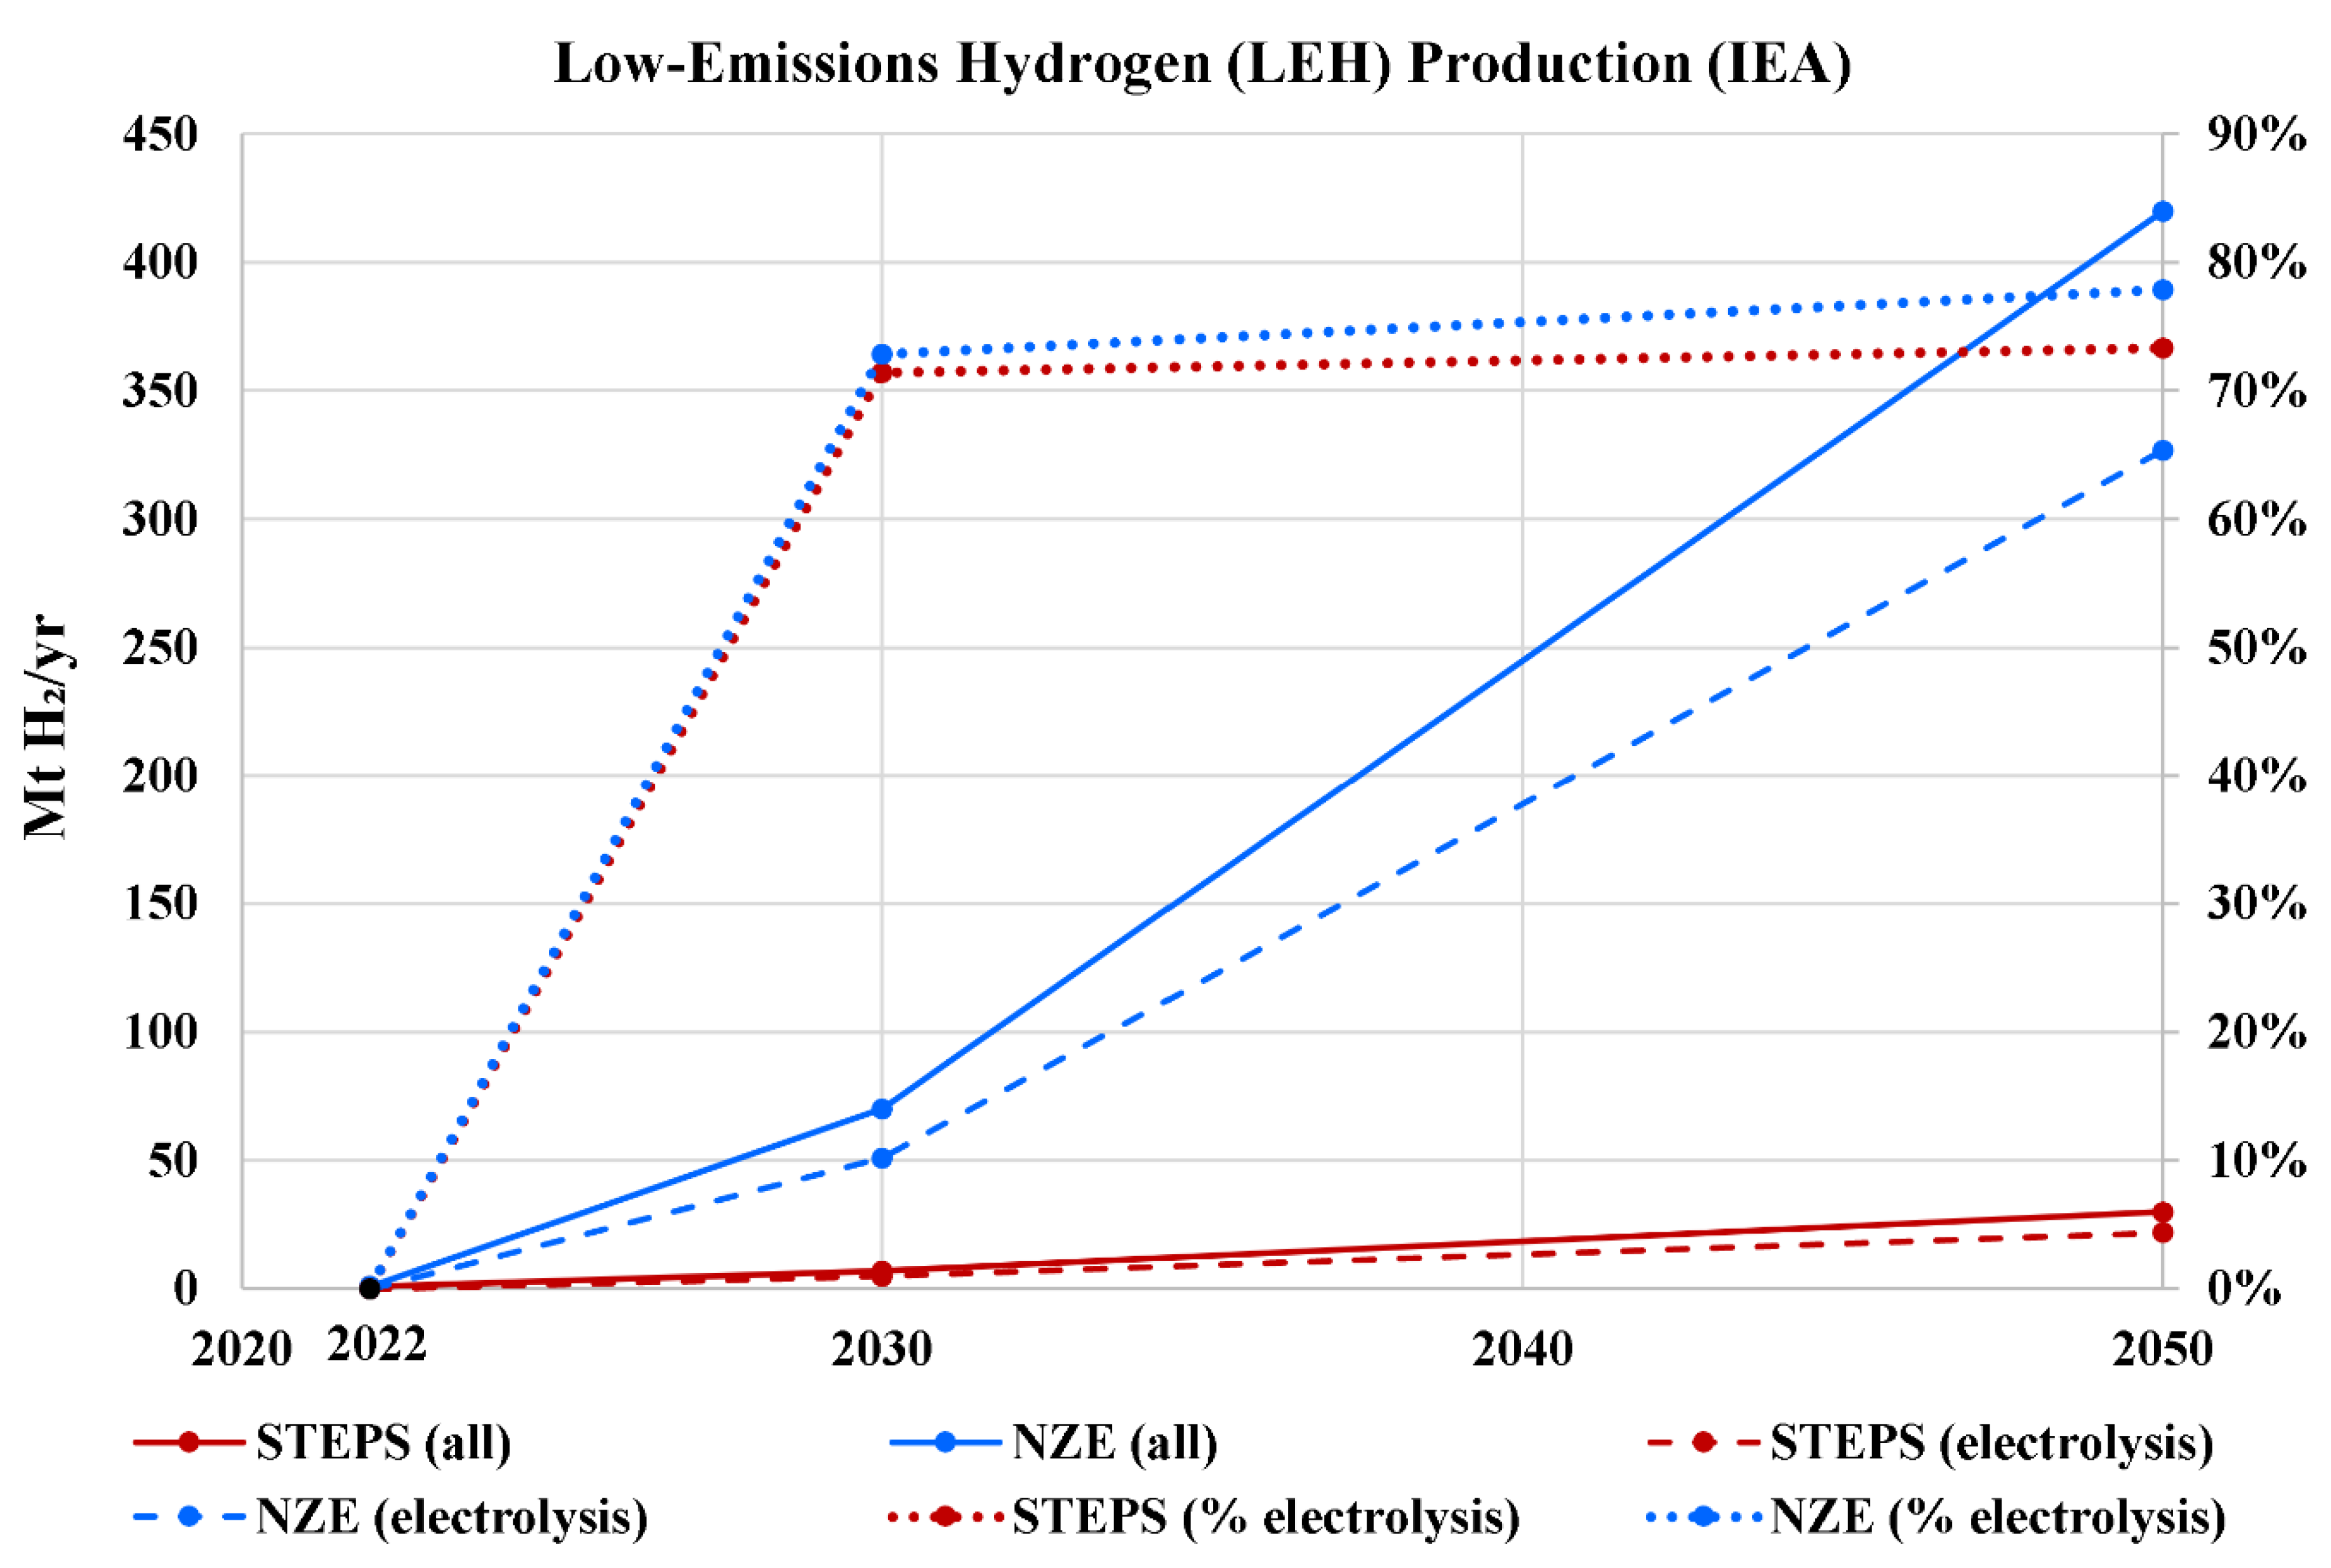
Figure 18.
Global total electrolyzer capacity for producing electrolysis-based green hydrogen (data source: IRENA).
Figure 18.
Global total electrolyzer capacity for producing electrolysis-based green hydrogen (data source: IRENA).
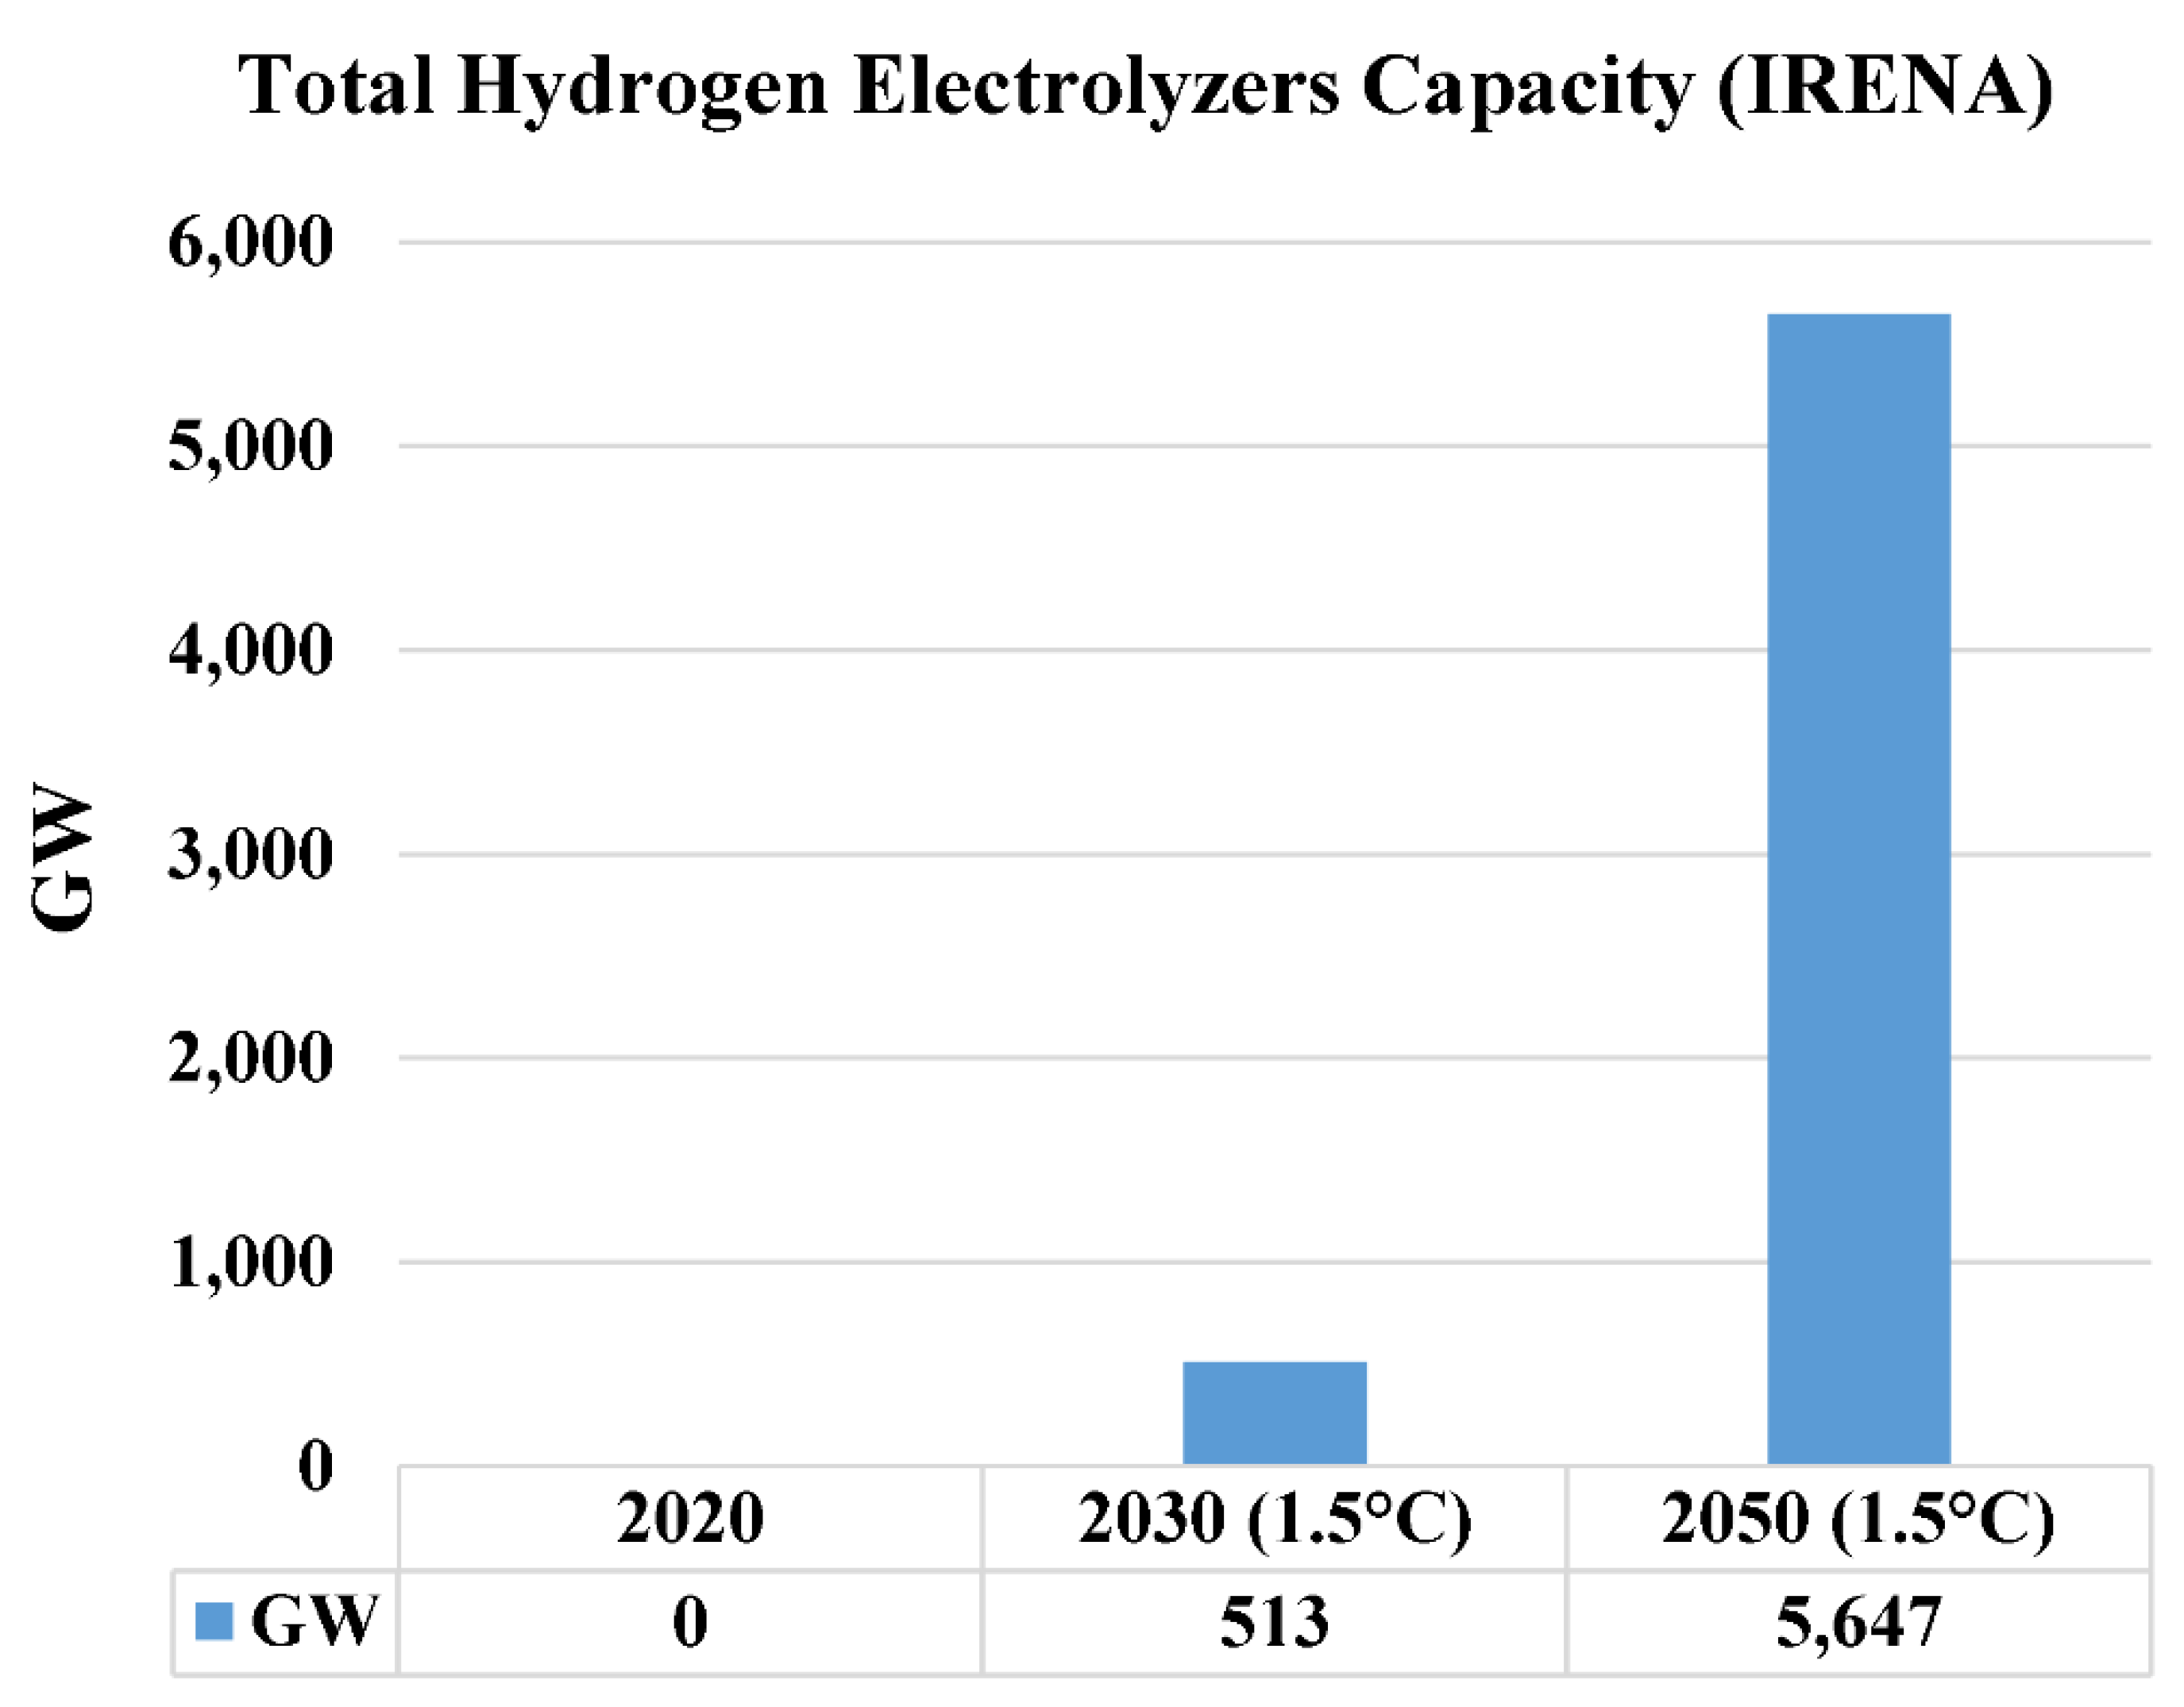
Figure 19.
Global hydrogen demand by sector, historical values (data source: IEA).
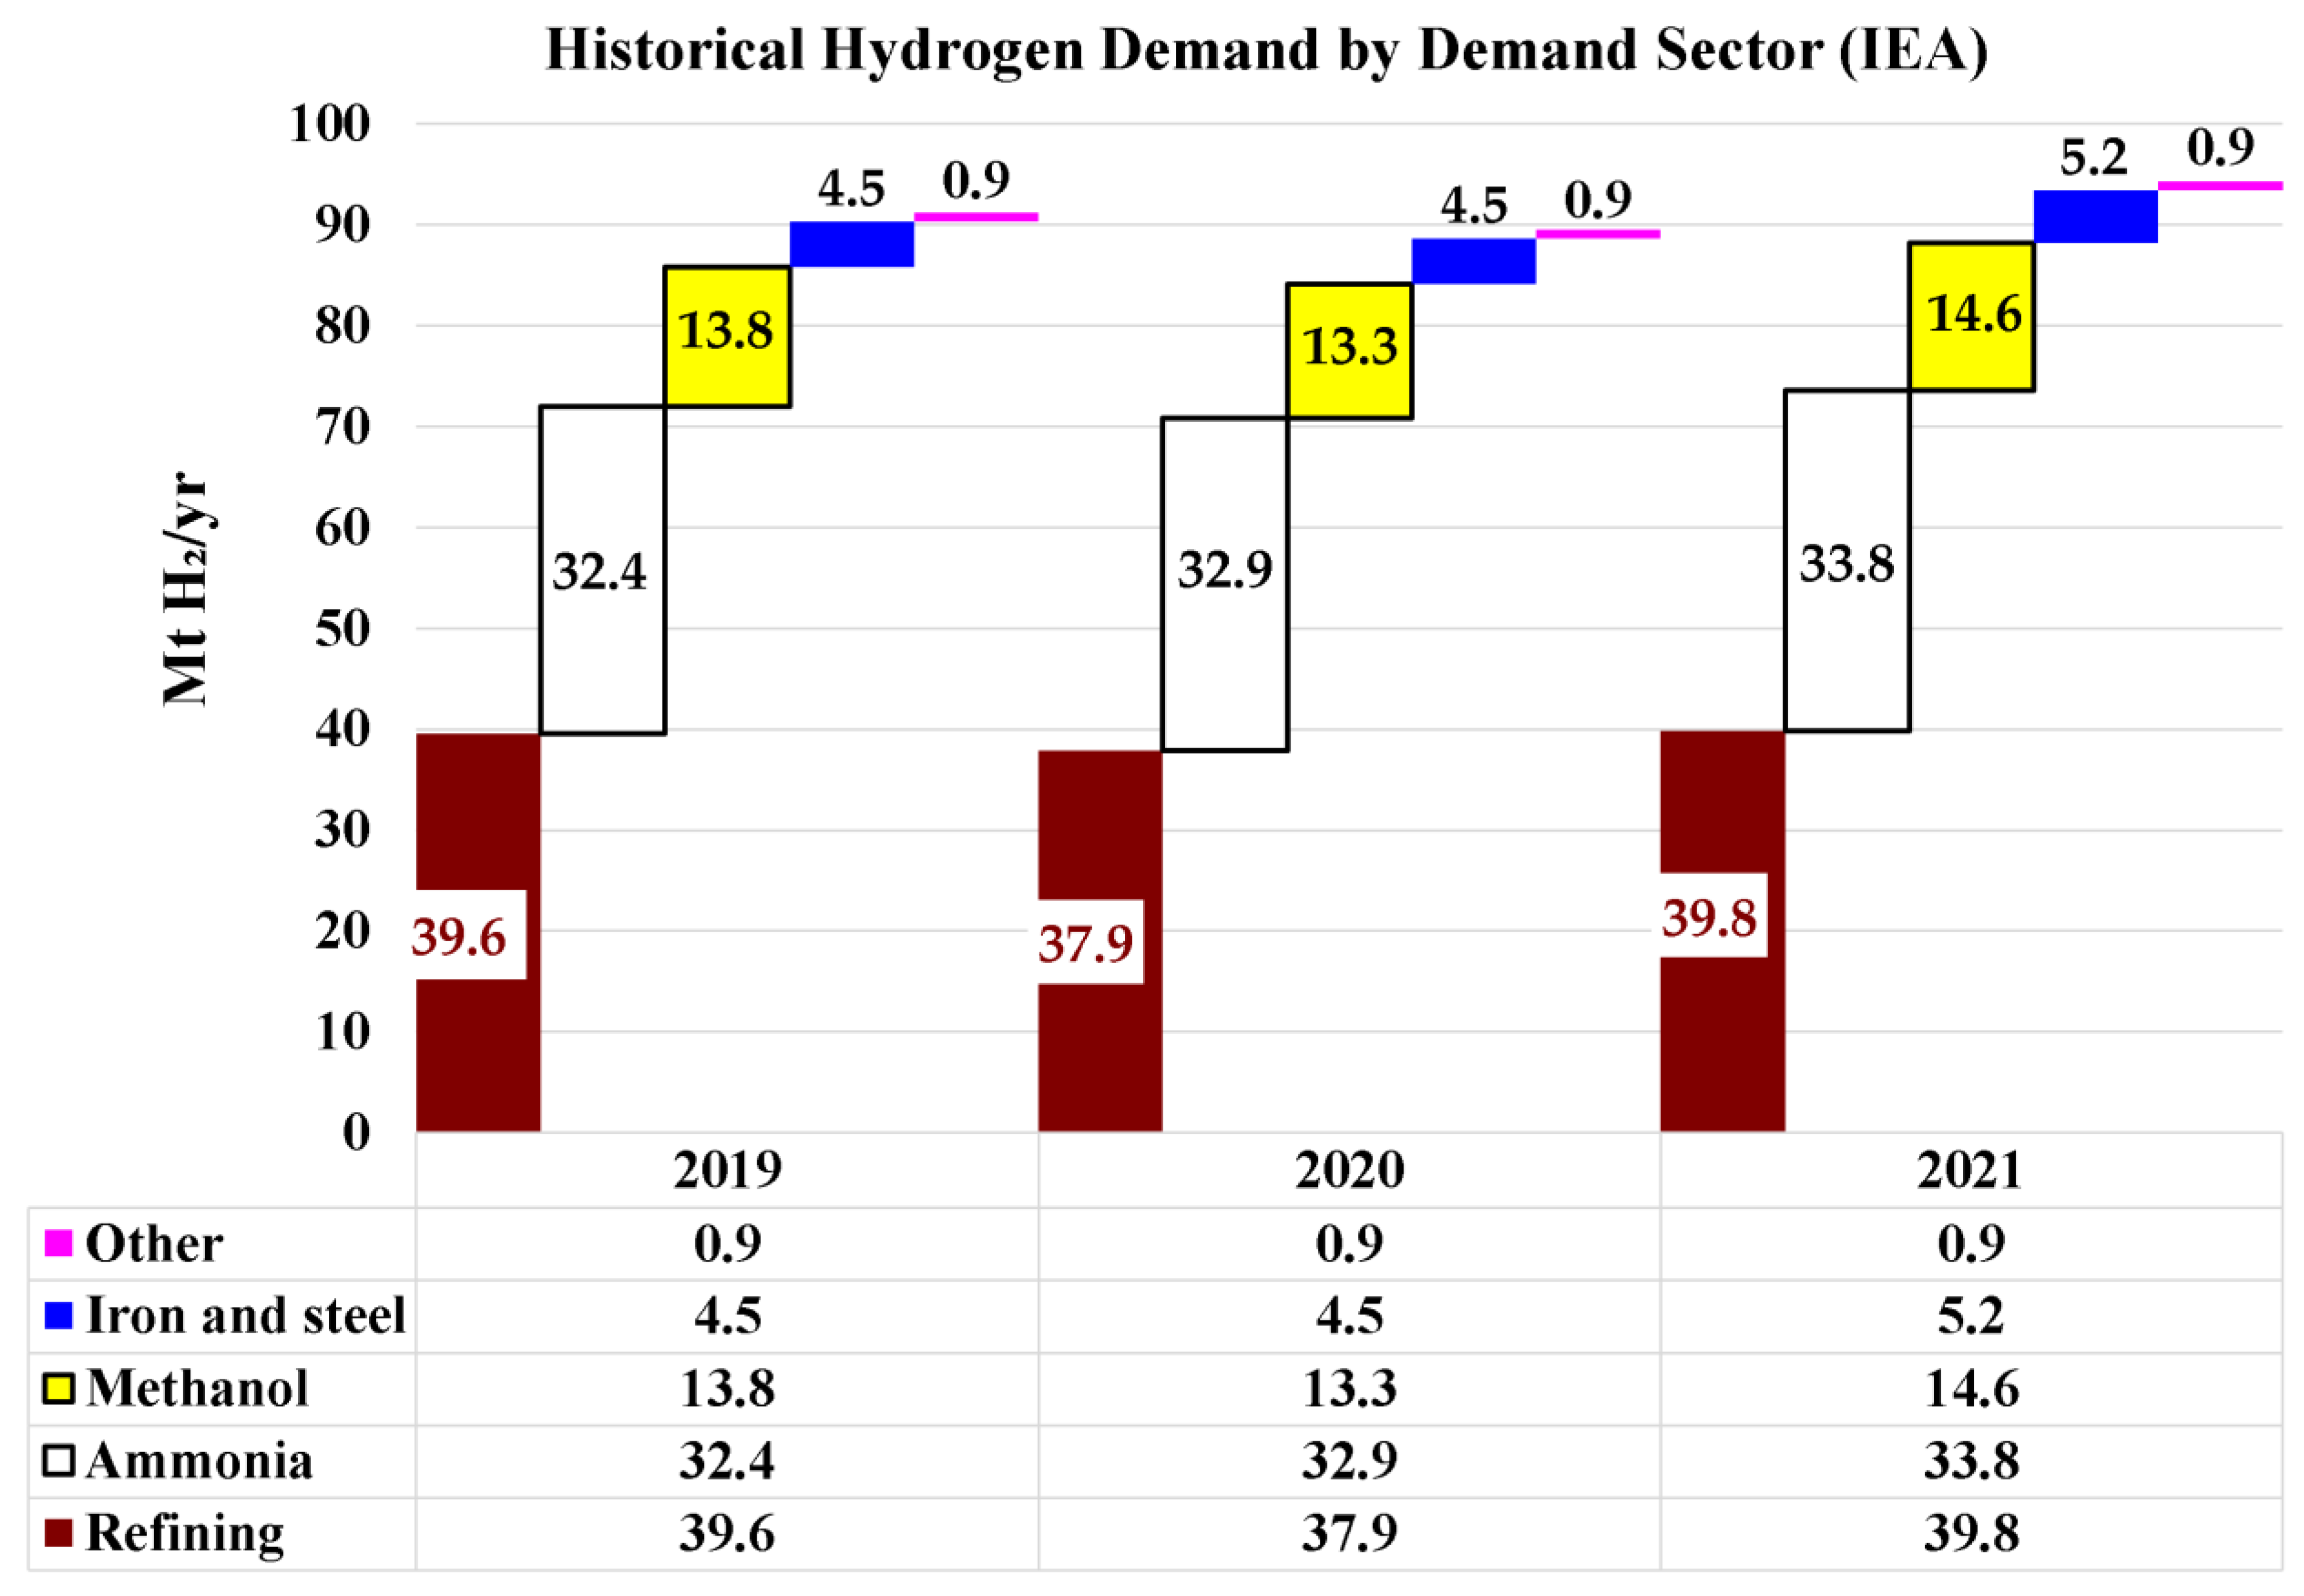
Figure 20.
Globally region-to-region traded low-emissions hydrogen and its derivatives, and its share in the global low-emissions hydrogen demand and its derivatives (data source: IEA). Trading here refers to exchange between geographic regions (not between individual countries), and excludes exchange within the same region. There are seven regions considered in IEA modeling, which are: (1) North America (Canada, USA, Mexico), (2) Central and South America, (3) Europe (including Turkey), (4) Africa (including all North Africa countries), (5) Middle East (including Iran), (6) Eurasia (Russia and the Caspian zone), and (7) Asia Pacific (including India and Pakistan).
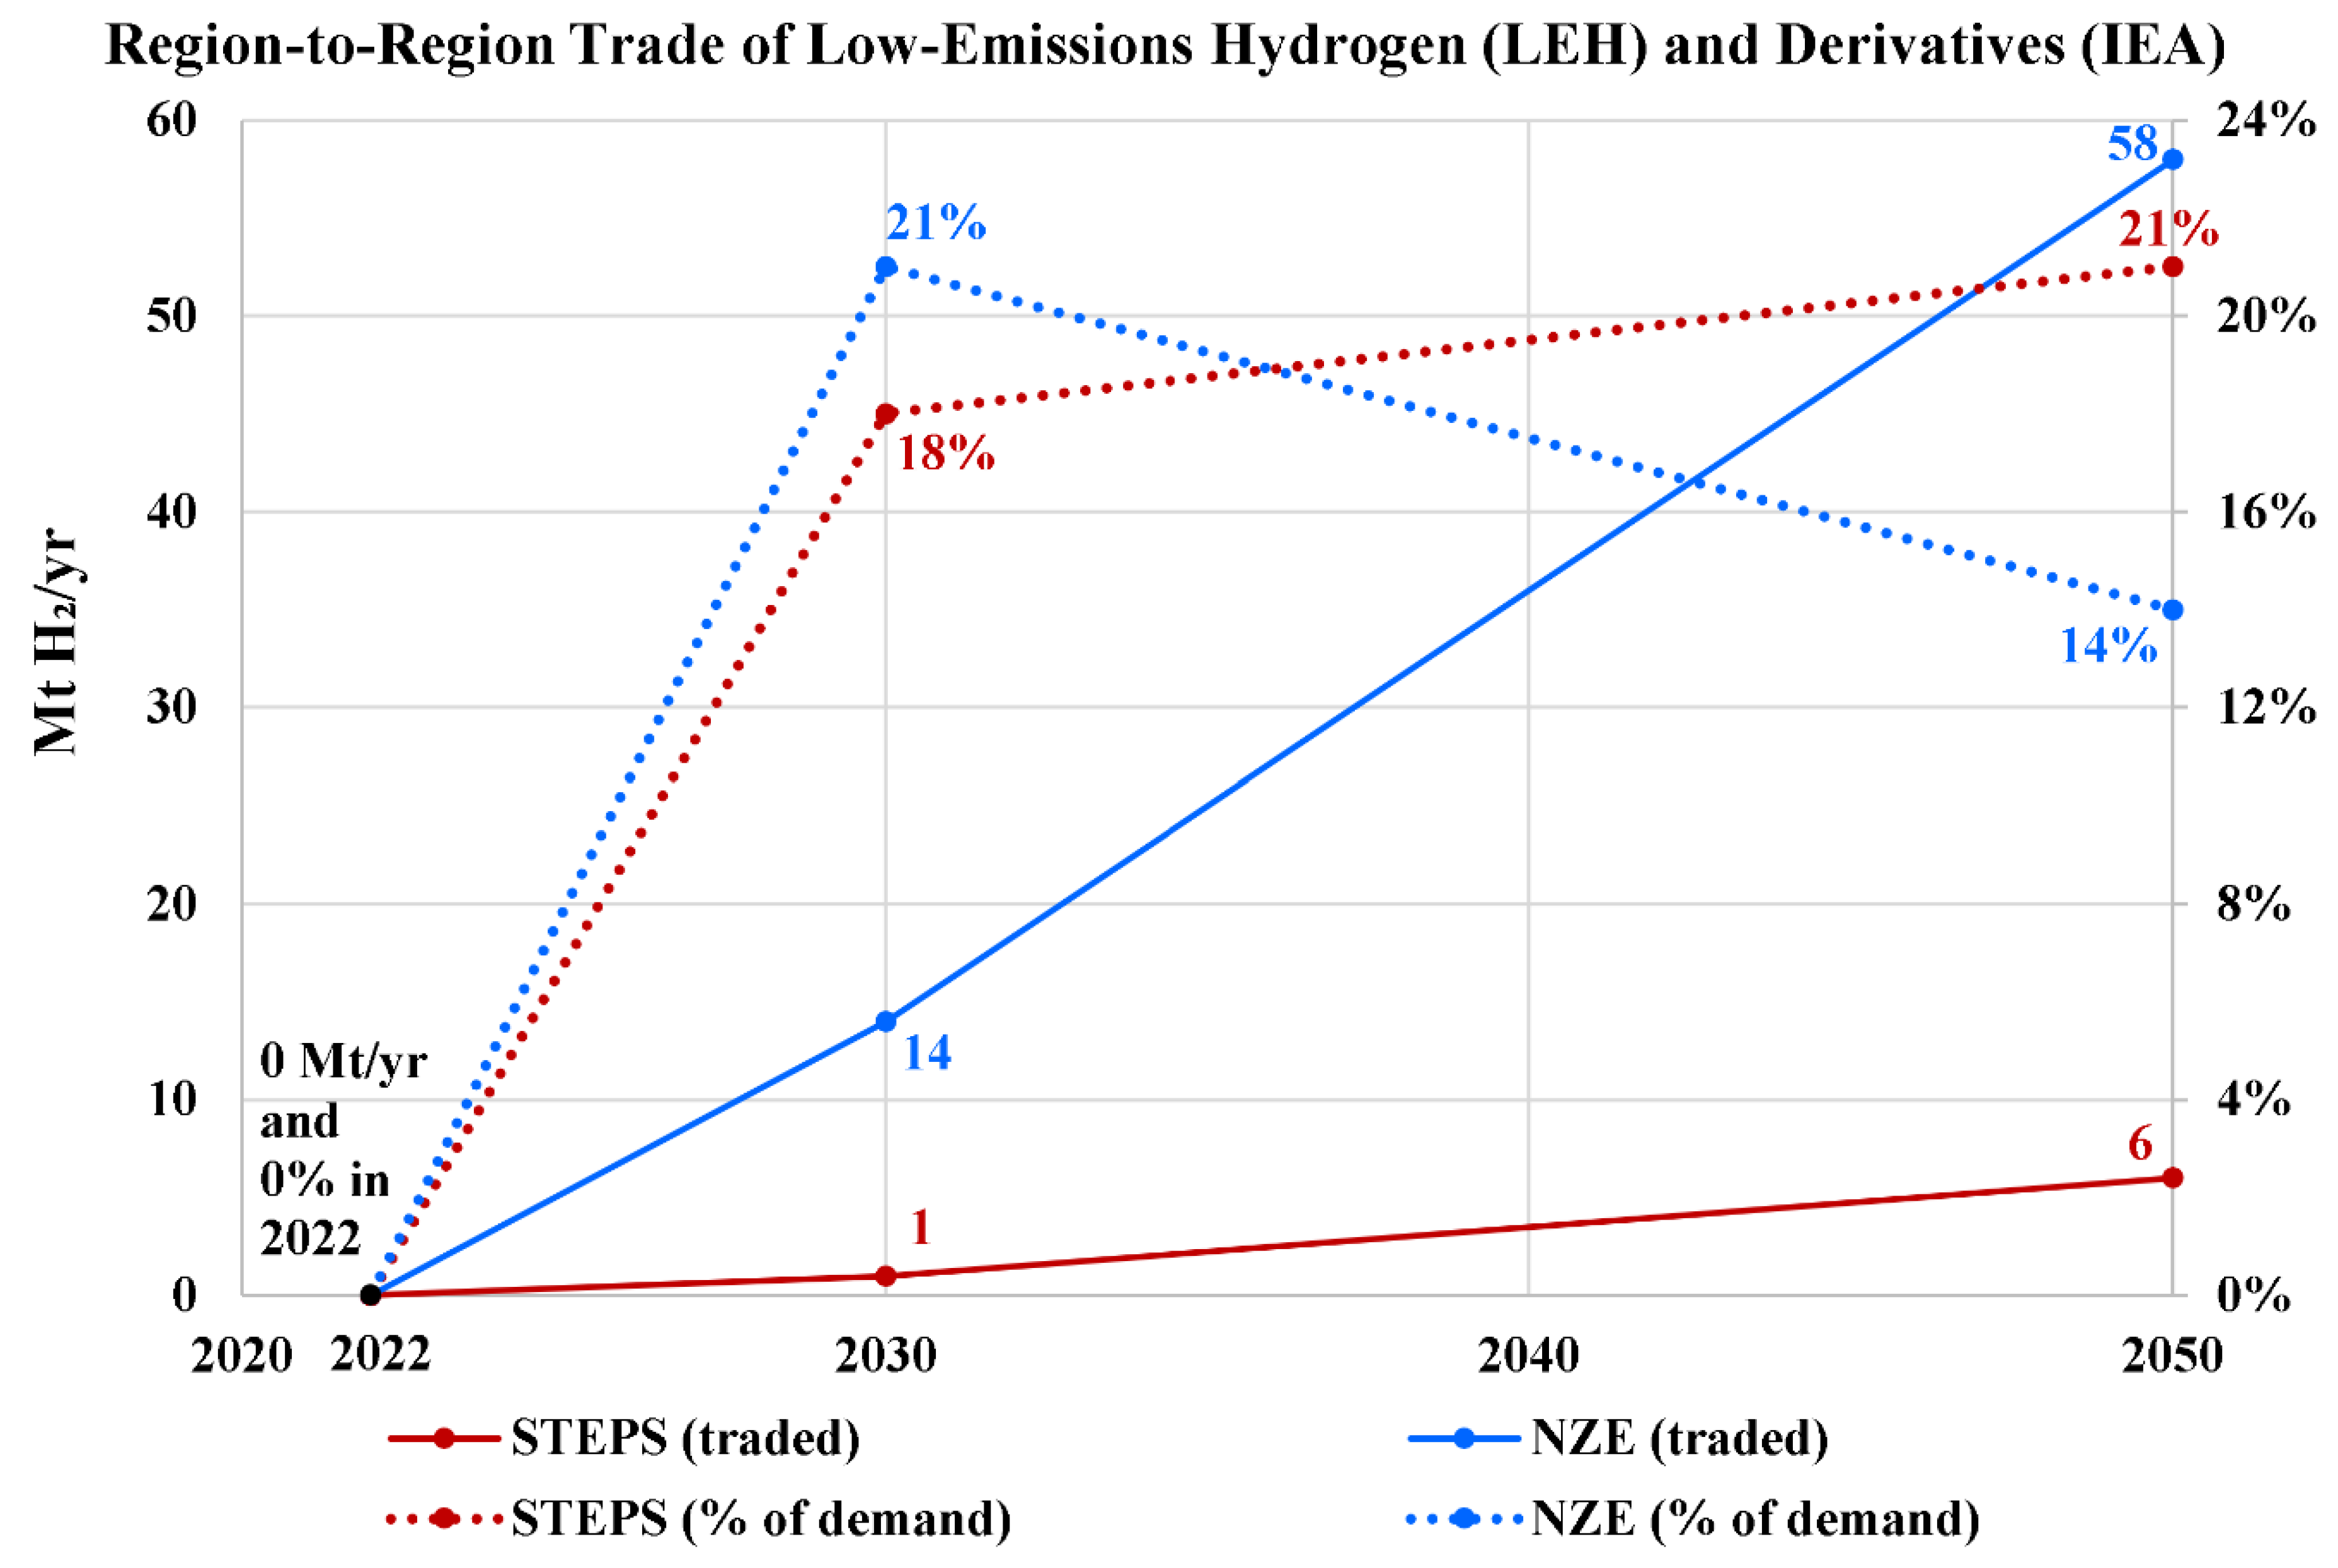

Table 1.
Global low-emissions hydrogen production, and the share of the electrolysis-based green hydrogen of this production (IEA).
Table 1.
Global low-emissions hydrogen production, and the share of the electrolysis-based green hydrogen of this production (IEA).
| Low-emissions hydrogen production, in Mt H₂ | Water electrolysis hydrogen production, in Mt H₂ | Share of electrolysis-based hydrogen production (in low-emissions hydrogen) | ||||
|---|---|---|---|---|---|---|
| Year | STEPS | NZE | STEPS | NZE | STEPS | NZE |
| 2022 | 1 | 0 | 0% | |||
| 2030 | 7 | 70 | 5 | 51 | 71% | 73% |
| 2050 | 30 | 420 | 22 | 327 | 73% | 78% |
Table 2.
Global production of clean hydrogen, in Mt H2/yr (IRENA).
| Year | PES | 1.5°C |
|---|---|---|
| 2020 | 0.7* | |
| 2030 | 2 | 125 |
| 2050 | 21 | 523 |
* Based on operational projects capacity through October 2022 (IRENA used the IEA Hydrogen Project Database).
Table 3.
Global low-emissions hydrogen-based liquid fuels demand, and its ratio to the conventional crude oil demand (IEA).
Table 3.
Global low-emissions hydrogen-based liquid fuels demand, and its ratio to the conventional crude oil demand (IEA).
| low-emissions hydrogen-based liquid fuels* demand, in Mboe/d** | Conventional crude oil demand, in Mb/d | Ratio of low-emissions hydrogen-based liquid fuels demand to conventional crude oil demand | ||||
|---|---|---|---|---|---|---|
| Year | STEPS | NZE | STEPS | NZE | STEPS | NZE |
| 2010 | 0 | 67.4 | 0.0% | |||
| 2022 | 0 | 62.8 | 0.0% | |||
| 2030 | 0 | 0.7 | 61.3 | 48 | 0.0% | 1.5% |
| 2050 | 0.2 | 6.0 | 58.2 | 15.8 | 0.3% | 38.0% |
* Low-emissions hydrogen-based liquid fuels (LELs) include ammonia, methanol, and other synthetic liquid hydrocarbons (such as kerosene) derived from low-emissions hydrogen. If carbon inputs are needed to synthesize such fuels (like CO2), they must not come from fossil fuels emissions or from process emissions. ** Low-emissions hydrogen-based liquid fuels are expressed in energy equivalent volumes, and are reported in Mboe/d (million barrels of oil equivalent per day).
Table 4.
Global electricity generation from low-emissions hydrogen and derived ammonia, and the share of this in the total electricity generation (IEA).
Table 4.
Global electricity generation from low-emissions hydrogen and derived ammonia, and the share of this in the total electricity generation (IEA).
| Electricity generation from low-emissions hydrogen and derived ammonia, in TWh | Total electricity generation, in TWh | Share of electricity generation from low-emissions hydrogen and derived ammonia (in total electricity generation) | ||||
|---|---|---|---|---|---|---|
| Year | STEPS | NZE | STEPS | NZE | STEPS | NZE |
| 2010 | 0 | 21,533 | 0% | |||
| 2021 | 0 | 28,346 | 0% | |||
| 2022 | 0 | 29,033 | 0% | |||
| 2030 | 22 | 373 | 35,802 | 38,207 | 0% | 1% |
| 2050 | 91 | 1,161 | 53,985 | 76,838 | 0% | 2% |
Table 5.
Global electricity capacity due to low-emissions hydrogens and derived ammonia, and the share of this in the total electricity capacity (IEA).
Table 5.
Global electricity capacity due to low-emissions hydrogens and derived ammonia, and the share of this in the total electricity capacity (IEA).
| Electricity capacity by low-emissions hydrogen and derived ammonia, in GW | Total electricity capacity, in GW | Share of electricity capacity by low-emissions hydrogen and derived ammonia (in total electric capacity) | ||||
|---|---|---|---|---|---|---|
| Year | STEPS | NZE | STEPS | NZE | STEPS | NZE |
| 2010 | 0 | 5,187 | 0% | |||
| 2021 | 0 | 8,230 | 0% | |||
| 2022 | 0 | 8,643 | 0% | |||
| 2030 | 8 | 129 | 14,168 | 16,180 | 0% | 1% |
| 2050 | 19 | 427 | 25,956 | 36,956 | 0% | 1% |
Table 6.
Global clean hydrogen (direct use and e-fuels) share in total final energy consumption (IRENA).
Table 6.
Global clean hydrogen (direct use and e-fuels) share in total final energy consumption (IRENA).
| Year | PES | 1.5°C |
|---|---|---|
| 2020 | <1% (TFEC 374 EJ/yr) | |
| 2030 | <1% | 2% |
| 2050 | <1% | 14% (TFEC 353 EJ/yr) |
Table 7.
Transport sector: global clean hydrogen (direct use and e-fuels) share in the final energy consumption within that sector (IRENA).
Table 7.
Transport sector: global clean hydrogen (direct use and e-fuels) share in the final energy consumption within that sector (IRENA).
| Year | PES | 1.5°C |
|---|---|---|
| 2020 | <1% | |
| 2030 | <1% | <1% |
| 2050 | 2% | 24% |
Table 8.
Industry sector: global clean hydrogen (direct use and e-fuels) share in the final energy consumption within that sector (IRENA).
Table 8.
Industry sector: global clean hydrogen (direct use and e-fuels) share in the final energy consumption within that sector (IRENA).
| Year | PES | 1.5°C |
|---|---|---|
| 2020 | <1% | |
| 2030 | <1% | 5% |
| 2050 | <1% | 17% |
Table 9.
Buildings sector: global clean hydrogen (direct use and e-fuels) share in the final energy consumption within that sector (IRENA).
Table 9.
Buildings sector: global clean hydrogen (direct use and e-fuels) share in the final energy consumption within that sector (IRENA).
| Year | PES | 1.5°C |
|---|---|---|
| 2020 | <1% | |
| 2030 | <1% | <1% |
| 2050 | <1% | <1% |
Disclaimer/Publisher’s Note: The statements, opinions and data contained in all publications are solely those of the individual author(s) and contributor(s) and not of MDPI and/or the editor(s). MDPI and/or the editor(s) disclaim responsibility for any injury to people or property resulting from any ideas, methods, instructions or products referred to in the content. |
© 2025 by the authors. Licensee MDPI, Basel, Switzerland. This article is an open access article distributed under the terms and conditions of the Creative Commons Attribution (CC BY) license (http://creativecommons.org/licenses/by/4.0/).
Copyright: This open access article is published under a Creative Commons CC BY 4.0 license, which permit the free download, distribution, and reuse, provided that the author and preprint are cited in any reuse.


