Submitted:
04 April 2025
Posted:
04 April 2025
You are already at the latest version
Abstract
This study aimed to assess the influence of recent climatic conditions and cultivar on the timing of key phenological stages in grapevines. For this purpose, five table grape varieties with different ripening periods, grown at the Murfatlar viticultural center and vineyard in Romania, were studied. This vineyard is challenged by current cli-matic changes. At the local level, data have been recorded showing constant climatic changes, with changing temperature and humidity regimes. These data will lead to management problems that other vineyards are already facing. The study covered the period from 2000 to 2019 and tracked the timing of the onset of vegetative phases, as recorded in the number of days from January 1 to that point, according to the BBCH phenological scale.
The results showed that the length of the vegetation period depends not only on the variety but also on the viticultural year, due to annual climatic variability. Changes in the duration of the vegetative phases were evidenced, with a trend towards advancing ripening.
Keywords:
phenology
; climate change
; grape table
1. Introduction
Romanian viticulture is recognized for the diversity of varieties used to produce high-quality wines, including white, red, and aromatic varieties [1]. It is also notable for the production of table grapes, with the wine sector experiencing steady development following the country’s accession to the European Union in 2007 [2].
Cultivation and quality of grapes depends on several key factors of the terroir concept (soil, climate, slope and exposure, etc.) but to a large extent on the stability and favorability of climatic parameters of the growing area: heat balance, actual insolation, number of possible growing days, annual minimum and maximum temperatures, water balance during growing and resting periods, precipitation during resting and growing periods, number of useful rainfalls (>10 mm) and relative humidity. Some values of environmental factors may be restrictive for grapevine phenology, including minimum air temperatures (< -150 °C), extreme temperatures during the growing season, drought [3], late spring and early fall frosts, and high wind frequency [4].
Viticultural regions and vineyards alike exhibit variability in both phenology and terroir, representing interesting material for current scientific research in the context of changing climatic factors [5].
Climatic factors play a crucial role in determining the timing of the main phenological stages. Vines have been shown to respond to a warming climate by advancing the main phenological stages and shortening the phenological interval. At the scale of viticultural regions, climate and, in particular, humidity are key terroir factors that dictate grape quality. At the vineyard level, where the climate is more consistent, soil composition also contributes to the final quality of the grapes [5]. Temperature, is the limiting parameter for grapevine cultivation because the vineyard area, cropping system, phenophase onset and progression, production quantity and quality are decisively determined by it, requiring continuous evaluation by calculating specific parameters: overall heat balance (Σtºg), active heat balance (Σtºa) and useful heat balance (Σtºu) [6,7]. The ripening of table grapes requires cycles of cooler temperatures with high diurnal fluctuations [8]. In recent decades, due to climate change, grape ripening has occurred under warmer and drier conditions, resulting in reduced grape yield and quality [9,10]. The observed trend is an increase in evapotranspiration, the direct consequence of which is the application of irrigation [11]. As a result of climate change, the increase in temperature associated with variable rainfall can lead to mild to severe stress, reducing yield and improving grape quality [11,12].
Although this problem has been addressed through technological improvements, recent changes in temperature, as well as sunshine duration and rainfall, reveal a concerning trend for grapevine cultivation [13]. Therefore, understanding the thermal requirements and thresholds for viticulture is crucial not only for sustaining traditional wine-growing regions but also for identifying new cultivation opportunities in the context of global warming [14,15]. Another determining parameter for vine phenology is light, with the light resources of a vineyard assessed in terms of the sum of hours of effective sunshine during the growing season (actual insolation), which in our country’s conditions ranges from 1200 to 1600 h [16]. Humidity can be a restrictive factor for grapevines under prolonged drought conditions. However, the grapevine is a plant with the potential to adapt due to its well-developed root system to both drought and high humidity conditions [17]. Climate change adaptation strategies are crucial in viticulture, as it is a dynamic socio-economic activity in most regions of the world, with short-term strategies being widely employed despite growing concerns about their sustainability [18,19]. To better understand the traits underlying the adaptive capacity of grapevine to current climate change, the integration of research in plant physiology, biochemistry, histology and genetics is needed [20]. Studies on how climate change might modify the risk of plant frost have shown that it remains low for viticulture [21].
Several traits, including morphological, physiological and molecular aspects, are essential for adaptation to environmental stresses such as drought and heat. By studying the abundant intervarietal diversity of grapevines, the potential for adapting viticulture to climate change through varietal selection is immense [20]. Although the plant response to light and heat stress is well understood, as grapevine varieties exhibit different molecular mechanisms of leaf cell homeostasis, the ability to develop heat stress tolerance strategies requires further investigation. This is because morpho-anatomical and physiological traits may vary depending on the intensity and duration of stress, as well as the genotype × environment combination [22]. Additionally, by combining genomic and environmental data, breeders can more accurately predict varietal performance, thereby enhancing breeding efficiency and facilitating the development of high-quality grapevine cultivars [23]. Variations in planting sites, particularly between lowland and mountainous areas, also affect temperature and climatic conditions [24]. Variation in phenological responses of table grape varieties due to temperature differences requires future genotype management and active management applied at the vineyard level [25,26].
Mediterranean countries are expected to face substantial increases in temperature, prolonged periods of severe drought, increased levels of ultraviolet (UV) radiation and a higher frequency of extreme weather events [20,27,28,29]. Europe is emerging as a particularly climatically sensitive area, where the grapevine is recognized as one of the most important crops. There is growing evidence of the significant impact of climate change on the timing of grapevine phenological stages, which necessitates the scientific community’s investigation into the potential evolution of this impact in the coming decades [29,30]. Climate projections for the near future (2020-2060) indicate a delay of budburst by 7 to 8 days and of ripening by 4 to 5 days on average. For the far future (2060-2100), the respective changes are 11 to 18 and 7 to 9 days earlier [30]. Studies [31,32] suggest that phenological models based on the growing degree days (GDD) index could be useful planning tools for viticulture, especially from vegetative initiation to flowering for table grape varieties.
In the current climatic context, the phenophase of table grapes may change. For this reason, further local and regional studies are needed to assess the climatic impact on the progression of vegetation phases and to contribute to the implementation of effective strategies in response to climate change [33,34]. This is also the aim of the current study, which proposes to evaluate the influence of climatic year and varietal characteristics on the development of vegetative phases in table grape varieties grown in Murfatlar, Romania.
2. Materials and Methods
Location. The study was conducted in Podgoria, specifically in Murfatlar, at the Murfatlar viticultural center. The vineyard is situated in the central part of the Dobrogea shelf, along the linear slopes of the Danube-Black Sea Canal, extending from Poarta Albă-Nazarcea to Cernavodă, then south to Cochirleni and Rasova, and north to Seimenii Mici, within the Dobrogea Hills Wine Region (Figure 1a, VZ 6). The geographical coordinates are 44˚11′ north latitude and 28˚23′ east longitude, relative to the equator and the Greenwich meridian. The Murfatlar vineyard comprises three vineyard centers situated at varying altitudes: Murfatlar (57 m), Medgidia (60 m), and Cernavoda (75 m) (Figure 1b). The Murfatlar wine-growing center is situated in the central-southeastern part of Constanța County, characterized by predominantly chernozemic or kastanozemic soils with a loamy texture, high edaphic volume, and good overall drainage. At the soil level, humus ranges from 2.5% to 3%, nitrogen from 0.16% to 0.22%, and total phosphorus from 0.07% to 0.11%.
Climatic conditions. During the period of the phenological study (2000-2019), the mean annual temperature was 14.42°C, the actual insolation during the growing season was 1675.7 h, and the annual precipitation volume was 503.3 l/m2, of which 303.9 l/m2 occurred during the growing season.
Plant material. The table grape varieties studied in this research are five in number and differ in ripening time: early (Victoria, Cardinal), medium (Muscat de Hamburg), and late (Italia, Afuz-Ali). Planting distances are 2,2 m between rows and 1,4 m between plants per row. Row orientation is N-S. The pruning system used is Dr. Jules Guyot.
Phenological data. The phenological observations were carried out from the beginning of vegetation to maturity.
Four main phenophases were followed, according to the BBCH (Federal Institute of Biology and Chemical Industry) monograph: BBCH 09 (Bud burst), BBCH 61 (Beginning of flowering), BBCH 81 (Beginning of ripening), BBCH 89 (Full maturity). Thirty observations were made for each variety, with the results expressed as an average. Phenophases were recorded as several days since January 1 (day of year, DOY).
Statistical analysis. Each data set was statistically analyzed using JASP 0.19.3.0. program for descriptive analysis and correlations.
3. Results and Discussion
The progress through the vegetative phases of the varieties is influenced by both climate and biological characteristics of each variety. The descriptive statistical analysis of the influence of variety on phenophases in table grape varieties grown in the Murfatlar wine-growing center is presented in Table 1. It can be observed that all phenophases start earlier in the varieties Cardinal and Victoria, followed by Muscat de Hamburg, then Afuz-Ali and Italia. This is also their ripening order. It is observed that the onset of each vegetative phase occurs earlier for varieties with shorter vegetation periods and later for those with longer vegetation periods. During this period, at Murfatlar, the Cardinal variety required, on average, 239.2 days to ripen, Victoria 253.4 days, Muscat de Hamburg 261.2 days, Afuz-Ali 272.9 days and Italia 275.4 days. The vegetation period characterizes each variety and is also evident in varieties grown for wine [37]. If we consider each phenophase, the number of days from January 1 to onset varied for the same variety during the analyzed period. The BBCH 09 stage unfolded most clustered, with the amplitude of varieties ranging from 4 to 10 days. This phenotype showed the lowest amplitude. The data are in agreement with those previously reported, which indicate that the variability of this phenophase is low [38]. In this context, the maximum amplitude was recorded in the Afuz-Ali variety, which maintained this characteristic in both the BBCH 61 and BBCH 81 phenophases.
During the 3 phenophases, Victoria evolved more clustered, with a maximum amplitude of 7 days. The last phenophase (BBCH 89) is characterized by the highest amplitude, which, depending on the variety, ranges from 12 to 24 days. Italia recorded the highest amplitude at BBCH 61, Afuz-Ali at BBCH 81 and Victoria, Muscat de Hamburg and Cardinal at BBCH 89.
The shortest interphase interval was between BBCH 09 and BBCH 61. Varieties were clustered in this respect, ranging between 37 and 39 days. The longest interval was between BBCH 61 and BBCH 81, ranging from 51 to 82 days. Low values characterized the early-maturing varieties, and the highest values were recorded by the late-maturing varieties. The standard deviation and coefficient of variation have low values, indicating homogeneity among the analyzed varieties. The distribution of statistically analyzed data is normal, with two exceptions: phenotype BBCH 09, Afuz-Ali, and Muscat Hamburg (Shapiro-Wilk p-value < 0.001).
The descriptive statistical analysis of the influence of the year on the phenotypes of table grape varieties grown in the Murfatlar viticultural center is presented in Table 2. The distribution of statistically analyzed data is normal. For the first phases of vegetation, the standard deviation and the coefficient of variation indicate a distribution clustered around the mean of the values; as a result, there is good uniformity in the onset of vegetation and the beginning of flowering.
Stage BBCH 09 was triggered after 108.6 - 112.8 days from January 1, and stage BBCH 61 after 147.2 - 155.8 days. The annual amplitude ranged from 3 to 9 days for BBCH 09 and from 2 to 14 days for BBCH 61. The BBCH 81 stage is characterized by higher values of the coefficient of variation and standard deviation, which indicate a phenophase with an average uniformity in terms of onset time. The amplitude is between 32 and 43 days, with the phenophase manifesting after 215.4 - 220.6 days from the onset. The last phenophase is comparable in terms of uniformity to the previous one and is triggered 253.6-266.4 days after the beginning of the year, characterized by an amplitude of 27-50 days.
The average distances between the four phenophases are 40.6, 67.0, and 41.9 days, respectively. The annual variations can be attributed to the variability of climatic conditions, particularly temperature, which is more closely linked to the onset of phenophases than humidity [39,40].
Recent studies have highlighted changes in the dynamics of vegetation phase unfolding in relation to temperature, which is of importance in the context of global warming [41]. Elevated temperatures correlate well with the timing of flowering, fruit set and ripening, in terms of the avulsion of these phenophases, with variations by vineyard and variety [42]. The greatest impact on phenophases was identified for average temperatures in March (for budbreak), May (for flowering) and August, in terms of ripening and harvest [43].
Similar observations on some wine grape varieties have shown that in recent years, we are witnessing an advancement of the vegetative phases, while the intervals between some phenophases are decreasing [43]. If we follow the dynamics of the number of days from January 1 to the recording of the ripening phase of the grapes (BBCH 89), we observe a decreasing trend over the 20-year study period. The separate analysis of each phenophase showed a more pronounced upward trend for the BBCH 09 stage compared to the BBCH 61 and BBCH 89 stages. Leek (BBCH 81) is the only stage that remains relatively unaffected, remaining approximately constant over the 2000-2019 period. The data obtained are confirmed by other studies, which show that the advancement of the harvest is explained by a reduction in the duration between phenophases [44]. The reduction in the vegetation cycle has also been reported for other species of the genus Vitis (e.g., Vitis labrusca L.), which, under the given climatic conditions, leads to two harvests per year [45]. Essentially, we are witnessing an advancement of the vegetative stages, which can be attributed to the warming climate. However, there are situations where an early bud burst cannot be correlated with advanced ripening if reduced temperatures occur during the growing season [46].
Pearson’s coefficient was used to determine the correlation between the durations of the analyzed phenophases, and the results are presented in the form of a correlation matrix (Table 3). The correlation coefficients had positive values and are statistically assured. The table shows that all the phenophases correlate with each other, indicating that the number of days until the onset of one phenophase influences the duration of subsequent phenophases. It can be observed that the analyzed phenophases correlate with each other positively distinctly significantly without exception. Pearson’s coefficient values ranged between 0.445 and 0.828.
Figure 2 plots the correlations between the analyzed phenotypes of table grape varieties cultivated at the Murfatlar vineyard center from 2000 to 2019. The trend lines, confidence intervals (blue line) and prediction intervals (green line) are shown in the graphs.
The graphical representation confirms the data presented above, by the existence of direct, positive correlations between the key phases of vegetation, in terms of the number of days recorded from January 1 to their onset, in the varieties studied. This indicates that the greater the number of days from January 1 to the time of recording the first vegetation phases (DOY), the longer the period to the subsequent phenophases (e.g., dormancy, maturity).
As a result, we believe that the results of this study can be utilized in various ways. Disbudbreak, flowering, flushing, scorch and ripening are key phenological phases for the grapevine; their identification can be of economic importance through timely harvest management [47,48].
Correct identification of phenological phases helps determine the optimal time for applying various works and technologies correctly and on time. The impact of such studies has been noticed by several authors [39,49] who have focused on the importance of phenology for choosing the timing of treatments for disease and pest control, for vineyard irrigation while, the development of phenological maps can be useful for determining the ripening zones within the vineyard and differentiated harvesting. For example, studies have shown that late pruning after budbreak can delay phenology and, consequently, ripening. Therefore, knowledge of the effects of pruning timing on grape production and composition provides useful information for viticulturists to inform their vineyard management [50].
The elaboration of phenograms for the studied varieties under the existing conditions at Murfatlar can provide support for optimizing viticultural technologies in this vineyard, which is characterized by extreme climatic factors, including high temperatures and water deficits. Currently, in the Murfatlar vineyard, climatological studies indicate that the average annual temperature, heat balance, and number of days with scorching temperatures (˃ 35°C) have increased. At the same time, precipitation, particularly useful precipitation [51], has decreased. Additionally, the phenophase progression differs in the field compared to the protected cultivation of table grape varieties. In this context, recent studies propose the development of separate phenological calendars [52]. This approach, under current climatic conditions, proves useful not only for viticulture but also for other horticultural sectors such as fruit growing [9,53].
4. Conclusions
The study showed that the variety and climatic characteristics of the viticultural year phenologically influence all 5 fresh grape varieties studied.
The data recorded in this study highlight the fingerprint of terroir on certain table grape varieties, an important step in exploring phenotypic diversity among them.
These findings contribute to a deeper understanding of the impacts and consequences of climate change, providing valuable insights into the challenges faced by the wine sector.
Author Contributions
Conceptualization, L.C.M., R.C.; methodology, G.B.; software, V.S.; investigation, G.B.; resources, N.G.; writing—original draft preparation, L.C.M.; writing—review and editing, L.C.M, R.C.; supervision, L.C.M. All authors have read and agreed to the published version of the manuscript.
Funding
This research received no external funding.
Data Availability Statement
Not applicable.
Conflicts of Interest
The authors declare that they have no conflicts of interest.
References
- Bucur, G.M.; Dejeu, L. Phenological and some eno-carpological traits of thirteen new Romanian grapevine varieties for white wine (Vitis Vinifera L.) in the context of climate change. Scientific Papers. Series B. Horticulture. 2024, 68 (1), 254-263. https://horticulturejournal.usamv.ro/pdf/2024/issue_1/Art32.pdf.
- Antoce, A.O.; Călugăru, L.L. Evolution of grapevine surfaces in Romania after accession to European Union - period 2007-2016. 40th World Congress of Vine and Wine, BIO Web of Conf. 2017, 9, 1-7. [CrossRef]
- Tangolar, S.; Temel, N.; Torun, H.; Tangolar, S.; Karaman, Y.; Tursun, N.; Torun, A. A. Impact of organic and non-organic mulching on grape yield, quality and ecophysiological traits under irrigated and nonirrigated conditions. OENO One. 2025, 59 (1). [CrossRef]
- Carrera, L.; Fernández-González, M.; Aira, M. J.; Espinosa, K.C.S.; Otero, R.P.; Rodríguez-Rajo, F. J. Airborne Plasmopara viticola Sporangia: A Study of Vineyards in Two Bioclimatic Regions of Northwestern Spain. Horticulturae. 2025, 11 (3), 228. [CrossRef]
- Cameron, B.I. Phenology and Terroir Heard Through the Grapevine. In Phenology: An Integrative Environmental Science, 3nd ed.; Cham: Springer Nature Switzerland, 2024; pp. 573-593. [CrossRef]
- Costea, D. C.; Căpruciu, R. The influence of environmental resources specific to the cultivation year over the grapevine growth and yield. Annals of the University of Craiova - Agriculture Montanology Cadastre Series. 2022, 52 (1), 95-100. [CrossRef]
- Lakatos, L.; Nagy, R. Assessment of historical and future changes in temperature indices for winegrape suitability in Hungarian wine regions (1971-2100). Frontiers in Plant Science. 2025, 16, 1481431. [CrossRef]
- Tiefenbacher, J.P.; Townsend, C. The Semiofoodscape of Wine: The Changing Global Landscape of Wine Culture and the Language of Making, Selling and Drinking Wine. In Handbook of the Changing World Language Map; Springer International Publishing: Basel, Switzerland, 2019; pp. 1-44.
- Dinu, M.D., Mazilu, I.E.; Cosmulescu, S. Influence of climatic factors on the phenology of chokeberry cultivars planted in the Pedoclimatic conditions of southern Romania. Sustainability. 2022, 14 (9), 4991. [CrossRef]
- Parra, A.S.S.; Gascueña, J.M.; Alonso, G.L.; Tarancón, C.C.; Morales, A.M.; Vozmediano, J.L.C. Exploring intra-specific variability as an adaptive strategy to climate change: Response of 21 grapevine cultivars grown under drought conditions. OENO One, 2024, 58 (3). [CrossRef]
- Maciejewska, D.; Olewnicki, D.; Stangierska-Mazurkiewicz, D.; Tyminski, M., Latocha, P. Impact of climate change on the development of viticulture in central Poland: autoregression modeling SAT indicator. Agriculture. 2024, 14 (5), 748. [CrossRef]
- Williamson, J.A.; Petrone, R.M.; Valentini, R.; Macrae, M.L.; Reynolds, A. Assessing the influence of climate controls on grapevine biophysical responses: a review of Ontario viticulture in a changing climate. Canadian Journal of Plant Science. 2024, 104 (5), 394-409. [CrossRef]
- Colibaba, L.C.; Bosoi, I.; Pușcalău, M.; Bodale, I.; Luchian, C. Rotaru, L.; Cotea, V.V. Climatic projections vs. grapevine phenology: A regional case study. Notulae Botanicae Horti Agrobotanici Cluj-Napoca, 2024, 52 (1), 13381-13381. [CrossRef]
- Van Leeuwen, C.; Darriet, P. The impact of climate change on viticulture and wine quality. J. Wine Econ. 2016, 11, 150-167. [CrossRef]
- Galal, H.; Ghoneem, G.M.; Khalil, R.; Yusuf, M.; Allam, A.; Abou Elyazid, D.M. Plastic Covering Accelerates Phenological Stages and Causes Abiotic Stress in Table Grapes in Egypt. Journal of Plant Production, 2024, 15 (10), 629-636. [CrossRef]
- Cichi, D.D.; Cichi, M.; Gheorghiu, N. Thermal regime during cold acclimation and dormant season of grapevines in context of climate changes-Hills of Craiova vineyard (Romania). Annals of the University of Craiova-Agriculture, Montanology, Cadastre Series. 2021, 51 (1), 50-59.
- Mărăcineanu, C.; Giugea, N.; Muntean, L.; Căpruciu, R. Analyses of the influence of crop load on biological and productive characteristics of some table grape varieties grown in the Severin vineyard. Scientific Papers. Series B. Horticulture. 2022, 66 (1). https://horticulturejournal.usamv.ro/pdf/2022/issue_1/Art47.pdf.
- Monteiro, A.; Pereira, S.; Bernardo, S.; Gómez-Cadenas, A.; Moutinho-Pereira, J.; Dinis, L.T. Biochemical analysis of three red grapevine varieties during three phenological periods grown under Mediterranean climate conditions. Plant Biology. 2024, 26 (5), 855-867. [CrossRef]
- Gerbi, V.; De Paolis, C. The effects of climate change on wine composition and winemaking processes. Italian Journal of Food Science, 2025, 37 (1), 246-260.
- Baltazar, M.; Castro, I.; Gonçalves, B. Adaptation to Climate Change in Viticulture: The Role of Varietal Selection-A Review. Plants. 2025, 14 (1), 104. [CrossRef]
- Llanaj, C.; McGregor, G. Climate change, grape phenology, and frost risk in Southeast England. Australian Journal of Grape and Wine Research. 2022, (1), 9835317. [CrossRef]
- Fernandes de Oliveira, A.; Piga, G.K.; Najoui, S.; Becca, G.; Marceddu, S.; Rigoldi, M.P.; Nieddu, G. UV light and adaptive divergence of leaf physiology, anatomy, and ultrastructure drive heat stress tolerance in genetically distant grapevines. Frontiers in Plant Science. 2024, 15, 1399840. [CrossRef]
- Procino, S.; Miazzi, M.M.; Savino, V.N.; La Notte, P.; Venerito, P.; D’Agostino, N.; Montemurro, C. Genome Scan Analysis for Advancing Knowledge and Conservation Strategies of Primitivo Clones (Vitis vinifera L.). Plants. 2025, 14 (3), 437. [CrossRef]
- Kamila, S.; Widodo, W.D.; Santosa, E.; Suhartanto, M.R. Flowering and fruiting phenology in two varieties of grapes (Vitis vinifera) in tropical regions, Indonesia. Biodiversitas Journal of Biological Diversity. 2024, 25 (11). [CrossRef]
- Rafique, R.; Ahmad, T.; Ahmed, M; Khan, M.A.; Wilkerson, C.J.; Hoogenboom G. Seasonal variability in the effect of temperature on key phenological stages of four table grapes cultivars. Int. J. Biometeorol. 2023, 67, 745-759. [CrossRef]
- Faralli, M.; Martintoni, S.; Giberti, F.D.; Bertamini, M. Dynamic of bud ecodormancy release in Vitis vinifera: Genotypic variation and late frost tolerance traits monitored via chlorophyll fluorescence emission. Scientia Horticulturae. 2024, 331, 113169.
- Santillán, D.; Garrote, L.; Iglesias, A.; Sotes, V. Climate Change Risks and Adaptation: New Indicators for Mediterranean Viticulture. Mitig. Adapt. Strateg. Glob. Change. 2020, 25, 881-899. [CrossRef]
- Tramblay, Y.; Koutroulis, A.; Samaniego, L.; Vicente-Serrano, S.M.; Volaire, F.; Boone, A.; Le Page, M.; Llasat, M.C.; Albergel, C.; Burak, S.; Cailleret, M.; Kalin, K.C.; Davi, H.; Dupuy, J.L.; Greve, P.; Grillakis, M.; Hanich, L.; Jarlan, L.; Martin-StPaul, N.; Martínez-Vilalta, J.; Mouillot, F.; D. Pulido-Velazquez, D.; Quintana-Seguí, P.; Renard, D.; Turco, M.; Türkeş, M.; Trigo, R.; Vidal, J.P.; Vilagrosa, A.; Zribi, M.; Polcher. J. Challenges for drought assessment in the Mediterranean region under future climate scenarios. Earth-Science Reviews. 2020, 210,103348. [CrossRef]
- Droulia, F.; Charalampopoulos, I. Future Climate Change Impacts on European Viticulture: A Review on Recent Scientific Advances. Atmosphere. 2021, 12 (4), 495. [CrossRef]
- Grillakis, M. G.; Doupis, G.; Kapetanakis, E.; Goumenaki, E. Future shifts in the phenology of table grapes on Crete under a warming climate. Agricultural and Forest Meteorology. 2022, 318, 108915. [CrossRef]
- Verdugo-Vásquez, N.; Pañitrur-De la Fuente, C.; Ortega-Farías, S. Model Development to Predict Phenological scale of Table Grapes (cvs. Thompson, Crimson and Superior Seedless and Red Globe) using Growing Degree Days. OENO One. 2017, 51 (3). [CrossRef]
- Espinosa-Roldán, F.E.; García-Díaz, A.; Raboso, E.; Crespo, J.; Cabello, F.; Martínez de Toda, F.; Muñoz-Organero, G. Phenological Evaluation of Minority Grape Varieties in the Wine Region of Madrid as a Strategy for Adaptation to Climate Change. Horticulturae. 2024, 10 (4). 353. [CrossRef]
- del Río, S.; Álvarez-Esteban, R.; Alonso-Redondo, R.; Álvarez, R.; Rodríguez-Fernández, M.P.; González-Pérez, A.; Penas, A. Applications of bioclimatology to assess effects of climate change on viticultural suitability in the DO León (Spain). Theoretical and Applied Climatology. 2024, 155 (4). 3387-3404. [CrossRef]
- Pourreza, A.; Kamiya, Y.; Peanusaha, S.; Jafarbiglu, H.; Moghimi, A.; Fidelibus, M.W. Nitrogen retrieval in grapevine (Vitis vinifera L.) canopy by hyperspectral imaging. Computers and Electronics in Agriculture. 2025, 229, 109717. [CrossRef]
- Chedea, V. S.; Drăgulinescu, A.M.; Tomoiagă, L.L.; Bălăceanu, C.; Iliescu, M.L. Climate change and internet of things technologies-sustainable premises of extending the culture of the Amurg cultivar in Transylvania-a use case for Târnave vineyard. Sustainability. 2021, 13 (15), 8170. [CrossRef]
- Stațiunea Murfatlar. Available online: https://statiuneamurfatlar.ro/vocatia-podgoriei-si-a-statiunii/ (accesed 03/16/2025).
- Borghezan, M.; Villar, L.; Silva, T.; Canton, M.; Guerra, M.; Campos, C. Phenology and Vegetative Growth in a New Production Region of Grapevines: Case Study in São Joaquim, Santa Catarina, Southern Brazil. Open Journal of Ecology. 2014, 4, 321-335. doi: 10.4236/oje.2014.46030.
- García de Cortázar-Atauri, I.; Duchêne, E.; Destrac-Irvine, A.; Barbeau, G.; de Rességuier, L.; Lacombe, T.; Parker A.K.; Saurin N.; van Leeuwen, C. Grapevine phenology in France: from past observations to future evolutions in the context of climate change. OENO One. 2017, 51 (2), 115–126. [CrossRef]
- Verdugo-Vásquez, N.; Acevedo-Opazo, C.; Valdés-Gómez, H.; Araya-Alman, M.; Ingram, B.; de Cortázar-Atauri, I.G.; Tisseyre, B. Spatial variability of phenology in two irrigated grapevine cultivar growing under semi-arid conditions. Precision Agric. 2016, 17, 218–245. [CrossRef]
- Fraga, H.; Amraoui, M.; Malheiro, A.C.; Moutinho-Pereira, J.; Eiras-Dias, J.; Silvestre, J.; Santos, J.A. Examining the relationship between the Enhanced Vegetation Index and grapevine phenology. European Journal of Remote Sensing. 2014, 47 (1), 753–771. [CrossRef]
- Rodrigues, P.; Pedroso, V.; Reis, S.; Yang, C.; Santos, Santos J.A. Climate change impacts on phenology and ripening of cv. Touriga Nacional in the Dão Wine Region, Portugal. International Journal of Climatology. 2022, 42, (14). 7117-7132, doi:10.1002/joc.7633, 1097-0088 0899-8418.
- Cameron, W.; Petrie, P.R., Barlow, E.; Howell, K.; Jarvis, C.; Fuentes, S. A comparison of the effect of temperature on grapevine phenology between vineyards. OENO One. 2021, 55 (2), 301-320. [CrossRef]
- Bernáth, S.; Paulen, O.; Šiška, B.; Kusá, Z.; Tóth, F. Influence of Climate Warming on Grapevine (Vitis vinifera L.) Phenology in Conditions of Central Europe (Slovakia). Plants. 2021, 10, 1020. [CrossRef]
- Teker, T. Effects of temperature rise on grapevine phenology (Vitis vinifera L.): Impacts on early flowering and harvest in the 2024 Growing Season. International Journal of Agriculture, Environment and Food Sciences. 2024, 8 (4), 970-979. [CrossRef]
- Nunes, N.A.S.; Leite, A.V.; Castro, C.C. Phenology, reproductive biology and growing degree days of the grapevine ‘Isabel’ (Vitis labrusca, Vitaceae) cultivated in northeastern Brazil. Brazilian Journal of Biology. 2016, 76 (04). http://dx.doi.org/10.1590/1519-6984.05315.
- Rafique, R.; Ahmad, T.; Khan, M.A.; Ahmed, M.; Atak, A. Pheno-physiological responses of grapevine cultivars vary under the influence of growing season temperature – a study from Pothwar region of Pakistan. Acta Hortic. 2024, 1385, 197-204. DOI: 10.17660/ActaHortic.2024.1385.25.
- Rafique R.; Ahmad, T.; Abbasi, N.; Ahmed, M. Modeling phenological responses of table grape cultivars. In Book of abstract Second International Crop Modelling Symposium, Montpellier, France. 2020. https://inria.hal.science/hal-02950242v1.
- Munoz-Organero, G.; Espinosa, F.E.; Cabello, F.; Zamorano, J.P.; Urbanos, M.A.; Puertas, B.; Fernandez-Pastor, M. Phenological study of 53 Spanish minority grape varieties to search for adaptation of vitiviniculture to climate change conditions. Horticulturae. 2022, 8(11), 984. [CrossRef]
- Yilmaz, T. Understanding the Influence of Extreme Cold on Grapevine Phenology in South Dakota’s Dormant Season: Implications for Sustainable Viticulture. Applied Fruit Science. 2024, 66, 1019–1026. [CrossRef]
- Ghiglieno, I.; Facciano, L.; Valenti, L.; Amari, F.; Cola, G. Evaluation of the impact of vine pruning periods on grape production and composition: an integrated approach considering different years and cultivars. OENO ONE. 2025, 59. [CrossRef]
- Beleniuc G.V. Viticultura și vinificația de pe Valea Carasu de-a lungul vremurilor. Teză de doctorat. Universitatea din Craiova, 2022.
- Alonso, F.; Chiamolera, F.M.; Hueso, J.J.; González, M.; Cuevas, J. Heat unit requirements of “flame seedless” table grape: a tool to predict its harvest period in protected cultivation. Plants. 2021, 10 (5), 904. [CrossRef]
- Cosmulescu, S.; Laies, M.M.M.; Sărățeanu, V. The Influence of Variety and Climatic Year on the Phenology of Blueberry Grown in the Banat Area, Romania. Agronomy. 2022, 12, 2605. [CrossRef]
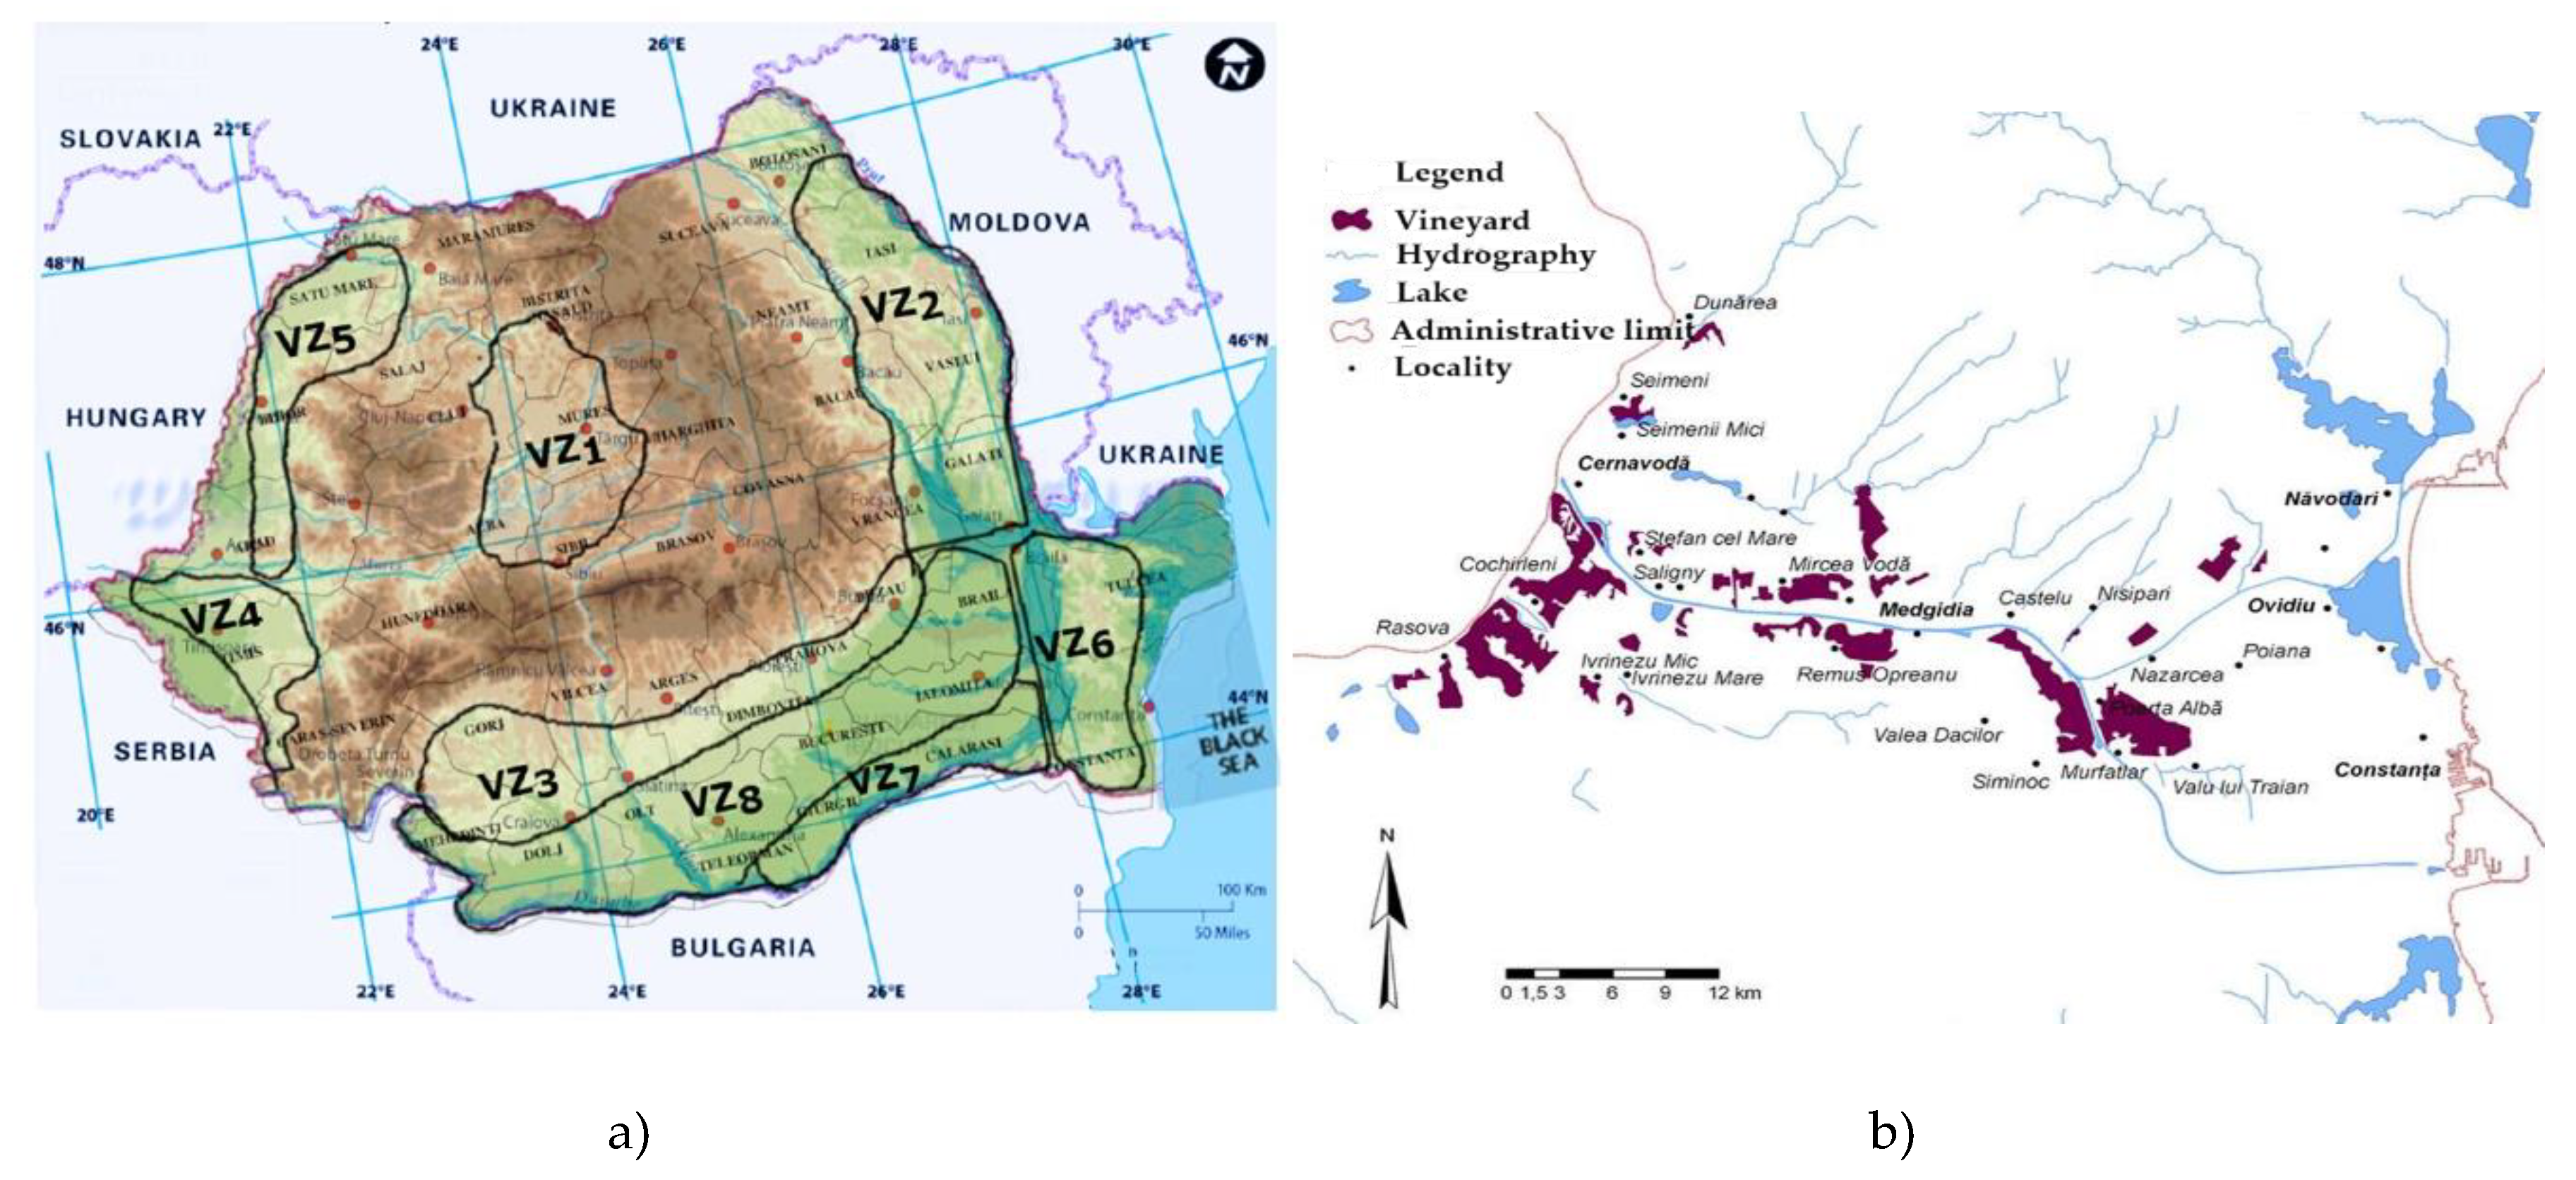
Figure 2.
Correlations between the analyzed phenotypes of table grape varieties cultivated in Murfatlar vineyard in the period 2000-2019.
Figure 2.
Correlations between the analyzed phenotypes of table grape varieties cultivated in Murfatlar vineyard in the period 2000-2019.
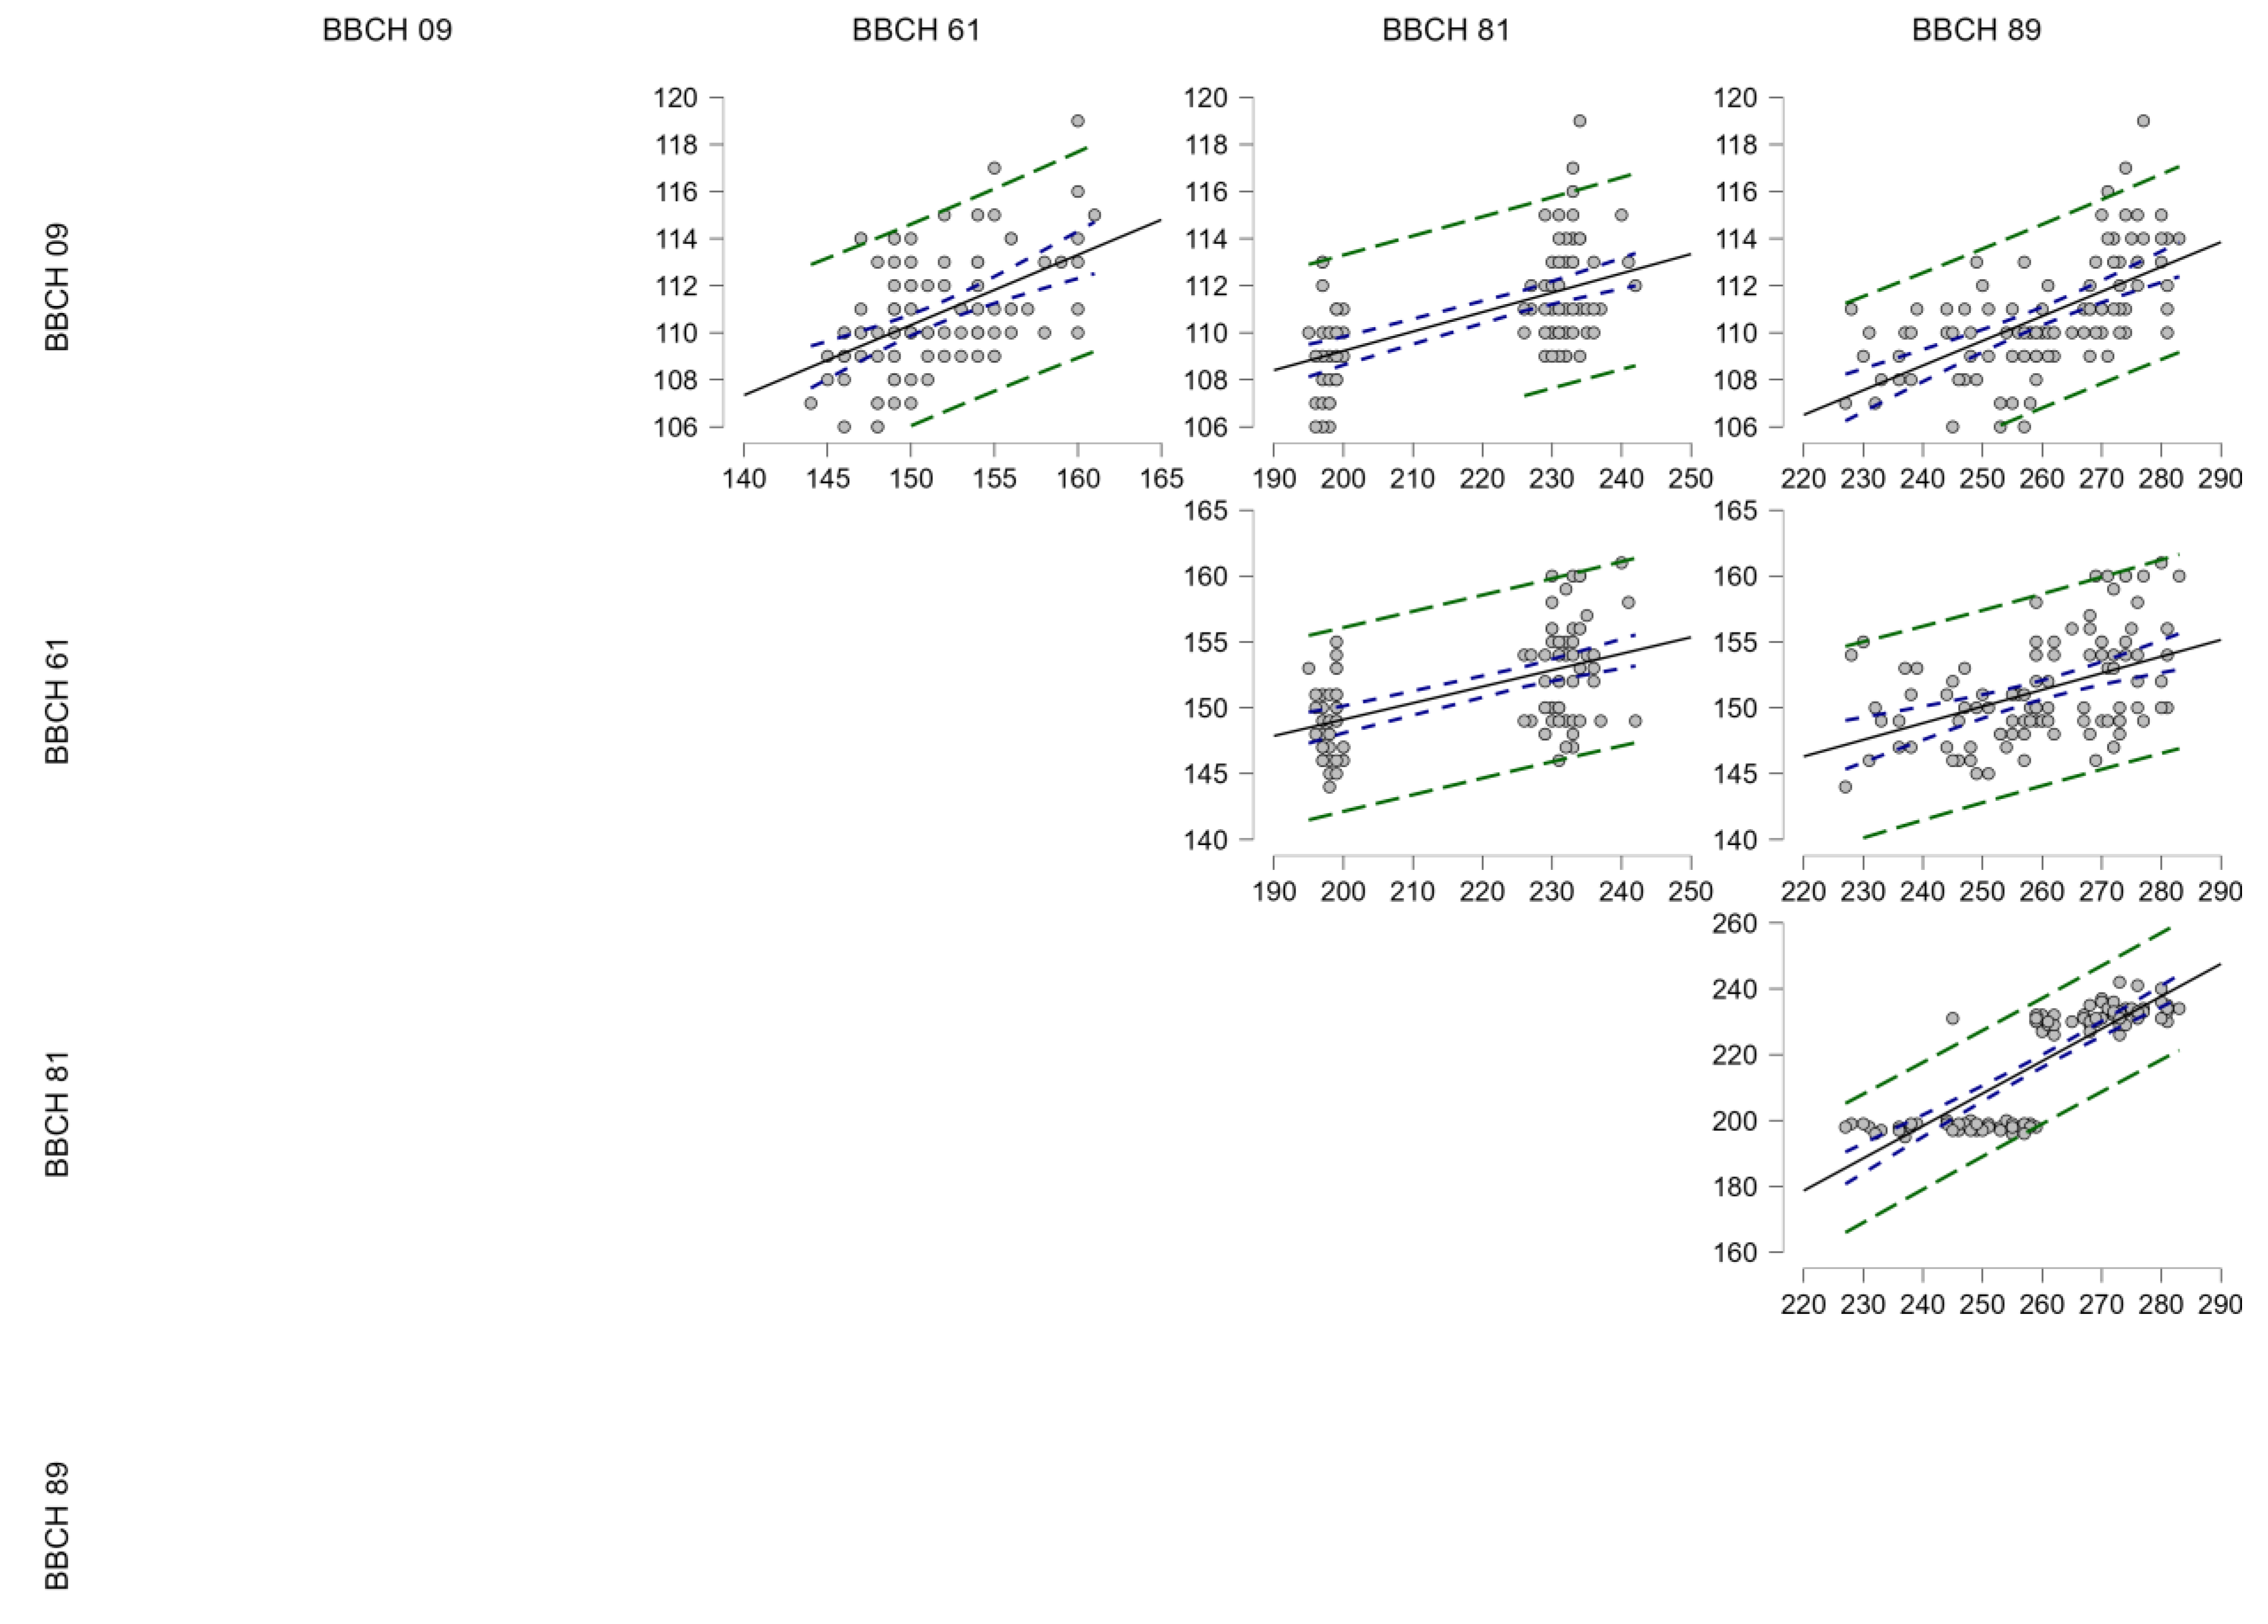

Table 1.
Descriptive statistics on the influence of variety on phenotypes of table grape varieties grown in Murfatlar (2000-2019).
Table 1.
Descriptive statistics on the influence of variety on phenotypes of table grape varieties grown in Murfatlar (2000-2019).
| Phenophase | Variety | Mean | SD | CV (%) | Shapiro–Wilk | p-Value of Shapiro–Wilk | Minimum | Maximum |
|---|---|---|---|---|---|---|---|---|
| BBCH 09 (Bud burst) |
Victoria | 108.750 | 1.997 | 1.836 | 0.944 | 0.284 | 106.000 | 113.000 |
| Cardinal | 109.500 | 1.573 | 1.437 | 0.942 | 0.265 | 107.000 | 113.000 | |
| Muscat Hamburg | 110.100 | 1.021 | 0.927 | 0.790 | < 0.001 | 109.000 | 113.000 | |
| Italia | 113.650 | 1.461 | 1.286 | 0.889 | 0.026 | 110.000 | 117.000 | |
| Afuz-Ali | 111.750 | 2.359 | 2.111 | 0.754 | < 0.001 | 109.000 | 119.000 | |
| BBCH 61 (Beginning of flowering) |
Victoria | 148.600 | 1.789 | 1.204 | 0.937 | 0.212 | 145.000 | 151.000 |
| Cardinal | 149.300 | 3.230 | 2.163 | 0.953 | 0.410 | 144.000 | 155.000 | |
| Muscat Hamburg | 152.200 | 3.443 | 2.262 | 0.920 | 0.098 | 148.000 | 160.000 | |
| Italia | 153.150 | 4.320 | 2.821 | 0.951 | 0.380 | 147.000 | 161.000 | |
| Afuz-Ali | 153.850 | 4.295 | 2.792 | 0.929 | 0.147 | 146.000 | 160.000 | |
| BBCH 81 (Beginning of ripening) |
Victoria | 198.000 | 1.124 | 0.568 | 0.907 | 0.056 | 196.000 | 200.000 |
| Cardinal | 198.100 | 1.294 | 0.653 | 0.917 | 0.088 | 195.000 | 200.000 | |
| Muscat Hamburg | 230.100 | 1.651 | 0.718 | 0.889 | 0.026 | 226.000 | 232.000 | |
| Italia | 233.650 | 2.870 | 1.228 | 0.870 | 0.012 | 229.000 | 241.000 | |
| Afuz-Ali | 232.600 | 3.619 | 1.556 | 0.962 | 0.581 | 226.000 | 242.000 | |
| BBCH 89 (Full maturity) |
Victoria | 253.450 | 4.395 | 1.734 | 0.895 | 0.033 | 245.000 | 259.000 |
| Cardinal | 239.250 | 7.779 | 3.251 | 0.941 | 0.250 | 227.000 | 251.000 | |
| Muscat Hamburg | 261.200 | 5.053 | 1.935 | 0.814 | 0.001 | 245.000 | 269.000 | |
| Italia | 275.450 | 3.620 | 1.314 | 0.894 | 0.032 | 271.000 | 283.000 | |
| Afuz-Ali | 272.900 | 4.315 | 1.581 | 0.876 | 0.015 | 268.000 | 281.000 |
SD = standard deviation; CV = coefficient of variation.
Table 2.
Descriptive statistics on the influence of the year on phenotypes of table grape varieties grown in Murfatlar (2000-2019).
Table 2.
Descriptive statistics on the influence of the year on phenotypes of table grape varieties grown in Murfatlar (2000-2019).
| Phenophase | Year | Mean | SD* | CV (%) | Shapiro–Wilk | p-Value of Shapiro–Wilk | Minimum | Maximum |
|---|---|---|---|---|---|---|---|---|
| BBCH 09 (Bud burst) |
2000 | 110.800 | 2.280 | 2.058 | 0.961 | 0.814 | 108.000 | 114.000 |
| 2001 | 111.200 | 2.280 | 2.050 | 0.961 | 0.814 | 108.000 | 114.000 | |
| 2002 | 111.200 | 1.643 | 1.478 | 0.779 | 0.054 | 110.000 | 114.000 | |
| 2003 | 112.600 | 3.782 | 3.359 | 0.786 | 0.062 | 110.000 | 119.000 | |
| 2004 | 112.800 | 1.095 | 0.971 | 0.828 | 0.135 | 111.000 | 114.000 | |
| 2005 | 111.800 | 3.114 | 2.785 | 0.885 | 0.332 | 108.000 | 115.000 | |
| 2006 | 111.600 | 2.881 | 2.582 | 0.871 | 0.269 | 109.000 | 116.000 | |
| 2007 | 110.000 | 3.240 | 2.945 | 0.922 | 0.543 | 106.000 | 115.000 | |
| 2008 | 111.800 | 2.950 | 2.639 | 0.688 | 0.007 | 110.000 | 117.000 | |
| 2009 | 111.200 | 1.643 | 1.478 | 0.779 | 0.054 | 110.000 | 114.000 | |
| 2010 | 110.200 | 2.775 | 2.518 | 0.939 | 0.656 | 107.000 | 114.000 | |
| 2011 | 110.400 | 1.673 | 1.515 | 0.881 | 0.314 | 109.000 | 113.000 | |
| 2012 | 112.000 | 1.225 | 1.094 | 0.833 | 0.146 | 111.000 | 114.000 | |
| 2013 | 110.400 | 1.673 | 1.515 | 0.881 | 0.314 | 109.000 | 113.000 | |
| 2014 | 109.800 | 2.387 | 2.174 | 0.974 | 0.899 | 107.000 | 113.000 | |
| 2015 | 110.200 | 2.490 | 2.260 | 0.895 | 0.384 | 108.000 | 114.000 | |
| 2016 | 110.600 | 2.702 | 2.443 | 0.903 | 0.427 | 108.000 | 115.000 | |
| 2017 | 109.000 | 2.000 | 1.835 | 0.905 | 0.440 | 106.000 | 111.000 | |
| 2018 | 108.800 | 2.683 | 2.466 | 0.916 | 0.502 | 106.000 | 113.000 | |
| 2019 | 108.600 | 1.517 | 1.397 | 0.803 | 0.086 | 107.000 | 110.000 | |
| BBCH 61 (Beginning of flowering) |
2000 | 148.400 | 1.817 | 1.224 | 0.867 | 0.254 | 146.000 | 150.000 |
| 2001 | 149.800 | 0.837 | 0.558 | 0.881 | 0.314 | 149.000 | 151.000 | |
| 2002 | 149.000 | 2.449 | 1.644 | 0.833 | 0.146 | 147.000 | 153.000 | |
| 2003 | 153.800 | 5.404 | 3.514 | 0.957 | 0.785 | 147.000 | 160.000 | |
| 2004 | 155.800 | 5.762 | 3.698 | 0.712 | 0.013 | 149.000 | 160.000 | |
| 2005 | 154.200 | 4.868 | 3.157 | 0.937 | 0.643 | 149.000 | 161.000 | |
| 2006 | 154.800 | 6.058 | 3.913 | 0.860 | 0.228 | 146.000 | 160.000 | |
| 2007 | 151.600 | 3.782 | 2.495 | 0.800 | 0.081 | 147.000 | 155.000 | |
| 2008 | 153.800 | 1.924 | 1.251 | 0.979 | 0.928 | 151.000 | 156.000 | |
| 2009 | 152.400 | 3.912 | 2.567 | 0.902 | 0.421 | 147.000 | 156.000 | |
| 2010 | 150.200 | 3.899 | 2.596 | 0.908 | 0.455 | 145.000 | 154.000 | |
| 2011 | 150.000 | 3.162 | 2.108 | 0.912 | 0.482 | 147.000 | 155.000 | |
| 2012 | 152.000 | 3.082 | 2.028 | 0.903 | 0.429 | 149.000 | 156.000 | |
| 2013 | 151.600 | 2.881 | 1.900 | 0.951 | 0.742 | 148.000 | 155.000 | |
| 2014 | 151.800 | 4.764 | 3.138 | 0.711 | 0.012 | 149.000 | 160.000 | |
| 2015 | 151.600 | 3.286 | 2.168 | 0.845 | 0.179 | 149.000 | 157.000 | |
| 2016 | 149.600 | 4.159 | 2.780 | 0.947 | 0.715 | 145.000 | 155.000 | |
| 2017 | 149.400 | 3.847 | 2.575 | 0.829 | 0.137 | 146.000 | 154.000 | |
| 2018 | 151.400 | 2.408 | 1.590 | 0.957 | 0.787 | 148.000 | 154.000 | |
| 2019 | 147.200 | 2.168 | 1.473 | 0.871 | 0.272 | 144.000 | 149.000 | |
| BBCH 81 (Beginning of ripening) |
2000 | 218.400 | 18.202 | 8.334 | 0.736 | 0.022 | 198.000 | 233.000 |
| 2001 | 217.600 | 18.407 | 8.459 | 0.751 | 0.030 | 197.000 | 233.000 | |
| 2002 | 215.400 | 17.869 | 8.296 | 0.793 | 0.071 | 195.000 | 232.000 | |
| 2003 | 220.000 | 19.455 | 8.843 | 0.862 | 0.235 | 199.000 | 241.000 | |
| 2004 | 218.400 | 19.604 | 8.976 | 0.731 | 0.020 | 197.000 | 234.000 | |
| 2005 | 219.600 | 19.655 | 8.950 | 0.822 | 0.121 | 198.000 | 240.000 | |
| 2006 | 218.600 | 17.925 | 8.200 | 0.727 | 0.018 | 199.000 | 233.000 | |
| 2007 | 218.400 | 18.743 | 8.582 | 0.766 | 0.041 | 198.000 | 235.000 | |
| 2008 | 219.000 | 18.722 | 8.549 | 0.706 | 0.011 | 198.000 | 233.000 | |
| 2009 | 218.600 | 17.516 | 8.013 | 0.758 | 0.035 | 199.000 | 234.000 | |
| 2010 | 217.000 | 17.903 | 8.250 | 0.761 | 0.037 | 197.000 | 232.000 | |
| 2011 | 218.600 | 20.330 | 9.300 | 0.781 | 0.057 | 196.000 | 237.000 | |
| 2012 | 220.600 | 20.256 | 9.182 | 0.835 | 0.153 | 199.000 | 242.000 | |
| 2013 | 217.400 | 16.817 | 7.736 | 0.719 | 0.015 | 199.000 | 231.000 | |
| 2014 | 219.200 | 19.867 | 9.063 | 0.748 | 0.029 | 197.000 | 236.000 | |
| 2015 | 219.600 | 18.863 | 8.590 | 0.736 | 0.022 | 199.000 | 235.000 | |
| 2016 | 218.800 | 17.641 | 8.063 | 0.727 | 0.018 | 199.000 | 233.000 | |
| 2017 | 219.000 | 20.285 | 9.263 | 0.758 | 0.036 | 197.000 | 236.000 | |
| 2018 | 218.000 | 20.112 | 9.226 | 0.722 | 0.016 | 196.000 | 234.000 | |
| 2019 | 217.600 | 17.897 | 8.225 | 0.698 | 0.009 | 198.000 | 231.000 | |
| BBCH 89 (Full maturity) |
2000 | 258.200 | 19.867 | 7.694 | 0.977 | 0.916 | 231.000 | 281.000 |
| 2001 | 260.000 | 17.479 | 6.723 | 0.920 | 0.528 | 236.000 | 277.000 | |
| 2002 | 258.000 | 15.540 | 6.023 | 0.914 | 0.494 | 237.000 | 273.000 | |
| 2003 | 263.400 | 13.704 | 5.203 | 0.919 | 0.525 | 244.000 | 277.000 | |
| 2004 | 266.400 | 13.520 | 5.075 | 0.975 | 0.906 | 249.000 | 283.000 | |
| 2005 | 265.000 | 10.977 | 4.142 | 0.998 | 0.998 | 251.000 | 280.000 | |
| 2006 | 260.600 | 11.502 | 4.414 | 0.914 | 0.490 | 244.000 | 272.000 | |
| 2007 | 261.600 | 17.038 | 6.513 | 0.975 | 0.906 | 238.000 | 281.000 | |
| 2008 | 263.400 | 13.831 | 5.251 | 0.949 | 0.727 | 247.000 | 281.000 | |
| 2009 | 260.200 | 15.675 | 6.024 | 0.996 | 0.997 | 239.000 | 281.000 | |
| 2010 | 262.200 | 11.946 | 4.556 | 0.918 | 0.519 | 251.000 | 280.000 | |
| 2011 | 258.600 | 14.673 | 5.674 | 0.924 | 0.557 | 236.000 | 273.000 | |
| 2012 | 258.400 | 18.916 | 7.320 | 0.885 | 0.331 | 228.000 | 275.000 | |
| 2013 | 260.800 | 18.674 | 7.160 | 0.850 | 0.195 | 230.000 | 276.000 | |
| 2014 | 262.400 | 18.366 | 6.999 | 0.913 | 0.487 | 233.000 | 280.000 | |
| 2015 | 253.600 | 14.876 | 5.866 | 0.853 | 0.205 | 238.000 | 271.000 | |
| 2016 | 262.000 | 12.748 | 4.866 | 0.863 | 0.238 | 248.000 | 276.000 | |
| 2017 | 259.000 | 12.884 | 4.975 | 0.849 | 0.190 | 245.000 | 272.000 | |
| 2018 | 258.200 | 16.146 | 6.253 | 0.861 | 0.232 | 232.000 | 272.000 | |
| 2019 | 257.000 | 18.166 | 7.068 | 0.873 | 0.280 | 227.000 | 273.000 |
*SD = standard deviation; CV = coefficient of variation.
Table 3.
Matrix of correlations between analyzed phenotypes of table grape varieties grown in Murfatlar (2000-2019).
Table 3.
Matrix of correlations between analyzed phenotypes of table grape varieties grown in Murfatlar (2000-2019).
| Variable | BBCH 09 | BBCH 61 | BBCH 81 | BBCH 89 | |
|---|---|---|---|---|---|
| BBCH 09 | Pearson’s r | — | |||
| p-value | — | ||||
| Lower 95% CI | — | ||||
| Upper 95% CI | — | ||||
| BBCH 61 | Pearson’s r | 0.493*** | — | ||
| p-value | < 0.001 | — | |||
| Lower 95% CI | 0.328 | — | |||
| Upper 95% CI | 0.628 | — | |||
| BBCH 81 | Pearson’s r | 0.569*** | 0.522*** | — | |
| p-value | < 0.001 | < 0.001 | — | ||
| Lower 95% CI | 0.419 | 0.363 | — | ||
| Upper 95% CI | 0.688 | 0.652 | — | ||
| BBCH 89 | Pearson’s r | 0.610*** | 0.445*** | 0.828*** | — |
| p-value | < 0.001 | < 0.001 | < 0.001 | — | |
| Lower 95% CI | 0.470 | 0.273 | 0.754 | — | |
| Upper 95% CI | 0.720 | 0.590 | 0.881 | — |
* p < 0.05, ** p < 0.01, *** p < 0.001.
Disclaimer/Publisher’s Note: The statements, opinions and data contained in all publications are solely those of the individual author(s) and contributor(s) and not of MDPI and/or the editor(s). MDPI and/or the editor(s) disclaim responsibility for any injury to people or property resulting from any ideas, methods, instructions or products referred to in the content. |
© 2025 by the authors. Licensee MDPI, Basel, Switzerland. This article is an open access article distributed under the terms and conditions of the Creative Commons Attribution (CC BY) license (http://creativecommons.org/licenses/by/4.0/).
Copyright: This open access article is published under a Creative Commons CC BY 4.0 license, which permit the free download, distribution, and reuse, provided that the author and preprint are cited in any reuse.


