
Submitted:
03 April 2025
Posted:
04 April 2025
You are already at the latest version
Abstract
Portfolio management, a critical application of financial market analysis, involves optimising asset allocation to maximise returns while minimising risk. This paper addresses the notable research gap in analysing historical financial data for portfolio optimisation purposes. Particularly, the research examines different approaches for handling missing values and volatility, while examining their effects on optimal portfolios. For this portfolio optimisation task, the study employs metaheuristic approach through Swarm Intelligence algorithm, particularly Particle Swarm Optimisation and its variants. Additionally, it aims to enhance portfolio diversity for risk minimisation by dynamically clustering and selecting appropriate assets using proposed strategies. This entire investigation focuses on improving risk-adjusted return metrics, like Sharpe, Adjusted Sharpe and Sortino ratios, for single asset class portfolios over two distinct classes of assets, cryptocurrencies and stocks. Considering relatively high market activity during pre, during and post-pandemic conditions, experiments utilise historical data spanning from 2015 to 2023. Results indicate that Sharpe ratios of portfolios across both asset classes are maximised by employing linear interpolation for missing value imputation and exponential moving average smoothing with lower smoothing factor (α). Furthermore, incorporating assets from different clusters significantly improves risk-adjusted returns of portfolios as compared to when portfolios are restricted to high market-capitalisation assets.
Keywords:
portfolio optimisation
; clustering
; asset selection
; Sharpe and Adjusted Sharpe ratios
; rebalancing
1. Introduction
The financial sector has been transformed by the use of algorithms to provide customised recommendations for the investment in the financial assets based on individual financial profiles and risk tolerance. This concept of finding the optimal asset combination to achieve the desired returns with risk tailored to the investors’ tolerance is called Portfolio Optimisation (PO) [1]. A wide variety of algorithms, including the foundational Markowitz Modern Portfolio Theory (MPT) [2], Sharpe Ratio Optimisation [3], Conditional Value at Risk (CVaR) Optimisation [4], have been suggested for this task. Recent innovations in the process of determination of appropriate weights include metaheuristic algorithms, particularly nature-inspired methods like Evolutionary and Swarm Intelligence, which evidently handle PO quite effectively under the real-world constraints [5,6,7].
Portfolio optimisation and management strategies are categorised as either passive or active approaches [8,9]. Passive portfolio management involves fund managers investing client’s capital in index funds or in selected securities, while maintaining fixed allocations until portfolio reaches maturity [8]. In contrast, active portfolio management employs trading strategies to outperform benchmark market index through strategic portfolio adjustments, such as asset selection and adjustment of weights, in response to market fluctuations [10]. Active portfolio management typically implements a rolling window methodology for the inclusion of recent market data to update the portfolio accordingly [10]. This systematic portfolio reallocation process, known as rebalancing, requires careful consideration of the frequency, as each rebalancing event incurs transaction costs in practical applications [11]. For both kinds of investments (active and passive), effective analysis of assets by the investor or fund manager is beneficial for the improvement of quality of portfolios [12]. This analysis can either be classified as fundamental analysis or technical analysis [13,14]. The former incorporates quantitative metrics and qualitative corporate indicators including product offerings, management policies, and organisational profiles [15,16]; the latter examines inherent asset patterns through price movements, trading volumes, and market dynamics [16]. Considering the benefit of higher returns from periodically updating the portfolios rather than passive portfolio strategy [17], this research focuses exclusively on the use of technical analysis of the market for active portfolio management strategies.
The quality of market data represents a crucial component in portfolio profitability within technical market analysis frameworks. The inherent volatility of historical asset data demands processing techniques such as reduction of short term fluctuations with the help of smoothing methods like Moving Averages (MA) [18]. However, explicit research on the comparison of different preprocessing techniques for different asset types is limited. Existing studies usually employ specific methodologies for handling missing values and for smoothing purposes [19,20], while generally restricting their analyses to shorter timeframe (i.e couple of years) of historical data [21,22,23]. Consequently, this research focuses initially on evaluating the impact of various preprocessing methods on the single asset type portfolios.
An important part of financial asset allocation and portfolio optimisation lies in the identification of an appropriate set of assets for the portfolio [24], which is referred to as the asset selection stage. This is a prerequisite, before optimising and assessing the profitability of portfolios, since real-time financial market environment is characterised by an enormous number of financial assets of different types. Thus to create portfolios of manageable size which consists of the most suitable assets, asset selection becomes a crucial step. Given the financial markets have been shown to exhibit cross-asset correlations [25,26], strategic portfolio diversification has been advocated through uncorrelated asset selection as a fundamental risk mitigation approach [27]. Clustering algorithms facilitate portfolio diversification by partitioning similar assets into distinct groups [28], enabling this research to identify optimal asset selection strategies across various asset classes.
Beyond correlation: Extreme co-movements between financial assets
Overall, the research objective of this paper is to specifically answer the following research questions :
- RQ1 : To what extent do different smoothing techniques influence risk-adjusted returns of single asset type portfolios of different asset classes?
- RQ2 : Which selection criteria best identify representative assets from clusters formed using risk-return characteristics of smoothed data?
This paper is organised as follows: Section 2 discusses the related work in the field of portfolio optimisation and how metahueristic algorithms have been used for this purpose, with special focus on Particle Swarm Optimisation algorithm for optimal asset weight allocation from a large search space. Additionally, this section examines the deployment of various clustering methodologies to handle a wide variety of assets of different types. Section 3 describes the data accessing and processing steps followed by such algorithms that are used in our work. Further, it discusses various asset selection strategies in conjunction with the clustering algorithm and their effect on different risk-adjusted return metrics, which measure the return of an investment after consideration of the level of risk involved. Discussion on the results and other findings as well as benchmarking the results with the literature is presented in Section 4. Section 5 highlights the key outcomes and conclusions of this study followed by potential future work mentioned in Section 6 for the creation of more realistic portfolio optimisation systems.
2. Related Work
2.1. Traditional Portfolio Optimisation Techniques
2.1.1. Markowitz Mean - Variance (MV) Theory
Markowitz’s Mean-Variance portfolio theory [2] conceptualises the trade-off between return and risk of portfolio, which are represented by their mean and variance respectively. This enables the construction of portfolios along the efficient frontier, which represents the optimal portfolios that either maximise returns for given risk levels or minimise risk for given returns. Mathematically, this model can be represented as follows [5]
where N is the number of assets, is the mean return of asset i, is the covariance of returns of assets i and j, and R is the investor’s target rate of return. The goal is to find optimal weight allocation which minimises the portfolio risk, , for the given expected return, .
2.1.2. Sharpe and Sortino Ratio
The Sharpe Ratio model [3] modifies the MV framework by incorporating risk-free returns, such as 3-Month US Treasury Bills [29], which represents the yield from a security with theoretically zero-risk. This model aims to maximise the Sharpe Ratio () which is the ratio of excess returns (those exceeding the risk-free rate) to portfolio volatility (standard deviation). is one of the most commonly used metrics for evaluating the performance of portfolios [30,31,32] with higher values of it indicating more excess returns from the portfolio as compared to risk-free rate [21]. Mathematically, this can be represented as follows :
where is the expected portfolio return, is the risk free rate of return, and is the standard deviation of the portfolio value.
The Sortino ratio () [33] addresses the Sharpe ratio’s limitation of assuming normally distributed returns [34,35]. considers only the downside deviation[36,37], , which is a measure used to asses investment risk by considering only the negative deviations from a target return (usually zero or the risk-free rate).
Another variation of Sharpe ratio, which adjusts for skewness and kurtosis in the returns distribution of the assets through the use of a penalty factor for negative skewness and excessive kurtosis, is known as Adjusted Sharpe Ratio () [23] and is given by :
2.2. Portfolio Optimisation Using Meta Heuristic Algorithms
Due to the proliferation in asset data and compute power, use of metaheuristic algorithms such as Simulated Annealing (SA) [38], Tabu search (TS) [38,39], Particle Swarm Optimisation (PSO) [40], Ant Colony Optimisation (ACO) [41] and Evolutionary Algorithms (EA) [42] has grown. This is because research has indicated that such algorithms excel at solving diverse real-world optimisation challenges across domains such as job scheduling [43,44], classification [45] and robotics [46]. This stems from their capability to extensively explore and exploit solution spaces while seeking globally optimal or near-optimal solutions [47]. Extensive literature reviews have been conducted on the works of portfolio management using swarm intelligence (SI) and multi-objective evolutionary algorithms during the period of 1993-2023 [7,48,49,50]. They all consistently identify PSO as the predominant SI technique for Portfolio Optimisation (PO), followed by Genetic Algorithms (GAs) and Artificial Bee Colony (ABC) algorithms. To simulate the operational market conditions, previous researchers have also included different types of constraints such as bounds on holdings (limits on asset proportions), cardinality (maximum number of securities allowed), minimum transaction lots and sector (or market/class) capitalisation constraints.
Different variations of the PSO algorithm tailored specifically for the portfolio optimisation task have been suggested by different authors. A modification of PSO which increases exploration in the initial search steps and improves convergence speed in the final search steps has been developed in [51]. Using the weekly price data of different market indices, their strategy outperformed other PSO techniques in the literature on the basis of minimum mean percentage error. A novel version of PSO which considers different types of constraints discussed above is proposed in [5]. They compared their method with the Genetic Algorithm (GA) and showed that the proposed PSO effectively outperforms GA, especially in the case of large-scale problems. The criteria for evaluation used are best variance (i.e. lowest risk), mean variance, standard deviation of variances and mean run time. In order to maintain sufficient amount of diversity of the swarm and to prevent the PSO algorithm from premature convergence, [52] proposed a Hybrid PSO (HPSO) which maintains the diversity without computing it at every iteration, thus making the algorithm faster and efficient. A Heterogeneous Multiple Population PSO (HMPPSO) algorithm is proposed in [53] where the entire search space is partitioned into smaller sub-populations and then different variants of PSO are applied on each of these sub-population. On comparing with other PSO variants in terms of mean euclidean distance, variance of return error and mean return error, HMPPSO model proved to be more robust and effective, especially for high dimensional problems. Dynamically updating the coefficients and velocity equations has been used to improve the performance of PSO over other algorithms such as GA, Simulated Annealing (SA) and Tabu search (TS) [54,55,56]. Following the widespread use of the PSO algorithm and its variations, this work plans to use PSO and its modifications for the portfolio optimisation task.
Apart from PSO and its variants, other forms of nature-inspired algorithms have also been implemented for determining optimal portfolios. A comprehensive literature review on the use of multi-objective evolutionary algorithms for the purpose of portfolio optimisation is conducted by [57], which mentions different variations of EA developed for this task. A two-stage Genetic Algorithm (GA) was introduced in [58] to initially select high-quality assets and then optimise their weights. An improved Artificial Bee Colony (ABC) algorithm which provided the right balance between exploration and exploitation to find the most optimal solution was suggested in [59]. The results obtained proved to outperform Variable Neighbourhood Search (VNS), SA, TS and standard ABC in terms of diversity, effectiveness and convergence. A combination of the critical components from continuous Ant Colony Optimisation (ACO), ABC and GA models was used in [60] for solving the cardinality constrained portfolio optimisation problem. They proved their method’s efficiency over other methods including GA, TS and SA based on percentage error and return errors. Overall, nature inspired algorithms have been extensively used for the purpose of portfolio optimisation, accommodating various constraints inherent to financial markets. These algorithmic approaches exhibit considerable diversity in their computational complexity and implementation requirements.
2.3. Clustering of Financial Assets
Studies demonstrate that inclusion of a greater number of diverse assets in a portfolio effectively reduces unsystematic risk. This is because this kind of risk pertains specifically to individual companies or industries rather than a wider market [61]. However increasing the count of assets has been shown to introduce the curse of dimensionality and potentially elevate transaction costs - the cost incurred while buying and/or selling financial assets. To overcome this, careful asset selection while maintaining the cardinality constraint is essential. To address this, researchers have developed preprocessing methodologies based on clustering techniques that facilitate strategic asset selection from a larger asset universe[28]. Such clustering algorithms are broadly classified into the following categories : partitional, hierarchical, density-based and graph-based [62,63]. Among these, k-means and k-medoids represent the most prevalent partitional algorithms, and they iteratively aim to minimise the sum of distances between observations and corresponding medoids in every cluster [64]. In contrast to k-means where the centroids can be chosen as any arbitrary number representing the mean/average of the data objects, the k-medoids algorithm utilises actual data points/observations as centroids [65,66], thus making it more robust to outliers and noise [66,67]. Hierarchical clustering creates a tree like structure by recursively merging/splitting the clusters on a distance metric. DBSCAN (Density-Based Spatial Clustering of Applications with Noise) is an implementation of density-based algorithm that groups tightly packed financial assets according to specified density criteria.
These different clustering algorithms and their variations have been used for the portfolio optimisation (PO) task in the literature. K-means and k-medoids algorithms followed by MV-based portfolio optimisation is used for cryptocurrency based portfolios using the daily prices of the assets [22]. The simulation is executed for each monthly rebalancing period, wherein a single cluster, based on the risk tolerance of the investor, is selected as the optimal set of assets for the MV model. Their analysis proved that this enhances the results as compared to the classic MV, risk parity and hierarchical risk parity methods when evaluated using metrics such as Sharpe ratio, Omega ratio, Calmar ratio, Value at Risk (VaR) and Conditional Value at Risk (CVaR). VaR measures the potential loss in a portfolio over time with a specified confidence level. Whereas CVaR, also known as expected shortfall, measures tail risk by calculating the weighted average of extreme losses beyond the VaR threshold in an investment portfolio’s return distribution. Similarly cellwise outlier robustness and agglomerative clustering has been used for cryptocurrencies [23] along with different portfolio optimisation methods such as Equally weighted portfolio, Minimum-variance portfolio, Hierarchical Risk Parity [68], maxCluster portfolio, minCluster portfolio. maxCluster [69] includes selection of the cluster with maximum Sharpe ratio whereas minCluster is a novel strategy proposed by the authors where the cluster with minimum CVaR at 95% is considered. They mentioned that minCluster portfolio has the highest Adjusted Sharpe ratio (which takes into account the skewness and kurtosis of the returns distribution) and performs 50% better than the Equally weighted portfolio. In both [22] and [23], portfolios are generated using the assets belonging to only a single selected cluster. K-means has also been used for the clustering of top 100 cryptocurrencies in [64] followed by manual selection of 8 cryptocurrencies from these clusters for generating monthly portfolios. It considered daily returns of the crypto coins and CVaR for finding an optimal allocation strategy. One issue which can be observed is that the manual selection may not be feasible when handling with large datasets and may miss out some patterns or opportunities.
Apart from cryptocurrencies, clustering algorithms have been used for portfolio optimisation using data from DOW30, NASDAQ100 and S&P500 [28], Brazilian stock exchange (B3) [66] and NSE Nifty 100 (Indian stock market) [8]. Again k-means is used in [8] whereas k-medoids and Partitioning Around Medoids (PAM) is used in [66] and [28] respectively. Similarly, k-means is used on financial statements of the companies to cluster the stocks [70] and then assets belonging to the cluster with the highest expected return are selected for the portfolio. Then PSO algorithm is used for optimal weight allocation to the selected assets while returns and sharpe ratio metrics are used for portfolio evaluation. Hierarchical clustering with complete linkage is used to cluster industrial portfolios and S&P 500 stocks in a multi-period experimental design [71]. K-means, fuzzy k-means and self-organising maps were used to cluster the assets of the Bombay Stock Exchange based on Euclidean distance measure and then use the randomly selected assets from these clusters for PO using MV model [72]. The authors concluded that k-means is better than other methods when evaluated based on intraclass inertia metrics like Euclidean distance and Dunn’s index. Dunn’s index evaluates the quality of a clustering solution through the compactness and separation of clusters [73]. However, this work focuses on single period portfolios, whereas in real time, portfolios are updated after certain period of time to increase profitability [23].
All of these works have concluded that, irrespective of the assets and performance metrics used, clustering does help to generate better portfolios than other traditional methods based on mean variance model. This also aligns with the concept of modern portfolio theory, which suggests that well-diversified asset universe can further minimise risk and improve MV model’s efficiency. To overcome the shortcomings mentioned above in the previous works and improve them to make more realistic portfolio optimisation (PO) framework, this work aims to implement an automated multi-period PO method which selects assets from different clusters, as done by many of the previous researchers [64,74,75], without any manual intervention.
3. Materials and Methods
The study begins with identification of the most effective preprocessing methodology for historical data of cryptocurrencies and stocks. This involves investigating the impact of various imputing methods for missing values and moving average techniques for data smoothing on corresponding single-asset class portfolios. The analysis of data preprocessing techniques is conducted on a constrained set of top market capitalisation assets (as in [21,23]) from the two asset classes in order to generate optimal portfolios while maintaining reasonable transaction costs and portfolio cardinality [23,24]. Subsequent analysis involves clustering larger sets of available assets and identifying suitable selection strategy for diverse portfolio generation. This work uses Particle Swarm Optimisation (PSO) algorithm for finding the optimal weight allocation of the assets in the portfolio. Evaluation of portfolio performance is performed using the risk-adjusted return metrics such as Sharpe, Sortino and Adjusted Sharpe ratios given by equations 5, 6 and 7. The values of these metrics have been annualised for easier interpretation. The downside deviation () for Sortino ratio is calculated using the formula proposed by [76].
3.1. Dataset Description
The dataset [77] utilised for this work is a historic dataset spanning from January 2005 to May 2023. It contains transaction data for selected assets from several categories: US Stocks, ETFs, Futures, US Indices, and Cryptocurrencies. The dataset presents this data at various granularities/frequencies in the OHLCV format, i.e DateTime, Open Price, High Price, Low Price, Close Price, Volume of shares. For this work, the focus is on hourly data ranging from January 2018 to May 2023 for Cryptocurrencies, and the daily data from January 2015 to May 2023 for the S&P500 and Nasdaq100 stocks. These particular timeframes have been selected due to considerably high market activity, observed in the plots of assets’ historical data, during this time period as compared to most of the preceding periods, while also encompassing both pre-pandemic and post-pandemic market trends. The use of S&P500 and Nasdaq100 stocks in this study is inspired from previous works such as [28,78,79]. The risk free rate of return considered for Sharpe, Adjusted Sharpe and Sortino ratios is the commonly used 3-Month US Treasury Bill Secondary Market Rate, Discount Basis (TB3MS) data which is freely accessible online at [80]. This downloaded data is the percent, non-adjusted returns of monthly frequency.
The initial analysis task employs a small subset from the large pool of available assets, comprising the top 10 cryptocurrency coins by market capitalisation (as of April 9, 2024) according to coinmarketcap.com, and the top 20 S&P stocks by market capitalisation index weight (as of March 24, 2024) according to [81], all listed in Table A1 (Appendix A). Subsequently, for the analysis of clustering and asset selection methodologies, the scope expands to include the complete sets of Nasdaq100, S&P 500, and all 53 available cryptocurrencies in the dataset.
3.2. Dataset Pre-Processing
As the risk free data is composed of 3-month treasury returns, hence to accurately calculate risk-adjusted returns, cumulative 3-month returns must be computed for each asset to determine excess returns relative to this risk-free rate. Following general practice [82], returns from OHLC (Open, High, Low, Close) data are derived using assets’ Closing Prices, by calculating percentage changes between two time points [83] as shown in equation 8. Hence in order to find cumulative quarterly returns, first monthly returns are calculated and then aggregated over the duration of three-months.
3.2.1. Handling Missing Values
Whenever there is a zero volume i.e no transaction/trading has occurred, such entries are not recorded in the dataset. In order to deal with such gaps, global replacement of the missing values with the corresponding minimum, maximum, mean (average), etc. of the time series [84,85] have been compared to interpolation methods. The interpolation approach in this study employs linear and quadratic regression methods to model these trends and predict suitable values for missing values imputation. For the comparison of these different methods, initially, (= "percent_missing") of the available data is replaced with NaN values (as per [86]), followed by prediction of these missing values using various imputation techniques. The predicted values are then compared with the true values for evaluation purposes. This evaluation is done using error metrics such as Mean Squared Error (MSE), Root Mean Squared Error (RMSE), and Mean Absolute Percentage Error (MAPE), as also done by [86,87,88]. Lower values of these metrics indicate superior method performance. In this investigation, the different "percent_missing" () values used are [10%, 30%, 50%, 70%, 90%] [86,88].
3.2.2. Implementation of Smoothing Algorithms
To overcome the issue of high volatility in asset prices, smoothing of data is performed after handling the missing values. In general, the literature lacks the comprehensive analysis of how different smoothing strategies impact portfolio performance [89] as measured by risk-adjusted return metrics like the Sharpe Ratio. Therefore, as part of RQ1, this study examines these effects across single asset-type portfolios from various asset classes. The analysis considers several smoothing techniques, including Simple Moving Average (SMA), Exponential Moving Average (EMA), 4 - point Moving Average (FMA) and 2 x 4 - point Moving Average (TFMA) [13,90,91]. They are formulated as follows :-
where (n) is the window size, is the smoothing factor and is related to n by . While SMA assigns equal weights to all the past n data points, EMA assigns exponentially decreasing weights to previous data points. A larger emphasises more on recent observations whereas a smaller value assigns greater weight to historical data points too. This work implements and compares multiple window sizes for SMA (n = [5, 10, 30, 50, 100]) and different smoothing factors for EMA ( = [0.01, 0.1, 0.3, 0.5, 0.9]).
3.3. Meta - Heuristic Algorithm Used for Portfolio Optimisation - Particle Swarm Optimisation
Particle Swarm Optimisation (PSO) is characterised by its simplicity - attributed to a reduced number of parameters - and its rapid convergence even in the presence of large search spaces [48]. Hence, this research employs PSO methodology to determine optimal asset allocation weights within the portfolio framework. The Particle Swarm Optimisation (PSO) [40] algorithm was developed by Kennedy and Eberhart in 1995 which is inspired by the movements of swarm in the nature such as flock of birds and school of fish. The PSO algorithm identifies the optimal solution by comprehensively exploring the objective function space through systematic adjustment of the routes of individual agents, called particles. Each particle in the swarm has inherent properties such as position and velocity which help them to move towards an optimal position. In the context of portfolio optimisation, the particle’s position in the swarm represents the weight allocations (i.e portfolio) and its velocity represents the rate of change in the individual weights [92]. Every particle i has a tendency to move randomly to search through unexplored search space. But at the same time, each particle is attracted towards its personal best position until the present iteration as well as the current global best position of the swarm. In other words, indicates particle’s position in the entire history for which the objective function value is maximum or minimum (depending on the problem requirement). The aim of the PSO algorithm is to discover the optimal position or solution in search space, considering the best solutions associated with each individual particle. This process continues until either the objective function value ceases to improve or a predefined iteration limit is reached.
Mathematically, the equations to update the velocity and position of the particle i at iteration t, using the personal best position and global best position , are given by [93] :
where
represent dimensions ; represent particle ;
N is the size of swarm i.e. total number of particles ; is called inertia weight ;
are two positive constants, called cognitive and social parameter respectively ;
are random numbers, uniformly distributed in ;
g is the index of overall best particle in the swarm; and
determines the iteration number of algorithm.
The velocity calculation in equation 13 comprises three components [93]: the inertia component (), which maintains directional momentum; the cognitive component (), which attracts particles to their historical best positions; and the social component (), which pulls particles towards the neighbourhood’s global best position. Figure 1 represents the particle’s movement from position to , where represents particle i’s best position at step t and denotes the current global best at step t. In the case of search space problems, there are the two important concepts of exploration and exploitation. Exploration investigates unexplored regions for new possibilities, while exploitation focuses on previously visited points’ neighbourhoods to maximise immediate gains [94]. Excessive exploration increases computational time, whereas pure exploitation yields sub-optimal global solutions, necessitating a balance to efficiently identify optimal solutions while avoiding local optima. In equation 13, parameters and govern PSO’s exploration-exploitation balance : higher cognitive component values () promote wider particle wandering, while higher social component values () increase premature convergence risk to local minima [40]. Research advocates a dynamic approach where exploration is prioritised during initial search phases, while inter-particle communication intensifies as the algorithm approaches termination [95].
The implementation in this work encompasses three variations of PSO algorithm, each employing different mechanisms for updating particle position and velocity. They are Standard PSO (SPSO) [40], Improved PSO (IPSO) [93] and Drift PSO (DPSO) [32]. These variations correspond to different ways of searching through the search space to identify the most optimal asset weight allocations, which is represented by the particle with best fitness value. A fitness function, also called objective function, is used to evaluate the quality of each particle. In the application of portfolio optimisation, the risk-adjusted returns metrics are used as fitness function.
The pseudo code for standard PSO algorithm is shown in Algorithm 1 (Appendix B).
One of the drawbacks of the Standard PSO algorithm is that it has a high tendency to get trapped in the local optimum due to its rapid convergence property [96]. To overcome this, works such as [93] dynamically adjust the hyper-parameters such as inertia weights () and constants () in IPSO using the equations 15, 16 and 17, instead of keeping them fixed as in SPSO. As discussed before, higher corresponds to more exploration and higher results in more exploitation. Therefore, in 16 and 17, decreases and increases as iterations progress, encouraging early exploration followed by later-stage exploitation [93]. This can potentially improve the efficiency of finding optimal asset weight allocations.
where t is the iterations and is the maximum number of iterations.
Additionally, at every iteration of IPSO, the particle exhibiting the minimum fitness value (risk-adjusted return metric) is redirected to move in the opposite direction of its velocity, as proposed by [93]. These particles’ velocity and position updates follow equations 18 and 19, while remaining particles use standard equations 13 and 14.
Lastly the DPSO algorithm [32] draws inspiration from electron motion in conductors under electric fields, incorporating both thermo motion and drift motion. Thermo motion refers to the random movement of electrons due to thermal energy, whereas drift motion refers to electrons’ directional movement under external electric fields. In [32], thermo motion is considered to be following Maxwell velocity distribution law. Thus it is represented as where is the standard deviation of the Gaussian distribution and is a random number with the standard normal distribution. The drift motion is represented as for particle i at iteration . Consequently, the final equation for updating the velocity and position of particle i is as follows :
where
represent dimensions ; represent particle ;
N is the size of swarm i.e total number of particles ;
is called compression-expansion coefficient ;
is a random number from a standard normal distribution ; and
is mean best () i.e average of of all particles at iteration t , i.e
All these variants of PSO have two critical hyperparameters - the number of iterations and the population size. Population size indicates the number of particles which makes up the set of the entire search space, and each of these particles’ position represents a portfolio vector. A comprehensive analysis of the impact of different values for these hyperparameters on corresponding generated portfolios is performed using a range of values of 200 - 500 for the number of iterations and 100 - 400 for the population size.
To validate the effectiveness of these PSO algorithms, results are benchmarked against some of the previous works. In literature, PSO has been compared with Genetic algorithm based on Sharpe ratio of the portfolios constructed from Shanghai Stock Exchange 50 Index constituents [30]. In addition, Sharpe ratio has been used to optimise the financial portfolios using a proposed variation of PSO in [31]. Following the use of Sharpe ratio as a metric in such papers, this research initially compares the PSO algorithm with Markowitz Portfolio theory based on optimal Sharpe ratio for cryptocurrency-only portfolios, with no rebalancing scenario. This is performed using an inbuilt library of Python called PyPortfolioOpt [97] which implements the Markowitz Mean-Variance model. This is done with the help of max_sharpe() function, which belongs to this library’s class called EfficientFrontier [98,99,100]. Further analysis demonstrates the superiority of these PSO methods over some of the other existing approaches in both cryptocurrency and stock-based portfolio optimisation.
3.4. K-Medoids Based Clustering and Optimal Selection of Financial Assets
As a part of RQ2, this study aims to handle larger sets of cryptocurrencies and stocks in real-time using clustering algorithms followed by identification of the most suitable assets to be included in the portfolio. A distance-based clustering approach is selected for its simplicity, intuitive nature, and broad applicability [101]. The process aims to identify the most profitable and diverse assets to maximise returns while minimising risk, as illustrated in Figure 2. Based on the considerations and literature works reviewed previously, the K-medoids algorithm is adopted as the clustering technique. For this clustering task, assets are represented using a bivariate approach incorporating quarterly returns and standard deviation of returns, consistent with methodology employed by [101].
Partitional clustering algorithms require prior knowledge of the number of clusters (K) [101], which presents challenges, particularly with large datasets [64]. According to [102], the optimal value of K should be determined using domain expertise and/or statistical methods like the Silhouette plot. In view of this, this research applies common approaches for identifying optimal K value : the Elbow method, which minimises total within-cluster sum of squares (WSS) [103], alongside Silhouette analysis [104]. Once the optimal number of clusters has been decided, the K-medoids algorithm [65] is executed which starts with the initialisation of the K medoids. Two types of initialisation methods for the centroids have been tested in this work : random, where centroids are randomly selected [28,64], and heuristic, where points with the smallest sum of distance to every other point are chosen [105]. The pseudo code for the K-medoids clustering algorithm used is shown in Algorithm 2 (Appendix B).
Once the clustering of assets has been performed, this research proposes following novel strategies for asset selection for the portfolio. These methods differ in terms of how additional assets are selected to complement the representative medoid assets and the degree of flexibility permitted during this selection process.
a) Asset Selection Strategy 1 : The methodology exclusively selects the centroids of the clusters created using Euclidean distance as a metric. The underlying principle posits that these centroids serve as optimal representatives of the assets within each cluster, consequently leading to effective portfolio construction. Hence, through this strategy, the total number of assets = number of clusters (K).
b) Asset Selection Strategy 2 : Research indicates that portfolios comprising approximately 10-15 assets typically yield optimal results [8,24,64]. This methodology therefore incorporates, in addition to centroids, an additional P nearest assets to each centroid from every cluster such that the size of the portfolios created is around 10-15. Here, the total number of selected assets equals the number of clusters (K) + P.
c) Asset Selection Strategy 3 : This is a modification of strategy 2 wherein the algorithm automatically selects the best performing assets across different clusters rather than selecting a fixed number of assets from each cluster. Given the required final portfolio size S, the model identifies S nearest assets to centroids from each cluster and ranks them individually based on four metrics: returns, risk, risk-adjusted returns, and distances from corresponding centroids. Assets are sorted in decreasing order of returns and risk-adjusted returns, and increasing order of risk and distance to centroids. The frequency of each asset’s appearance in the top S positions across all four ranking lists is then calculated, with the final portfolio comprising the S assets appearing most frequently across these rankings. This methodology enables dynamic selection of the most suitable assets from different clusters based on multiple performance indicators.
d) Asset Selection Strategy 4 : In this strategy, the idea is that usually there are some top market capitalisation based assets across different asset classes. Investment in such assets can prove advantageous for particular investor profiles due to their characteristic stability [106]. Based on this principle, this strategy incorporates the top Q performing assets (ranked by market capitalisation) during the considered time period, in addition to the medoid assets. Consequently, the total number of assets selected for portfolio optimisation = number of clusters (K) + Q.
In order to make the portfolios more realistic and dynamic, the portfolios usually need to be revised after certain amounts of time, and this is termed rebalancing. It enables portfolios to remain aligned with the market trends and potentially generate higher profits compared to the Buy and Hold strategy [107,108] (which involves a single investment maintained over an extended period). Rebalancing facilitates monitoring of portfolio value fluctuations over time. However, it incurs transaction costs while buying or selling securities in the financial markets, due to which determination of optimal rebalancing frequency becomes critical. This research establishes a fixed rebalancing interval of l = 30 days as per [22,23,109]. This approach exemplifies static rebalancing, wherein adjustments occur after predetermined time intervals. During each rebalancing period, the optimal value of K is first determined, followed by application of clustering and asset selection techniques to adjust portfolios according to market trends.
4. Results
4.1. Missing Value Handling Techniques
The comparison of missing value handling methods utilises complete datasets of Nasdaq100, S&P 500 indices, and all 53 cryptocurrencies. Considering all these asset types, different percentages of missing values () and different imputation strategies discussed before, linear interpolation (as also used by [19]) demonstrates superior performance exhibiting minimal values for Mean Squared Error (MSE), Root Mean Squared Error (RMSE), and Mean Absolute Percentage Error (MAPE) metrics. Consequently, linear interpolation is selected as the optimal technique for addressing missing values in both cryptocurrency and stock datasets throughout the subsequent analyses.
4.2. Analysis of Different Smoothing Strategies
To examine the effect of various smoothing techniques on portfolio quality, a comparative analysis of Sharpe ratios is conducted using different window sizes (n) for Simple Moving Average (SMA) and varying smoothing factor () for Exponential Moving Average (EMA) along with other smoothing techniques such as 4 - point moving average (FMA) and 2 x 4 - point moving average (TFMA). As discussed earlier, this investigation utilises the top 10 cryptocurrencies and top 20 S&P stocks based on market capitalisation, which are detailed in Table A1 (Appendix A). No portfolio rebalancing occurs throughout this analytical process.
The results for SMA with different window sizes (n) reveal that the best Sharpe ratio values are obtained using n = 50 for cryptocurrency and n = 199 for S&P stocks. On the other hand, EMA provides the best Sharpe ratio values with smoothing factor = 0.1 for cryptocurrency and = 0.01 for S&P stocks, both corresponding to larger window sizes. Overall, the comparison of different smoothing methods mentioned above illustrate that Exponential Moving Average (EMA) emerges as the optimal smoothing technique for both asset classes (cryptocurrencies and stocks) during the timeframe of data considered. However, the optimal smoothing factor varies between asset types, with cryptocurrency portfolios performing best at = 0.1 (which gives optimal Sharpe ratio of around 0.76) and S&P stock based portfolios at = 0.01 (which gives optimal Sharpe ratio of around 2.43). The lower value of (which indicates greater window size) for S&P stocks than for cryptocurrencies can be attributed to higher volatility of cryptocurrencies than stocks [110,111,112]. These findings on optimal smoothing factor values align with existing literature (like [113]) which recommends that medium to long-term day traders, in general, should employ lower values. For day traders, the window size considered for EMA can be reduced. However, this research focuses on medium to long-term trading strategies using extended historical data. Hence, EMA( = 0.1) for cryptocurrency data and EMA( = 0.01) for stock data are implemented throughout subsequent analyses to effectively eliminate random market fluctuations.
4.3. Hyperparameter Optimisation for the Particle Swarm Optimisation (PSO) Algorithm
In order to determine the most efficient configuration for the three PSO variants used in this research, multiple values for the "iterations" and "population size" hyperparameters are systematically evaluated. Due to the reasons mentioned previously, this analysis considers top 10 cryptocurrency coins and top 20 S&P stocks based on market capitalisation (Table A1). There is no rebalancing scenario considered for this analysis, hence the complete data for these assets for the entire time period is used at once. Based on the Sharpe ratios of portfolios generated from various PSO configurations, a consistent pattern is observed wherein portfolio performance for both SPSO and IPSO models demonstrates positive correlation with increases in population size and iteration count. However, in order to balance algorithmic efficiency against rate of improvement in portfolio quality, 500 iterations and 400 as the population size are established as the most efficient hyperparameter values for the upcoming analyses.
4.4. Benchmarking PSO with Previous Works
In this section, the effectiveness of PSO is compared against other established techniques in portfolio optimisation. Initially the PSO algorithm is compared with the Markowitz theory using the python’s inbuilt library called Efficient Frontier. The assets considered comprise the top 10 cryptocurrencies based on market capitalisation (Table A1) with their complete data being used at once as there is no rebalancing. Considering that the average risk-free rate of the 3-month US Treasury bill during January 2018 to May 2023 is 1.55, the risk-free rate parameter is set to 1.5 for both the max_sharpe() function of the Efficient Frontier library and risk-adjusted return calculations in PSO techniques. Under these conditions, the Efficient Frontier Library is unable to generate any portfolio and states that "at least one of the assets must have an expected return exceeding the risk-free rate" [114]. But PSO algorithms are capable to produce optimal portfolios with Sharpe ratios of approximately 0.56. Similar pattern is observed from both Efficient Frontier library and PSO algorithms until the risk free rate is set to 1. Later when the risk-free rate parameter is set to 0.95, results indicate that PSO variations achieve similar Sharpe ratios of approximately 0.56, whereas the inbuilt library yields approximately 0.38. These findings demonstrate the superiority of PSO over Markowitz Mean-Variance theory across all PSO variations.
The PSO methods are subsequently benchmarked against the methods used in other works focusing on both cryptocurrency and stock-based portfolios [21,115]. Initial comparative analysis focuses on cryptocurrency portfolio optimisation, utilising the work of [115] as a benchmark. Different models used in this paper are Equally Weighted (NAIVE) portfolio, Mean Variance model(MV), maximum Sharpe model (Max Sharp), mean conditional value-at-risk (MCVaR) based models and the multicriteria (MC) based model. There are two MV based models developed in [115] - MV Middle, which focuses on the average variance, and MV Max, which aims for having the maximum variance. Their MC model is a multiobjective decision making model that considers number of variables such as daily return, standard deviation, volume, market capitalisation, etc. These models are used to create an optimal portfolio from the top 9 cryptocurrencies as per market capitalisation (based on rankings during the entire timeframe of data) - Bitcoin(BTC), Dash, Ethereum Classic(ETC), Ethereum(ETH), Litecoin(LTC), Monero(XMR), Neo, Stellar(XLM) and Ripple(XRP). The timeframe considered in their paper spans from 1 January 2017 to 11 February 2020, with monthly rebalancing resulting in a total of 32 rebalancing time periods/portfolios. The metrics used for PSO training are annualised Sharpe, Adjusted Sharpe and Sortino ratios, with the risk-free rate set to 0 as per [115]. Three evaluation metrics from the paper are used for comparative analysis: return for the next training day (Next day returns), mean return for the next 30 days (Mean 30 returns), and standard deviation of the next 30 days returns (SD 30 returns). All these results are presented in Figure 3, Figure 4 and Figure 5 which illustrate the number of rebalancing periods for which our PSO variations performed better than the models employed in [115]. The larger the number of these rebalancing periods, the more superior is the performance of PSO algorithms as compared to the benchmark methods. Analysis of these graphs indicates that when evaluated based on returns-based metrics (i.e Next day returns and Mean 30 returns), the PSO methods outperform all benchmark models for approximately more than half of the 32 rebalancing time periods. Whereas when assessed based on risk (i.e SD 30 returns), the PSO methods demonstrate superior performance compared to all benchmark models across all 32 periods.
Lastly, the evaluation of the PSO variations for stock-based portfolios involves benchmarking against [21]. Results are compared with those presented in table 6 of the paper (where no selling of assets is permitted). These results consider the following stocks for portfolio optimisation : Berkshire Hathaway Inc (BRKa) , JPMorgan Chase & co. (JPM) , Johnson & Johnson (JNJ) , Procter & Gamble Company (PG) , Visa Inc Class A (V). The comparison is presented in Table 1, which demonstrates that the PSO techniques combined with Exponential Moving Average smoothing strategy (with = 0.01) gives significantly better Sharpe ratio values for the stocks-only portfolio.
4.5. Analysis of the Effect of Clustering and Different Asset Selection Techniques
To view the effect of clustering of the assets followed by selection of optimal assets using the four novel strategies proposed above, clustering and portfolio optimisation is performed for every rebalancing period to create dynamic portfolios. This task utilises complete datasets of Nasdaq100 and all 53 available cryptocurrencies. Nasdaq100 stocks are used instead of top 20 S&P stocks to increase the size of asset pool and demonstrate the effectiveness of the clustering and asset selection methods. The training period encompasses January 2018 to December 2022 for cryptocurrencies and January 2015 to December 2022 for stocks, constituting approximately 80-85% of the total data. Then monthly portfolio rebalancing commences in January 2022 and continues till May 2023. Asset selection strategies 2, 3, and 4 are implemented in a way that they generate portfolios containing approximately 12-15 assets, thus facilitating simple and efficient portfolio management while maintaining reasonable transaction costs [23,24]. For asset selection strategy 4, which requires inclusion of top-performing assets based on market capitalisation, coinmarketcap.com [116] serves as the reference for updated list of top cryptocurrencies during each rebalancing time period. Similarly, top 10 Nasdaq100 stocks are identified using market capitalisation rankings [116,117].
An assessment of elbow graphs and silhouette scores across all rebalancing periods for both asset types reveals the trends depicted in Figure 6 and Figure 7. Hence, across every rebalancing period, cluster count of k = 4 for cryptocurrencies and k = 3 for Nasdaq100 stocks is implemented consistently for all clustering methodologies. Cluster analysis at every rebalancing period indicates a distinct separation between high-return/high-risk asset clusters and low-return/low-risk asset clusters, validating that selection of assets from each cluster effectively enhances portfolio diversity.
An evaluation of portfolios constructed using assets from different selection strategies (such as only the centroids, or centroids + nearby assets, or centroids + top market capitalisation assets), is conducted through Sharpe, Sortino, and Adjusted Sharpe ratios. Results for the Sharpe and Adjusted Sharpe ratios for cryptocurrency based portfolios are shown in Figure 8 and for Nasdaq100 based portfolios are shown in Figure 9 (Similar trends have been found with Sortino Ratio as well). These figures provide graphical representation of descriptive statistics of risk-adjusted returns across the four asset selection variations for cryptocurrency-only and stock-only portfolios. The statistics include minimum, maximum and average (i.e mean) of the metrics calculated across all monthly rebalancing periods. Optimal performance is characterised by higher minimum, maximum and average metric values.
4.5.1. Comparison of the Effect of Clustering and Asset Selection Strategy Against Non-Clustered Approach on the Corresponding Portfolios
Figure 8 shows that all clustering and asset selection techniques generally yield improved Sharpe ratios compared to when portfolio optimisation is applied to smoothed data without performing any clustering (Sharpe ratio of 0.76 is obtained for top market-capitalisation cryptocurrency-based portfolios without clustering, while analysing different smoothing strategies in the previous section). Also this comparison illustrates that instead of creating portfolios from just the high market capitalisation assets (as done in the previous section of analysis of smoothing strategies), performing clustering and including other diverse set of assets from these clusters helps to improve the performance of the portfolios. These findings align with the initially proposed hypothesis. Similar conclusions can be formed on the basis of Adjusted Sharpe ratio from Figure 8.
4.5.2. Comparison of Different PSO Techniques
Figure 8 and Figure 9 exhibit that among the three PSO variations, Drift PSO (DPSO) consistently generates the most optimal portfolios irrespective of the risk-adjusted return metric used. This is also observed in the results obtained during implementation of different smoothing strategies. Figure 10 and Figure 11 also provide graphical confirmation of this conclusion, demonstrating variations in risk-adjusted return metrics over time across different PSO algorithms for cryptocurrency-based and stock-based portfolios respectively.
4.5.3. Comparison of Different Asset Selection Strategies
Figure 8 clearly indicates that strategy 3 provides the best Sharpe and Adjusted Sharpe ratio values for cryptocurrency portfolios (Similar analysis has been found with Sortino Ratio as well). This demonstrates that enabling the algorithm to dynamically select cryptocurrencies from different clusters based on different performance metrics (including return, risk, return/risk, distance to centroid) significantly enhances portfolio risk-adjusted returns. This can also be seen in Figure 12 and Figure 13 where the graphs represent the variation in Sharpe and Adjusted Sharpe ratios of the cryptocurrency portfolios over time obtained from DPSO algorithm for different asset selection methods. Only the results from DPSO method are depicted in these graphs because, as shown before, this algorithm is found to consistently perform the best among the three PSO variations.
Conversely, in Figure 9 for Nasdaq100 stock portfolios, both asset selection strategy 4 (incorporating top market capitalisation stocks alongside centroids) and strategy 3 (dynamic asset selection) generate comparably optimal portfolios. This pattern is also graphically illustrated in Figure 14 and Figure 15, which display trends in Sharpe and Adjusted Sharpe ratios of the Nasdaq100 portfolios over time from DPSO for different asset selection methods.
4.6. Benchmarking with Literature Review
To benchmark the clustering results, the methodology’s performance is compared against [76]. The comparison examines Sharpe and Sortino ratio values for portfolios of sizes (n) = 10 and (n) = 25 in Table 2. This comparison is conducted against PSO techniques of Restricted Sharpe and Restricted Sortino models for equivalent portfolio sizes in the benchmark paper. The dataset comprises daily prices of S&P 500 stocks from October 2017 to October 2018. For the clustering approaches in this work, k = n is considered for asset selection method 1, whereas for the remaining strategies, k = 5 for n = 10 and k = 10 for n = 25 based on the elbow graphs and silhouette scores. Table 2 presents results from the DPSO algorithm, which typically yields optimal portfolios. Evidence indicates that the proposed asset selection strategies in this work outperform those in the referenced paper. Additionally, for both the cases of portfolio size, dynamic selection of assets from clusters demonstrates superior performance.
5. Discussion and Conclusion
Portfolio optimisation has evolved through machine learning, deep learning, and more recently, swarm intelligence and evolutionary algorithms for efficient asset management. Particle Swarm Optimisation (PSO) is a nature-inspired approach that demonstrates proficiency with continuous data. It offers simplicity through fewer parameters and rapid convergence in large search spaces helps to effectively address financial market challenges. This study implements three different variations of the PSO algorithm to enhance the efficacy of optimal solution identification within the search space. This work initially addresses management of missing data and high volatility in the historical data of financial assets. For this, comparison of different imputation and smoothing strategies has been implemented for different types of assets, particularly cryptocurrencies and US stocks. It is found that linear interpolation for missing value imputation followed by Exponential Moving Average smoothing technique with a smaller smoothing factor () value helps the most to improve the quality of cryptocurrency-based and stocks-based portfolios, measured in terms of Sharpe ratio. Also the smoothing factor for cryptocurrency is higher than for the stocks data, which corresponds to a smaller window size for cryptocurrency than for stocks, for medium to long-term investments. This is due to higher volatility of the considered cryptocurrencies as compared to stocks. Apart from this, the superiority of the PSO algorithm, for both asset type portfolios, over the Markowitz Mean-Variance model and other traditional algorithms used in the literature is also demonstrated. Subsequent analysis in this work focuses on clustering of assets using a partition-based clustering algorithm and identifying the most suitable asset selection strategy from different proposed strategies for the two asset classes. The overall results demonstrated that dynamic selection of assets from different clusters based on multiple performance metrics, such as return, risk, risk-adjusted returns and distance to the centroids, helps to improve the Sharpe and Adjusted Sharpe ratios of both cryptocurrency and stocks-based portfolios. This indicates that restricting the selection of assets based on a single metric, such as only including high market capitalisation assets, diminishes portfolio quality. Increasing the diversity of portfolios through careful inclusion of high-return/high-risk and low-return/low-risk assets maximises the profitability of the constructed portfolios.
6. Future Work
The main focus of this work is on analysing and using the historical market data for generating optimal portfolios with the help of artificial intelligence methods. However there is a significant impact of social media and influencers on the prices of the assets, especially in the case of cryptocurrency. The relationship between transactions from some top rated cryptocurrencies such as Bitcoin, Ethereum and Ripple with the activity in the online forums has been analysed in [118]. The results show that the number of cryptocurrency transactions is greatly influenced by the comments and replies posted in the forums and online communities. Thus considering the influence of social media activity of the community while generating the optimal portfolios is important.
Though PSO has shown improvements in the performance with the help of parallel computations, it may likely suffer from getting trapped in local optima due to premature convergence in the case of complex problems. This issue may be encountered when the search space is more scattered. However this limitation of PSO may be overcome by using it along with other evolutionary approaches such as Genetic Algorithms.
Author Contributions
Conceptualization, V.B., M.B. and M.C.; Methodology, V.B., M.B. and M.C.; Software, V.B.; Formal Analysis, V.B.; Investigation, V.B.; Data Curation, V.B.; Writing – Original Draft Preparation, V.B.; Writing – Review & Editing, M.B. and M.C.; Visualization, V.B.; Supervision, M.B. and M.C. All authors have read and agreed to the published version of the manuscript.
Funding
This publication has emanated from research conducted with the financial support of Taighde Éireann-Research Ireland under Grant No. 18/CRT/6223.
Data Availability Statement
The data can be shared on reasonable request.
Acknowledgments
The author Vivek Bulani wishes to acknowledge the financial support of Taighde Éireann-Research Ireland under Grant No. 18/CRT/6223. (URL: https://www.crt-ai.ie/). The authors Martin Crane and Marija Bezbradica wish to acknowledge the support from the Science Foundation Ireland under Grant Agreement No. 13/RC/2106_P2 at the ADAPT SFI Research Centre at DCU. ADAPT, the SFI Research Centre for AI-Driven Digital Content Technology, is funded by the Science Foundation Ireland through the SFI Research Centres Programme (URL: https://www.adaptcentre.ie/). The funders had no role in study design, data collection and analysis, decision to publish, or preparation of the manuscript.
Conflicts of Interest
The authors declare no conflict of interest.
Appendix A. Subset of Assets Used

Table A1.
List of subset of assets considered.
| Top 10 Crypto coins | Top 20 S&P stocks | Top 20 S&P stocks |
|---|---|---|
| Bitcoin (BTC) | MICROSOFT CORP (MSFT) | APPLE INC (AAPL) |
| Ethereum (ETH) | NVIDIA CORP (NVDA) | AMAZON.COM, INC (AMZN) |
| Tether (USDT) | META PLATFORMS INC, CLASS A (META) | ALPHABET INC CL C (GOOG) |
| Ripple (XRP) | BERKSHIRE HATHAWAY INC. CL B (BRK.B) | ELI LILLY AND COMPANY (LLY) |
| USD Coin (USDC) | BROADCOM INC. (AVGO) | TESLA, INC (TSLA) |
| Dogecoin (DOGE) | JPMORGAN CHASE & COMPANY (JPM) | UNITEDHEALTH GROUP INC (UNH) |
| Cardano (ADA) | VISA INC. (V) | EXXON MOBIL CORP (XOM) |
| Tron (TRX) | JOHNSON & JOHNSON (JNJ) | MASTERCARD INC (MA) |
| Litecoin (LTC) | THE PROCTER & GAMBLE COMPANY (PG) | HOME DEPOT, INC. (HD) |
| Dai (DAI) | MERCK COMPANY. INC. (MRK) | COSTCO WHOLESALE CORP (COST) |
Appendix B. Pseudocodes
Appendix B.1. Standard Particle Swarm Optimisation (SPSO) Algorithm
Appendix B.2. K-Medoids Clustering Algorithm
References
- Ta, V.D.; Liu, C.M.; Tadesse, D.A. Portfolio Optimization-Based Stock Prediction Using Long-Short Term Memory Network in Quantitative Trading. Applied Sciences 2020, 10, 437. [Google Scholar] [CrossRef]
- Markowitz, H.M.; Markowitz, H.M. Portfolio selection: efficient diversification of investments; J. Wiley, 1967.
- Sharpe, W.F. Capital Asset Prices: A Theory of Market Equilibrium Under Conditions of Risk. The Journal of Finance 1964, 19, 425–442. [Google Scholar] [CrossRef]
- Rockafellar, R.T.; Uryasev, S. Optimization of conditional value-at-risk. The Journal of Risk 2000, 2, 21–41. [Google Scholar] [CrossRef]
- Golmakani, H.R.; Fazel, M. Constrained Portfolio Selection using Particle Swarm Optimization. Expert Systems with Applications 2011, 38, 8327–8335. [Google Scholar] [CrossRef]
- Niu, B.; Fan, Y.; Xiao, H.; Xue, B. Bacterial foraging based approaches to portfolio optimization with liquidity risk. Neurocomputing 2012, 98, 90–100. [Google Scholar] [CrossRef]
- Metaxiotis, K.; Liagkouras, K. Multiobjective Evolutionary Algorithms for Portfolio Management: A comprehensive literature review. Expert Systems with Applications 2012, 39, 11685–11698. [Google Scholar] [CrossRef]
- Aithal, P.K.; Geetha, M.; U, D.; Savitha, B.; Menon, P. Real-Time Portfolio Management System Utilizing Machine Learning Techniques. IEEE Access 2023, 11, 32545–32559. [Google Scholar] [CrossRef]
- Gunjan, A.; Bhattacharyya, S. A brief review of portfolio optimization techniques. Artificial Intelligence Review 2023, 56, 3847–3886. [Google Scholar] [CrossRef]
- Grinold, R.C.; Kahn, R.N. Active portfolio management 2000.
- El Bernoussi, R.; Rockinger, M. Rebalancing with transaction costs: theory, simulations, and actual data. Financial Markets and Portfolio Management 2023, 37, 121–160. [Google Scholar] [CrossRef]
- S, K. SECURITY ANALYSIS AND PORTFOLIO MANAGEMENT, THIRD EDITION; PHI Learning Pvt. Ltd., 2022.
- Thakkar, A.; Chaudhari, K. A Comprehensive Survey on Portfolio Optimization, Stock Price and Trend Prediction Using Particle Swarm Optimization. Archives of Computational Methods in Engineering 2021, 28, 2133–2164. [Google Scholar] [CrossRef]
- Nti, I.K.; Adekoya, A.F.; Weyori, B.A. A systematic review of fundamental and technical analysis of stock market predictions. Artificial Intelligence Review 2020, 53, 3007–3057. [Google Scholar] [CrossRef]
- Thakkar, A.; Chaudhari, K. CREST: Cross-Reference to Exchange-based Stock Trend Prediction using Long Short-Term Memory. Procedia Computer Science 2020, 167, 616–625. [Google Scholar] [CrossRef]
- Anbalagan, T.; Maheswari, S.U. Classification and Prediction of Stock Market Index Based on Fuzzy Metagraph. Procedia Computer Science 2015, 47, 214–221. [Google Scholar] [CrossRef]
- Wen, Q.; Yang, Z.; Song, Y.; Jia, P. Automatic stock decision support system based on box theory and SVM algorithm. Expert systems with Applications 2010, 37, 1015–1022. [Google Scholar] [CrossRef]
- Raudys, A.; Lenčiauskas, V.; Malčius, E. Moving averages for financial data smoothing. In Proceedings of the Information and Software Technologies: 19th International Conference, ICIST 2013, Kaunas, Lithuania, 2013, October 2013. Proceedings 19. Springer; pp. 34–45. [Google Scholar]
- Cesarone, F.; Scozzari, A.; Tardella, F. A new method for mean-variance portfolio optimization with cardinality constraints. Annals of Operations Research 2013, 205, 213–234. [Google Scholar] [CrossRef]
- Lim, Q.Y.E.; Cao, Q.; Quek, C. Dynamic portfolio rebalancing through reinforcement learning. Neural Computing and Applications 2022, 34, 7125–7139. [Google Scholar] [CrossRef]
- Ma, Y.; Ahmad, F.; Liu, M.; Wang, Z. Portfolio optimization in the era of digital financialization using cryptocurrencies. Technological Forecasting and Social Change 2020, 161, 120265. [Google Scholar] [CrossRef]
- Lorenzo, L.; Arroyo, J. Online risk-based portfolio allocation on subsets of crypto assets applying a prototype-based clustering algorithm. Financial Innovation 2023, 9, 25. [Google Scholar] [CrossRef]
- Menvouta, E.J.; Serneels, S.; Verdonck, T. Portfolio optimization using cellwise robust association measures and clustering methods with application to highly volatile markets. The Journal of Finance and Data Science 2023, 9, 100097. [Google Scholar] [CrossRef]
- Maghsoodi, A.I. Cryptocurrency portfolio allocation using a novel hybrid and predictive big data decision support system. Omega 2023, 115, 102787. [Google Scholar] [CrossRef]
- McMillan, D.G. Cross-asset relations, correlations and economic implications. Global Finance Journal 2019, 41, 60–78. [Google Scholar] [CrossRef]
- Zeevi, A.; Mashal, R. Beyond correlation: Extreme co-movements between financial assets. Available at SSRN 317122 2002. [Google Scholar]
- Koumou, G.B. Diversification and portfolio theory: a review. Financial Markets and Portfolio Management 2020, 34, 267–312. [Google Scholar] [CrossRef]
- Tolun Tayalı, S. A novel backtesting methodology for clustering in mean–variance portfolio optimization. Knowledge-Based Systems 2020, 209, 106454. [Google Scholar] [CrossRef]
- U.S. Department of the Treasury. Available online: https://home.treasury.gov/resource-center/data-chart-center/interest-rates/TextView?type=daily_treasury_bill_rates&field_tdr_date_value=2023. Accessed on 24. 20 April.
- Zhu, H.; Wang, Y.; Wang, K.; Chen, Y. Particle Swarm Optimization (PSO) for the constrained portfolio optimization problem. Expert Systems with Applications 2011, 38, 10161–10169. [Google Scholar] [CrossRef]
- Zaheer, K.B.; Abd Aziz, M.I.B.; Kashif, A.N.; Raza, S.M.M. Two stage portfolio selection and optimization model with the hybrid particle swarm optimization. Matematika.
- Sun, J.; Fang, W.; Wu, X.; Lai, C.H.; Xu, W. Solving the multi-stage portfolio optimization problem with a novel particle swarm optimization. Expert Systems with Applications 2011, 38, 6727–6735. [Google Scholar] [CrossRef]
- Sortino, F.A.; Price, L.N. Performance measurement in a downside risk framework. the Journal of Investing 1994, 3, 59–64. [Google Scholar] [CrossRef]
- Bailey, D.H.; Lopez de Prado, M. The Sharpe ratio efficient frontier. Journal of Risk 2012, 15, 13. [Google Scholar] [CrossRef]
- Mistry, J.; Shah, J. Dealing with the limitations of the Sharpe ratio for portfolio evaluation. Journal of Commerce and Accounting Research 2013, 2, 10. [Google Scholar]
- Cuchieri, N. Deep reinforcement learning for financial portfolio optimisation. Master’s thesis, University of Malta, 2021.
- Sharma, A.; Mehra, A. Financial analysis based sectoral portfolio optimization under second order stochastic dominance. Annals of Operations Research 2017, 256, 171–197. [Google Scholar] [CrossRef]
- Chang, T.J.; Meade, N.; Beasley, J.E.; Sharaiha, Y.M. Heuristics for cardinality constrained portfolio optimisation. Computers & Operations Research 2000, 27, 1271–1302. [Google Scholar] [CrossRef]
- Schaerf, A. Local Search Techniques for Constrained Portfolio Selection Problems. Computational Economics 2002, 20, 177–190. [Google Scholar] [CrossRef]
- Kennedy, J.; Eberhart, R. Particle swarm optimization. In Proceedings of the Proceedings of ICNN’95 - International Conference on Neural Networks, 1995, Vol. [CrossRef]
- Dorigo, M.; Maniezzo, V.; Colorni, A. Ant system: optimization by a colony of cooperating agents. IEEE Transactions on Systems, Man, and Cybernetics, Part B (Cybernetics) 1996, 26, 29–41. [Google Scholar] [CrossRef] [PubMed]
- Vikhar, P.A. Evolutionary algorithms: A critical review and its future prospects. In Proceedings of the 2016 International conference on global trends in signal processing, information computing and communication (ICGTSPICC). IEEE; 2016; pp. 261–265. [Google Scholar]
- Lin, T.L.; Horng, S.J.; Kao, T.W.; Chen, Y.H.; Run, R.S.; Chen, R.J.; Lai, J.L.; Kuo, I.H. An efficient job-shop scheduling algorithm based on particle swarm optimization. Expert Systems with Applications 2010, 37, 2629–2636. [Google Scholar] [CrossRef]
- Nguyen, S.; Zhang, M.; Johnston, M.; Tan, K.C. Automatic Programming via Iterated Local Search for Dynamic Job Shop Scheduling. IEEE Transactions on Cybernetics 2015, 45, 1–14. [Google Scholar] [CrossRef]
- Chernbumroong, S.; Cang, S.; Yu, H. Genetic Algorithm-Based Classifiers Fusion for Multisensor Activity Recognition of Elderly People. IEEE Journal of Biomedical and Health Informatics 2015, 19, 282–289. [Google Scholar] [CrossRef]
- Chen, C.H.; Liu, T.K.; Chou, J.H. A Novel Crowding Genetic Algorithm and Its Applications to Manufacturing Robots. IEEE Transactions on Industrial Informatics 2014, 10, 1705–1716. [Google Scholar] [CrossRef]
- Yang, X.S.; Talatahari, S.; Alavi, A.H. Metaheuristic Applications in Structures and Infrastructures; Newnes, 2013.
- Ertenlice, O.; Kalayci, C.B. A survey of swarm intelligence for portfolio optimization: Algorithms and applications. Swarm and Evolutionary Computation 2018, 39, 36–52. [Google Scholar] [CrossRef]
- Chen, Y.; Zhao, X.; Yuan, J. Swarm intelligence algorithms for portfolio optimization problems: Overview and recent advances. Mobile Information Systems 2022, 2022, 4241049. [Google Scholar] [CrossRef]
- Erwin, K.; Engelbrecht, A. Meta-heuristics for portfolio optimization. Soft Computing 2023, 27, 19045–19073. [Google Scholar] [CrossRef]
- Deng, G.F.; Lin, W.T.; Lo, C.C. Markowitz-based portfolio selection with cardinality constraints using improved particle swarm optimization. Expert Systems with Applications 2012, 39, 4558–4566. [Google Scholar] [CrossRef]
- Wang, W.; Wang, H.; Wu, Z.; Dai, H. A Simple and Fast Particle Swarm Optimization and Its Application on Portfolio Selection. In Proceedings of the 2009 International Workshop on Intelligent Systems and Applications; 2009; pp. 1–4. [Google Scholar] [CrossRef]
- Yin, X.; Ni, Q.; Zhai, Y. A novel PSO for portfolio optimization based on heterogeneous multiple population strategy. In Proceedings of the 2015 IEEE Congress on Evolutionary Computation (CEC); 2015; pp. 1196–1203. [Google Scholar] [CrossRef]
- Chen, C.; Chen, B.y. Complex portfolio selection using improving particle swarm optimization approach. In Proceedings of the 2018 IEEE 20th International Conference on High Performance Computing and Communications; 2018, IEEE 16th International Conference on Smart City; IEEE 4th International Conference on Data Science and Systems (HPCC/SmartCity/DSS). IEEE; pp. 828–835.
- Chang, T.J.; Meade, N.; Beasley, J.E.; Sharaiha, Y.M. Heuristics for cardinality constrained portfolio optimisation. Computers & Operations Research 2000, 27, 1271–1302. [Google Scholar]
- Koshino, M.; Murata, H.; Kimura, H. Improved particle swarm optimization and application to portfolio selection. Electronics and Communications in Japan (Part III: Fundamental Electronic Science) 2007, 90, 13–25. [Google Scholar] [CrossRef]
- Ponsich, A.; Jaimes, A.L.; Coello, C.A.C. A survey on multiobjective evolutionary algorithms for the solution of the portfolio optimization problem and other finance and economics applications. IEEE Transactions on evolutionary computation 2012, 17, 321–344. [Google Scholar] [CrossRef]
- Yu, L.; Wang, S.; Lai, K.K. Portfolio optimization using evolutionary algorithms. In Reflexing Interfaces: The Complex Coevolution of Information Technology Ecosystems; IGI Global, 2008; pp. 235–245.
- Chen, A.H.L.; Liang, Y.C.; Liu, C.C. Portfolio optimization using improved artificial bee colony approach. In Proceedings of the 2013 IEEE Conference on Computational Intelligence for Financial Engineering &, 2013, Economics (CIFEr); pp. 60–67. [CrossRef]
- Kalayci, C.B.; Polat, O.; Akbay, M.A. An efficient hybrid metaheuristic algorithm for cardinality constrained portfolio optimization. Swarm and Evolutionary Computation 2020, 54, 100662. [Google Scholar] [CrossRef]
- Machdar, N.M. The Effect of Capital Structure, Systematic Risk, and Unsystematic Risk on Stock Return. Business and Entrepreneurial Review 2015, 14, 149–160. [Google Scholar] [CrossRef]
- Rodriguez, M.Z.; Comin, C.H.; Casanova, D.; Bruno, O.M.; Amancio, D.R.; Costa, L.d.F.; Rodrigues, F.A. Clustering algorithms: A comparative approach. PloS one 2019, 14, e0210236. [Google Scholar] [CrossRef]
- Sarker, I.H. Machine learning: Algorithms, real-world applications and research directions. SN computer science 2021, 2, 160. [Google Scholar] [CrossRef]
- Tenkam, H.M.; Mba, J.C.; Mwambi, S.M. Optimization and Diversification of Cryptocurrency Portfolios: A Composite Copula-Based Approach. Applied Sciences 2022, 12, 6408. [Google Scholar] [CrossRef]
- Rdusseeun, L.; Kaufman, P. Clustering by means of medoids. In Proceedings of the Proceedings of the statistical data analysis based on the L1 norm conference, Neuchatel, Switzerland, 1987, Vol.
- Duarte, F.G.; De Castro, L.N. A Framework to Perform Asset Allocation Based on Partitional Clustering. IEEE Access 2020, 8, 110775–110788. [Google Scholar] [CrossRef]
- Arora, P.; Deepali. ; Varshney, S. Analysis of K-Means and K-Medoids Algorithm For Big Data. Procedia Computer Science 2016, 78, 507–512. [Google Scholar] [CrossRef]
- Lopez de Prado, M. Building diversified portfolios that outperform out-of-sample. Journal of Portfolio Management 2016. [Google Scholar] [CrossRef]
- Sass, J.; Thös, A.K. Risk reduction and portfolio optimization using clustering methods. Econometrics and Statistics 2024, 32, 1–16. [Google Scholar] [CrossRef]
- Yun, I.; Jong, H.; Rim, W.; et al. Portfolio Optimization Based on K-Means Clustering and Particle Swarm Optimization Using Financial Statements and Stock Price Data.
- Bjerring, T.T.; Ross, O.; Weissensteiner, A. Feature selection for portfolio optimization. Annals of Operations Research 2017, 256, 21–40. [Google Scholar] [CrossRef]
- Nanda, S.R.; Mahanty, B.; Tiwari, M.K. Clustering Indian stock market data for portfolio management. Expert Systems with Applications 2010, 37, 8793–8798. [Google Scholar] [CrossRef]
- Bezdek, J.C.; Pal, N.R. Cluster validation with generalized Dunn’s indices. In Proceedings of the Proceedings 1995 second New Zealand international two-stream conference on artificial neural networks and expert systems. IEEE; 1995; pp. 190–193. [Google Scholar]
- Navarro, M.M.; Young, M.N.; Prasetyo, Y.T.; Taylar, J.V. Stock market optimization amidst the COVID-19 pandemic: Technical analysis, K-means algorithm, and mean-variance model (TAKMV) approach. Heliyon 2023, 9. [Google Scholar] [CrossRef]
- Wu, D.; Wang, X.; Wu, S. Construction of stock portfolios based on k-means clustering of continuous trend features. Knowledge-Based Systems 2022, 252, 109358. [Google Scholar] [CrossRef]
- Chen, R.R.; Huang, W.K.; Yeh, S.K. Particle swarm optimization approach to portfolio construction. Intelligent Systems in Accounting, Finance and Management 2021, 28, 182–194. [Google Scholar] [CrossRef]
- Data, F. Complete Intraday Bundle. Available online: https://firstratedata.com/cb/1/complete-us-stocks-index-etf-futures. Accessed on. 30 April.
- Ta, V.D.; Liu, C.M.; Tadesse, D.A. Portfolio optimization-based stock prediction using long-short term memory network in quantitative trading. Applied Sciences 2020, 10, 437. [Google Scholar] [CrossRef]
- Platanakis, E.; Urquhart, A. Should investors include bitcoin in their portfolios? A portfolio theory approach. The British accounting review 2020, 52, 100837. [Google Scholar] [CrossRef]
- LOUIS, F.R.B.O.S. 3-Month Treasury Bill Secondary Market Rate, Discount Basis (TB3MS). Available online: https://fred.stlouisfed.org/series/TB3MS#0. Accessed on. 30 May.
- Top 25 Stocks in the S&P 500 By Index Weight for March 2025. Available online: https://www.investopedia.com/best-25-sp500-stocks-8550793. Accessed on. 9 April.
- Elton, E.J. Presidential Address: Expected Return, Realized Return, and Asset Pricing Tests. The Journal of Finance 1999, 54, 1199–1220. [Google Scholar] [CrossRef]
- Daily Returns Meaning. Available online: https://www.stockopedia.com/ratios/daily-volatility-12000/. Accessed on 24. 20 October.
- Peng, J.; Hahn, J.; Huang, K.W. Handling missing values in information systems research: A review of methods and assumptions. Information Systems Research 2023, 34, 5–26. [Google Scholar] [CrossRef]
- Pratama, I.; Permanasari, A.E.; Ardiyanto, I.; Indrayani, R. A review of missing values handling methods on time-series data. In Proceedings of the 2016 international conference on information technology systems and innovation (ICITSI). IEEE; 2016; pp. 1–6. [Google Scholar]
- Uddin, A.; Tao, X.; Chou, C.C.; Yu, D. Are missing values important for earnings forecasts? A machine learning perspective. Quantitative finance 2022, 22, 1113–1132. [Google Scholar] [CrossRef]
- Kofman, P.; Sharpe, I.G. Using multiple imputation in the analysis of incomplete observations in finance. Journal of Financial Econometrics 2003, 1, 216–249. [Google Scholar] [CrossRef]
- Chen, A.Y.; McCoy, J. Missing values handling for machine learning portfolios. Journal of Financial Economics 2024, 155, 103815. [Google Scholar] [CrossRef]
- Wang, C.H.; Zeng, Y.; Yuan, J. Two-stage stock portfolio optimization based on AI-powered price prediction and mean-CVaR models. Expert Systems with Applications 2024, 255, 124555. [Google Scholar] [CrossRef]
- Ojha, A.; Saxena, V. Understanding stock market trends using simple moving average (SMA) and exponential moving average (EMA) indicators. In Proceedings of the 2023 6th International Conference on Contemporary Computing and Informatics (IC3I). IEEE, Vol. 6; 2023; pp. 1931–1935. [Google Scholar]
- Time series and moving averages. Available online: https://www.accaglobal.com/ie/en/student/exam-support-resources/fundamentals-exams-study-resources/f5/technical-articles/time-series.html#:%5C~:text=The%5C%20first%5C%20four%5C%20observations%5C%20are,together%5C%20and%5C%20dividing%5C%20by%5C%20two. Accessed on 24. 20 October.
- Amal, M.A.; Napitupulu, H.; et al. Particle Swarm Optimization Algorithm for Determining Global Optima of Investment Portfolio Weight Using Mean-Value-at-Risk Model in Banking Sector Stocks. Mathematics 2024, 12, 3920. [Google Scholar] [CrossRef]
- Xu, F.; Chen, W.; Yang, L. Improved Particle Swarm Optimization for Realistic Portfolio Selection. In Proceedings of the Eighth ACIS International Conference on Software Engineering, Artificial Intelligence, Networking, 2007, Vol. 1, and Parallel/Distributed Computing (SNPD 2007); pp. 185–190. [Google Scholar] [CrossRef]
- Črepinšek, M.; Liu, S.H.; Mernik, M. Exploration and exploitation in evolutionary algorithms: A survey. ACM computing surveys (CSUR) 2013, 45, 1–33. [Google Scholar] [CrossRef]
- Xu, F.; Chen, W.; Yang, L. Improved particle swarm optimization for realistic portfolio selection. In Proceedings of the Eighth ACIS International Conference on Software Engineering, Artificial Intelligence, Networking, 2007, Vol. 1, and Parallel/Distributed Computing (SNPD 2007). IEEE; pp. 185–190. [Google Scholar]
- Freitas, D.; Lopes, L.G.; Morgado-Dias, F. Particle swarm optimisation: a historical review up to the current developments. Entropy 2020, 22, 362. [Google Scholar] [CrossRef]
- Mean-Variance Optimization. Available online: https://pyportfolioopt.readthedocs.io/en/latest/MeanVariance.html. Accessed on 23. 20 July.
- Jensen, T.I.; Kelly, B.T.; Malamud, S.; Pedersen, L.H. Machine learning and the implementable efficient frontier. Swiss Finance Institute Research Paper 2024. [Google Scholar] [CrossRef]
- Merton, R.C. An analytic derivation of the efficient portfolio frontier. Journal of financial and quantitative analysis 1972, 7, 1851–1872. [Google Scholar] [CrossRef]
- General Efficient Frontier. Available online: https://pyportfolioopt.readthedocs.io/en/latest/GeneralEfficientFrontier.html. Accessed on 23. 20 July.
- Lorenzo, L.; Arroyo, J. Analysis of the cryptocurrency market using different prototype-based clustering techniques. Financial Innovation 2022, 8, 7. [Google Scholar] [CrossRef]
- Rousseeuw, P.J. Silhouettes: A graphical aid to the interpretation and validation of cluster analysis. Journal of Computational and Applied Mathematics 1987, 20, 53–65. [Google Scholar] [CrossRef]
- Thorndike, R.L. Who belongs in the family? Psychometrika 1953, 18, 267–276. [Google Scholar] [CrossRef]
- Shutaywi, M.; Kachouie, N.N. Silhouette analysis for performance evaluation in machine learning with applications to clustering. Entropy 2021, 23, 759. [Google Scholar] [CrossRef]
- sklearn extra K-Medoids. Available online: https://scikit-learn-extra.readthedocs.io/en/stable/generated/sklearn_extra.cluster.KMedoids.html. Accessed on 24. 20 October.
- Understanding Small-Cap and Big-Cap Stocks. Available online: https://www.investopedia.com/insights/understanding-small-and-big-cap-stocks/. Accessed on 24. 20 October.
- Sanderson, R.; Lumpkin-Sowers, N.L. Buy and hold in the new age of stock market volatility: A story about ETFs. International Journal of Financial Studies 2018, 6, 79. [Google Scholar] [CrossRef]
- Evans, J.L. The random walk hypothesis, portfolio analysis and the buy-and-hold criterion. Journal of Financial and Quantitative Analysis 1968, 3, 327–342. [Google Scholar] [CrossRef]
- Paiva, F.D.; Cardoso, R.T.N.; Hanaoka, G.P.; Duarte, W.M. Decision-making for financial trading: A fusion approach of machine learning and portfolio selection. Expert Systems with Applications 2019, 115, 635–655. [Google Scholar] [CrossRef]
- Nzokem, A.; Maposa, D. Bitcoin versus s&p 500 index: Return and risk analysis. Mathematical and Computational Applications 2024, 29, 44. [Google Scholar]
- Caferra, R.; Vidal-Tomás, D. Who raised from the abyss? A comparison between cryptocurrency and stock market dynamics during the COVID-19 pandemic. Finance Research Letters 2021, 43, 101954. [Google Scholar] [CrossRef]
- Brini, A.; Lenz, J. A comparison of cryptocurrency volatility-benchmarking new and mature asset classes. Financial Innovation 2024, 10, 122. [Google Scholar] [CrossRef]
- Alonso-Monsalve, S.; Suárez-Cetrulo, A.L.; Cervantes, A.; Quintana, D. Convolution on neural networks for high-frequency trend prediction of cryptocurrency exchange rates using technical indicators. Expert Systems with Applications 2020, 149, 113250. [Google Scholar] [CrossRef]
- Source code for Efficient Frontier class in Python. Available online: https://pyportfolioopt.readthedocs.io/en/latest/_modules/pypfopt/efficient_frontier/efficient_frontier.html. Accessed on 24. 20 October.
- Aljinović, Z.; Marasović, B.; Šestanović, T. Cryptocurrency portfolio selection—a multicriteria approach. Mathematics 2021, 9, 1677. [Google Scholar] [CrossRef]
- CoinMarketCap - Cryptocurrency Prices by Market Cap. Available online: coinmarketcap.com. Accessed on. 7 July.
- The 100 largest companies in the world by market capitalization in 2024. Available online: https://www.statista.com/statistics/263264/top-companies-in-the-world-by-market-capitalization/. Accessed on 25. 20 January.
- Kim, Y.B.; Kim, J.G.; Kim, W.; Im, J.H.; Kim, T.H.; Kang, S.J.; Kim, C.H. Predicting fluctuations in cryptocurrency transactions based on user comments and replies. PloS one 2016, 11, e0161197. [Google Scholar] [CrossRef]
Figure 1.
Adaptation of [13] with detailed explanation of the components to show the update of a particle’s position in PSO
Figure 1.
Adaptation of [13] with detailed explanation of the components to show the update of a particle’s position in PSO
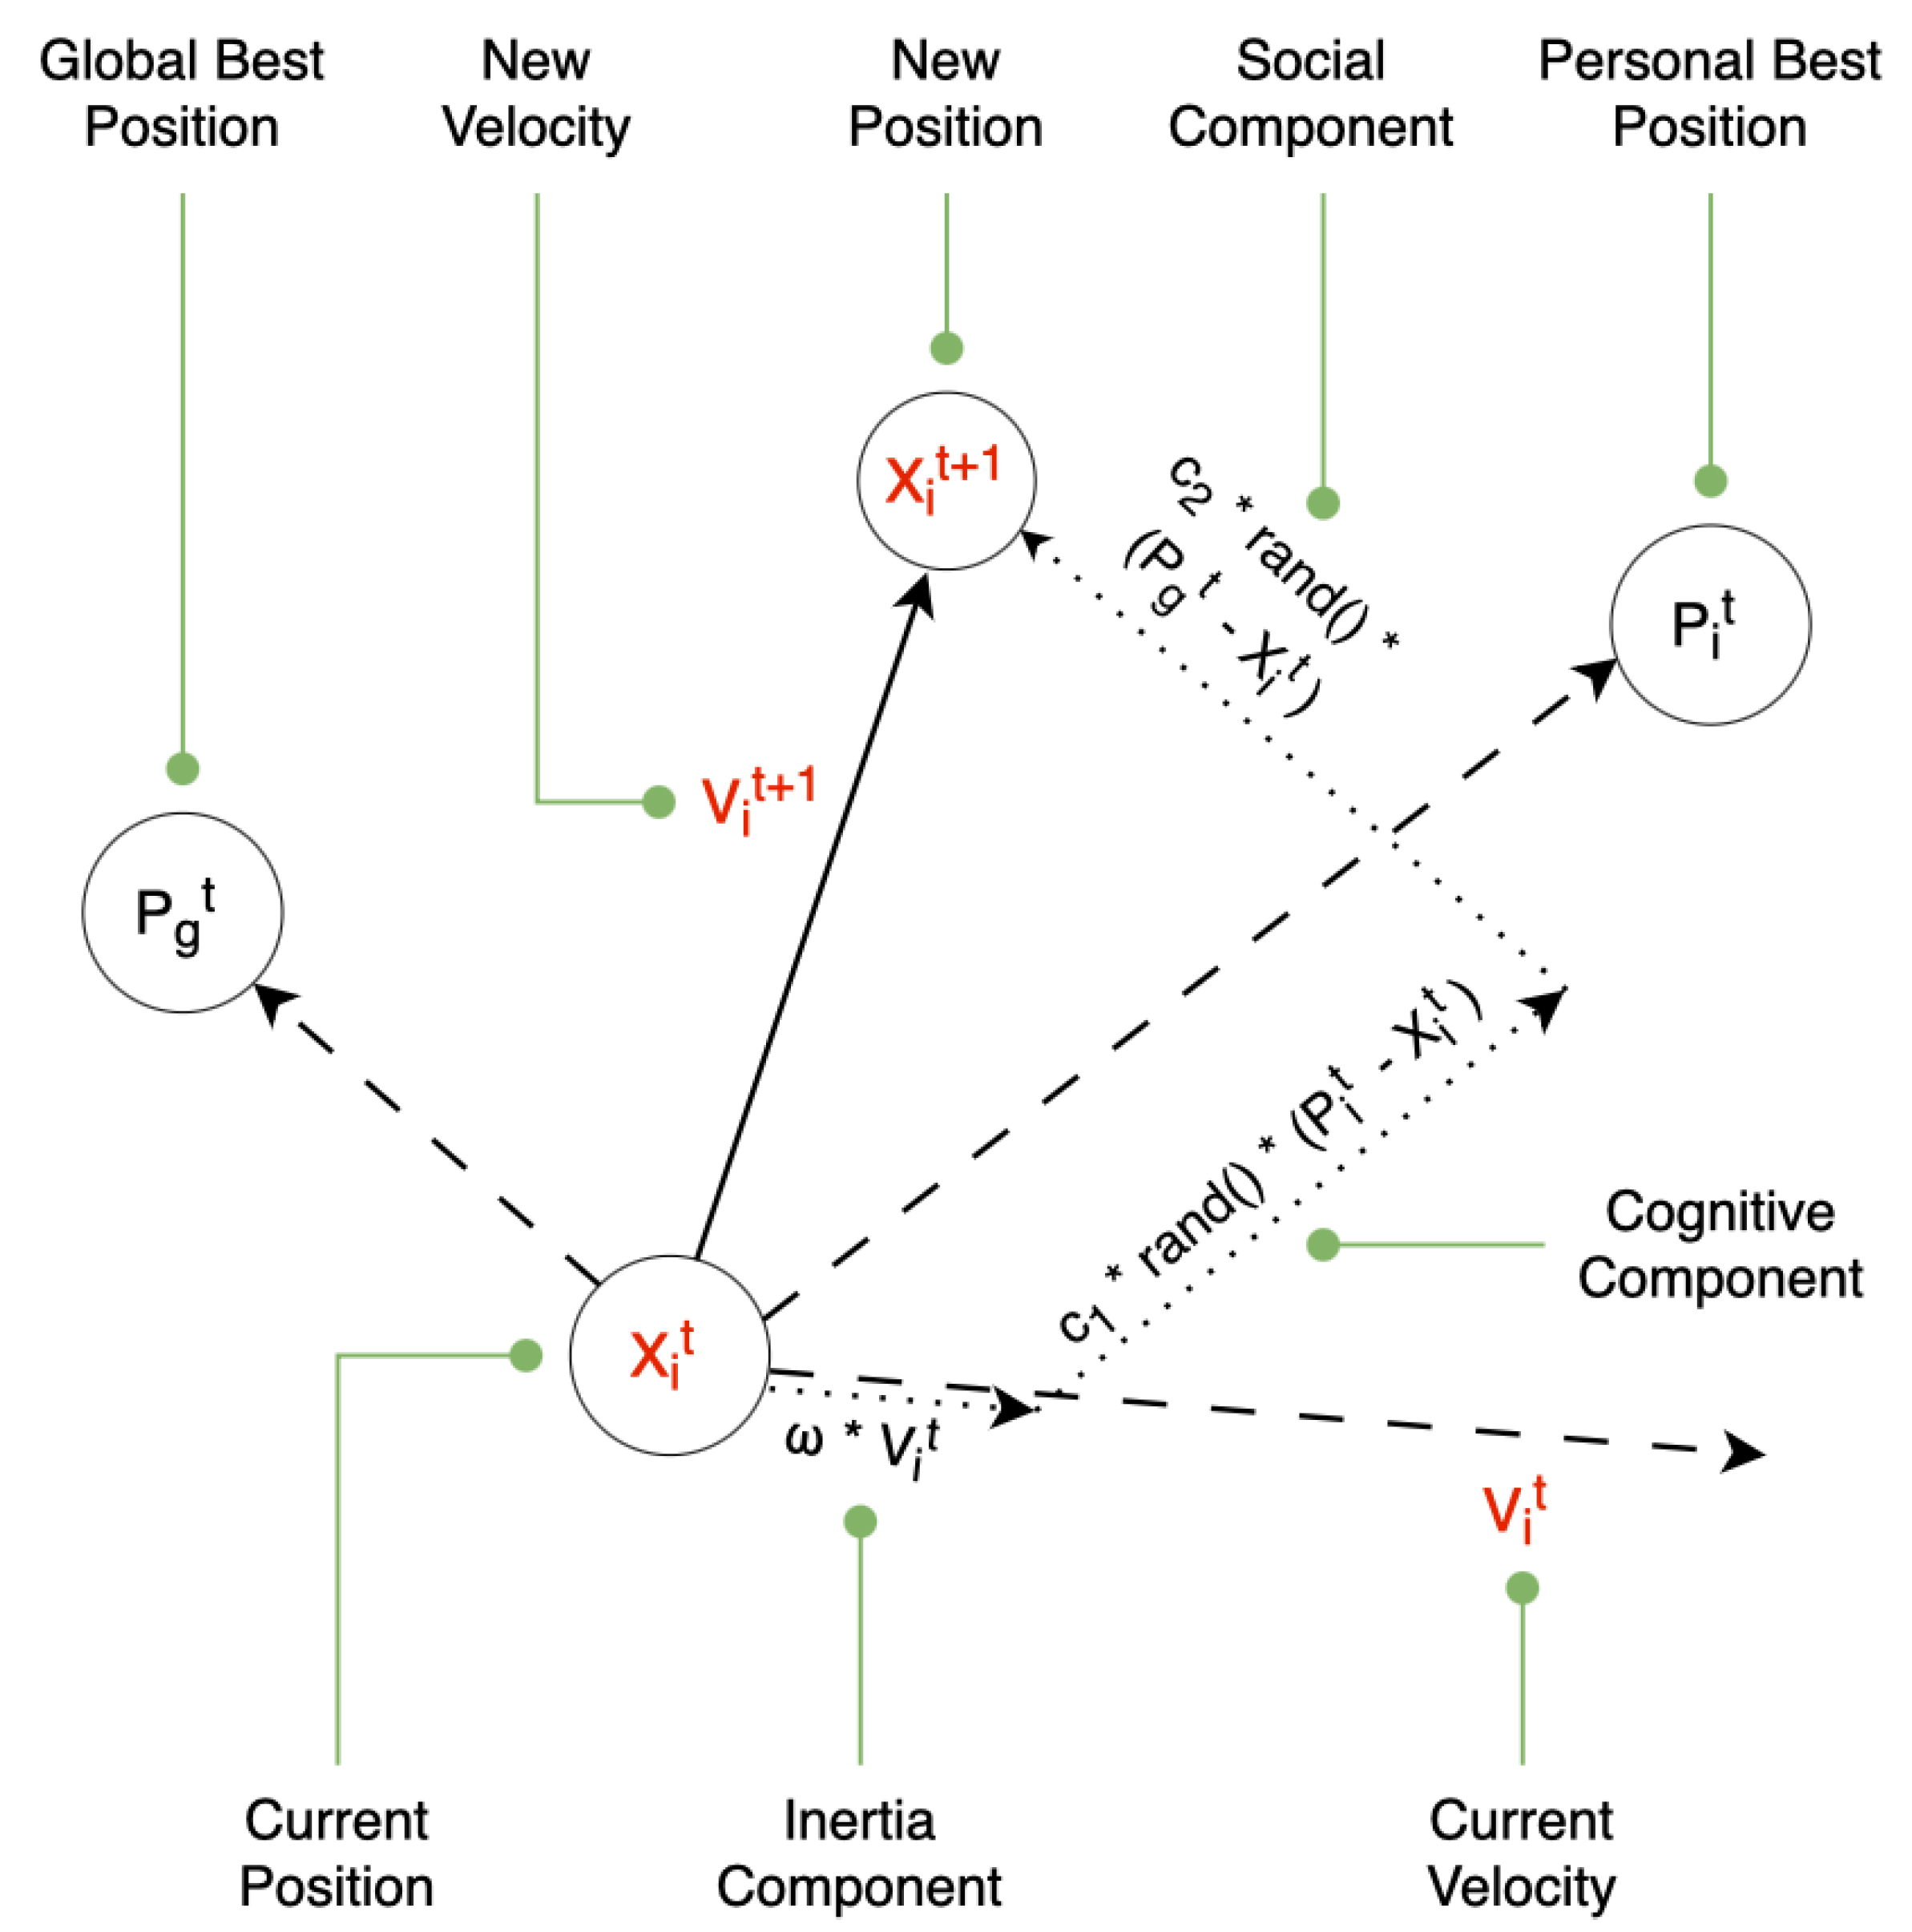
Figure 2.
Process representing the three steps of PO that includes clustering and asset selection.
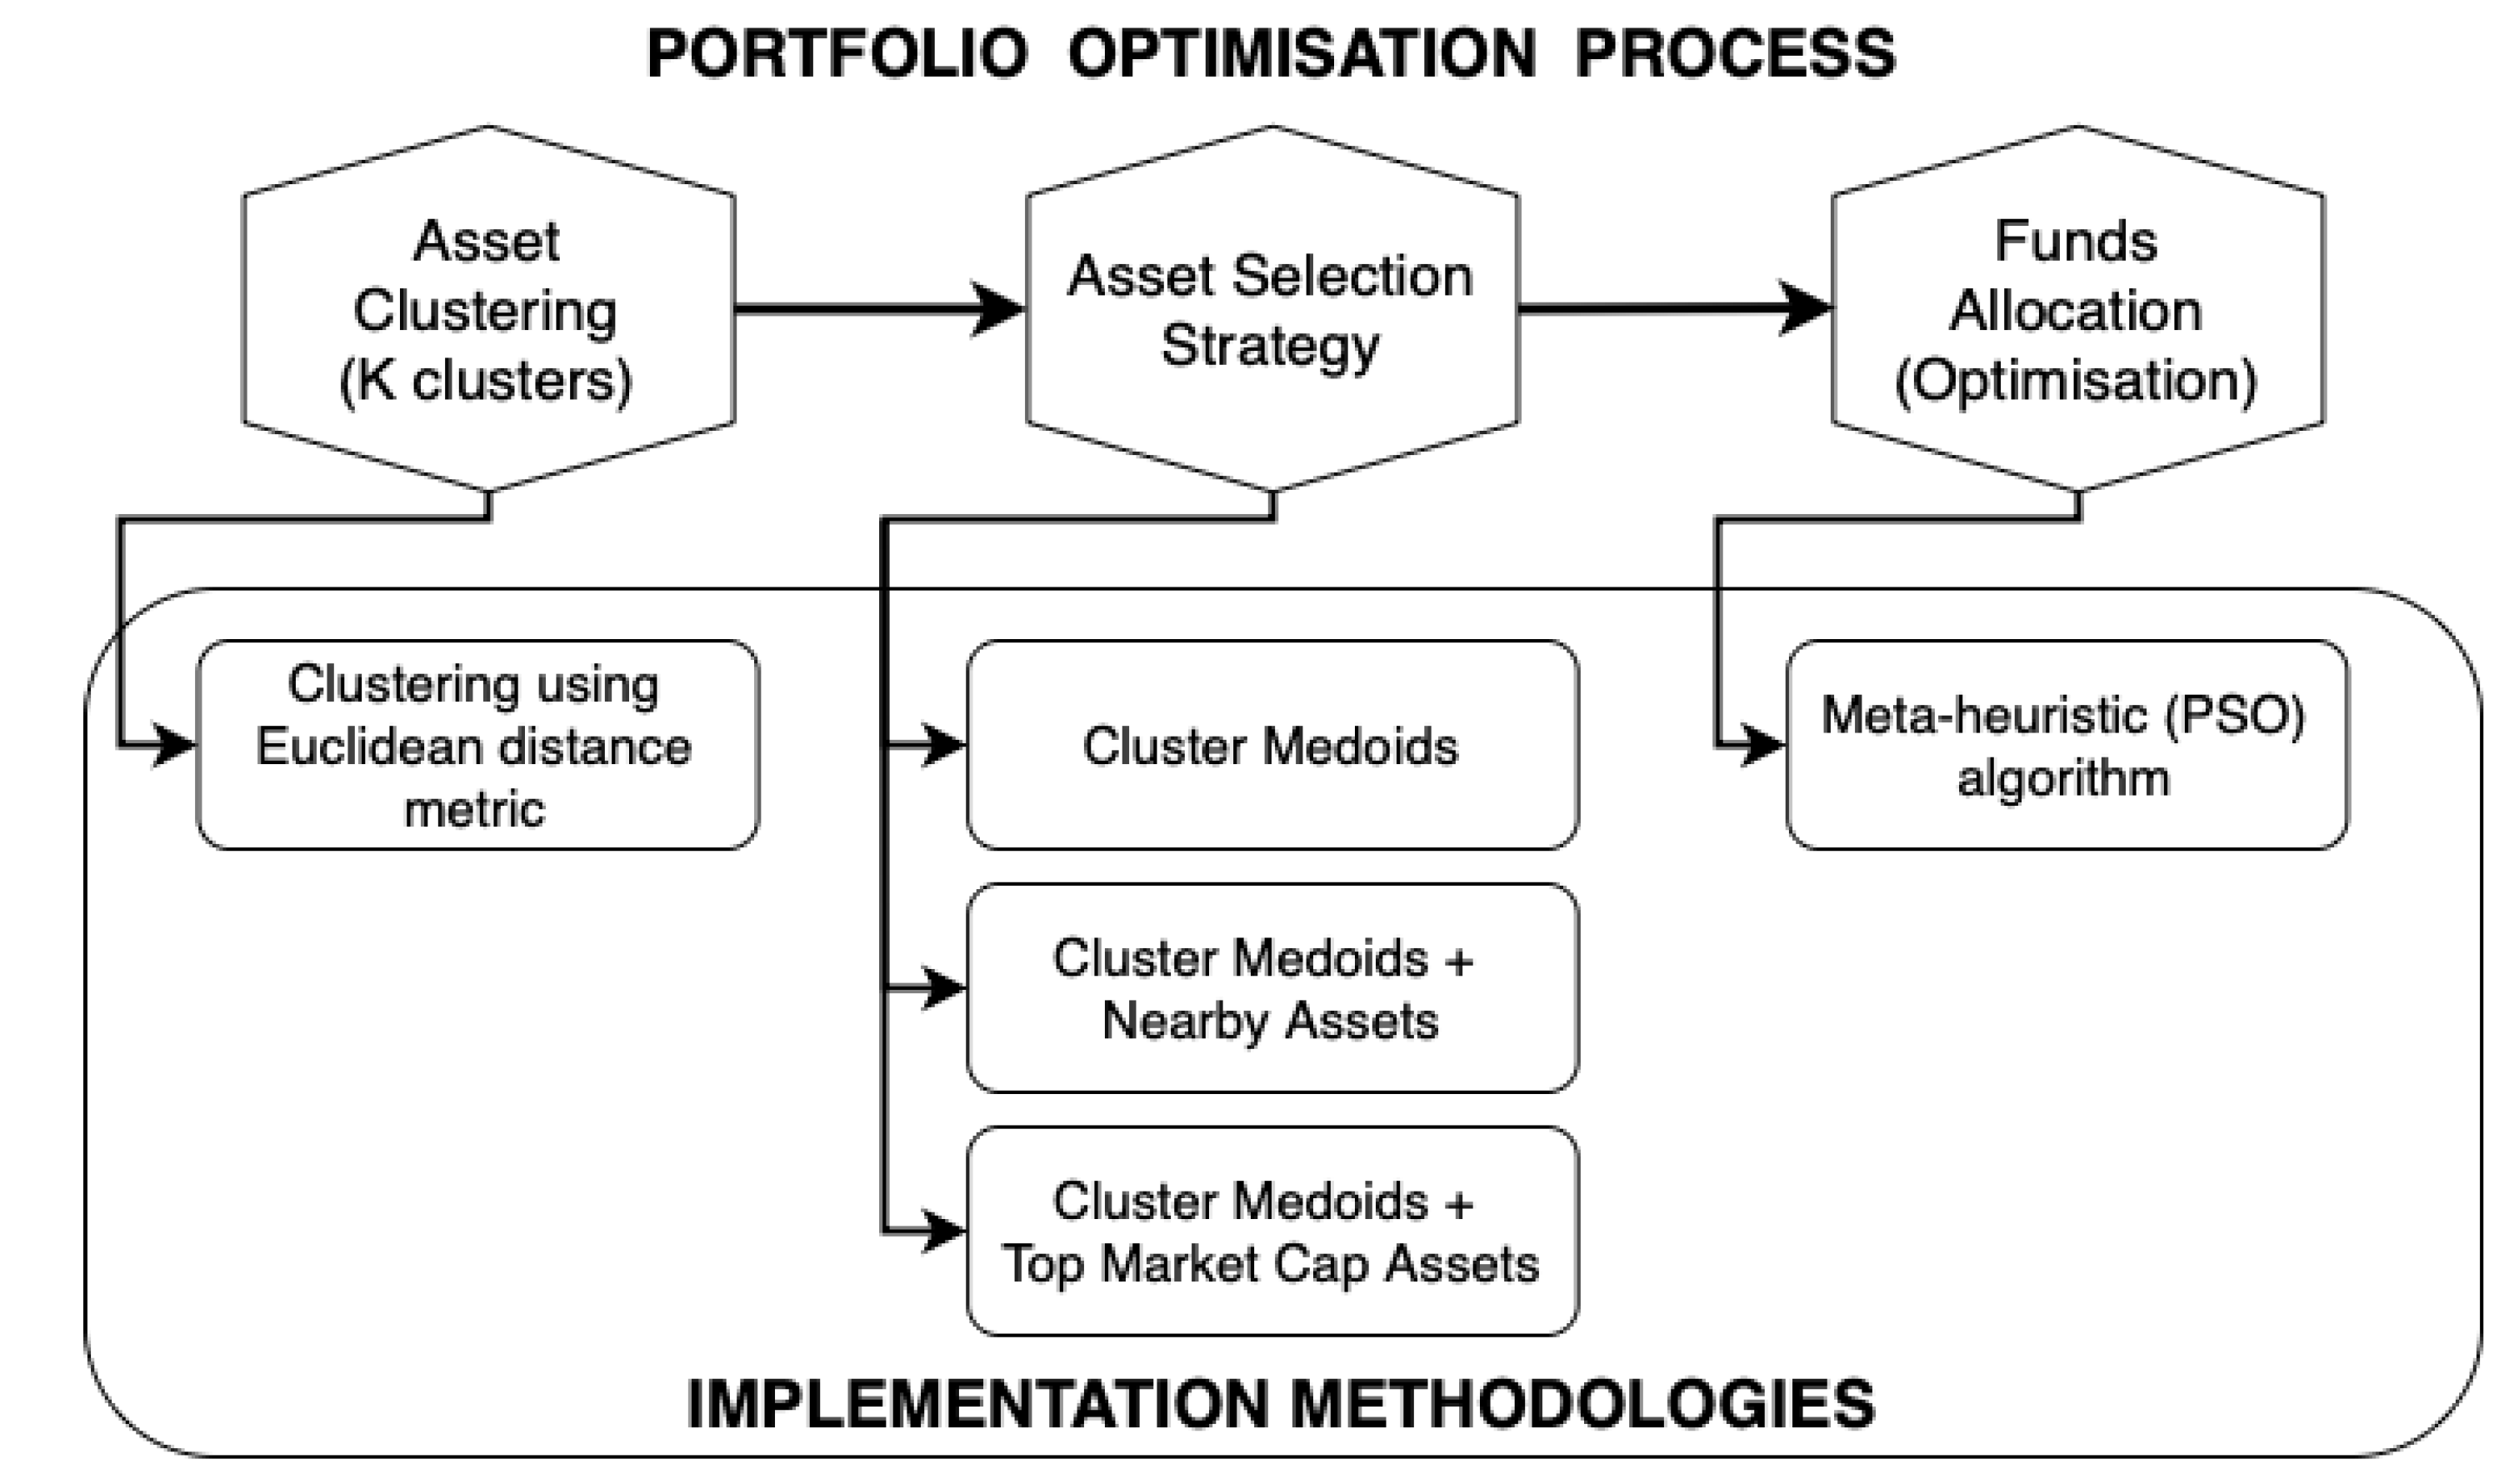
Figure 3.
Number of time periods between 1 January 2017 and 11 February 2020 for which the PSO models of this research are better than the 6 models mentioned in the paper based on "Next Day returns" evaluation metric of the paper. In total, rebalancing took place over 32 time periods. Different risk-adjusted returns metrics are used for training the PSO models.
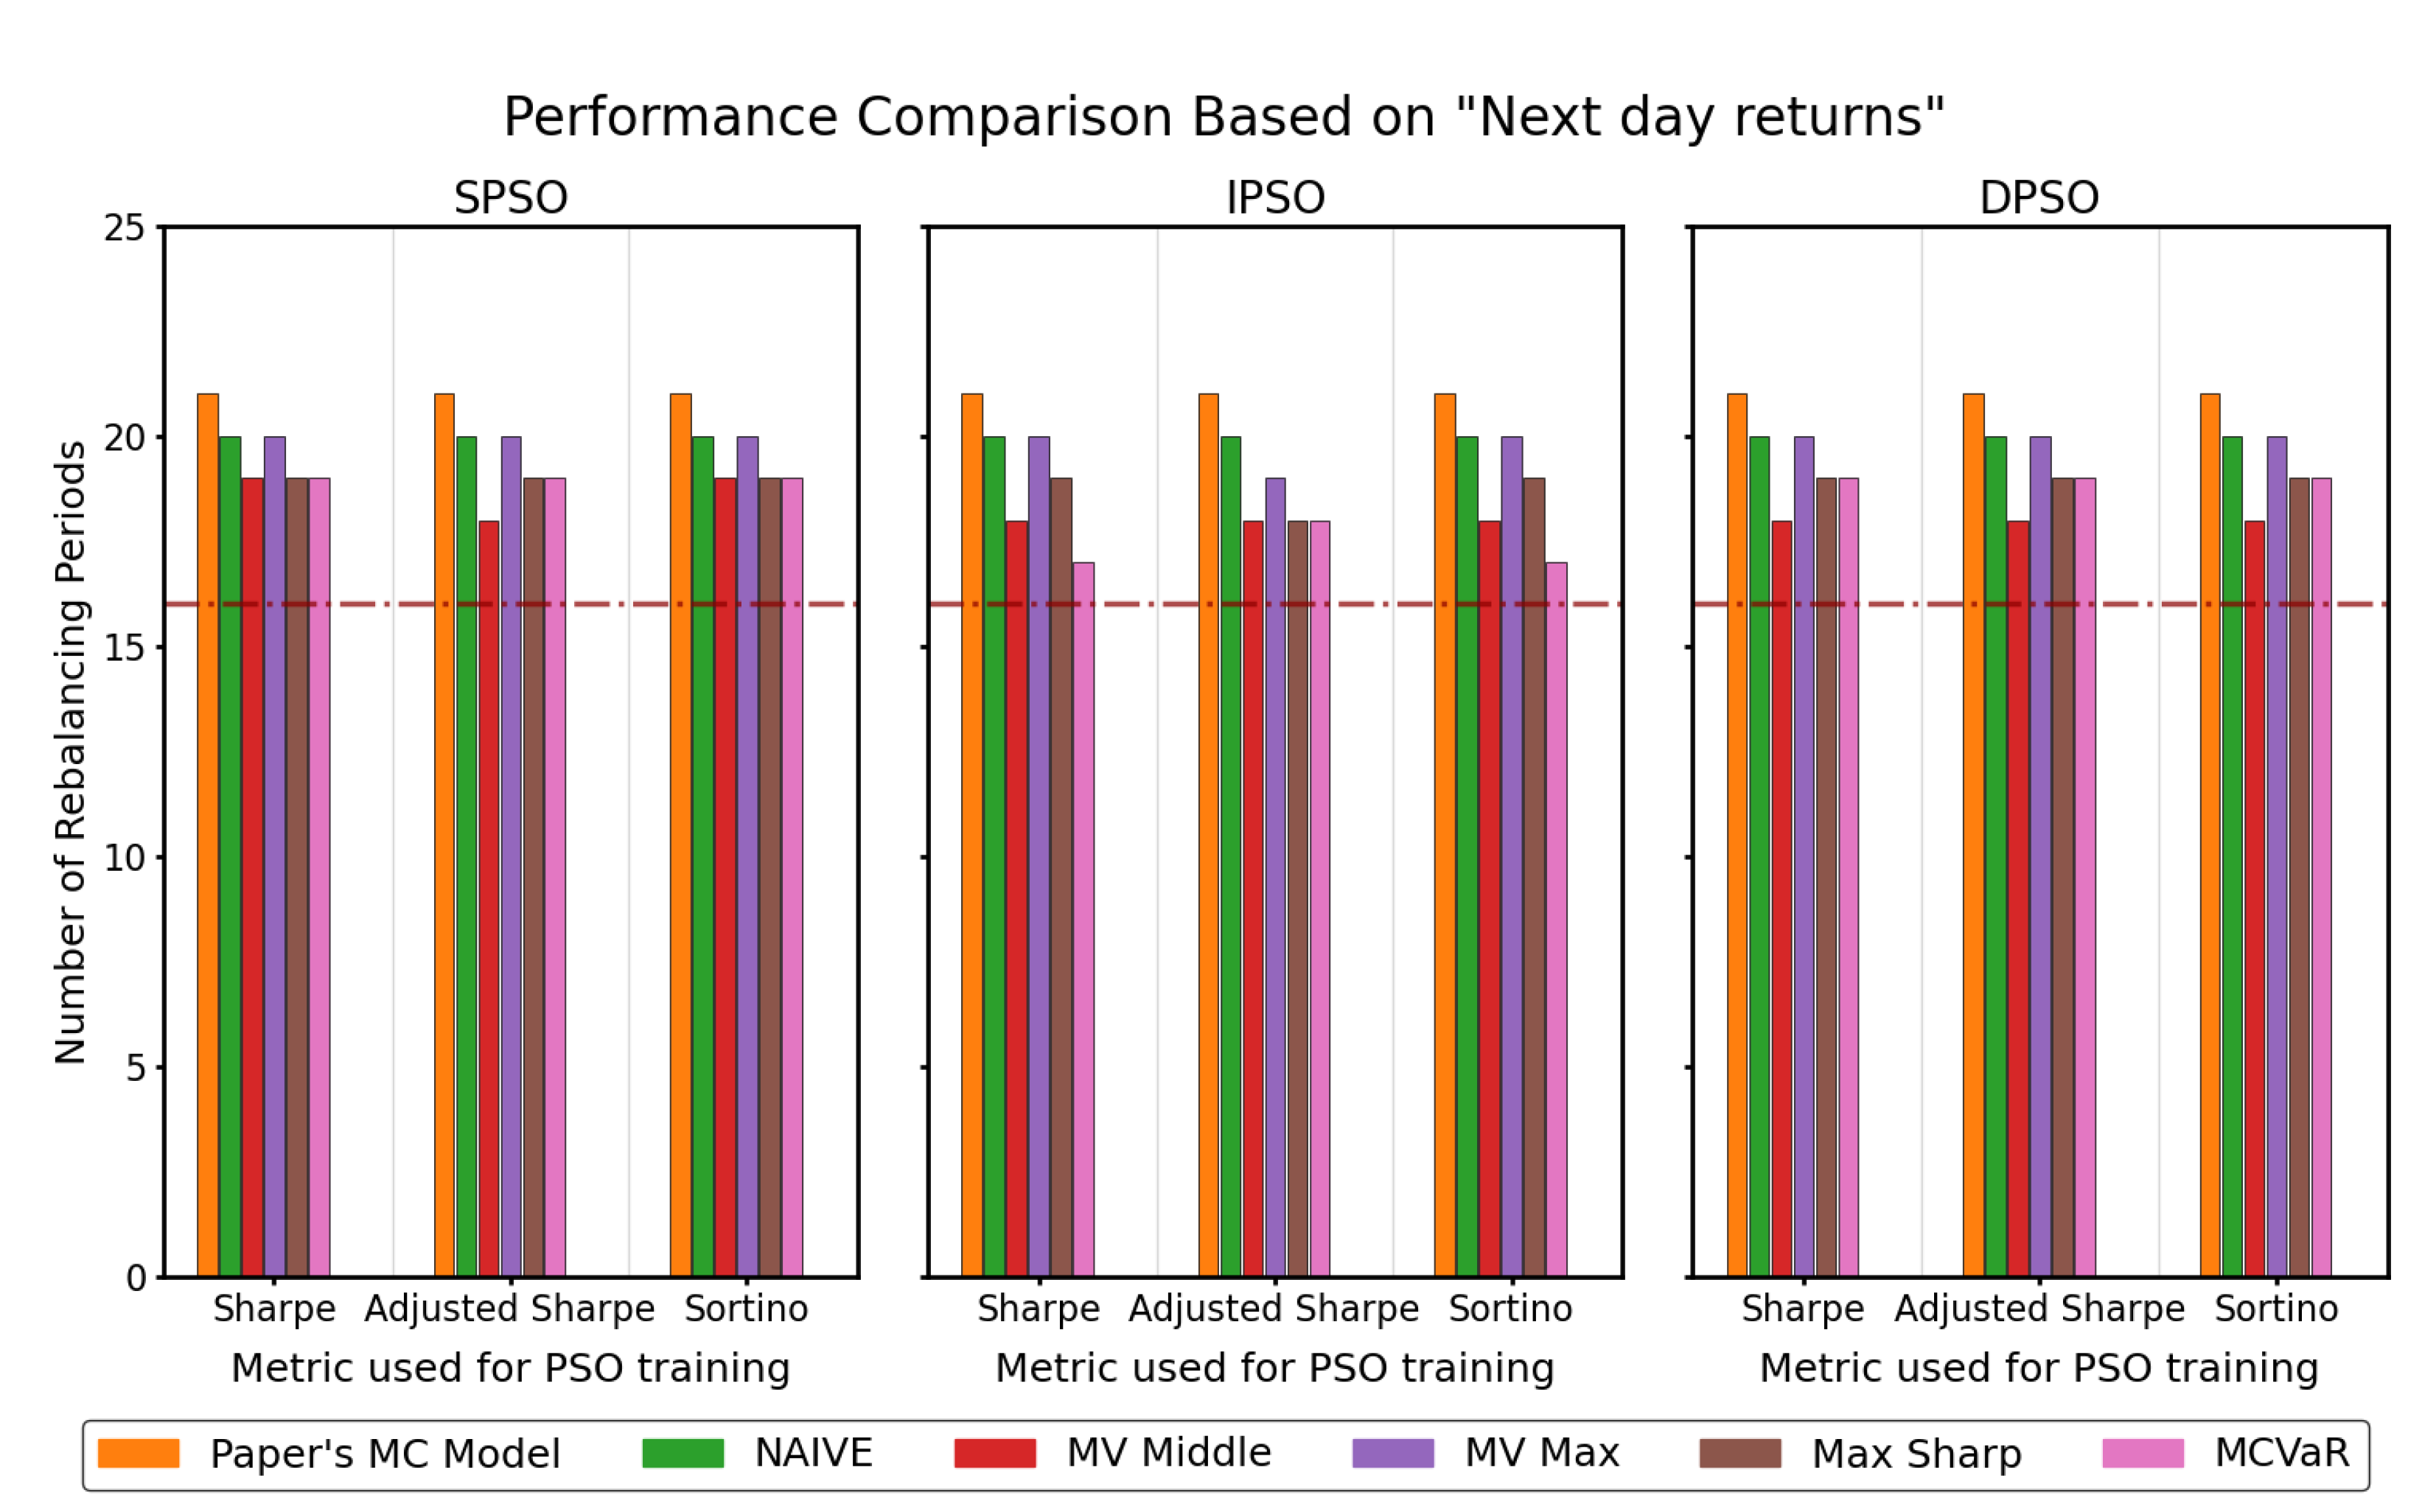
Figure 4.
Number of time periods between 1 January 2017 and 11 February 2020 for which the PSO models of this research are better than the 6 models mentioned in the paper based on "Mean 30 returns" evaluation metric of the paper. In total, rebalancing took place over 32 time periods. Different risk-adjusted returns metrics are used for training the PSO models.
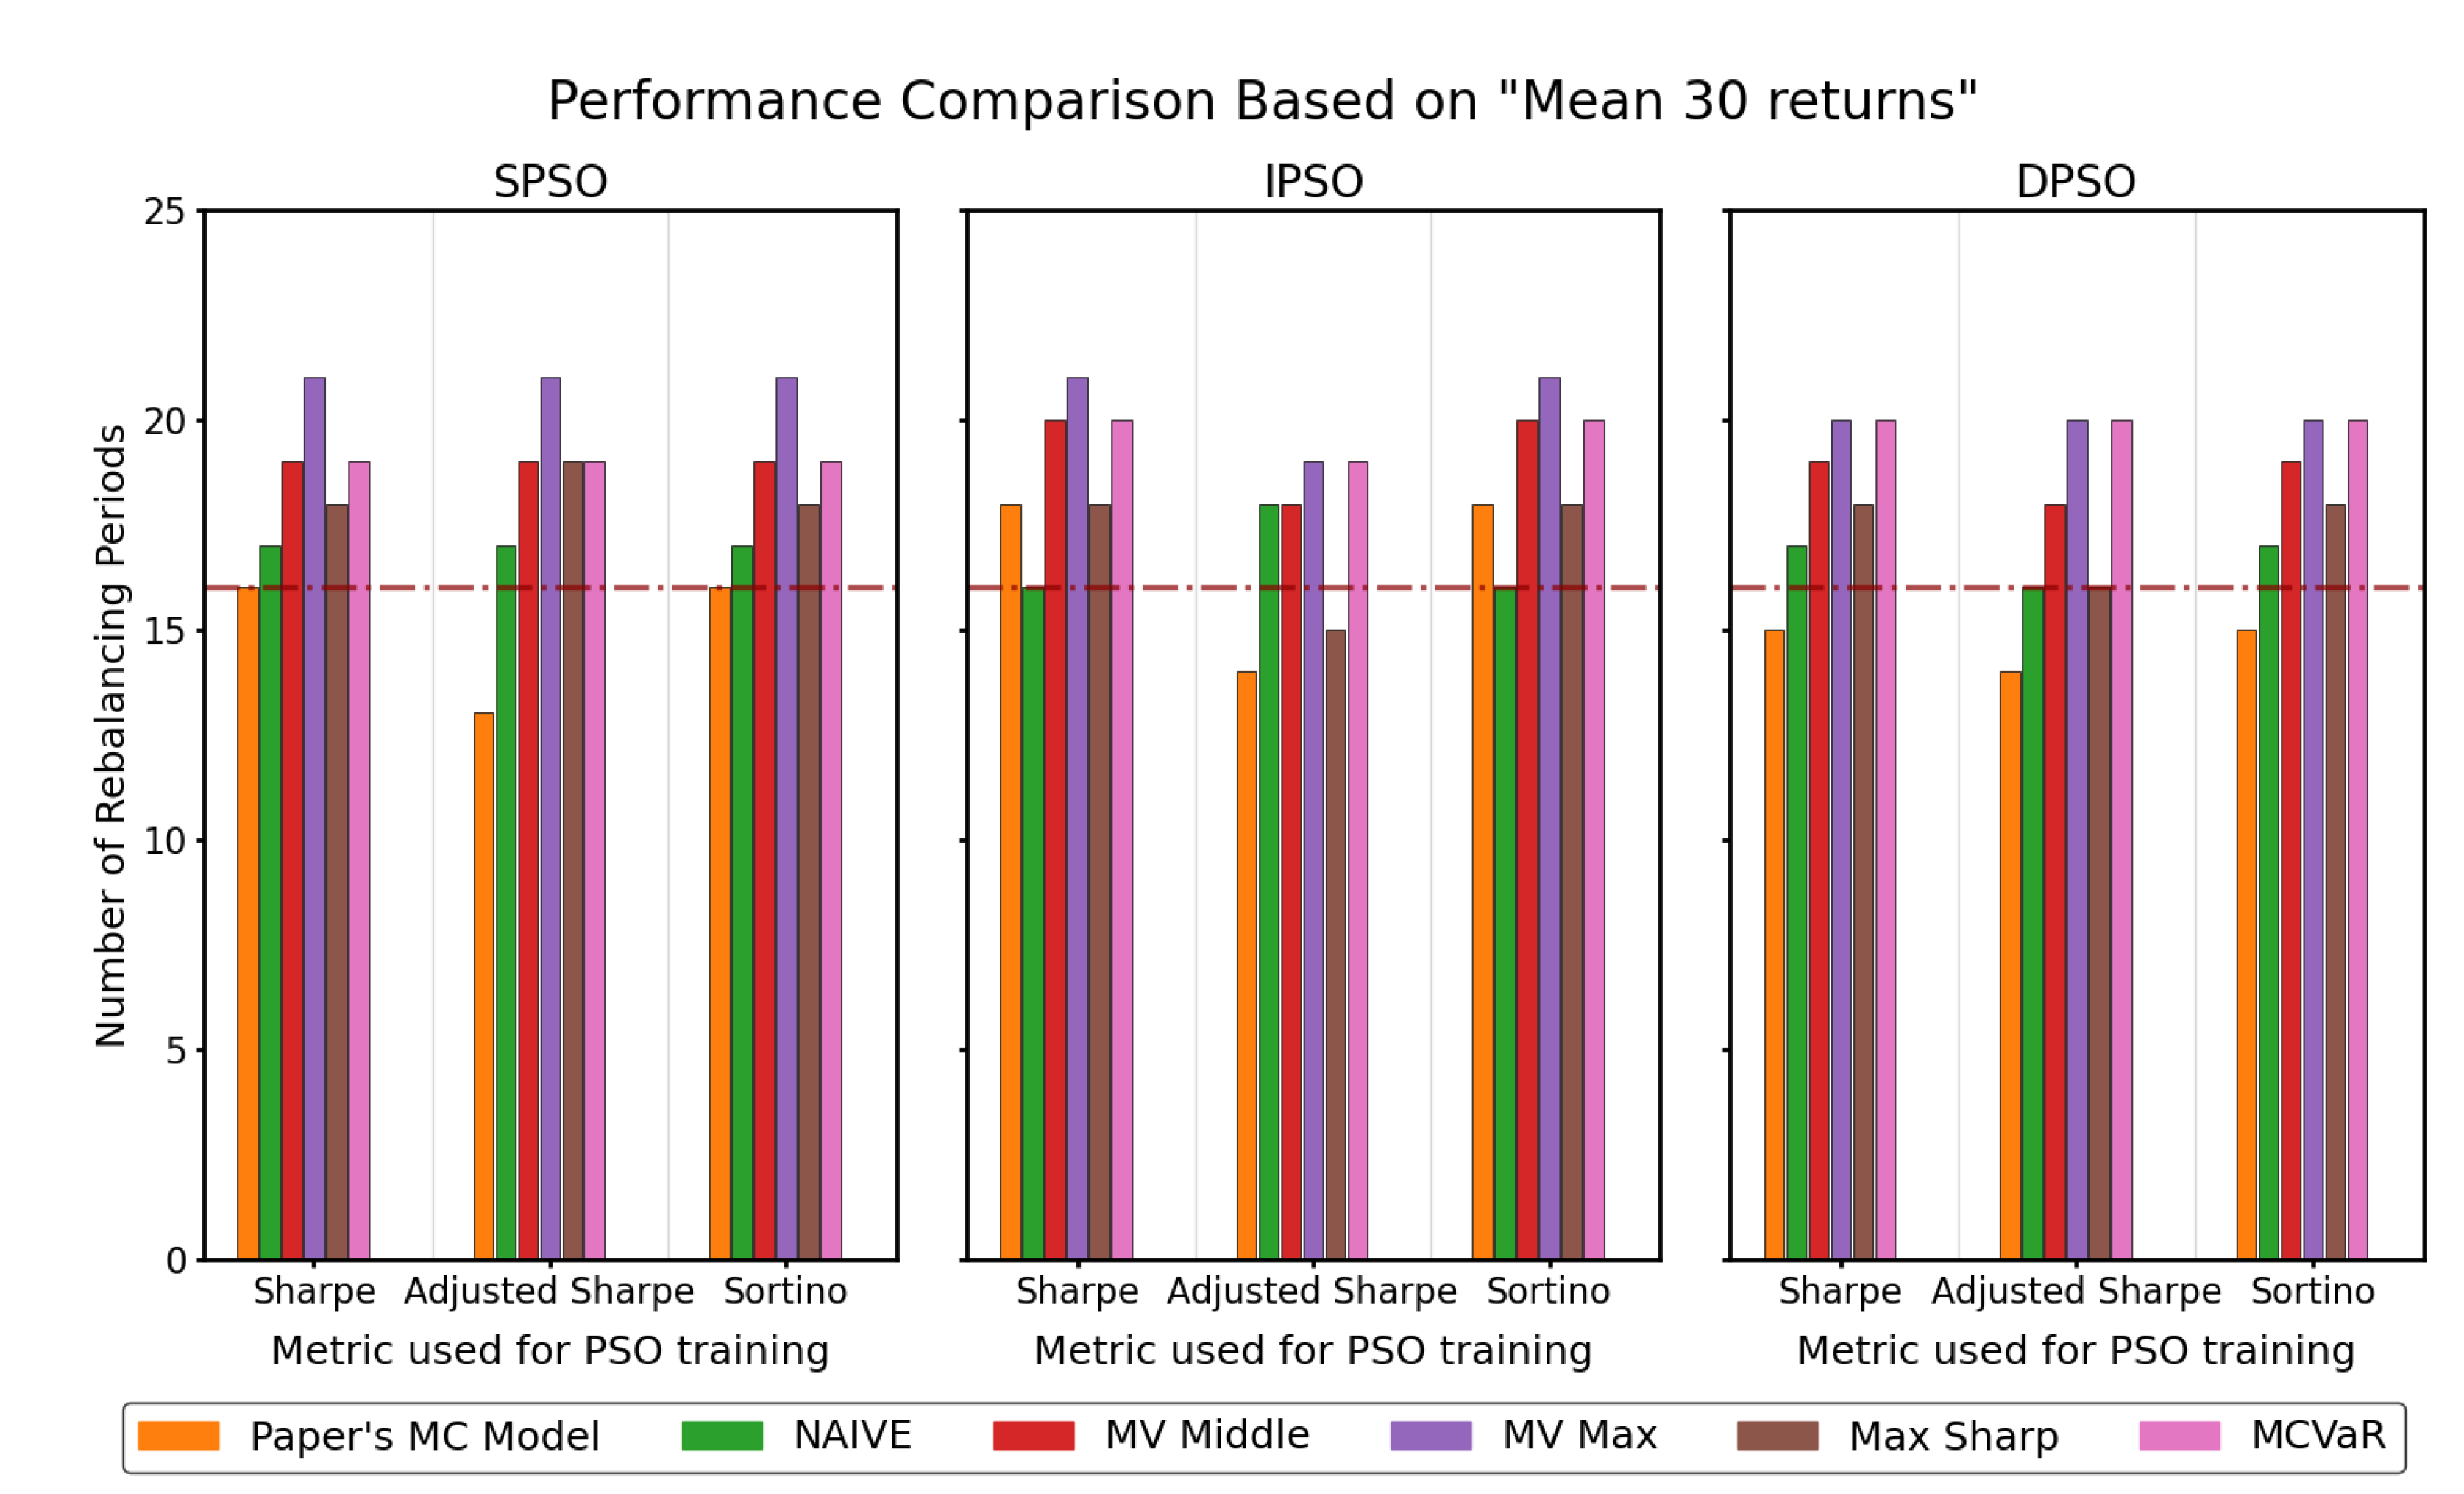
Figure 5.
Number of time periods between 1 January 2017 and 11 February 2020 for which the PSO models of this research are better than the 6 models mentioned in the paper based on "SD 30 returns" evaluation metric of the paper. In total, rebalancing took place over 32 time periods. Different risk-adjusted returns metrics are used for training the PSO models.
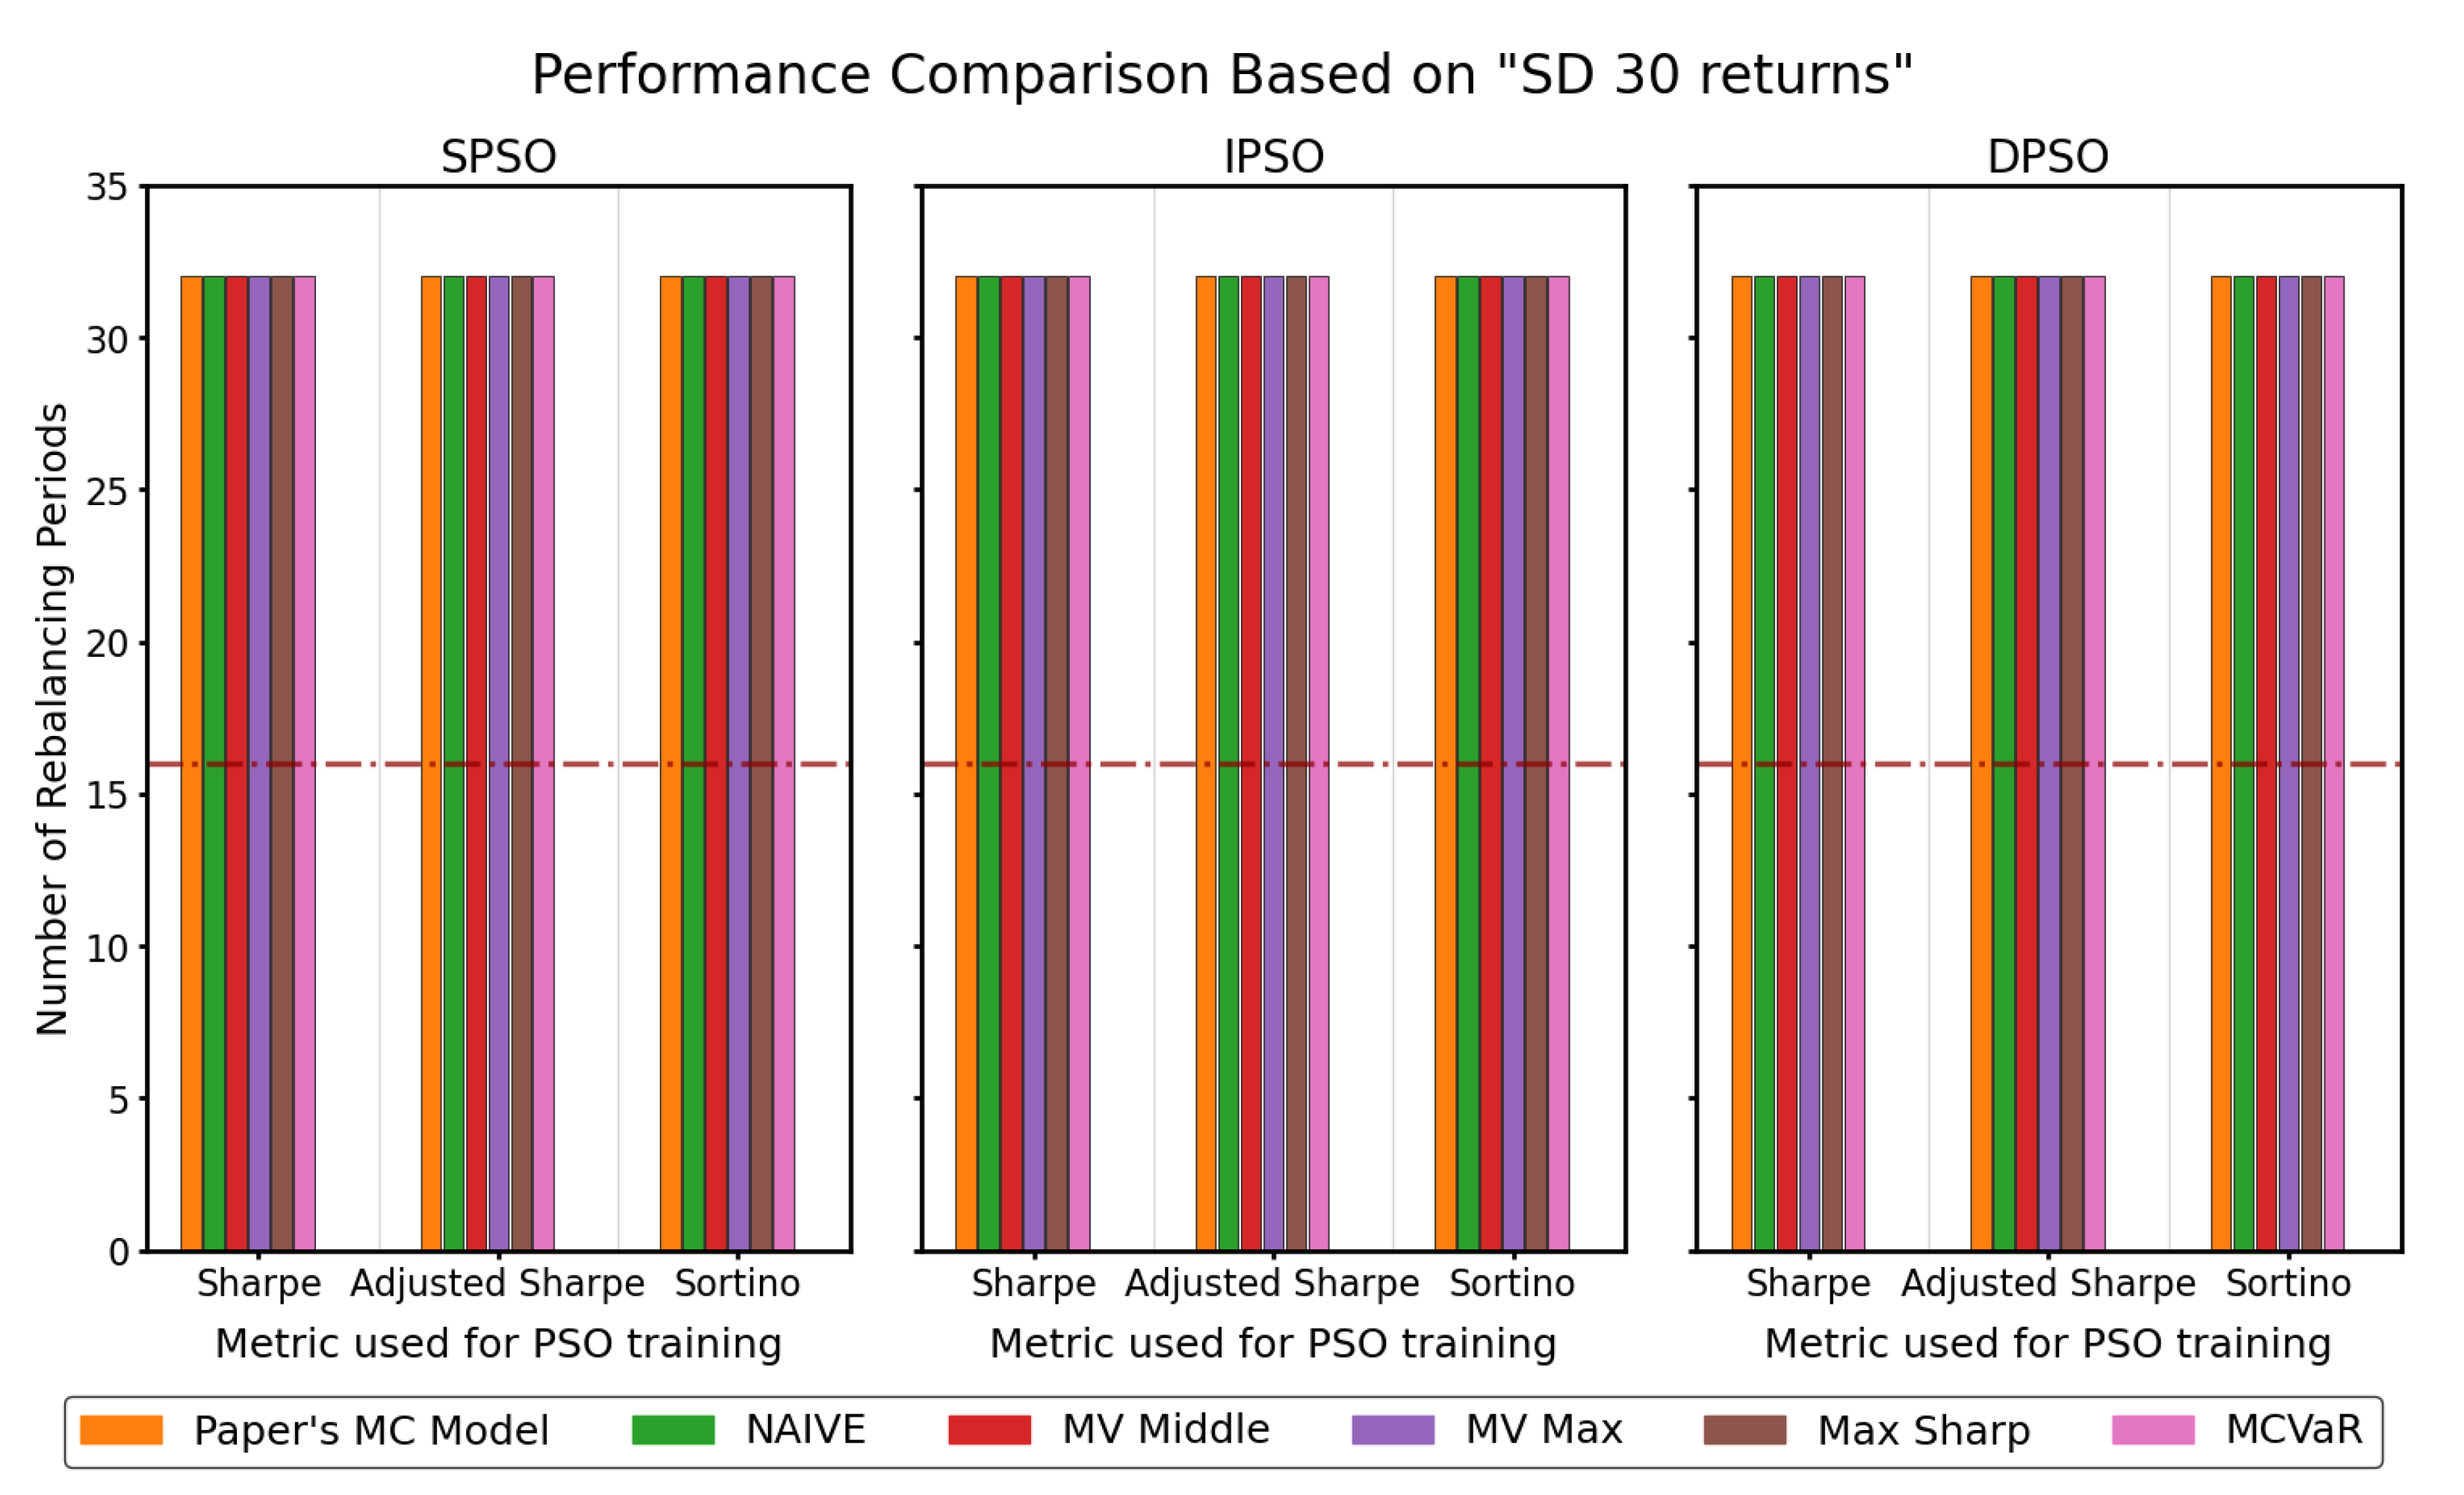
Figure 6.
Elbow graph and Silhouette scores for different values of K (number of clusters) for cryptocurrency assets.
Figure 6.
Elbow graph and Silhouette scores for different values of K (number of clusters) for cryptocurrency assets.
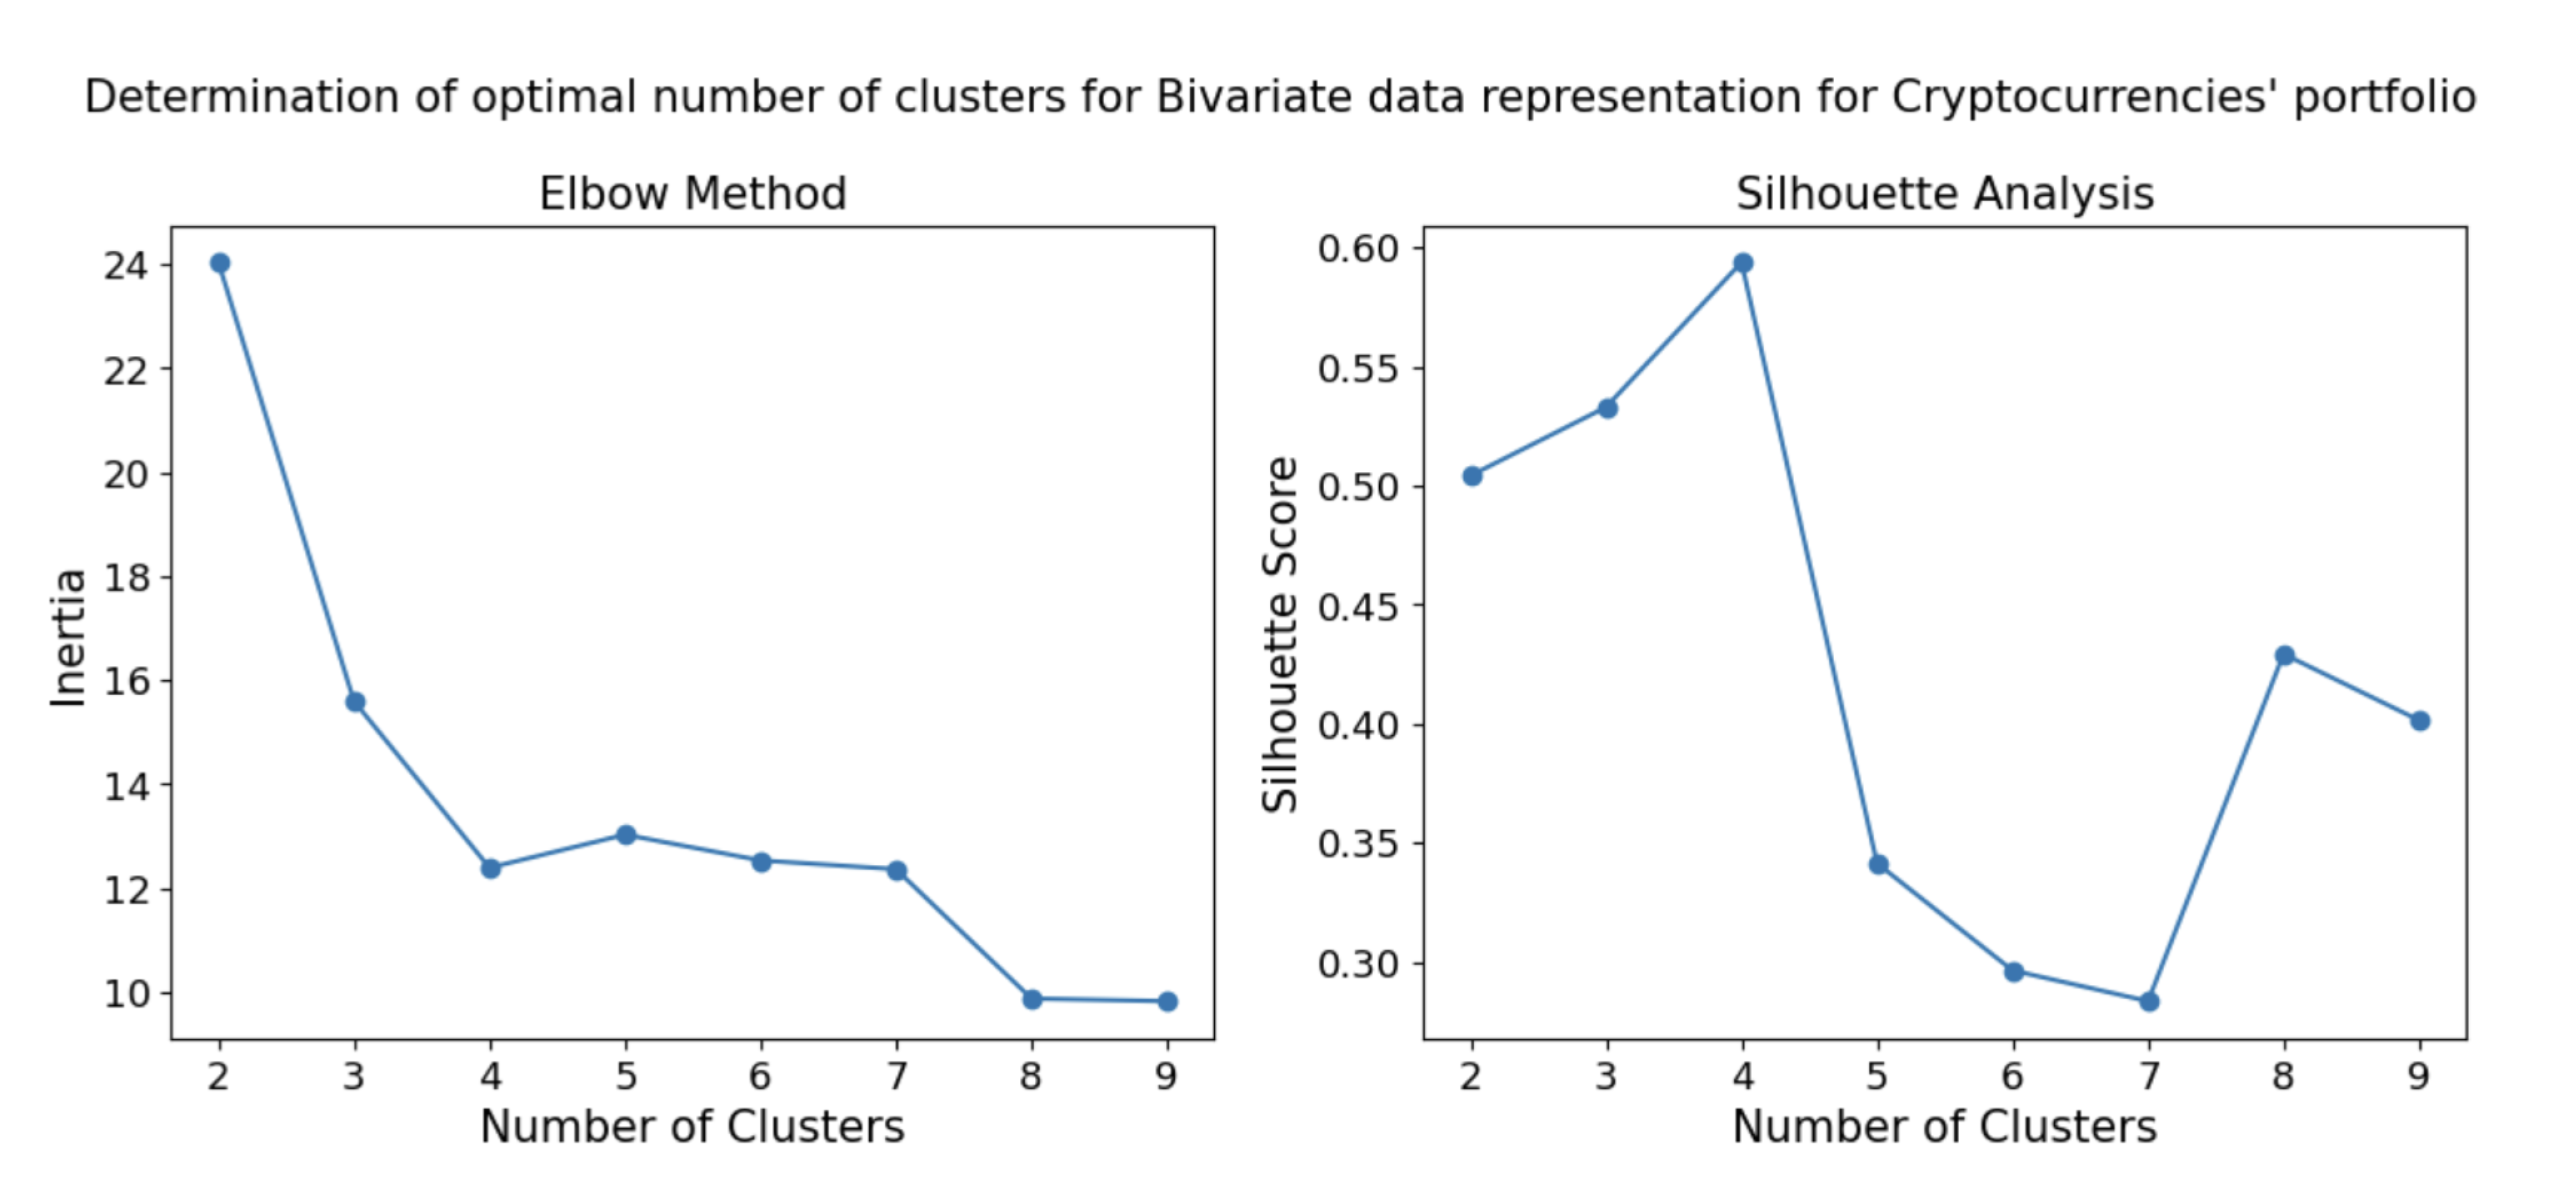
Figure 7.
Elbow graph and Silhouette scores for different values of K (number of clusters) for Nasdaq100 stocks.
Figure 7.
Elbow graph and Silhouette scores for different values of K (number of clusters) for Nasdaq100 stocks.
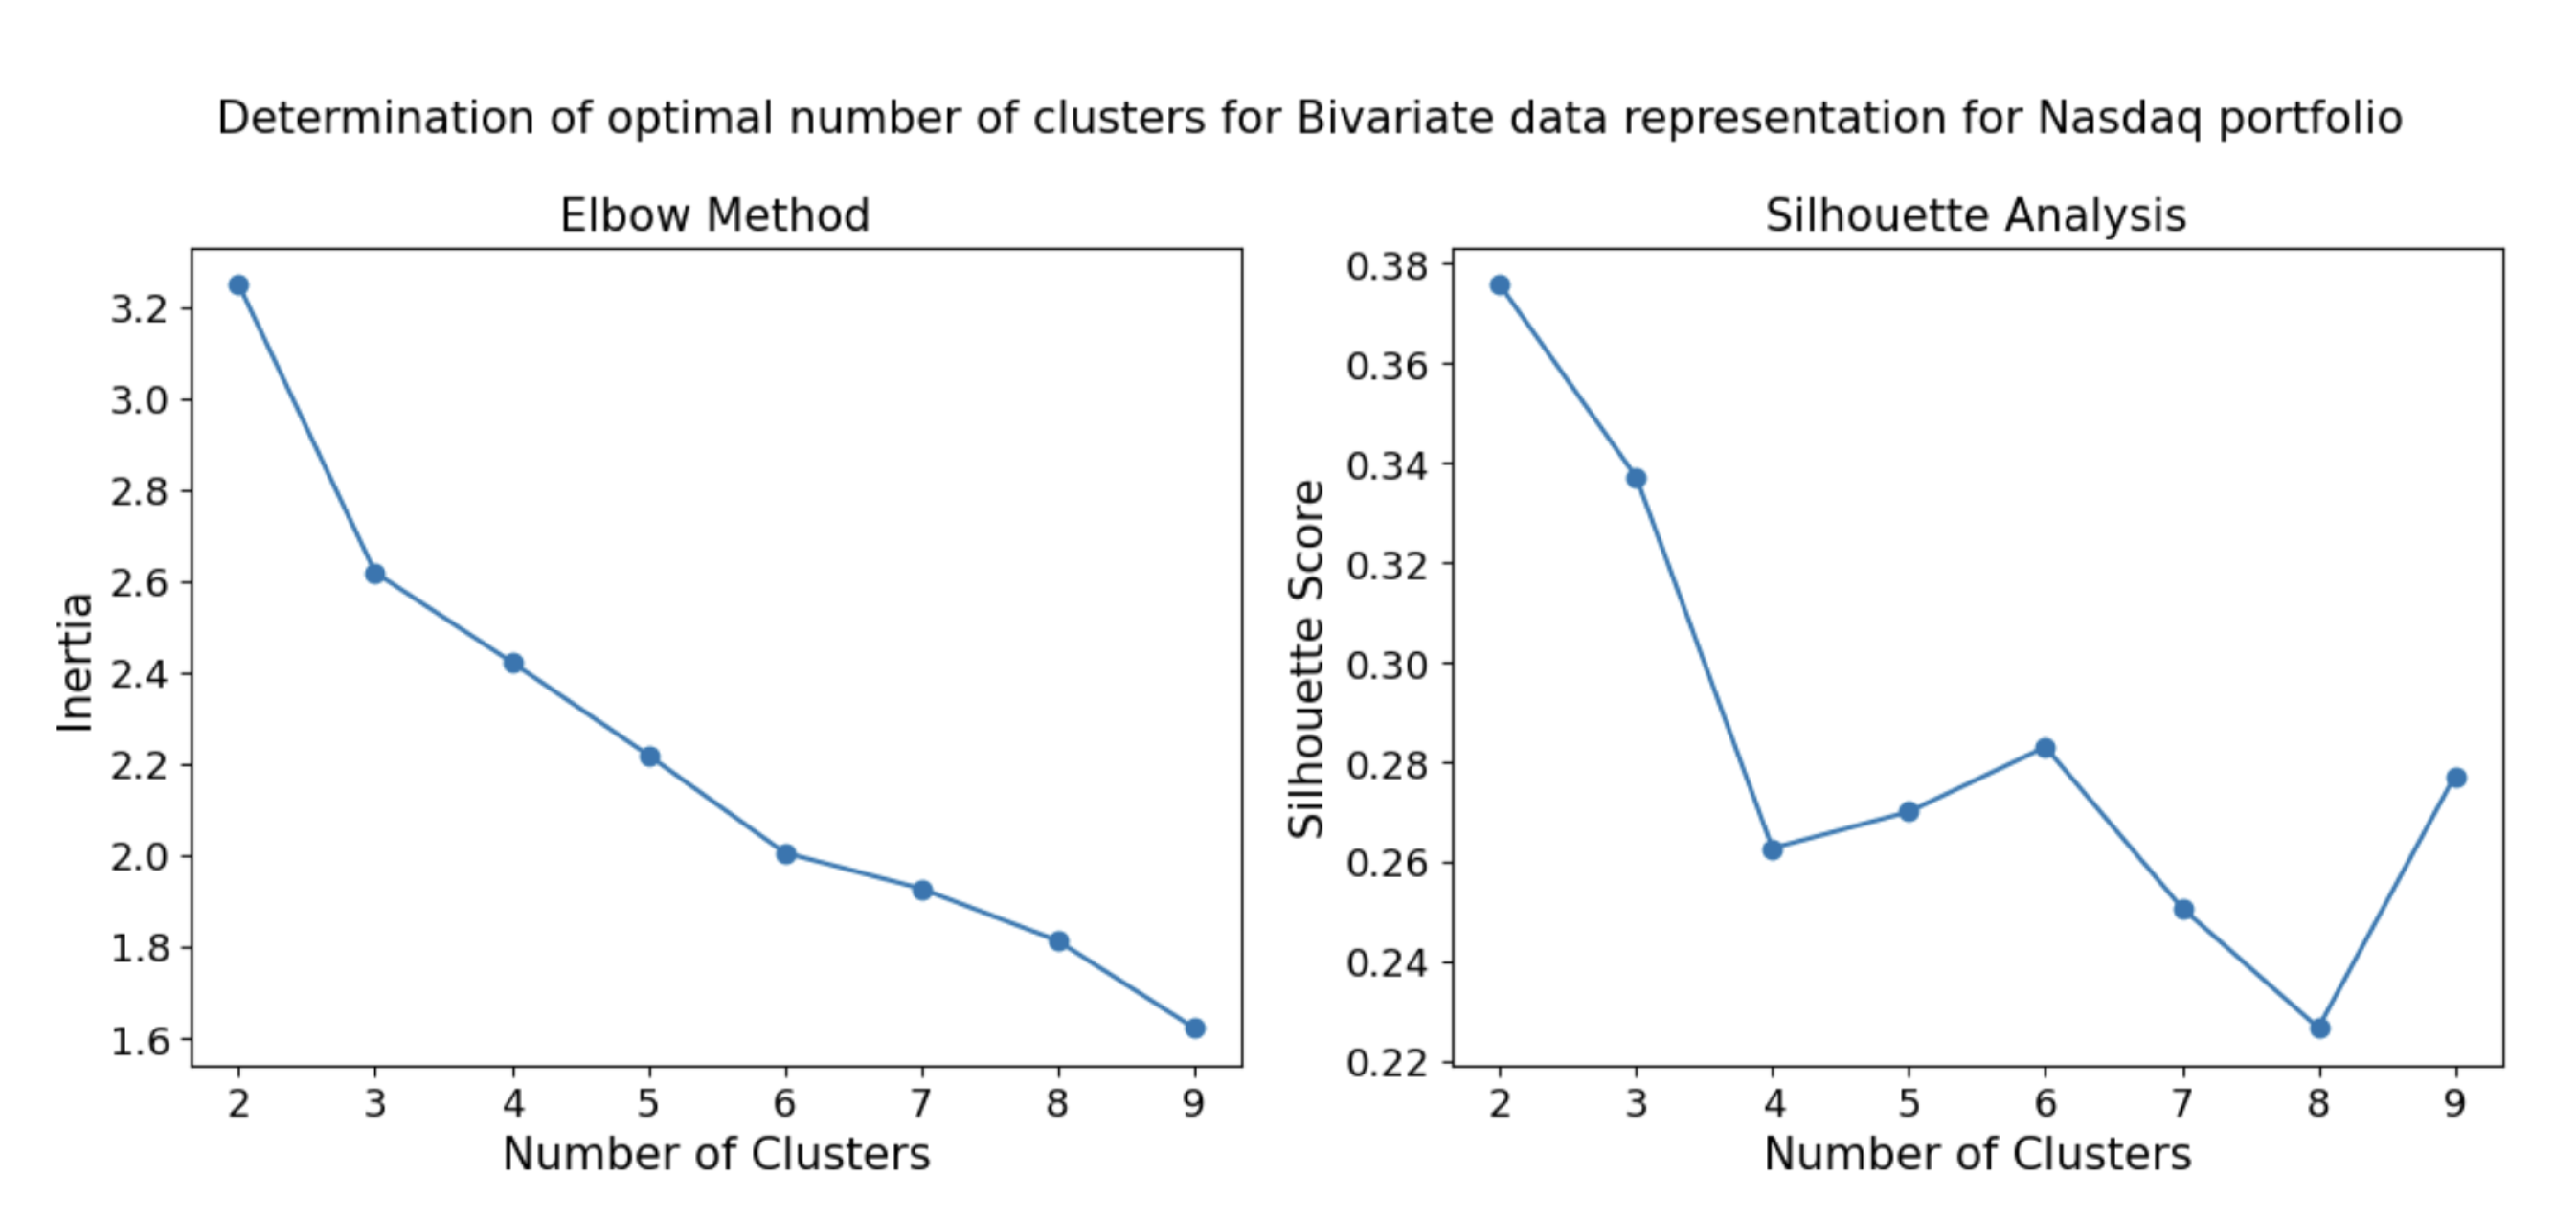
Figure 8.
Min-max-mean plot of risk-adjusted return metrics for Cryptocurrency portfolios using all the 4 strategies proposed for Clustering + Asset Selection. The left and right subplots illustrate the minimum, maximum and mean values of Sharpe and Adjusted Sharpe ratios respectively while considering portfolios at all rebalancing periods.
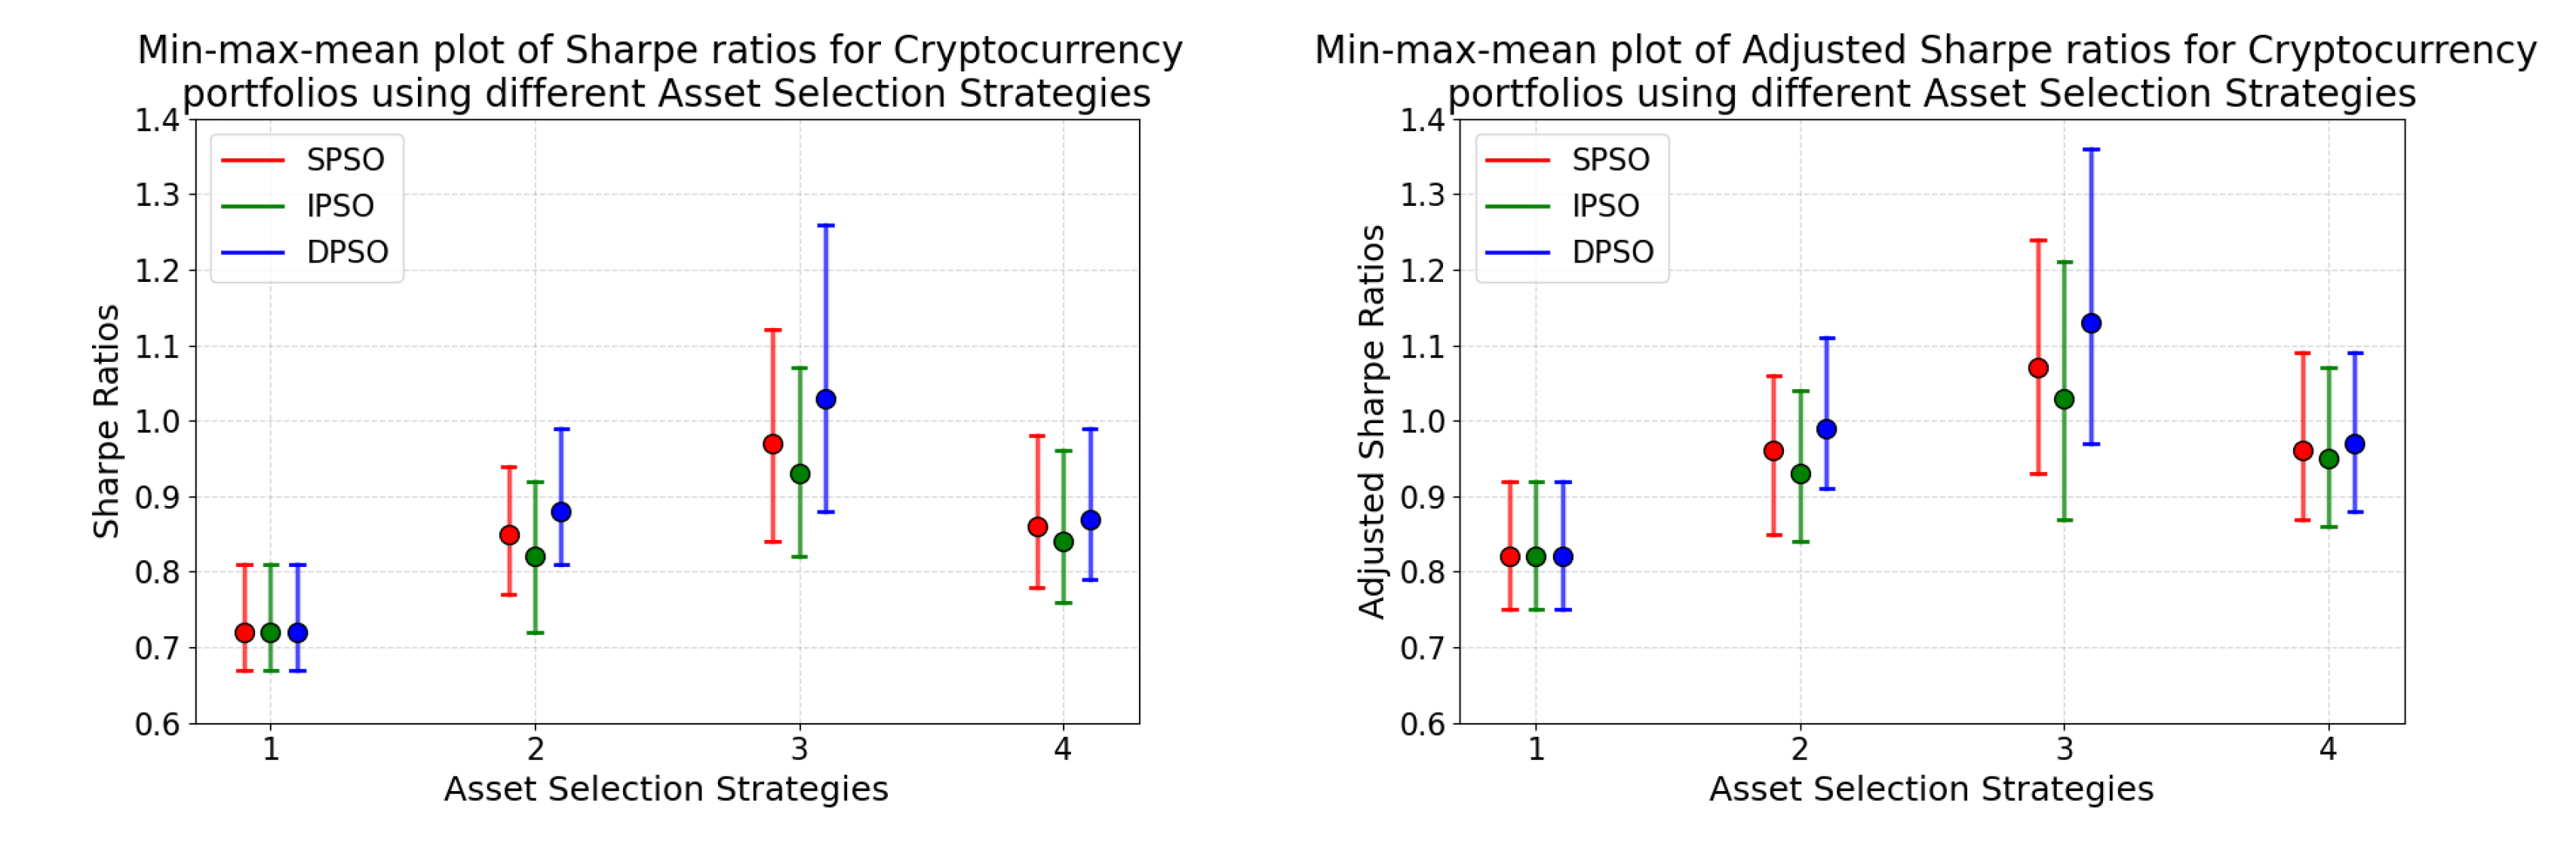
Figure 9.
Min-max-mean plot of risk-adjusted return metrics for Nasdaq100 portfolios using all the 4 strategies proposed for Clustering + Asset Selection. The left and right subplots illustrate the minimum, maximum and mean values of Sharpe and Adjusted Sharpe ratios respectively while considering portfolios at all rebalancing periods.
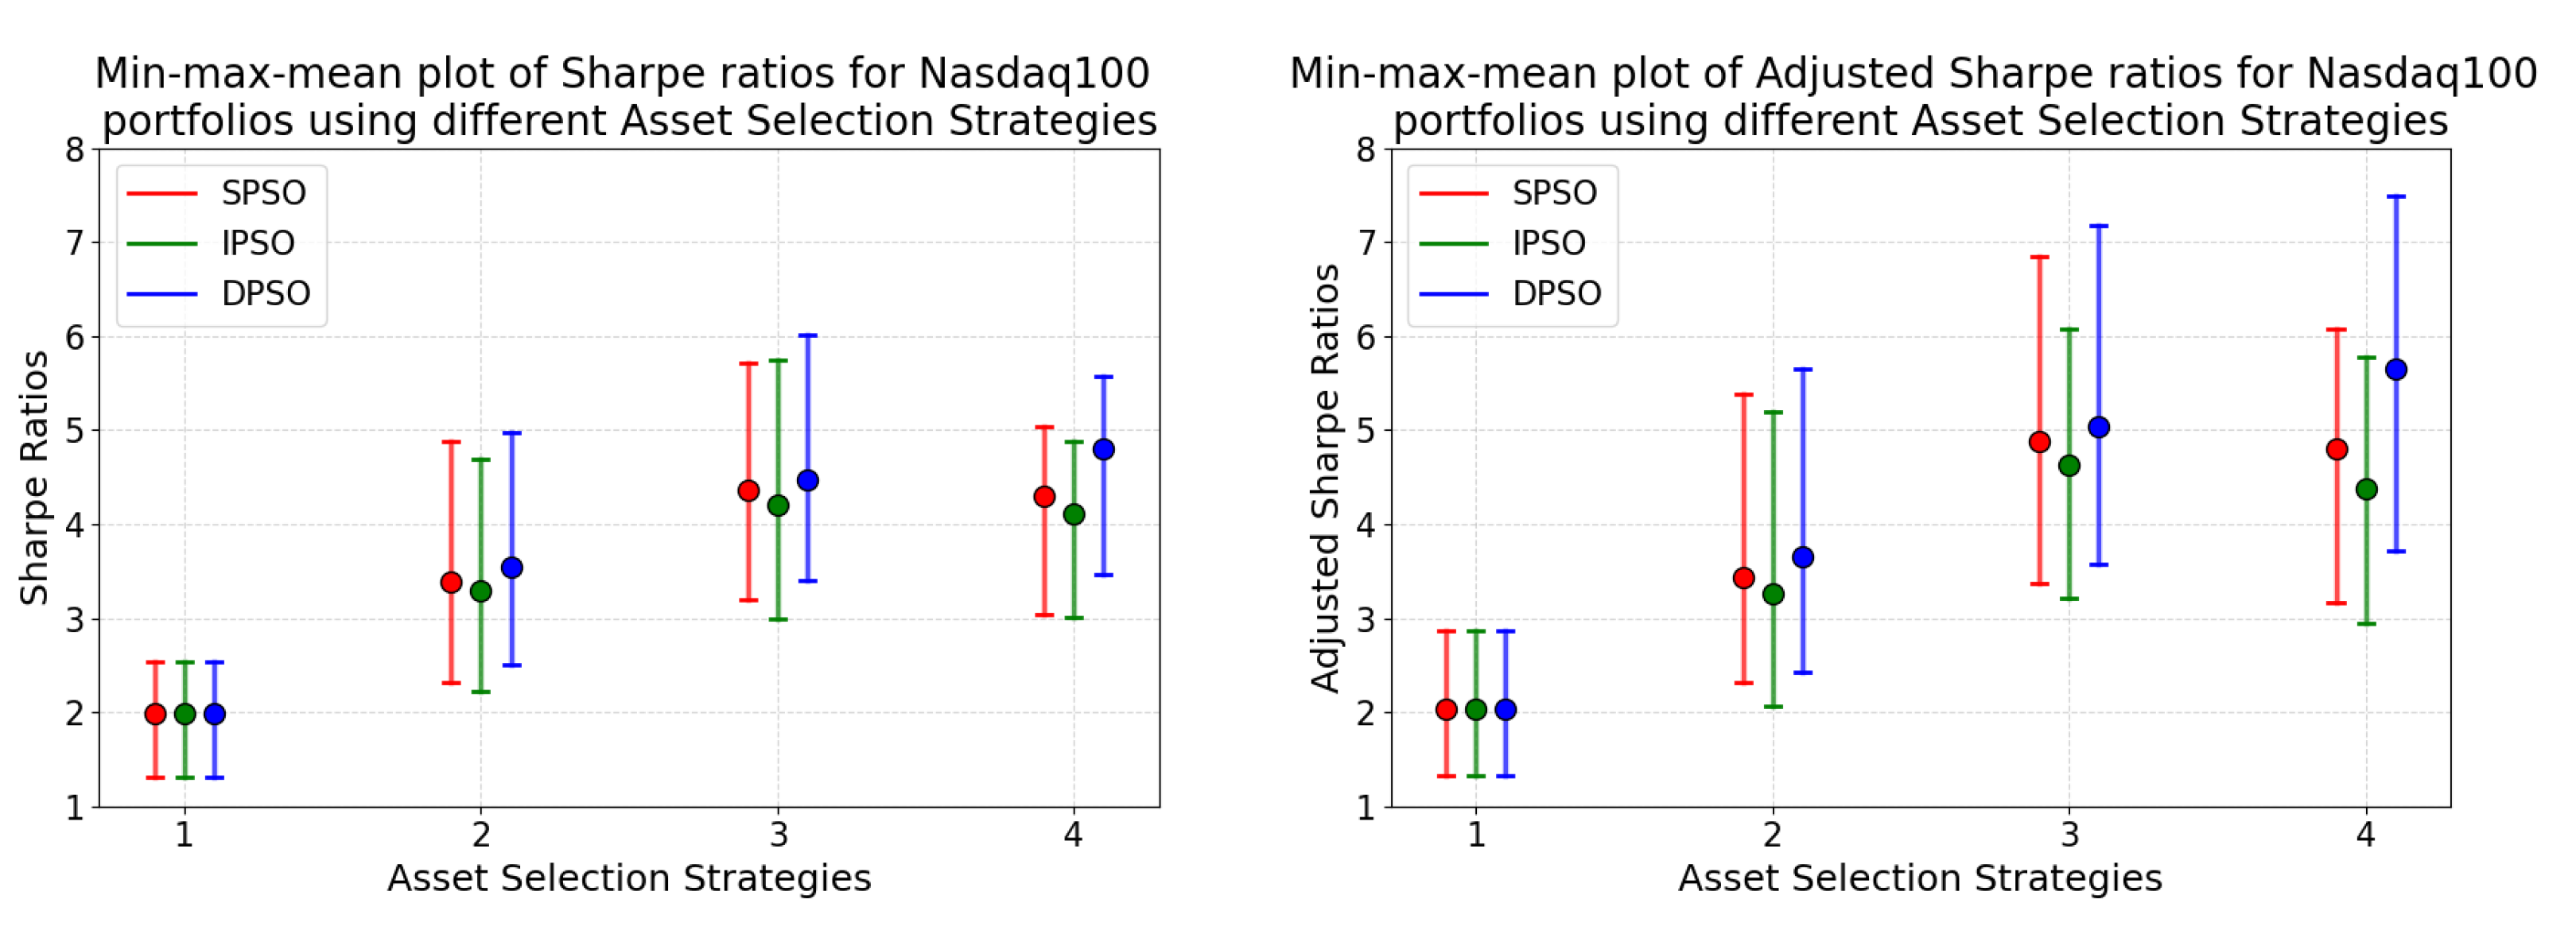
Figure 10.
Comparison of PSO algorithms for Cryptocurrency based portfolios obtained using asset selection method 3 optimised using Sharpe and Adjusted Sharpe ratios.
Figure 10.
Comparison of PSO algorithms for Cryptocurrency based portfolios obtained using asset selection method 3 optimised using Sharpe and Adjusted Sharpe ratios.
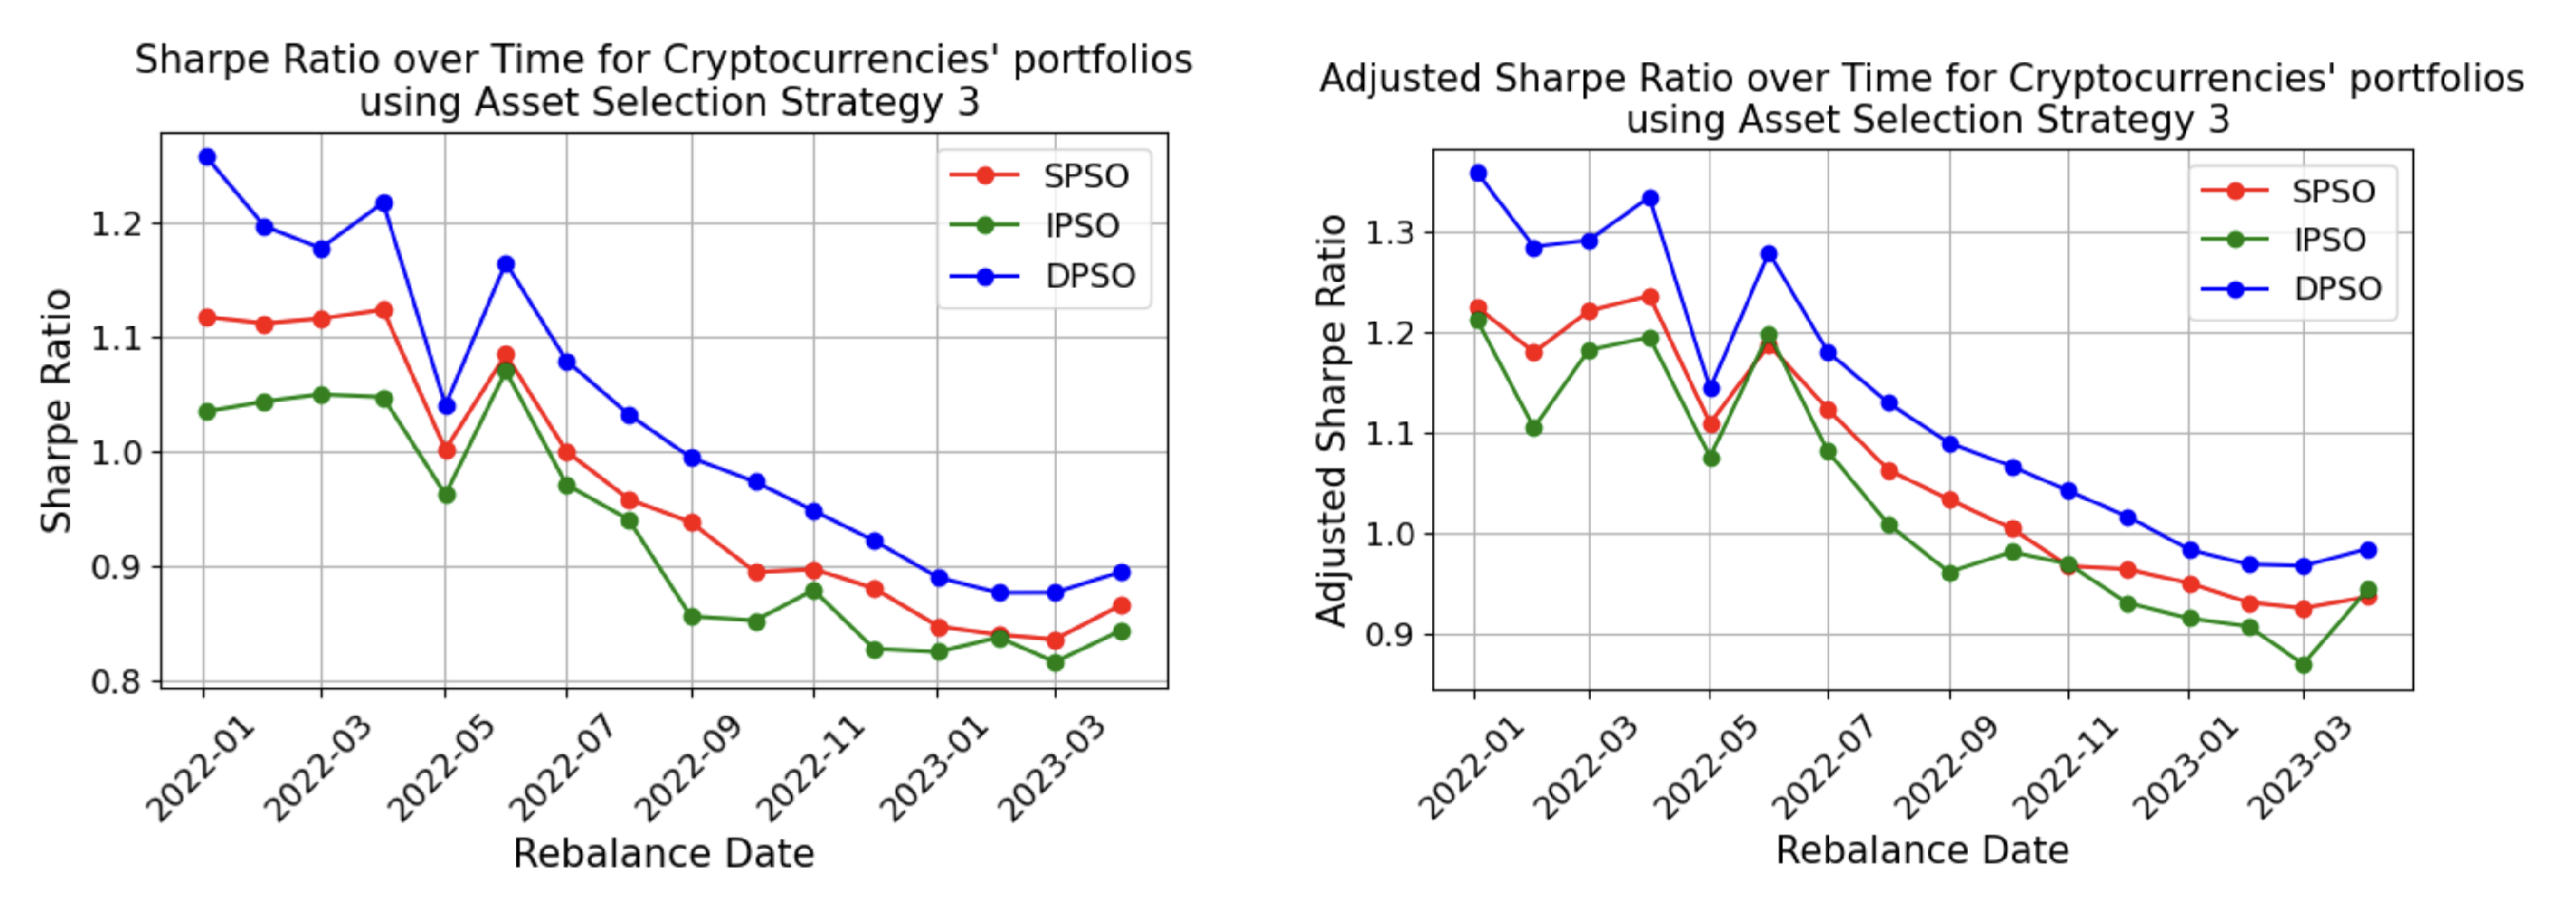
Figure 11.
Comparison of PSO algorithms for Nasdaq100 based portfolios obtained using asset selection method 4 optimised using Sharpe and Adjusted Sharpe ratios.
Figure 11.
Comparison of PSO algorithms for Nasdaq100 based portfolios obtained using asset selection method 4 optimised using Sharpe and Adjusted Sharpe ratios.
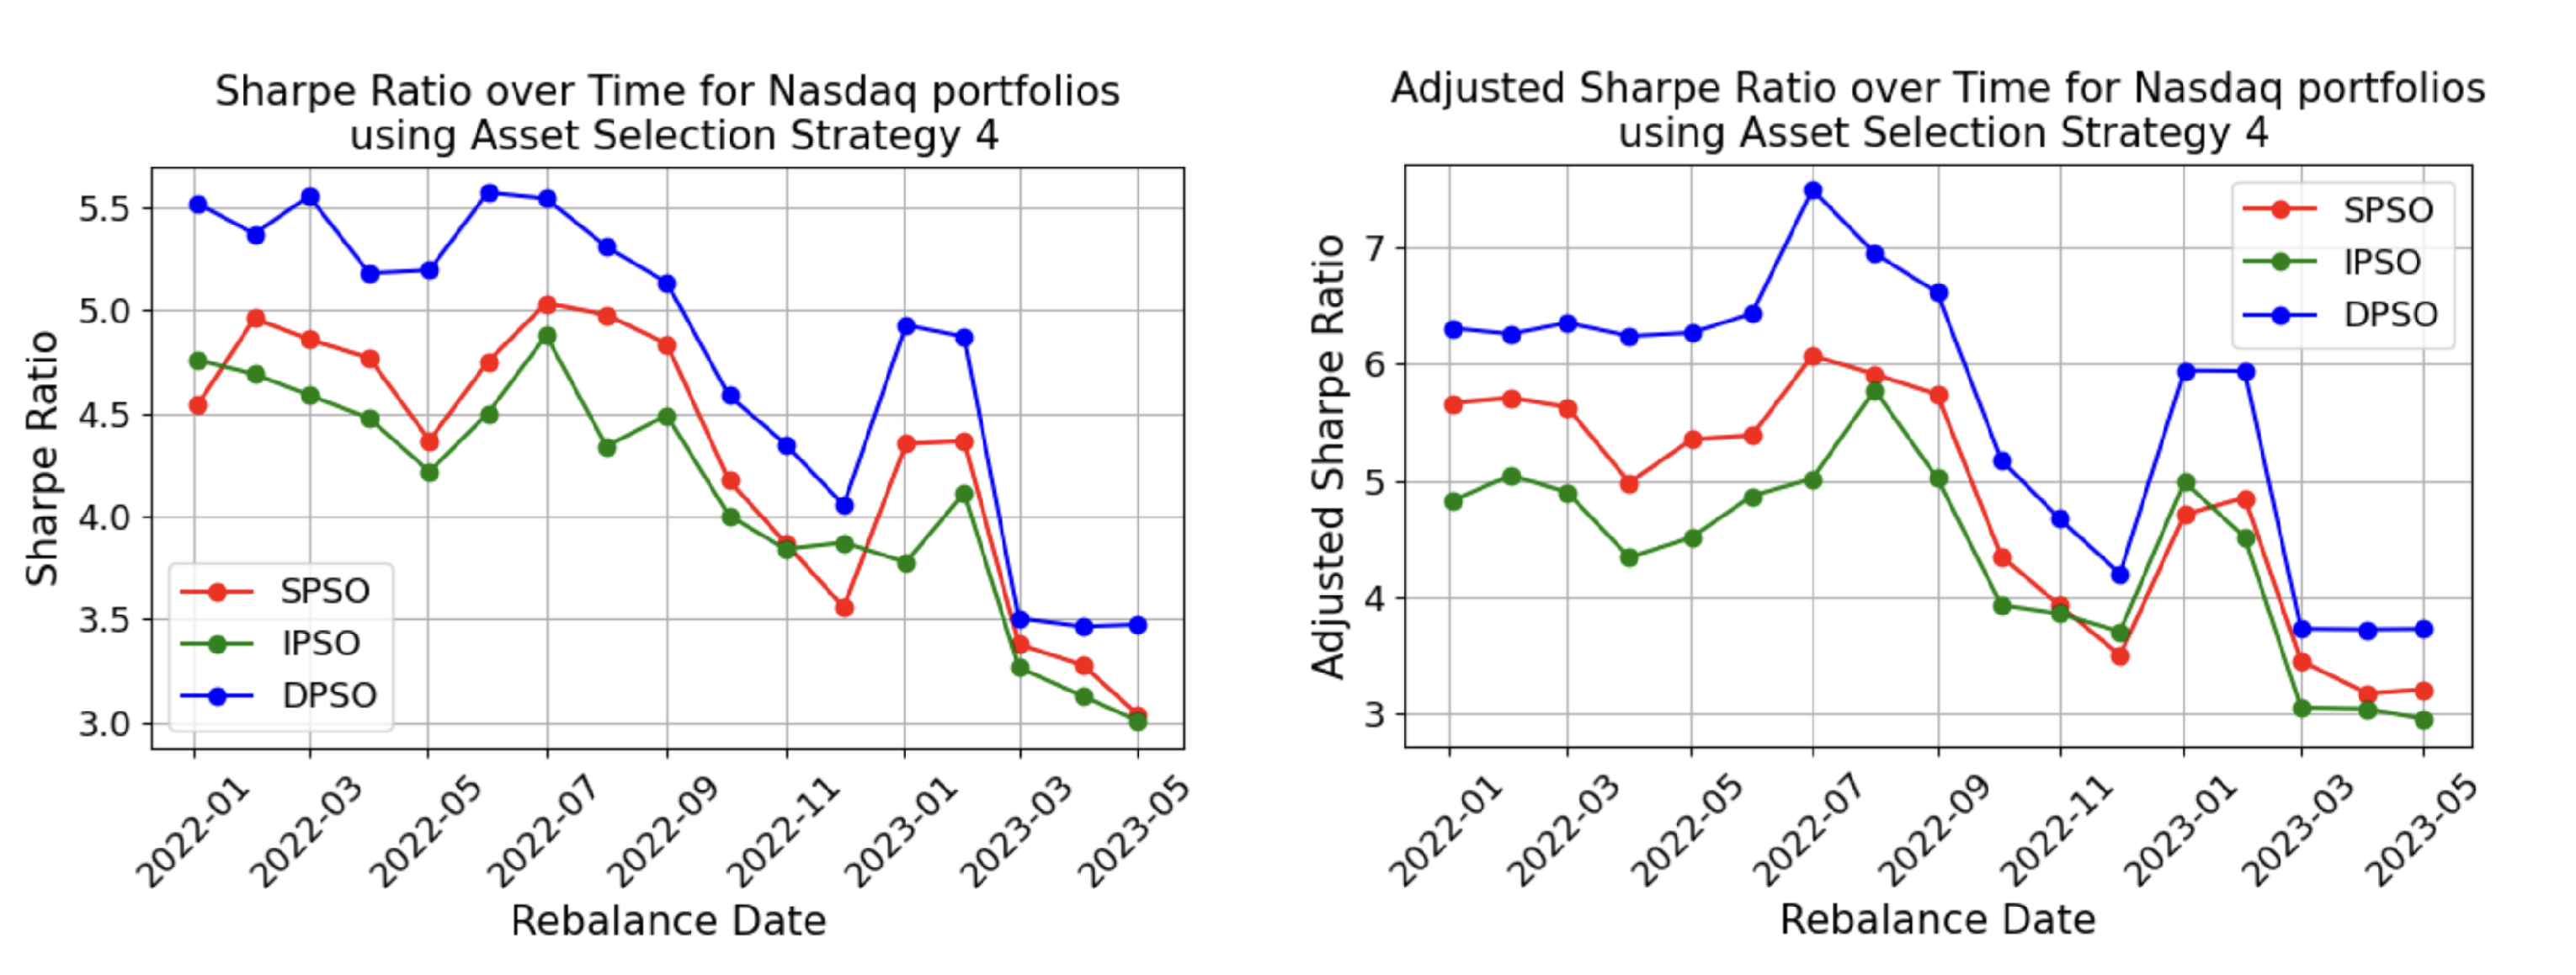
Figure 12.
Comparison of different asset selection strategies for Cryptocurrency based portfolios obtained from DPSO algorithm using the Sharpe ratio.
Figure 12.
Comparison of different asset selection strategies for Cryptocurrency based portfolios obtained from DPSO algorithm using the Sharpe ratio.
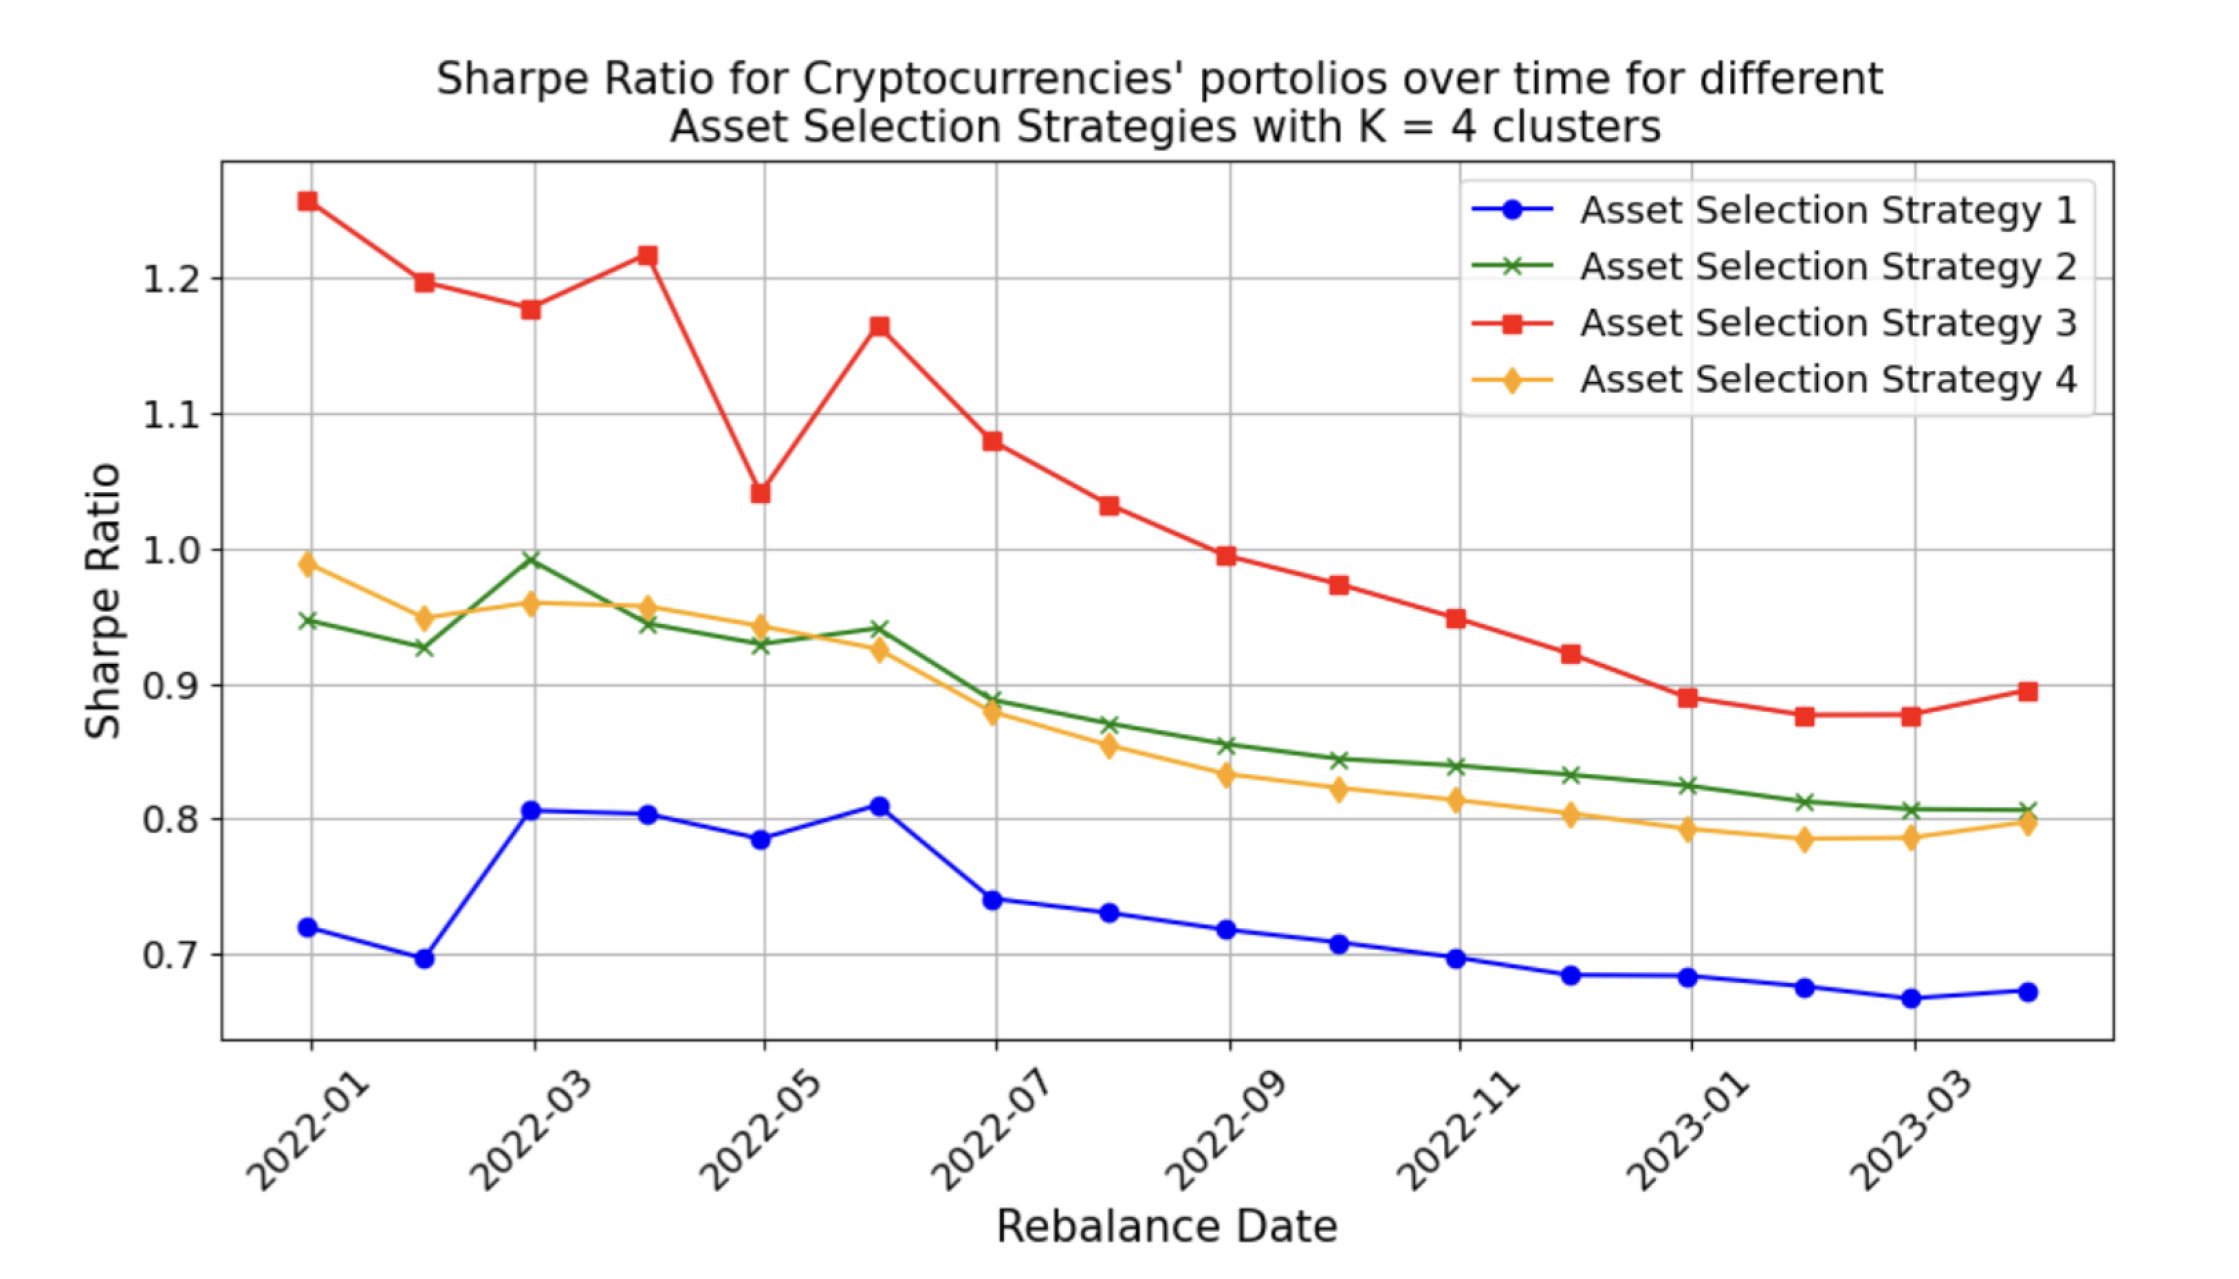
Figure 13.
Comparison of different asset selection strategies for Cryptocurrency based portfolios obtained from DPSO algorithm using the Adjusted Sharpe ratio.
Figure 13.
Comparison of different asset selection strategies for Cryptocurrency based portfolios obtained from DPSO algorithm using the Adjusted Sharpe ratio.
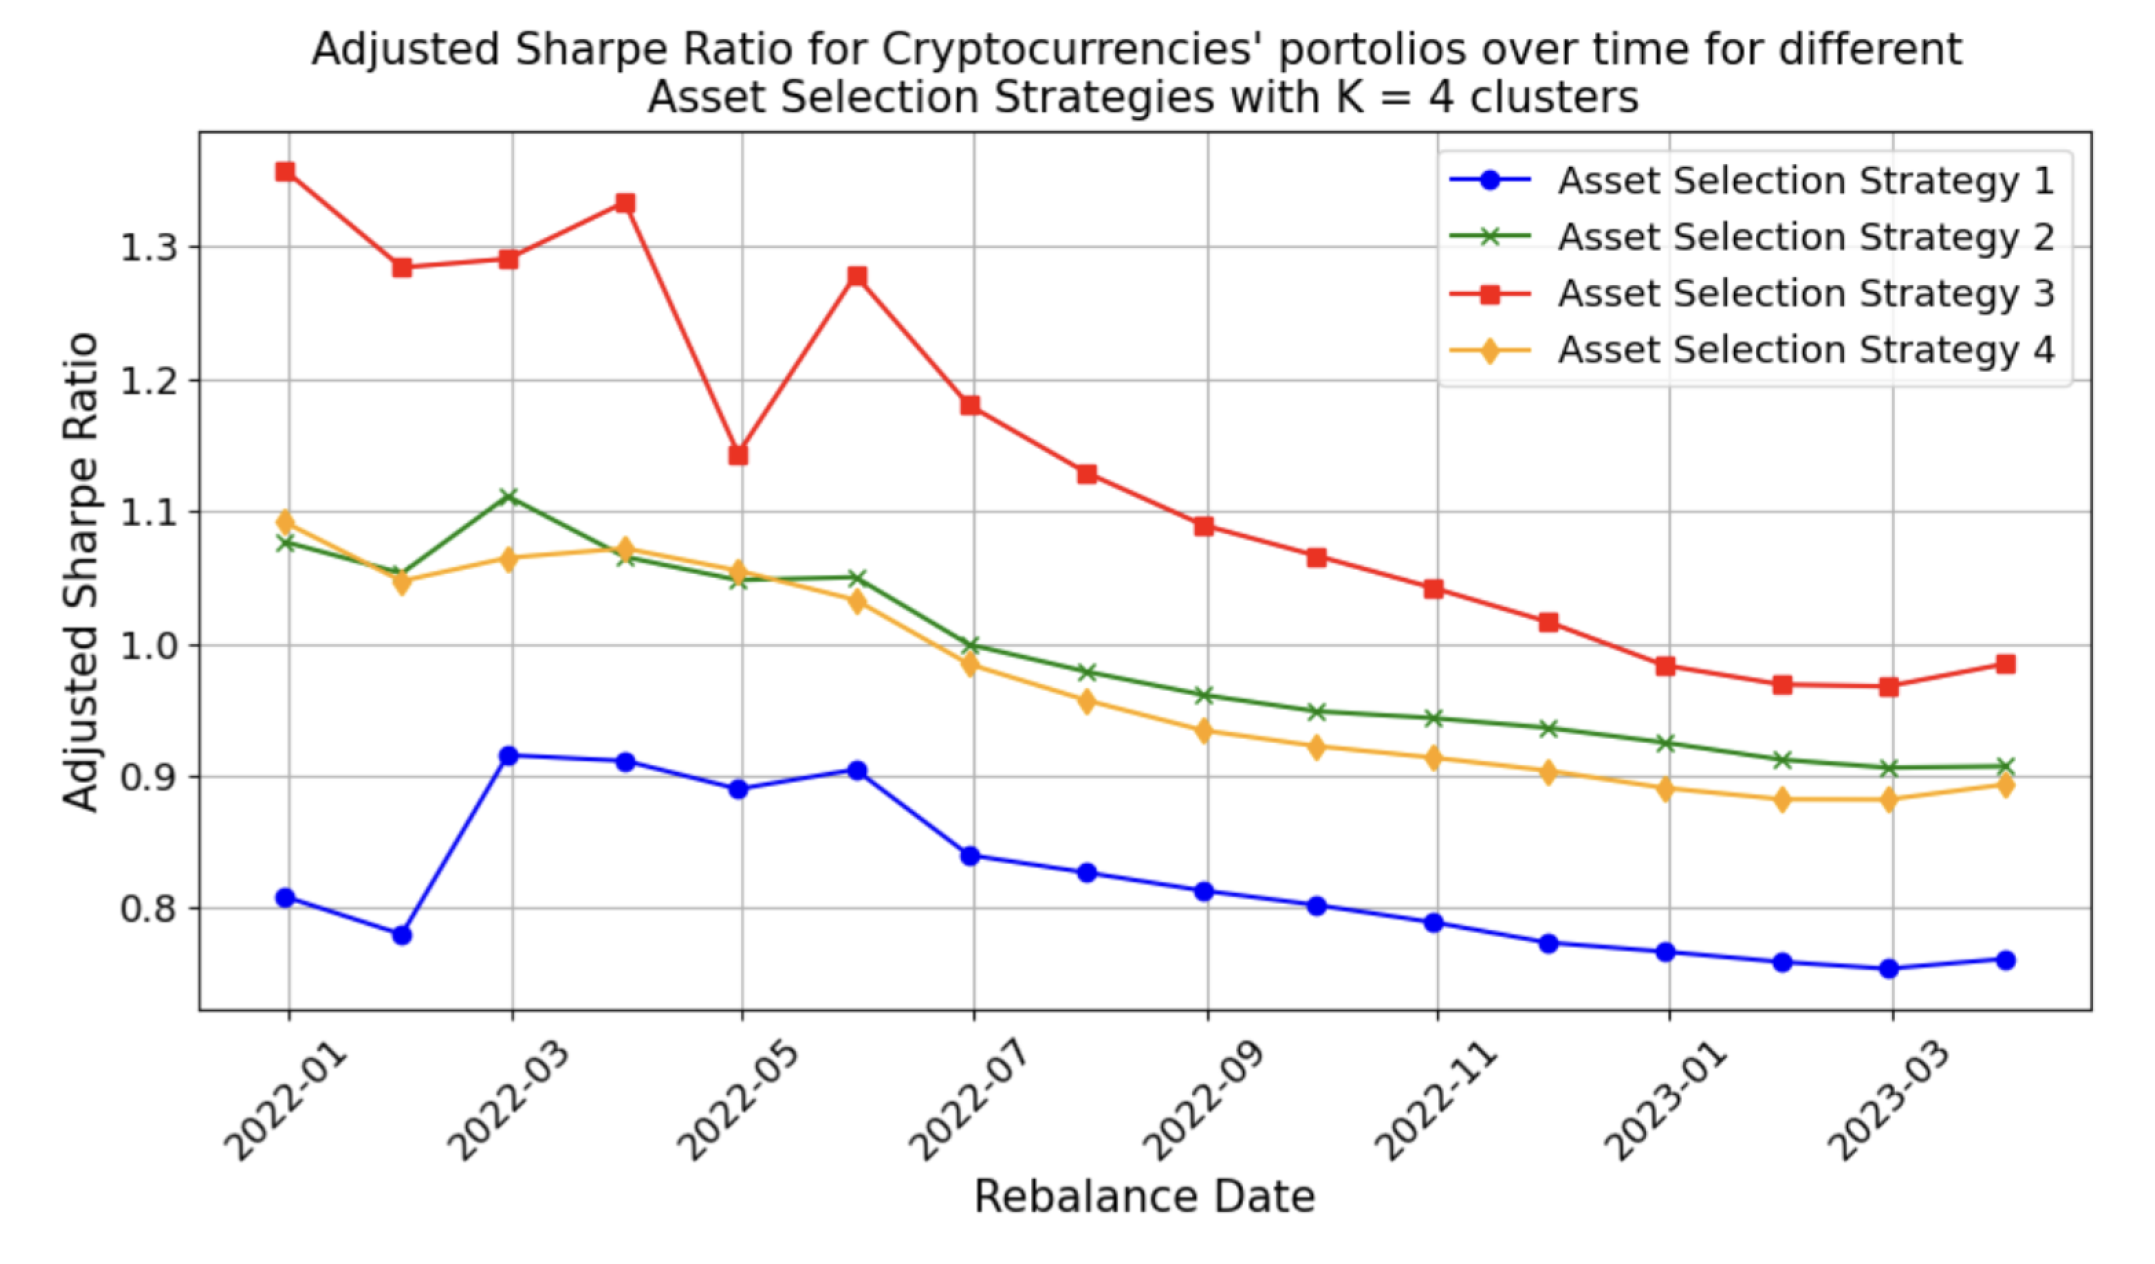
Figure 14.
Comparison of different asset selection strategies for Nasdaq100 based portfolios obtained from DPSO algorithm using the Sharpe ratio.
Figure 14.
Comparison of different asset selection strategies for Nasdaq100 based portfolios obtained from DPSO algorithm using the Sharpe ratio.
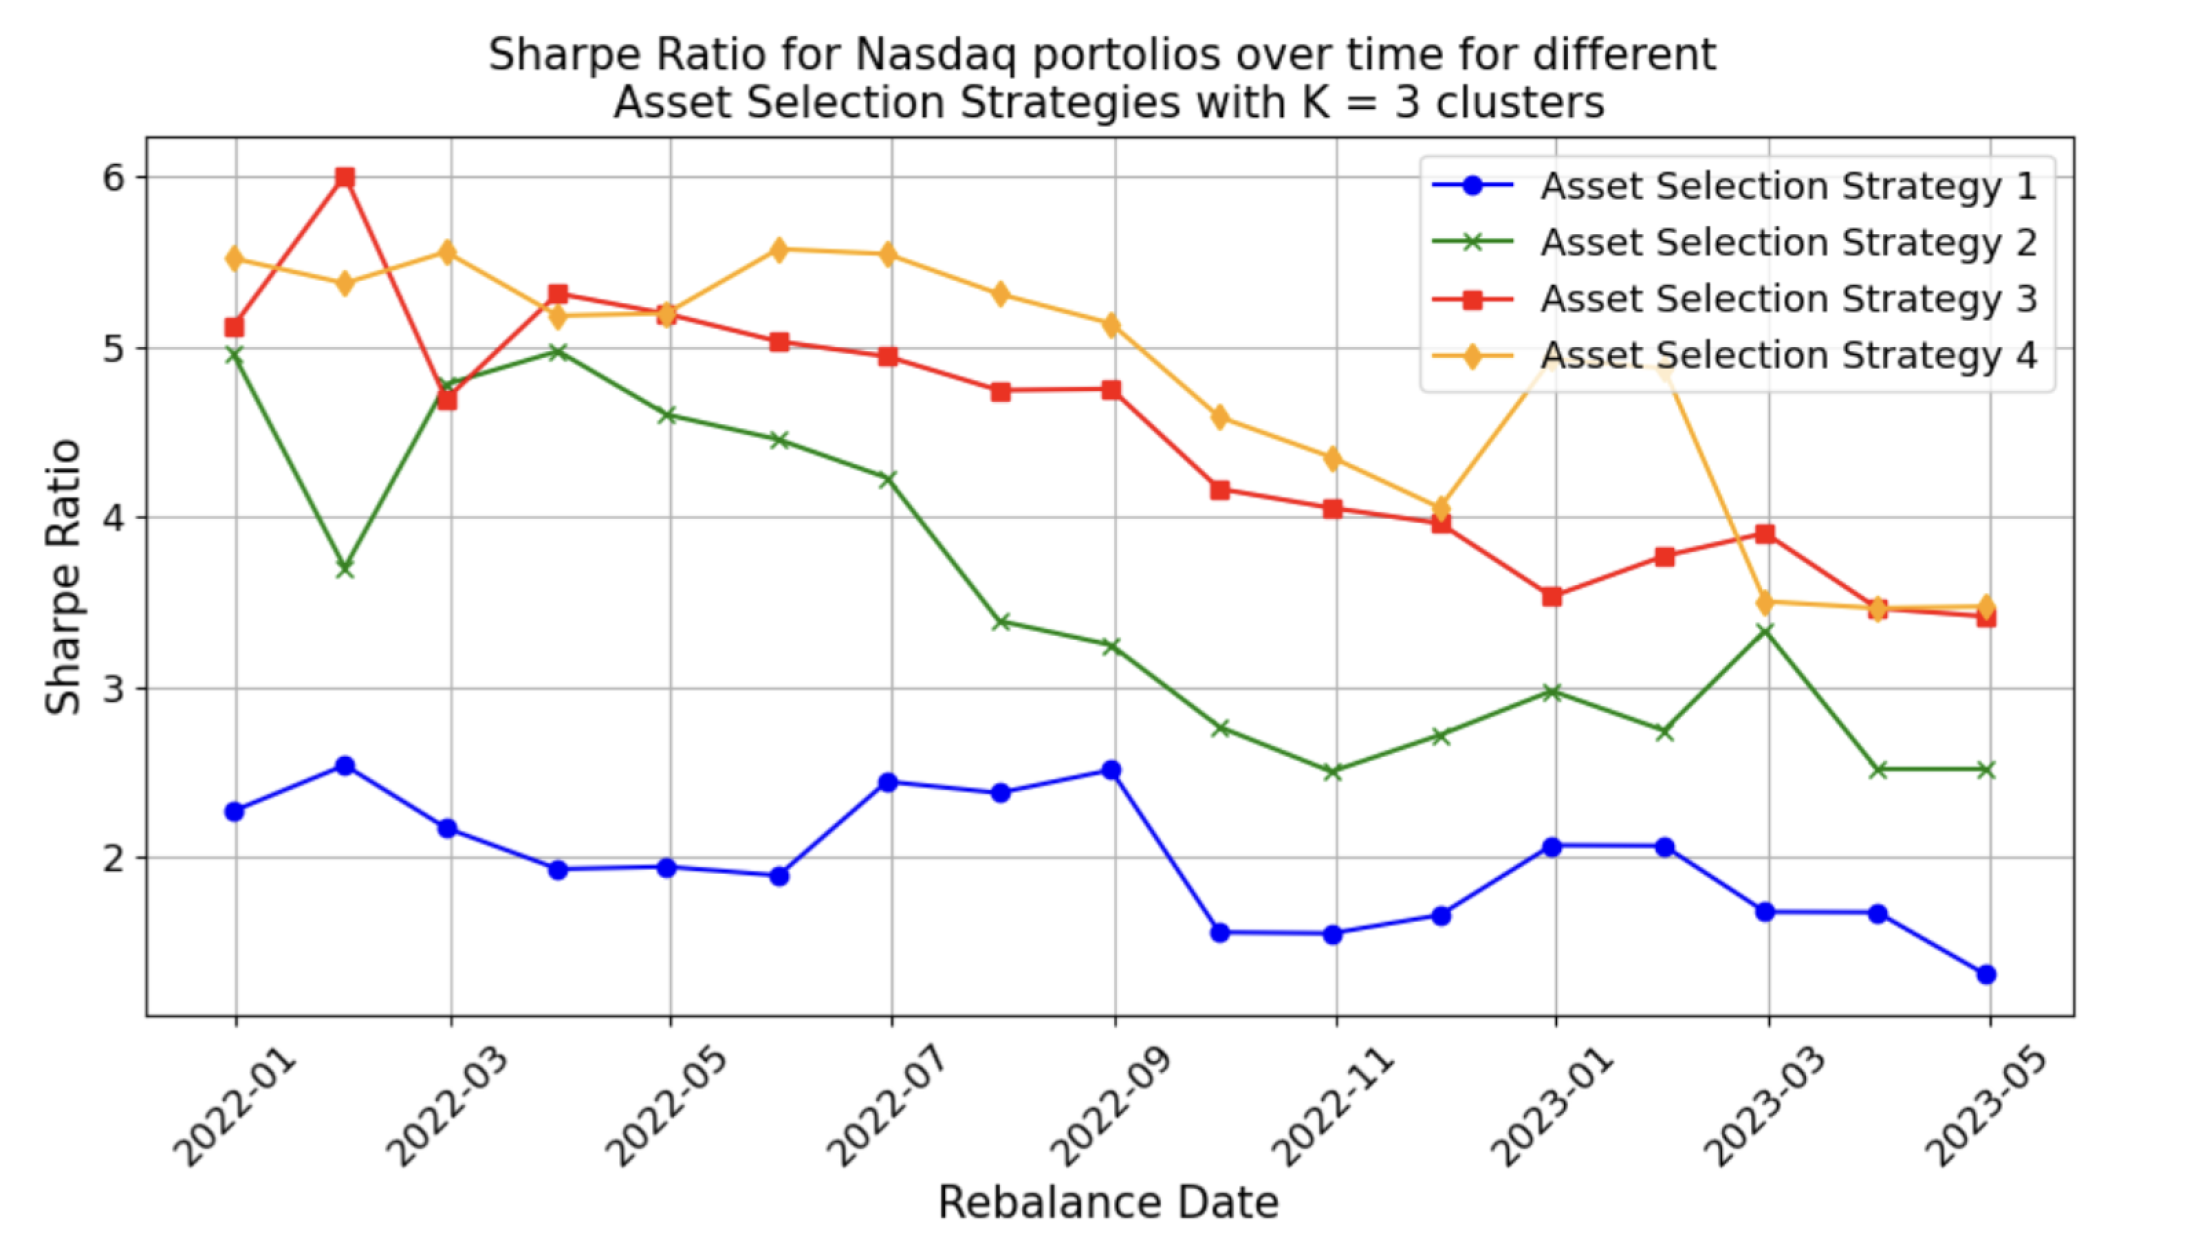
Figure 15.
Comparison of different asset selection strategies for Nasdaq100 based portfolios obtained from DPSO algorithm using the Adjusted Sharpe ratio.
Figure 15.
Comparison of different asset selection strategies for Nasdaq100 based portfolios obtained from DPSO algorithm using the Adjusted Sharpe ratio.
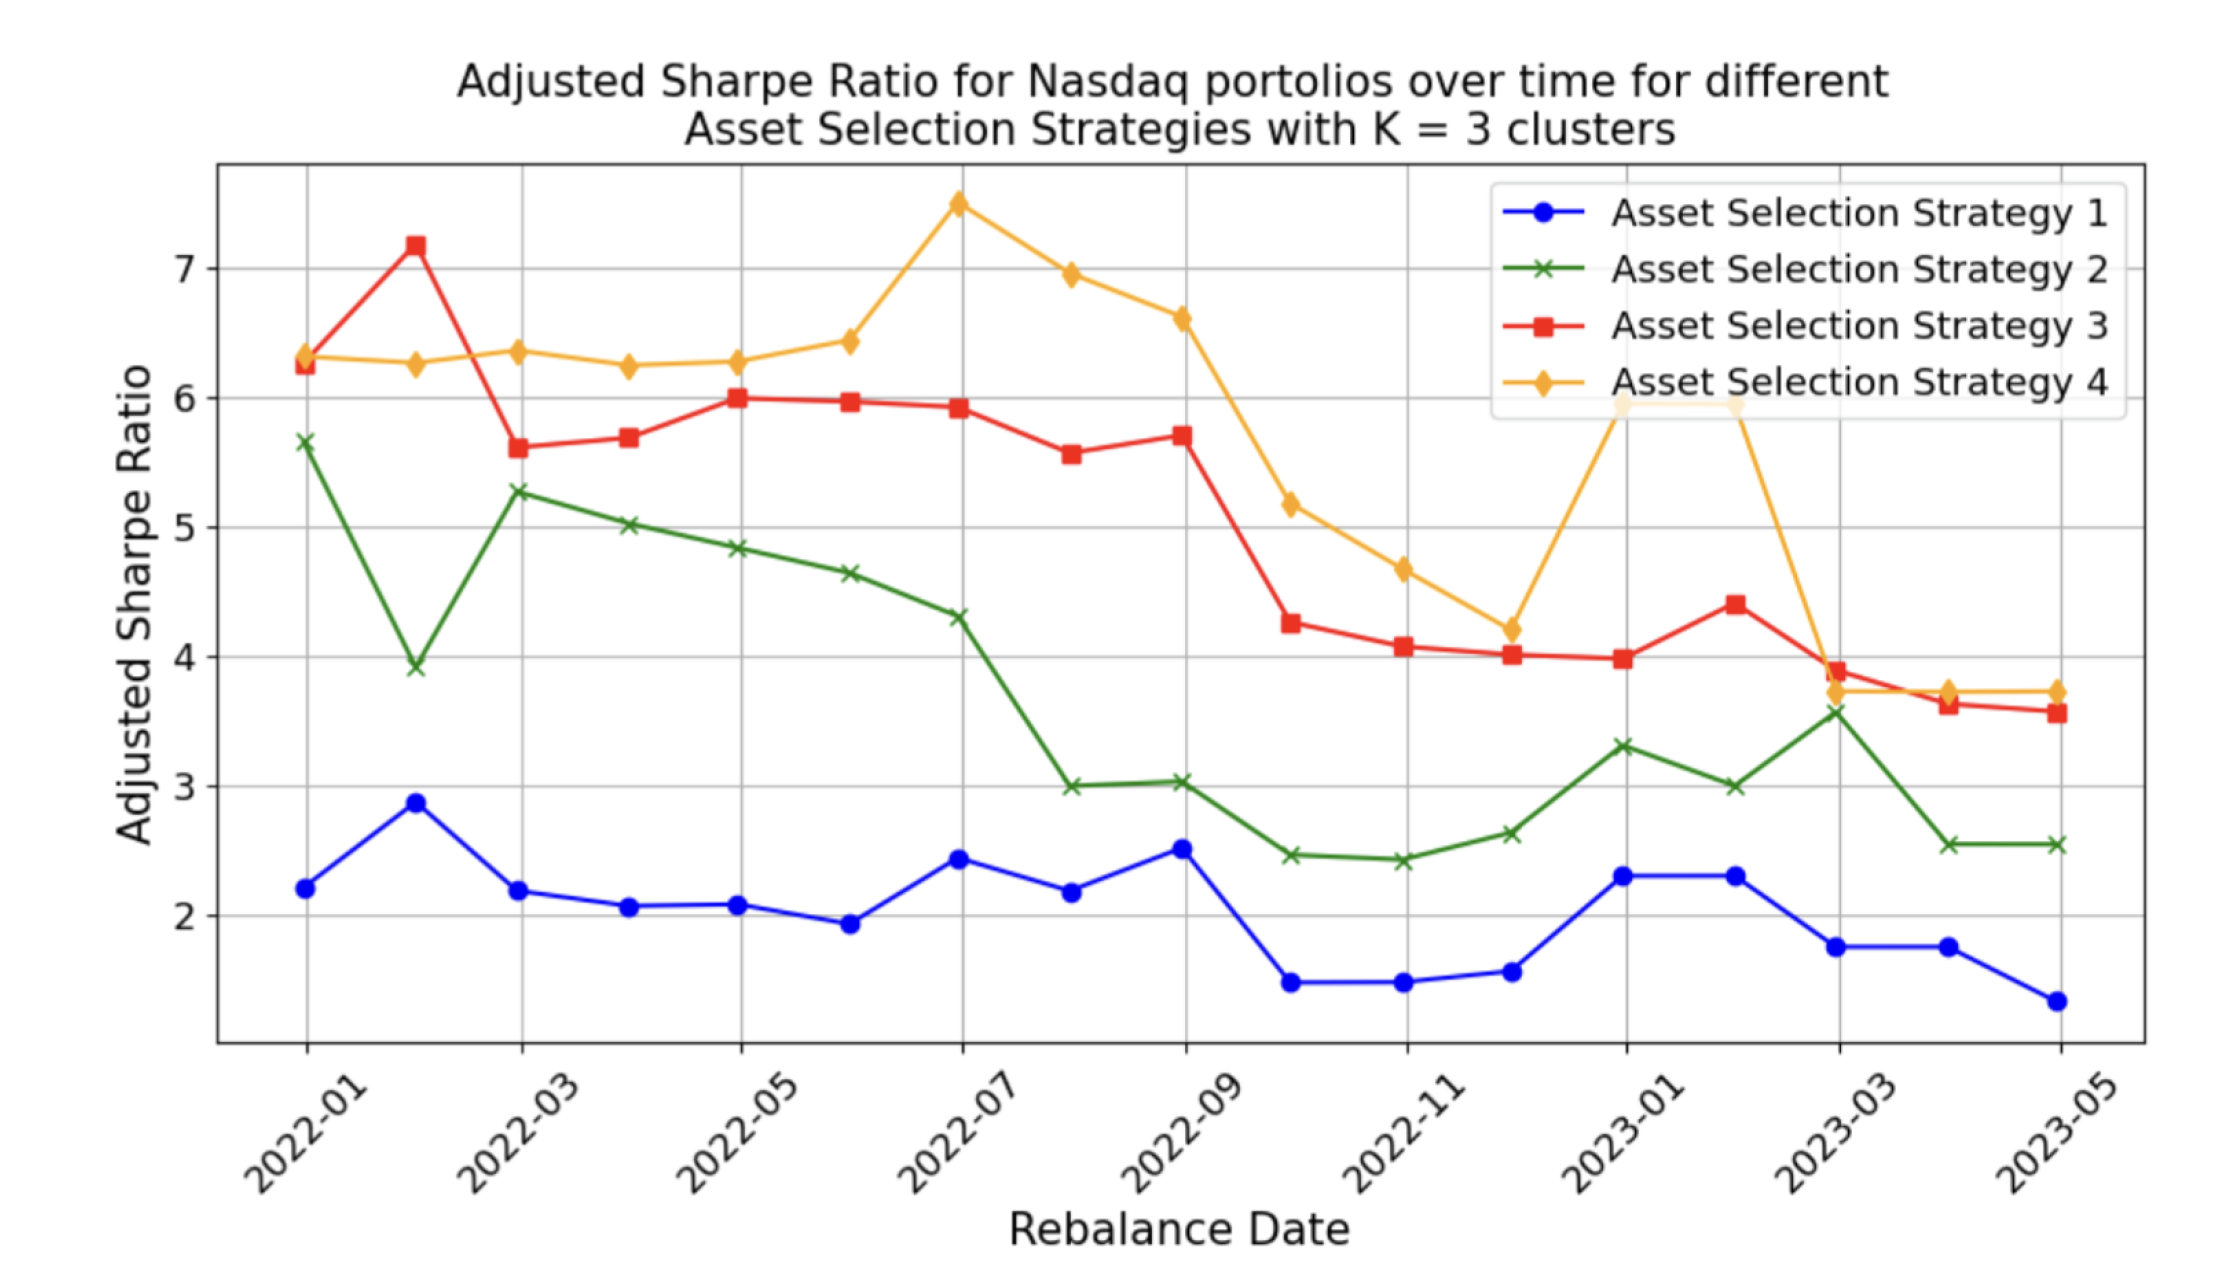
Table 1.
Comparison of Sharpe ratio values for stocks only portfolios obtained by PSO techniques and smoothing methods in this research work against the benchmark paper [21].
Table 1.
Comparison of Sharpe ratio values for stocks only portfolios obtained by PSO techniques and smoothing methods in this research work against the benchmark paper [21].
| Stocks Only | |||
|---|---|---|---|
| SPSO | IPSO | DPSO | Paper |
| 4.8832 | 4.8802 | 4.8843 | 1.27 |
Table 2.
Comparison of Sharpe and Sortino ratios for different asset selection strategies with the benchmark paper for 2 kinds of S&P 500 based portfolios, where number of assets (n) = 10 or 25. Values below the diagonal correspond to Sharpe ratios and the values above the diagonal correspond to Sortino Ratios. PSO algorithm used here is DPSO.
| SharpeSortino | Asset Select 1 | Asset Select 2 | Asset Select 3 | Asset Select 4 | Paper |
|---|---|---|---|---|---|
| n = 10 | 12.513.31 | 12.443.22 | 13.123.47 | 12.363.24 | 1.8371.81 |
| n = 25 | 12.843.50 | 13.033.44 | 14.833.79 | 11.733.10 | 2.7172.398 |
Disclaimer/Publisher’s Note: The statements, opinions and data contained in all publications are solely those of the individual author(s) and contributor(s) and not of MDPI and/or the editor(s). MDPI and/or the editor(s) disclaim responsibility for any injury to people or property resulting from any ideas, methods, instructions or products referred to in the content. |
© 2025 by the authors. Licensee MDPI, Basel, Switzerland. This article is an open access article distributed under the terms and conditions of the Creative Commons Attribution (CC BY) license (http://creativecommons.org/licenses/by/4.0/).
Copyright: This open access article is published under a Creative Commons CC BY 4.0 license, which permit the free download, distribution, and reuse, provided that the author and preprint are cited in any reuse.


