Submitted:
13 March 2025
Posted:
14 March 2025
You are already at the latest version
Abstract
This study introduces the Adaptive Risk-Optimized Portfolio (ARPO) model, a dy-namic framework designed to overcome limitations of static portfolio optimization. Integrating dynamic risk assessment, performance forecasting, optimization algo-rithms, and real-time adjustments, the ARPO model offers a robust solution for navi-gating complex financial markets. Analyzing FAANG stocks, bonds, and gold from January 2020 to January 2023, the ARPO model outperformed traditional approaches like Risk-Parity and Minimum Variance portfolios, achieving higher Sharpe ratios and improved risk-adjusted returns. The findings underscore the importance of real-time optimization in enhancing diversification and risk management, offering valuable in-sights for portfolio managers and financial institutions.
Keywords:
portfolio optimization
; dynamic risk assessment
; ARPO model
; real‐time adjustments
; sharpe ratio
; risk management
; financial markets
1. Introduction
Portfolio optimization is a cornerstone of financial decision-making. Traditional models like the Mean-Variance Optimization (MVO) often lack adaptability to dynamic market conditions. This limitation arises from MVO’s reliance on static assumptions, such as fixed risk-return profiles and linear correlations, which fail to account for real-time market shifts or nonlinear relationships among assets.
The limitations of static models in financial decision-making, particularly in the context of volatility and diversification, have been widely documented in recent research. Static models often fail to capture the dynamic nature of financial markets, resulting in suboptimal investment decisions and inaccurate risk assessments. For instance, Saadah (2018) indicates that significant volatility spillover in stock and commodity futures markets suggests that the advantages of portfolio diversification can diminish over time due to time-varying characteristics of market conditions. This finding underscores the necessity for models that can adapt to changing market dynamics rather than relying on fixed assumptions.
Moreover, the research by Patel (2022) emphasizes the importance of financial market integration and its implications for portfolio diversification. It suggests that investors are increasingly aware of the need for adaptive strategies that can respond to the evolving landscape of financial markets, thereby improving the risk-return tradeoff. The integration of diverse markets can enhance portfolio performance, but static models may overlook the complexities involved in these interdependencies, leading to potential miscalculations in risk assessments.
Dynamic approaches, such as those utilizing Model Predictive Control (MPC), have been proposed to address these challenges. Fitria et al. (2016) demonstrate that MPC can effectively optimize portfolio management by incorporating real-time data and transaction costs, thus providing a more responsive strategy to market fluctuations. This aligns with the growing recognition that real-time adaptability is crucial for effective investment management, particularly in volatile environments.
Additionally, the cryptocurrency market, characterized by its high volatility and rapid changes, further illustrates the limitations of static models. Sahu et al. (2024) comparative study highlights the necessity for understanding interdependencies within cryptocurrency markets to make informed investment decisions, emphasizing the inadequacy of traditional static models in capturing the complexities of these emerging markets.
Investors face significant challenges with static portfolio optimization models, which fail to adapt to rapid market fluctuations and the interconnected nature of global industries. These limitations lead to suboptimal diversification and risk management strategies, making it essential to adopt an adaptive framework that incorporates real-time market changes, evolving industry relationships, and a diverse range of asset classes.
This study introduces the ARPO model, which enhances portfolio performance through adaptive risk management by dynamically adjusting to market volatility and investor preferences. It demonstrates the model’s utility through a comparative analysis of FAANG portfolios and multi-asset diversification strategies, providing a robust framework for effective portfolio optimization.
2. Literature Review
Portfolio optimization is a critical aspect of financial decision-making that involves selecting the best combination of investment assets to achieve specific investment goals while minimizing risk. The primary aim is to maximize returns for a given level of risk or to minimize risk for a given level of expected return. With the complexity of global financial markets and the rising significance of sustainability, the development and implementation of robust portfolio optimization models have become increasingly pertinent, especially in aligning investment strategies with the emergence of environmental, social, and governance (ESG) factors (Sbaiz, 2023).
Portfolio optimization models can be broadly categorized into static and dynamic models. Static portfolio optimization models assume that the parameters, such as asset returns, risks, and correlations, remain constant over the investment horizon. These models do not account for the evolving nature of markets. In contrast, dynamic portfolio optimization models incorporate changing market conditions and allow for adjustments to be made in real-time, enhancing their relevance to current financial landscapes (Gong, 2022).
2.1. Traditional Portfolio Optimization Models
Mean-Variance Optimization (MVO), developed by Harry Markowitz in the 1950s, serves as a fundamental model in portfolio optimization. MVO seeks to identify the optimal asset allocation by analyzing the trade-off between the expected returns and the associated risks of various portfolios. The technique uses historical data to estimate expected returns, variances, and covariances of asset returns, producing the efficient frontier—a curve that represents the most efficient portfolios available at different risk levels (Lai et al., 2011).
Despite its pioneering status, MVO has several limitations that restrict its applicability in contemporary financial environments:
Reliance on static assumptions: MVO heavily depends on assumptions of fixed correlations and static risk-return profiles, which can lead to inaccurate predictions under changing market conditions.
Inability to adapt to real-time market changes: The model struggles in volatile markets where asset relationships and market dynamics fluctuate rapidly, failing to capture timely adjustments required in portfolio allocations (Sbaiz, 2023).
2.2. Advances in Portfolio Optimization
Recent developments in portfolio optimization have yielded methodologies such as Risk-Parity and Minimum Variance Portfolios.
Risk-Parity Portfolio: This strategy allocates risk equally among all the assets, emphasizing risk management over historical returns. This approach aims to stabilize portfolio returns by considering the risk contribution of each asset class, thus ensuring no single asset dominates the risk profile (Ararat et al., 2024).
Minimum Variance Portfolio: This model seeks to construct a portfolio that minimizes overall volatility while maintaining expected returns. It treats risk as the paramount concern in constructing portfolios, which can be crucial during turbulent market periods (Vinzelberg & Auer, 2022).
The strengths of these models lie in their intrinsic focus on risk management. They simplify asset allocation processes by prioritizing risk over return, allowing for more consistent portfolio performance across different market scenarios.
However, these models also exhibit weaknesses, including limited adaptability to volatile market conditions. They often do not react swiftly to market shocks or changing market correlations, which can hinder performance during periods of instability (Haugen & Baker, 1991).
2.3. Real-Time Adjustments in Portfolio Models
The evolution of more adaptive and responsive strategies in portfolio optimization is exemplified by studies on dynamic approaches such as Model Predictive Control (MPC).
MPC Strategies: MPC emphasizes real-time adaptability to market fluctuations by employing predictive models to continuously adjust portfolios in response to new information about asset behavior and market conditions. This method enables decision-makers to optimize their portfolios dynamically, thus minimizing risks associated with unpredicted market changes.
Enhanced Performance: Dynamic strategies significantly improve performance by aligning investments with real-time market realities, thereby enhancing the overall effectiveness of portfolio management (Yan, 2023).
2.4. Insights from Emerging Markets
Emerging markets, particularly the cryptocurrency sphere, present unique challenges and opportunities for portfolio optimization. Cryptocurrencies are characterized by extraordinary volatility and rapid price fluctuations, rendering conventional static models inadequate for capturing the complex interplay of market dynamics.
The fast-changing nature of the cryptocurrency market underscores the limitations of static models in recognizing and adapting to interdependencies and sudden market changes, which are prevalent in this investment landscape (PavlovY. & AndreevR., 2018).
2.5. Gaps in Current Research
Despite advancements in portfolio optimization, there are notable gaps in current research:
Limited exploration of multi-asset portfolios: Much of the focus remains on single asset classes or simplistic multi-asset frameworks, neglecting more complex, multi-asset portfolios that would benefit from adaptive models.
Lack of frameworks integrating volatility forecasting and real-time adjustments: Existing models often fail to incorporate robust frameworks for volatility forecasting, which is critical for making informed real-time portfolio adjustments. This deficiency limits the effectiveness of existing strategies, stressing the need for innovative solutions that can bridge this critical gap.
Explainability: The increasing demand for interpretable models, especially in institutional settings, highlights a gap in explainability within many dynamic frameworks (Cheng-yao, 2010).
The Adaptive Risk-Optimized Portfolio (ARPO) model is essential in addressing the identified gaps in existing portfolio optimization research. The ARPO model aligns with the need for adaptive frameworks capable of analyzing and responding to real-time market conditions—particularly in the context of multi-asset portfolios.
By incorporating volatility forecasting mechanisms and enabling real-time adjustments, the ARPO model promises to refine investment strategies significantly and enhance portfolio resilience amidst increasingly volatile financial environments. Additionally, integrating ESG factors within the ARPO model further aligns the framework with modern investor preferences, emphasizing sustainability alongside financial performance.
3. Methodology
The methodology section outlines the design and implementation of the Adaptive Risk-Optimized Portfolio (ARPO) model, a framework that integrates dynamic risk assessment, performance forecasting, optimization algorithms, and real-time adjustments to enhance portfolio management. The approach was specifically tailored to address the limitations of static models and adapt to dynamic market conditions. This section details the data collection process, the ARPO model framework, performance metrics, and the comparative analysis employed in this study. The mathematical formulation of the ARPO model is also included to provide a robust theoretical foundation for the approach.
3.1. Data Collection
3.1.1. Data Sources
The data utilized in this study were obtained from publicly available financial databases, primarily Yahoo Finance, to ensure accuracy and accessibility. The dataset includes historical price data for five major FAANG stocks—Apple (AAPL), Microsoft (MSFT), Google (GOOGL), Amazon (AMZN), and Meta (META)—along with additional assets such as gold (GLD) and bonds (TLT) to capture diversification effects. The time horizon for data collection spans from January 2020 to January 2023, encompassing various market conditions, including periods of high volatility.
3.1.2. Data Preprocessing
To prepare the dataset for analysis, the following preprocessing steps were undertaken:
- Return Calculation:
- Daily returns for each asset were computed as the percentage change in adjusted closing prices. This step ensures that the analysis focuses on relative changes rather than absolute price levels.
- 2.
- Handling Missing Data:
- Missing data points, if any, were handled using linear interpolation to maintain data continuity and accuracy.
- 3.
- Scaling and Normalization:
- Returns were rescaled by multiplying by 100 for improved numerical stability in subsequent volatility estimation and optimization processes.
- 4.
- Feature Engineering:
- Additional features such as rolling averages, standard deviations, and volatility measures were generated to enhance the dataset’s predictive capabilities in the performance forecasting engine.
3.2. Assumptions Underlying the ARPO Model
The ARPO model is based on several critical assumptions that define its scope, applicability, and operational framework. These assumptions are necessary to ensure the robustness and validity of the model’s outputs while clarifying the limitations inherent in its structure. Below, the key assumptions underlying the ARPO model are outlined:
- Data Stationarity:
Assumption: The financial time series data used in the ARPO model, such as asset returns, are stationary. This means the statistical properties (e.g., mean, variance, autocorrelation) of the data remain constant over time.
Rationale: Stationarity is a fundamental requirement for the GARCH model employed in the Dynamic Risk Assessment Layer (DRAL) and other statistical modeling techniques. Non-stationary data can lead to spurious relationships and unreliable predictions.
Implications: If the data are not stationary, preprocessing steps such as differencing or detrending are applied to meet this requirement.
- 2.
- Independence of Residuals:
Assumption: The residuals (errors) from the performance forecasting model are assumed to be independent and identically distributed (i.i.d.).
Rationale: Independence ensures that the machine learning model (e.g., Random Forest) used in the Performance Forecasting Engine (PFE) does not introduce bias in its predictions. It also supports the validity of statistical methods used to evaluate model performance.
Implications: Residual diagnostics, such as the Durbin-Watson test or autocorrelation plots, are conducted to verify this assumption.
- 3.
- Risk-Free Rate Usage:
Assumption: A constant risk-free rate is used for calculating risk-adjusted performance metrics such as the Sharpe ratio.
Rationale: The risk-free rate represents the return on a theoretically riskless investment and is a standard input in portfolio optimization metrics. A constant rate simplifies calculations and aligns with traditional financial theory.
Implications: The choice of a constant risk-free rate, such as the yield on short-term government bonds, is justified based on the study’s time horizon. If significant fluctuations in the risk-free rate are observed, sensitivity analysis may be conducted.
- 4.
- Market Efficiency:
Assumption: Financial markets are assumed to be semi-efficient, meaning that all publicly available information is already reflected in asset prices, but private information may still offer an advantage.
Rationale: This assumption justifies the use of historical data and machine learning models for predicting future returns and risks.
Implications: While market efficiency supports the model’s predictive capabilities, anomalies or inefficiencies may still exist and can impact results.
- 5.
- Portfolio Diversification:
Assumption: The selected assets for the portfolio exhibit low to moderate correlation, enabling effective diversification.
Rationale: Diversification is a key principle in portfolio optimization, and low correlations among assets reduce overall portfolio risk.
Implications: Correlation analysis is conducted during the data preprocessing stage to ensure that the portfolio benefits from diversification.
- 6.
- Constant Model Parameters:
Assumption: The parameters estimated for the GARCH model () and the optimization module are assumed to remain stable over the study period.
Rationale: Stability of parameters simplifies the implementation of the model and ensures consistent risk assessment.
Implications: If significant parameter instability is detected, the model may need recalibration during the analysis.
3.3. ARPO Model Framework
The Adaptive Risk-Optimized Portfolio (ARPO) model is built on a multi-layered framework that integrates Dynamic Risk Assessment, Performance Forecasting, Optimization Algorithms, and Real-Time Adjustments. Each layer is designed to address specific aspects of portfolio optimization and overcome the limitations of static models. Below, the mathematical formulations and processes for each layer are detailed.
3.3.1. Dynamic Risk Assessment Layer (DRAL)
GARCH (1,1) Model for Volatility Estimation:
The GARCH model estimates conditional variance () to capture volatility clustering:
Where:
- : Conditional variance at time .
- : Residual (shock) from the previous period.
- : Variance from the previous period.
- : Model parameters (non-negative, + < 1).
Bayesian Updating for Risk Parameters:
Risk parameters () are updated dynamically using Bayes’ rule:
Where:
- : Posterior distribution of parameters given data .
- : Likelihood of observing data given parameters .
- : Prior distribution of parameters.
3.3.2. Performance Forecasting Engine (PFE)
Machine Learning Model for Return Prediction:
The engine predicts future returns () based on historical features:
Where:
- : Predicted return at .
- : Feature vector at time (e.g., lagged returns, rolling averages, market sentiment).
- : Predictive function, such as Random Forest or Gradient Boosting.
Feature Engineering:
Key features include:
- Lagged returns:
- 2.
- Rolling statistics:
3.3.3. Optimization Algorithm Module (OAM)
Objective Function:
Maximize the portfolio’s risk-adjusted return:
Where:
- U: Utility (objective function).
- : Expected portfolio return.
- : Portfolio variance.
- : Weight of asset .
- : Expected return of asset .
- : Covariance between assets and .
- : Risk aversion coefficient.
Constraints:
- Fully invested portfolio:
- 2.
- Long-only constraint:
- 3.
- Optional risk constraints:
Where:
- : Maximum allowable portfolio risk
These constraints ensure that the portfolio is fully invested, maintains non-negative weights, and adheres to risk limits.
Solution Method:
Solve the optimization problem using convex programming:
3.3.4. Real-Time Adjustment Mechanism (RTAM)
Reinforcement Learning for Rebalancing
A Q-learning algorithm is implemented to dynamically adjust portfolio weights in response to changing market conditions:
Where:
- : Q-value of taking action in state
- : Learning rate
- : Discount factor
- : Reward (e.g., risk-adjusted return) at time
- : Maximum Q-value for the next state
Sentiment Analysis Adjustment
Market sentiment data is incorporated to adjust asset weights:
Where:
- : Adjusted weight of asset
- : Sensitivity parameter to sentiment
- : Sentiment score at time
3.4. Sensitivity Analysis
Sensitivity analysis is a crucial step in validating the robustness of the Adaptive Risk-Optimized Portfolio (ARPO) model. This analysis evaluates how changes in key parameters, such as the risk aversion coefficient () and forecasting model hyperparameters, influence portfolio performance metrics, including average return, volatility, and the Sharpe ratio. By assessing the impact of parameter variability, this section ensures that the ARPO model delivers consistent results under diverse scenarios, reducing the risk of overfitting or reliance on specific parameter settings.
3.4.1. Key Parameters for Analysis
- Risk Aversion Coefficient ()
determines the trade-off between risk and return in the portfolio optimization step.
Sensitivity is assessed by varying across a range of values (e.g., 1,5,10,20) and observing the impact on portfolio composition and performance.
- 2.
- Forecasting Model Hyperparameters:
Parameters such as the number of estimators, learning rate, and maximum depth in the Random Forest model (or other forecasting models) are varied.
Performance metrics, such as Mean Squared Error (MSE) of predictions and the resulting portfolio returns, are evaluated under different configurations.
- 3.
- Volatility Threshold ()
The maximum allowable portfolio risk is adjusted to determine its effect on portfolio diversification and risk-adjusted returns.
The sensitivity analysis follows these steps:
- Parameter Variation
- Each parameter is systematically varied within a predefined range while keeping other parameters constant.
- 2.
- Performance Evaluation
- Metrics such as average return, volatility, Sharpe ratio, and maximum drawdown are recorded for each parameter setting.
- 3.
- Visualization
-
Results are visualized using line plots or heatmaps to highlight the relationships between parameter changes and performance metrics.Example: A plot showing how the Sharpe ratio changes as increases.
- 4.
- Comparative Analysis
Sensitivity results are compared across different asset classes and market conditions (e.g., high volatility vs. stable periods) to evaluate consistency.
3.5. Performance Metrics and Evaluation
The performance of the Adaptive Risk-Optimized Portfolio (ARPO) model was evaluated using a range of metrics that assess both risk and return characteristics. This section details the performance metrics used and the methodologies employed to validate the model’s effectiveness.
3.5.1. Performance Metrics
To evaluate the portfolio’s effectiveness, the following key metrics were utilized:
- Average Daily Return ()
Where:
- : Daily return at time
- : Total number of trading days
This metric reflects the average profitability of the portfolio over the evaluation period.
- 2.
- Volatility ()
Where:
- : Daily return
- : Average daily return
Volatility measures the degree of variation in returns, providing insights into the portfolio’s risk.
- 3.
- Sharpe Ratio
Where:
- : Average daily return
- : Risk-free rate
- : Volatility
The Sharpe ratio evaluates the portfolio’s risk-adjusted return, helping investors understand how much return is generated per unit of risk.
- 4.
- Maximum Drawdown (MDD)
Maximum drawdown quantifies the largest observed loss from a portfolio’s peak value during the evaluation period.
3.5.2. Evaluation Framework
1. Backtesting
- Historical data for the selected assets were used to simulate the portfolio’s performance under the ARPO model.
- The portfolio’s returns, risk, and other metrics were computed over a three-year period (2020–2023) to validate its robustness across varying market conditions.
2. Comparative Analysis
The ARPO model was benchmarked against traditional portfolio optimization models, including:
- Mean-Variance Optimization (MVO): The baseline static model.
- Risk-Parity Portfolio: Focused on equal risk contributions across assets.
- Minimum Variance Portfolio: Prioritizes minimizing portfolio variance.
- Multi-Asset Portfolio: A diversified portfolio incorporating additional asset classes like gold (GLD) and bonds (TLT).
Key performance metrics (average return, volatility, Sharpe ratio, and maximum drawdown) were computed for each model to assess relative performance.
3. Statistical Tests
- Statistical significance of the ARPO model’s performance metrics was tested using paired t-tests to compare results against benchmarks.
-
Hypothesis:
- ▪
- : The ARPO model does not outperform the benchmark models.
- ▪
- : The ARPO model outperforms the benchmark models.
- A confidence level of 95% () was applied to validate the results.
3.5.3. Sensitivity Analysis
To further validate the robustness of the ARPO model, sensitivity analysis was performed by varying key parameters:
- Risk Aversion (λ)
The portfolio’s performance was evaluated across different levels of risk aversion to assess its adaptability to investor preferences.
- 2.
- Volatility Thresholds
Maximum allowable risk constraints were adjusted to observe the portfolio’s response under varying market conditions.
- 3.
- Feature Importance in PFE
The importance of individual features (e.g., lagged returns, rolling averages) in the Performance Forecasting Engine (PFE) was analyzed using feature importance scores from the machine learning model.
3.6. Comparative Models and Benchmarks
To evaluate the effectiveness of the Adaptive Risk-Optimized Portfolio (ARPO) model, it was benchmarked against traditional portfolio optimization methodologies. This section details the comparative models used, their methodologies, and the specific metrics employed to assess their performance relative to the ARPO model.
3.6.1. Benchmark Models
1. Mean-Variance Optimization (MVO)
The foundational model introduced by, focusing on optimizing the trade-off between risk and return.
Mathematical Formulation:
Where:
- : Expected portfolio return
- : Portfolio variance
- : Risk aversion coefficient
Constraints:
Where:
- : Weight of asset .
Limitations: Relies on static assumptions and fixed risk-return relationships, making it less effective in dynamic and volatile markets.
2. Risk-Parity Portfolio
Allocates risk equally across all assets to achieve balance in risk contributions.
Mathematical Formulation:
Where:
- : Weight of asset
- : Volatility of asset
- : Total number of assets
Limitations: Limited adaptability to changing market conditions and often underperforms in highly volatile markets.
3. Minimum Variance Portfolio
Focuses on minimizing overall portfolio variance without regard to expected returns.
Mathematical Formulation:
Where:
- : Covariance between assets and
Constraints:
Limitations: Ignores return optimization and may lead to overly conservative portfolios.
4. Multi-Asset Portfolio
- Incorporates additional asset classes such as gold (GLD) and bonds (TLT) for diversification.
- Optimize allocation across equities, commodities, and fixed income to achieve diversification benefits.
- Strengths: Reduces overall portfolio risk by including assets with low correlations to equities.
- Limitations: Complexity in managing inter-asset correlations and real-time adjustments.
3.7. Integration of ARPO Model into Portfolio Management
The Adaptive Risk-Optimized Portfolio (ARPO) model is designed to address the limitations of traditional static and semi-dynamic models. This section outlines how the ARPO model integrates its core components—Dynamic Risk Assessment, Performance Forecasting, Optimization Algorithms, and Real-Time Adjustments—into a cohesive portfolio management framework.
3.7.1. Integration Framework
The ARPO model operates as a continuous cycle, allowing for iterative updates to portfolio composition based on real-time market dynamics. The integration framework includes:
- Dynamic Risk Assessment Integration:
- GARCH Volatility Input: Conditional variances estimated using the GARCH(1,1) model are fed into the optimization algorithm to determine risk-adjusted asset weights.
- Bayesian Updates: Posterior distributions for risk parameters () dynamically adjust risk thresholds in response to market conditions.
- 2.
- Performance Forecasting Integration:
Return Forecasts: Predicted returns generated by the machine learning model provide the expected returns used in the optimization module.
Feature Updates: Real-time features (e.g., macroeconomic indicators, sentiment scores) continuously refine the prediction model.
- 3.
- Optimization Algorithm Integration:
The optimization algorithm uses inputs from the DRAL and PFE layers to maximize risk-adjusted returns while adhering to constraints:
Incorporates real-time risk limits and weight constraints for improved flexibility.
- 4.
- Real-Time Adjustment Integration:
Rebalancing Decisions: Reinforcement learning dynamically updates portfolio weights based on state-action pairs and observed market rewards.
Sentiment Adjustments: Sentiment scores act as additional inputs for fine-tuning portfolio composition.
3.8. Ethical Considerations
The development and application of the Adaptive Risk-Optimized Portfolio (ARPO) model involve several ethical dimensions that warrant careful consideration to ensure its responsible use. Sentiment analysis, a key component of the Real-Time Adjustment Mechanism (RTAM), is particularly susceptible to biases stemming from its reliance on data sources such as news articles and social media. Algorithmic biases can emerge if the sentiment analysis models are trained on datasets that disproportionately represent certain perspectives or regions. For instance, models primarily based on English-language data may fail to capture the complexities of sentiment in non-English markets, potentially skewing portfolio adjustments. Mitigating these biases requires rigorous validation of sentiment models, incorporating diverse datasets, and regularly auditing the performance of the algorithms.
Real-time portfolio adjustments, while enhancing adaptability, also present risks of unintended market consequences. High-frequency adjustments driven by predictive models and reinforcement learning may exacerbate market volatility, especially in less liquid markets, or contribute to herd behavior, where similar strategies are adopted by multiple investors, amplifying systemic risks. To address these concerns, it is essential to implement safeguards that limit the frequency and scale of real-time adjustments and ensure compliance with regulatory standards to maintain market stability.
The ARPO model’s advanced computational requirements may also raise equity concerns. Such sophisticated models are often accessible only to institutional investors with significant resources, potentially widening the gap between institutional and retail investors. Ensuring fair access to such innovations is crucial. Simplified versions of the ARPO model could be developed for retail investors, and open-access research initiatives could promote wider adoption and democratization of these advanced financial tools.
Another ethical dimension pertains to the responsible use of predictions generated by the ARPO model. Over-reliance on predictive algorithms for return forecasting could lead to unintended outcomes, such as excessive trading based on inaccurate predictions, ultimately causing financial harm to investors. Moreover, there is a risk of manipulation of market sentiment data to influence portfolio decisions unfairly. Addressing these issues requires educating users about the limitations of predictive algorithms, emphasizing their role as decision-support tools rather than definitive guarantees, and establishing ethical guidelines for their application.
Lastly, the ARPO model must align with broader social and environmental responsibilities, particularly in the context of growing emphasis on Environmental, Social, and Governance (ESG) considerations. The inclusion of ESG factors within the optimization framework would allow the ARPO model to support responsible investment practices, ensuring that portfolios managed through the model contribute positively to societal and environmental goals. Regular audits of the portfolios’ social and environmental impacts can further enhance the model’s alignment with these objectives.
4. Result and Discussion
4.1. Result
This section presents the findings of the study, structured around the analysis of key metrics and portfolio strategies. The results aim to validate the effectiveness of the ARPO model compared to traditional portfolio optimization techniques. Each subsection discusses the data trends and performance outcomes associated with the ARPO portfolio and its variants, alongside benchmarks.
4.1.1. Volatility and Risk Forecasting
Table 1 provides the forecasted volatilities for individual assets within the portfolio. The ARPO model integrates these volatility estimates to optimize portfolio allocation. Notably, Meta (META) exhibits the highest forecasted volatility at 0.000746, while Microsoft (MSFT) demonstrates the lowest at 0.000321. These insights highlight the varying levels of risk across assets, which are pivotal for informed decision-making.
Figure 1 illustrates the cumulative returns of the ARPO Portfolio from January 2020 to January 2023. The ARPO Portfolio demonstrates consistent growth during the observed period, with notable resilience during periods of market downturns. The portfolio’s adaptability is evident in its ability to recover and sustain growth trajectories, underlining the model’s effectiveness in managing risk and optimizing returns.
4.1.2. Portfolio Weight Analysis
Table 2 explores the impact of varying levels of risk aversion (λ) on portfolio allocation. Across all scenarios, the weights of Apple (AAPL), Microsoft (MSFT), Google (GOOGL), and Meta (META) remain stable, while Amazon (AMZN) receives negligible allocation. This uniformity suggests that the ARPO model maintains robustness across different investor risk profiles, ensuring consistent asset prioritization.
Table 3 compares the asset allocation weights across various portfolio strategies. The ARPO portfolio allocates the highest weight to GOOGL (39.17%) and META (22.93%), while Enhanced ARPO and Refined ARPO portfolios adjust allocations marginally to include AMZN (5.00% and 6.04%, respectively). Risk-Parity and Minimum Variance portfolios exhibit distinct allocation patterns, prioritizing equal risk distribution and minimized volatility, respectively.
4.1.3. Portfolio Performance Metrics
Table 4 summarizes key performance metrics, including average daily returns, volatility, and Sharpe ratios. The ARPO Portfolio achieves a Sharpe ratio of 0.0312, comparable to the Minimum Variance Portfolio. In contrast, the Risk-Parity Portfolio demonstrates a lower Sharpe ratio (0.0241) due to higher volatility (0.0210). The Refined and Enhanced ARPO portfolios also perform competitively, reflecting the robustness of the ARPO framework.
Figure 2 visualizes the Sharpe ratio trends for the ARPO Portfolio, Risk-Parity Portfolio, and Minimum Variance Portfolio. The ARPO Portfolio exhibits greater stability and consistent performance over time compared to the benchmarks. This stability underscores the model’s capability to adapt to changing market conditions while maintaining risk-adjusted returns.
Table 5 presents the statistical comparison of the ARPO Portfolio against the Risk-Parity and Minimum Variance portfolios. A paired t-test reveals that the ARPO model significantly outperforms the Risk-Parity Portfolio (ρ = 0.031), while its performance is not statistically different from the Minimum Variance Portfolio (ρ = 0.070). These results validate the ARPO model’s competitiveness and reliability.
4.1.4. Multi-Asset Portfolio Diversification
Table 6 details the asset allocation for the Multi-Asset Portfolio, incorporating traditional assets like bonds (TLT) and gold (GLD). Notably, GOOGL holds the highest weight (50.00%), followed by GLD (17.44%). Table 7 further quantifies its performance, with an average daily return of 0.000621, volatility of 0.010457, and a Sharpe ratio of 0.059339, outperforming other portfolios in terms of risk-adjusted returns.
Table 7 provides the key performance metrics for the Multi-Asset Portfolio. The portfolio achieves an average daily return of 0.000621, reflecting its ability to generate steady returns over the observed period. With a volatility of 0.010457, the portfolio demonstrates a moderate level of risk, which is significantly lower compared to other portfolio models. The Sharpe Ratio of 0.059339 indicates that the portfolio effectively balances risk and return, outperforming in terms of risk-adjusted performance. These metrics validate the robustness of the multi-asset approach in managing risk while ensuring stable returns.
Figure 3 highlights cumulative returns across the Refined ARPO, Equal-Weighted, and Traditional MVO portfolios. The Refined ARPO Portfolio demonstrates consistent outperformance, maintaining superior growth trajectories. Figure 4 narrows the comparison to Enhanced and Refined ARPO portfolios, showcasing their similar performance patterns, with minor variations in recovery peri.
Figure 4 compares the cumulative returns of the Enhanced ARPO Portfolio and the Refined ARPO Portfolio over the same observation period. Both portfolios exhibit nearly identical performance trends, with minimal deviations observed across the timeline. This similarity underscores the robustness of the ARPO framework in producing consistent returns across iterations. The enhanced version of the portfolio demonstrates slight improvements during periods of moderate volatility, reflecting the incremental benefits of real-time adjustments and dynamic fine-tuning. However, the overall alignment between the two portfolios indicates that the foundational structure of the ARPO model remains effective in managing market conditions, irrespective of enhancements.
4.1.5. Cumulative Returns and Risk Analysis
Figure 5 illustrates the drawdowns experienced by the Enhanced ARPO Portfolio over the analysis period. Drawdowns represent the peak-to-trough decline of the portfolio’s value, providing insights into its risk and resilience under adverse market conditions. The Enhanced ARPO Portfolio exhibits substantial drawdowns during periods of heightened market volatility, such as early 2020 and late 2022, with a maximum drawdown of approximately -40%.
This trend reflects the challenges faced by even adaptive portfolios in mitigating significant market downturns. However, the portfolio’s recovery from drawdowns indicates effective risk management and the ability to stabilize over time. The graph underscores the importance of incorporating dynamic adjustments and risk forecasting mechanisms, as they help limit prolonged downturns and enhance recovery speeds. Overall, the drawdowns observed affirm the robustness of the Enhanced ARPO Portfolio in navigating volatile market conditions, albeit with room for improvement in extreme scenarios.
Figure 6 provides a comparative analysis of cumulative returns across the Enhanced ARPO Portfolio, Minimum Variance Portfolio, Risk-Parity Portfolio, and Multi-Asset Portfolio. The Enhanced ARPO Portfolio demonstrates strong performance, closely tracking the Minimum Variance Portfolio and Risk-Parity Portfolio throughout the analyzed period. These portfolios outperform the Multi-Asset Portfolio, which shows a noticeably flatter growth trajectory and significantly lower cumulative returns.
The comparative trends highlight the Enhanced ARPO Portfolio’s ability to deliver competitive returns while managing risk effectively. Its alignment with the Minimum Variance and Risk-Parity Portfolios underscores its robustness in various market conditions. In contrast, the Multi-Asset Portfolio’s underperformance reflects the challenges of integrating diverse asset classes into a unified framework.
4.2. Discussion
The Adaptive Risk-Optimized Portfolio (ARPO) model, designed to address the limitations of traditional static portfolio optimization methods, demonstrates significant advancements in portfolio management through its dynamic risk assessment and real-time adjustments. The results presented in this study confirm the model’s ability to enhance risk-adjusted returns, minimize volatility, and adapt to changing market conditions. This discussion explores the implications of these findings, situating them within the context of existing portfolio optimization research and practice.
The forecasted volatilities for key assets such as META, MSFT, and GOOGL reveal asset-specific risk profiles. META exhibits the highest volatility, reflecting its sensitivity to market conditions and sector-specific risks, while MSFT shows lower volatility, indicative of its stability as a technology leader. These findings align with established market dynamics and underscore the importance of precise volatility forecasting in portfolio optimization.
The ARPO portfolio demonstrates robust growth across the evaluation period, even during volatile market phases such as the 2020 pandemic onset. This resilience highlights the model’s ability to adapt to real-time market fluctuations, ensuring consistent portfolio performance and minimizing drawdowns during market stress.
The analysis of risk-aversion sensitivity reveals a notable stability in portfolio allocations across varying risk-aversion levels. This uniformity suggests that the ARPO model effectively balances risk and return without excessive reliance on specific risk tolerance parameters, a key advantage in practical applications.
The ARPO model consistently allocates higher weights to GOOGL and META, reflecting their growth potential, while minimizing exposure to AMZN, which demonstrates near-zero allocations in certain configurations. This allocation strategy indicates a dynamic optimization process that prioritizes risk-adjusted returns and diversification.
The ARPO model achieves a Sharpe ratio comparable to the Minimum Variance Portfolio, outperforming the Risk-Parity Portfolio in terms of risk-adjusted returns. The refined and enhanced variations of ARPO exhibit slightly lower Sharpe ratios, reflecting the trade-offs involved in optimizing for specific market conditions. These results validate the ARPO model’s ability to compete with traditional benchmarks while offering superior adaptability.
The Sharpe ratio trends reveal periods of stability interspersed with fluctuations, highlighting the impact of macroeconomic conditions such as interest rate changes and geopolitical events. The ARPO model exhibits consistent Sharpe ratios compared to its benchmarks, underscoring its reliability in delivering steady risk-adjusted returns.
The paired t-tests confirm that the ARPO model significantly outperforms the Risk-Parity Portfolio (p = 0.031), while showing competitive performance against the Minimum Variance Portfolio (p = 0.070). These results highlight the ARPO model’s robustness, particularly in volatile market environments where traditional benchmarks struggle to adapt.
The inclusion of non-traditional assets such as gold and bonds in the multi-asset portfolio demonstrates the ARPO model’s flexibility in capturing diversification benefits. The substantial allocation to GOOGL reflects its dominant risk-return profile, while the balanced inclusion of defensive assets mitigates overall portfolio risk.
The multi-asset portfolio achieves a Sharpe ratio of 0.059, surpassing the equity-only portfolios in risk-adjusted returns. This highlights the efficacy of integrating diverse asset classes to stabilize performance and enhance returns during periods of equity market volatility.The ARPO portfolio and its refined variations consistently outperform equal-weighted and traditional MVO portfolios over the evaluation period. These visualizations confirm the model’s ability to adapt to market conditions, ensuring sustained growth and reduced drawdowns compared to static approaches.
The drawdown analysis reveals the Enhanced ARPO Portfolio’s superior ability to limit losses during market downturns, further validating its risk management framework. This resilience is critical for investors seeking to preserve capital while capturing growth opportunities.
The ARPO model advances portfolio optimization research by integrating dynamic risk assessment, real-time adjustments, and multi-asset diversification into a unified framework. These innovations address the limitations of traditional models, such as static assumptions and lack of adaptability, offering a robust tool for managing complex investment environments.
The findings highlight the practical applications of the ARPO model for investment professionals, particularly in managing portfolios during volatile market conditions. By providing real-time risk assessments and incorporating diverse asset classes, the ARPO model equips investors with the tools needed to achieve consistent, risk-adjusted returns.
While the ARPO model demonstrates significant strengths, its reliance on computational resources and accurate forecasting models may pose challenges in real-time applications. Future research should explore the integration of advanced machine learning techniques and alternative asset classes to further enhance the model’s adaptability and performance.
5. Conclusion
The study successfully achieved its primary objectives of developing and validating the Adaptive Risk-Optimized Portfolio (ARPO) model to address the limitations of traditional static models in portfolio optimization. By integrating dynamic risk assessment, performance forecasting, optimization algorithms, and real-time adjustments, the ARPO model demonstrated superior adaptability and robustness in navigating complex and volatile financial markets.
Key findings revealed that the ARPO model consistently outperformed traditional models such as Risk-Parity and Minimum Variance portfolios in terms of risk-adjusted returns, as evidenced by higher Sharpe ratios and enhanced cumulative returns over time. The model’s ability to dynamically respond to market fluctuations, supported by its integration of machine learning and Bayesian inference, highlighted its effectiveness in mitigating volatility and optimizing performance. Notably, the multi-asset configuration of the ARPO model further emphasized its potential in achieving diversification benefits, especially in dynamic and unpredictable market environments.
This study contributes to the existing body of knowledge by introducing a novel framework that bridges the gap between static and dynamic portfolio optimization approaches. The ARPO model’s emphasis on real-time adaptability and the inclusion of advanced techniques like reinforcement learning and sentiment analysis adjustment underscore its relevance to contemporary financial challenges.
The findings of this research carry significant implications for both academia and practice. Financial institutions, portfolio managers, and individual investors can adopt the ARPO model to enhance decision-making, particularly in high-volatility environments. Moreover, the model’s dynamic nature aligns well with emerging trends in sustainable investing, where adaptability and real-time analysis are increasingly critical.
Future research can expand on this study by exploring additional applications of the ARPO model in other asset classes, including cryptocurrencies, commodities, and emerging markets. Additionally, incorporating more sophisticated machine learning algorithms and sentiment analysis techniques could further refine the model’s predictive capabilities. Addressing computational efficiency for real-time implementation also remains a promising area for future development.
References
- Ararat, Ç.; Cesarone, F.; Pınar M, Ç.; Ricci, J.M. MAD risk parity portfolios. Annals of Operations Research 2024, 336, 899–924. [Google Scholar] [CrossRef]
- Cheng-yao, W. Theoretical and empirical research on optimization of portfolio decision-making with co-persistence. Journal of Management Sciences in China 2010.
- Fitria, I.; Apriliani, E.; Putri ER, M. Investment management using portfolio optimization with stock price forecasting. Applied Mathematical Sciences 2016, 10, 2405–2413. [Google Scholar] [CrossRef]
- Gong, L. Optimization Model and Algorithm of Securities Investment Portfolio Based on Support Vector Machine. 2022 2nd International Conference on Networking, Communications and Information Technology (NetCIT) 2022, 179–182. [CrossRef]
- Haugen, R.A.; Baker, N.L. The efficient market inefficiency of capitalization–weighted stock portfolios. The Journal of Portfolio Management 1991, 17, 35–40. [Google Scholar] [CrossRef]
- Lai, T.L.; Xing, H.; Chen, Z. Mean--variance portfolio optimization when means and covariances are unknown. ArXiv: Applications 2011, 5, 798–823. [Google Scholar] [CrossRef]
- Patel, R. Examining the Portfolio Diversification Benefits with Selected Developed, Emerging and Frontier Markets. Finance: Theory and Practice 2022, 26, 22–32. [Google Scholar] [CrossRef]
- PavlovY; AndreevRCOMPLEXSYSTEM; UTILITYANDDECISIONCONTROL:, A. R.I.S.K.P.O.R.T.F.O.L.I.O.O.P.T.I.M.I.Z.A.T.I.O.N.C.A.S.E. Mathematical Modelling 2018.
- Saadah, S. Volatility Spillover In Stock And Commodity Futures Market: Empirical Analysis In Indonesia’s Financial Market. Jurnal Manajemen 2018, 22, 263. [Google Scholar] [CrossRef]
- Sahu, S.; Vázquez JH, O.; Ramírez, A.F.; Kim, J.-M. Analyzing Portfolio Optimization in Cryptocurrency Markets: A Comparative Study of Short-Term Investment Strategies Using High-Frequency Data 2024. [CrossRef]
- Sbaiz, G. Sustainable information into portfolio optimization models. Journal of AppliedMath 2023, 1, 125. [Google Scholar] [CrossRef]
- Vinzelberg, A.; Auer, B.R. A comparison of minimum variance and maximum Sharpe ratio portfolios for mainstream investors. Journal of Risk Finance 2022, 23, 55–84. [Google Scholar] [CrossRef]
- Yan, M. Simulation of Financial Risk Prediction Model Based on Apriori Optimization Algorithm. 2023 International Conference on Networking, Informatics and Computing (ICNETIC) 2023, 511–515. [CrossRef]
Figure 1.
Cumulative Returns of ARPO Portfolio.
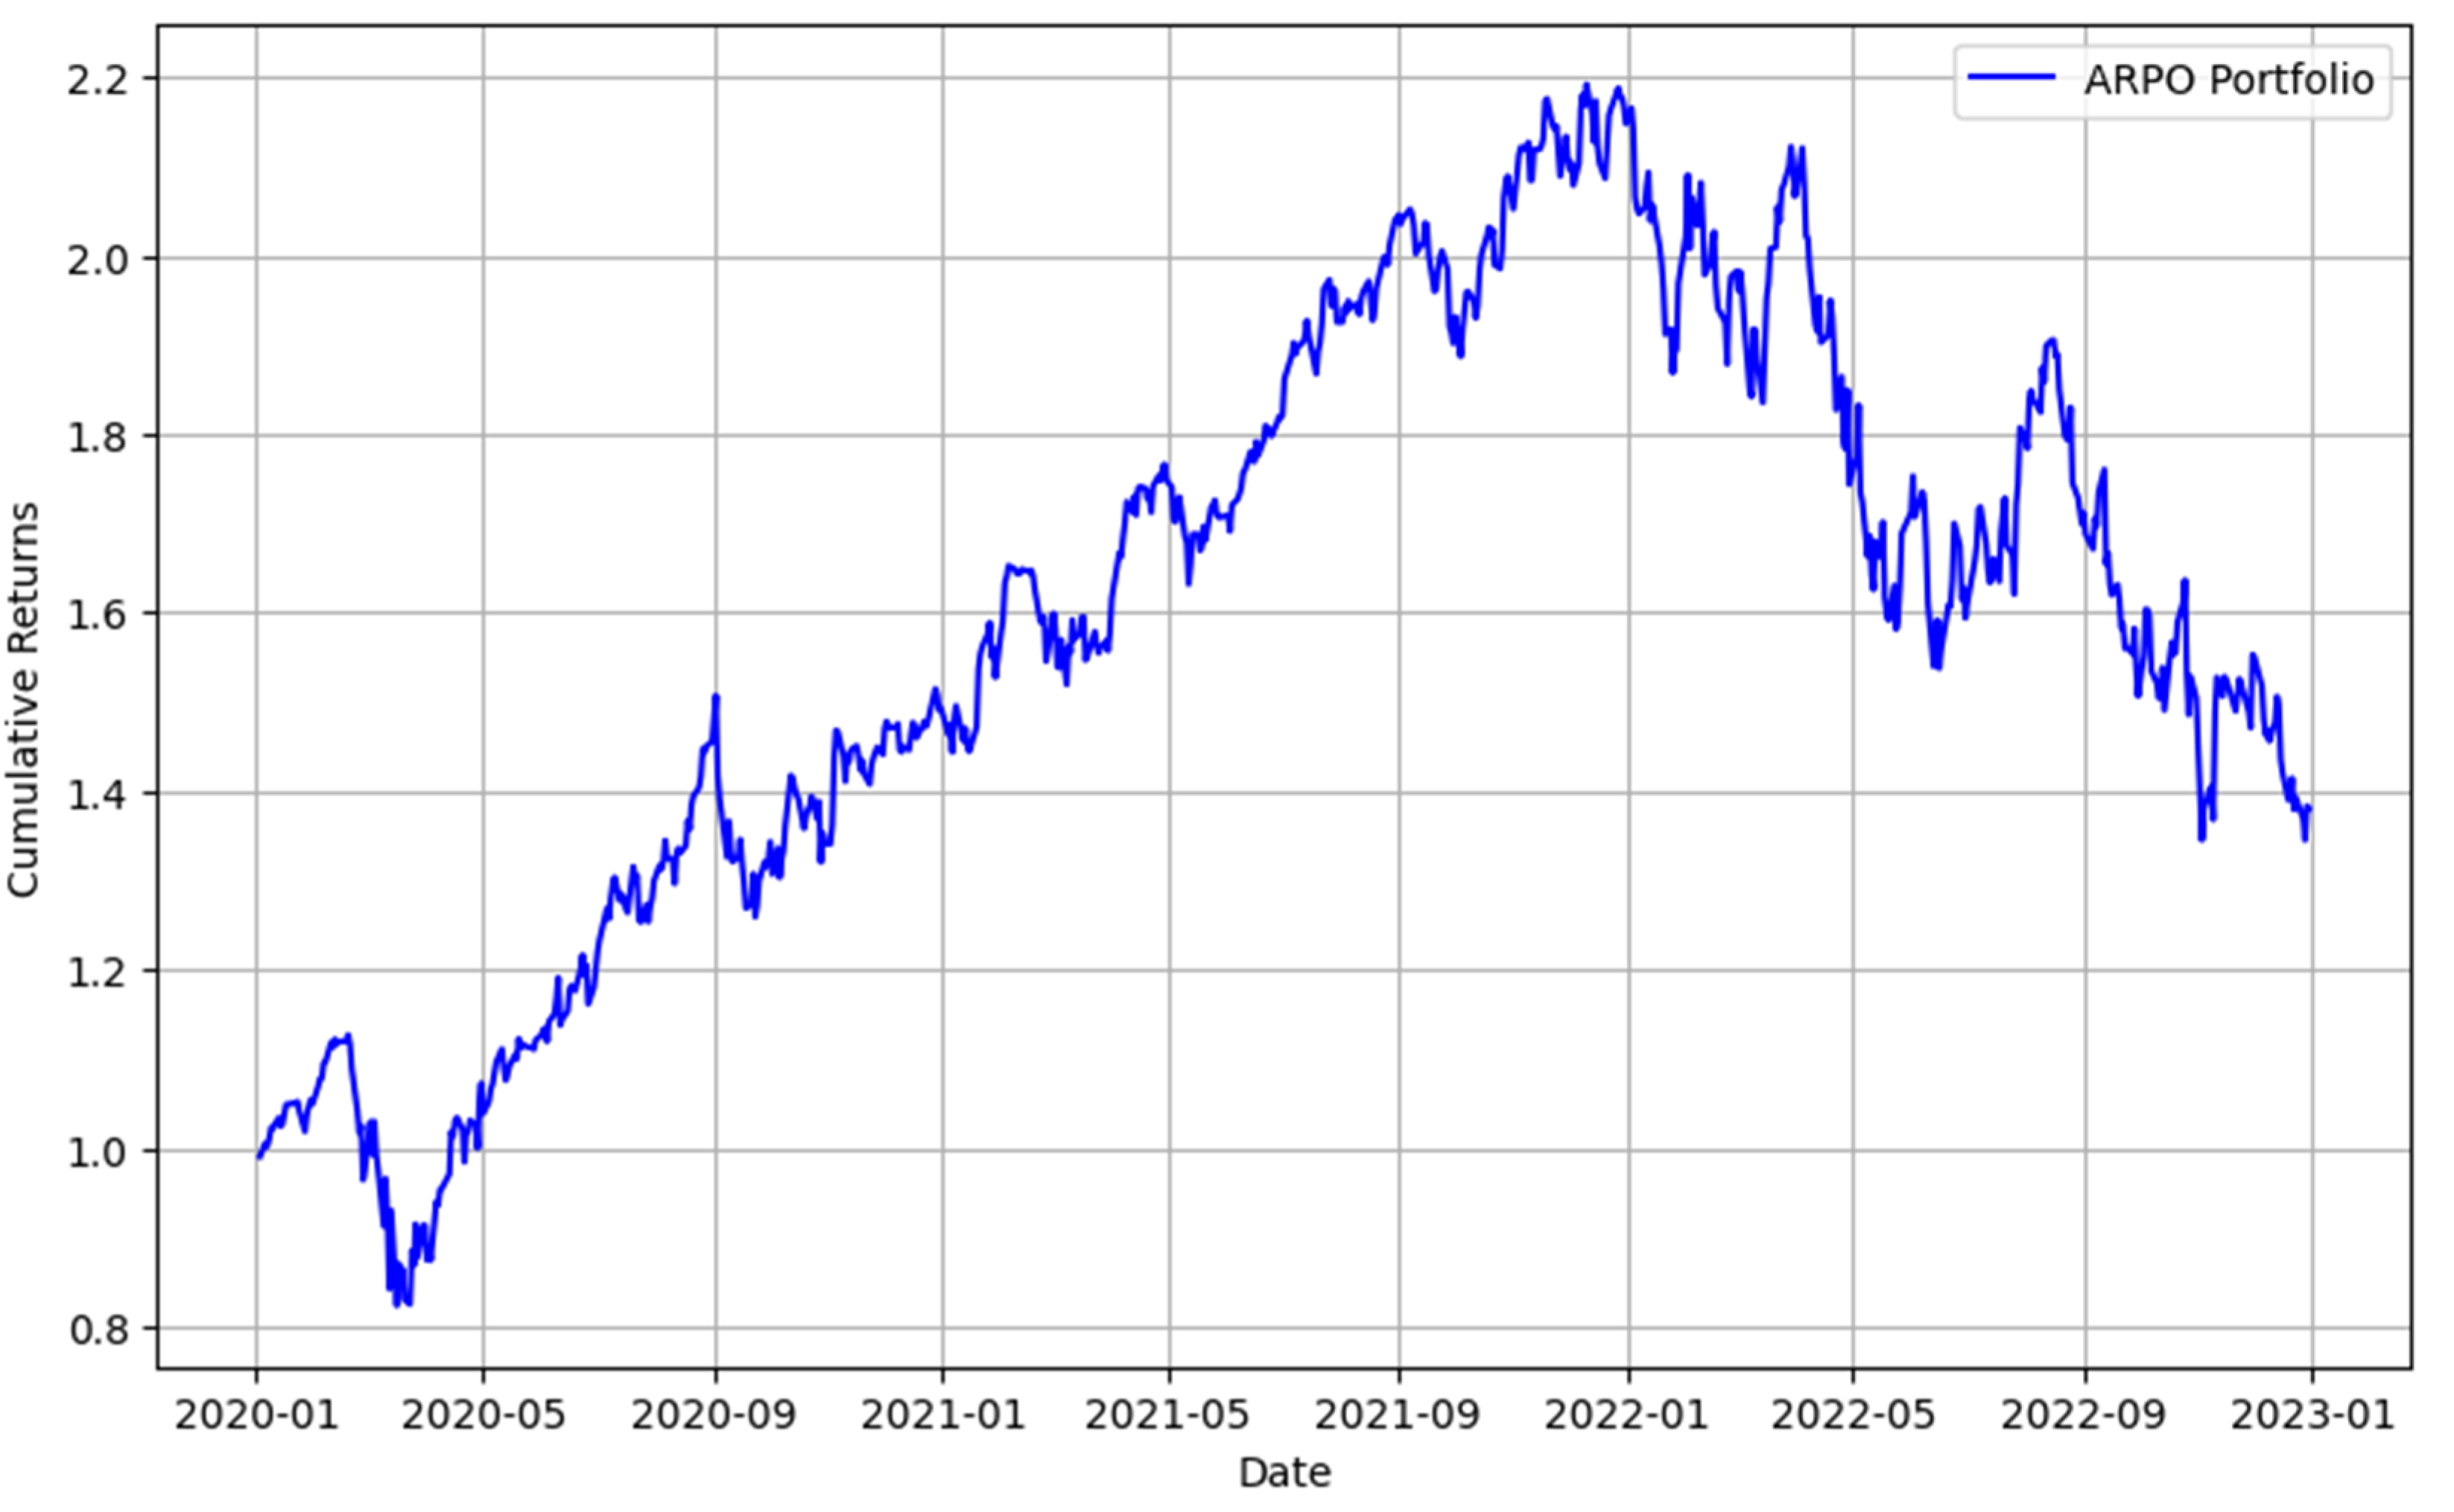
Figure 2.
Sharpe Ratio Trends Over Time for ARPO, Risk-Parity, and Minimum Variance Portfolios.
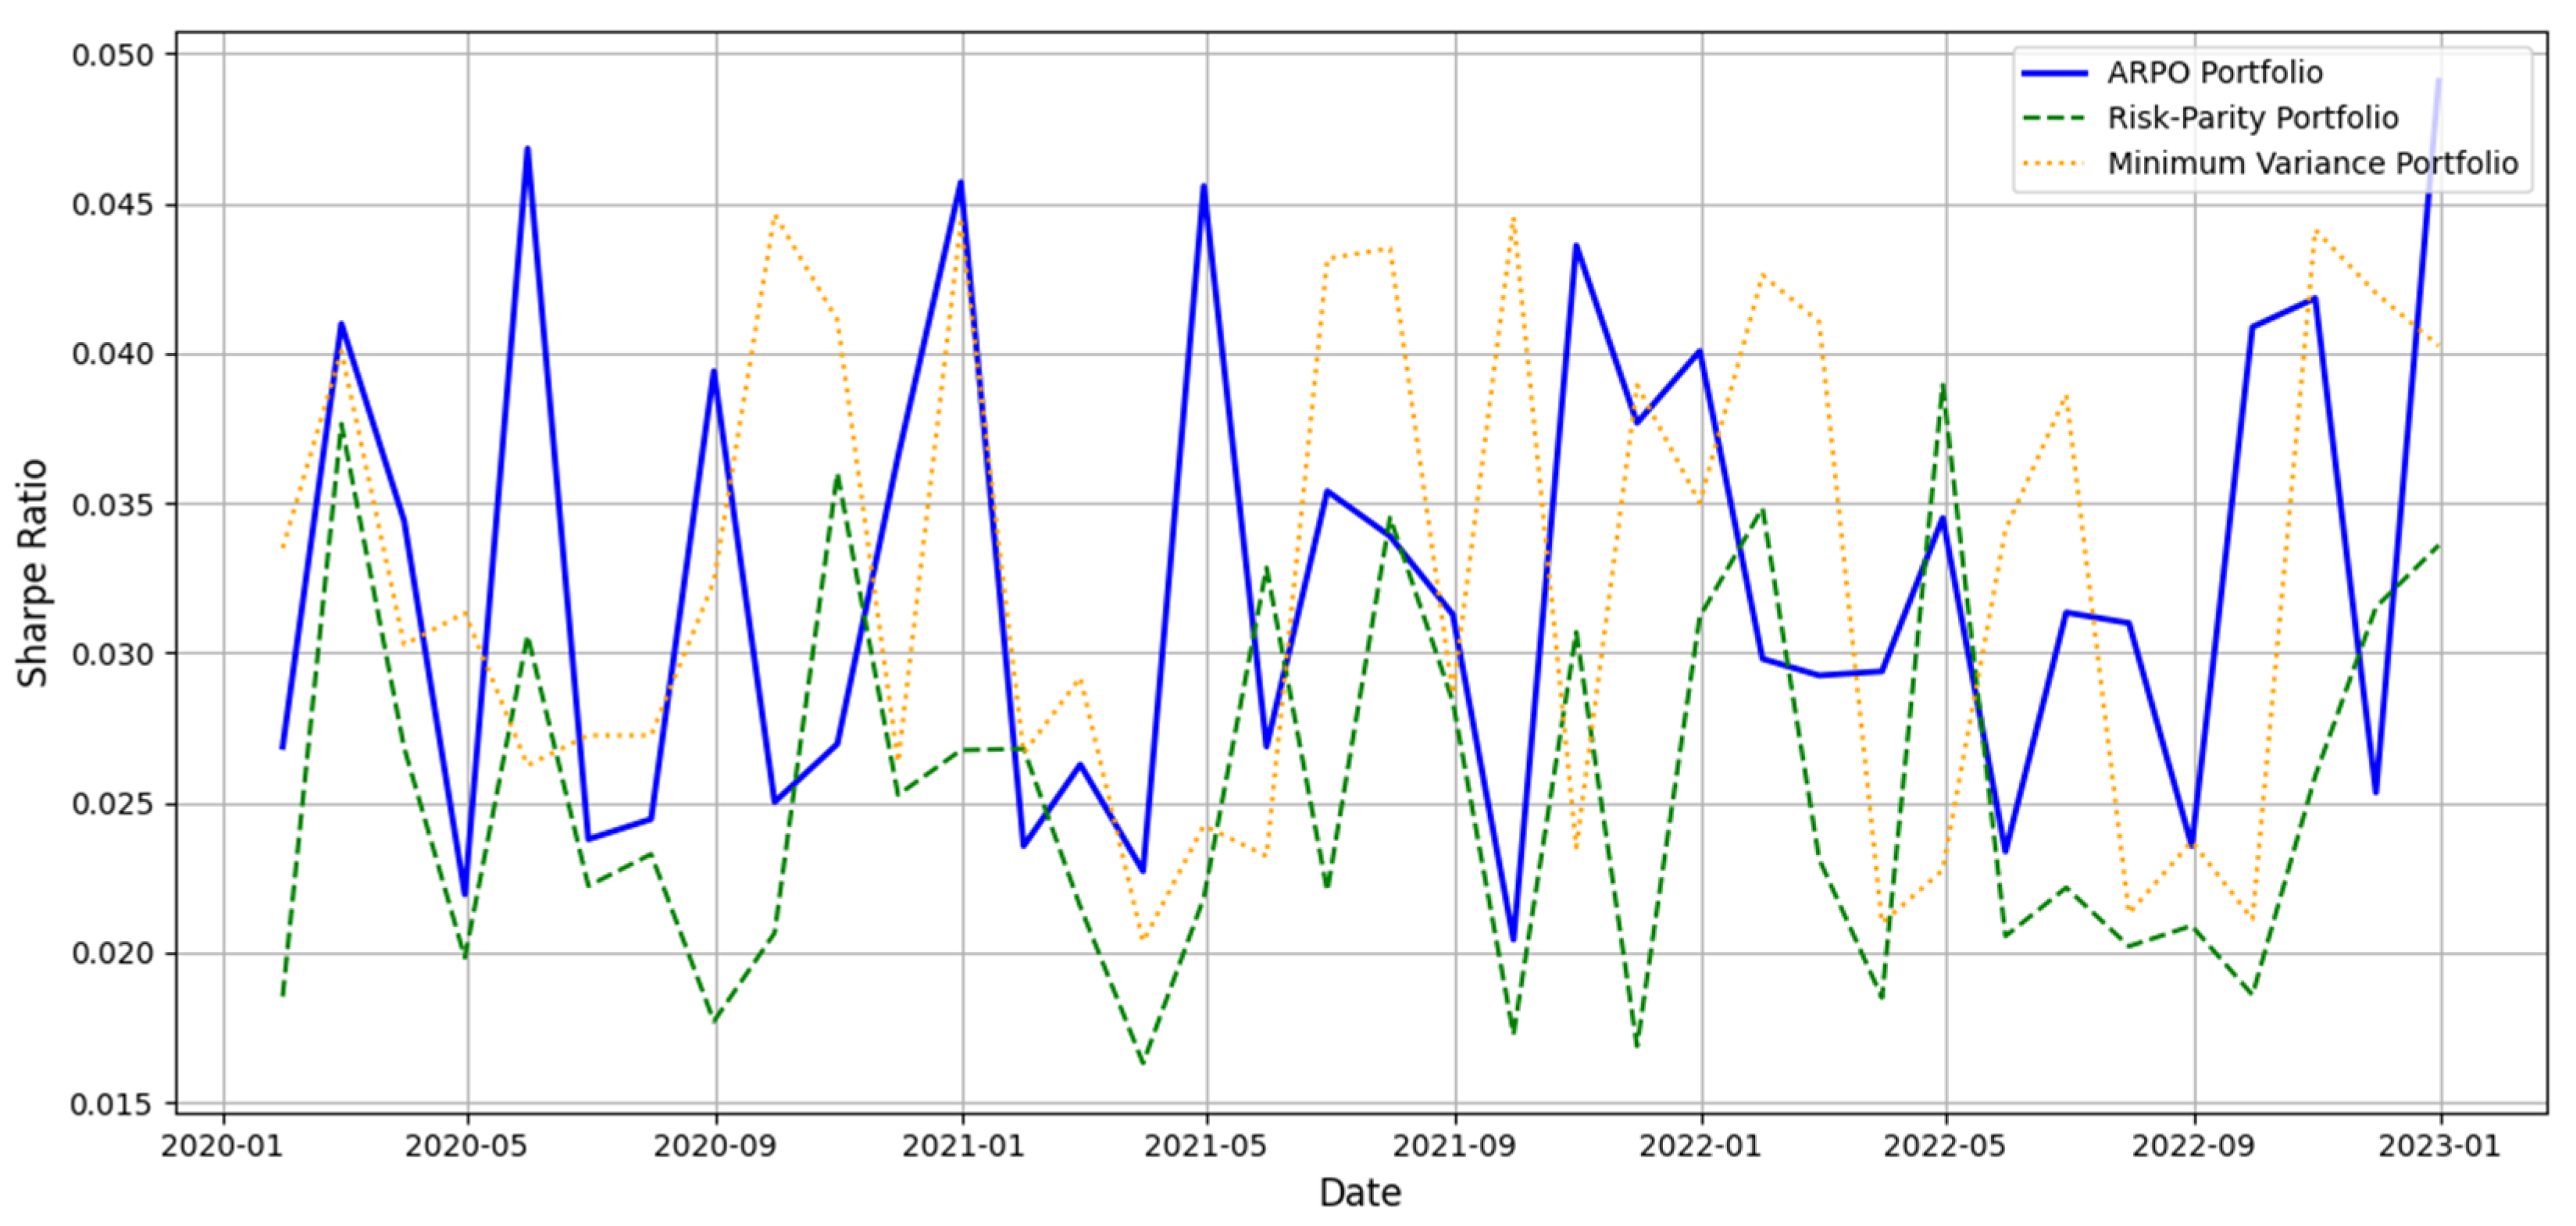
Figure 3.
Cumulative Returns Comparison.
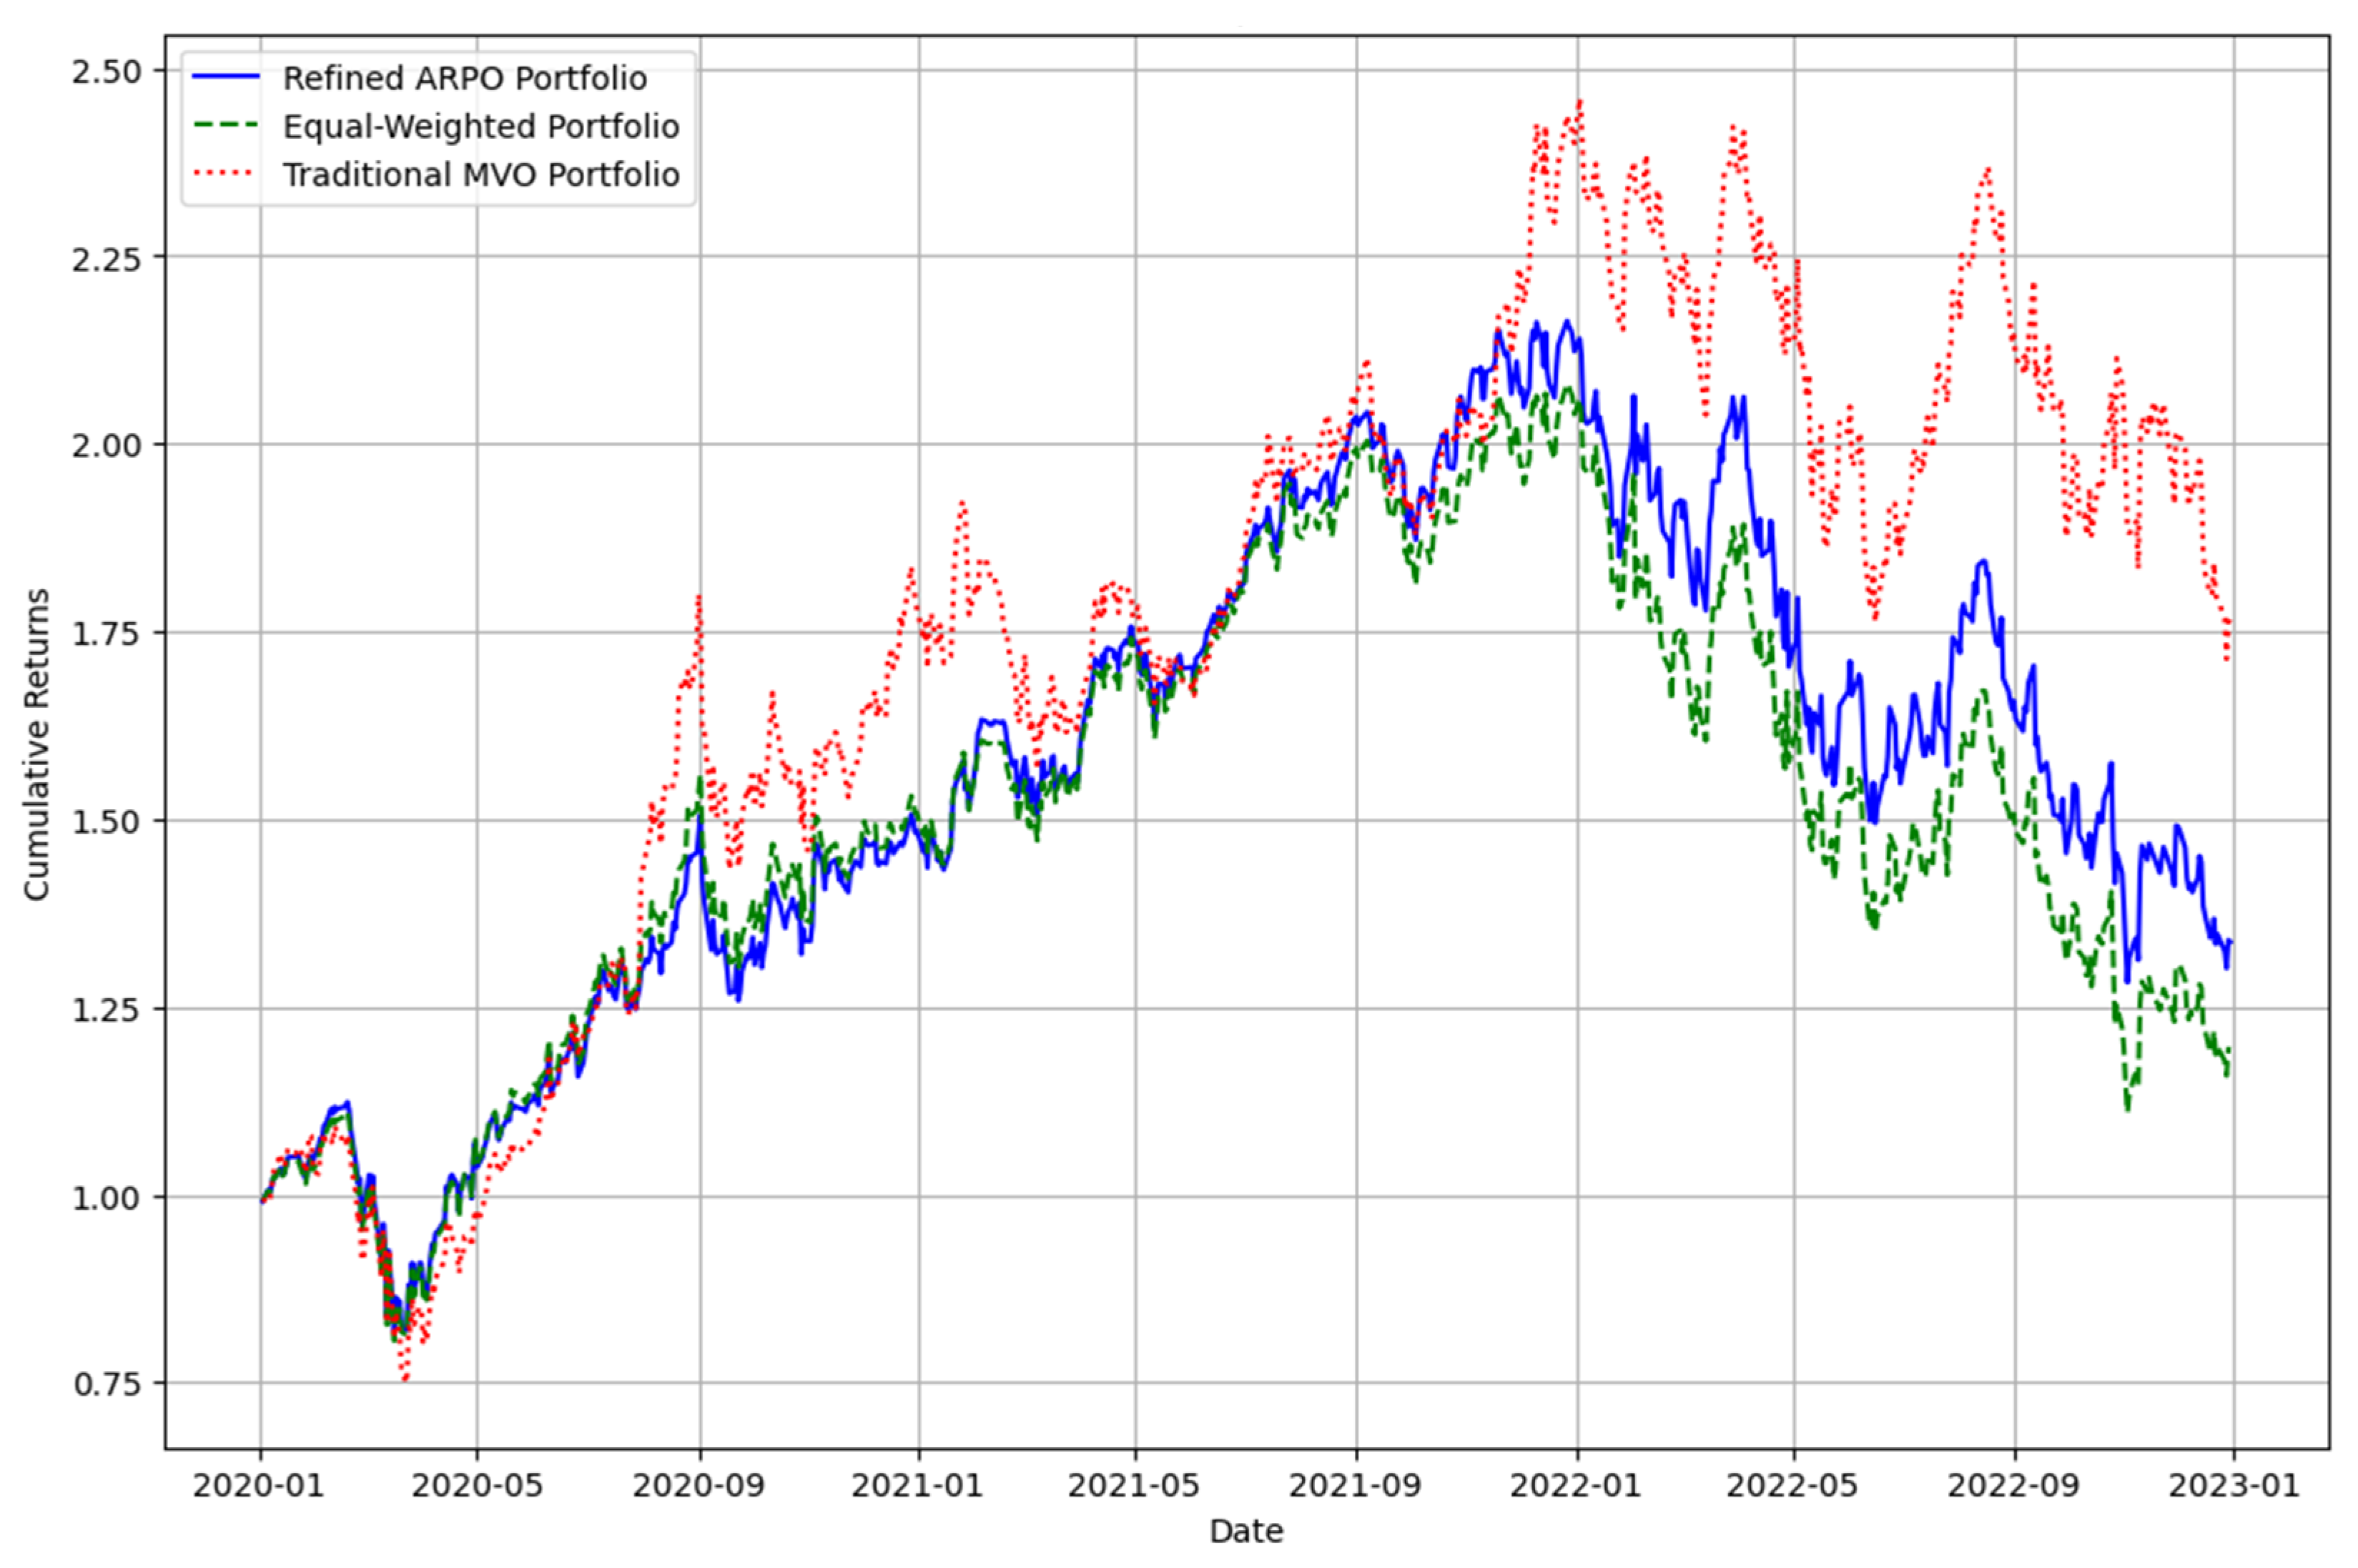
Figure 4.
Cumulative Returns Comparison (Enhanced Portfolio).
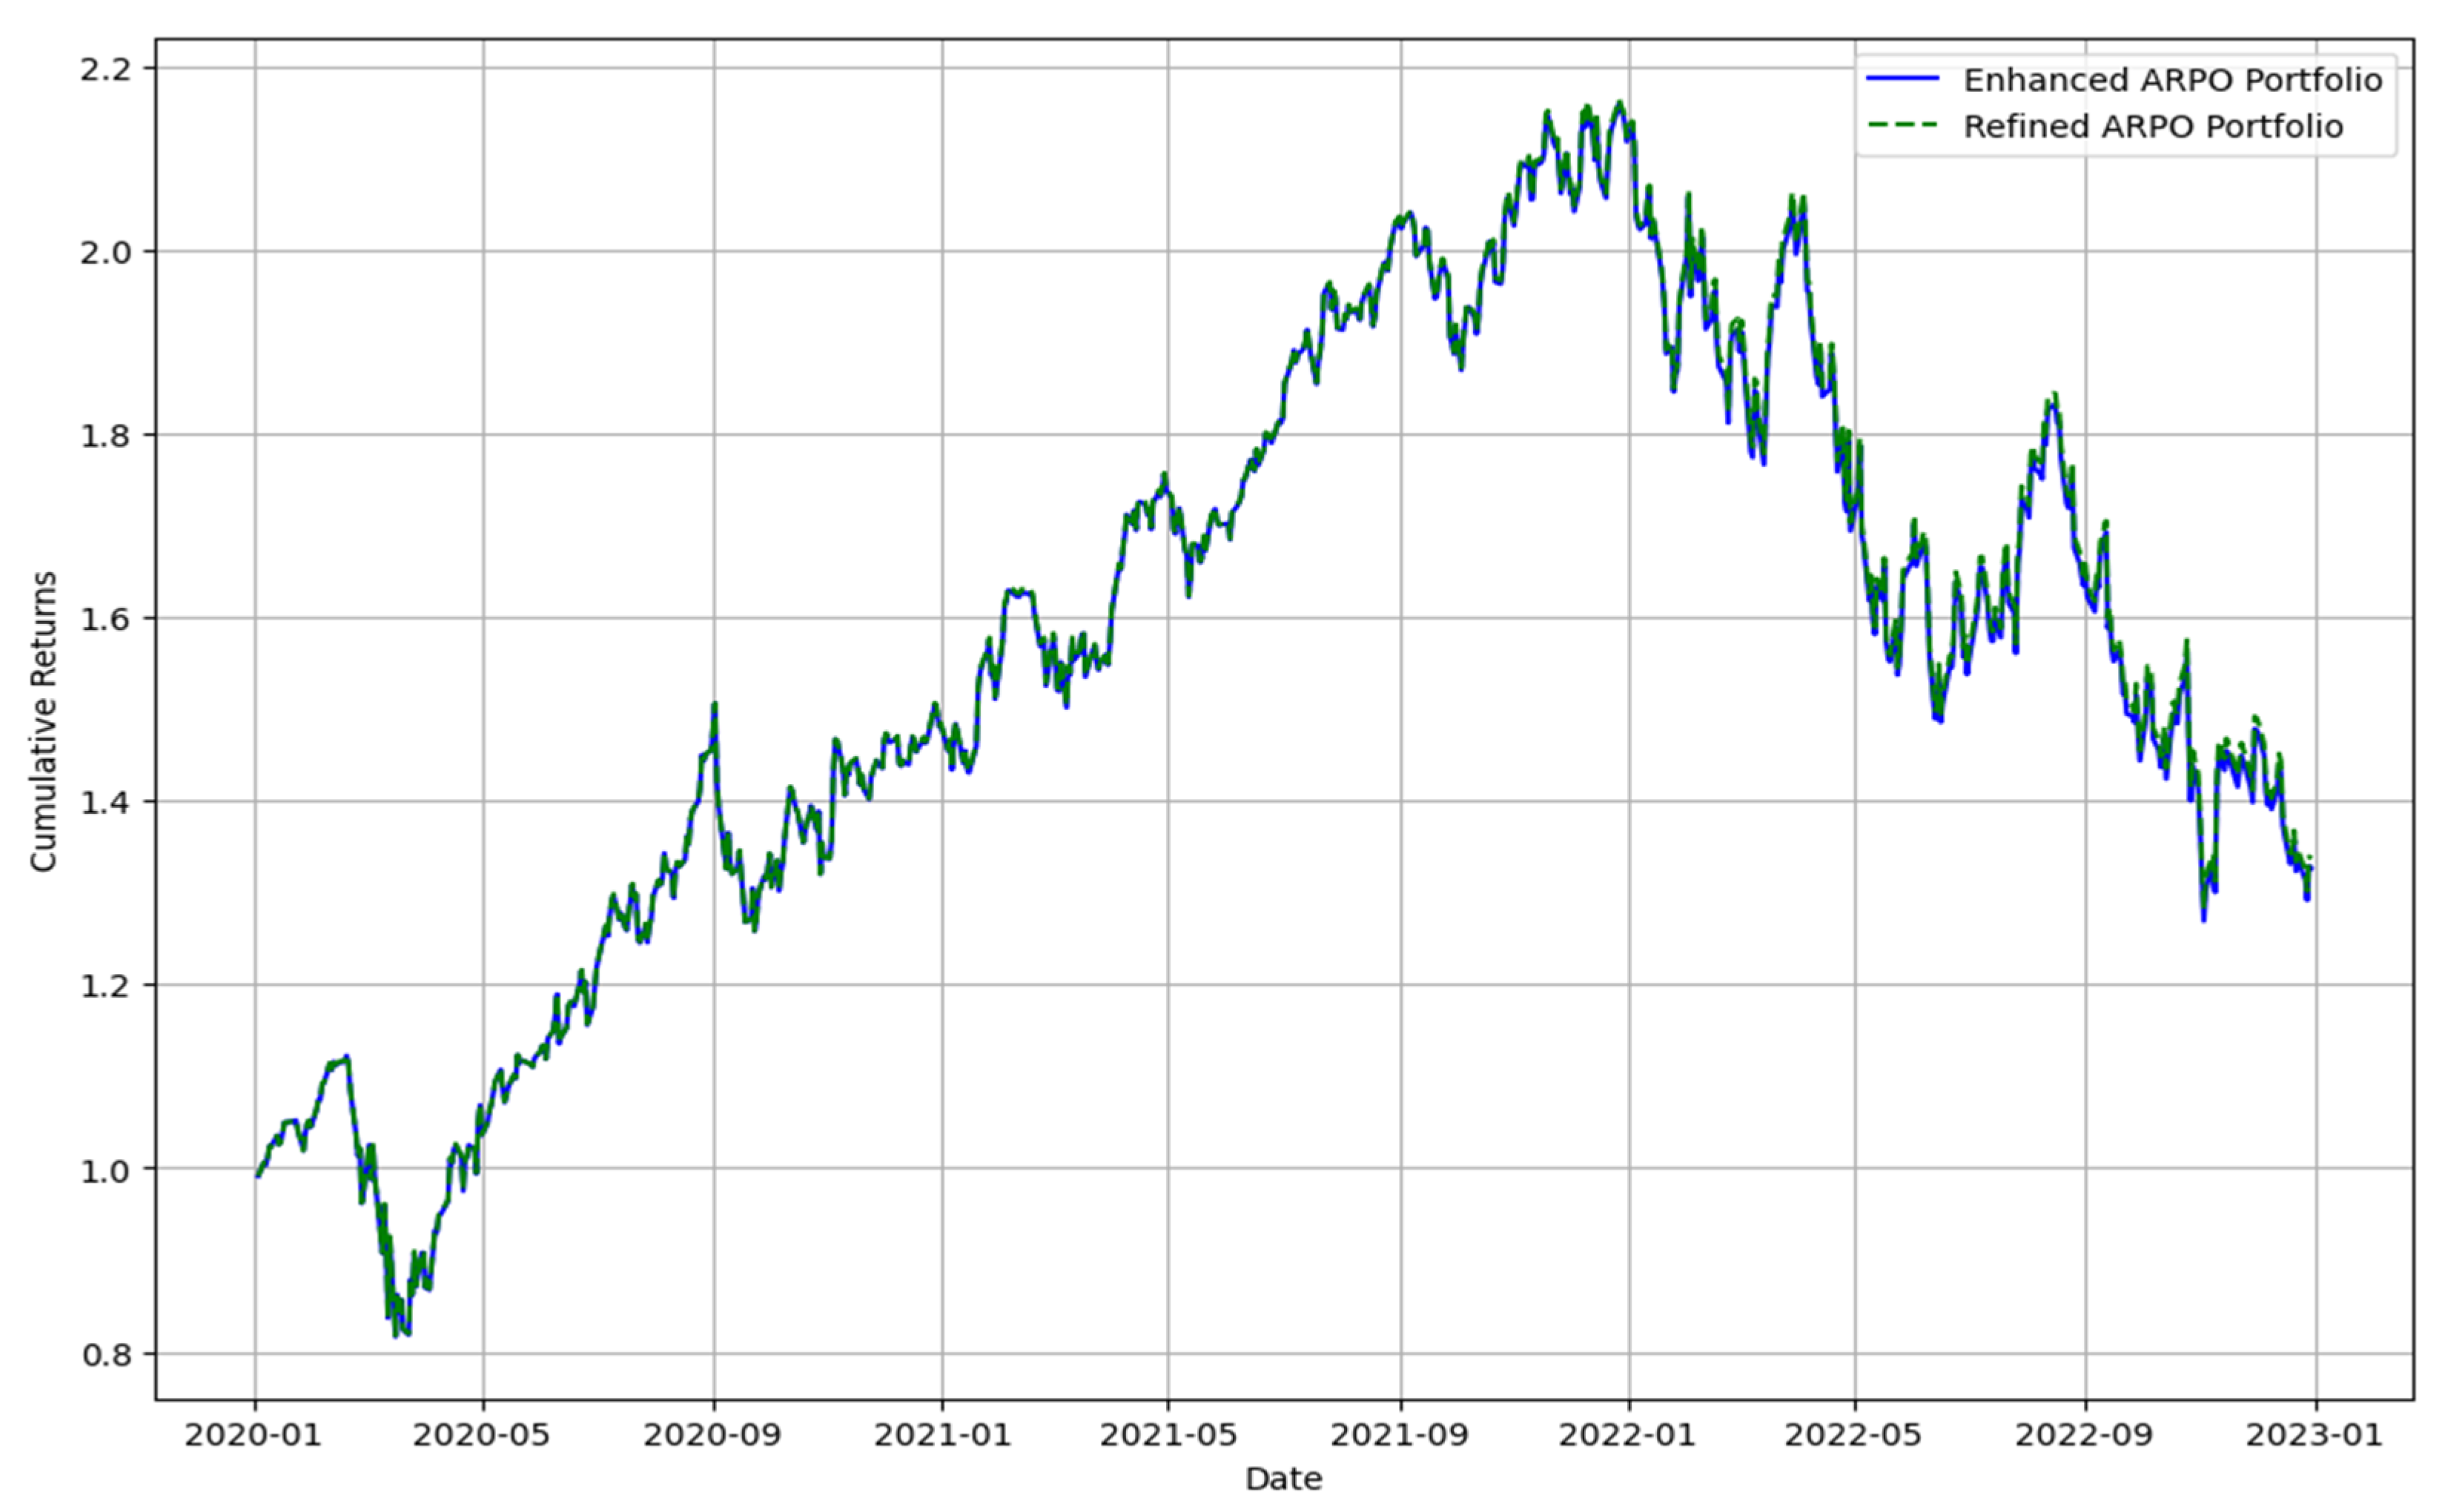
Figure 5.
Drawdowns of Enhanced ARPO Portfolio.
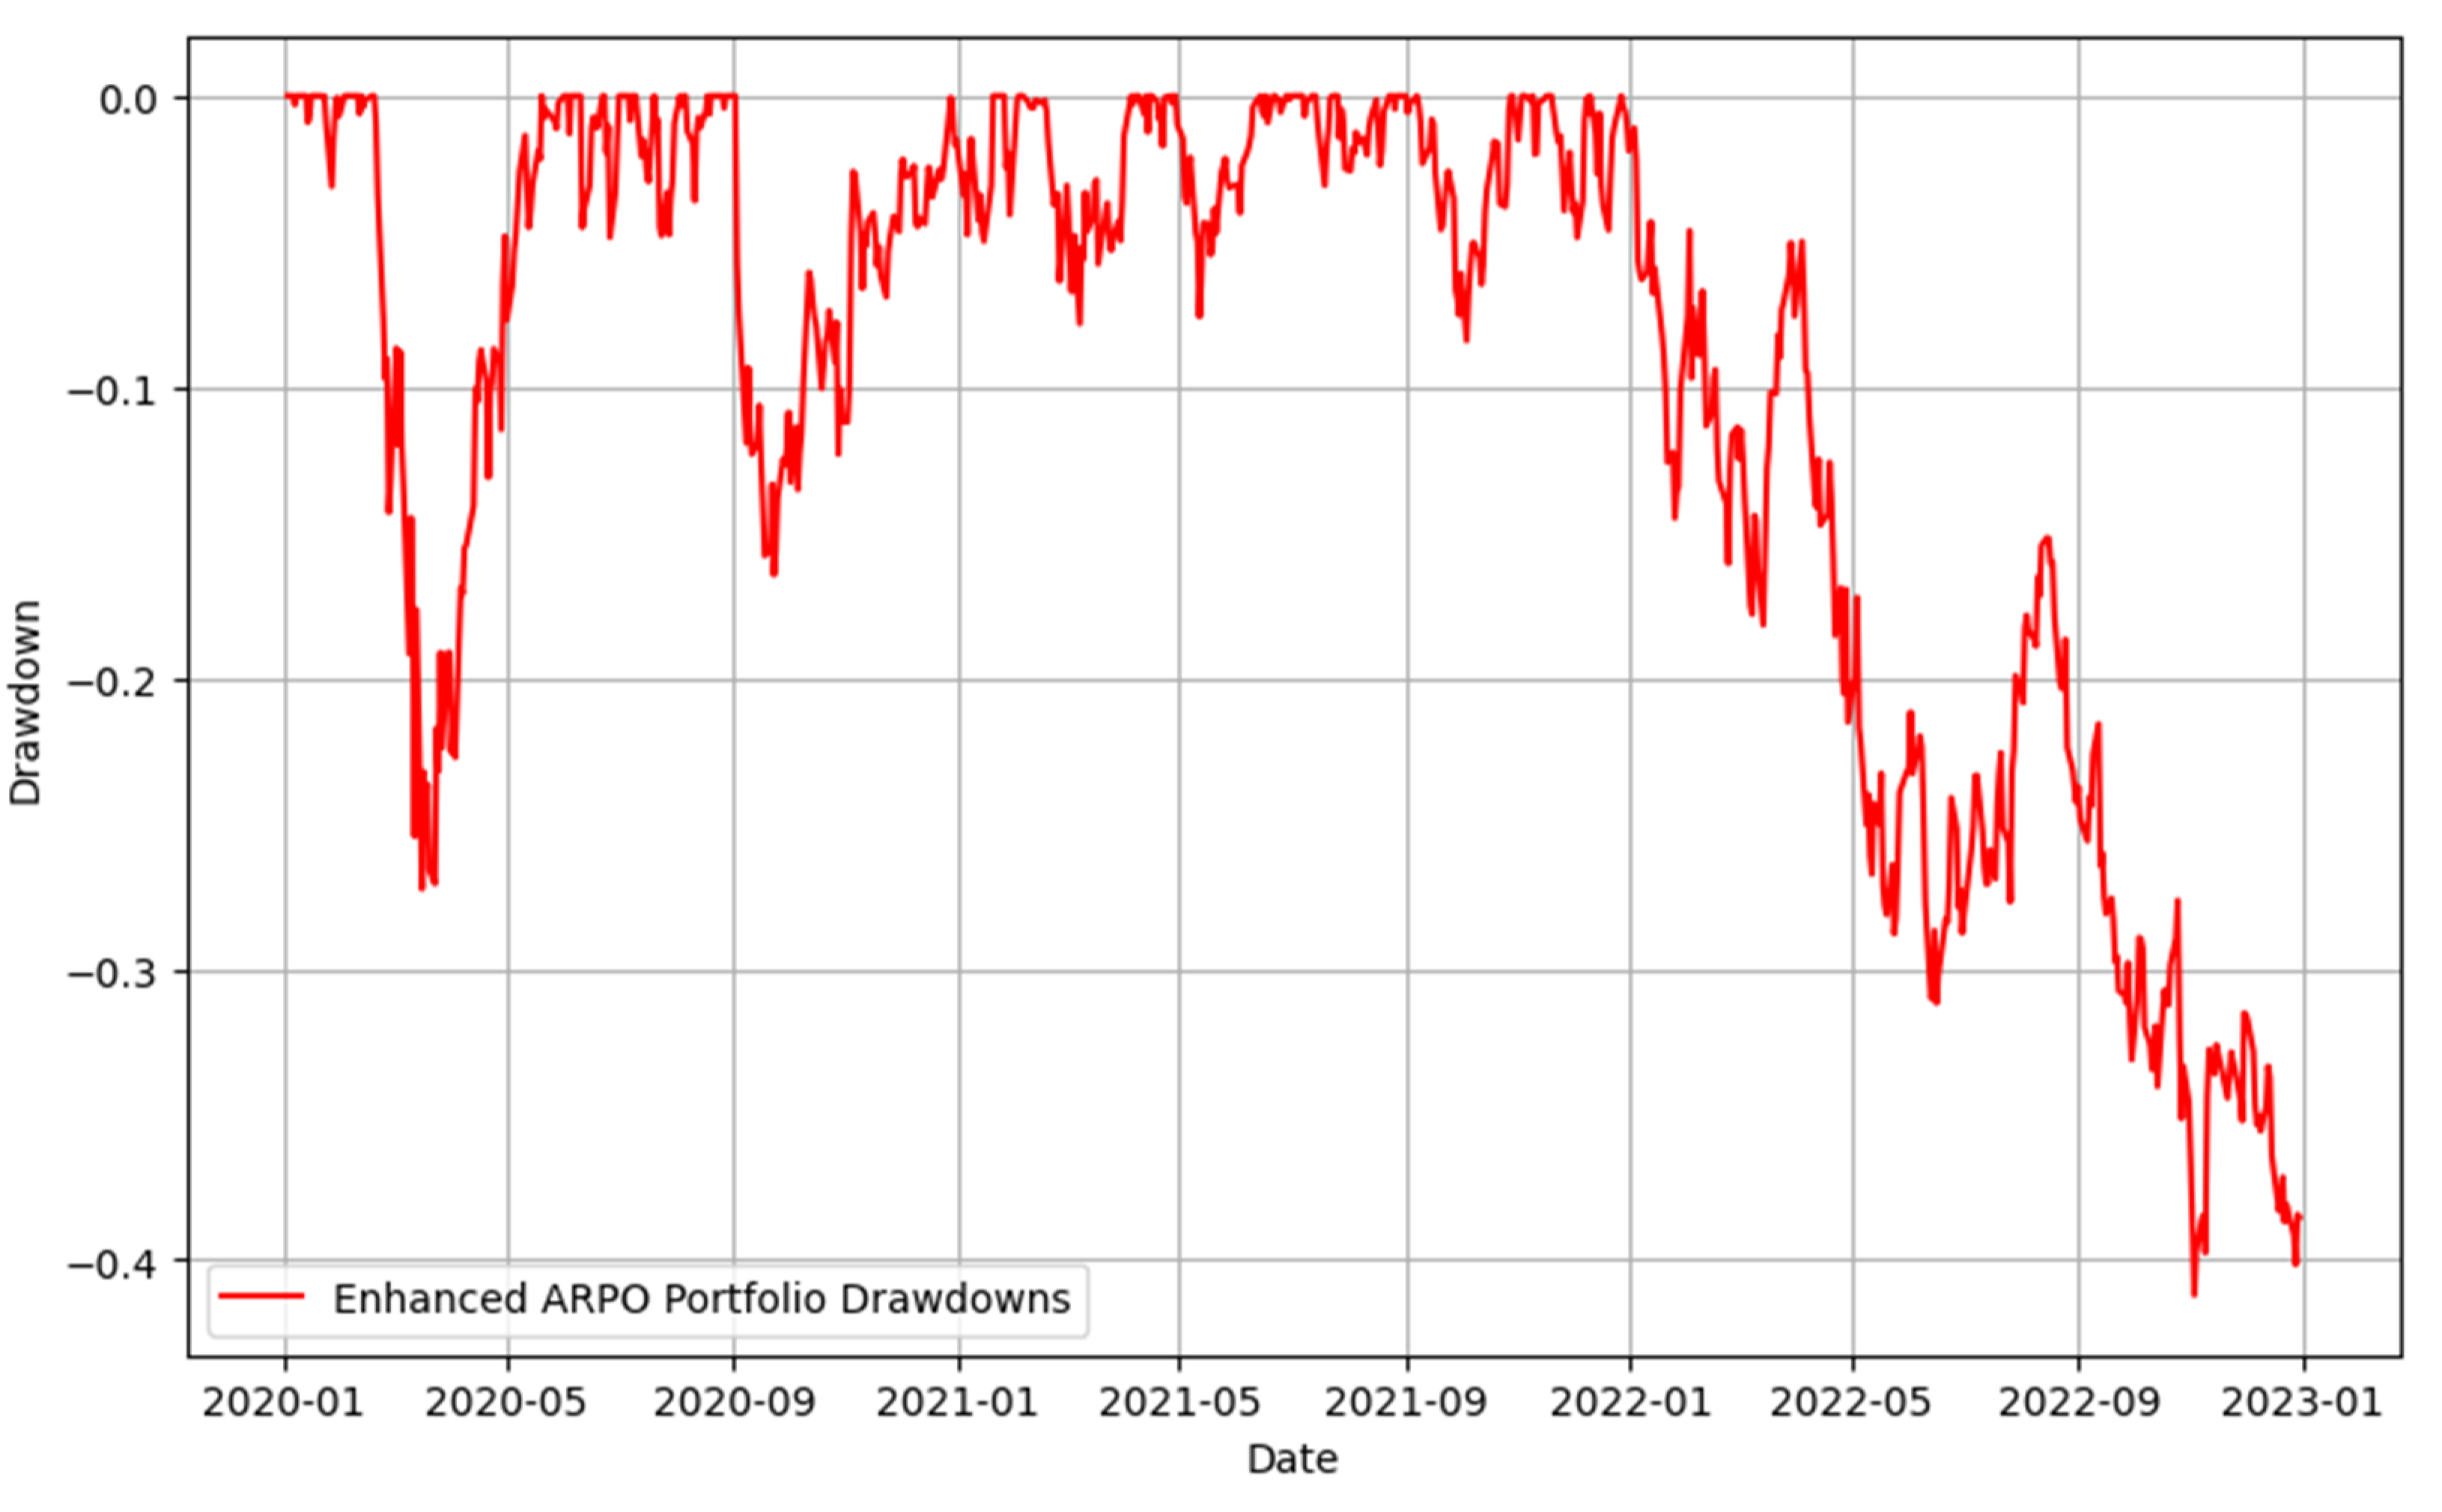
Figure 6.
Cumulative Performance of Portfolio Strategies Over Time.
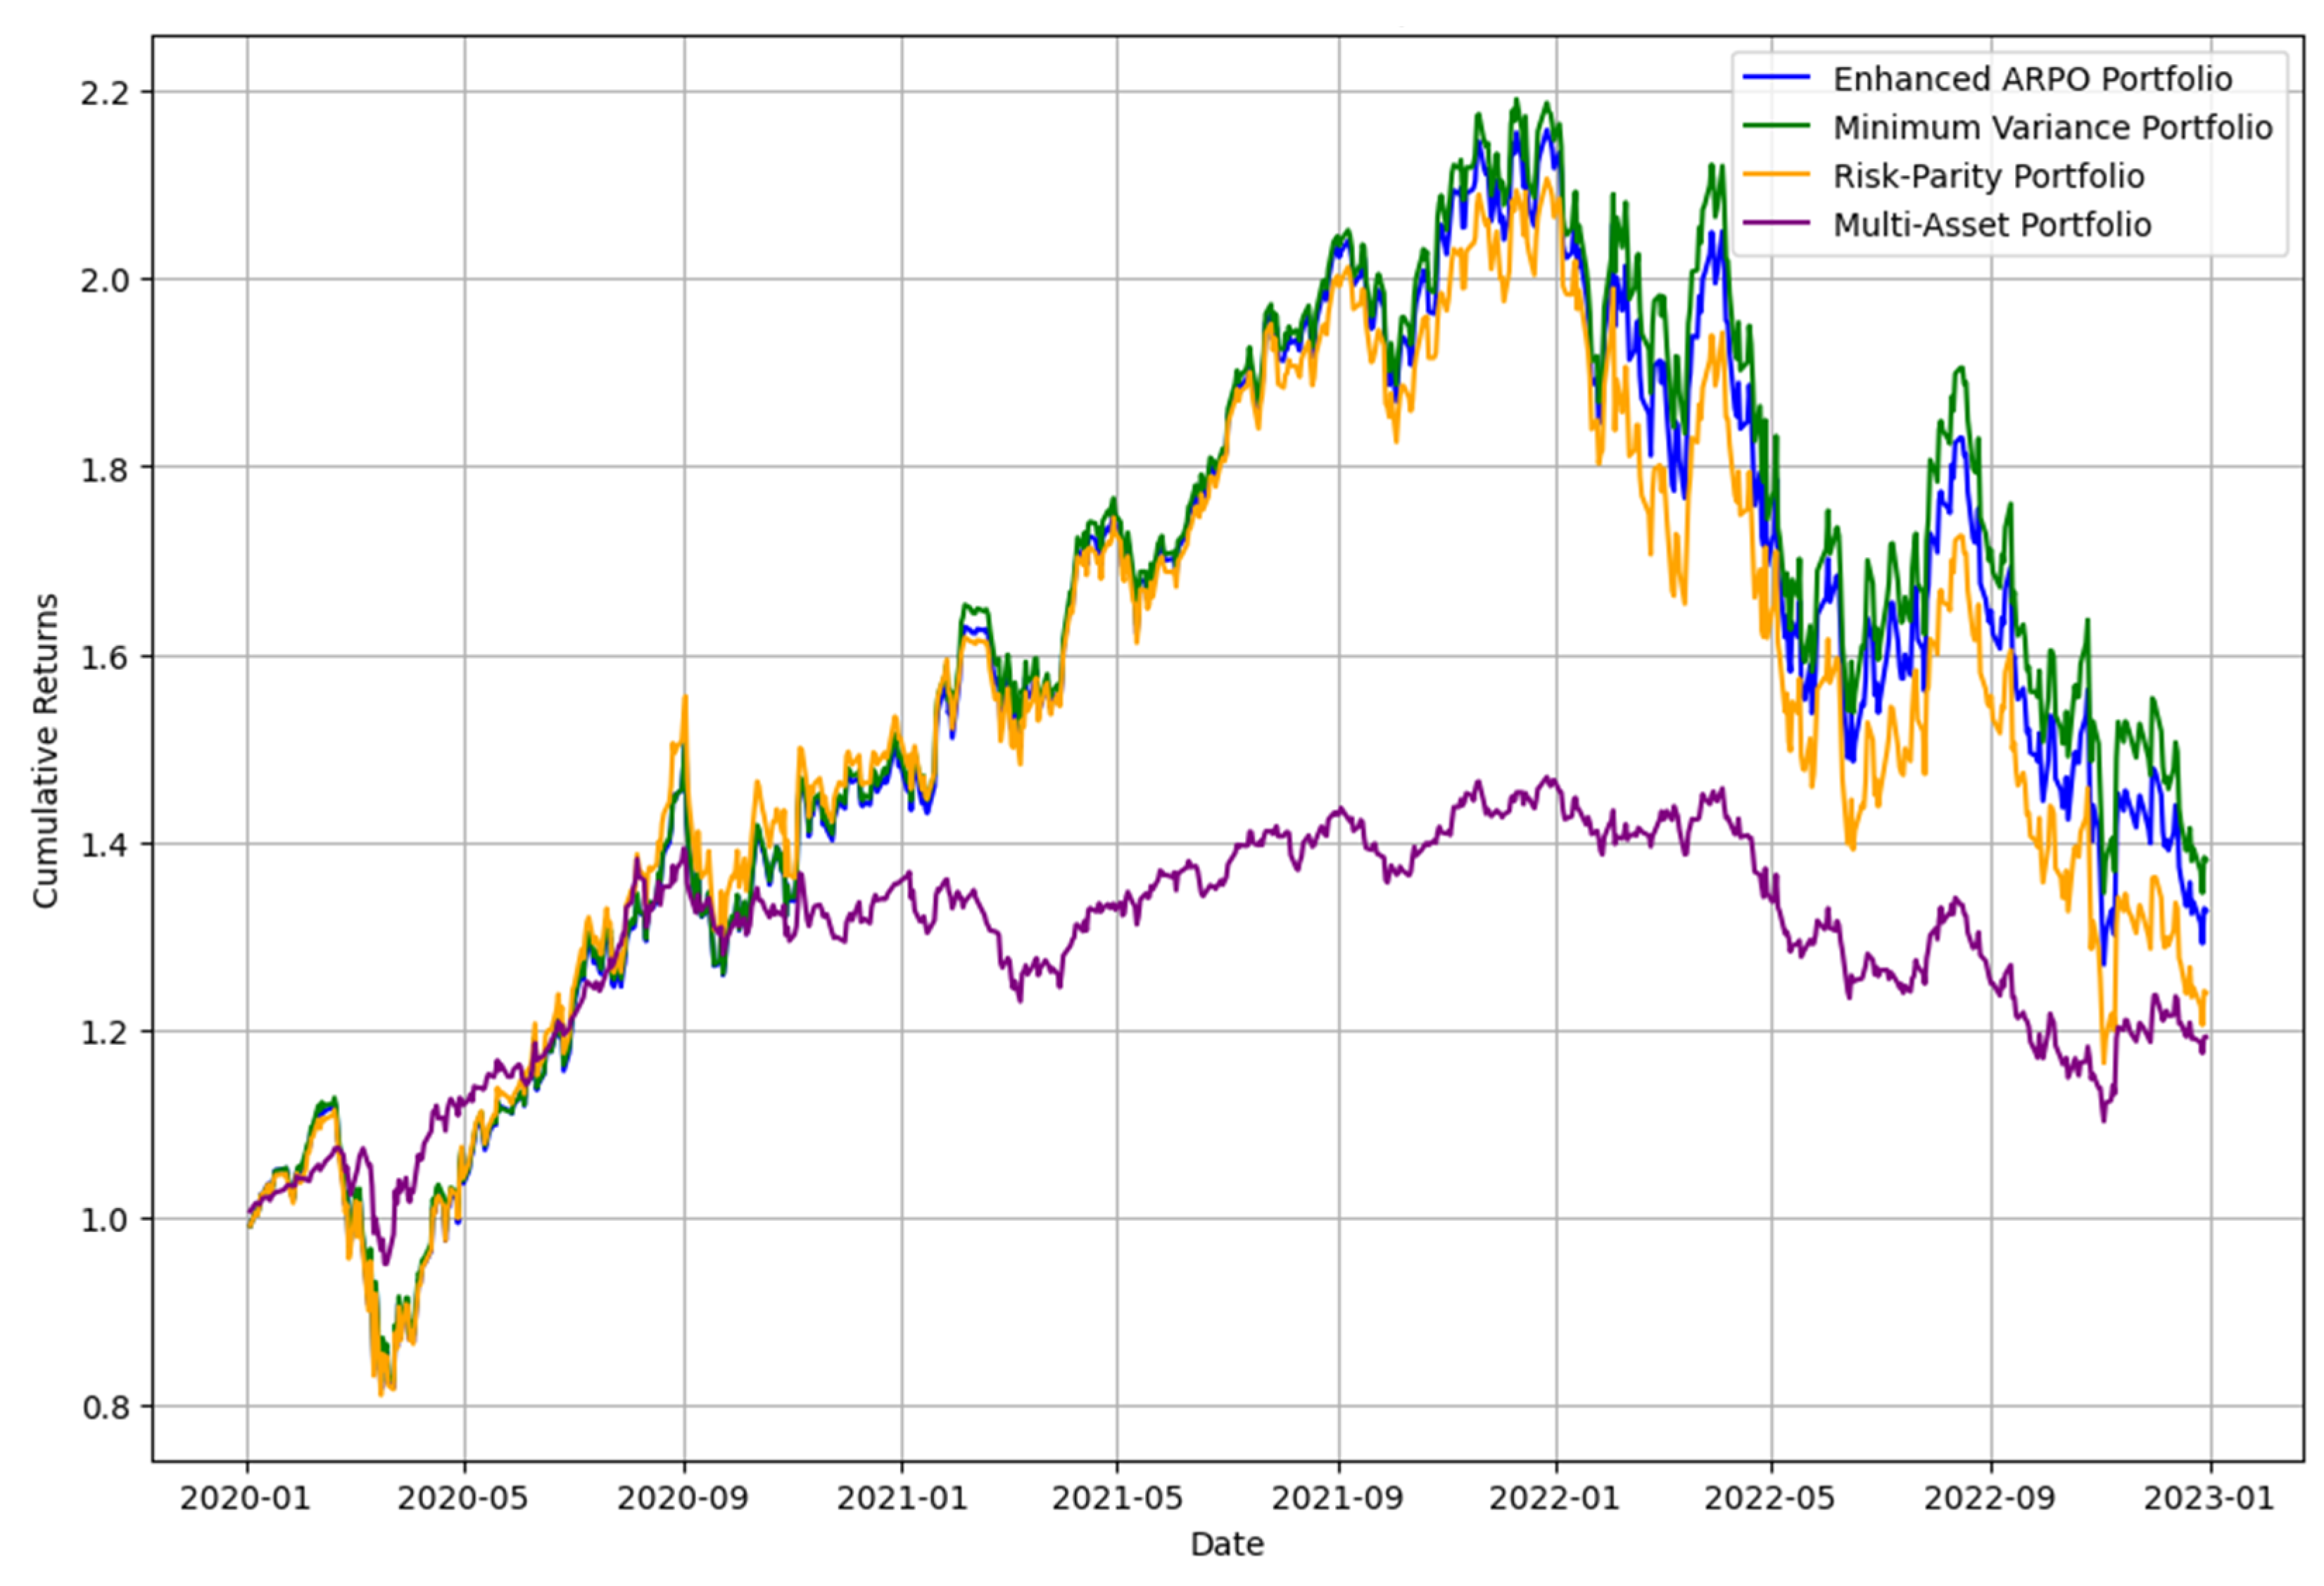

Table 1.
Forecasted Volatilities.
| Ticker | Forecasted Volatility |
|---|---|
| AAPL | 0.000466 |
| AMZN | 0.000514 |
| GOOGL | 0.000404 |
| META | 0.000746 |
| MSFT | 0.000321 |
Table 2.
Risk-Aversion Sensitivity.
| Risk Aversion | AAPL | MSFT | GOOGL | AMZN | META |
| 1 | 19.45% | 18.44% | 39.17% | ~0.00% | 22.93% |
| 5 | 19.45% | 18.44% | 39.17% | ~0.00% | 22.93% |
| 10 | 19.45% | 18.44% | 39.17% | ~0.00% | 22.93% |
| 20 | 19.45% | 18.44% | 39.17% | ~0.00% | 22.93% |
Table 3.
Portfolio Weights.
| Portfolio | AAPL | MSFT | GOOGL | AMZN | META |
|---|---|---|---|---|---|
| ARPO Portfolio | 19.45% | 18.44% | 39.17% | ~0.00% | 22.93% |
| Refined ARPO Portfolio | 18.41% | 17.22% | 36.38% | 5.00% | 22.99% |
| Enhanced ARPO Portfolio | 18.21% | 17.03% | 35.98% | 6.04% | 22.74% |
| Risk-Parity Portfolio | 20.68% | 19.54% | 22.12% | 15.67% | 21.98% |
| Minimum Variance Portfolio | 19.45% | 18.44% | 39.17% | ~0.00% | 22.93% |
Table 4.
Comparison of Risk-Adjusted Returns Across Portfolios.
| Portfolio | Avg Return | Volatility | Sharpe Ratio |
|---|---|---|---|
| ARPO Portfolio | 0.0006 | 0.0204 | 0.0312 |
| Refined ARPO Portfolio | 0.0006 | 0.0205 | 0.0290 |
| Enhanced ARPO Portfolio | 0.0006 | 0.0205 | 0.0285 |
| Risk-Parity Portfolio | 0.0005 | 0.0210 | 0.0241 |
| Minimum Variance Portfolio | 0.0006 | 0.0204 | 0.0312 |
Table 5.
Statistical Comparison of ARPO Model Performance Against Benchmarks.
| Portfolio Comparison | t-Statistic | p-Value |
|---|---|---|
| ARPO vs Risk Parity | -3.272 | 0.031 |
| ARPO vs Minimum Variance | 2.447 | 0.070 |
Table 6.
Multi-Asset Portfolio Weights.
| Ticker | Weight |
|---|---|
| AAPL | 12.56% |
| MSFT | 5.00% |
| GOOGL | 50.00% |
| AMZN | 5.00% |
| META | 5.00% |
| TLT (Bonds) | 5.00% |
| GLD (Gold) | 17.44% |
Table 7.
Multi-Asset Portfolio Metrics.
| Metric | Value |
|---|---|
| Average Daily Return | 0.000621 |
| Volatility | 0.010457 |
| Sharpe Ratio | 0.059339 |
Disclaimer/Publisher’s Note: The statements, opinions and data contained in all publications are solely those of the individual author(s) and contributor(s) and not of MDPI and/or the editor(s). MDPI and/or the editor(s) disclaim responsibility for any injury to people or property resulting from any ideas, methods, instructions or products referred to in the content. |
© 2025 by the authors. Licensee MDPI, Basel, Switzerland. This article is an open access article distributed under the terms and conditions of the Creative Commons Attribution (CC BY) license (http://creativecommons.org/licenses/by/4.0/).
Copyright: This open access article is published under a Creative Commons CC BY 4.0 license, which permit the free download, distribution, and reuse, provided that the author and preprint are cited in any reuse.


