
Submitted:
03 April 2025
Posted:
04 April 2025
You are already at the latest version
Abstract
A one-dimensional plug-flow reactor modeling procedure was developed and used to investigate the performance of a membrane reactor (MR) for hydrogen separation from syngas. A feed syngas enters from one side, while a sweep gas of nitrogen enters from the opposite side. The model treats the membrane reactor as a series of 200 segments with a constant cross section and temperature. The adopted spatial resolution was verified to be accurate based on a conducted resolution sensitivity analysis. Permeation is modeled as happening through thin palladium membranes that are selectively permeable to hydrogen, depending on the temperature and membrane thickness. After analyzing the hydrogen permeation profile in a base case corresponding to reference operational temperature and pressures, the temperature of the module, the retentate-side pressure, and the permeate-side pressure were varied individually and their influence on the permeation performance was investigated. In all the simulation cases, fixed targets of 95% hydrogen recovery and 40% mole-fraction of hydrogen at the permeate exit were demanded. The module length is allowed to change to satisfy these targets, with a shorter module requiring less space and reflecting better hydrogen permeation mass flux. Other dependent permeation-performance variables that were investigated include the logarithmic mean pressure-square-root difference, the hydrogen apparent permeance, and the efficiency factor. Various linear and nonlinear regression models were proposed based on the obtained results. This work gives general insights about hydrogen permeation via palladium membranes.
Keywords:
hydrogen
; palladium
; membrane reactor
; MR
; syngas
1. Introduction
Gasification is a thermos-chemical process in which a carbonaceous solid fuel (such as coal or biomass) is converted into synthetic gas, also known as syngas (Couto et al., 2013; Sarafraz et al., 2019). In other words, gasification is a partial oxidation process consisting of physical processes, such as pyrolysis; and chemical reactions, such as gasification with steam (NETL, 2022). Syngas is a mixture of gases, primarily carbon dioxide and hydrogen, with possible additional impurities such as carbon dioxide, methane, water vapor, and nitrogen (Poudel et al., 2019; Kumar and Aarthi, 2020). Syngas is also produced from natural gas or light crude oil fractions through steam reforming (Talmadge et al., 2013). The molar ratio of molecular hydrogen (H2) to carbon monoxide (CO) increases as the ratio of hydrogen atoms to carbon atoms in the feedstock increases. Thus, ideal steam reforming of carbon gives a molar ratio of H2:CO equal to 1:1, while the ideal steam reforming of natural gas gives a molar ratio of H2:CO equal to 3:1 (Matar et al., 1989).
While syngas by itself is a gaseous fuel that can be used in gas turbines or boilers (Fortunato et al., 2013; Stork, 2022), it is also a feedstock for the production of hydrogen, methanol, and synthetic gasoline (Marco and Carlo, 2015; Ni et al., 2021). Producing hydrogen is of special environmental importance, as it enables production of electricity through fuel cells without the harmful carbon-dioxide emissions (Felseghi et al., 2019). Hydrogen also can be used as an alternative fuel in hydrogen vehicles, leading to reduced greenhouse gas emissions in the transportation sector. ). Separating hydrogen from the syngas increases the concentration of carbon dioxide, thereby facilitating the carbon capture afterwards (Ghiat and Al-Ansari, 2021; Madejski et al., 2022). Carbon dioxide can be captured from syngas, preventing its polluting release to the atmosphere (Dinca et al., 2018). Such captured carbon dioxide may be either stored underground or utilized commercially (Adu et al., 2019). This scenario is classified as a pre-combustion capture, because carbon dioxide is segregated from the fuel stream (syngas in this gas) before it is sent to the combustion facility (OFECM, 2022The two processes (hydrogen separation followed by carbon capture) improve the utilization of syngas.
Hydrogen separation from a hydrogen-containing gas mixture can be accomplished by various methods, including membrane separation (Adhikari and Fernando, 2006). Palladium-based (Pd-based) membranes allow the production of high purity hydrogen (Iulianelli et al., 2014), which is important for effective operation of proton exchange membrane (PEM) fuel cells (Piemonte et al., 2014). Palladium-based membranes are known for selectively separating hydrogen from a gas stream (Peters and Caravella, 2019), which undergoes a dehydrogenation process as hydrogen is removed and passes across the membrane. Compared to the pressure swing adsorption (PSA), where adsorbing the impurities is used for hydrogen purification; membrane purification allows higher hydrogen recovery. Compared to cryogenic distillation, where impurities are condensed at low temperatures for purifying hydrogen; membrane purification is less energy intensive (Vermaak et al., 2021). Membrane-based hydrogen purification here refers to a pressure-driven process, where the selective permeation of hydrogen through the thin membrane is stimulated by a difference in the partial pressure of hydrogen as it is transferred from the retentate side (where hydrogen has a higher partial pressure) to the permeate side (where hydrogen has a lower partial pressure).
This work considers hypothetical membranes that are unsupported (bulk), relatively-thick, dense (non-porous) palladium foils (Alique et al., 2018) for hydrogen separation. The mechanism of permeation through the membrane involves dissociation of molecular hydrogen at the surface of the palladium membrane as hydrogen atoms, which then diffuse into the palladium membrane (Oh et al., 2020). An isothermal (thus, having a uniform temperature) hydrogen separation module is adopted here. The spatial variation of the chemical composition of the permeate stream and retentate stream is modeled numerically as a plug-flow reactor. The permeation performance is examined under a reference set of representative conditions, as well as when each of three control (design) variables is changed from the reference (base) case. These control variables are: (1) the reactor temperature, (2) the retentate-side pressure, and (3) the permeate-side pressure. The study is based on computational modeling using principles in membrane-based hydrogen permeation.
In the next section, the research method is described. Then, details about the geometric and inlet parameters are provided. Most of these settings remain fixed throughout the entire study. Then, the modeling procedure is described for the hydrogen permeation in the reactor. After this, five quantitative scalar quantities are introduced as criteria for evaluating the overall permeation performance. This is followed by presentation of results for a base case, combined with a discretization-sensitivity analysis that confirms the adequacy of the spatial resolution utilized. Then, the influence of three control variables is explored, with some regression models relating the value of each control variable to the five permeation metrics of the hydrogen permeation. Finally, concluding remarks are provided.
The contribution of this work to the fields of energy systems, computational modeling, hydrogen production, and carbon capture includes:
- Presenting a simple plug-flow reactor computational model for the membrane-based hydrogen separation, which takes a short time to give rough predictions as a precursor of time-consuming three-dimensional computational fluid dynamics (CFD) models. The simple plug-flow reactor model can be automated using spreadsheet software without the resorting to complicated computer programming or expensive software packages. It was checked for accuracy in terms of spatial resolution, and it passed successfully a resolution-independence test.
- Providing results of a representative case of hydrogen separation out of a feedstock flow of pressurized syngas, giving insights about the distribution of the permeation flux along the unit, when 95% hydrogen recovery is attained
- Demonstrating examples of consolidated metrics for comparing and judging the permeation performance of hydrogen. This can guide researchers when analyzing or interpreting similar problems.
- Showing the impact of three different design variables on the hydrogen permeation performance, accompanied by good-fit regression models. This step helps in having a broad estimation of the advantage of manipulating each of these variable, which can be weighed against the expenses or practical difficulty in a realistic setting, thus helps in selecting optimum operational conditions.
- Facilitating the validation of computational fluid dynamics (CFD) models for membrane reactors, by making available necessary details about geometric, inlet, and mass transport conditions with results from a plug-flow reactor model. While the CFD results may not agree perfectly with the presented plug-flow reactor results (due the additional complexity in the CFD models), the results of the plug-flow reactor model can still guide a researcher or modeler while validating their CFD models through approximate matching of aggregate scalar quantities or distribution profiles. Although specific cross-section details are not necessary for the performing the plug-flow reactor simulations, an imagined geometric configuration in the form of a shell-and-tube reactor is proposed, making the model upgradable to three-dimensional simulation by the interested reader. The expected high slenderness ratio (length-to-width ratio), lack of turbulators, and symmetry in the model here are advantageous in terms in reducing the gap between the plug-flow reactor performed here, and a three-dimensional CFD model.
2. Research Method
The research conducted here is computational in principle, and it relies on the modeling of hypothetical units for the permeation of hydrogen from a feedstock (feed) gases stream to a destination stream called permeate.
The feed stream is representative of a realistic syngas flow in an integrated gasification combined cycle (IGCC), in which coal is converted into syngas (Krishnana et al., 2009; Berstad et al., 2011; GE, 2022). This syngas drives gas turbines as the first source of power generation, and the heat content in the exhaust gases is partially recovered to produce steam as a working fluid for steam turbines, serving as the second source of power generation (Wang, 2017). An IGCC power plant has an efficiency (with respect to the lower heating value, LHV) of about 48%, which means it has a higher efficiency (10-15% increase) and lower harmful emissions (10-15% reduction) compared to a conventional coal-fired power plant (Mitsubishi, 2022).
The computational modeling is performed through spreadsheets (Microsoft Excel software program), where the mathematical equations governing the hydrogen permeation along the membrane length are implemented as dependent formulas. The built-in tool (Goal Seek) tool in this software was utilized for solving the nonlinear equation relating the unknown membrane length to the specified hydrogen recovery target (95%). Obtaining a solution using this nonlinear solver tool is nearly immediate on a personal computer.
The variables that are subject to change in this work as independent parameters are:
- The temperature of the membrane reactor (while keeping the retentate-side pressure and the permeate-side pressure at reference values of a base case)
- The retentate-side pressure (while keeping the temperature and the permeate-side pressure at reference values of a base case)
- The permeate-side pressure (while keeping the temperature and the retentate-side pressure at reference values of a base case)
For each of the three scenarios listed above, the influence of the isolated design variable on the hydrogen permeation and fluid flow is investigated.
A number of assumptions are made in the present work, which reduces interaction of factors and makes the interpretation of cause-effect dependence more evident. Such assumptions include the uniformity of the temperature, and ignoring the effect of permeation on the pressures.
3. General Model Settings
3.1. Fixing Common Parameters
This section illustrates various elements of the hydrogen separation modeling that remain unchanged for all simulation cases. They may be classified into two groups: (1) geometric parameters, (2) flow parameters. It should be noted that this work is not primarily intended to solve a particular problem or recommend a specific design. Instead, more value is provided through examining variations of permeation parameters when three operational variables are changed. Thus, any reasonable selection of settings is considered satisfactory here to establish a starting design point in the design space.
3.2. Underlying Geometry
All the hydrogen separation modules investigated in this study share the same presumed geometric configuration except the length. The module is in the form of a shell-and-tube reactor, with 8 cylindrical tubes placed inside a cylindrical shell. The sum of the cross-sectional areas of the tubes is 50% of the cross-sectional area of the outer enclosing cylinder, which forms the outer boundaries of the shell. In this work, the term “shell” means the part of the outer enclosing cylinder that remains after subtracting the tubes. Thus, it refers to the passage available for the gaseous stream to flow around the tubes but within the outer enclosing cylinder. This stream is referred to as the (shell stream) or the (retentate). It is the fluid stream where the syngas feedstock enters and loses hydrogen during a dehydrogenation process to the other stream located inside the tubes. The retentate stream entering the shell is referred to as the (feed), which means the raw syngas supplied before any processing by the hydrogen permeation membranes.
The other stream located inside the 8 tubes is the (tubes stream) or the (permeate). It is the destination of the hydrogen that is transported from the retentate through the palladium membranes. At the inlet of the permeate, a non-hydrogen gas of molecular nitrogen (N2) is supplied. This intentionally-added nitrogen is referred to as the (sweep gas) of the (sweep). While the use of such sweep gas is strictly-speaking optional, it helps improve the permeation process by ensuring that the permeate side can never be saturated with hydrogen, and it increases the difference in hydrogen partial pressures across the membrane, leading to an increased hydrogen permeation flux (Barbieri, 2015; Li et al., 2019). The added sweep gas can play another function of controlling the temperature (Chein et al., 2015), but this is not considered here as we assume the membrane reactor to be isothermal for simplicity. Other gases can also be used as a sweep gas, such as argon, Ar (Balachandran et al., 2011); steam, H2O (Chiesa et al., 2013); or helium, He (Brunetti et al., 2017). The use of nitrogen here seems adequate (GTI, 2007; Kinouchi et al., 2012).
Figure 1 shows a proposed cross-section of the membrane reactor, indicating the areas of the 8 tubes (yellow color) and the area of the shell (white color). To obtain more-uniform gaps between walls, one of the tubes is placed exactly at the center of the shell. The remaining 7 tubes are arranged with equal circumferential spacing. It should be mentioned that the plug-flow reactor modelling conducted here utilizes the details about the layout of tubes when calculating the total perimeter of the palladium membranes (but the shell outer diameter is not utilized in the permeation calculation). In addition, such layout provides justification for the adopted membrane perimeter, and also helps the reader envision how the membrane reactor looks like in a real situation.
Table 1 shows some details about the shell and tubes geometry. The tubes and shell are assumed to have zero thickness, and the palladium membranes cover the entire surface of each tube. Being a one-dimensional model, there are no baffles in the membrane reactor.
3.3. Fixed Conditions
Figure 2 is a sketch for the stream directions and the compositions of the feed (inlet of the retentate side, in the shell) and the sweep (inlet of the permeate side, inside the tubes). Instead of showing all the 8 tubes (which can make the sketch unclear), only the central tube is shown. The coordinate (x) is the longitudinal distance measured from the left edge of the membrane reactor. The feed syngas enters the shell from the left, and the sweep nitrogen enters the tubes from the right.
The counter-flow profile used here for the streams (where the two streams enter from the opposite ends of the membrane reactor) is preferred over the parallel or co-flow profile (when the two streams enter the membrane reactor from the same edge and exit from the same edge). This is due to more even distribution of the driving force for the mass transfer of hydrogen from the retentate side to the permeate side. This advantage of counter-flow design over co-flow design exists also in the field of heat exchangers, where heat transfer rather than mass transfer is sought (Enerquip, 2022; Thermex, 2022).
Table 2 shows some details about the retentate stream, whose inlet conditions correspond to the raw syngas (the feed) supplied to the membrane reactor. The temperature and pressure are considered uniform in that stream. The temperature and pressure values are not specified because they are not common in all simulation cases, but are varied and their influences later is studied in multiple simulations.
The mixture molecular weight of the feed (MWmix) is calculated from the mole fractions and molecular weights of the constituent gases as follows (Kuo, 2005):
where (MW) refers to the molecular weight, (X) refers to the mole fraction, and the subscripts refer to the individual gases.
The mass fraction (Y) for each constituent gas in the feed is dependent upon its mole fraction (X) according to (Poinsot and Veynante, 2005)
where the subscript (i) refers to any gas of the constituent gases in the feed.
The standard volume flow rate is the virtual volume flow if the temperature and pressure are at standard values, which are taken here as Tstnd = 0 °C (32 °C, 273.15 K) and Pstnd = 105 Pa (0.9869 atm, 14.504 psi). These two standard values are based on the International Union of Pure and Applied Chemistry, IUPAC (IUPAC, 1997).
An ideal gas is a gas that obeys the ideal-gas equation of state: , where (P) is the pressure, (V) is the volume, (N) is the number of moles, () is the universal gas constant, and (T) is the absolute temperature. For an ideal gas, each mole occupies a volume of 22,711 cm3 (22.711 liters) at the standard pressure and temperature mentioned earlier. Thus, the standard volume is directly proportional to the number of moles, which is turn (and assuming no change occurs in chemical composition of the gas) is directly proportional to the mass. This value can be obtained from the ideal-gas equation of state by solving for the standard volume per mole (Vstnd/N) as:
where the multiplier (1,000) is inserted to convert from the volume unit from liters (L) to cubic centimeters (cm3), and the value of the universal gas constant () is a physical constant is taken from the National Institute of Standards and Technology (NIST, 2018). The shown value in the above equation is a truncated version of the published one used in the computation, which is 8,314.462618 J/mol.K.
Table 3 shows some details about the permeate stream, whose inlet conditions correspond to the sweep gas supplied to the membrane reactor. The temperature and pressure are considered uniform in that stream.
The flow rate of the sweep gas is decided based on the target mole fraction of hydrogen in the permeate outlet (XH2,per-out), the mass flow rate of hydrogen in the syngas (ṁH2,feed), and the target hydrogen recovery (β). To demonstrate this dependence, consider a non-dimensional factor (α) defined as
The above equation is valid when having only nitrogen in the sweep gas (which is true in all the simulations in the present work).
Then, the matching mass flow of the sweep gas (ṁsweep) is governed by
The above equation is valid when not having any hydrogen in the sweep (which is true in all the simulations in the present work).
In the present work, β = 0.95, XH2,per-out = 0.4, and ṁH2,feed = 1.5499 kg/hr (this is the product of the feed mass flow: 60 kg/hr, and the mass fraction of hydrogen in the feed: 0.025832). With the previously mentioned molecular weights of hydrogen (Table 2) and nitrogen (Table 3), we get ṁsweep = 30.692 kg/hr as mentioned in Table 3.
The mass flow rates (and the standard volume flow rates) and the chemical compositions of the sweep gas and the feed gas are fixed in all the simulations of this work.
4. Modelling Hydrogen Permeation
4.1. Segmental Plug-Flow Reactor
For simulating the hydrogen permeation in the membrane reactor, piece-wise constant profiles are utilized to replace the continuous distributions along the membrane reactor. The membrane reactor is divided into (n) number of segments, having a small thickness and a constant cross-section. Each segment is assumed to have a uniform gas composition in either the permeate stream or in the retentate stream, and a uniform permeation flux. The flow is steady (time-independent), with a feed syngas entering from the left end (and leaving from the right after losing 95% of its hydrogen moles), and a sweep gas entering from the right end (and leaving from the left end after gaining the same amount of hydrogen lost from the syngas, and having a composition of 40% hydrogen and 60% nitrogen, by moles or volume). Such segmental approach for handling the one-dimensional evolution of the permeation process along the membrane reactor resembles a discretized version of a plug-flow reactor, PFR (AIChE, 2022). Instead of having infinitely-small segments (or plugs) in a true PFR, these segments here are finite. Also, instead of solving ordinary differential equations to find the composition distribution as a function of the longitudinal coordinate as in true PFR problems (Tuckerman, 2020), a numerical approach is used to describe that composition in adjacent segments, by ensuring continuity of the permeate flow and the retentate flow at the interfaces of each pair of adjacent segments. The hydrogen permeation occurs through the palladium membranes from the retentate to the permeate, with a single permeation rate assigned to each segment.
4.2. Modeling Algorithm
Figure 3 explains the segmentation of the hypothetical membrane reactor. It shows a portion of its left end, with the two most-left segments. The left end of the membrane reactor is where the coordinate (x) is assigned the value zero. Because the segmental PFR model is aimed to capture the hydrogen permeation with no consideration of the flow pattern, only the membrane surface is of concern here, because it is where permeation occurs. No gradients are allowed the direction perpendicular to the longitudinal axis (no gradients perpendicular to the membrane surface). The membrane is simplified in the figure as a cylindrical surface, separating the permeate stream (inside) from the retentate stream (outside).
The left-hand side (LHS) of the first segment is the left end of the entire membrane (where x = 0).
The LHS of any intermediate segment (all segments except the first one and the last one) is the right-hand side (RHS) of the previous segment located to its left.
The index number (i) for a segment can take the value from (1) for the first segment at the left edge of the membrane reactor to (n) for the last segment at the right edge of the membrane reactor. The algorithm for calculating the segment-wise composition in the permeate and the retentate streams for a generic segment is provided below.
- a)
- Start with a known hydrogen mole fraction in the retentate at the LHS (XH2,Ret-LHS,i), standard volume flow rate of retentate at the LHS (QRet-LHS,i), hydrogen mole fraction of permeate at the LHS (XH2,Per-LHS,i), and standard volume flow rate of permeate at the LHS (QPer-LHS,i) of the segment (say segment number i).
For this step, there are two routes of calculations
For the first segment (i = 1), implement the inlet conditions and the target mole fraction as follows:
In the last equation, the product (XH2,Ret-LHS,1 QRet-LHS,1) gives the standard volume flow rate of the hydrogen content in the feed syngas.
In the last equation, multiplying the standard volume flow rate of the hydrogen content in the feed syngas (QH2,Ret-LHS,1) by the target hydrogen recovery (β) gives the target standard volume flow rate of the hydrogen content in the permeate stream as it exits the entire membrane reactor from its left end. Dividing this value further by the target mole fraction of the exiting permeate stream (XH2,Per-LHS,1) gives the target standard volume flow of the exiting permeate stream (QPer-LHS,1), which is composed of molecular hydrogen and molecular nitrogen. Performing these calculations gives QPer-LHS,1 = 691,173 sccm.
For other segments except the first one (i = 2, 3, … n), the connectivity condition of the segments (interfacing condition) can be used as follows
where the values of (XH2,Ret-RHS,i–1), (QRet-RHS,i–1), (QH2,Ret-RHS,i–1), (XH2,Per-RHS,i–1), and (QRet-RHS,i–1) should be available from the analysis of the previous segment (numbered i–1).
- b)
- Compute (QH2,Per-LHS,i), which is the standard volume flow rate of the hydrogen content in the permeate stream at the LHS of the current segment being analyzed (say segment i), as follows:
- c)
- Compute (ΔPH20.5)LHS,i, which is the difference in the partial pressures of hydrogen raised to the power of 0.5 (which is the driving force for hydrogen permeation through the palladium membrane) at the LHS of the current segment being analyzed (say segment i), as follows:
- d)
- Compute (JH2,i), which is a predicted (first-iteration) segment-level molar flux of permeating hydrogen through the palladium membrane based on the conditions at LHS of the current segment being analyzed (say segment i), as follows:
This predicted flux value is an initial estimation, based on LHS conditions only. In a subsequent step of the present algorithm, it is refined by including effects of RHS conditions.
The above equation is referred to as Richardson’s equation (Campo et al., 2011) or Sieverts’ law (Alraeesi and Gardner, 2021). The factor (k’) is an ideal (or local, or actual) permeance for hydrogen permeation, and it is calculated as
where (A) is a pre-exponential factor for hydrogen permeation, (δ) is the thickness of the palladium membrane, (E) is an activation energy for hydrogen permeation, and (T) is the absolute temperature (in kelvins). The values of (A) and (E) used here are (Koffler et al., 1969; Morreale et al., 2003)
A = 2.2 × 10⁻⁷ mol/m/s/Pa0.5
E = 15,670 J/mol
The thickness of the palladium membrane is set to 80 μm, which is considered a reasonable value (Marzouk, 2017; Yuan et al., 2019).
- e)
- Convert the LHS-based first-iteration molar flux (JH2,i) to a predicted (first-iteration) segment-level standard volume flow rate of permeating hydrogen (QH2,i) for the current segment being analyzed (say segment i).
This temporary standard volume flow rate value is an initial estimation, based on LHS conditions only. In a subsequent step of the present algorithm, it is refined by including effects of RHS conditions. It is computed as follows:
where (Aseg) is the membrane surface area in one segment, and (λ) is a constant that arises from a necessary unit conversion, as follows:
where (scc) stands for (standard cubic centimeters). This gives λ = 1.36266 × 10⁶ scc.s/mol.min.
When computing the segmental membrane area, the envisioned tubes layout in the shell-and-tube design and its specified dimensions become necessary.
If the tube diameter is designated by the symbol (d), and the length of the entire membrane reactor is designated by the symbol (L), then for 8 tubes and (n) segments, the length of a single segment is
and the membrane area within a single segment is
where (π = 3.14159) is the traditional mathematical constant.
- f)
- Compute (H2,Ret-RHS,i) and (H2,Per-RHS,i), which are predicted (first-iteration) mole fractions of hydrogen in the retentate stream and the permeate stream, respectively at the RHS of the current segment being analyzed (say segment i), as follows:
- g)
- Compute (ΔPH20.5)RHS,i, which is the difference in the partial pressures of hydrogen raised to the power of 0.5 (as the driving force for hydrogen permeation) at the RHS of the current segment being analyzed (say segment i), as follows:
- h)
- Compute (ΔPH20.5)i, which is the difference in the partial pressures of hydrogen raised to the power of 0.5 assigned to the current segment being analyzed (say segment i). It is taken as the arithmetic average of the LHS value and the RHS value, as follows:
- i)
- Compute (JH2,i), which is a corrected (second-iteration) segment-level molar flux of permeating hydrogen through the palladium membrane, which includes driving forces for permeation at both sides of the current segment being analyzed (say segment i), as follows:
- j)
- Convert the corrected, segment-level molar flux (JH2,i) to a corresponding updated (refined) segment-level standard volume flow rate of permeating hydrogen (QH2,i) for the current segment being analyzed (say segment i), as follows:
This is considered the final representation of the segment-level permeation of hydrogen.
- k)
- Compute (RH2,i), which is the hydrogen recovery due to the current segment being analyzed (say segment i), as follows:
The denominator (QH2,Ret-LHS,1) in the previous equation is basically the standard volume flow rate of hydrogen in the inlet feed syngas. Thus, it is the standard volume flow of hydrogen available for permeation.The segmental contribution to the overall recovery (RH2,i) can help in studying the distribution of the permeation, and thus identifying portions of the membrane reactor that are more effective than others.
- l)
- Optional: Compute (H2,i), which is the cumulative hydrogen recovery, due to all previous segments of the membrane reactor in addition to the current segment being analyzed (say segment i), as follows:
While this value is not necessary for continuing the calculation process, it is part of the data visualization of results here. It is thus beneficial to explain how it is obtained.
- m)
- Compute (QRet-RHS,i) and (QH2,Ret-RHS,i), which are the standard volume flow rate of the retentate stream and the hydrogen content in that retentate stream, respectively at the RHS of the current segment being analyzed (say segment i), as follows:
- n)
- Compute (XH2,Ret-RHS,i), which is the corrected (second-iteration) mole fraction of hydrogen in the retentate stream at the RHS of the current segment being analyzed (say segment i), as follows:
- o)
- Compute (QPer-RHS,i) and (QH2,Per-RHS,i), which are the standard volume flow rate of the permeate stream and the hydrogen content in that permeate stream, respectively at the RHS of the current segment being analyzed (say segment i), as follows:
- p)
- Compute (XH2,Per-RHS,i), which is the corrected (second-iteration) mole fraction of hydrogen in the permeate stream at the RHS of the current segment being analyzed (say segment i), as follows:
- q)
- Set the obtained RHS conditions of current segment being analyzed (say segment i) as LHS conditions at the next adjacent segment to be analyzed (segment i+1), and repeat the computation procedure sequentially for all remaining segments until the last membrane segment (segment n).
The following values should be obtained for each segment:
- (ΔPH20.5)LHS,i
- H2,i
- H2,i
- H2,Ret-RHS,i and XH2,Per-RHS,i
- (ΔPH20.5)RHS,i
- (ΔPH20.5)i
- JH2,i
- QH2,i
- RH2,i
- Optional: ∙∙
- H2,i
- QRet-RHS,i and QH2,Ret-RHS,i
- XH2,Ret-RHS,i
- QPer-RHS,i and QH2,Per-RHS,i
- XH2,Per-RHS,i
- r)
- Compute (H2,n), which is the cumulative hydrogen recovery at the last segment. It is the overall hydrogen recovery by the entire membrane reactor, and it is obtained by simply adding the segment-level hydrogen recovery (RH2,i) for all the (n) segments of the membrane reactor. The total cumulative value is itself the target hydrogen recovery (β). Therefore
The hydrogen recovery is an important success criterion not only from the chemical perspective, but also from an economic perspective. A higher hydrogen recovery leads to a lower cost per unit mass of hydrogen produced (Nordio et al., 2021).
In the presented algorithm, the length of the entire membrane (L) is a nonlinear function of the overall hydrogen recovery (β). Since (β) is fixed at a desired value of 95% (in all the simulation cases of this study), a matching membrane length (L) should be solved for. Solving such non-linear system of equations is achieved here using the (Goal Seek) tool in the Microsoft Excel software program. This tool is useful only when the equation or system of equations relate a single independent variable to a single dependent variable (Microsoft, 2022). This condition is satisfied in the segmented plug-flow reactor problems here, with the independent variable being the membrane length, and the dependent variable being the hydrogen recovery.
5. Assessing Hydrogen Permeation
5.1. Permeation Metrics
After performing a complete steady-state simulation for the palladium membrane permeation of hydrogen in a segmented plug-flow reactor, assessment of the overall permeation process is facilitated using a number of quantitative scalar quantities (referred to here as performance metrics or permeation metrics), that are convenient to utilize for comparing the performance of different simulations. In this section, five performance metrics for hydrogen separation are discussed.
5.2. Membrane Length
The first permeation performance metric adopted here is the needed membrane length to achieve the target hydrogen recovery (β = 95%). This is designated by the symbol (L).
A smaller membrane length is desired, because it means a shorter membrane reactor, which is a better design due to reduced cost and space.
5.3. Average Hydrogen Permeation Mass Flux
The second permeation performance metric adopted here is average mass flux (mass flow rate per unit area) of the permeated hydrogen through the membrane. It is designated by the symbol (H2). Since the local mass flux of the permeated hydrogen is subject to variation from one segment to another in the membrane reactor model, the average of all segmental values is used. This metric is related to the corrected (second-iteration) segment-level molar flux of permeating hydrogen through the palladium membrane (JH2,i) as
where (MWH2 = 2.01588 kg/kmol) is the molecular weight of the molecular hydrogen, and the factor (3.6) appears to enable unit conversion such that the average mass flux is expressed in (kg/m2.hr) when the segmental mole flux (JH2,i) is expressed in (mol/m2.s).
A higher average mass flux is desired, as it shows more intense utilization of the membrane surface (better use of each unit area).
In the present study, because the total permeated hydrogen is fixed (by fixing the inlet mass flow of hydrogen in the syngas feed and fixing the target hydrogen recovery), and the membrane perimeter is also fixed, the average hydrogen mass flux (H2) and the membrane length (L) are not independent. Instead, they are inversely proportional to each other, and their product should be invariant.
5.4. Log Mean Pressure-Square-Root Difference
The third permeation performance metric adopted here is a global (membrane-level, not a segment-level) pressure-square-root difference, which is a membrane-level difference of the hydrogen partial pressure raised to the power of 0.5, between the retentate stream (higher value) and the permeate stream (lower value). It is designated here by the symbol (LMPsrD) or simply (LMPD), and is called log (or logarithmic) mean pressure-square-root difference. This difference in the square root of the hydrogen partial pressure (PsrD) stimulates the permeation through the palladium membrane. Because this stimulus driving force can vary along the membrane segments, an average value is sought. Instead of a simple arithmetic average over all segments, a logarithm-based average is used, which takes into account the differences at the left end and at the right end of the entire membrane reactor (where the flow inlets and outlets are located). This resembles an approach of calculating an overall temperature difference in the field of heat transfer within heat exchangers, which is called log mean temperature difference, or LMTD (Utamura et al., 2008). The global log mean pressure-square-root difference is calculated as follows:
where (ΔPH20.5)LHS,1 is the driving force at the left end of the membrane reactor (at x = 0), (ΔPH20.5)RHS,n is the driving force at the right end of the membrane reactor (at x = L), and the (ln) function is the natural logarithm. The LMPD should lie between (ΔPH20.5)LHS,1 and (ΔPH20.5)RHS,n, regardless of which of them is larger than the other.
A higher log mean pressure-square-root difference (LMPD) is desired, as it is an indicator of the average driving force for hydrogen permeation between the left end and the right end of the membrane reactor, and is interpreted in a similar way to the LMTD in heat exchanges, being the driving force for heat transfer (Lienhard IV and Lienhard V, 2019).
5.5. Global Apparent Permeance
The fourth permeation performance metric adopted here is the global apparent permeance (k’app), which is a solution-dependent variable that represents the effective permeance based on the obtained profile of hydrogen permeation in the membrane reactor. It has the same unit of the actual (ideal) permeance (k’), which is an input parameter that depends on the temperature and the membrane length, and thus can be computed prior to the numerical simulation of the plug-flow reactor. Despite being the same for all segments for any simulation in this work, the actual permeance (k’) in general is a local value, corresponding to a specific segment (or even a specific point), whereas the apparent permeance is computed based on the overall performance of the membrane reactor as a whole, as follows:
The numerator in the above equation is the arithmetic average of the molar flux of permeating hydrogen through the palladium membrane (average of the n segmental values), while the denominator is the log mean pressure-square-root difference (LMPD).
A higher apparent permeance is desired, as it shows that the membrane reactor yields a higher useful output (hydrogen molar flux) for a given average input (hydrogen pressure driving force).
5.6. Efficiency Factor
The fifth and last permeation performance metric adopted here is the efficiency factor (ηk), which is simply the ratio of the global apparent permeance to the local actual permeance, expressed as a percentage. Therefore,
The efficiency factor is the only permeation metric presented here that is non-dimensional, which makes it unambiguous and identical in any system of units.
The “efficiency factor” is not strictly an efficiency as used in energy conversion by a heat engine, being an output useful energy that is a fraction of an input heat energy, thus limited to a ceiling value of 100% (Bandyopadhyay, 2021). Instead, the “efficiency factor” is a ratio between two quantities that have the same dimensional units but have different meanings and either of them is allowed to exceed the other. Thus, the “efficiency factor” used here can exceed 100%.
A higher efficiency factor is desired, as it is directly proportional to the global apparent permeance, thus it is related to the goodness of the membrane reactor operation with regard to hydrogen permeation.
6. Results
6.1. Base Case and Spatial Resolution Test
The first implementation of the plug-flow membrane reactor model is referred to as the base case or reference simulation. Three needed thermodynamic properties for the two flowing fluids in the reactor are needed to run a simulation, which are
- Temperature (assumed uniform in the entire reactor)
- Retentate pressure (assumed uniform in the retentate stream)
- Permeate pressure (assumed uniform in the permeate stream)
The uniform-temperature assumption avoids ambiguity when computing the actual (ideal) permeance of the palladium membrane, which is temperature dependent. Thus, the actual permeance is also uniform in the entire membrane, and this eliminates an undesirable distracting influence from a varying permeance.
The three aforementioned thermodynamic properties are to be varied individually later, deviating from their base values. And the influence of each of them on the hydrogen permeation is examined.
The base case is considered to have representative (realistic) values of the membrane streams (Tan et al., 2015; Leonzio, 2018; Vita and Italiano, 2020), which they are summarized in Table 4.
The local actual hydrogen permeance (k’) for the base temperature of (300 °C, 573.15 K) is 10.263 × 10⁻⁴ mol/m2.s.Pa0.5.
Table 5 gives numerical results for the base case after a complete simulation of the segmented plug-flow reactor for it. The normal resolution of 200 segments is compared with another resolution with twice the number of segments (400 segments) having the same membrane length found necessary for the 200-segment case.
Also, the absolute percentage deviations of these results between the two resolutions are shown in the table. Such comparison reveals small deviations not exceeding 2% in all the four permeation performance metrics other than the membrane length, which was forced to be identical in the two simulations. Namely, these metrics are: (1) average hydrogen permeation mass flux, (2) log mean pressure-square-root difference, (3) global apparent hydrogen permeance, and (4) efficiency factor.
For the hydrogen recovery, it was a specified input in the case of using 200 segments, where the membrane length was a computed output. In the case of using 400 segments, the membrane length was the specified input (to ensure geometric consistency between the two simulations), while the hydrogen recovery was computed from the segmented plug-flow reactor model, in an inverse simulation mode. There is an insignificant difference (0.01% absolute change) in the two values of the hydrogen recovery.
In addition to the demonstrated quantitative agreement between the normal-resolution simulation with 200 segments and the high-resolution validation simulation with 400 segments, qualitative agreement can also be observed in Figure 4. This figure compares the cumulative hydrogen recovery along the base-case plug-flow reactor model, for the 200-segment resolution and the 400-segment resolution. The profiles under both resolutions are visually indistinguishable.
Figure 5 shows the segmental hydrogen recovery profile (contribution of each reactor segment to the total hydrogen recovery). The normal resolution (200 segments) corresponds to nearly twice the values of the high resolution (400 segments). Although this may indicate a mismatch between the two simulations, it is actually appropriate because each segment under the normal resolution has twice the membrane area of a segment under the high resolution.
The nonlinear profile of the segmental recovery is attributed to the underlying variation in the driving force for the segmental hydrogen permeation (the segmental pressure-square-root difference), which is a nonlinear function of the hydrogen mole fraction in the permeate stream and the hydrogen mole fraction in the retentate stream.
The variations of the hydrogen mole fraction in the retentate stream as the retentate gas traverses the membrane reactor form the left to the right are shown in Figure 6. It decreases from 30% at the left end corresponding to x/L = 0 to 2.10% at the right end corresponding to x/L = 1. The variation is weekly nonlinear with the distance. The exit mole fraction is not exactly zero, but this is consistent with the target hydrogen recovery of 95%. The value of the exit mole fraction of hydrogen (2.10%) and the longitudinal pattern of that mole fraction for the normal resolution (200 segments) are consistent with those for the validation resolution (400 segments).
The variations of the hydrogen mole fraction in the permeate stream as the permeate gas traverses the membrane reactor form the right to the left are shown in Figure 7. It increases from 0% at the right end corresponding to x = L (a normalized variable x/L = 1 is used in the figure) to the target 40% at the left end corresponding to x = 0. The variation is weekly nonlinear with the distance, as in the case of the retentate stream. Comparing the mole fraction patterns with 200 segments and with 400 segments suggests independence of the results on the spatial resolution. Thus, using 200 segments is adequate and there is no need to use a higher resolution.
With such observed good agreement between the normal spatial resolutions and the testing high resolution, the choice of 200 segments (normal resolution) is considered satisfactory, and is adopted in all remaining simulations.
6.2. Influence of Temperature
After completing the segmented flow reactor under a set of representative operational conditions, the temperature of the flows in the membrane reactor is varied in a discrete manner, leading to a number of temperatures higher than the base value of 300 °C. The base value and the 6 additional temperatures are:
- 300 °C (base)
- 350 °C
- 400 °C
- 500 °C
- 600 °C
- 700 °C
- 800 °C
It is understood that high temperatures may pose practical challenge for the materials and the process feasibility. Despite this, the model allows exploring the change in the permeation performance due to elevated temperatures. This is achieved by monitoring the changes in the five performance metrics due to the changes in the temperature alone. The other two design variables (retentate pressure and permeate pressure) are kept at their base values (40 atm absolute and 20 atm absolute, respectively).
Figure 8 shows the influence of the temperature on the first hydrogen permeation metric, which is the membrane length. There is a nonlinear decline, which can be described by a nonlinear power-type regression model. In the equation shown within the figure, (x) refers to the temperature in degrees Celsius, T(°C), while (y) refers to the membrane length in meters, L(cm). Therefore,
Thus, the temperature is an instrumental variable to limit the membrane length (for a given target hydrogen recovery) to less than 25% of its base value. Thus, it is equally instrumental to increase the hydrogen recovery for a given geometric length.
Figure 9 shows the influence of the temperature on the second hydrogen permeation metric, which is the average hydrogen permeation mass flux. There is an almost linear increase with temperature, which can be described by the following linear regression model:
with an (R2) value of 0.9990. This value that accompanies the linear regression equation is called the coefficient of determination. It helps in evaluating the goodness of the regression fit, with a perfect fit having a value of 1.0 (Heumann et al., 2016). Therefore, the provided regression model is almost perfect within the examined range of temperatures.
Thus, the temperature is an instrumental variable to improve the permeation flux. This is justified by the increase in the actual local permeance when the temperature increases (following an Arrhenius-type dependence).
Figure 10 shows that the third hydrogen permeation metric, which is the logarithmic mean pressure-square-root difference (LMPD) is independent of the temperature. Similarly, the left-end pressure-square-root difference, (ΔPH20.5)LHS,1, and the right-end pressure-square-root difference, (ΔPH20.5)RHS,n, which are included in the figure, are not functions of the temperature of the membrane reactor as well. Thus, they maintain their base values. The graph has a much-bigger range for the vertical axis intentionally, in order to accommodate results in other later simulation cases while using a uniform axis range, which facilitates visual comparison.
The lack of influence of temperature on this permeation metric is valid, due to fixing the pressures in all the case while changing only the temperatures.
Figure 11 shows how the fourth and fifth hydrogen permeation metrics change as the temperature increases. These metrics are the global apparent permeance and the efficiency factor, respectively. In addition, the figure also includes the actual local permeance. While both permeance values increase nonlinearly with the temperature, their ratio remains constant at the base value of 67.09%. The increase of the permeance values follow exactly an exponential function of the form
where (α) is a constant, being the activation energy divided by the universal gas constant (E/).
Therefore, while increasing the temperature leads to better permeance, it is useless for improving the efficiency factor.
6.3. Influence of Retentate Pressure
After exploring the role of the temperature as a design variable to improve premotion in a membrane reactor, this subsection explores the similar role of the retentate pressure. The retentate pressure is varied in a discrete manner, leading to a number of pressures higher than the base value of 40 atm (absolute). The base value and 7 additional absolute retentate pressures are:
- 40 atm (base)
- 45 atm
- 50 atm
- 60 atm
- 70 atm
- 80 atm
- 100 atm
- 120 atm
The goal here is to investigate the relation between this retentate pressure and the five performance metrics. The other two design variables (temperature and permeate pressure) are kept at their base values (300 °C and 20 atm absolute, respectively).
Figure 12 shows the influence of the retentate pressure on the first hydrogen permeation metric, which is the membrane length. Similar to the observed relation with the temperature, there is a favorable nonlinear decline in the membrane length as the retentate pressure increases. This relation can be described by the following fifth-order polynomial:
where (r) refers to the retentate absolute pressure, expressed in atm, PRet(atm, absolute). The retentate pressure was found to be an instrumental variable to limit the membrane length (for a given target hydrogen recovery) to less than 25% of its base value at about 110 atm(absolute). In other words, it can be utilized to increase the hydrogen recovery for a given geometric length.
Figure 13 shows the influence of the retentate pressure on the second hydrogen permeation metric, which is the average hydrogen permeation mass flux. There is an approximate linear increase with pressure, which can be described by the following linear regression model:
with an (R2) value of 0.9931, which is close to the perfect value of 1.0. Thus, the retentate pressure is useful for improving the permeation flux. This is justified by the increase in the driving force for permeation when the retentate pressure increases, due to the resulting proportional increase in the hydrogen partial pressure in the retentate stream.
Figure 14 shows that the third hydrogen permeation metric (log mean pressure-square-root difference - LMPD) increases logarithmically with the retentate pressure. The relation between the log mean pressure-square-root difference and the absolute pressure of the retentate stream over the range of considered pressures can be approximated as the following logarithmic function:
At an absolute retentate pressure of about 47 atm, the left-end pressure-square-root difference and the right-end pressure-square-root difference are equal, and become matching with the log mean pressure-square-root difference. The gap between the left-end and right-end pressure-square-root difference becomes larger as the retentate pressure increases.
Figure 15 shows how the global apparent permeance and the efficiency factor change as the retentate pressure increases. The actual local permeance is fixed at its base value of 10.263 × 10⁻⁴ mol/m2.s.Pa0.5, but the apparent global permeance increases slightly as the retentate pressure increases, and it approaches the actual local permeance at high retentate pressure. The efficiency factor increases from its base value of 67.09% at 40 atm(absolute) to 98.71% at 120 atm(absolute).
6.4. Influence of Permeate Pressure
In this subsection, the impact of the permeate pressure (the last design variable considered in this study) on the permeation metrics is discussed. Seven additional simulations with different values of the absolute permeate pressure were conducted with the aim of capturing the trend of the permeation performance when the permeate pressure decreases from the base value of 20 atm (absolute) to a small value near absolute vacuum. The base value and 7 additional absolute permeate pressures are:
- 20 atm (base)
- 17.5 atm
- 15 atm
- 10 atm
- 5 atm
- 1 atm
- 0.5 atm
- 0.2 atm
The other two design variables (temperature and retentate pressure) are kept at their base values (300 °C and 40 atm absolute, respectively). Unlike the temperature and the retentate pressure, where larger values than the base values were investigated, smaller values of permeate pressures are investigated here for seeking better permeation, since this permeation pressure has a resistive effect for permeation (not a supportive effect as the temperature and the retentate pressure).
Figure 16 shows the influence of the permeate pressure on the first hydrogen permeation metric, which is the membrane length. There is a nonlinear (nearly exponential) increase in the membrane length as the retentate pressure increases. This relation can be described by the following regression model:
Although manipulating the permeate pressure can reduce the membrane length (for a given target hydrogen recovery) to less than 25% of its base value (which was also achievable by manipulating the temperature or the retentate pressure), partial vacuum is needed for achieving this, with pressures below the normal atmospheric pressure of 1 atm. This imposes complications and expense, and may not be acceptable. However, the reduction in the permeate pressure within more-realistic values (like 10 atm, absolute) has still a favorable effect and the membrane length can decrease to less than half of its base value by halving the absolute permeate pressure.
Figure 17 shows the influence of the permeate pressure on the second hydrogen permeation metric, which is the average hydrogen permeation mass flux. There is approximately an exponential decline in the average hydrogen permeation mass flux as the permeate pressure increases. This can be described by the following nonlinear regression model:
If the absolute permeate pressure can be reduced to half of its base value, the average hydrogen permeation mass flux can be intensified to more than twice its base value.
Figure 18 shows that the third hydrogen permeation metric (log mean pressure-square-root difference) increases logarithmically with retentate pressure. The relation between the pressure-square-root (LMPD) and the absolute pressure of the permeate stream over the range of considered pressures can be approximated as an exponential function as
Below the absolute permeate pressure of about 17.5 atm, the left-end pressure-square-root difference is larger than the right-end pressure-square-root difference, which is reversed at higher permeate pressures.
Figure 19 shows how the global apparent permeance and the efficiency factor decrease as the permeate pressure increases. The actual local permeance is fixed at its base value of 10.263 × 10⁻⁴ mol/m2.s.Pa0.5, but the apparent global permeance decreases from a value higher than the actual local permeance (thus, an efficiency factor above 100%) at very low permeate pressures to a value smaller than the actual local permeance as the permeate pressure increases (thus, an efficiency factor below 100%) as the absolute permeate pressure is increases beyond about 5 atm. Specifically, the efficiency factor reaches 102.53% and 118.43% at absolute permeate pressures of 5 atm and 0.2 atm, respectively (compared to the base value of 67.09% at 20 atm, absolute).
6.5. Profiles with Extreme Design Variables
The final method to highlight the general impacts of the three design variables (temperature, retentate pressure, and permeate pressure) on the hydrogen permeation within a generic palladium membrane reactor is by contrasting some longitudinal profiles when the membrane reactor operates at the extreme values assigned to each design variable, while keeping the other two design variables at their base values.
This means contrasting results from three different simulations with the following conditions in Table 6:
The cumulative hydrogen recovery profiles for the three extreme cases are contrasted in Figure 20. The left-end value (0%) and the right-end value (95%) are implicitly imposed by the enforced inlet or outlet conditions. Thus, all profiles should coincide at both left and right edges of the membrane reactor, but they can deviate in the intermediate zone. The cumulative hydrogen recovery for the extreme temperature shows more linearity than the other two profiles, with the extreme permeate pressure corresponds to a curved profile, resembling a second-order function of the normalized membrane coordinate (x/L), with a gradually declining slope as x/L increases. The extreme retentate pressure simulation shows an intermediate behavior between the other two extreme cases, in terms of the cumulative hydrogen recovery profiles.
This behavior is better explained by visualizing the segmental contribution to the total hydrogen recovery for these three extreme cases in Figure 21. While the profile for the extreme temperature is not horizontal, it first decreases and then increases, making it behave as if changing around a uniform mean value. Thus, the cumulative value (integration of the profile) should be close to a straight upward line as shown earlier. On the other hand, the extreme permeate pressure causes a nearly-linear declining profile for the segmental hydrogen recovery, which when integrated, gives a nearly quadratic profile as shown before. The extreme retentate pressure simulation shows an intermediate behavior between the other two extreme cases, as noted earlier.
The hydrogen mole fractions in the retentate stream and in the permeate stream for the three extreme cases are contrasted in Figure 22 and Figure 23, respectively. The simulation with the extreme permeate pressure shows a regular variation for both streams. The simulation with the extreme temperature shows an accelerated decline in the hydrogen mole fractions in both streams as the coordinate x approaches the right end (permeate inlet, retentate exit). This can be attributed to the rapidly elevated segmental hydrogen recovery in this region, after being steadily declining in the left part of the membrane reactor. Again, the extreme retentate pressure simulation shows an intermediate behavior between the other two extreme cases.
7. Conclusions
A discrete plug-flow reactor model was established for simulating the one-dimensional isothermal permeation of hydrogen through palladium membranes, and were applied for separating hydrogen from a pressurized hot syngas stream. The model assumes a shell-and-tube cross-section for estimating the exact membranes area. A set of inlet conditions for the feed syngas and an inlet sweep nitrogen were made. Also, a target hydrogen recovery of 95% and a target hydrogen mole fraction of 40% at the permeate exit were enforced. The required membrane length was computed to achieve these targets. The model consists of 200 segments, with each segment having the length of about 2 cm. After a validity test, it was found that this spatial segmentation is adequate.
Then, the impact of three operational variables was investigated, when varied individually starting from reference values such that better hydrogen permeation can be obtained. These design variable are the temperature, retentate-side pressure, and permeate-side pressure. For quantitative evaluation of the permeation improvement, five assessment metrics were discussed, including the apparent global permeance and the efficiency factor. Linear or nonlinear regression models were provided for the membrane length, the average permeation mass flux, and the log mean pressure-square-root difference. In addition, the one-dimensional profiles of some permeation-related quantities (such as the segmental hydrogen recovery) at the extreme value of each design variable were contrasted. The present study can serve as a rough guide for palladium-based hydrogen separation, showing designers potential gains in hydrogen permeation by manipulating some operational conditions. The designers may then seek optimum compromise between the expected gain and the incurred complications or implementation cost. For example, it was shown that increasing the reactor temperature or the retentate pressure results in proportional gain in the mass flux, while decreasing the permeate pressure has an exponential correlation with that mass flux.
Considering the relative changes in the three investigated design variables and the dependent hydrogen permeation metrics in 21 simulations (one reference simulation and 20 additional ones), the temperature is the most effective for improving the permeation performance. The retentate pressure comes in the second place. The permeate pressure is the least-powerful way to improve hydrogen permeation.
Author Contributions
O.A.M. (the sole author) contributed to the conceptual design, computational modelling, simulations, data analysis, visualization, and manuscript writing.
Funding
This research received no funding.
Data Availability Statement
No dataset was used. The results reflect own calculations as described in the modeling procedure and mentioned input parameters.
Acknowledgments
The author deeply appreciates the valuable support and shared data by former colleagues E. David Huckaby, Michael V. Ciocco, Bryan D. Morreale (National Energy Technology Laboratory of the United States Department of Energy – NETL/DoE), and Michael Matuszewski (University of Pittsburgh, U.S.A).
Conflicts of Interest
The author declares that the research was conducted in the absence of any commercial or financial relationships that could be construed as a potential conflict of interest.
References
- Couto, N. , Rouboa, A., Silva, V., Monteiro, E., Bouziane, K. Influence of the biomass gasification processes on the final composition of syngas. Energy Procedia 2013, 36, 596–606. [Google Scholar] [CrossRef]
- Sarafraz, M.M. , Safaei, M.R., Jafarian, M., Goodarzi, M., Arjomandi, M. High Quality Syngas Production with Supercritical Biomass Gasification Integrated with a Water–Gas Shift Reactor. Energies. 2019, 12, 2591. [Google Scholar] [CrossRef]
- NETL [National Energy Technology Laboratory of the United States Department of Energy]. (no date). Reactions & Transformations. https://netl.doe.gov/research/coal/energy-systems/gasification/gasifipedia/reaction-transformations [Accessed May 5, 2022].
- Poudel, J. , Choi, J.H., Oh, S.C. Process Design Characteristics of Syngas (CO/H2) Separation Using Composite Membrane. Sustainability 2019, 11, 703. [Google Scholar] [CrossRef]
- Kumar, R.N. , and Aarthi, V. From Biomass to Syngas, Fuels and Chemicals – A Review. AIP Conference Proceedings 2020, 2225, 070007. [Google Scholar] [CrossRef]
- Talmadge, M. , Biddy, M., Dutta, A., Jones, S., Meyer, A. (2013). Syngas Upgrading to Hydrocarbon Fuels Technology Pathway [Technical Report by the National Renewable Energy Laboratory “NREL” and the Pacific Northwest National Laboratory “PNNL” of the United States Department of Energy]. Available at: https://www.nrel.gov/docs/fy13osti/58052.pdf.
- Matar, S. , Mirbach, M.J., Tayim, H.A. (1989). Production and Uses of Synthesis Gas. In: Catalysis in Petrochemical Processes. Springer, Dordrecht. [CrossRef]
- Fortunato, B. , Camporeale, S.M., Torresi, M. A Gas-Steam Combined Cycle Powered by Syngas Derived from Biomass. Procedia Comput. Sci. 2013, 19, 736–745. [Google Scholar] [CrossRef]
- Stork. (2022). Syngas Fired Steam Boiler. https://www.stork.com/en/client-cases/syngas-fired-steam-boiler [Accessed May 6, 2022].
- Marco, R. , and Carlo, P. (2015). "9. Use of bio-sourced syngas," in Biorefineries: An Introduction, ed. M. Aresta, A. Dibenedetto, F. Dumeignil (Berlin, München, Boston: De Gruyter), 219–234. [CrossRef]
- Ni, Y. , Wang, K., Zhu, W., Liu, Z. Realizing high conversion of syngas to gasoline-range liquid hydrocarbons on a dual-bed-mode catalyst. Chem Catal. 2021, 1, 383–392. [Google Scholar] [CrossRef]
- Felseghi, R.-A. , Carcadea, E., Raboaca, M.S., TRUFIN, C.N., Filote, C. Hydrogen Fuel Cell Technology for the Sustainable Future of Stationary Applications. Energies 2019, 12, 4593. [Google Scholar] [CrossRef]
- Ghiat, I. , and Al-Ansari, T. A review of carbon capture and utilisation as a CO2 abatement opportunity within the EWF nexus. J. CO2 Util. 2021, 45, 101432. [Google Scholar] [CrossRef]
- Madejski, P. , Chmiel, K., Subramanian, N., Kuś, T. Methods and Techniques for CO2 Capture: Review of Potential Solutions and Applications in Modern Energy Technologies. Energies 2022, 15, 887. [Google Scholar] [CrossRef]
- Dinca, C. , Slavu, N., Cormoş, C.-C., Badea, A. CO2 capture from syngas generated by a biomass gasification power plant with chemical absorption process. Energy 2018, 149, 925–936. [Google Scholar] [CrossRef]
- Adu, E. , Zhang, Y., Liu, D. Current situation of carbon dioxide capture, storage, and enhanced oil recovery in the oil and gas industry. Can. J. Chem. Eng. 2019, 97, 1048–1076. [Google Scholar] [CrossRef]
- OFECM [Office of Fossil Energy and Carbon Management at the United States Department of Energy]. (no date). Pre-Combustion Carbon Capture Research. https://www.energy.gov/fecm/science-innovation/carbon-capture-and-storage-research/carbon-capture-rd/pre-combustion-carbon[Accessed May 6, 2022].
- Iulianelli, A. , Ribeirinha, P., Basile, A. Methanol steam reforming for hydrogen generation via conventional and membrane reactors: A review. Renew. Sust. Energ. Rev. 2014, 29, 355–368. [Google Scholar] [CrossRef]
- Piemonte, V. , Di Paola, L., De Falco, M., Iulianelli, A., Basile, A. "11 - Hydrogen production using inorganic membrane reactors," in Advances in Hydrogen Production, Storage and Distribution, ed. A. Basile and A. Iulianelli (Woodhead Publishing), 2014, 283–316. [CrossRef]
- Peters, T. , and Caravella, A. Pd-Based Membranes: Overview and Perspectives. Membranes 2019, 9, 25. [Google Scholar] [CrossRef] [PubMed]
- Vermaak, L. , Neomagus, H.W.J.P., Bessarabov, D.G. Hydrogen Separation and Purification from Various Gas Mixtures by Means of Electrochemical Membrane Technology in the Temperature Range 100–160 °C. Membranes 2021, 11, 282. [Google Scholar] [CrossRef]
- Alique, D. , Martinez-Diaz, D., Sanz, R., Calles, J.A. Review of Supported Pd-Based Membranes Preparation by Electroless Plating for Ultra-Pure Hydrogen Production. Membranes 2018, 8, 5. [Google Scholar] [CrossRef]
- Oh, D.-K. , Lee, K.-Y., Park, J.-S. Hydrogen Purification from Compact Palladium Membrane Module Using a Low Temperature Diffusion Bonding Technology. Membranes 2020, 10, 338. [Google Scholar] [CrossRef]
- Krishnan, G. , Steele, D., O'Brien, K., Callahan, R., Berchtold, K., Figueroa, J. Simulation of a Process to Capture CO2 From IGCC Syngas Using a High Temperature PBI Membrane. Energy Procedia 2009, 1, 4079–4088. [Google Scholar] [CrossRef]
- Berstad, D. , Nekså, P., Gjøvåg, G.A. Low-temperature syngas separation and CO2 capture for enhanced efficiency of IGCC power plants. Energy Procedia 2011, 4, 1260–1267. [Google Scholar] [CrossRef]
- GE Power Systems. (no date). GE IGCC Technology and Experience with Advanced Gas Turbines [Online resource]. Available at: https://www.ge.com/content/dam/gepower-new/global/en_US/downloads/gas-new-site/resources/reference/ger-4207-ge-igcc-technology-experience-advanced-gas-turbines.pdf (Accessed May 6, 2022).
- Wang, T. "1 - An overview of IGCC systems," in Integrated Gasification Combined Cycle (IGCC) Technologies, ed. T. Wang and G. Stiegel (Woodhead Publishing), 2017, 1-80. [CrossRef]
- Mitsubishi Heavy Industries, Ltd. Energy Systems. (no date). IGCC Integrated coal Gasification Combined Cycle Power Plants [Catalogue document]. Available at: https://power.mhi.com/catalogue/pdf/igcc.pdf (Accessed May 6, 2022).
- Barbieri, G. (2015). "Sweep Gas in a Membrane Reactor," in: Encyclopedia of Membranes, ed. E. Drioli (Berlin, Heidelberg: Springer). [CrossRef]
- Li, Z. , Polfus, J.M., Xing, W., Denonville, C., Fontaine, M.-L., Bredesen, R. Factors Limiting the Apparent Hydrogen Flux in Asymmetric Tubular Cercer Membranes Based on La27W3.5Mo1.5O55.5−δ and La0.87Sr0.13CrO3−δ. Membranes 2019, 9, 126. [Google Scholar] [CrossRef]
- Chein, R.Y. , Chen, Y.C., Chung, J.N. Sweep gas flow effect on membrane reactor performance for hydrogen production from high-temperature water-gas shift reaction. J. Membr. Sci. 2015, 475, 193–203. [Google Scholar] [CrossRef]
- Balachandran, U. , Dorris, S.E., Emerson, J.E., Lee, T.H., Lu, Y., Park, C.Y., Picciolo, J.J. (2011). Hydrogen Separation Membranes [Annual Report by the Argonne National Laboratory “ANL” of the United States Department of Energy for FY 2010]. Available at: https://publications.anl.gov/anlpubs/2011/03/69523.pdf.
- Chiesa, P. , Romano, M.C., Kreutz, T.G. "10 - Use of membranes in systems for electric energy and hydrogen production from fossil fuels," in Handbook of Membrane Reactors, Reactor Types and Industrial Applications, ed. A. Basile (Woodhead Publishing), 2013, 416–455. [CrossRef]
- Brunetti, A. , Caravella, A., Drioli, E., Barbieri, G. (2017). "CHAPTER 1: Membrane Reactors for Hydrogen Production," in Membrane Engineering for the Treatment of Gases: Volume 2: Gas-separation Issues Combined with Membrane Reactors: Edition 2, ed. E. Drioli, G. Barbieri, A. Brunetti (The Royal Society of Chemistry), 1–29. [CrossRef]
- GTI [Gas Technology Institute] (2007). Direct Hydrogen Production from Biomass Gasifier Using Hydrogen-Selective Membrane [Final Report, prepared for Xcel Energy]. Available at: https://www.xcelenergy.com/staticfiles/xe/Corporate/RDF-DirectHydrogenProduction-Report%5B1%5D.pdf.
- Kinouchi, K. , Katoh, M., Horikawa, T., Yoshikawa, T., Wada, M. Hydrogen Permeability of Palladium Membrane for Steam-reforming of Bio-Ethanol Using the Membrane Reactor. Int. J. Mod. Phys. Conf. Ser. 2012, 6, 7–12. [Google Scholar] [CrossRef]
- Thermex. (2022). Why counter flow heat exchangers are more efficient. http://www.thermex.co.uk/news/blog/605-why-counter-flow-heat-exchangers-are-more-efficient. (accessed on 7 May 2022).
- Enerquip. (2022). What’s the difference between parallel flow, counter flow and crossflow heat exchangers? https://www.enerquip.com/whats-the-difference-between-parallel-flow-counter-flow-and-crossflow-heat-exchangers. (accessed on 7 May 2022).
- NIST [National Institute of Standards and Technology]. (2021a). NIST Chemistry WebBook - Hydrogen. https://webbook.nist.gov/cgi/cbook.cgi?Name=h2&Units=SI. (accessed on 7 May 2022).
- NIST [National Institute of Standards and Technology]. (2021b). NIST Chemistry WebBook - Carbon monoxide. https://webbook.nist.gov/cgi/cbook.cgi?Name=CO&Units=SI. (accessed on 7 May 2022).
- NIST [National Institute of Standards and Technology]. (2021c). NIST Chemistry WebBook - Carbon dioxide. https://webbook.nist.gov/cgi/cbook.cgi?ID=C124389&Units=SI. (accessed on 7 May 2022).
- Kuo, K.K. (2005). Principles of Combustion, 2nd ed. New Jersey, USA: John Wiley & Sons.
- Poinsot, T. , and Veynante, D. (2005). Theoretical and Numerical Combustion, 2nd ed. USA: R.T. Edwards, Inc.
- IUPAC [International Union of Pure and Applied Chemistry]. (1997). Compendium of Chemical Terminology, 2nd ed. (the "Gold Book"). Compiled by A.D. McNaught and A. Wilkinson. Oxford: Blackwell Scientific Publications. Online version (2019-) made by S.J. Chalk. [CrossRef]
- NIST [National Institute of Standards and Technology]. (2018). CODATA [Committee on Data for Science and Technology] Value: molar gas constant. https://physics.nist.gov/cgi-bin/cuu/Value?r|search_for=gas. (accessed on 7 May 2022).
- NIST [National Institute of Standards and Technology]. (2021d). NIST Chemistry WebBook - Nitrogen. https://webbook.nist.gov/cgi/cbook.cgi?Name=n2&Units=SI. (accessed on 7 May 2022).
- Tuckerman, M.E. (2020). Lecture 25: Plug flow reactors and comparison to continuously stirred tank reactors. https://chem.libretexts.org/Courses/New_York_University/CHEM-UA_652%3A_Thermodynamics_and_Kinetics/Lecture_25%3A_Plug_flow_reactors_and_comparison_to_continuously_stirred_tank_reactors [Accessed May 9, 2022].
- AIChE [American Institute of Chemical Engineers] (no date). Plug Flow Reactor (PFR). https://www.aiche.org/ccps/resources/glossary/process-safety-glossary/plug-flow-reactor-pfr [Accessed , 2022]. 9 May.
- Campo, M. , Tanaka, A., Mendes, A., Sousa, J.M. "3 - Characterization of membranes for energy and environmental applications," in Advanced Membrane Science and Technology for Sustainable Energy and Environmental Applications, ed. A. Basile and S.P. Nunes (Woodhead Publishing), 2011, 56–89. [CrossRef]
- Alraeesi, A. , and Gardner, T. Assessment of Sieverts Law Assumptions and ‘n’ Values in Palladium Membranes: Experimental and Theoretical Analyses. Membranes 2021, 11, 778. [Google Scholar] [CrossRef] [PubMed]
- Koffler, S.A. , Hudson, J.B., Ansell, G.S. Hydrogen permeation through alpha-palladium. Trans. Metall. Soc. AIME 1969, 245, 1735–1740. [Google Scholar]
- Morreale, B.D. , Ciocco, M.V., Enick, R.M., Morsi, B.I., Howard, B.H., Cugini, A.V., Rothenberger, K.S. The permeability of hydrogen in bulk palladium at elevated temperatures and pressures. J. Membr. Sci. [CrossRef]
- Marzouk, O.A. Performance Analysis of Shell-and-Tube Dehydrogenation Module. Int. J. Energy Res. 2017, 41, 604–610. [Google Scholar] [CrossRef]
- Yuan, M. , Lee, K., Van Campen, D.G., Liguori, S., Toney, M.F., Wilcox, J. Hydrogen Purification in Palladium-Based Membranes: An Operando X-ray Diffraction Study. Ind. Eng. Chem. Res. 2019, 58, 926–934. [Google Scholar] [CrossRef]
- Nordio, M. , Wassie, S.A., Annaland, M.V.S., Tanaka, D.A.P., Sole, J.L.V., Gallucci, F. Techno-economic evaluation on a hybrid technology for low hydrogen concentration separation and purification from natural gas grid. Int. J. Hydrogen Energy 2021, 46, 23417–23435. [Google Scholar] [CrossRef]
- Microsoft corporation. (2022). Use Goal Seek to find the result you want by adjusting an input value. https://support.microsoft.com/en-us/office/use-goal-seek-to-find-the-result-you-want-by-adjusting-an-input-value-320cb99e-f4a4-417f-b1c3-4f369d6e66c7. (accessed on 11 May 2022).
- Bandyopadhyay, S. All forms of energy are equal, but some forms of energy are more equal than others. Clean Techn. Environ. Policy 2021, 23, 2775–2776. [Google Scholar] [CrossRef]
- Tan, E.C.D. , Talmadge, M., Dutta, A., Hensley, J., Schaidle, J., Biddy, M., Humbird, D., Snowden-Swan, L.J., Ross, J., Sexton, D., Yap, R., Lukas, J. (2015). Process Design and Economics for the Conversion of Lignocellulosic Biomass to Hydrocarbons via Indirect Liquefaction Thermochemical Research Pathway to High-Octane Gasoline Blendstock Through Methanol/Dimethyl Ether Intermediates [Technical Report prepared for the United States Department of Energy - Bioenergy Technologies Office]. Available at: https://www.nrel.gov/docs/fy15osti/62402.pdf.
- Leonzio, G. Methanol Synthesis: Optimal Solution for a Better Efficiency of the Process. Processes 2018, 6, 20. [Google Scholar] [CrossRef]
- Vita, A. , and Italiano, C. (2020). "Chapter 4 - Fuel and hydrogen related problems for conventional steam reforming of natural gas," in Current Trends and Future Developments in (Bio-) Membranes: Membranes in Environmental Applications, ed. A. Figoli, Y. Li, A. Basile (Elsevier), 71–89. [CrossRef]
- Utamura, M. , Nikitin, K., Kato, Y. A generalised mean temperature difference method for thermal design of heat exchangers. Int. J. Nucl. Energy Sci. Technol. 2008, 4, 11–31. [Google Scholar] [CrossRef]
- Lienhard IV, J.H. , and Lienhard V, J. (2019). A Heat Transfer Textbook, 5th ed. Cambridge, Massachusetts, USA.
- Heumann, C. , Schomaker, M., Shalabh (2016). Introduction to Statistics and Data Analysis With Exercises, Solutions and Applications in R, Switzerland: Springer.
Figure 1.
Proposed cross-section of the shell-and-tube membrane reactor (all dimensions are in cm).
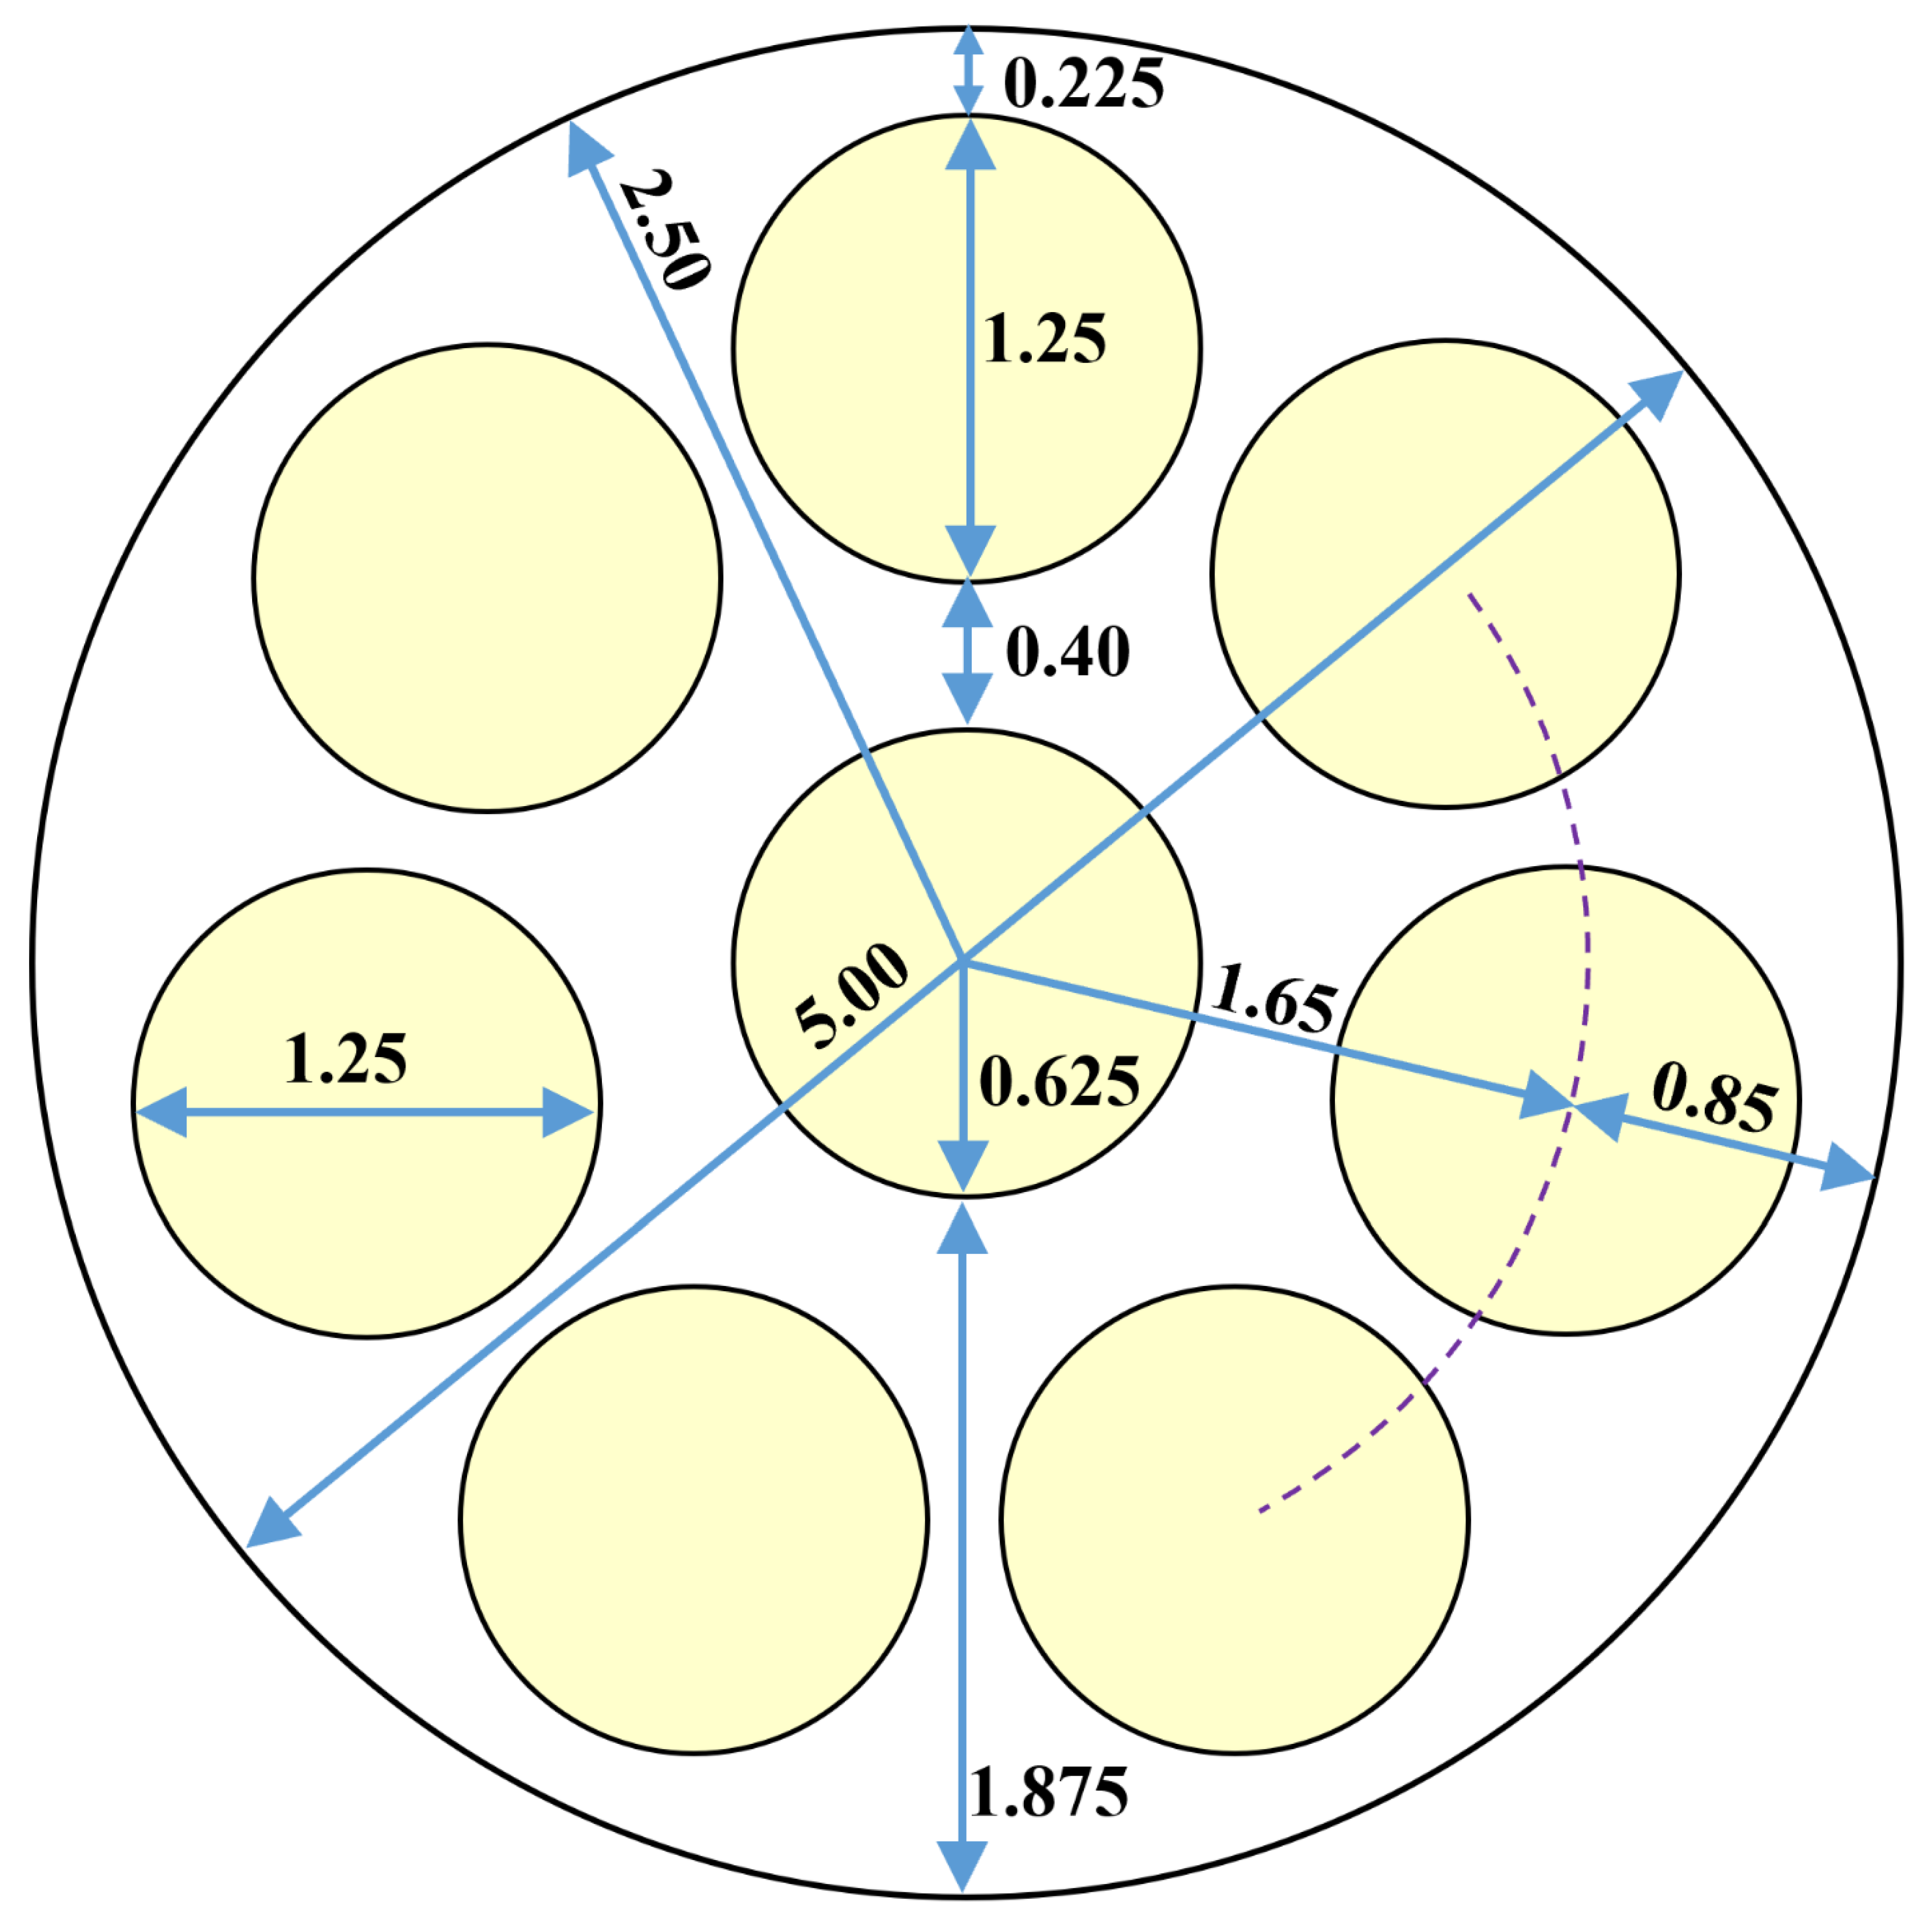
Figure 2.
Inlet conditions and flow directions for retentate and the permeate streams.
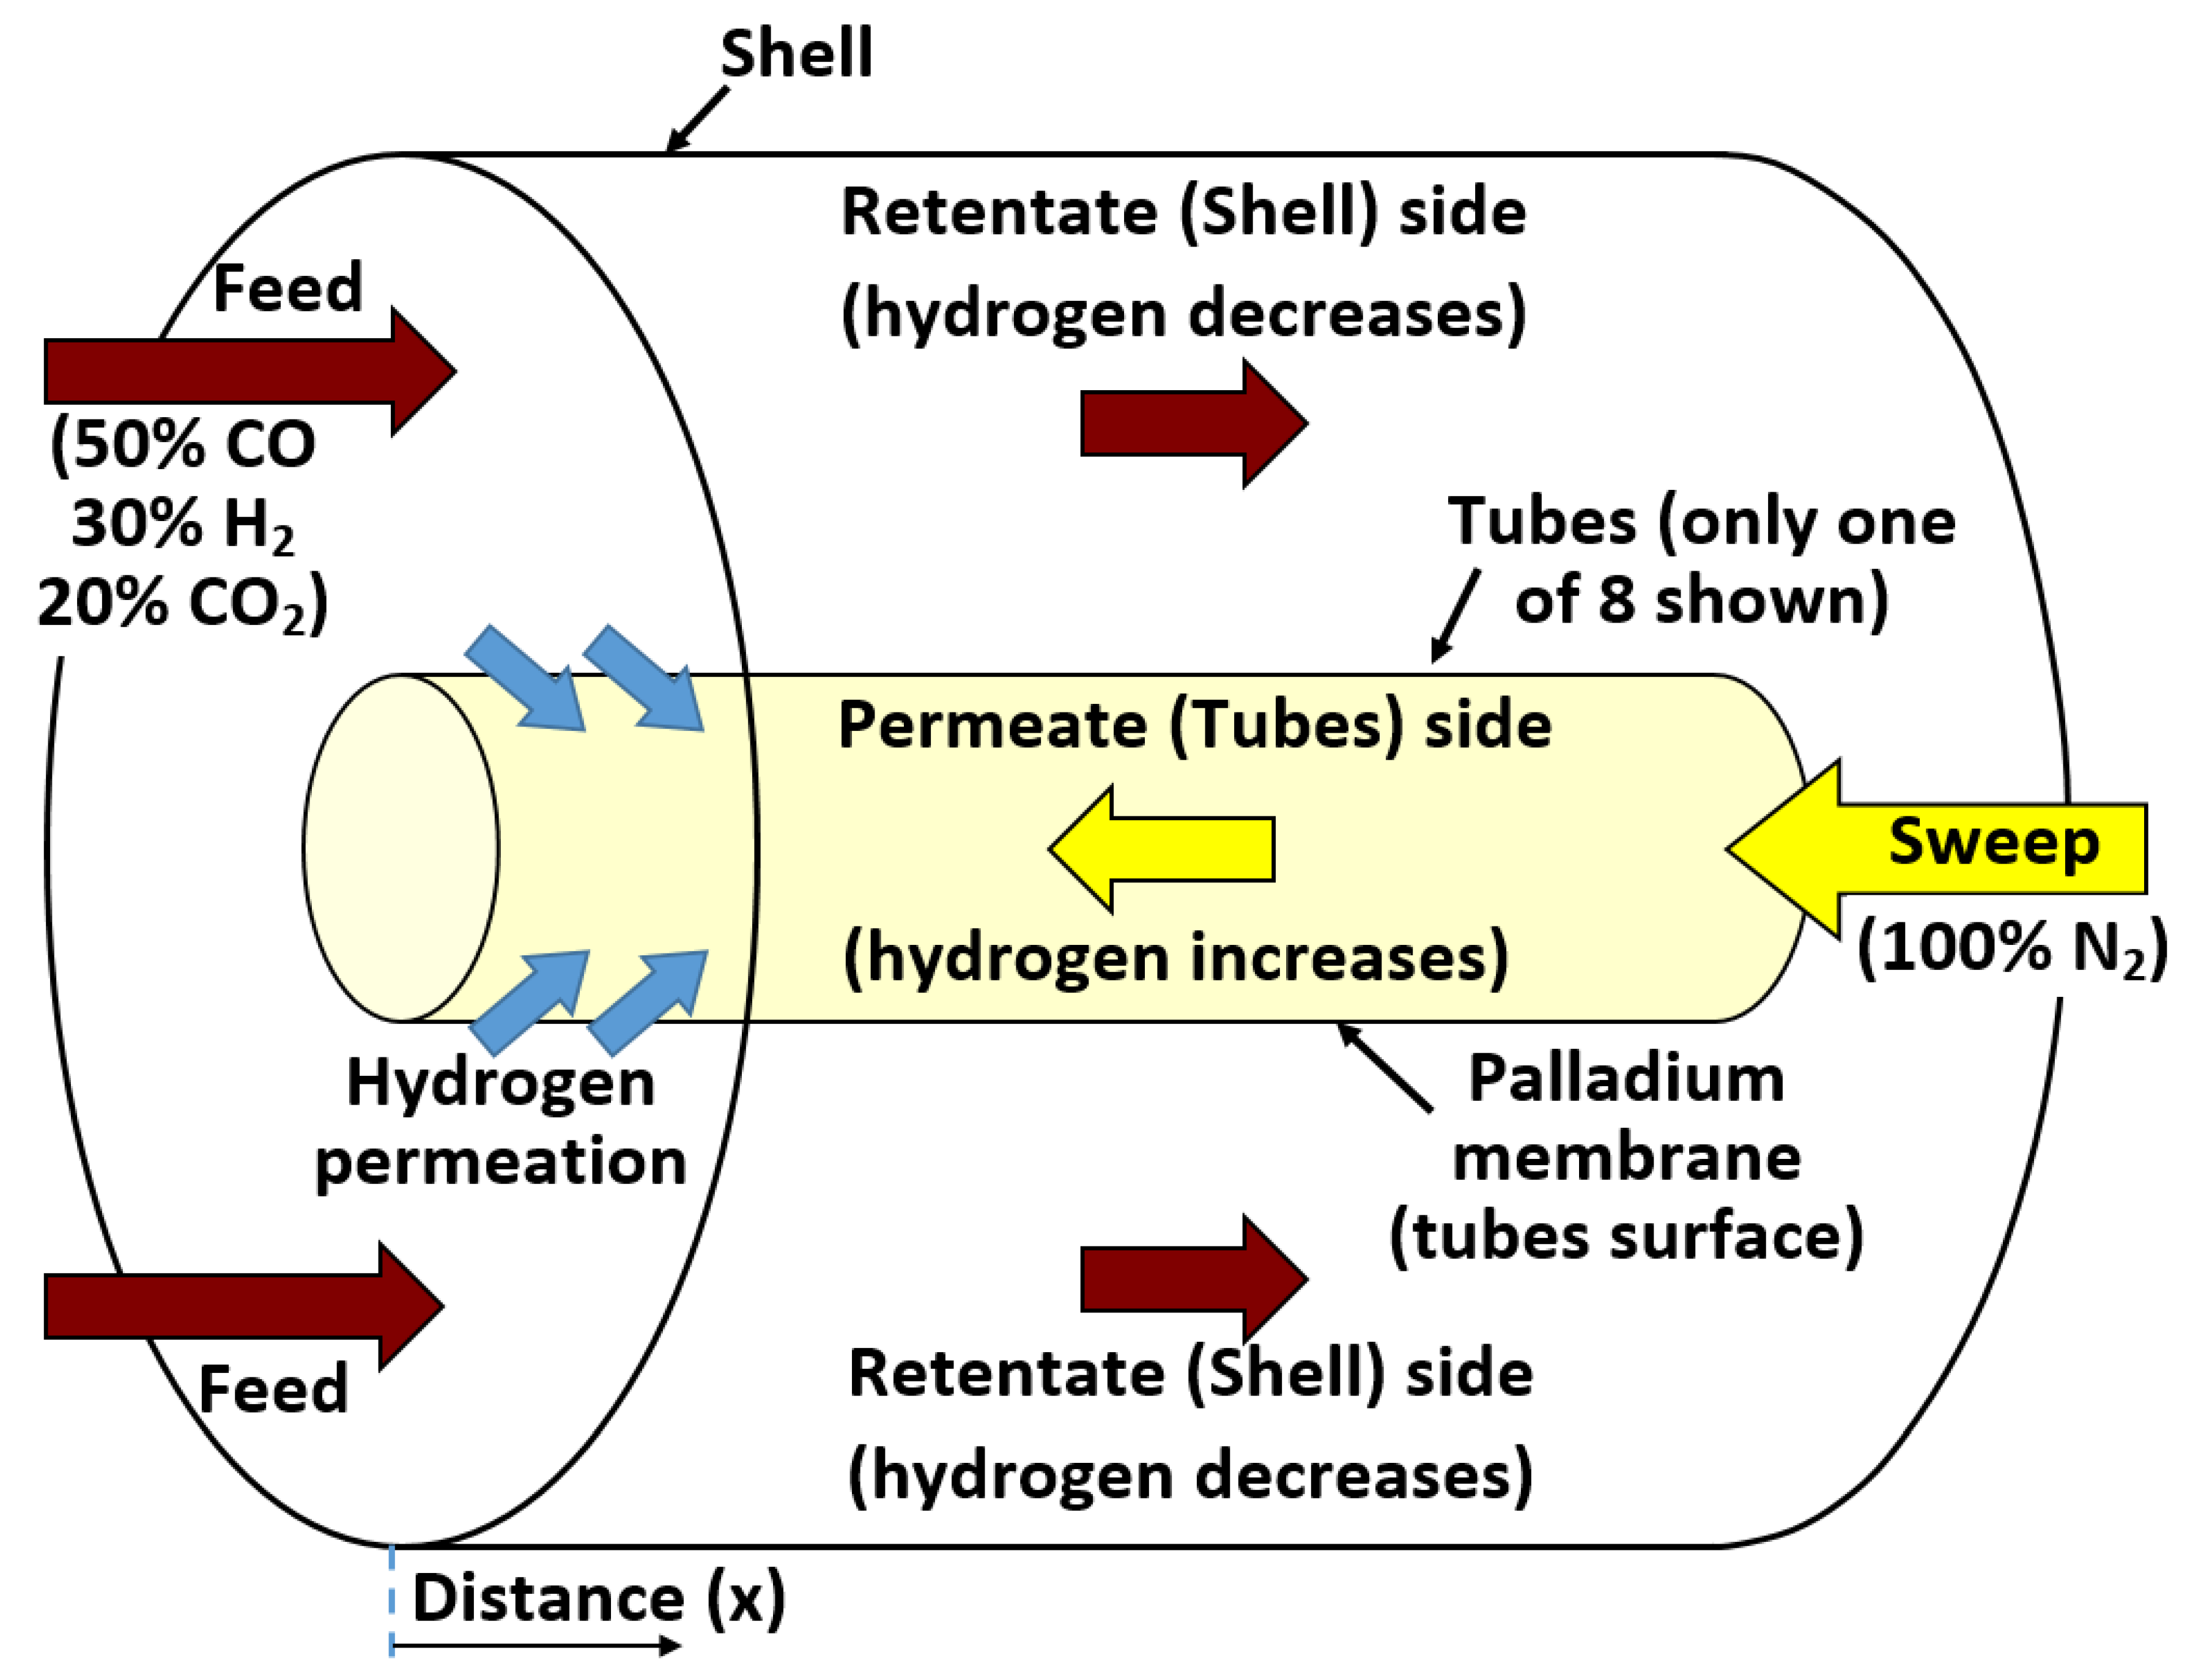
Figure 3.
Illustration of the segments of the membrane reactor near is left end.
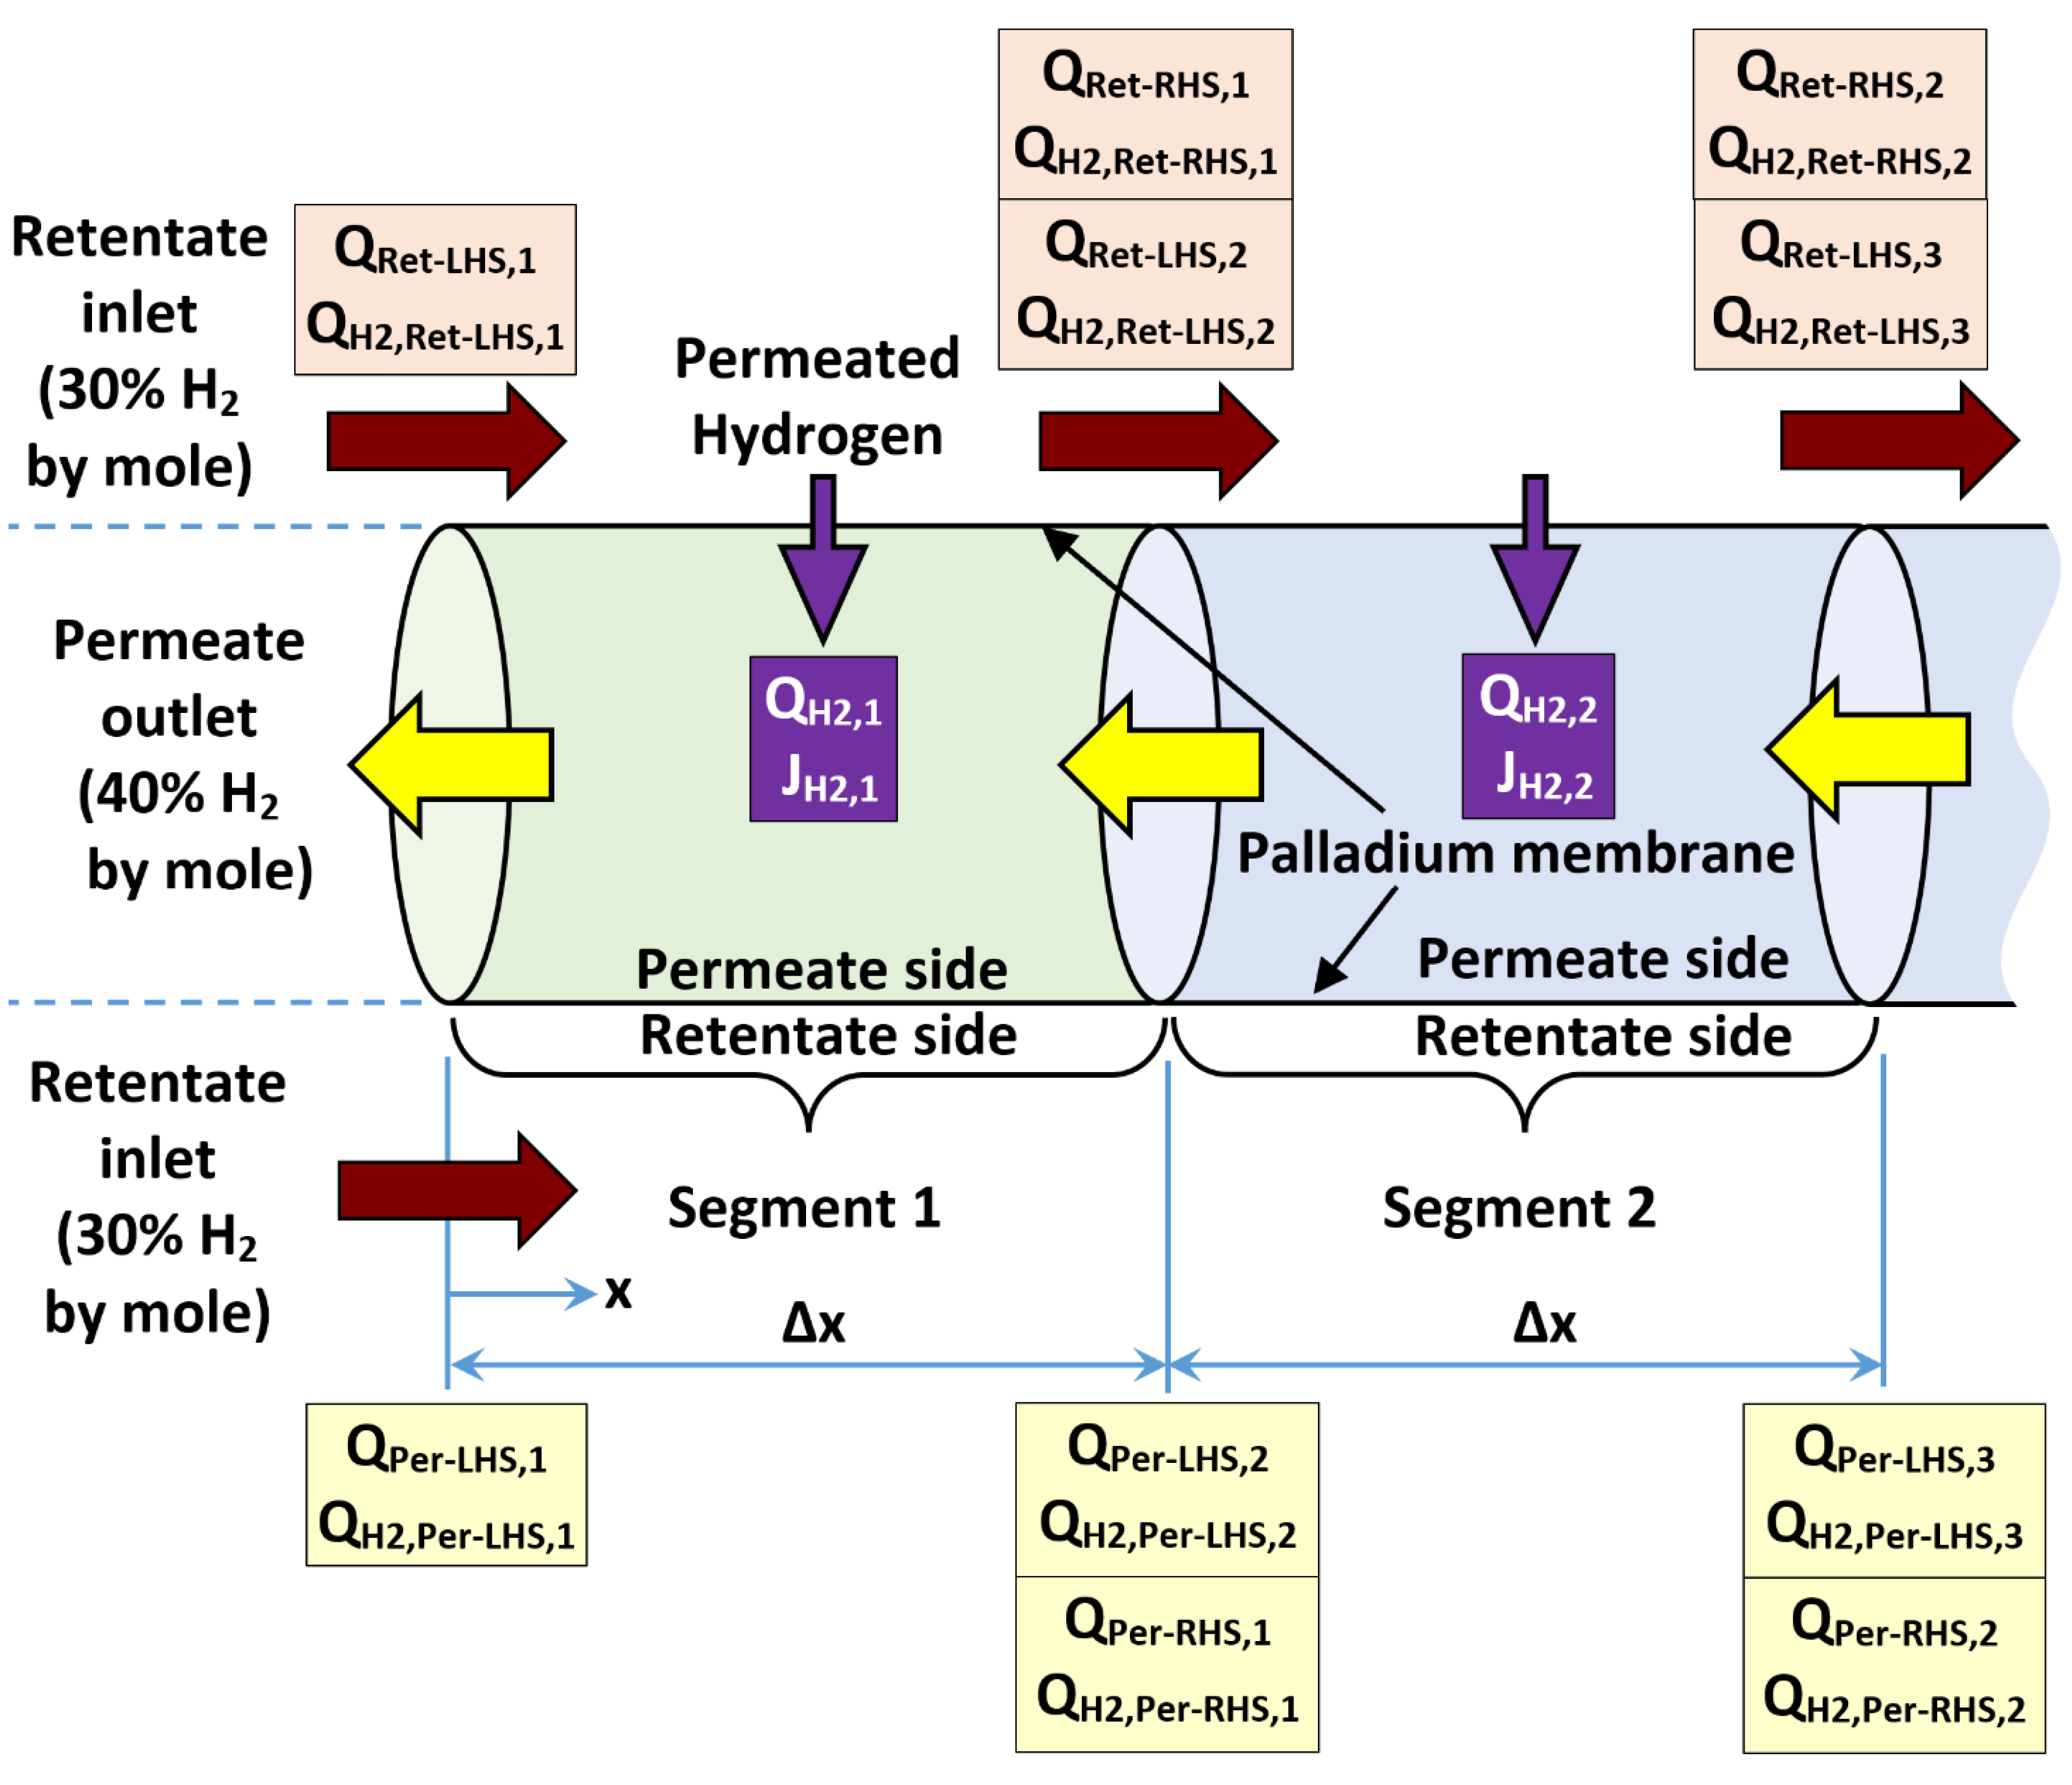
Figure 4.
Commutative hydrogen recovery for the base case, with two spatial resolutions (the 200 segments represent the normal resolution).
Figure 4.
Commutative hydrogen recovery for the base case, with two spatial resolutions (the 200 segments represent the normal resolution).
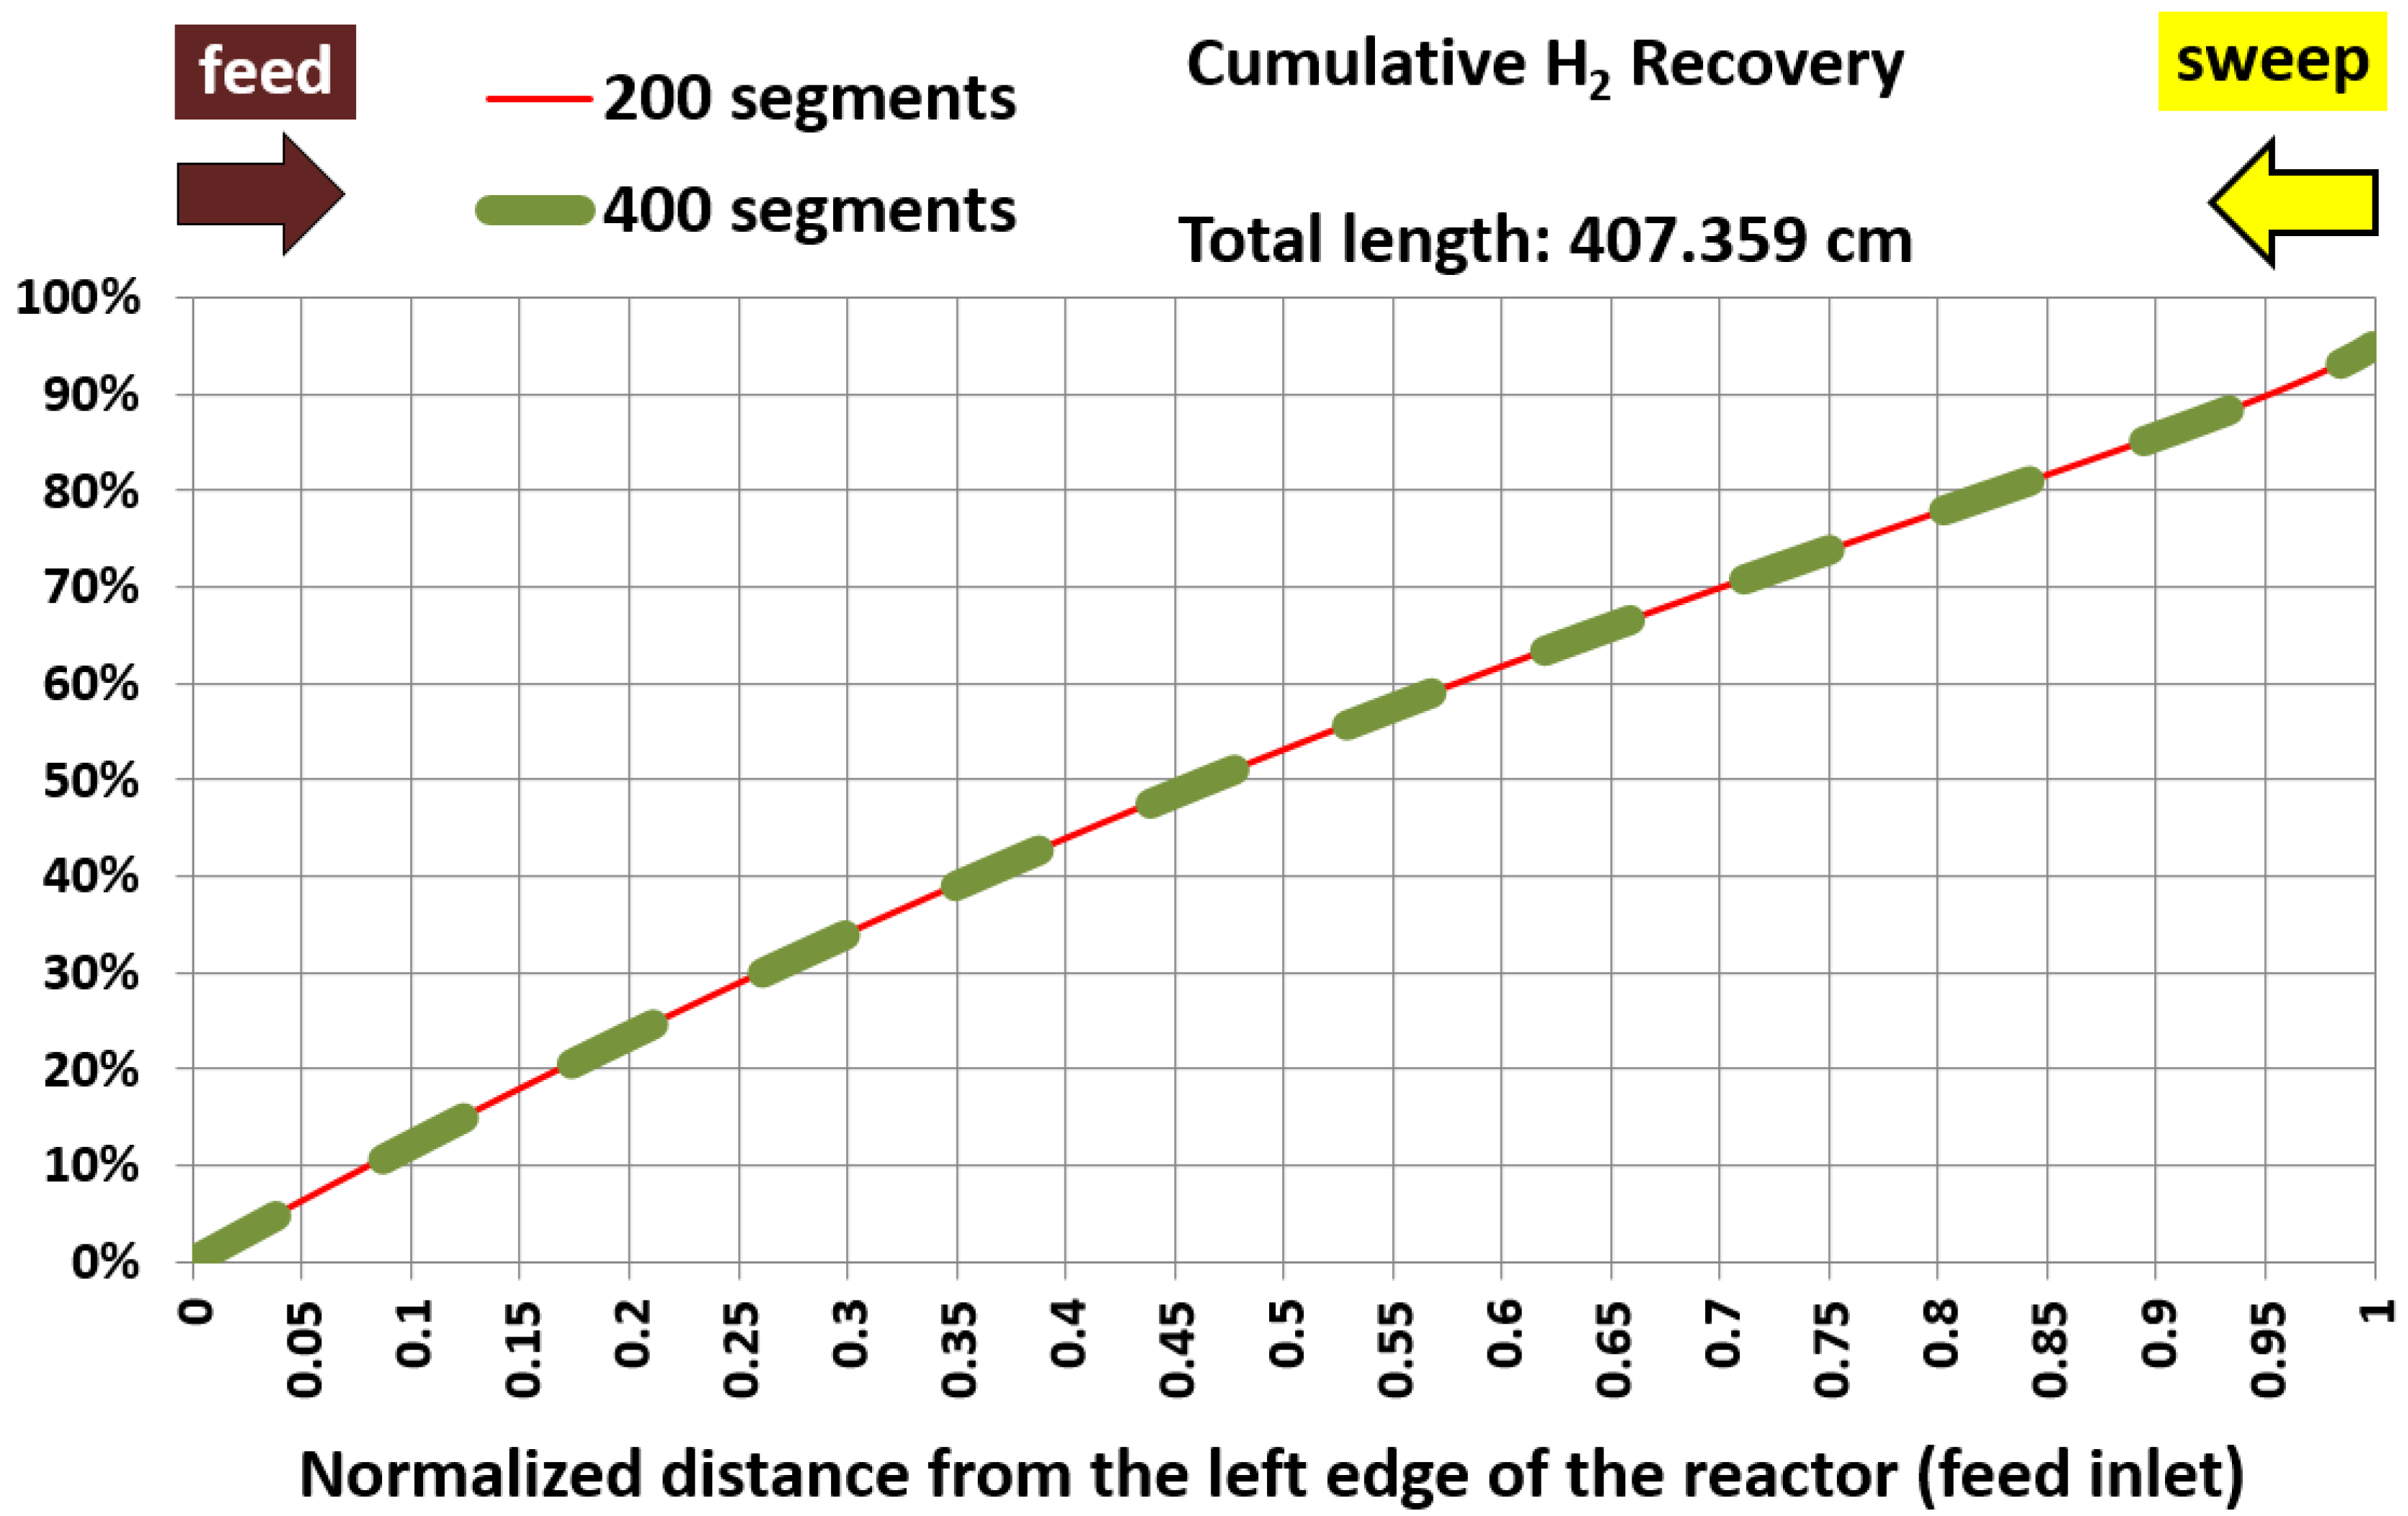
Figure 5.
Segmental hydrogen recovery for the base case, with two spatial resolutions (the 200 segments represent the normal resolution).
Figure 5.
Segmental hydrogen recovery for the base case, with two spatial resolutions (the 200 segments represent the normal resolution).
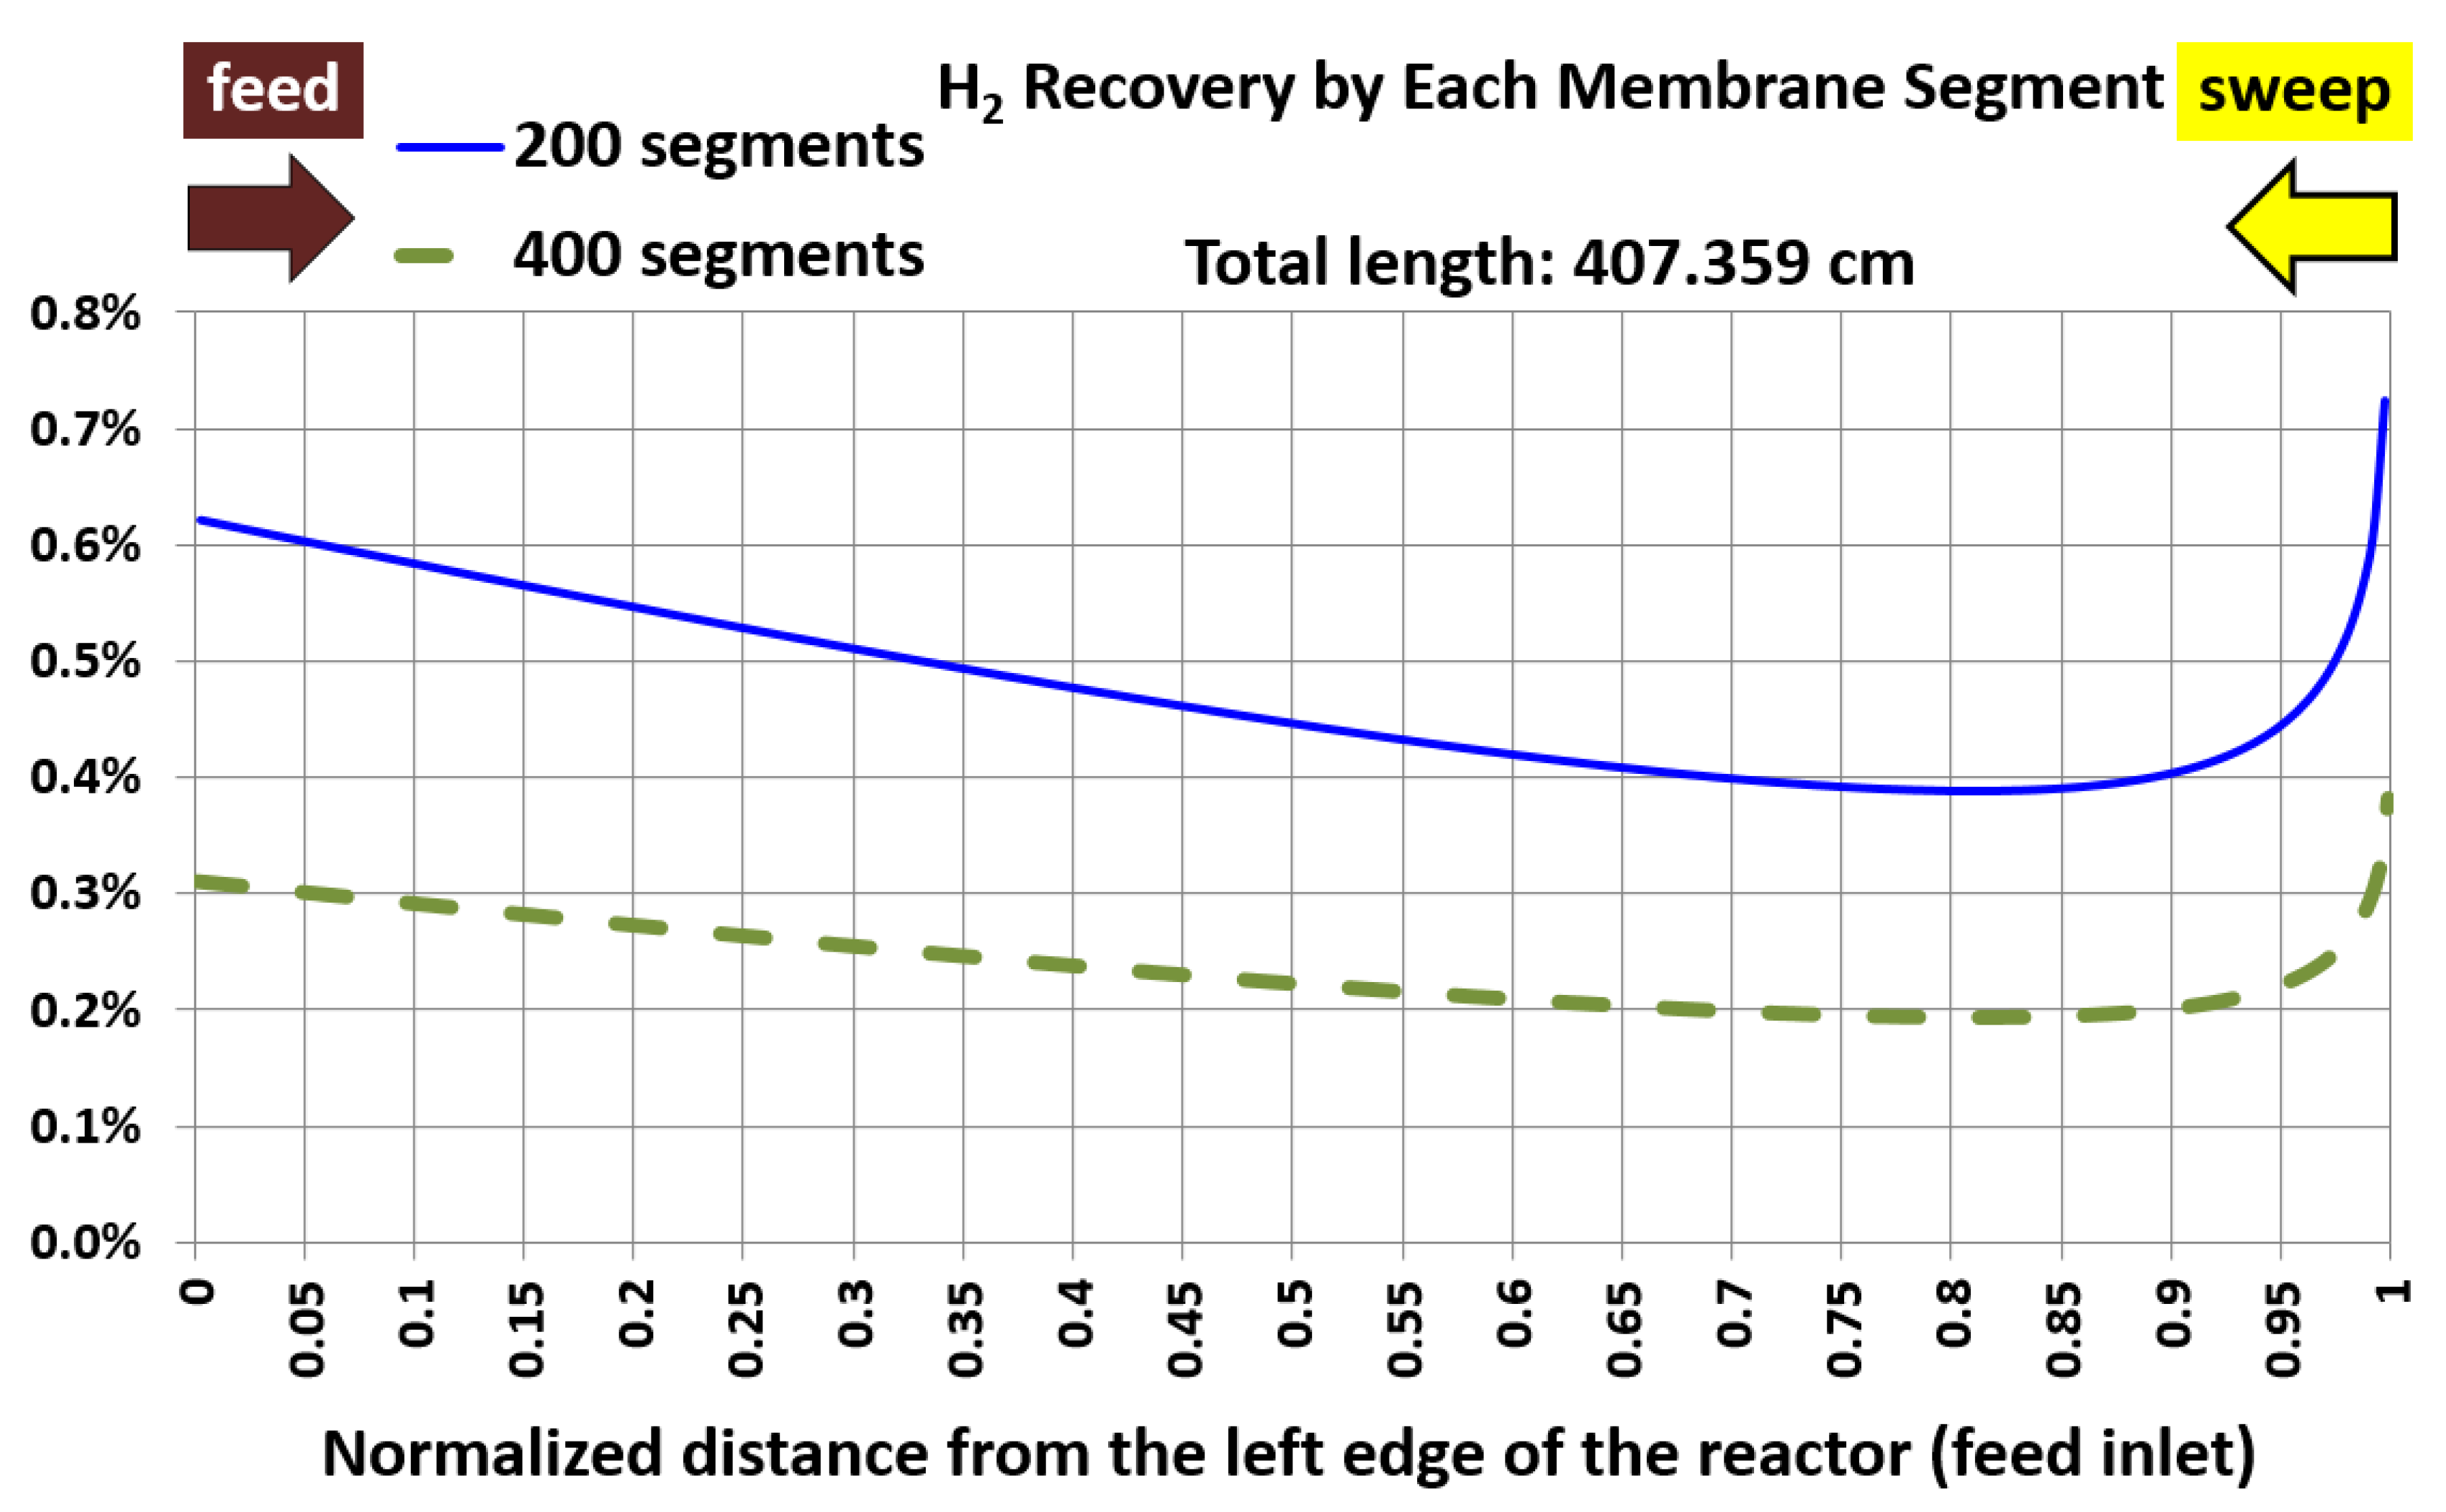
Figure 6.
Hydrogen mole fraction in the retentate stream for the base case, with two spatial resolutions (the 200 segments represent the normal resolution).
Figure 6.
Hydrogen mole fraction in the retentate stream for the base case, with two spatial resolutions (the 200 segments represent the normal resolution).
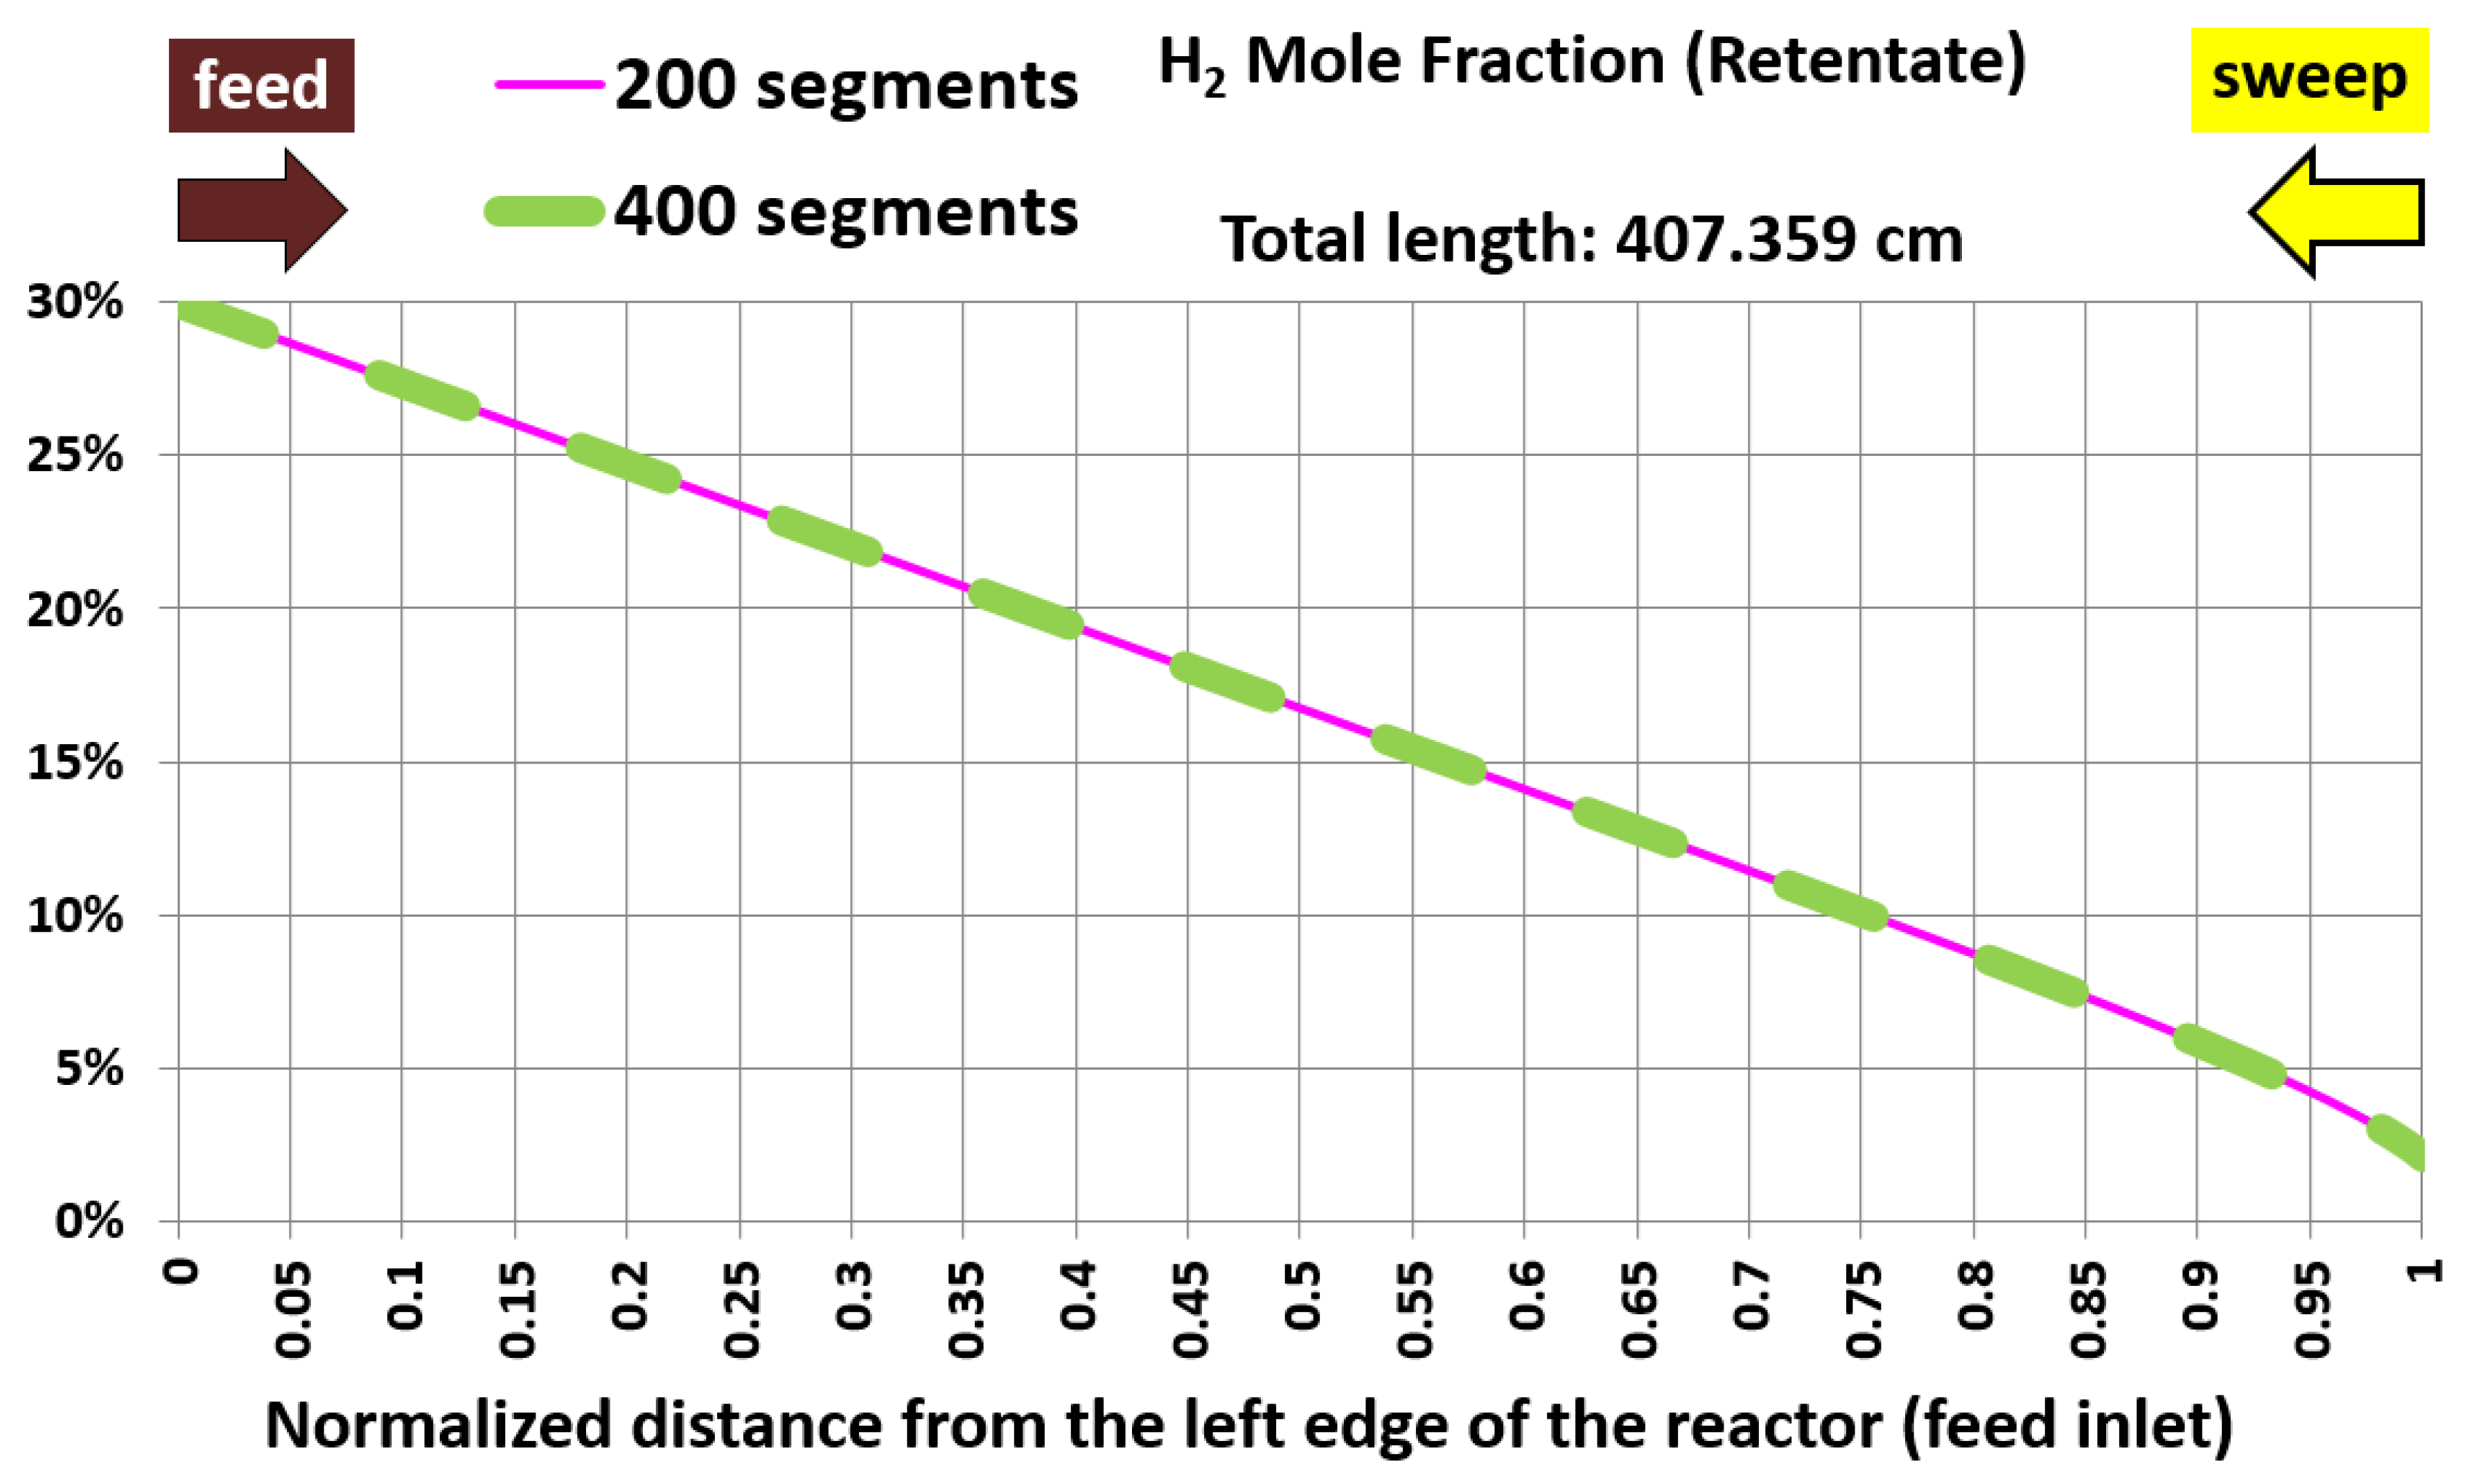
Figure 7.
Hydrogen mole fraction in the permeate stream for the base case, with two spatial resolutions (the 200 segments represent the normal resolution).
Figure 7.
Hydrogen mole fraction in the permeate stream for the base case, with two spatial resolutions (the 200 segments represent the normal resolution).
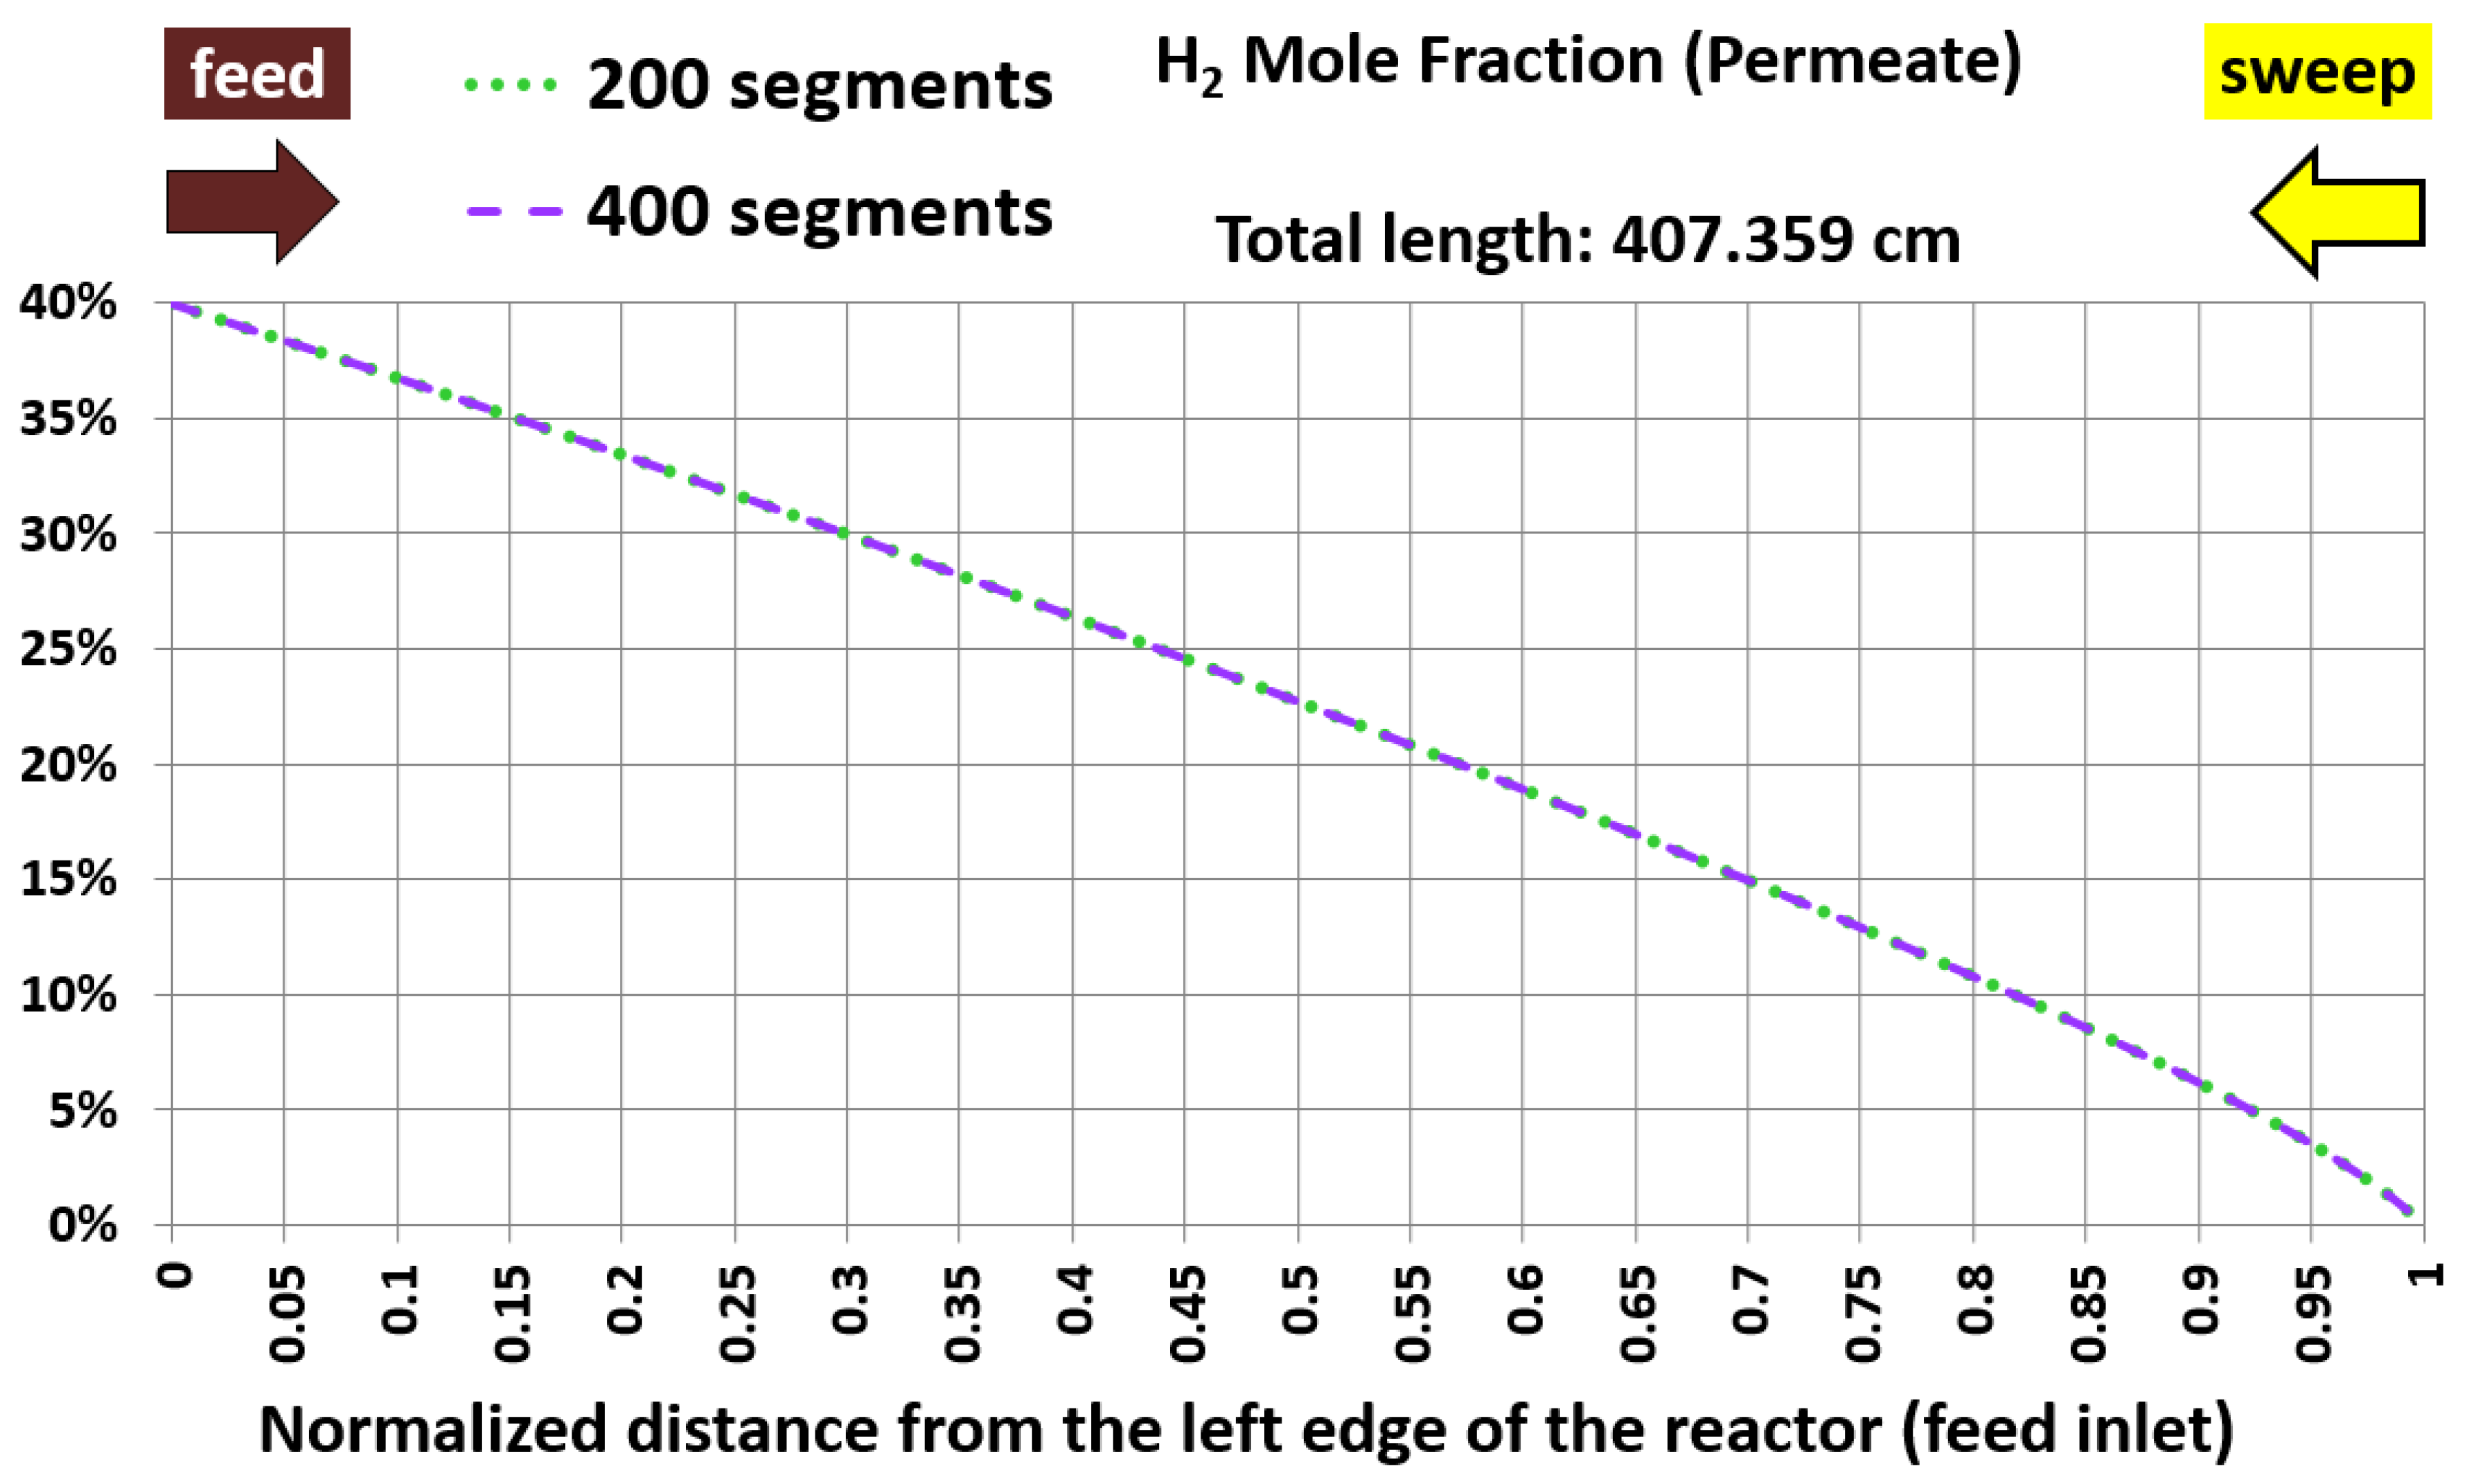
Figure 8.
Membrane length as a function of the temperature in the membrane reactor.

Figure 9.
Average hydrogen permeation mass flux as a function of the temperature in the membrane reactor.
Figure 9.
Average hydrogen permeation mass flux as a function of the temperature in the membrane reactor.
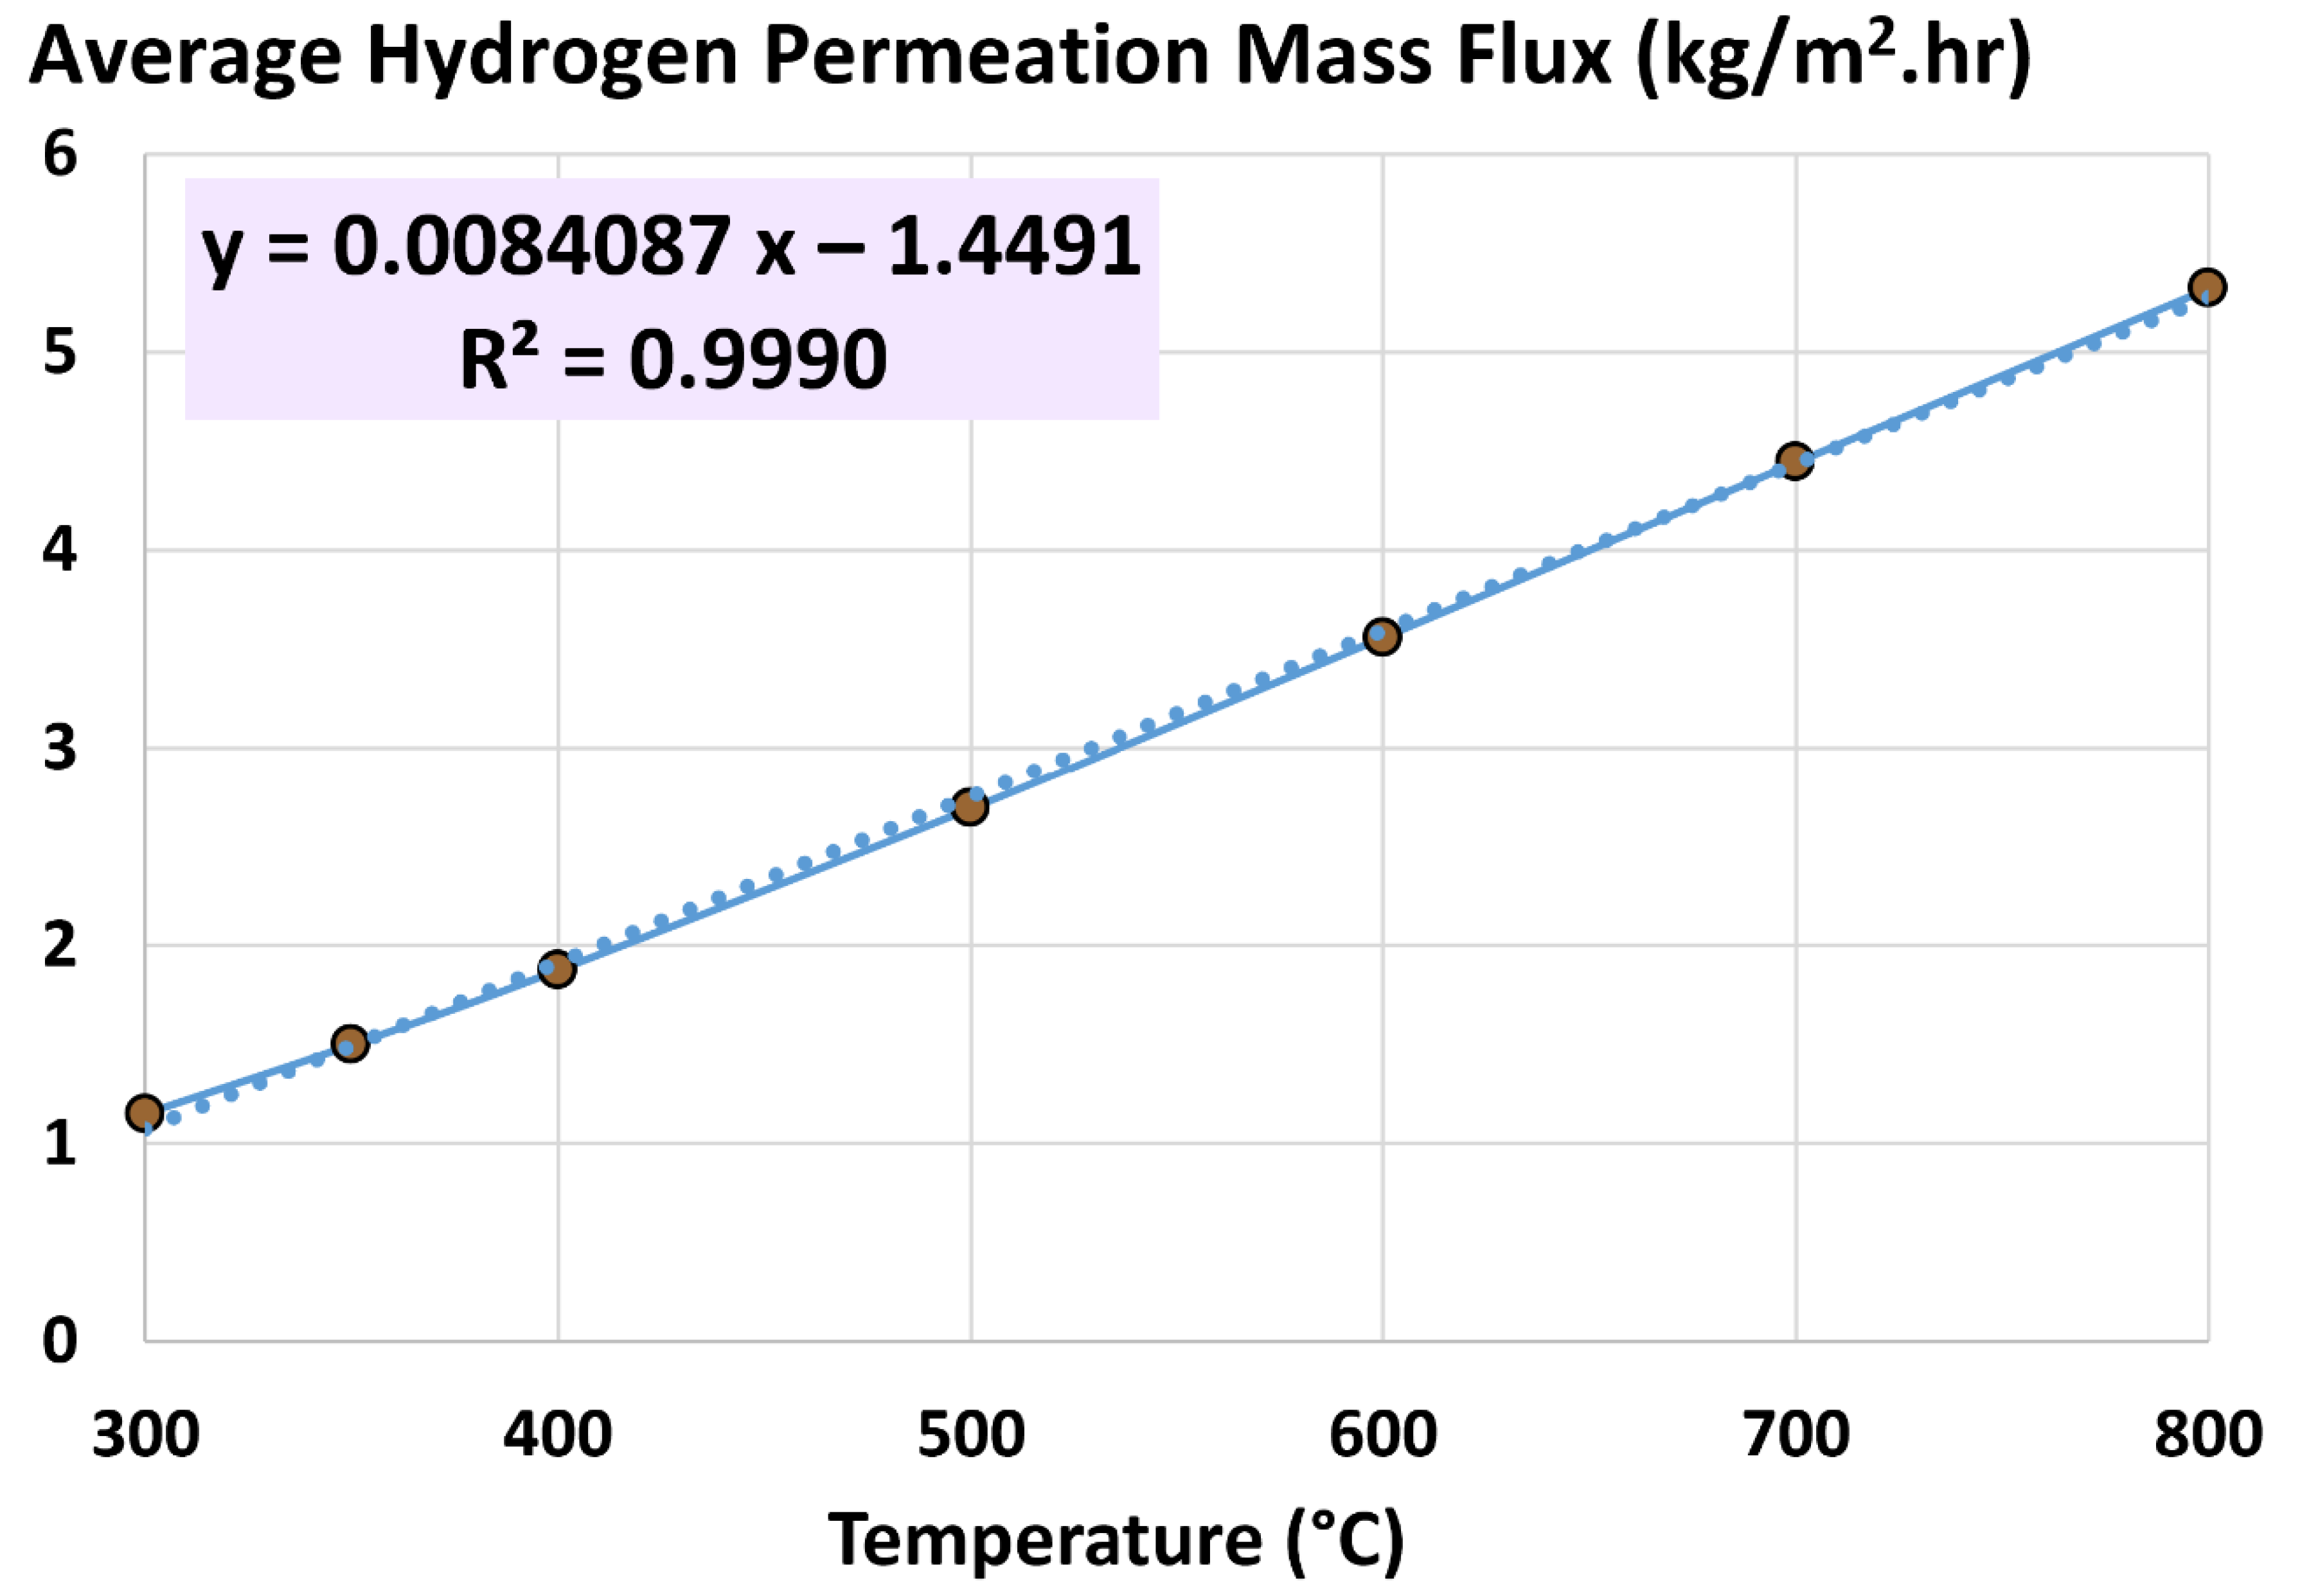
Figure 10.
Pressure-square-root difference at the left end of the membrane reactor (x = 0), pressure-square-root difference at the right end of the membrane reactor (x = L), and log mean pressure-square-root difference (LMPD) as functions of the temperature in the membrane reactor.
Figure 10.
Pressure-square-root difference at the left end of the membrane reactor (x = 0), pressure-square-root difference at the right end of the membrane reactor (x = L), and log mean pressure-square-root difference (LMPD) as functions of the temperature in the membrane reactor.
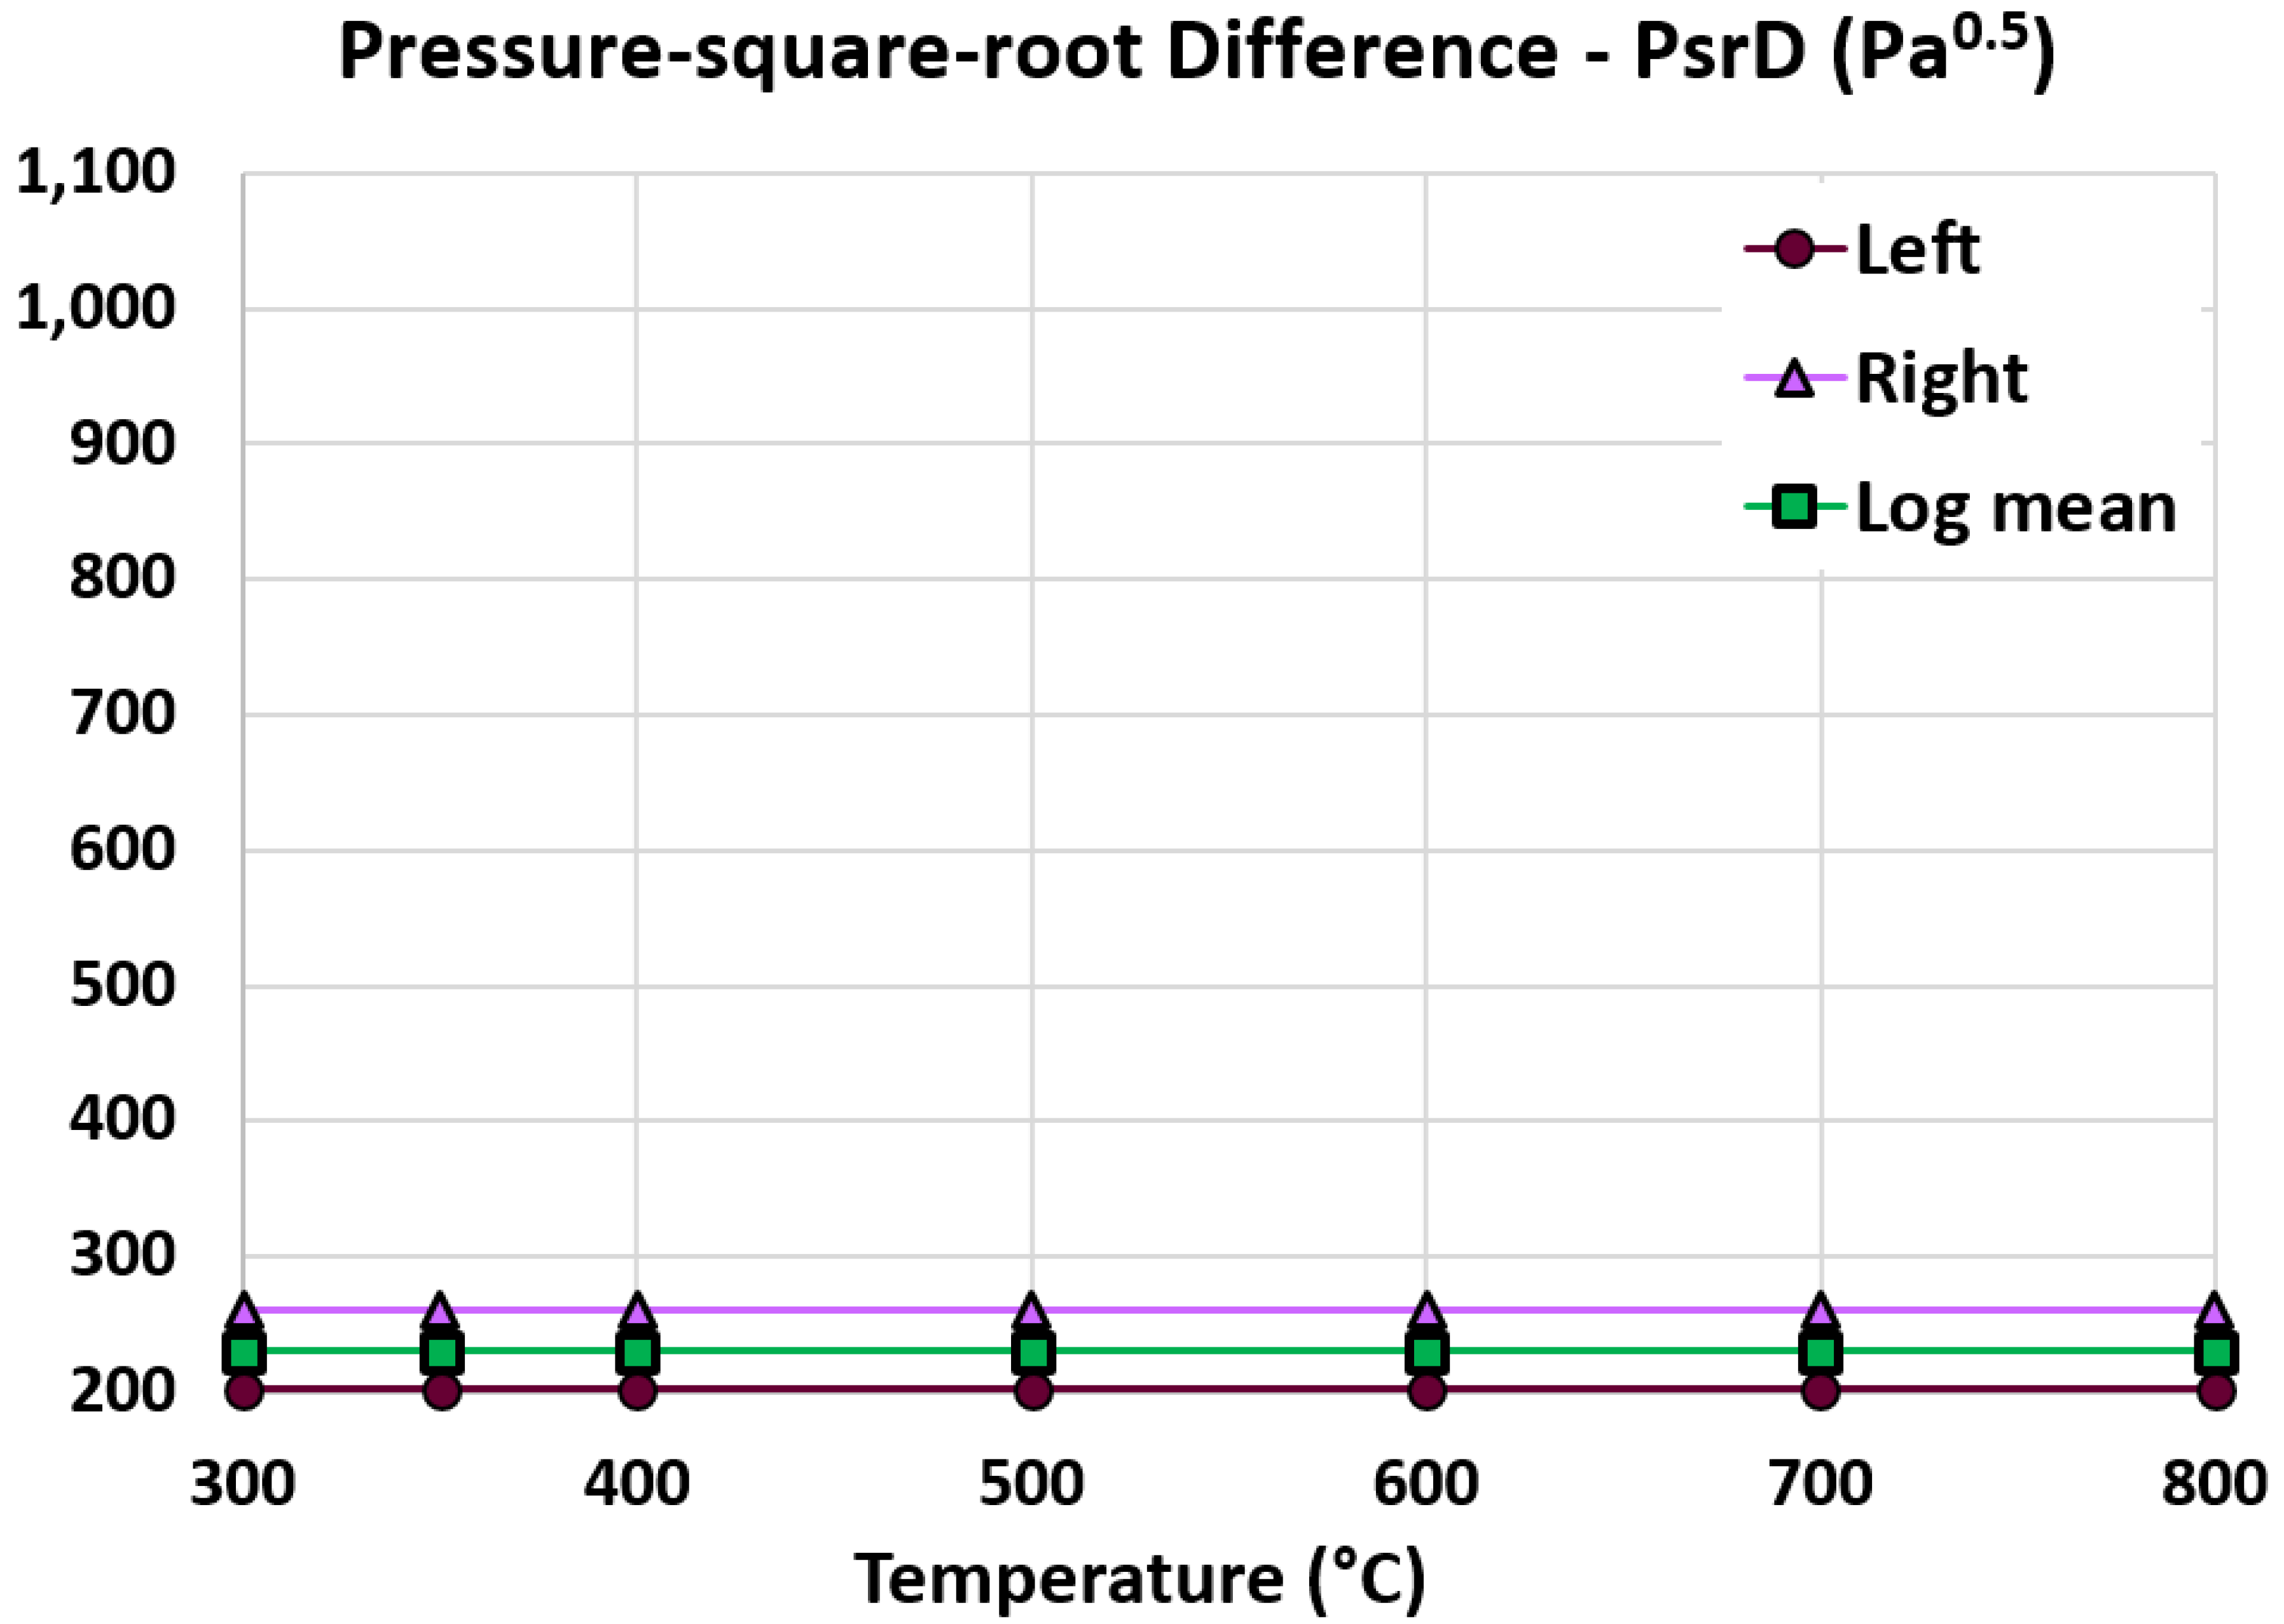
Figure 11.
Local actual permeance, global apparent permeance, and efficiency factor as functions of the temperature in the membrane reactor.
Figure 11.
Local actual permeance, global apparent permeance, and efficiency factor as functions of the temperature in the membrane reactor.
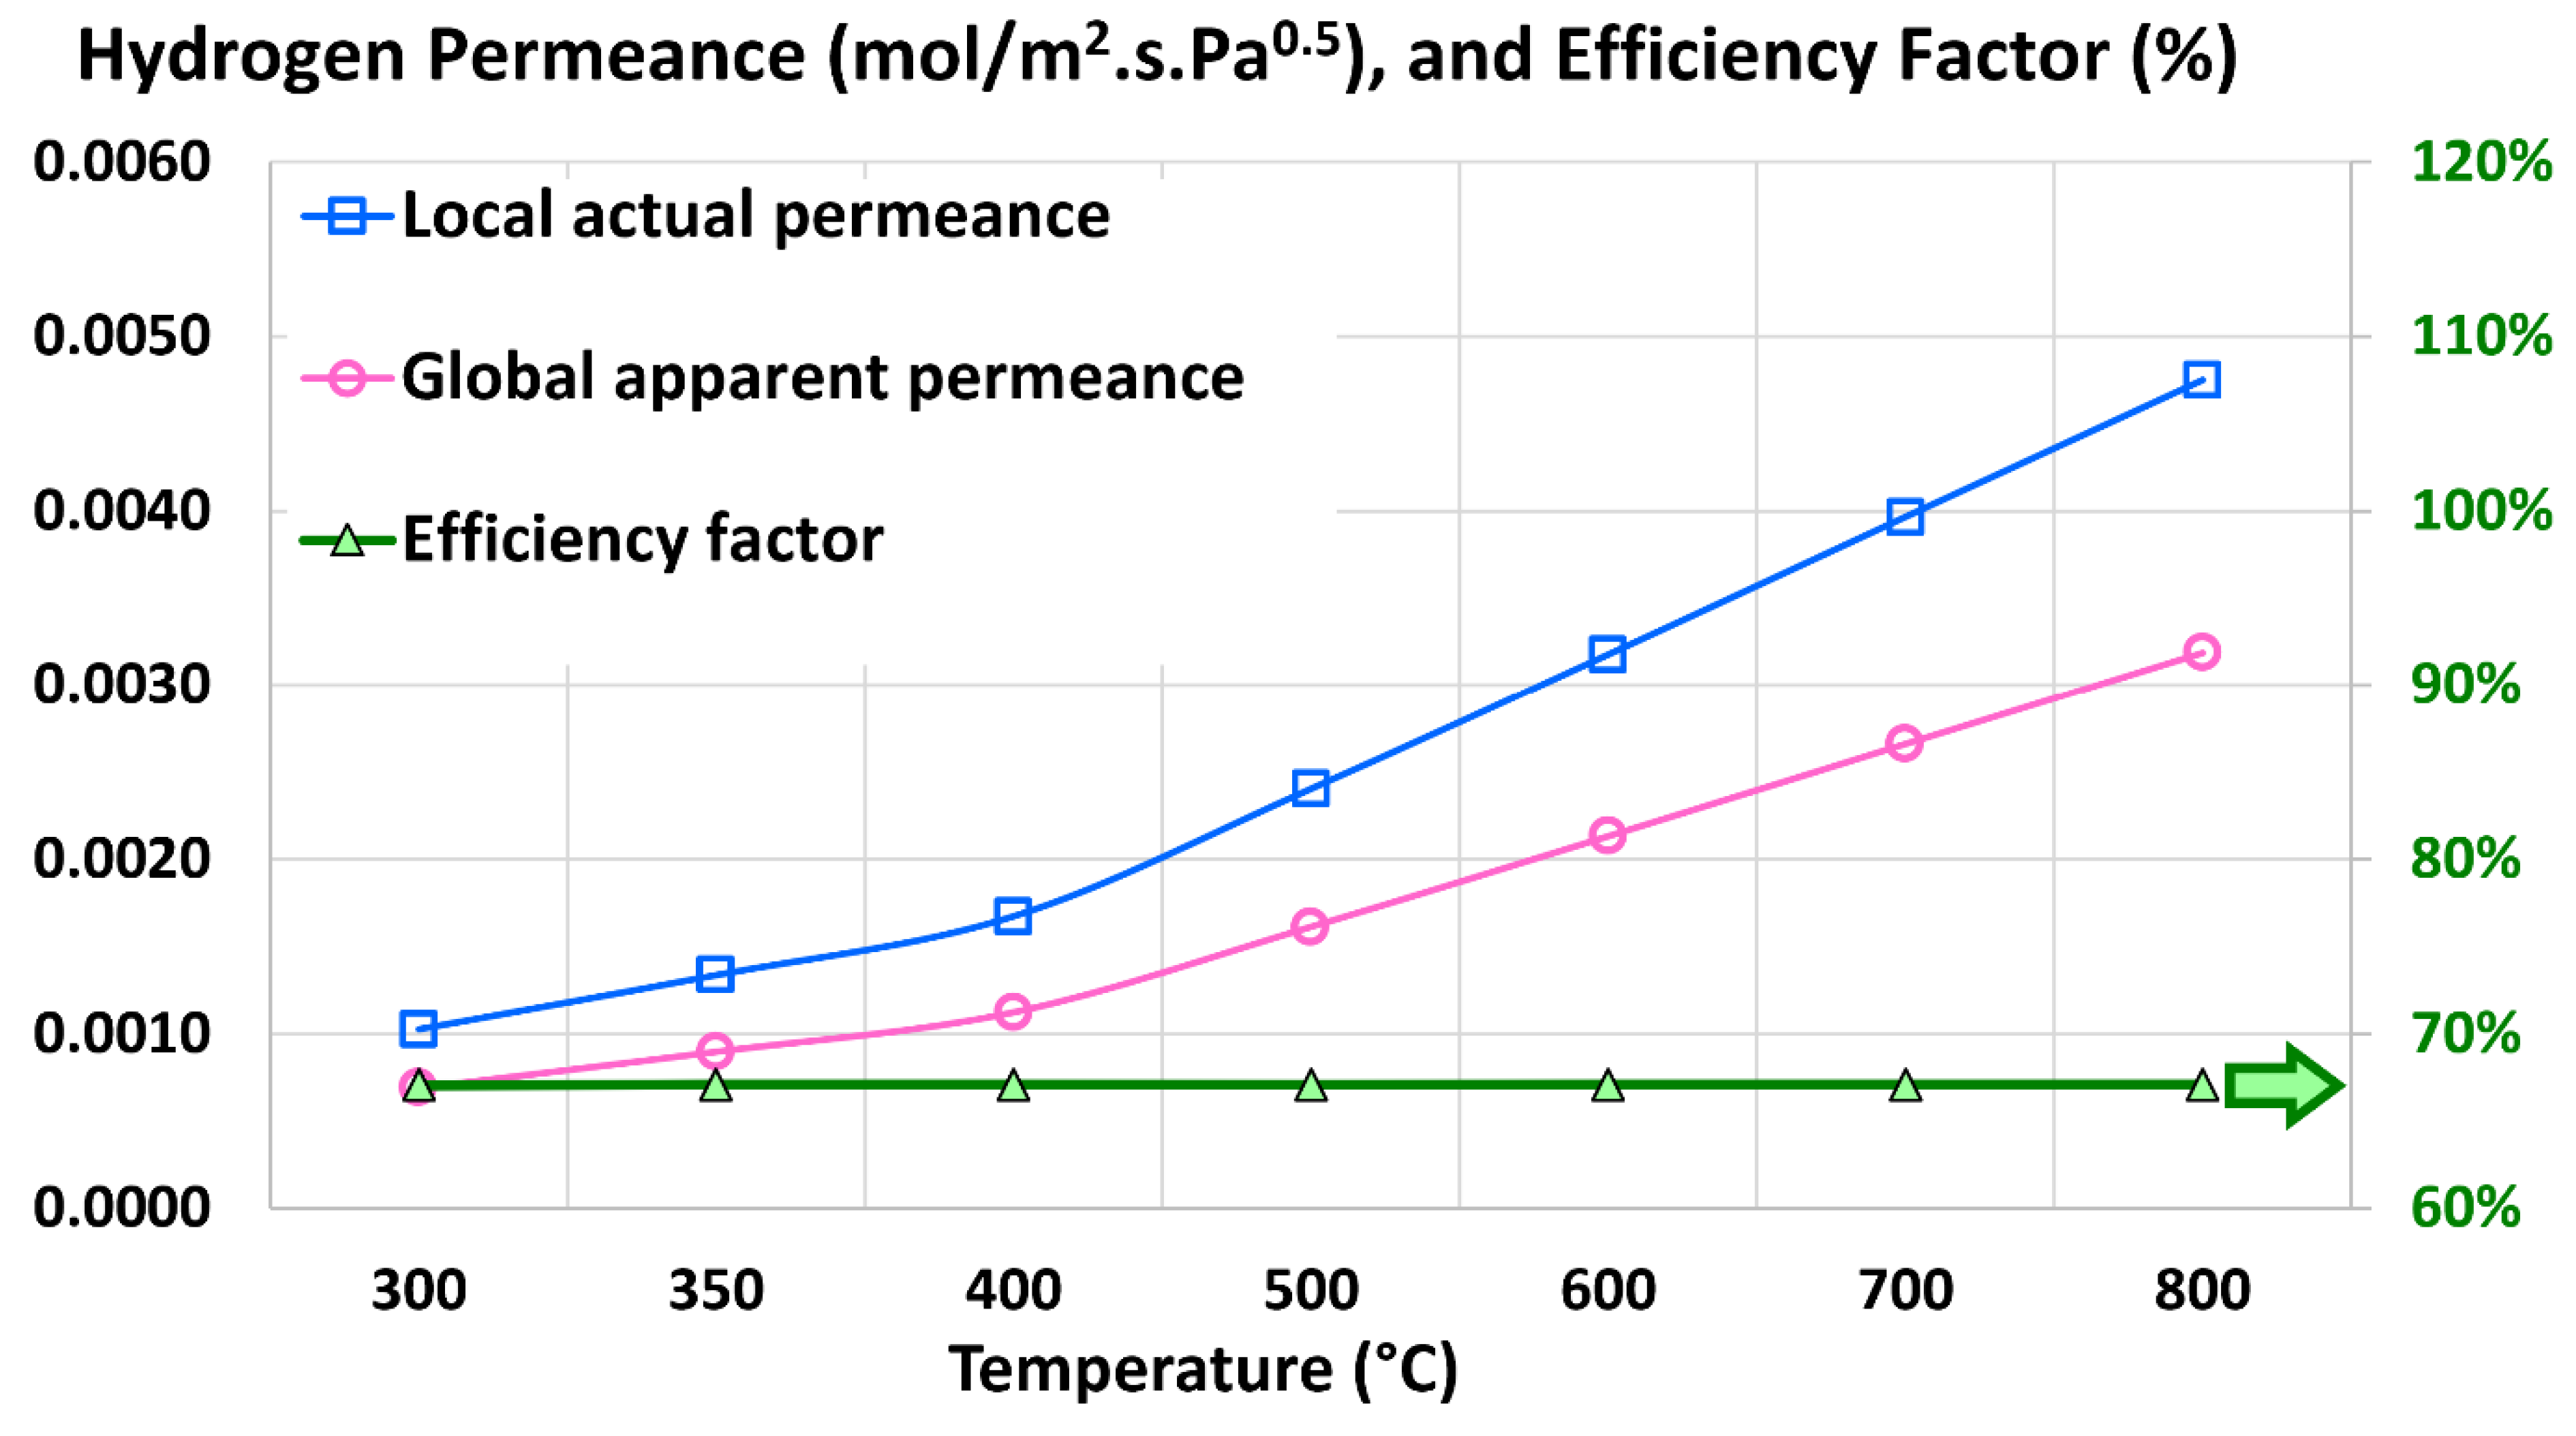
Figure 12.
Membrane length as a function of the retentate pressure in the membrane reactor.
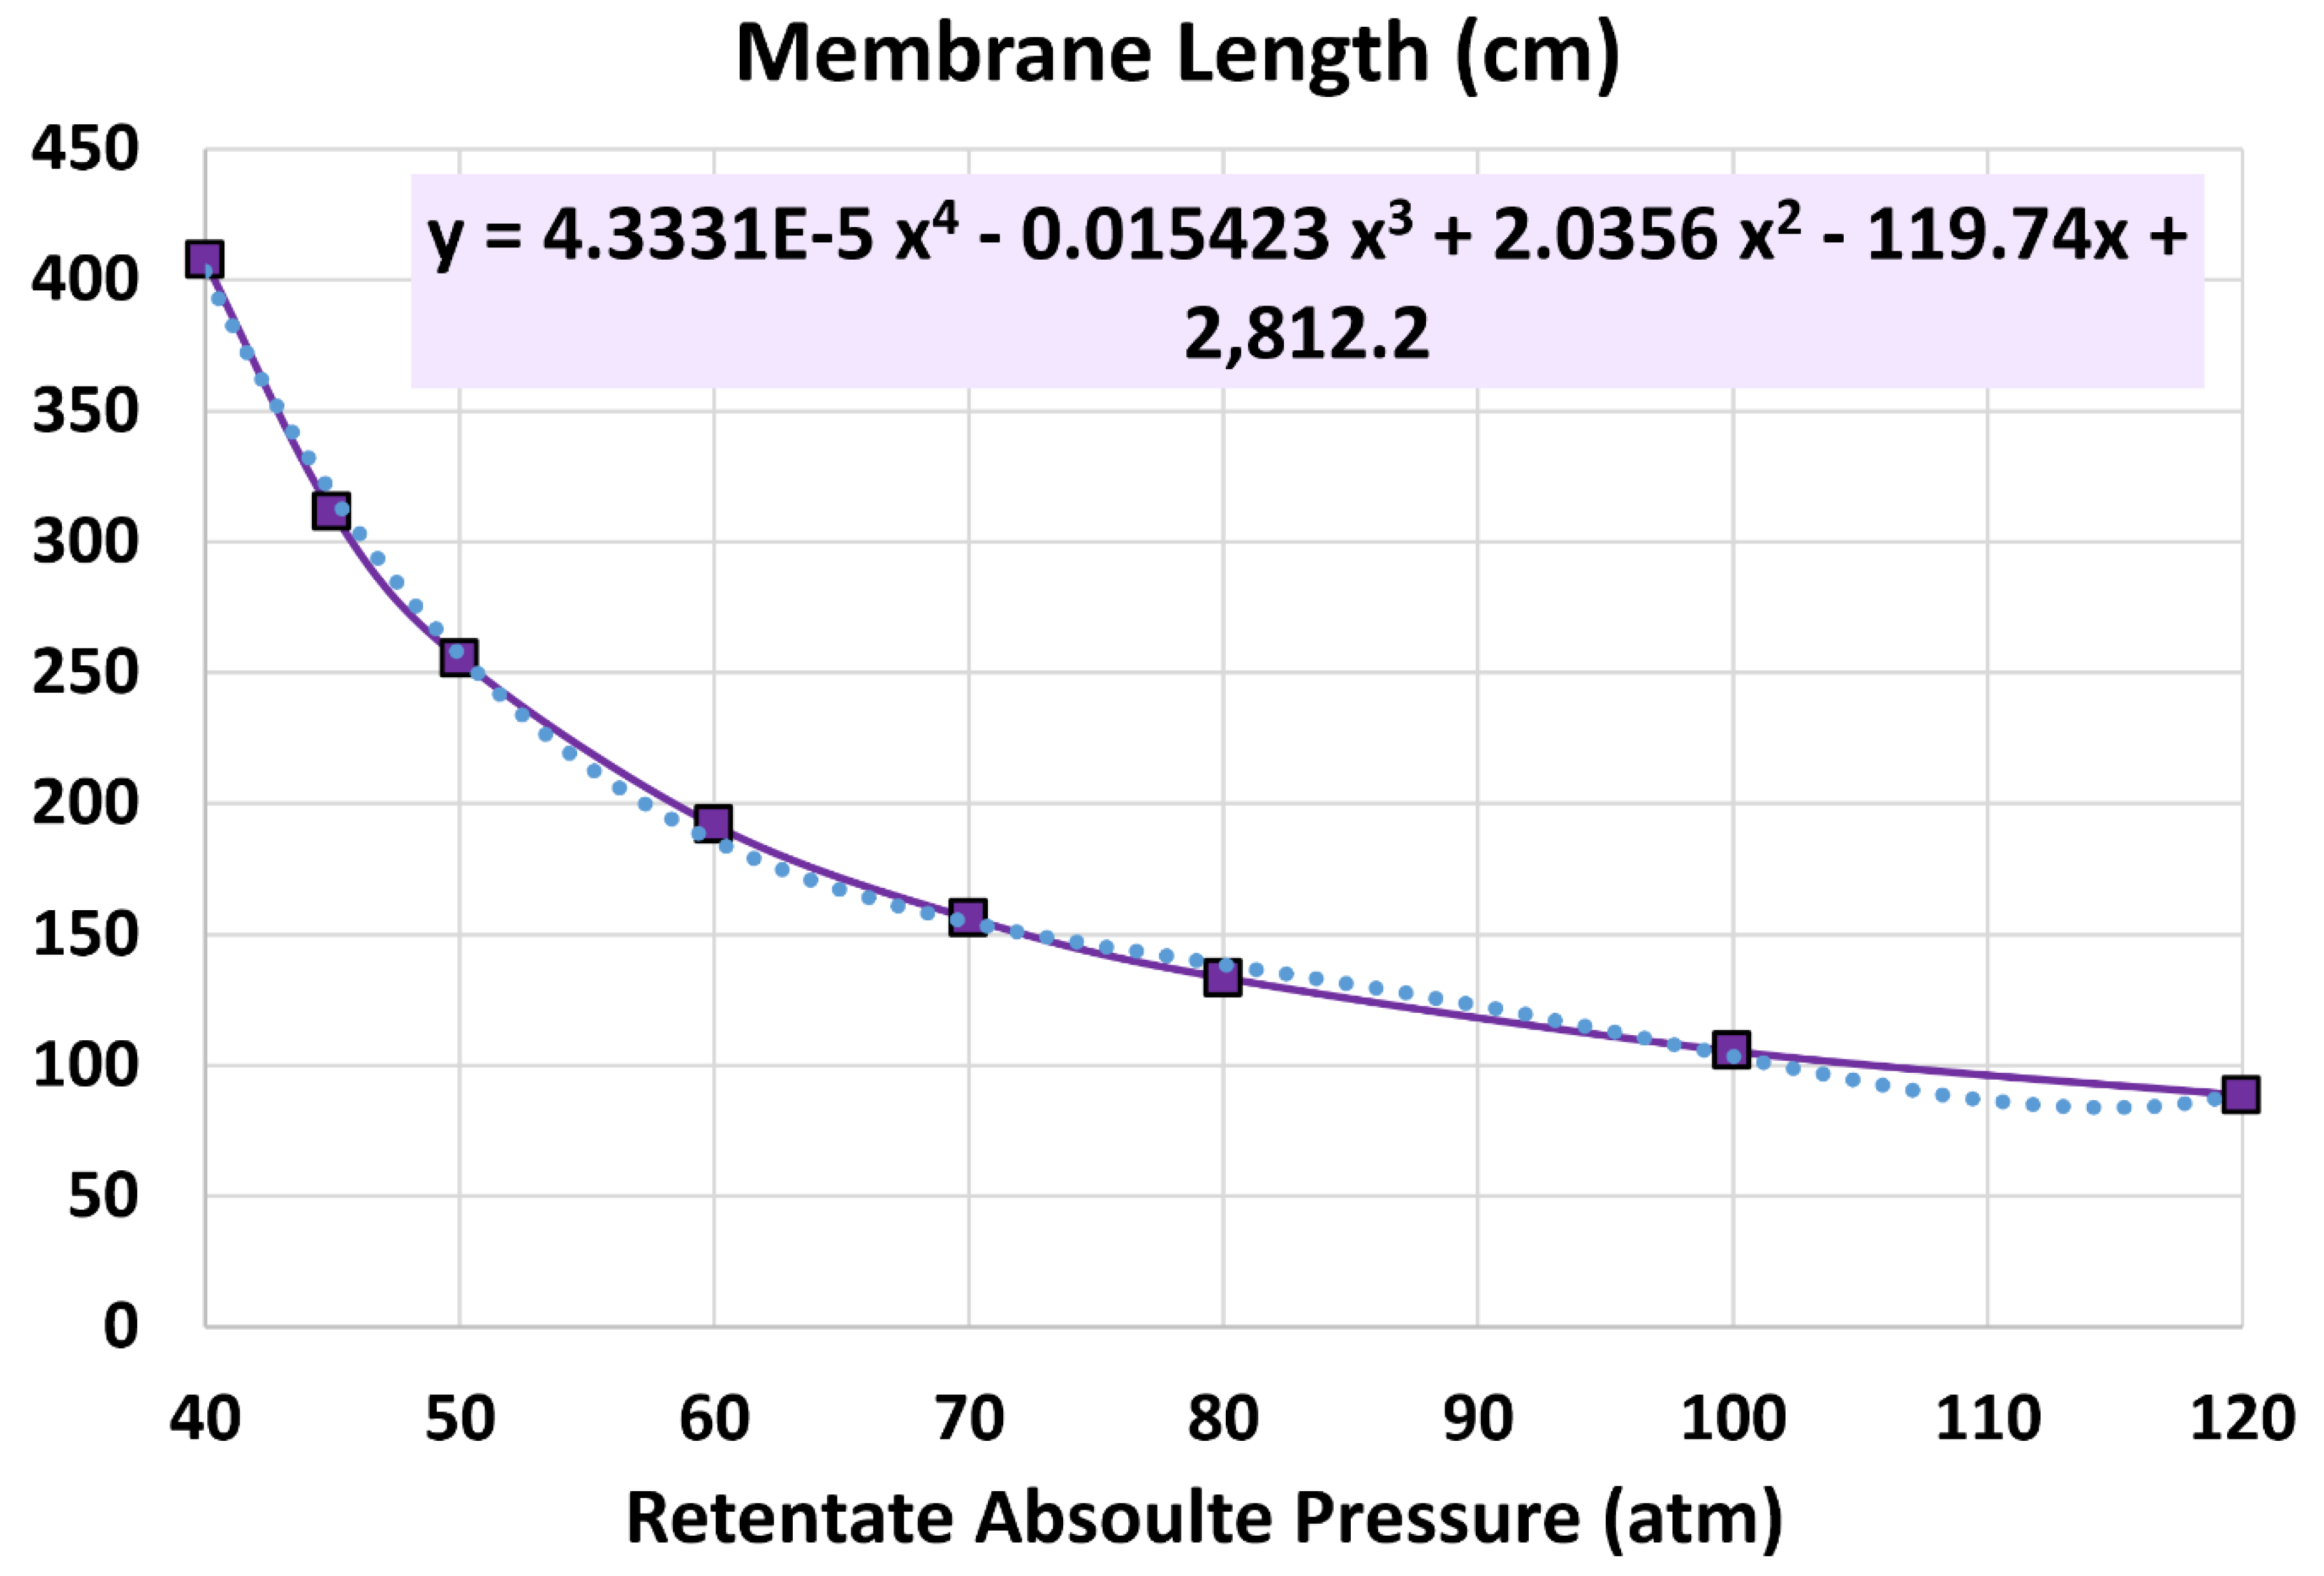
Figure 13.
Average hydrogen permeation mass flux as a function of the retentate pressure in the membrane reactor.
Figure 13.
Average hydrogen permeation mass flux as a function of the retentate pressure in the membrane reactor.
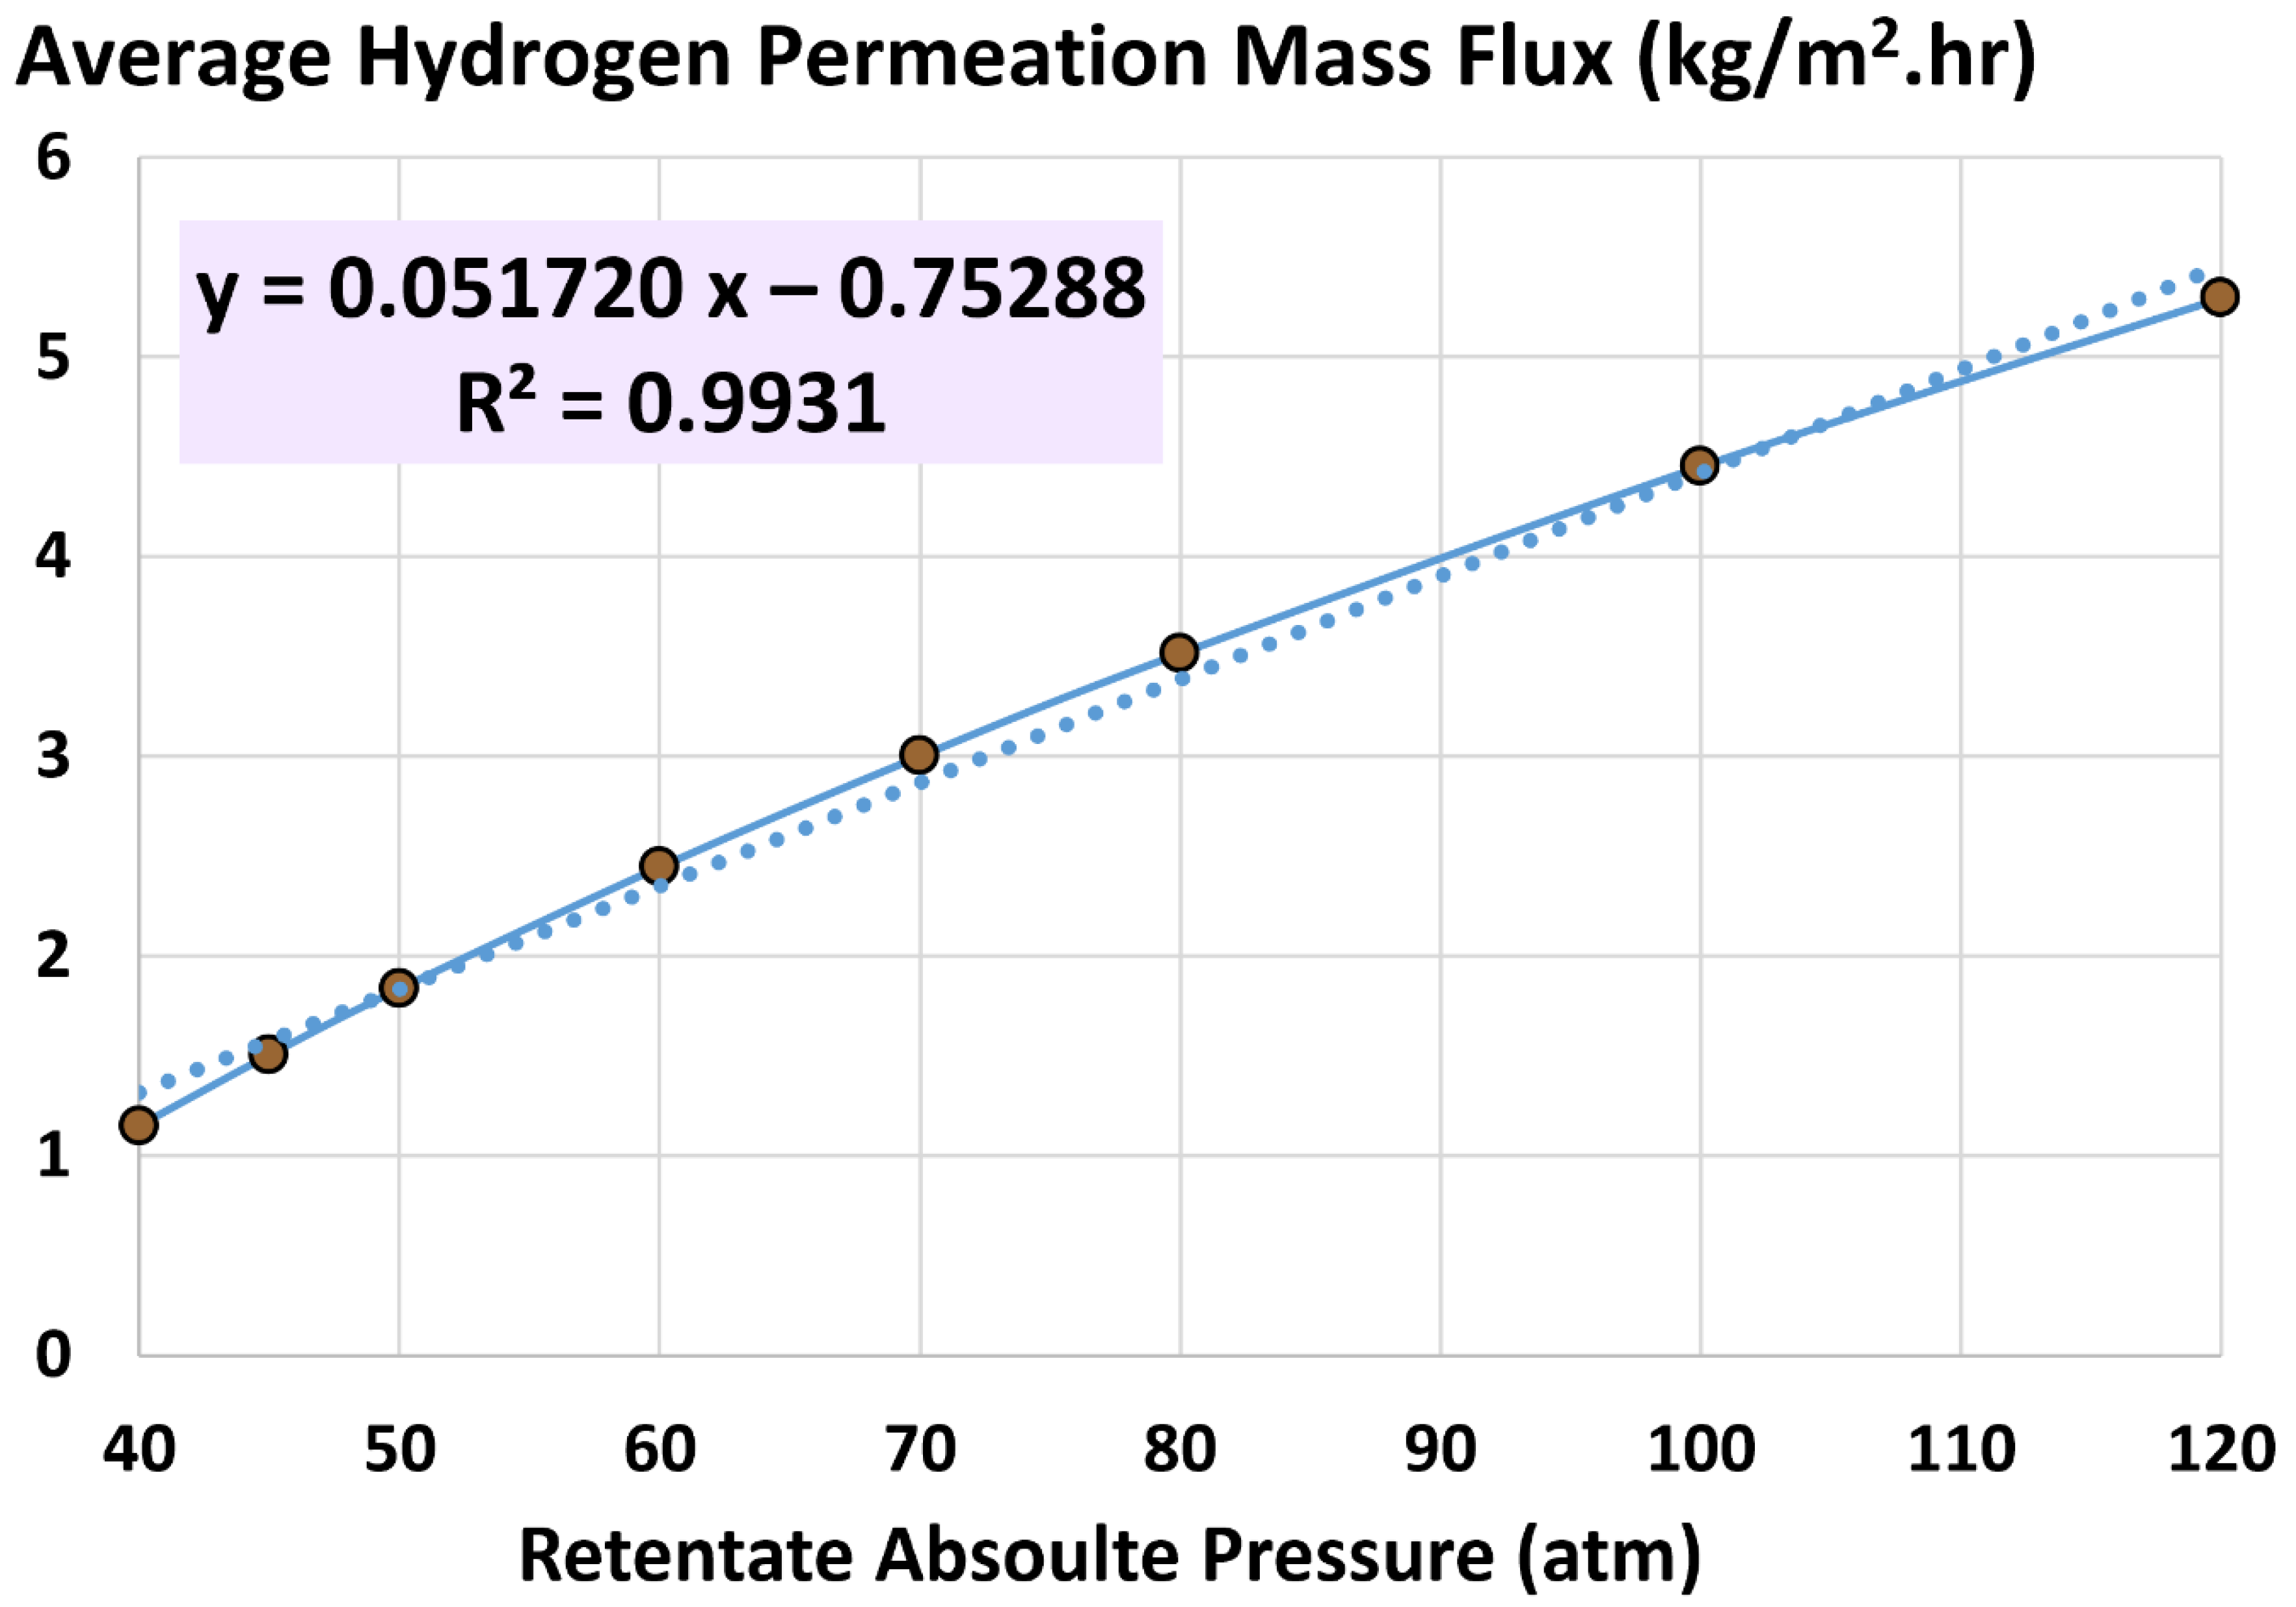
Figure 14.
Pressure-square-root difference at the left end of the membrane reactor (x = 0), pressure-square-root difference at the right end of the membrane reactor (x = L), and log mean pressure-square-root difference (LMPD) as functions of the retentate pressure in the membrane reactor.
Figure 14.
Pressure-square-root difference at the left end of the membrane reactor (x = 0), pressure-square-root difference at the right end of the membrane reactor (x = L), and log mean pressure-square-root difference (LMPD) as functions of the retentate pressure in the membrane reactor.
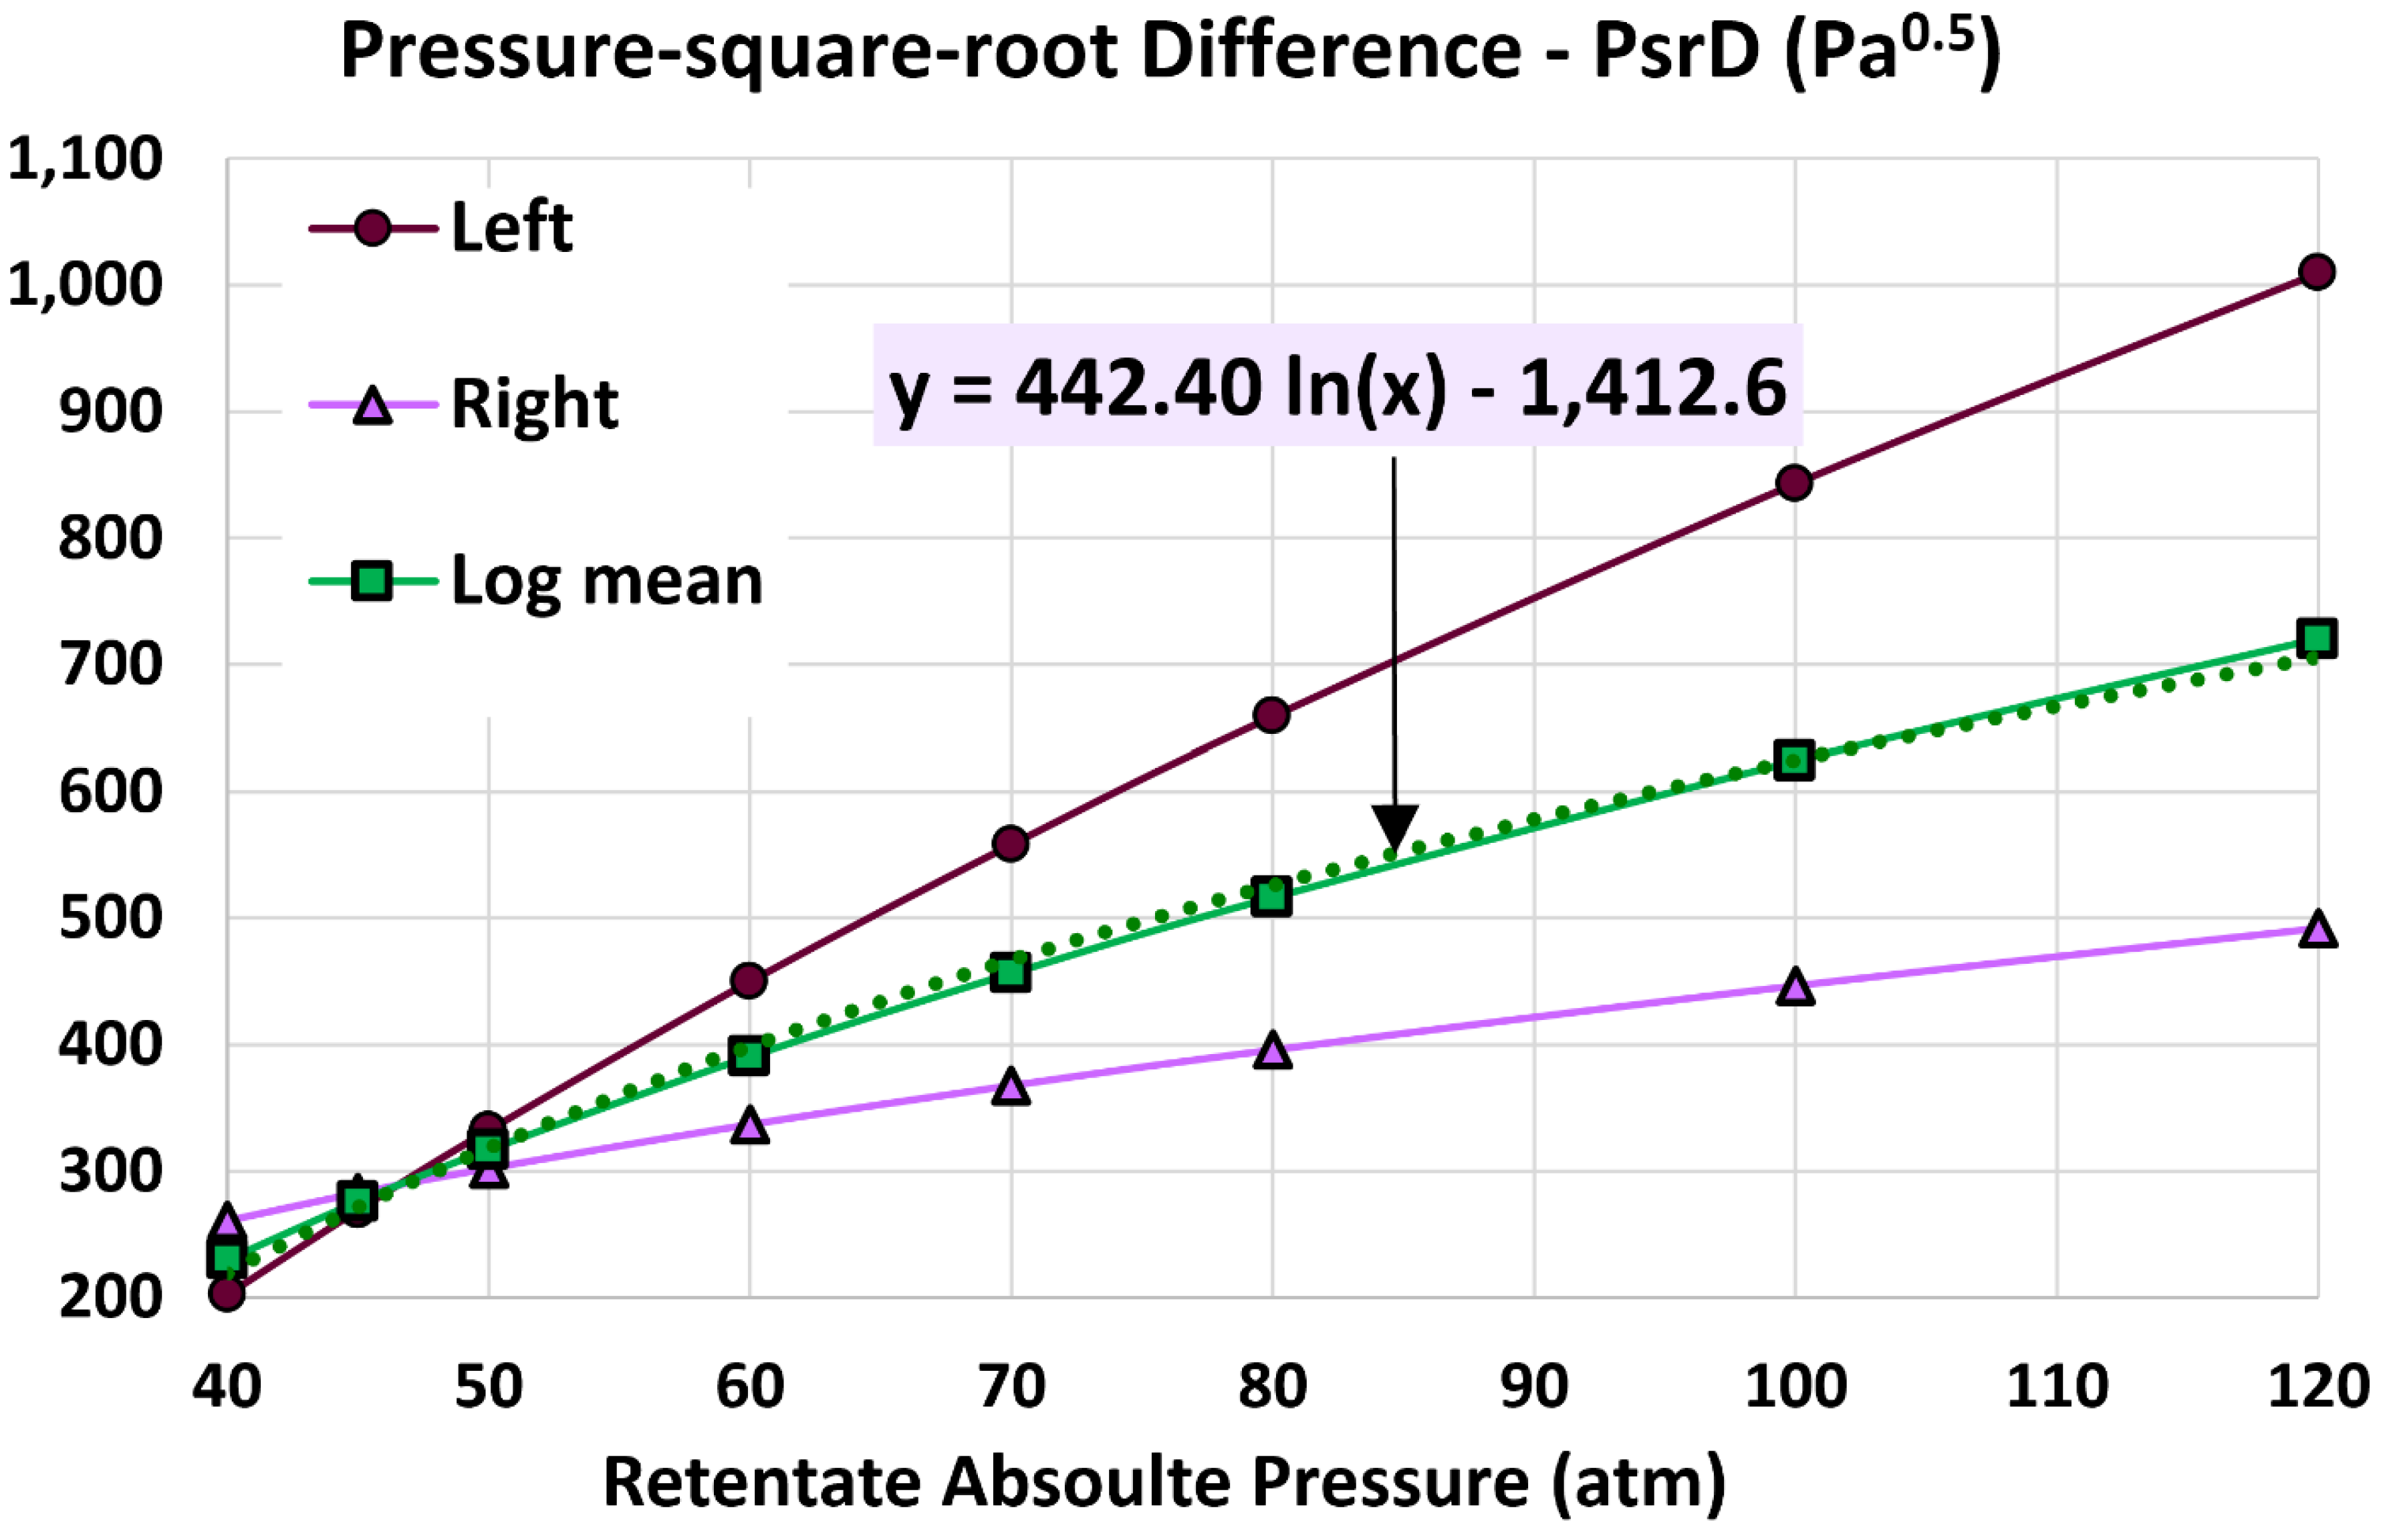
Figure 15.
Local actual permeance, global apparent permeance, and efficiency factor as functions of the retentate pressure in the membrane reactor.
Figure 15.
Local actual permeance, global apparent permeance, and efficiency factor as functions of the retentate pressure in the membrane reactor.
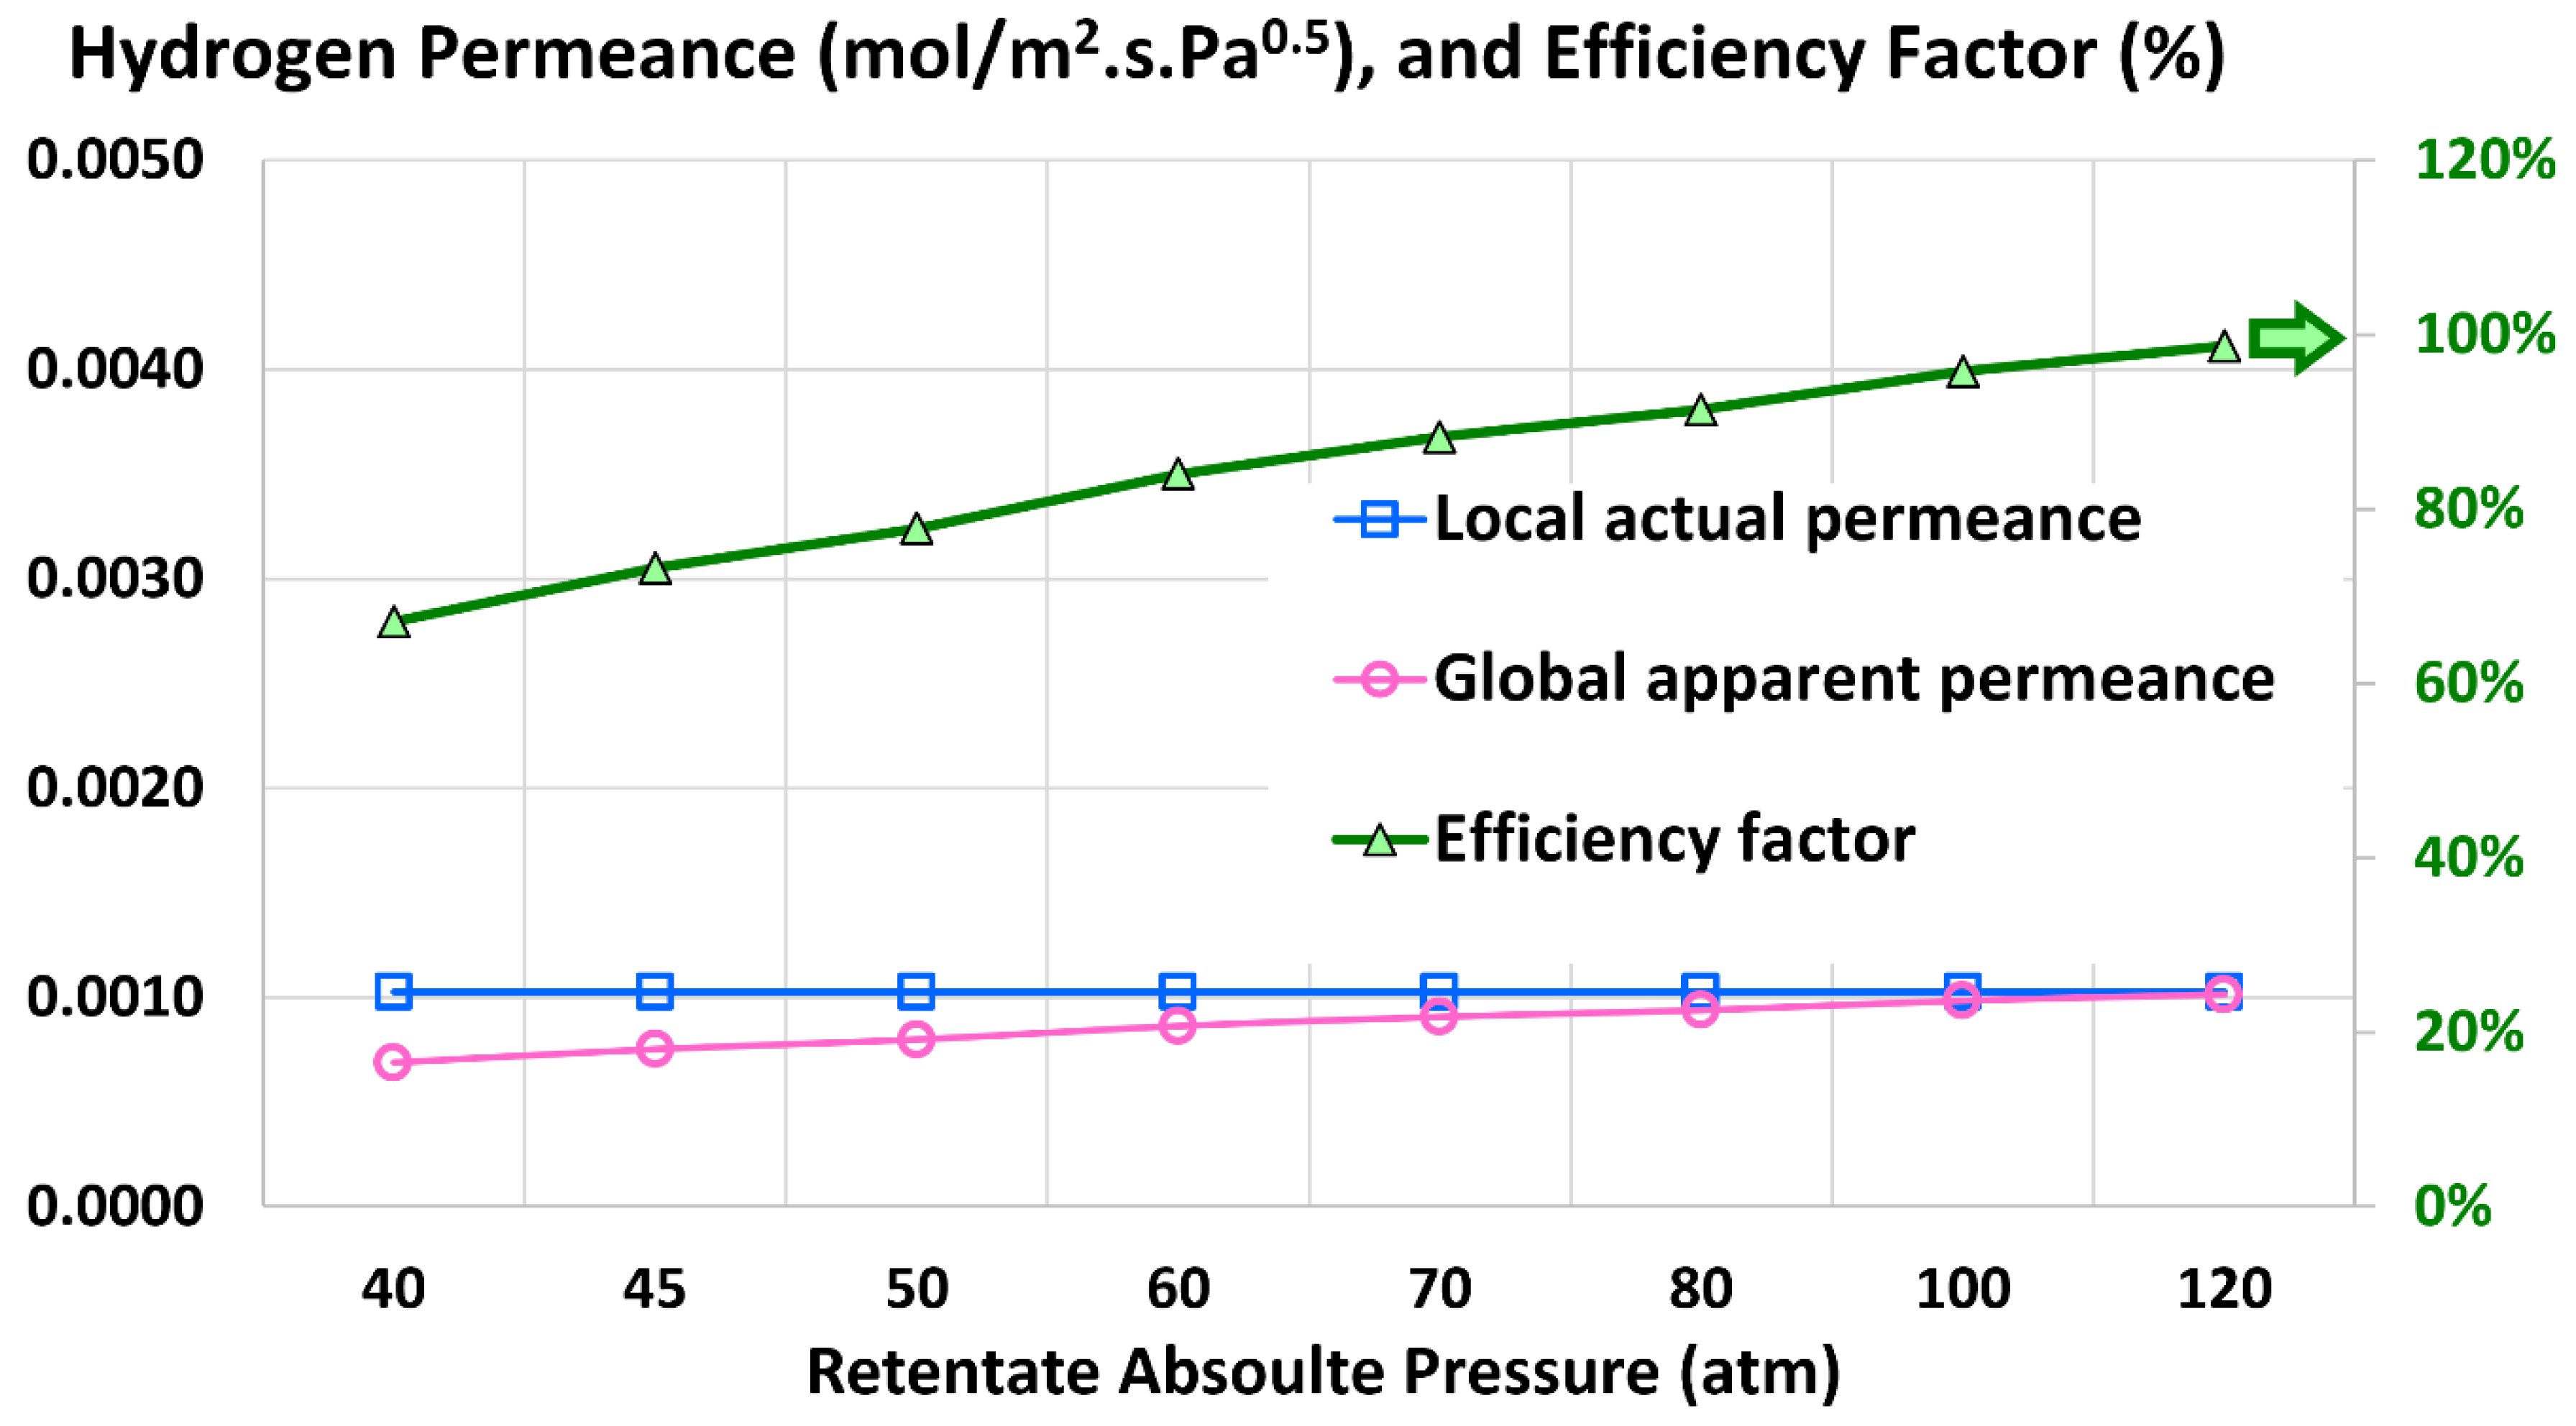
Figure 16.
Membrane length as a function of the permeate pressure in the membrane reactor.
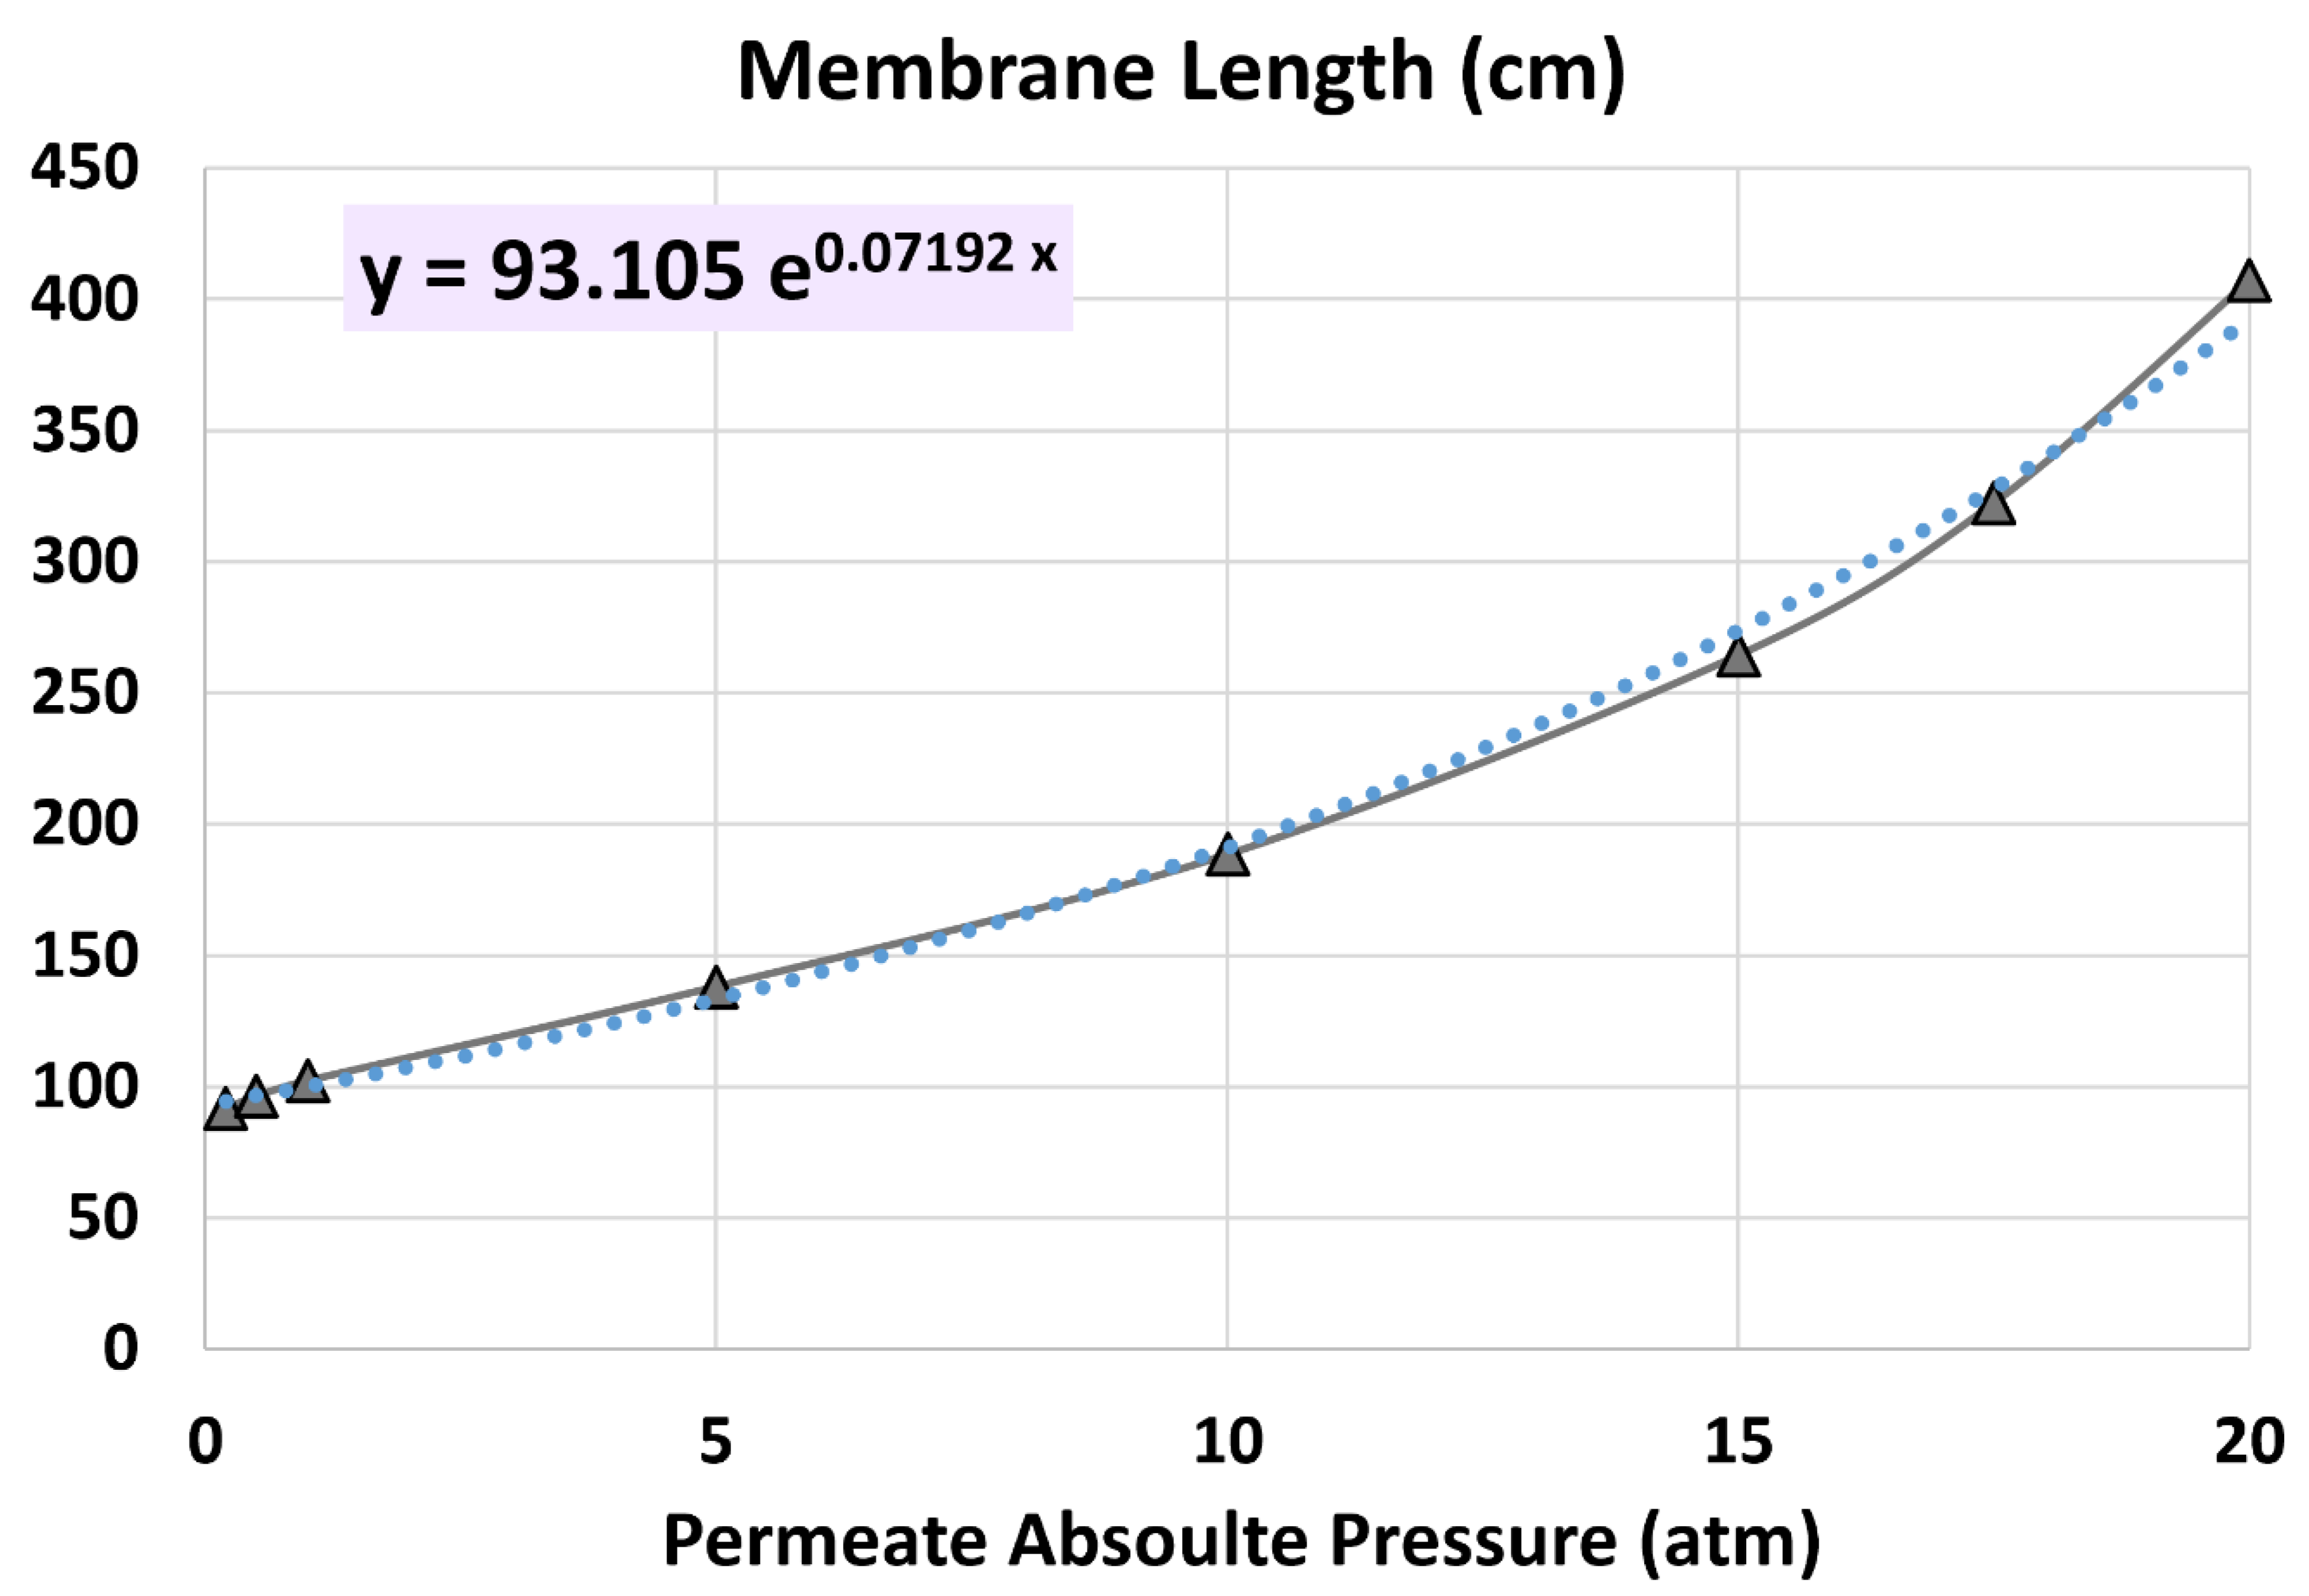
Figure 17.
Average hydrogen permeation mass flux as a function of the permeate pressure in the membrane reactor.
Figure 17.
Average hydrogen permeation mass flux as a function of the permeate pressure in the membrane reactor.

Figure 18.
Pressure-square-root difference at the left end of the membrane reactor (x = 0), pressure-square-root difference at the right end of the membrane reactor (x = L), and log mean pressure-square-root difference (LMPD) as functions of the permeate pressure in the membrane reactor.
Figure 18.
Pressure-square-root difference at the left end of the membrane reactor (x = 0), pressure-square-root difference at the right end of the membrane reactor (x = L), and log mean pressure-square-root difference (LMPD) as functions of the permeate pressure in the membrane reactor.
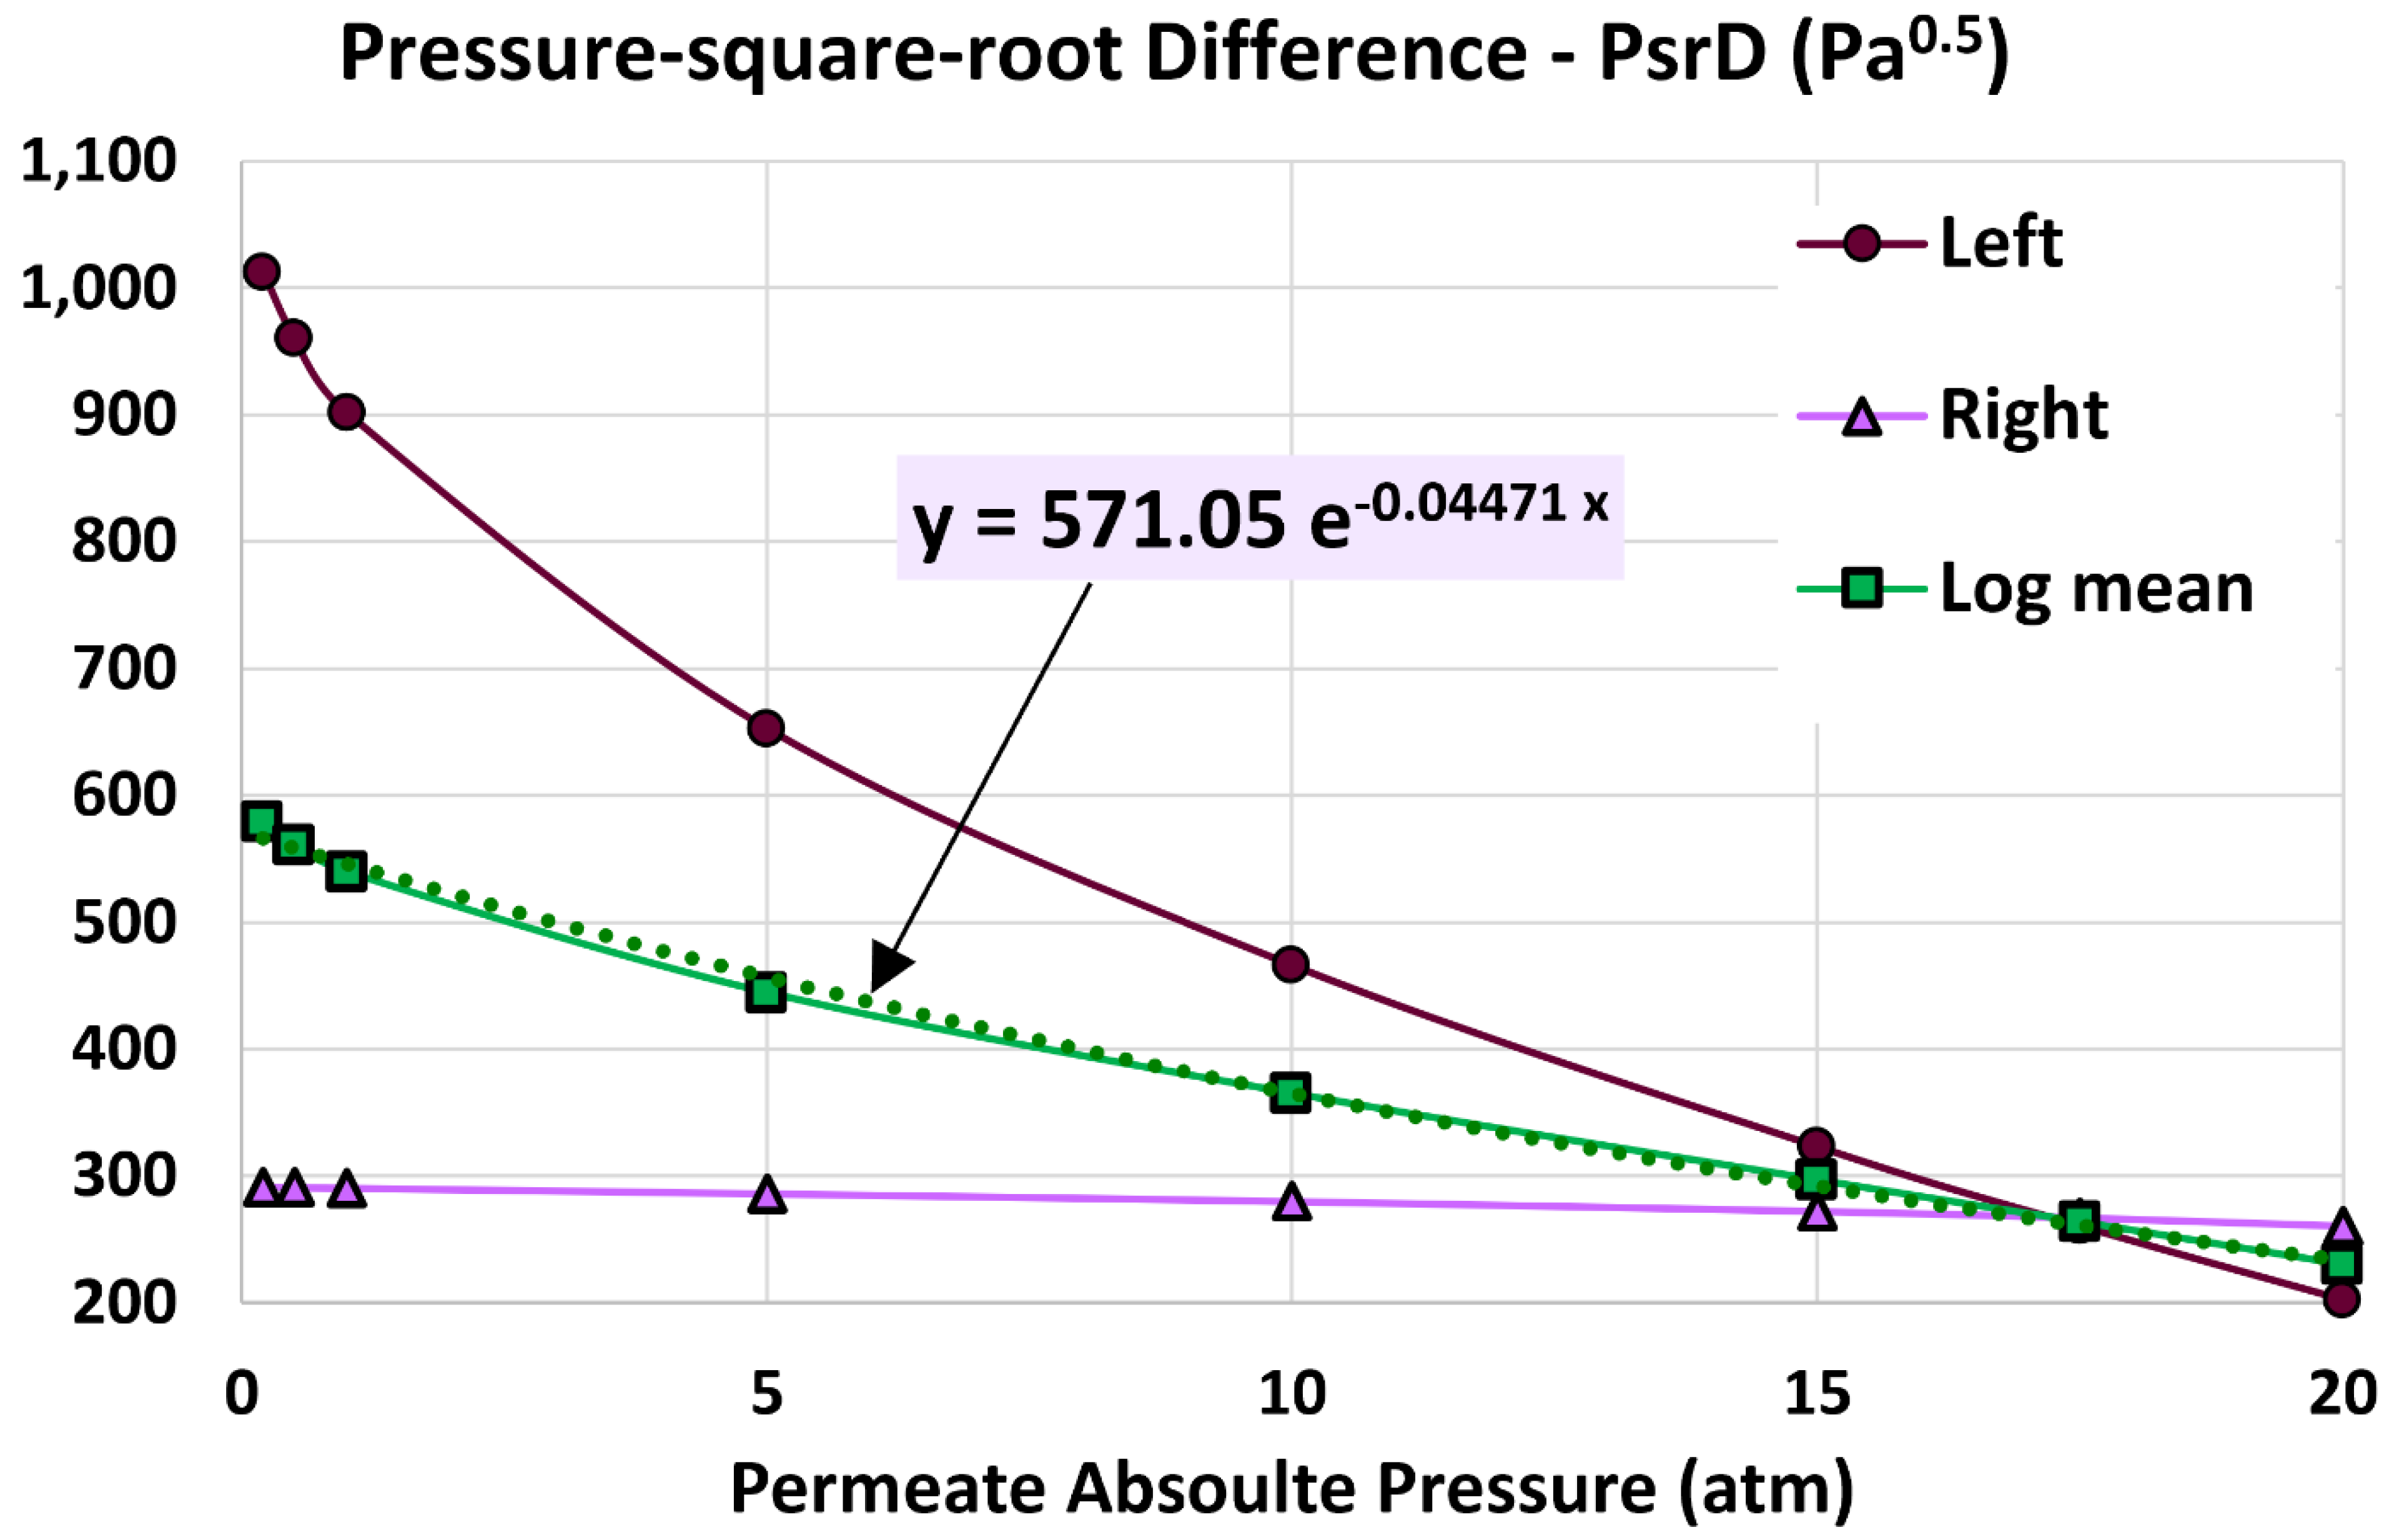
Figure 19.
Local actual permeance, global apparent permeance, and efficiency factor as functions of the permeate pressure in the membrane reactor.
Figure 19.
Local actual permeance, global apparent permeance, and efficiency factor as functions of the permeate pressure in the membrane reactor.
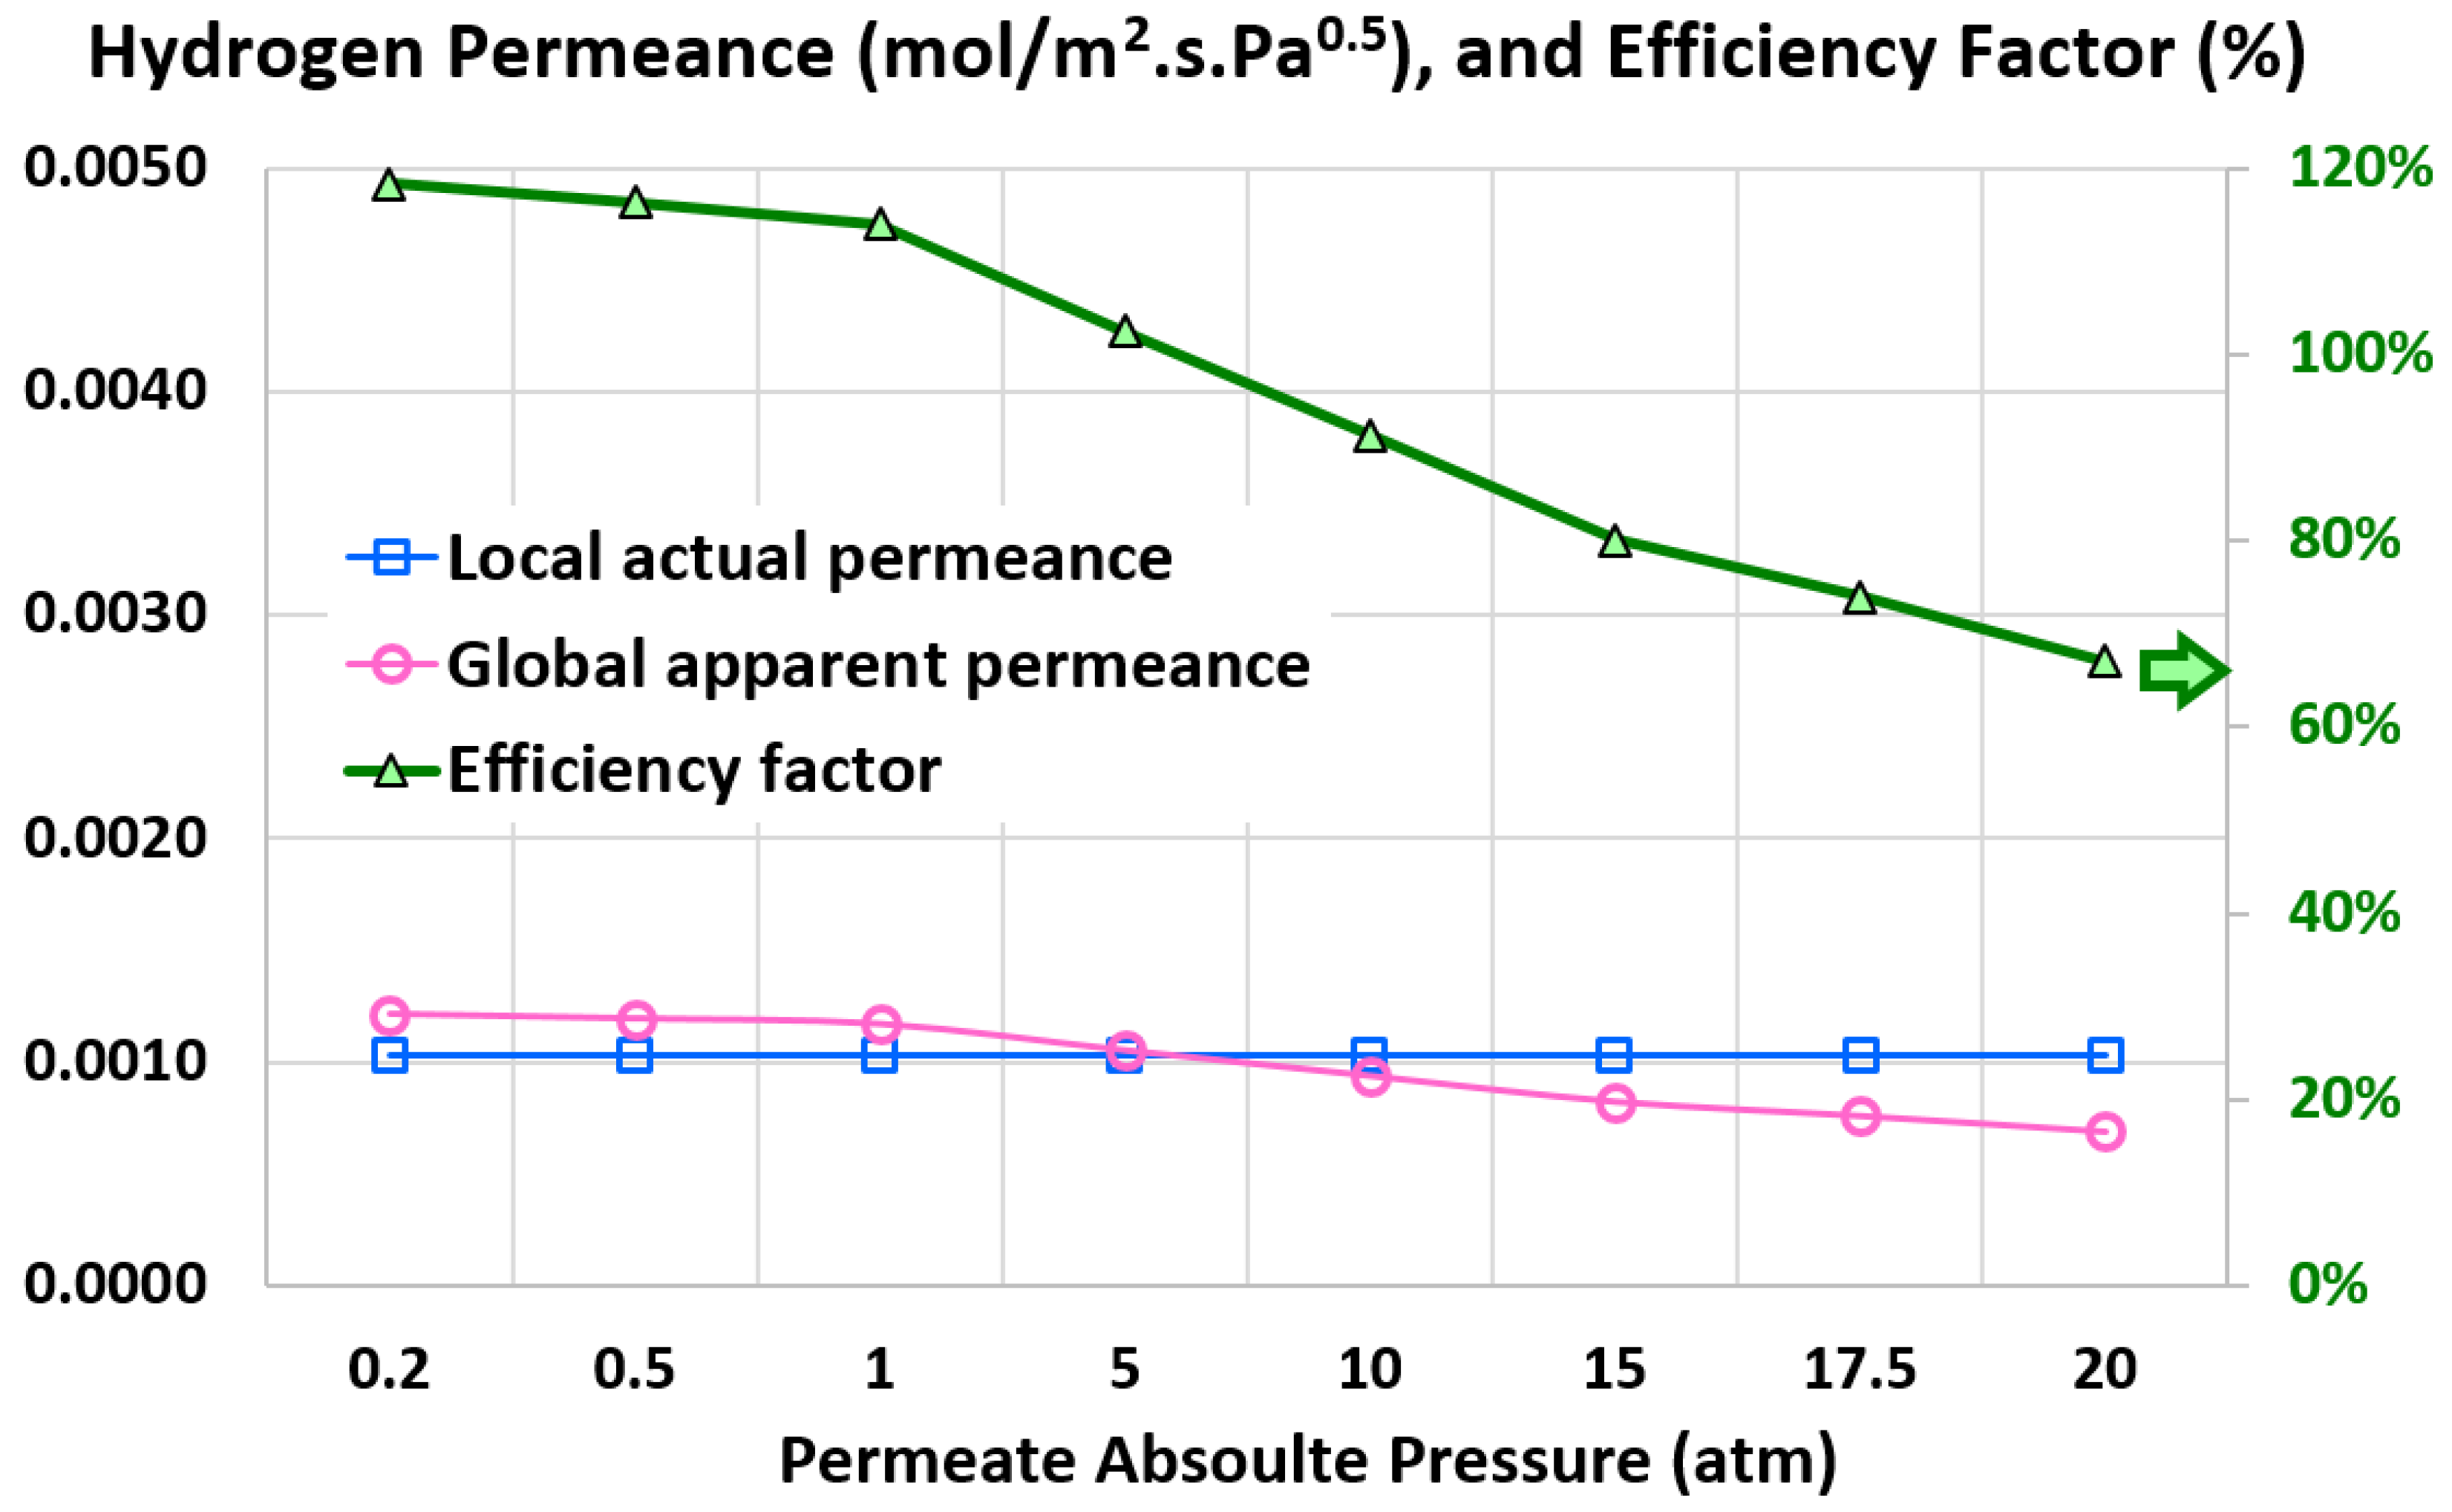
Figure 20.
Commutative hydrogen recovery with the extreme values considered for the temperature, absolute retentate pressure, and absolute permeate pressure.
Figure 20.
Commutative hydrogen recovery with the extreme values considered for the temperature, absolute retentate pressure, and absolute permeate pressure.
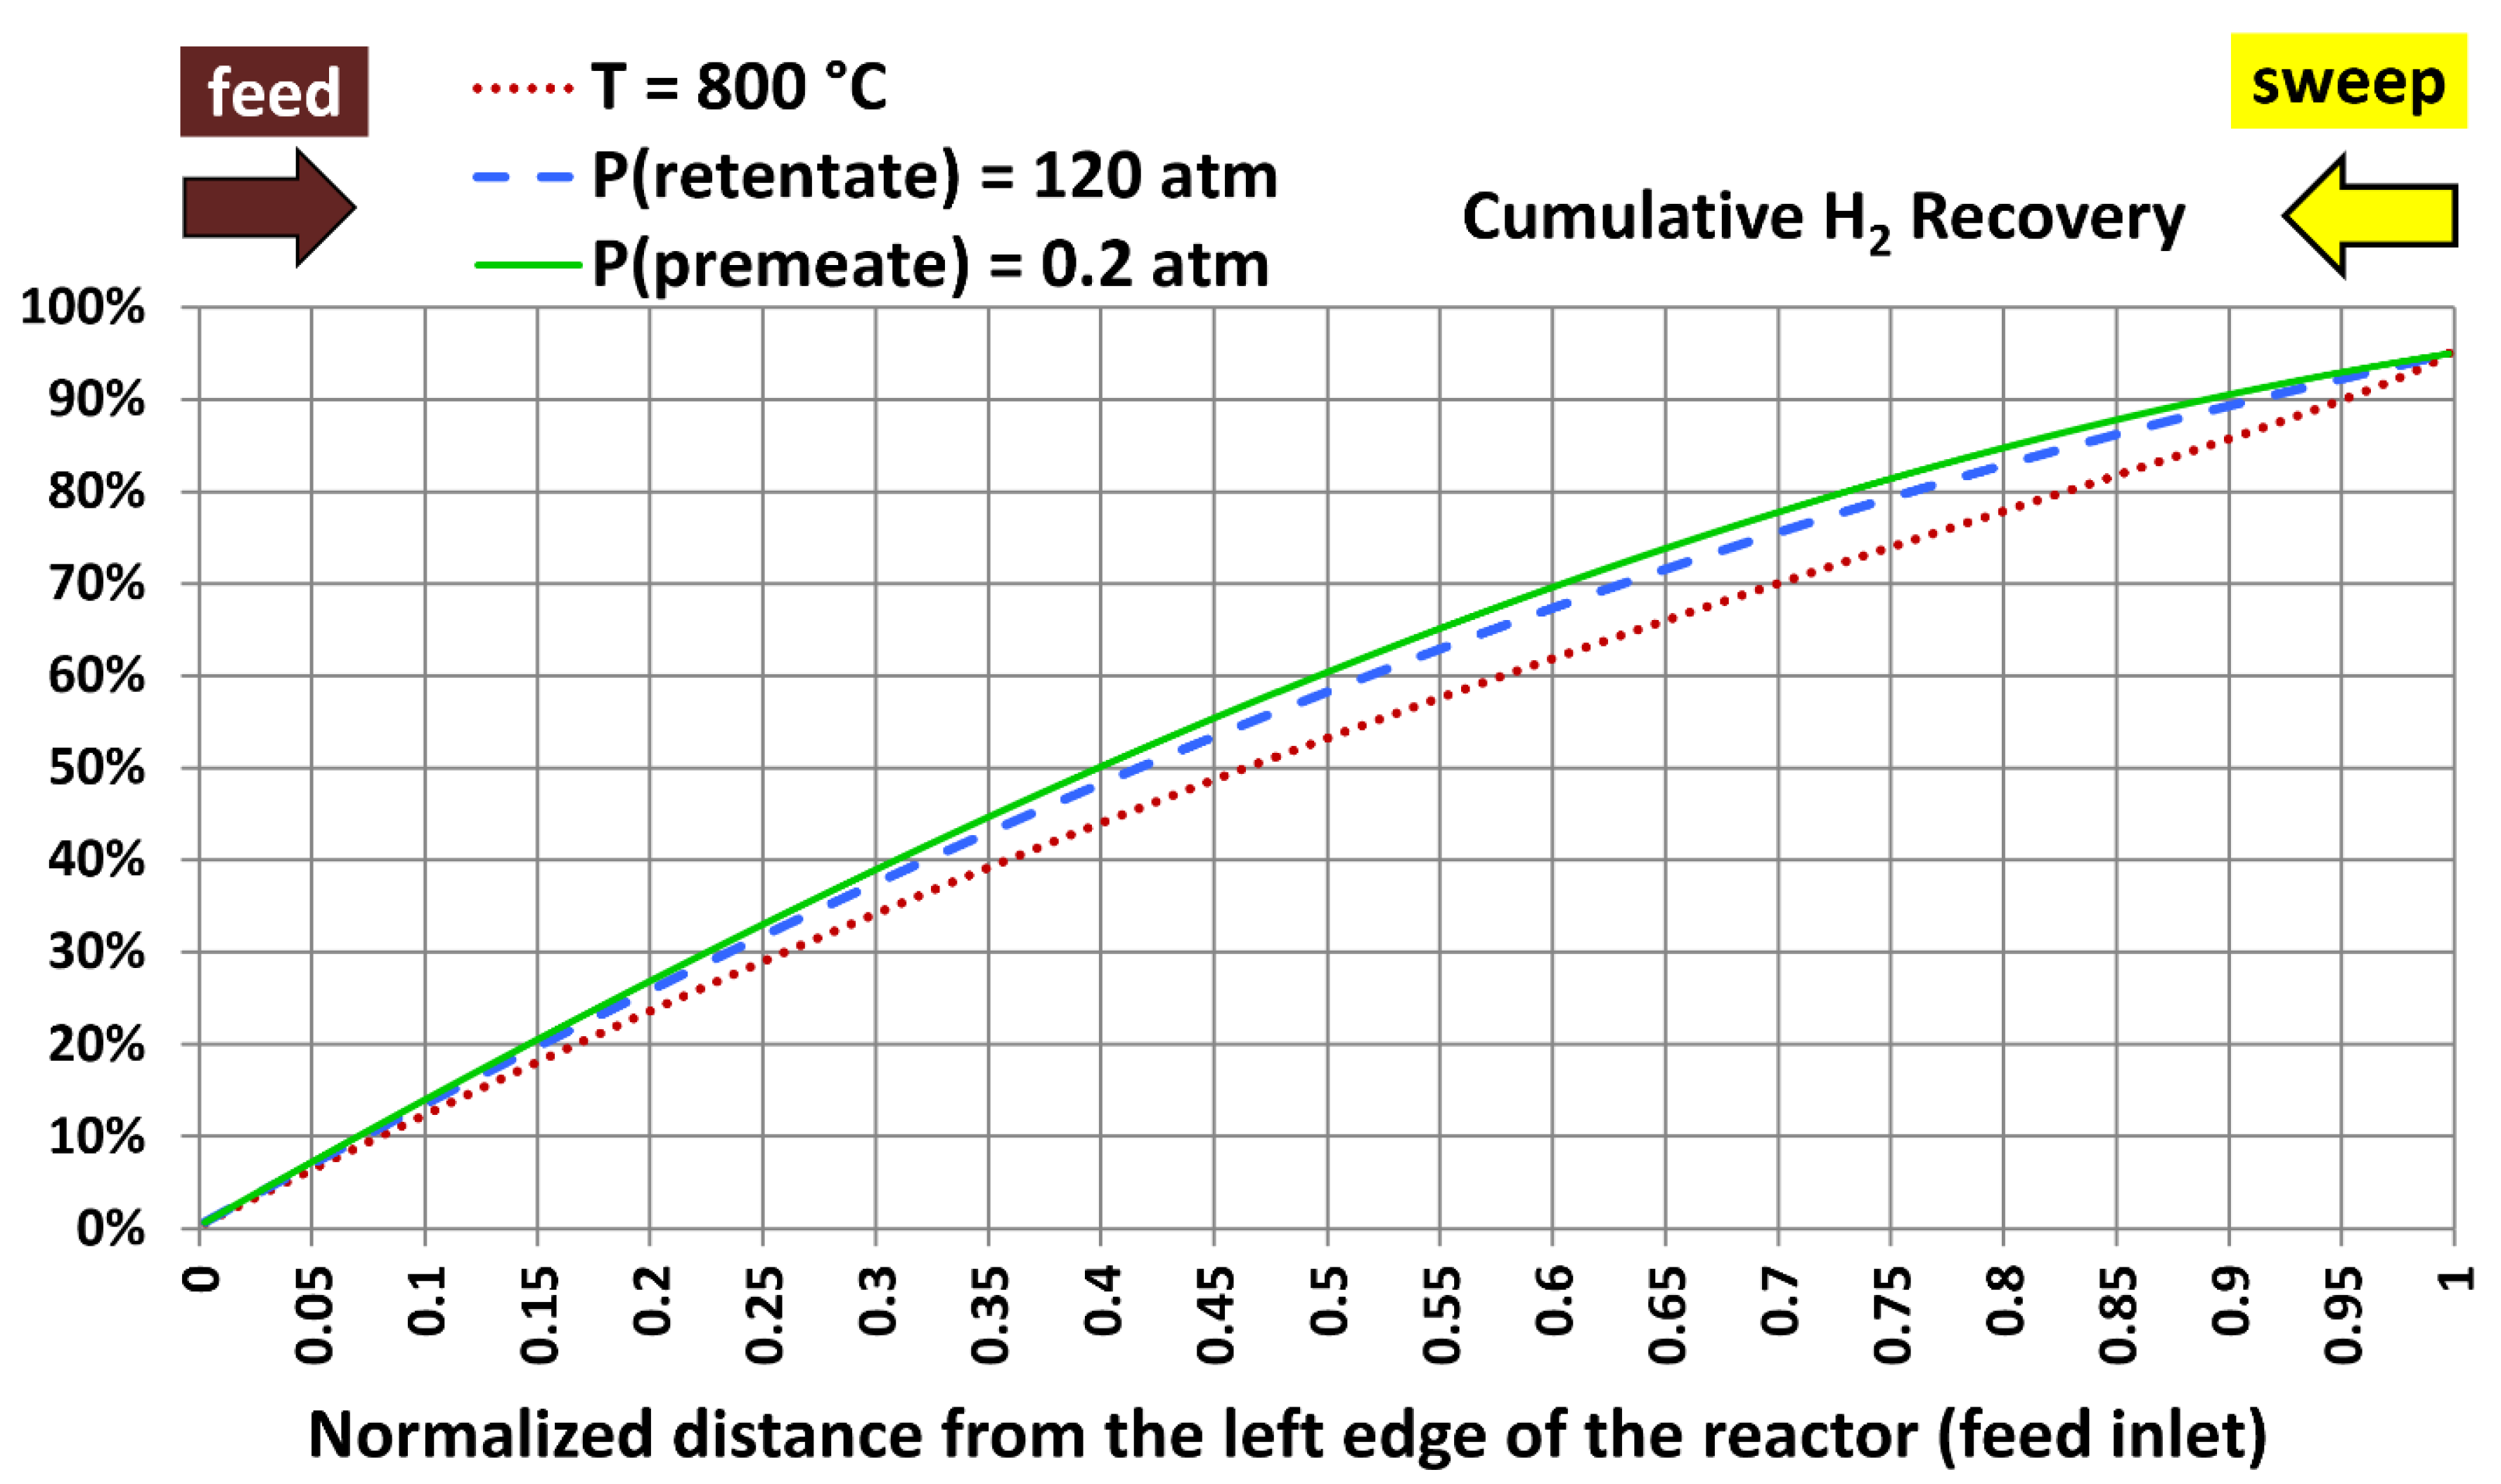
Figure 21.
Segmental hydrogen recovery with the extreme values considered for the temperature, absolute retentate pressure, and absolute permeate pressure.
Figure 21.
Segmental hydrogen recovery with the extreme values considered for the temperature, absolute retentate pressure, and absolute permeate pressure.
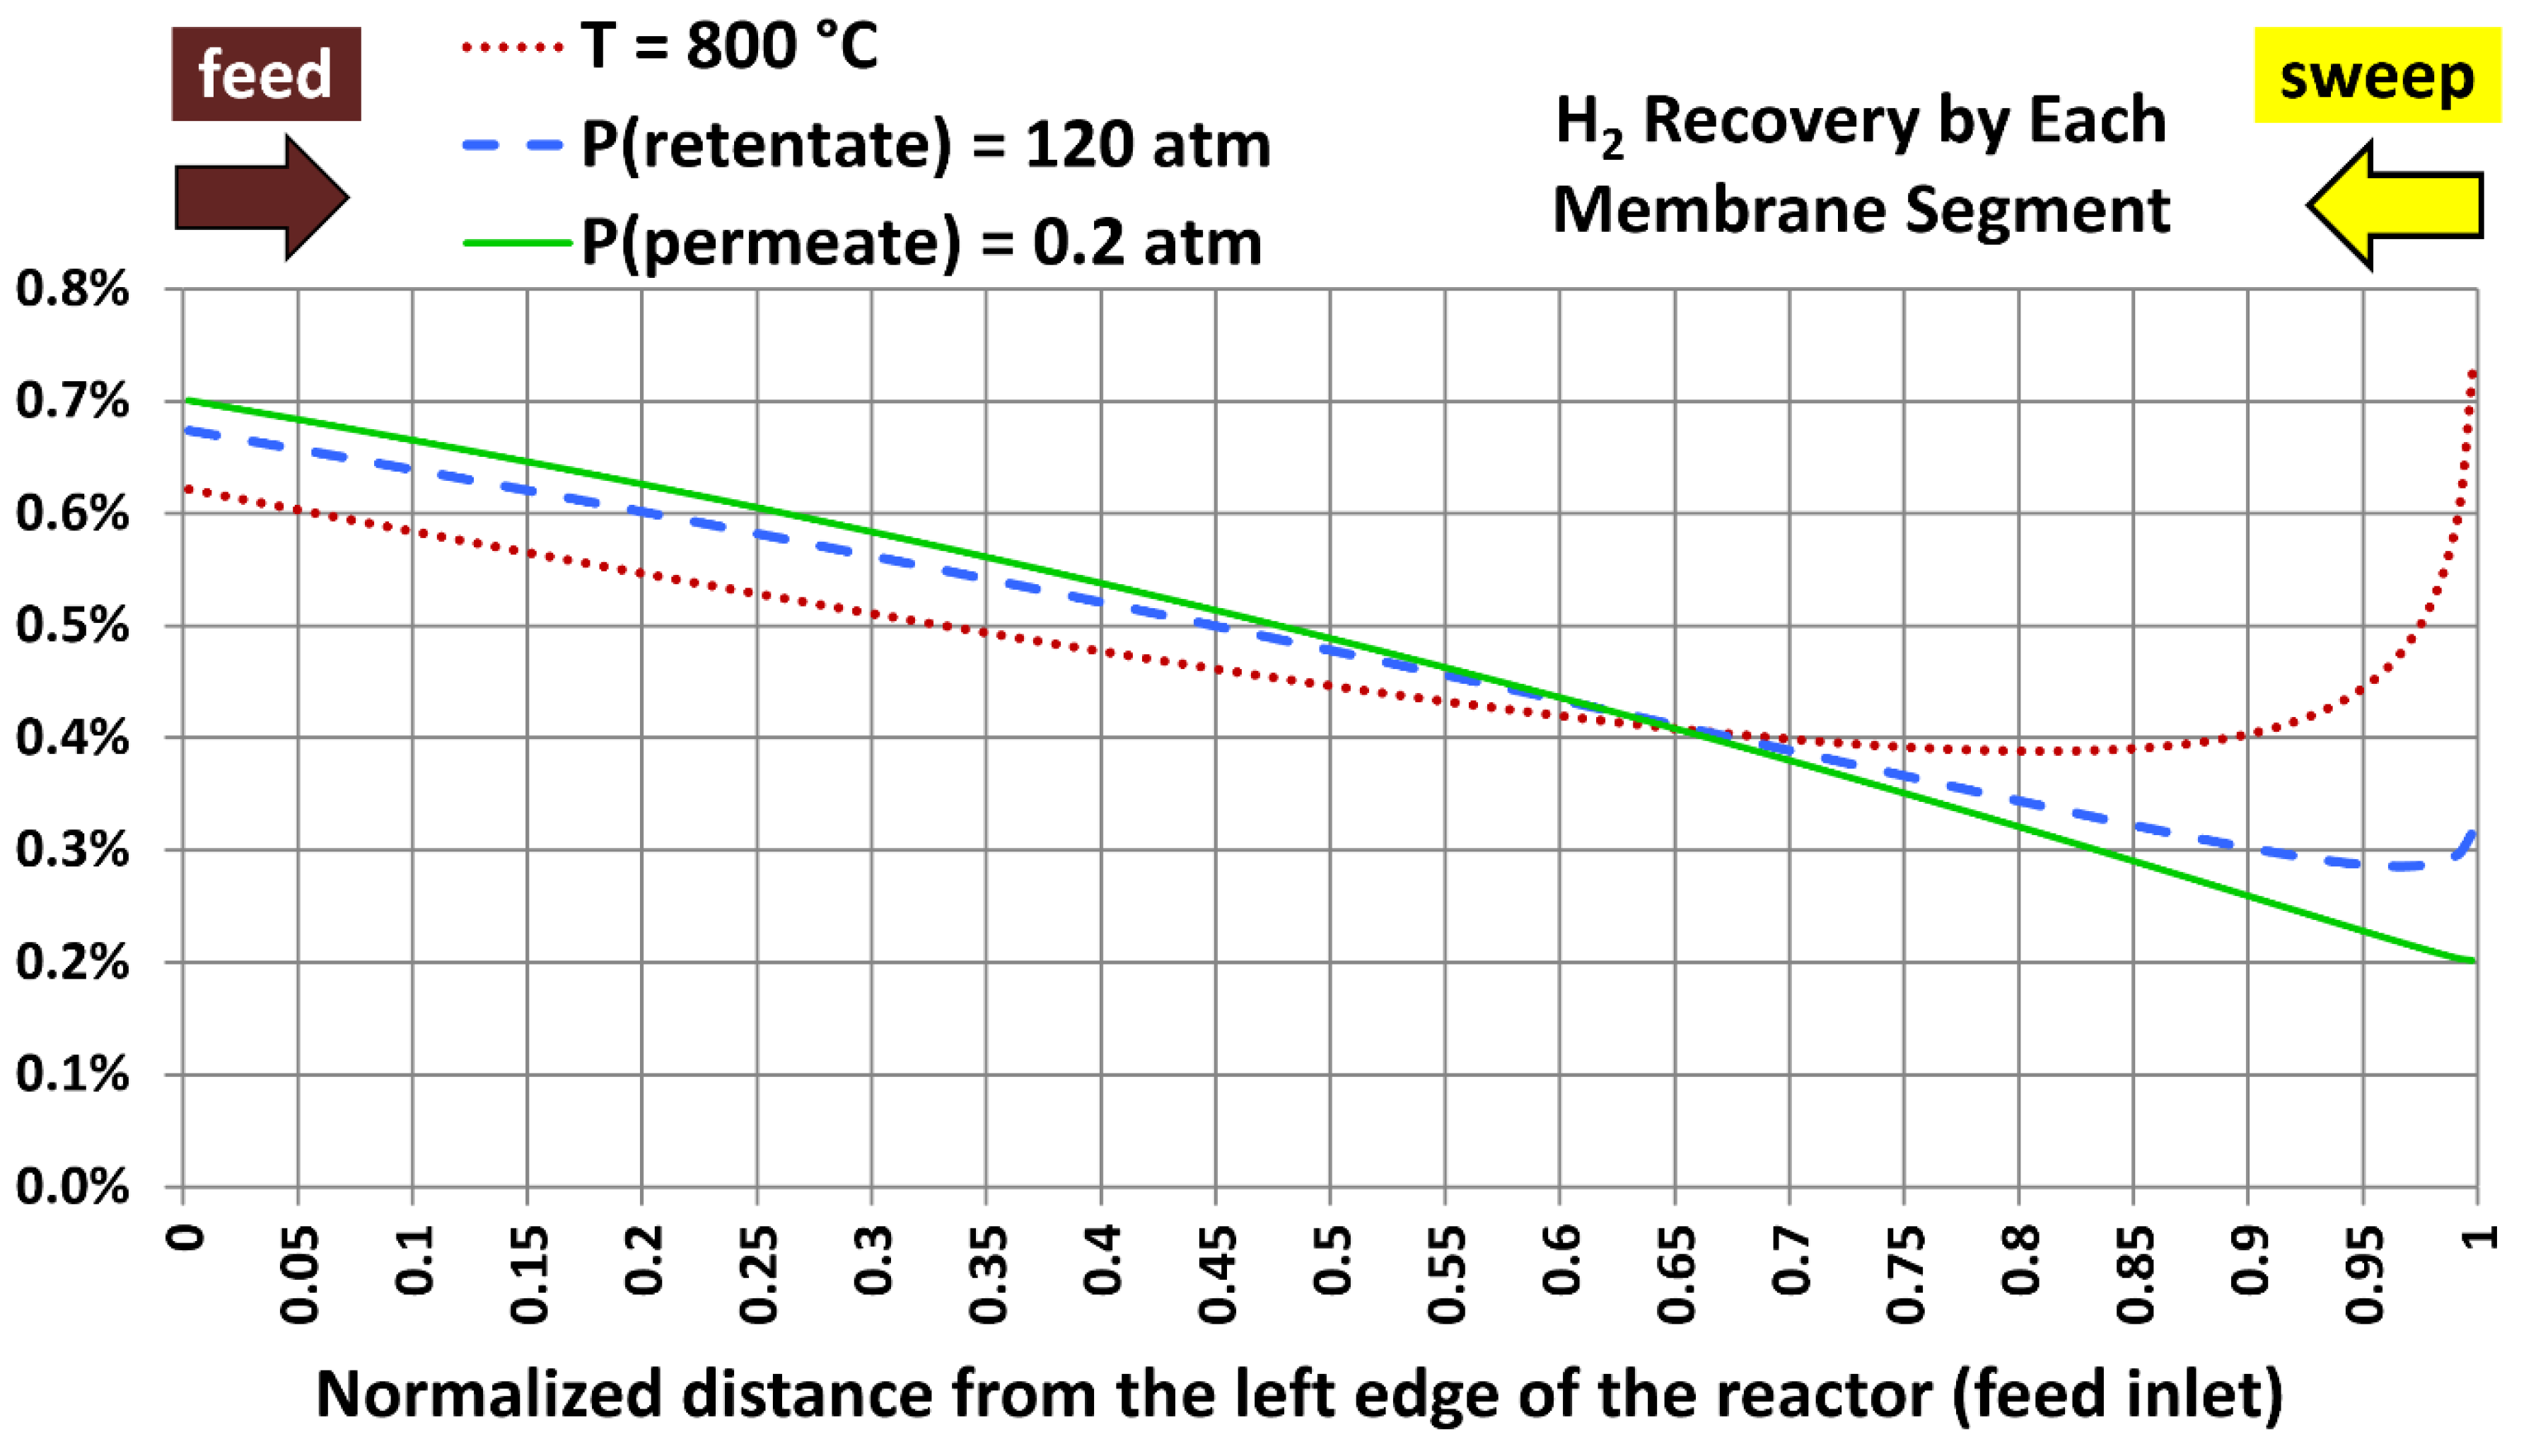
Figure 22.
Hydrogen mole fraction in the retentate stream with the extreme values considered for the temperature, absolute retentate pressure, and absolute permeate pressure.
Figure 22.
Hydrogen mole fraction in the retentate stream with the extreme values considered for the temperature, absolute retentate pressure, and absolute permeate pressure.
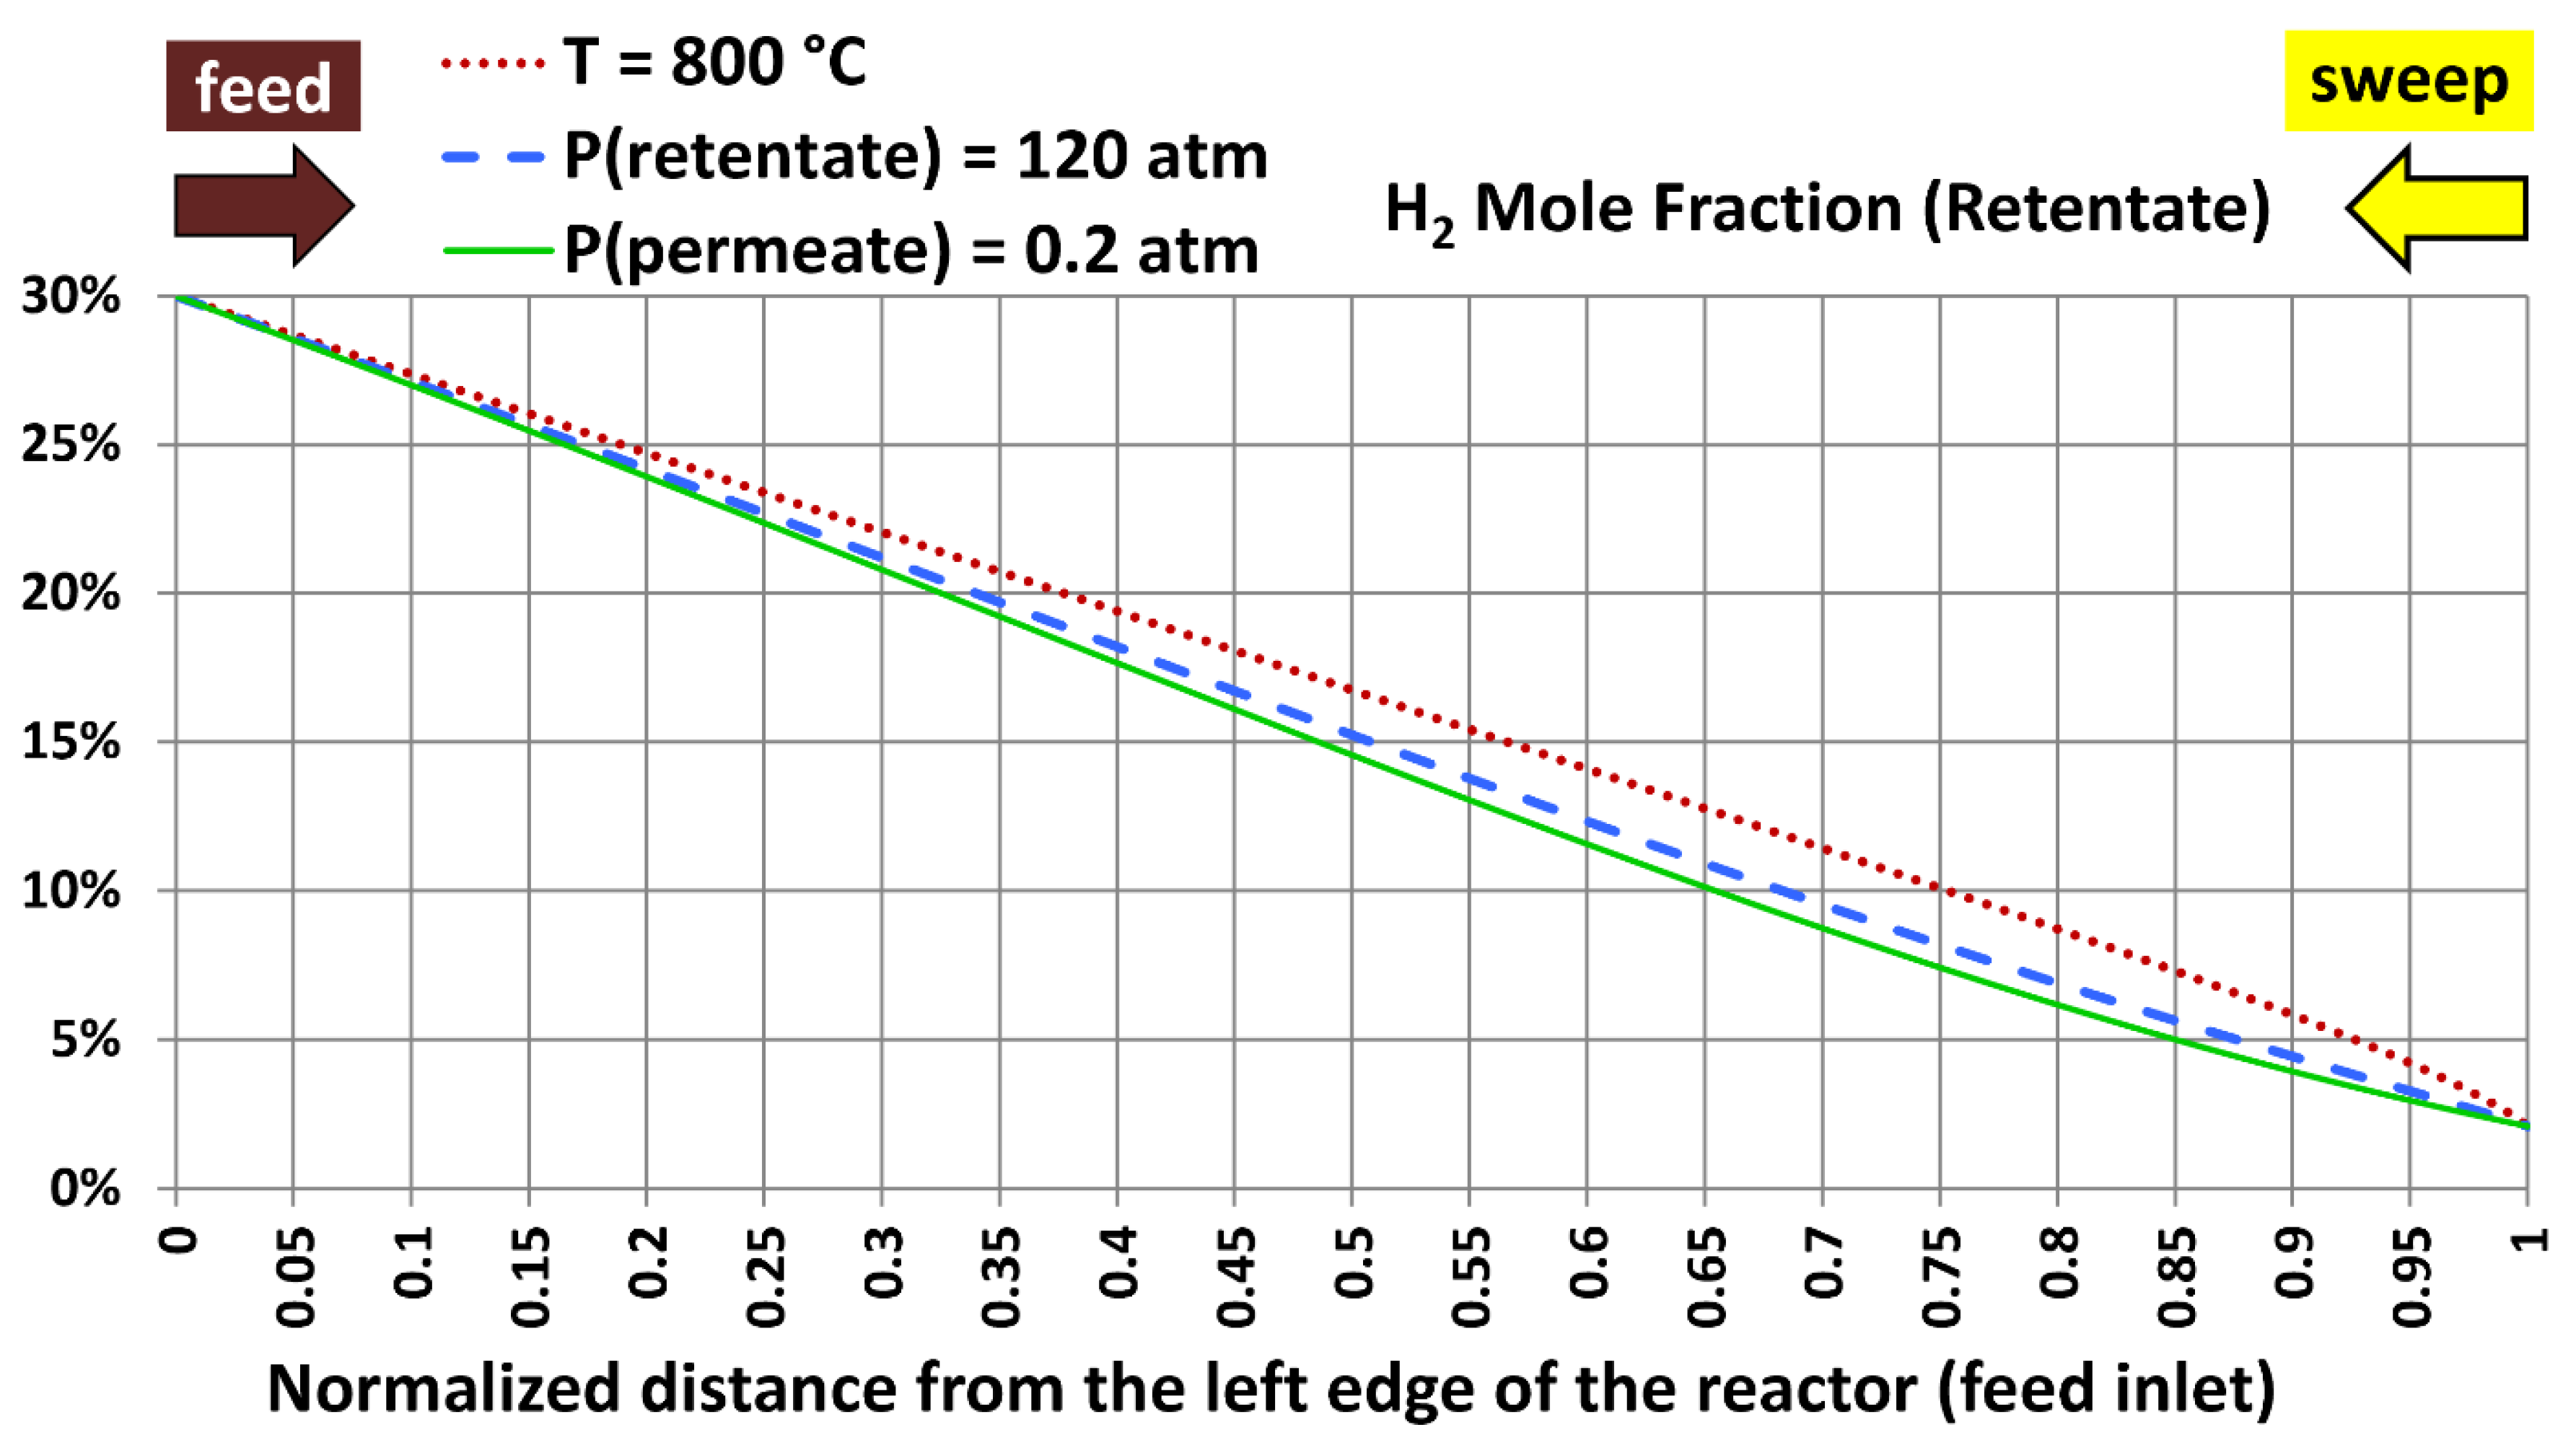
Figure 23.
Hydrogen mole fraction in the retentate stream with the extreme values considered for the temperature, absolute retentate pressure, and absolute permeate pressure.
Figure 23.
Hydrogen mole fraction in the retentate stream with the extreme values considered for the temperature, absolute retentate pressure, and absolute permeate pressure.
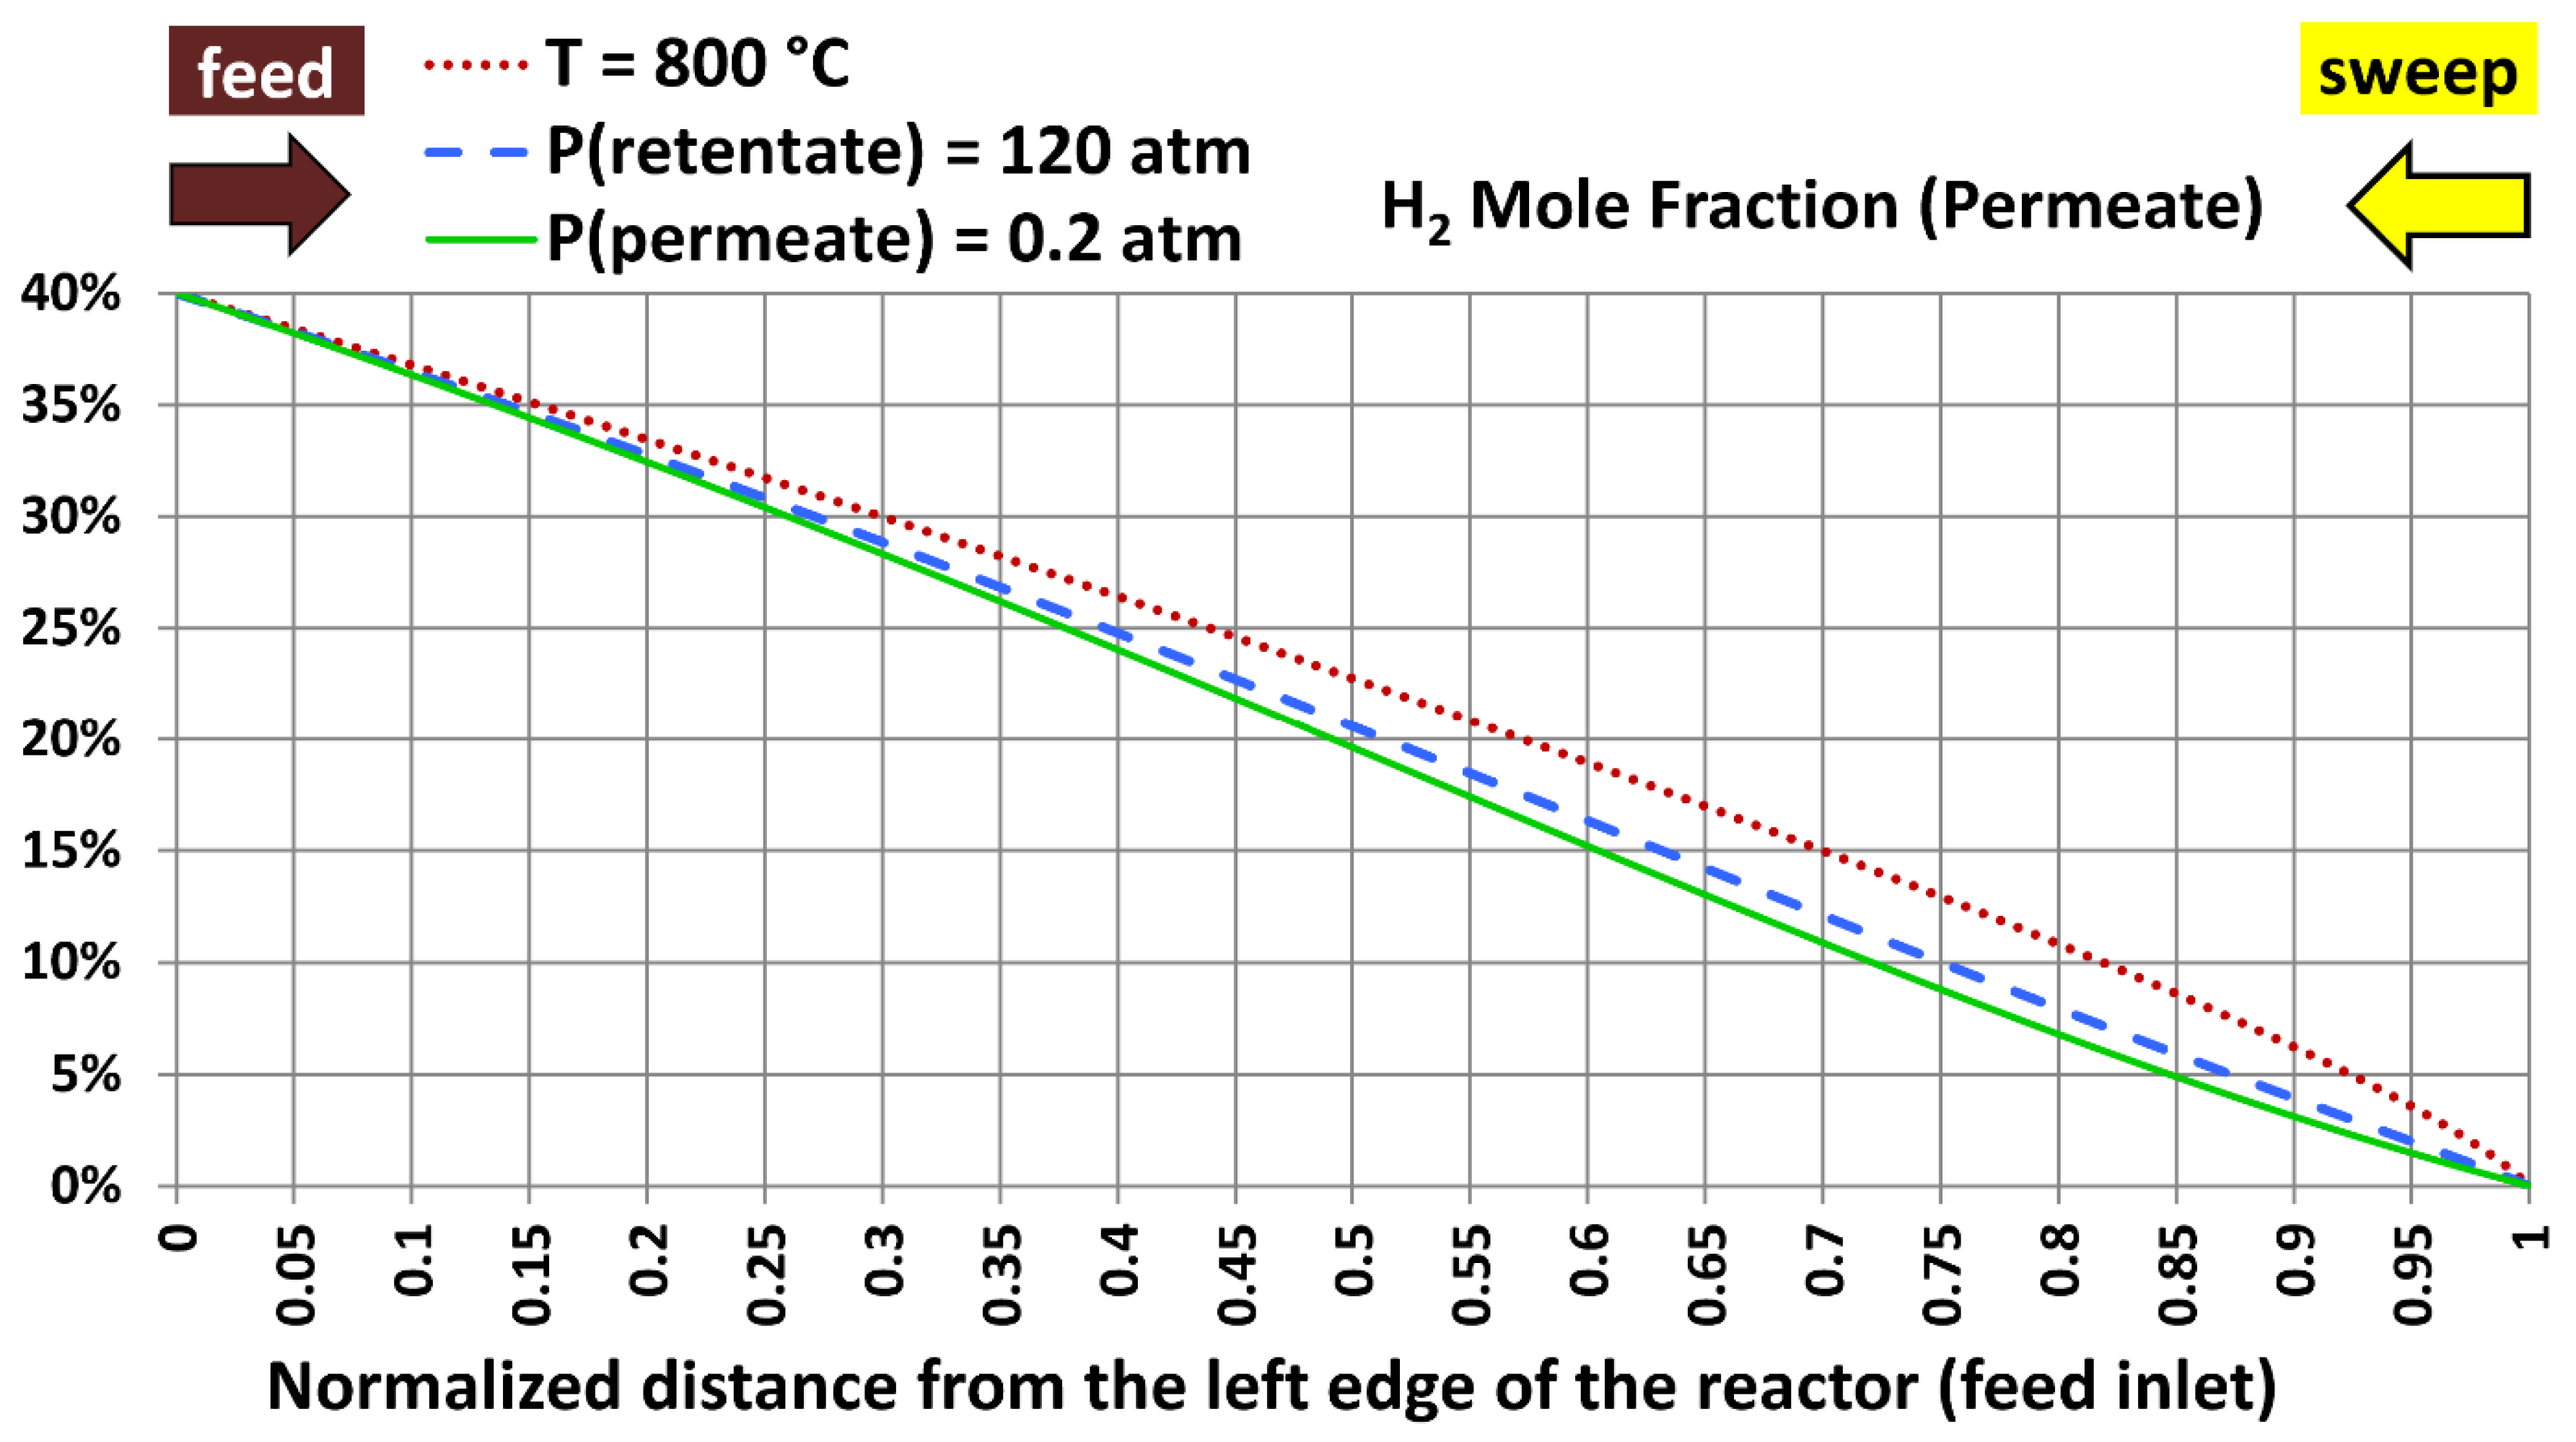

Table 1.
Some geometric details about the proposed shell-and-tube membrane reactor.
| Geometric feature | Value |
|---|---|
| Shell diameter | 5.000 cm (1.969 in) |
| Tube diameter | 1.250 cm (0.4921 in) |
| Number of tubes | 8 |
| Shell cross-section area (excluding tubes) | 9.817 cm2 (1.522 in2) |
| Tubes cross-section area (all 8 tubes) | 9.817 cm2 (1.522 in2) |
| Shell : Tube area ratio | 1 : 1 |
| Tube cross-section area (single tube) | 1.227 cm2 (0.1902 in2) |
Table 2.
Some common details about the retentate stream.
| Condition | Value |
|---|---|
| Inlet mole fraction, H2 | 30% |
| Inlet mole fraction, CO | 50% |
| Inlet mole fraction, CO2 | 20% |
| Molecular weight, H2 | 2.01588 kg/kmol (NIST, 2021a) |
| Molecular weight, CO | 28.0101 kg/kmol (NIST, 2021b) |
| Molecular weight, CO2 | 44.0095 kg/kmol (NIST, 2021c) |
| Molecular weight, mixture | 23.412 kg/kmol |
| Inlet mass fraction, H2 | 0.025832 |
| Inlet mass fraction, CO | 0.598207 |
| Inlet mass fraction, CO2 | 0.375961 |
| Mass flow rate | 60 kg/hr (132.28 lbm/hr) |
| Standard volume flow rate | 970,068 sccm (standard cubic centimeters per minute) |
| Target hydrogen recovery | 95% (by mass, by mole, or by standard volume - identical) |
Table 3.
Some common details about the permeate stream.
| Condition | Value |
|---|---|
| Inlet gas | 100% N2 |
| Molecular weight, N2 | 28.0134 kg/kmol (NIST, 2021d) |
| Mass flow rate | 30.692 kg/hr (67.664 lbm/hr) |
| Standard volume flow rate | 414,704 sccm (standard cubic centimeters per minute) |
| Target outlet mole fraction of H2 | 40% |
Table 4.
Temperature and pressures of the base case (reference simulation).
| Fluid property | Value |
|---|---|
| Temperature | 300 °C (572.00 °F) |
| Absolute retentate pressure | 40.0 atm (587.84 psia) |
| Absolute permeate pressure | 20.0 atm (293.92 psia) |
Table 5.
Some results obtained for the base case with 200 segments (normal resolution) and 400 segments (refined resolution for testing only).
Table 5.
Some results obtained for the base case with 200 segments (normal resolution) and 400 segments (refined resolution for testing only).
| Result | Value | Absolute percentage change | |
| n = 200 segments | n = 400 segments | ||
| Membrane length (cm) | 407.359 | 407.359 | 0% (identical) |
| Average hydrogen permeation mass flux (kg/m2.hr) | 1.151 | 1.150 | 0.01% |
| Pressure-square-root difference at the left end (Pa0.5) | 202.345 | 202.345 | 0% (identical) |
| Pressure-square-root difference at the right end (Pa0.5) | 260.655 | 268.896 | 3.16% |
| Log mean pressure-square-root difference (Pa0.5) | 230.271 | 234.05 | 1.64% |
| Global apparent hydrogen permeance (mol/m2.s.Pa0.5) | 6.8849 × 10⁻⁴ | 6.7732 × 10⁻⁴ | 1.62% |
| Efficiency factor (%) | 67.09% | 66.00% | 1.62% |
| Hydrogen recovery (%) | 95.000% | 94.991% | 0.01% |
Table 6.
Some details about the base case (reference simulation).
| Extreme case | Temperature | Absolute retentate pressure | Absolute permeate pressure |
|---|---|---|---|
| 1 | 800 °C (1,472.00 °F) | 40.0 atm (587.84 psia) | 20.0 atm (293.92 psia) |
| 2 | 300 °C (572.00 °F) | 120.0 atm (1,763.5 psia) | 20.0 atm (293.92 psia) |
| 3 | 300 °C (572.00 °F) | 40.0 atm (587.84 psia) | 0.20 atm (2.9392 psia) |
Disclaimer/Publisher’s Note: The statements, opinions and data contained in all publications are solely those of the individual author(s) and contributor(s) and not of MDPI and/or the editor(s). MDPI and/or the editor(s) disclaim responsibility for any injury to people or property resulting from any ideas, methods, instructions or products referred to in the content. |
© 2025 by the authors. Licensee MDPI, Basel, Switzerland. This article is an open access article distributed under the terms and conditions of the Creative Commons Attribution (CC BY) license (http://creativecommons.org/licenses/by/4.0/).
Copyright: This open access article is published under a Creative Commons CC BY 4.0 license, which permit the free download, distribution, and reuse, provided that the author and preprint are cited in any reuse.


