
Submitted:
01 April 2025
Posted:
04 April 2025
You are already at the latest version
Abstract
(1) Background: Blood pressure (BP) variability is an important risk factor for cardiovascular diseases. Still, existing BP monitoring methods often require periodic cuff-based measurements, raising concerns about accuracy and convenience. This study aims to develop a subject-independent, cuff-less BP estimation method using finger and toe photoplethysmography (PPG) signals combined with an electrocardiogram (ECG) without the need for an initial cuff-based measurement. (2) Methods: A customized measurement system was used to record 80 readings from human subjects. Fifteen features with the highest dependency on the reference BP, including time and morphological characteristics of PPG and subject information, were analyzed. A multivariate regression model was employed to estimate BP. (3) Results: The results showed that incorporating toe PPG signals improved the accuracy of BP estimation, reducing the mean absolute error (MAE). Using both finger and toe PPG signals resulted in an MAE of 9.63±12.54 mmHg for systolic BP and 6.76±8.38 mmHg for diastolic BP, providing the lowest MAE compared to previous methods. (4) Conclusions: This study is the first to integrate toe PPG for more accurate BP estimation and proposes a method that does not require an initial cuff-based BP measurement, offering a promising approach for non-invasive, continuous BP monitoring. conclusions.
Keywords:
blood pressure monitoring
; heart rate variability
; ECG
; finger PPG
; toe PPG
; calibration free
; physiological sensors
; multivariate analysis
; signal processing
1. Introduction
The blood pressure (BP) is a vital indicator of cardiovascular status. High blood pressure (hypertension) can cause several cardiovascular diseases (CVD) including atherosclerosis (thickening of the arteries), heart attack, aneurysms, and cerebrovascular events such as stroke [1,2]. Hypertension is the single most important modifiable risk factor for both CVD and stroke. Besides the absolute BP values, evidence from previous studies and trials have shown that these outcomes could also rely on increased blood pressure variability (BPV) [1,2]. It has been reported that increased short-term (24 hour period) and long-term (days, weeks, months, etc.) BPV result in the development, progression, and severity of cardiac, vascular, and renal damage [3]. Notably, post hoc analyses of large intervention trials in hypertension revealed that within-patient visit-to-visit BPV is strongly prognostic for cardiovascular morbidity and mortality [1,2,3]. These findings have provided evidence that it is crucial to minimize the risk by monitoring the changes in BP and keeping control in the early stage [2].
The gold standard of BP measurement is through the use of a catheter, but it is invasive and not practical for clinical uses. The most commonly performed non-invasive BP measurement is with the use of an inflatable cuff employing either auscultation or oscillometric methods; however, these measurements require at least one minute in between BP measurements, which do not allow for continuous BP recordings [4]. Even the conventional 24-hour ambulatory BP monitoring can only be done at regular intervals and they still require the use of a cuff [5]. Even though arterial tonometry and volume clamp techniques provide continuous measurements, due to their bulky size and being partly intrusive, they have not found extensive application in clinical practice [2]. There has been a significant research effort to come up with a non-invasive, accurate, cuff-less and minimally intrusive technology to monitor BP continuously. Even though there are two food and drug administration (FDA)-cleared methods, including Sotera VISI Mobile and SOMNOtouch continuous noninvasive BP monitoring systems, the research on finding a clinically valid cuff-less method is still ongoing since existing methods still struggle with accuracy and calibration concerns [6]. Current methods to achieve cuff-less BP measurements mainly focus on pulse transit time (PTT) and pulse wave velocity (PWV). For these methods, usually, ECG is used in combination with PPG. ECG provides a time reference for the origination of the BP pulse while PPG in reference to ECG provides the PTT (the time for the pulse to arrive at the PPG measurement site). PWV is the propagation velocity of the BP waveform through the arteries; i.e., stiffer arteries will lead to increased PWV. PTT is used for PWV estimation (PWV: the distance between the heart and the peripheral PPG measurement site (finger, toe, etc.) divided by PTT). The main disadvantage of using PTT/PWV technique is that it requires individual patient calibration (measurement with a cuff) that has to be updated periodically.
The majority of the previous studies on cuff-less BP monitoring have required calibration, and they have used different models including mathematical and machine learning algorithms [7,8,9,10,11,12,13,14,15,16]. Additionally, despite using some of the patients’ vital data, they did not have access to the patients’ information including age, height, weight, and body mass index (BMI) which are important parameters for better accuracy [2,10,17]. In addition, it has been shown that the subject’s heart rate shows a significant correlation with temporal parameters from both toe and finger PPG signals while toe PPG has no significant dependency on the subject’s sex [18]. Thus, including toe PPG signal in BP estimator models makes them less dependent on the subject’s sex.
We came up with two methods to improve the accuracy of our BP estimation algorithm by 1- adding/using parameters from toe PPG; 2- including additional parameters with considerable dependence on the BP.
While calibration-based methods need to modify the estimator model for each subject and then track the BP trajectory, designing a subject-independent algorithm –that is not based on an initial or periodic calibration, is one of the challenges in BP estimation. To our knowledge, there are only two studies that have reported calibration-free methods so far. Both of these studies used regression methods in addition to machine learning techniques such as support vector machine (SVM) [17,19]; however, those studies are limited to the available databases including Physionet MIMIC. By developing and customizing our measurement device, we were able to include and analyze additional features, most importantly the toe PPG signal.
Therefore, the importance of this study is not only based on its ability to estimate continuous BP without any initial cuff-based measurement, but also the integration and assessment of toe PPG signal, and additional subject information such as weight, age, height, and BMI. This study showed that involving these additional parameters results in improved accuracy.
2. Materials and Methods
In studies that are not based on a calibration-free approach, PTT is used as the main indicator of BP. By having an initial measurement of BP, BP at the next heartbeats can be tracked using an equation that maps PTT on BP [7,9,10]. In contrast, due to subject-specific features of the PTT-based algorithms, no universal equation can relate PTT to BP [20,21,22,23].
In this study, we hypothesized that using two PPG sensors including one for the finger and one for the toe, and additional subject information such as weight, height, BMI, heart rate (HR), etc. would improve the accuracy of BP estimation. The rationale behind the hypothesis is that finger and toe have different arterial structures where arterial compliance is the major factor for the toe and the peripheral resistance is the main contributor to the finger PPG signal. Previous studies (with and without calibration) have used the finger PPG signal, and none of them have used toe PPG signal, and only one study used forehead PPG recording [24]. We designed and developed a recording system that allows for two-channel (finger and toe) PPG recordings as well as a single-channel ECG recording.
- A.
- Our Recording Device
The recording system consists of two modules: the amplifying module and the controlling module as shown in Figure 1 and Figure 2. The amplifier module includes a two-channel PPG and a single channel ECG signal amplifier. The central processing and control unit utilizes an ARM Cortex-M4 (Tiva Launchpad TM4C123G, Texas Instruments, Dallas, TX, USA) evaluation board and a custom I/O board which also includes analog receivers and analog-to-digital converters (10 bit, 1 kHz). The captured analog signals are conditioned before feeding through the A/D converters in two stages: I) 2nd order high pass filter at 0.5 Hz for PPG inputs and 2 Hz for ECG signals; II) 6th order low pass filter at 25 Hz for the PPG signals and 100 Hz for the ECG signal. The circuit was powered by a power bank and the voltage of the input was protected using a DC-DC converter to ensure that there is a voltage isolation barrier. Digital signals were then transmitted to a PC through a Bluetooth link with a speed of 115200 bytes per second.
The PPG sensors used were 9-pin and reusable SpO2 sensors (DS100A, Nellcor Oximax, Minneapolis, MN, USA) and the ECG electrodes used were chest-lead Ag/AgCl electrodes.
Materials and Methods should be described with sufficient details to allow others to replicate and build on the published results. Please note that the publication of your manuscript implicates that you must make all materials, data, computer code, and protocols associated with the publication available to readers. Please disclose at the submission stage any restrictions on the availability of materials or information. New methods and protocols should be described in detail while well-established methods can be briefly described and appropriately cited.
- B.
- Subjects and Experiments
A total number of 80 participants, with 39 female and 41 male subjects, were included in this study (Table 1). The average age of the subjects was 25.0±7.6 years old (18-53 years old). Written informed consent was obtained from all subjects. The subjects also completed a digital questionnaire to obtain a general health background. Out of the 80 subjects, only one reported a history of cardiac arrhythmia. Seven of the subjects have indicated they had hypertension. All of the testing procedures with human subjects and the recording place were approved by the Office of Compliance and Risk Management Institutional Review Board (IRB Approval Number: 18-030) at Florida Institute of Technology, Melbourne, FL, USA and this study was conducted according to Declaration of Helsinki ethical principles for medical research on human subjects.
Three single-use dynamic ECG–/EMG electrodes, (PB-50-060, Myovision, Seattle, USA) were placed: One was placed about 2 inches below the left underarm; the second electrode was placed approximately 2 inches below the right underarm. These two locations were selected instead of the arms to reduce motion artifacts. The ground electrode was placed on the right side of the abdominal cavity, above the iliac crest to minimize power line noise from interfering with the ECG signal. The best positions arbitrated for optimal PPG recordings were the left index finger and the right hallux. The duration of the testing was 3 minutes. Each subject was seated in an armed chair and the subject’s right foot was placed on a footrest, with their leg fully extended. A fully automatic BP monitor (Bloeddrukmeter M3, Omron, Kyoto, Japan) was used to measure the BP 30 seconds after the onset of the recording process. The device has a mean error of 1.9±3.0 and -1.0±2.3 mmHg for systolic and diastolic BP respectively [25]. The room temperature was fixed at 25 0C and the lights were dimmed.
- C.
- Features and Feature Selection
The extracted and analyzed features were categorized based on the following classes:
1) Heart Rate and PPG based: latency/time and morphology features from finger and toe PPGs.
2) Subject information-based features: weight, height, age, and BMI.
3) Other features.
- 1)
- Heart Rate and PPG Features
Heart rate: HR is an indicator of ANS activity. It also controls the cardiac output. NN is the length of successive R-R intervals.
Latency/Time: When the blood arrives at the distal PPG site, the blood volume rapidly changes [26,27,28,29]. PPG signal, as the indicator of this change in volume, consists of consecutive peaks, inflection points, and a distinctive notch, which highlight distinguishable events in the cardiovascular system (Figure 3). These sites allow for the extraction of the latency/time features from the PPG signal. The first peak is called systolic peak and the second one is known as a diastolic peak. The moment when the blood volume starts to increase is the onset of the PPG signal (the first derivative of the signal becomes positive) as shown in Figure 3.
The time delay from the ECG R peak to the onset is measured as pulse arrival time (PAT) (Figure 4a). It is shown that PAT and BP are inversely correlated. The maximum rate in blood volume change can be observed when the first derivative of the PPG signal is at its maximum. This point is called the rising point and the time delay between the R peak and the rising point is called PTT [7,9,10,11,12,17,19,21,22,23,30]. The time delay between R peak and systolic and diastolic peaks is measured as systolic pulse transit time (SPTT) and diastolic pulse transit time (DPTT) respectively as shown in Figure 4a [7,9,10,20,21,22]. Since subject’s height is related to the distance in between the source (heart) and the distal site (i.e. finger/toe), the latencies (i.e. PTT) were normalized by dividing them by the subject’s height.
Morphology features: It was shown that the stiffer arteries exhibit longer delays between systolic and diastolic peaks (ΔT) [31,32,33,34]. Large artery stiffness index (LASI) represents the ratio obtained by dividing the height by ΔT [28,29,34,35]. AI is a feature that is measured by dividing the systolic-to-diastolic peak difference by the systolic peak amplitude [28,34]. AI is an indicator of arterial stiffness, hypertension, and mortality [28,34]. This feature is directly correlated to the arterial compliance [28,34]. Each PPG cycle can be divided into two parts; one from onset to dicrotic notch (A1) and the other from the dicrotic notch to the end of the cycle (A2). The A2/A1 ratio is called inflection point area ratio (IPA) [17,19,23,28,36]. The total peripheral resistance is related to the A2/A1 ratio [17,19,23,28,36]. PPG cycles can also be represented by 4 areas indicated as S1, S2, S3, and S4 as illustrated in Figure 4b. Since the PPG signal amplitude changes by the posture, these values (S1-S4) were normalized over the total area
- 2)
- Subject Information Based Features
Physiological and physical features such as weight, height, BMI, and age are also gathered from the questionnaire each subject filled out.
- 3)
- Other Features
The PPG signals recorded from the finger and the toe follow the wave propagation equation described in (1) [21,22].
where P, L, t, A, ρ, and P(x,t) are pressure, arterial inertance per unit length, time, distance, arterial cross-section area (πr2), blood viscosity and BP function respectively. C(P) is the compliance of the arteries and represents the elasticity and the dynamical change of the cross-sectional area that is influenced by the BP [21,22].
Studies on C(P) show that it is not only related to the geometry of the artery but also to the elastic modulus (E) of the arterial wall as follows [21,22]:
Based on (6), PTT2 is related to the arterial radius, stiffness, and compliance. So, (6) can be re-written for pressure as:
As described by (8), the natural logarithm of squared PWV is used as one of the features.
Table 1 shows, anthropometric characteristics of the subjects and Table 2 provides the detailed hemodynamic, anthropometric, and temporal features that were used in this study. Other than the mentioned parameters, all of the products of feature pairs with a high dependency on BP were also selected. These pair-products included powers from -2 to 2 for each feature. So, any possible orthogonal, polynomial combination of the features was added to the features list.
- D.
- Estimation Algorithms
As the number of features grows in size, finding the best estimation algorithm becomes more challenging. In this study, we used multivariate regression analysis (MR) analysis which is currently being used in various studies [37,38,39].
Multivariate Regression Analysis
MR is an approach that models a system to find the relationship between the inputs and the outputs. The simplest form of regression analysis is linear regression analysis as represented in (11). Although a linear method was used in this study, since several non-linear features were used as the inputs, the behavior of the method is similar to polynomial models. If P is the matrix of features and B is the recorded BP, 1st-order (linear) MR analysis finds an equation that maps P on B. Where a and b are coefficient and intercept matrices, respectively. , , and are the estimated values of a, b, and B. Eventually, MAE can be calculated using (13).
where f is the number of features, and n is the number of subjects.
When dealing with a large number of features, reducing the dimension of the matrices is crucial. The two common options to reduce the complexity are dimension reduction and feature selection [40,41]. In this study, the feature selection is employed. In parallel to finding a and b, the p-values of each feature are calculated. Then, the features with p-values greater than 0.07 are removed from the features matrix, P. Then, the regression analysis is performed on the validation group, and the overall p-value is calculated. If the p-value is not acceptable, a new set of training data is selected. When the validation is passed, SBP and DBP are estimated for the test group. Also, the values of MAE, r2, and p-value are measured to check the performance.
In order to check the system performance, the ratio of mean arterial pressure (MAP) error lower than 5, 10, and 15 mmHg to the entire population of the test group are calculated. According to “The British and Irish Health Society (BIHS)” standard, the performance of BP monitoring devices can be evaluated in three grades: A, B, and C; where in a grade B device, 90% of the estimations for MAP have a cumulative error of less than 15 mmHg, 70% of the estimations have a cumulative error of less than 10 mmHg, and 50% of the estimations have a cumulative error of less than 5 mmHg [42].
- E.
- QRS Complex Detection
The QRS complex detection method is based on the first derivative of the ECG signal [43,44].
where u is the ECG signal and n is the sample number. Equation (14) applies a derivative-based filter and calculates vr (filter output) that distinguishes QRS complexes. Equation (14) is used to prevent the output to be affected by high-frequency noise [43,44]. After passing the signal through the filter, it was squared and a moving average window with 32-sample width was applied. Then, the peaks were detected by comparing vr2 with a certain threshold value.
3. Results
The collected data were divided into three groups: training, validation, and test. The test group was kept separately, and all the analyses were performed on the training and validation groups. The training group included 45 recordings and the validation and the test groups had 10 and 33 recordings, respectively. There was no special rule to select the members of the training and test groups as they were randomly selected.
A Windows application was built with Visual C# 2017 (Microsoft, Seattle, WA, USA) that stored all of the recordings, subject information (i.e. weight), and record information (i.e. recording time) in a database that was designed using MySQL workbench 6.3 CE (Oracle, Redwood Shores, CA, USA).
The ECG signals were filtered based on (13) and then were squared. The detected R peaks of ECG signals were also visually checked by a specialist to identify the false positive and negative points. The R peaks detection algorithm had an excellent performance of 100%.
The histogram of cuff-measured SBP and DBP are shown in Figure 5 where the mean of SBP and DBP were 123.96±13.08 mmHg and 77.15±8.88 mmHg, respectively.
Estimation of SBP and DBP was performed for three scenarios. 1: ECG and finger PPG; 2: ECG and toe PPG; 3: ECG, finger and toe PPG.
The PTT features of finger and toe PPGs are one of the features used in our method. As expected, the results indicate that the PTT of the finger PPG is shorter than the PTT of the toe PPG for all of the subjects as shown in Figure 6.
The features were then extracted from the collected data using MATLAB R2017a. Next, the dimension was reduced based on the significance of each feature in SPSS Statistics 25 (IBM, Armonk, New York, USA). Accepted variables (p-values< 0.07) are listed in Table 3, Table 4 and Table 5 to estimate the values for three different scenarios mentioned above. The calculations were performed with ‘automatic linear modeling’ of SPSS to extract p-values.
The value of the coefficients and the intercept were calculated with SPSS software. The relation between the pressure and multivariate regression (MR) features is described by (15) [37,38,39], where n is the number of features, is the estimated blood pressure, I is the intercept, Pi is the ith feature, and α is the calculated coefficient represented in Table 3, Table 4 and Table 5.
The results from the proposed method are shown in Table 6. The MAE and standard deviation of error (SDE) represent the accuracy and precision of the method, respectively.
Figure 7 illustrates the regression plot of estimated values versus the measured references. The R values of regression analyses for SBP and DBP estimations are 0.73 (SBP-finger), 0.72 (DBP-finger), 0.72 (SBP-toe), 0.78 (DBP-toe), 0.78 (SBP-both), and 0.73 (DBP-both) respectively.
4. Discussion
In this study, a continuous, cuff-less, and subject-independent BP estimation method is proposed based on features extracted from lead-I ECG in combination with both finger and toe PPG signals.
All the previous studies to estimate BP have used only finger PPG (except one that included forehead PPG signal [24]) in combination with ECG. None of that research has included measurements from the toe PPG. One practical reason behind this is that they have used the open-source databases such as Physionet.org, and none of these databases have simultaneous finger and toe PPG data. For that purpose, we designed and developed a measurement device that is customized for this application. This device includes two PPG and one ECG inputs/amplifiers. We conducted an experimental study with human subjects to combine ECG measurements with simultaneous finger and toe PPG recordings. Importantly, our findings showed that the most accurate BP measurements are obtained when toe PPG is included in the calculations based on the physiological nature of the toe BP (SBP and DBP) (Table 6). Peripheral resistance and arterial compliance are directly affected by BP. As explained in Section II, finger PPG indicates more peripheral resistance, while the toe PPG displays more arterial compliance. According to (6), arterial compliance is directly related to arterial BP and is also affected by arterial radius and stiffness. The arteries that provide blood to the toe PPG are larger and stiffer than the arteries that provide blood to the finger PPG. This results in more dependency on BP. Therefore, one major novelty of the study was to incorporate the toe PPG into the BP estimation which enhanced the system’s accuracy.
The first group of features was extracted from the latencies between the QRS complex of ECG and distinguishable points of PPG signals including PAT, PTT, SPTT, and DPTT. The second group of features was measured based on the morphology of PPG signals such as LASI, IPA, and S2/S1 (see Section II). Additional features involving height, weight, BMI, and gender were recorded from the questionnaires that were filled out by the subjects before taking the test. Features with the highest dependency on the output were selected, and the others were removed from the database. Previous calibration-based methods have specifically focused on PTT, PAT, HR, augmentation index (AI), LASI, IPA, S1, S2, S3, and S4 (see Section II). However, in some studies, BP has been shown to be correlated to age, weight, height, gender, and BMI, which have never been used in any calibration-free techniques [31,32,33,35]. Therefore, another contribution of this study was to include, combine and analyze those features in relation to BP estimation. We thoroughly assessed each feature and calculated the p-values of their contribution to BP estimation, and we used only features that played a substantial part in the estimation, as shown in Table 3, Table 4 and Table 5.
The strategy to check the performance of estimation was based on MR analysis which is the easiest technique to find the regression equation of a multivariate model. Using MR analysis, SBP estimation MAE was 10.28±13.31 (finger), 9.70±12.62 (toe), and 9.63±12.54 (both) mmHg. The MAEs for DBP estimation were 7.08±9.18 (finger), 6.93±8.84 (toe), and 6.76±8.38 (both) mmHg. According to the BIHS standard, this device can be categorized as a grade B automated BP monitor.
MR analysis techniques are powerful in modeling linear models but sometimes may have limitations in dealing with non-linear models. However, non-linear forms of inputs were included to obtain a better fit.
The results from MR analysis demonstrated that the toe PPG displays better results than finger PPG. Moreover, using both signals from the finger and toe PPGs further improved the performance of the estimator as shown in Table 6.
Two of the key concerns regarding cuff-less and continuous BP measurement systems are their accuracy and requirement for periodic BP cuff-based readings. There are only a couple of studies that have come up with a calibration-free BP estimation [17,19]. No requirement for calibration can theoretically widen the clinical use of these methods and that was our motivation to introduce a technique that is subject-independent and does not rely on an initial cuff-based measurement. The results from one of the related previous studies, [19], reported MAE of 6.34 mmHg (DBP) and 12.83 (SBP) mmHg from a support vector machine (SVM) method, which provided the lowest error rate between the algorithms they covered. That study was based on machine learning strategies such as ANN, SVM as well as linear regression analysis. In a related study from the same team [17], they updated their algorithms and found the lowest MAE of 5.35 (DBP) and 11.17 (SBP) mmHg from their radial basis function (RBF) kernel SVM calibration-free method. The estimation error (MAE) from our method for DBP is 1.54 mmHg higher, and for SBP is 1.41 mmHg lower than the previous calibration-free studies. In addition, the r values of regression analyses showed that our method fitted the SBP estimation values on the reference values relatively better than other proposed methods [17,19]. Table 7 compares our results with the two other calibration-free studies [17,19]. Finally, the biggest difference of our work from those two studies is to include other parameters such as the toe PPG, HR, as well as anthropometric features (weight, height, BMI, etc.).There are several limitations to this study. The majority of the subjects were young students between the ages of 18-25, even though other age groups were also involved in the study. In addition, only 8 subjects have indicated they had cardiovascular conditions; therefore, we will extend our future study to include more subjects and subjects with cardiovascular disease history. The testing was performed while the subjects were sitting in a chair, and their signals were not recorded at different postures. The effect of posture on BP estimation will also be investigated in another study.
5. Conclusions
In conclusion, the highlights of this study are to integrate the toe PPG measurements into cuff-less BP estimations; a unique customized design and development of a two PPG and one-channel ECG recording system; demonstration of enhanced BP accuracy when the toe PPG is included, and even better accuracy when both toe and finger PPG recordings are performed; a subject-independent system that uses an MR-based method towards the goal of improving the performance of cuff-less BP devices in clinical uses. This study also analyzes a total number of 15 features and selects those that meet dependency criteria.
The ability to monitor sudden changes in BP continuously and managing hypertension in the early stage can be significant to reduce cardiovascular events as well as costs related to cardiovascular diseases. Therefore, this study represents a novel effort towards a reliable, continuous, calibration-free BP device with improved estimation accuracy, and can potentially allow for wider clinical use of BP monitoring including ambulatory and home health care [20].
Author Contributions
Conceptualization, S.D. and M.K.; Data curation, S.D., C.P., B.M., K.H. and M.K.; Formal analysis, S.D., P.T.G., M.A., Y.W., E.S., M.M.S. and M.K.; Investigation, M.K.; Resources, M.K.; Software, S.D. and M.K.; Validation, S.D., C.P., B.M., K.H. and M.K.; Visualization, S.D., P.T.G., M.A., Y.W., E.S. and M.M.S.; Writing – original draft, S.D. and M.K.; Writing – review & editing, S.D., P.T.G., M.A., Y.W., E.S., M.M.S. and M.K. All authors have read and agreed to the published version of the manuscript.
Funding
This research received no external funding.
Institutional Review Board Statement
This study was conducted in accordance with the Declaration of Helsinki and approved by the Institutional Review Board (IRB Approval Number: 18-030) at Florida Institute of Technology, Melbourne, FL, USA, in May 2018.
Informed Consent Statement
Informed consent was obtained from all subjects involved in the study.
Data Availability Statement
The data presented in this study are available on request from the corresponding author.
Conflicts of Interest
The authors declare no conflicts of interest.
References
- Gupta A. et al. Legacy benefits of blood pressure treatment on cardiovascular events are primarily mediated by improved blood pressure variability: the ASCOT trial. Eur. Heart J., 2024, vol. 45, no. 13, pp. 1159–1169. [CrossRef]
- Ding, X.; Yan, B. P.; Zhang, Y.-T.; Liu, J.; Zhao, N.; Tsang, H. K. Pulse Transit Time Based Continuous Cuffless Blood Pressure Estimation: A New Extension and A Comprehensive Evaluation. Sci. Rep., 2017, vol. 7, no. 1, p. 11554. [CrossRef]
- Picciotto, D. et al. Long-term systolic blood pressure variability as an independent risk factor for cardiovascular events in kidney transplant recipients. J. Hypertens., 2024, vol. 42, Suppl. 1, p. e50. [CrossRef]
- Eguchi, K.; Kuruvilla, S.; Ogedegbe, G.; Gerin, W.; Schwartz, J. E.; Pickering, T. G. What is the optimal interval between successive home blood pressure readings using an automated oscillometric device? J. Hypertens., 2009, vol. 27, no. 6, p. 1172. [CrossRef]
- Rexhaj, E. et al. Evaluation of a cuffless watch-like sensor for 24-hour ambulatory blood pressure monitoring. Eur. Heart J., 2021, vol. 42, Suppl. 1, p. ehab724-2348. [CrossRef]
- Goldberg, E. M.; Levy, P. D. New approaches to evaluating and monitoring blood pressure. Curr. Hypertens. Rep., 2016, vol. 18, no. 6, p. 49. [CrossRef]
- Lee, H.; Lee, H.-Y. Comparison of calibration methods in the precision of a ring-type cuffless blood pressure measurement device. J. Hypertens., 2024, vol. 42, Suppl. 1, p. e78. [CrossRef]
- Matsumura, K.; Rolfe, P.; Toda, S.; Yamakoshi, T. Cuffless blood pressure estimation using only a smartphone. Sci. Rep., 2018, vol. 8, no. 1, p. 7298. [CrossRef]
- Burkard, T. et al. Ability of a cuffless 24-hour ambulatory blood pressure measurement device to track blood pressure changes compared to a cuff-based device. J. Hypertens., 2023, vol. 41, Suppl. 3, p. e9. [CrossRef]
- Derendinger, F. C. et al. Ability of a 24-h ambulatory cuffless blood pressure monitoring device to track blood pressure changes in clinical practice. J. Hypertens., 2024, vol. 42, no. 4, pp. 662–671. [CrossRef]
- Gravity, Q. New photoplethysmogram indicators for improving cuffless and continuous blood pressure estimation accuracy. Physiol. Meas., 2018, vol. 39, no. 2, p. 25005. [CrossRef]
- Xing, X.; Sun, M. Optical blood pressure estimation with photoplethysmography and FFT-based neural networks. Biomed. Opt. Express, 2016, vol. 7, no. 8, p. 3007. [CrossRef]
- Huynh, T. H.; Jafari, R.; Chung, W. Y. Noninvasive cuffless blood pressure estimation using pulse transit time and impedance plethysmography. IEEE Trans. Biomed. Eng., 2019, Apr., vol. 66, no. 4, pp. 967–976. [CrossRef]
- Butlin, M.; Shirbani, F.; Barin, E.; Tan, I.; Spronck, B.; Avolio, A. P. Cuffless estimation of blood pressure: Importance of variability in blood pressure dependence of arterial stiffness across individuals and measurement sites. IEEE Trans. Biomed. Eng., 2018, Nov., vol. 65, no. 11, pp. 2377–2383. [CrossRef]
- Sharifi, I.; Goudarzi, S.; Khodabakhshi, M. B. A novel dynamical approach in continuous cuffless blood pressure estimation based on ECG and PPG signals. Artif. Intell. Med., 2019, Jun., vol. 97, pp. 143–151. [CrossRef]
- Sharma, M. et al. Cuff-Less and Continuous Blood Pressure Monitoring: A Methodological Review. Technologies, 2017, May, vol. 5, no. 2, p. 21. [CrossRef]
- Kachuee, M.; Kiani, M. M.; Mohammadzade, H.; Shabany, M. Cuffless Blood Pressure Estimation Algorithms for Continuous Health-Care Monitoring. IEEE Trans. Biomed. Eng., 2017, vol. 64, no. 4, pp. 859–869. [CrossRef]
- Dehghanojamahalleh, S.; Kaya, M. Sex-related Differences in Photoplethysmography Signals Measured from Finger and Toe. IEEE J. Transl. Eng. Heal. Med., 2019, vol. 7, pp. 1–7. [CrossRef]
- Kachuee, M.; Kiani, M. M.; Mohammadzade, H.; Shabany, M. Cuff-less high-accuracy calibration-free blood pressure estimation using pulse transit time. In 2015 IEEE International Symposium on Circuits and Systems (ISCAS), 2015, pp. 1006–1009. [CrossRef]
- Vlachopoulos, C.; O’Rourke, M.; Nichols, W. W. McDonald’s blood flow in arteries: theoretical, experimental and clinical principles. CRC Press, 2011.
- Mukkamala, R.; Hahn, J. O. Toward Ubiquitous Blood Pressure Monitoring via Pulse Transit Time: Predictions on Maximum Calibration Period and Acceptable Error Limits. IEEE Trans. Biomed. Eng., 2018, vol. 65, no. 6, pp. 1410–1420. [CrossRef]
- Mukkamala, R. et al. Toward Ubiquitous Blood Pressure Monitoring via Pulse Transit Time: Theory and Practice. IEEE Trans. Biomed. Eng., 2015, vol. 62, no. 8, pp. 1879–1901. [CrossRef]
- Esmaili, A.; Kachuee, M.; Shabany, M. Nonlinear Cuffless Blood Pressure Estimation of Healthy Subjects Using Pulse Transit Time and Arrival Time. IEEE Trans. Instrum. Meas., 2017, vol. 66, no. 12, pp. 3299–3308. [CrossRef]
- Franco, J.; Aedo, J.; Rivera, F. Continuous, non-invasive and cuff-free blood pressure monitoring system. In 2012 VI Andean Region International Conference (ANDESCON), 2012, pp. 31–34. [CrossRef]
- Asmar, R.; Khabouth, J.; Topouchian, J.; El Feghali, R.; Mattar, J. Validation of three automatic devices for self-measurement of blood pressure according to the International Protocol: The Omron M3 Intellisense (HEM-7051-E), the Omron M2 Compact (HEM 7102-E), and the Omron R3-I Plus (HEM 6022-E). Blood Press. Monit., 2010, Feb., vol. 15, no. 1, pp. 49–54. [CrossRef]
- Pappano, A. J.; Wier, W. G. Cardiovascular Physiology E-Book: Mosby Physiology Monograph Series. Elsevier Health Sciences, 2012.
- Hall, J. E. Guyton and Hall Textbook of Medical Physiology e-Book. Elsevier Health Sciences, 2015.
- Elgendi, M. On the Analysis of Fingertip Photoplethysmogram Signals. Curr. Cardiol. Rev., 2012, vol. 8, no. 1, pp. 14–25. [CrossRef]
- Allen J., “Photoplethysmography and its application in clinical physiological measurement,” Physiol. Meas., 2007, vol. 28, no. 3, R1–R39. [CrossRef]
- Paliakaitė, B.; Daukantas, S.; Marozas, V. Assessment of Pulse Arrival Time for Arterial Stiffness Monitoring on Body Composition Scales. Comput. Biol. Med., 2017, vol. 85, pp. 135–142. [CrossRef]
- Mitchell, G. F. et al. Changes in Arterial Stiffness and Wave Reflection With Advancing Age in Healthy Men and Women. Hypertension, 2004, vol. 43, no. 6, pp. 1239–1245. [CrossRef]
- Lakatta, L. E. et al. Effects of Age and Aerobic Capacity on Arterial Stiffness in Healthy Adults. Circulation, 2012, vol. 88, no. 4, pp. 1456–1462. [CrossRef]
- Benetos, A. et al. Influence of Age, Risk Factors, and Cardiovascular and Renal Disease on Arterial Stiffness: Clinical Applications. Am. J. Hypertens., 2002, vol. 15, no. 12, pp. 1101–1108. [CrossRef]
- Yousef, Q.; Reaz, M. B. I.; Ali, M. A. M. The Analysis of PPG Morphology: Investigating the Effects of Aging on Arterial Compliance. Meas. Sci. Rev., 2012, vol. 12, no. 6, pp. 266–271. [CrossRef]
- Wilkinson, I. et al. Expert Consensus Document on Arterial Stiffness: Methodological Issues and Clinical Applications. Eur. Heart J., 2006, vol. 27, no. 21, pp. 2588–2605. [CrossRef]
- Millasseau, S. C.; Kelly, R. P.; Ritter, J. M.; Chowienczyk, P. J. Determination of Age-Related Increases in Large Artery Stiffness by Digital Pulse Contour Analysis. Clin. Sci., 2002, vol. 103, no. 4, pp. 371–377. [CrossRef]
- Stolzenberg, R. M. Multiple Regression Analysis. Handb. Data Anal., 2004, vol. 165, p. 208. [CrossRef]
- Hair, J. F.; Black, W. C.; Babin, B. J.; Anderson, R. E.; Tatham, R. L. Multivariate Data Analysis. Prentice Hall, Upper Saddle River, NJ, 1998, vol. 5, no. 3.
- Tabachnick, B. G.; Fidell, L. S. Using Multivariate Statistics. Allyn & Bacon/Pearson Education, 2007.
- Carreira-Perpiñán, M. Á. A Review of Dimension Reduction Techniques. Dep. Comput. Sci. Univ. Sheffield. Tech. Rep., 1997, vol. 9, no. CS-96-09, pp. 1–69.
- Fodor, I. K. A Survey of Dimension Reduction Techniques. Lawrence Livermore National Lab., CA (US), 2002.
- O’Brien, E. et al. The British Hypertension Society Protocol for the Evaluation of Automated and Semi-Automated Blood Pressure Measuring Devices with Special Reference to Ambulatory Systems. J. Hypertens., 1990, vol. 8, no. 7, pp. 607–619. [CrossRef]
- Arzeno, N. M.; De Deng, Z.-D.; Poon, C.-S. S. Analysis of First-Derivative Based QRS Detection Algorithms. IEEE Trans. Biomed. Eng., 2008, vol. 55, no. 2, pp. 478–484. [CrossRef]
- Arzeno, N. M.; Poon, C.-S.; Deng, Z.-D. Quantitative Analysis of QRS Detection Algorithms Based on the First Derivative of the ECG. In 2006 EMBS’06 28th Annual International Conference of the IEEE Engineering in Medicine and Biology Society, 2006, pp. 1788–1791. [CrossRef]
Figure 1.
One-channel ECG and two-channel PPG amplifiers: (a) Central processing; (b) Control unit.
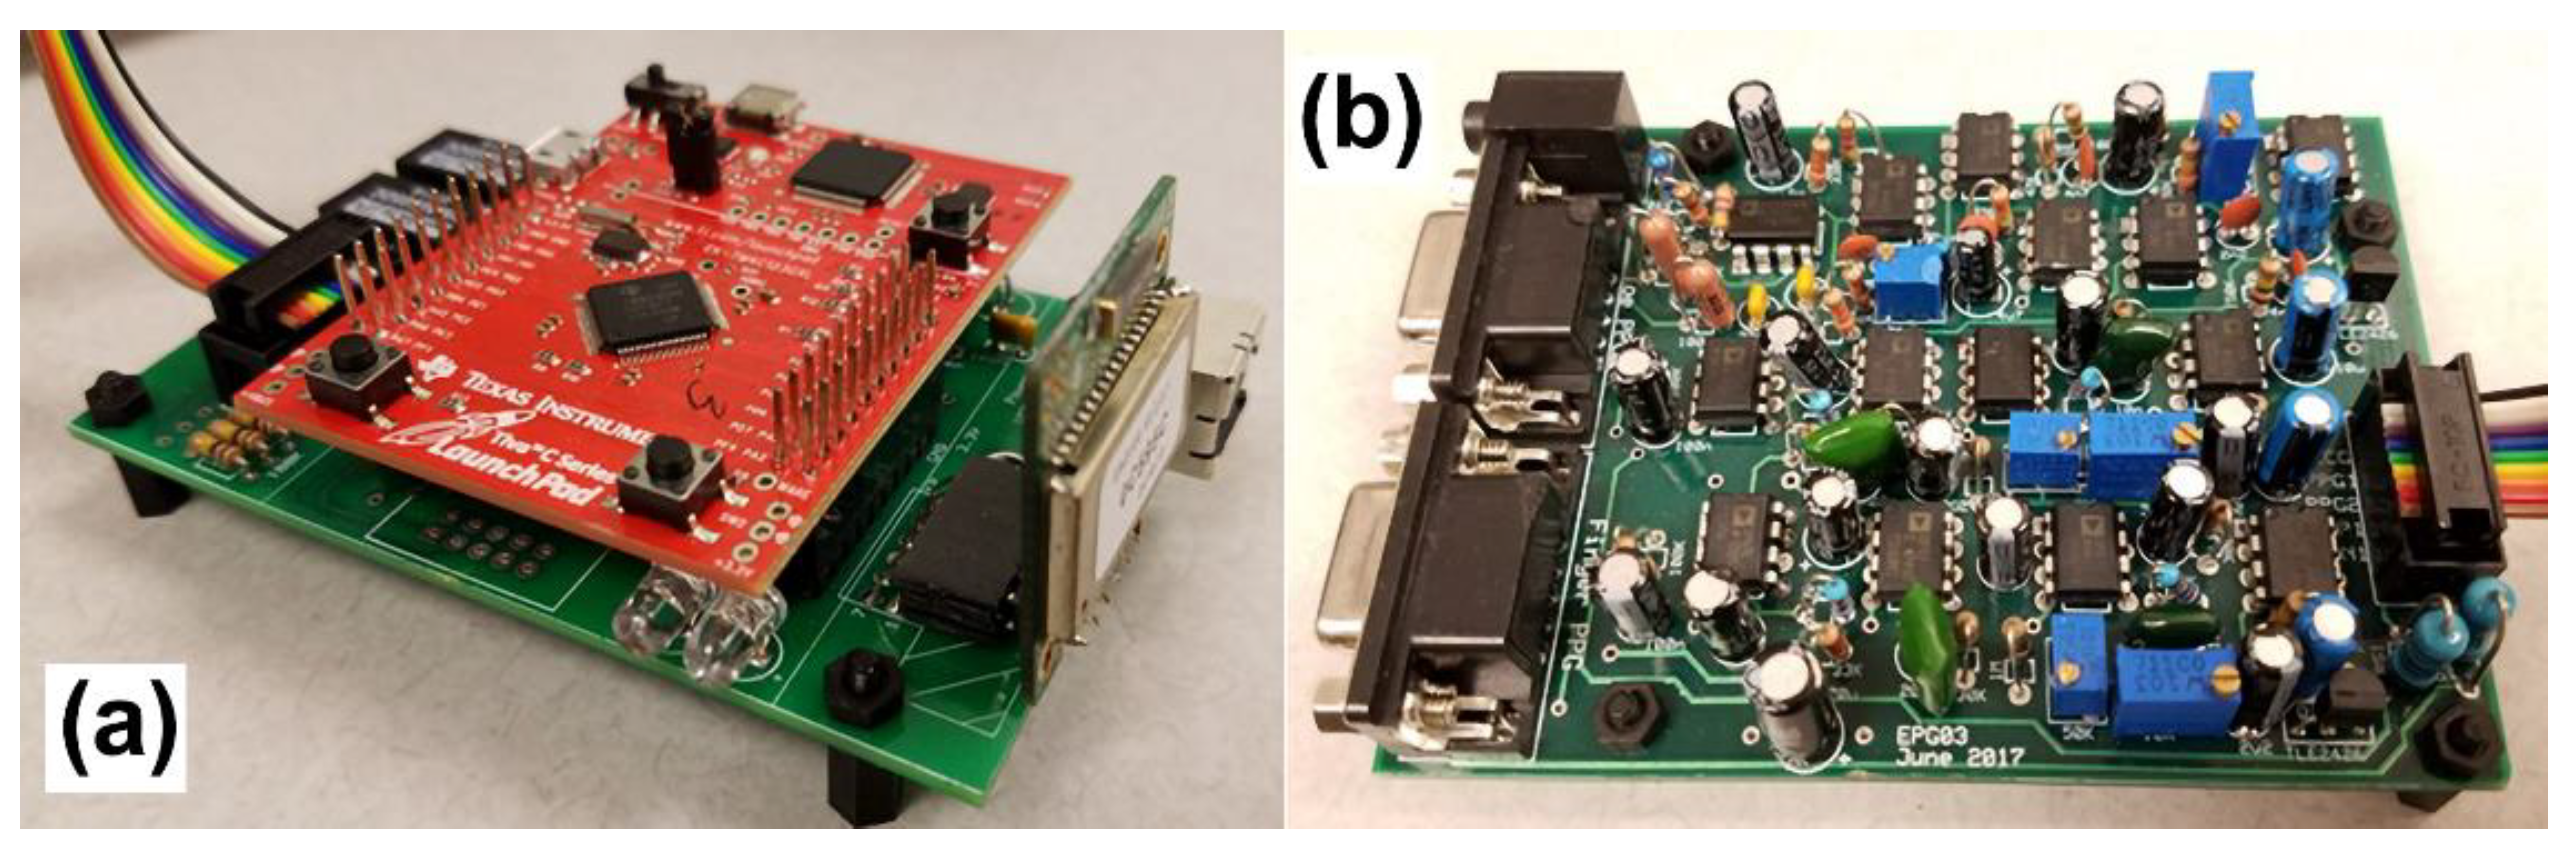
Figure 2.
Block diagram of the recording device.
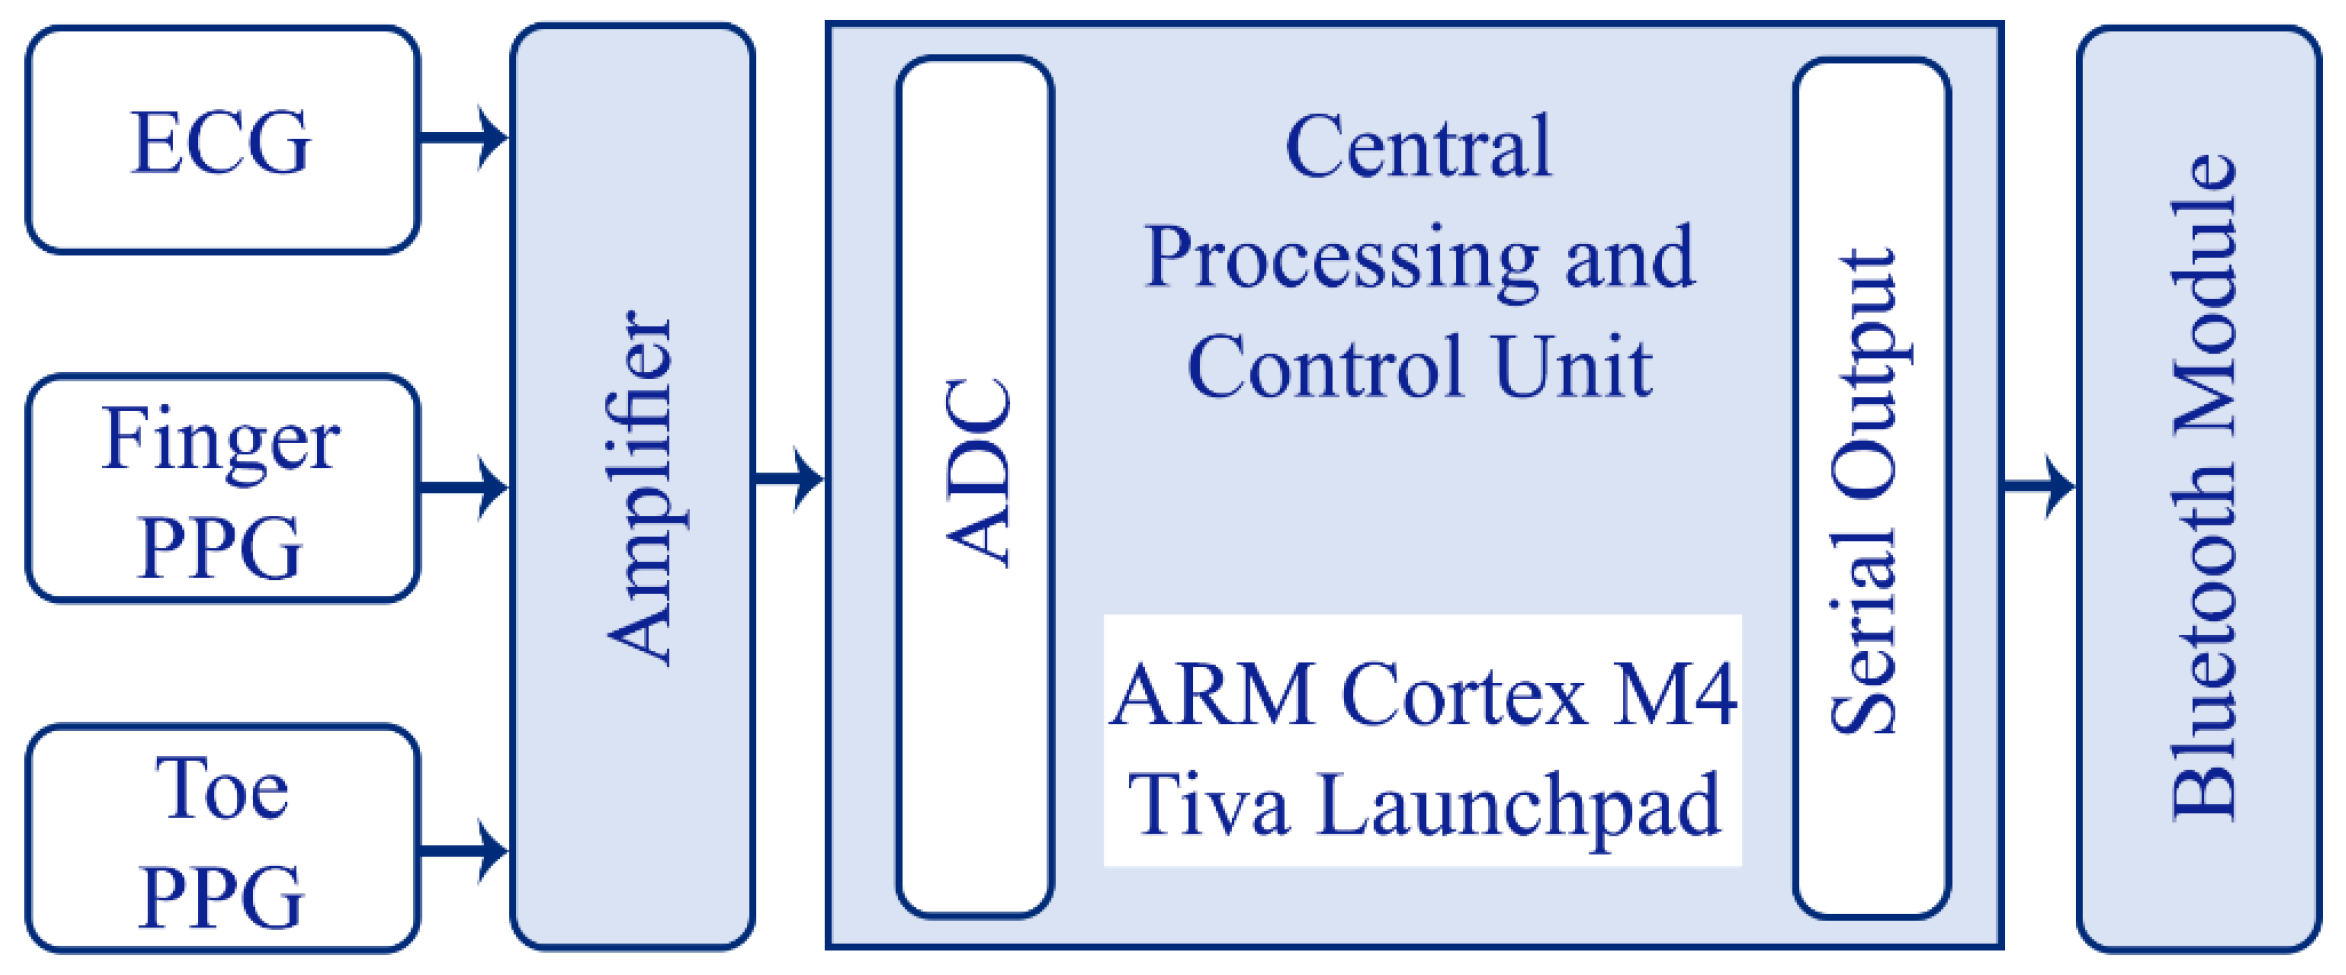
Figure 3.
Finger & Toe PPG cycles and their features including systolic peak, diastolic peak, rising point, and onset.
Figure 3.
Finger & Toe PPG cycles and their features including systolic peak, diastolic peak, rising point, and onset.
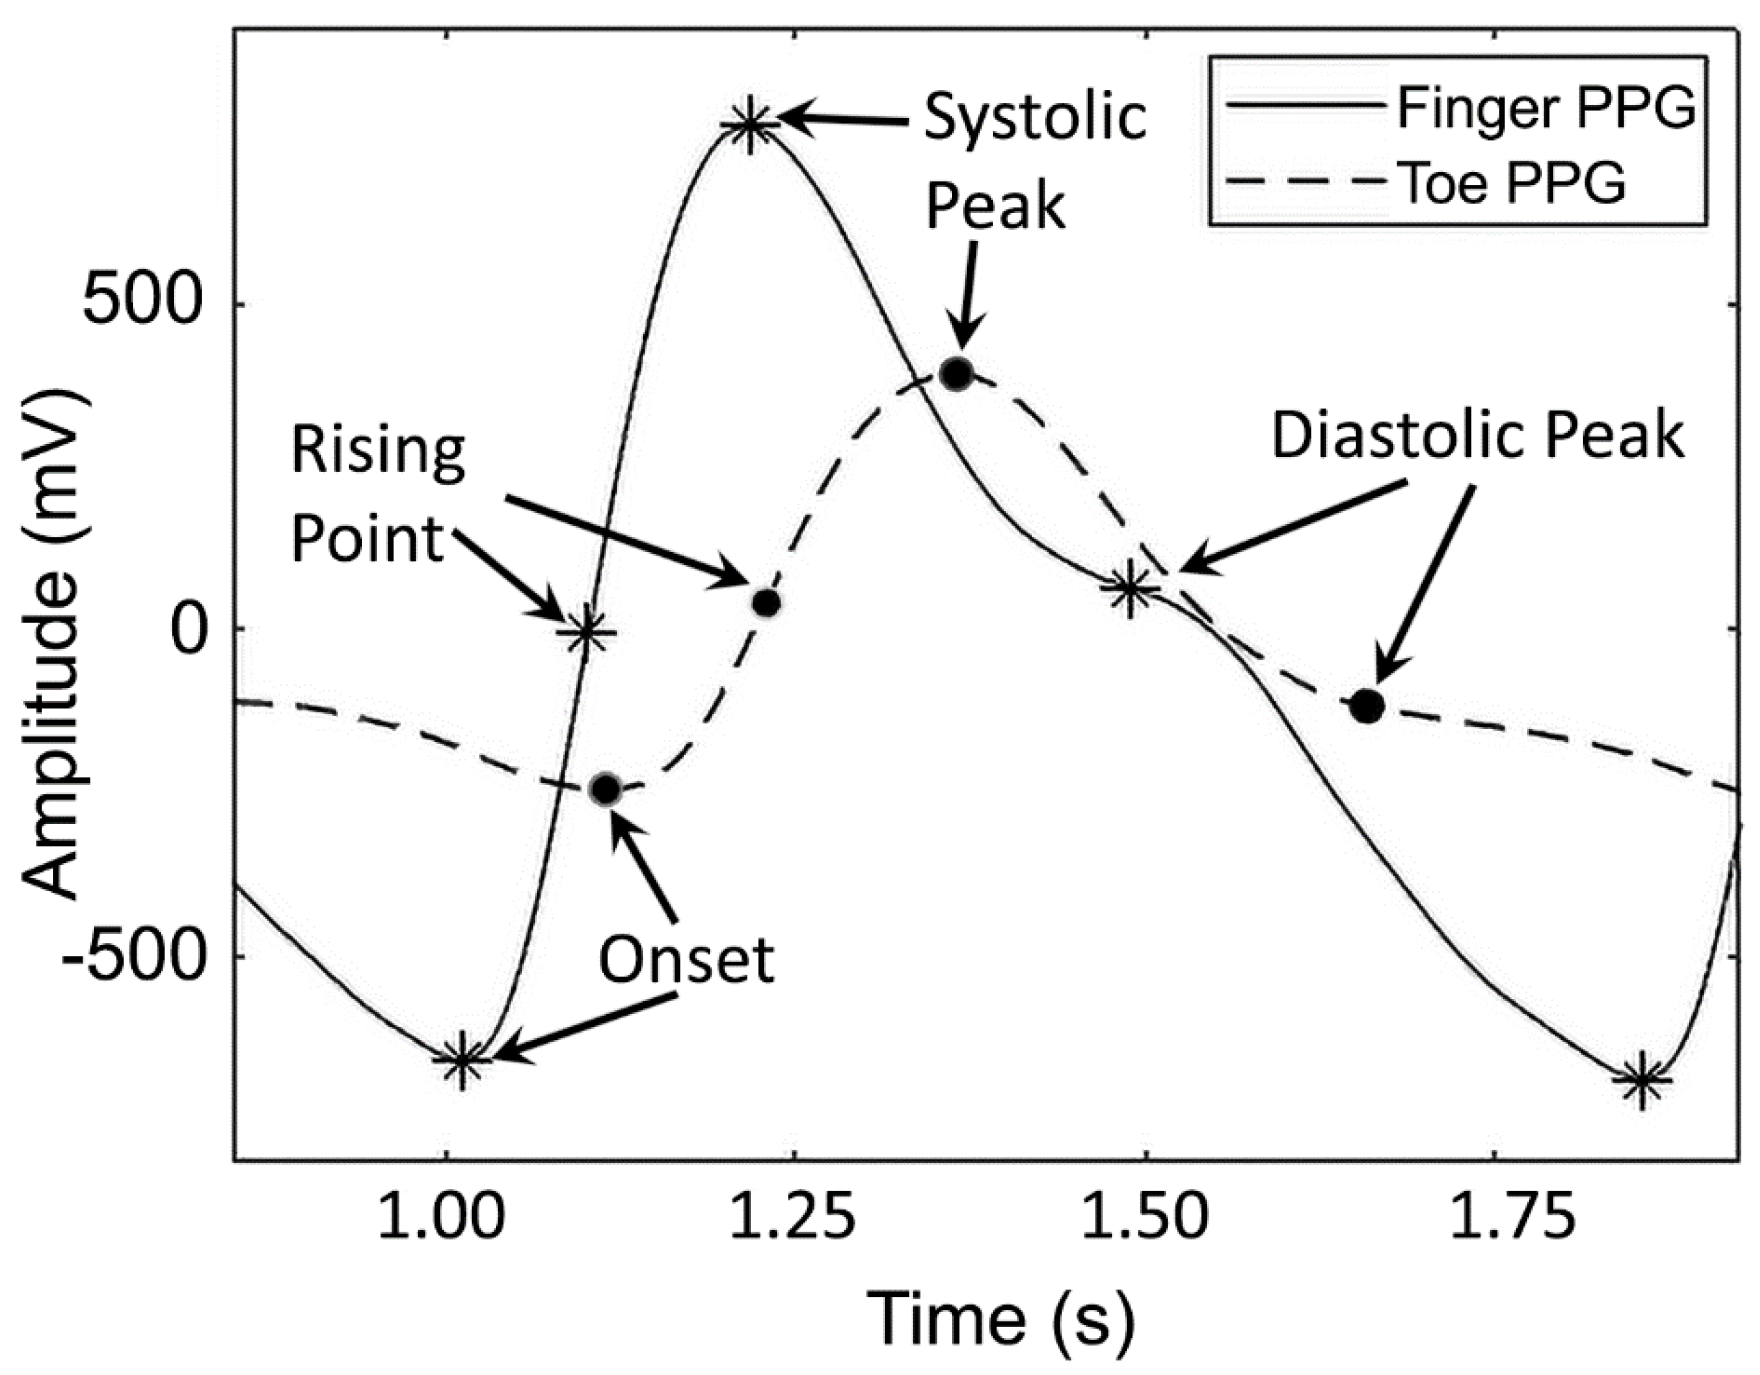
Figure 4.
ECG (solid line), PPG (dashed line): (a) PAT, PTT, SPTT, DPTT and ΔT are also illustrated on the figure with arrows; (b) S1 is the enclosed area from onset to the rising point; S2 is the enclosed area from the rising point to the systolic peak; S3 is the enclosed area from the systolic peak to dicrotic notch; S4=A2 the enclosed area from the dicrotic notch to the end of the cycle; A1 = S1+S2+S3.
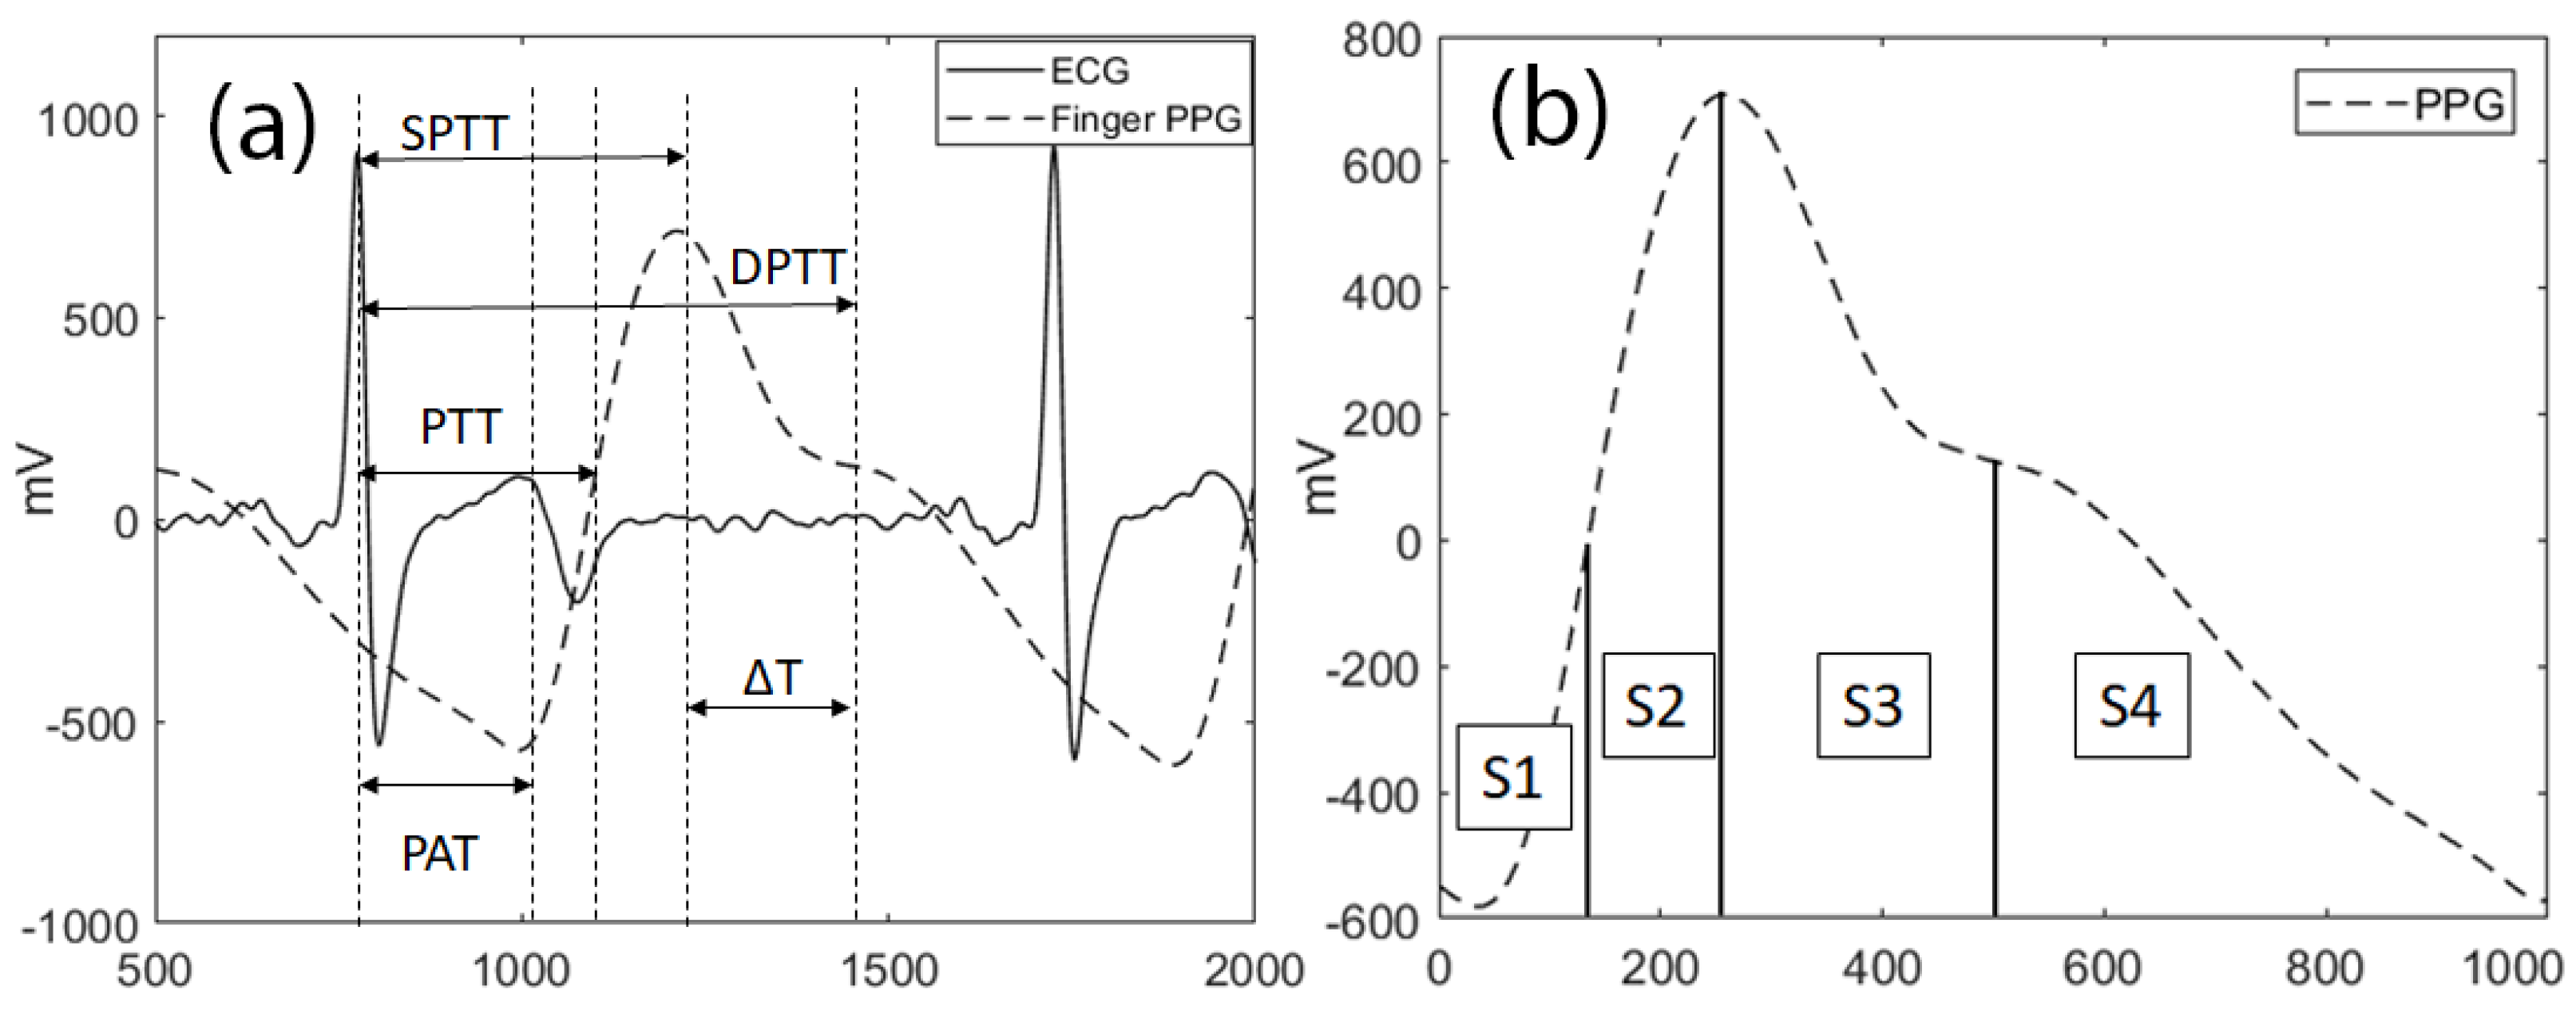
Figure 5.
Histogram of: (a) measured DBP and (b) measured SBP. The distribution curves (in red) are also shown for the histograms.
Figure 5.
Histogram of: (a) measured DBP and (b) measured SBP. The distribution curves (in red) are also shown for the histograms.
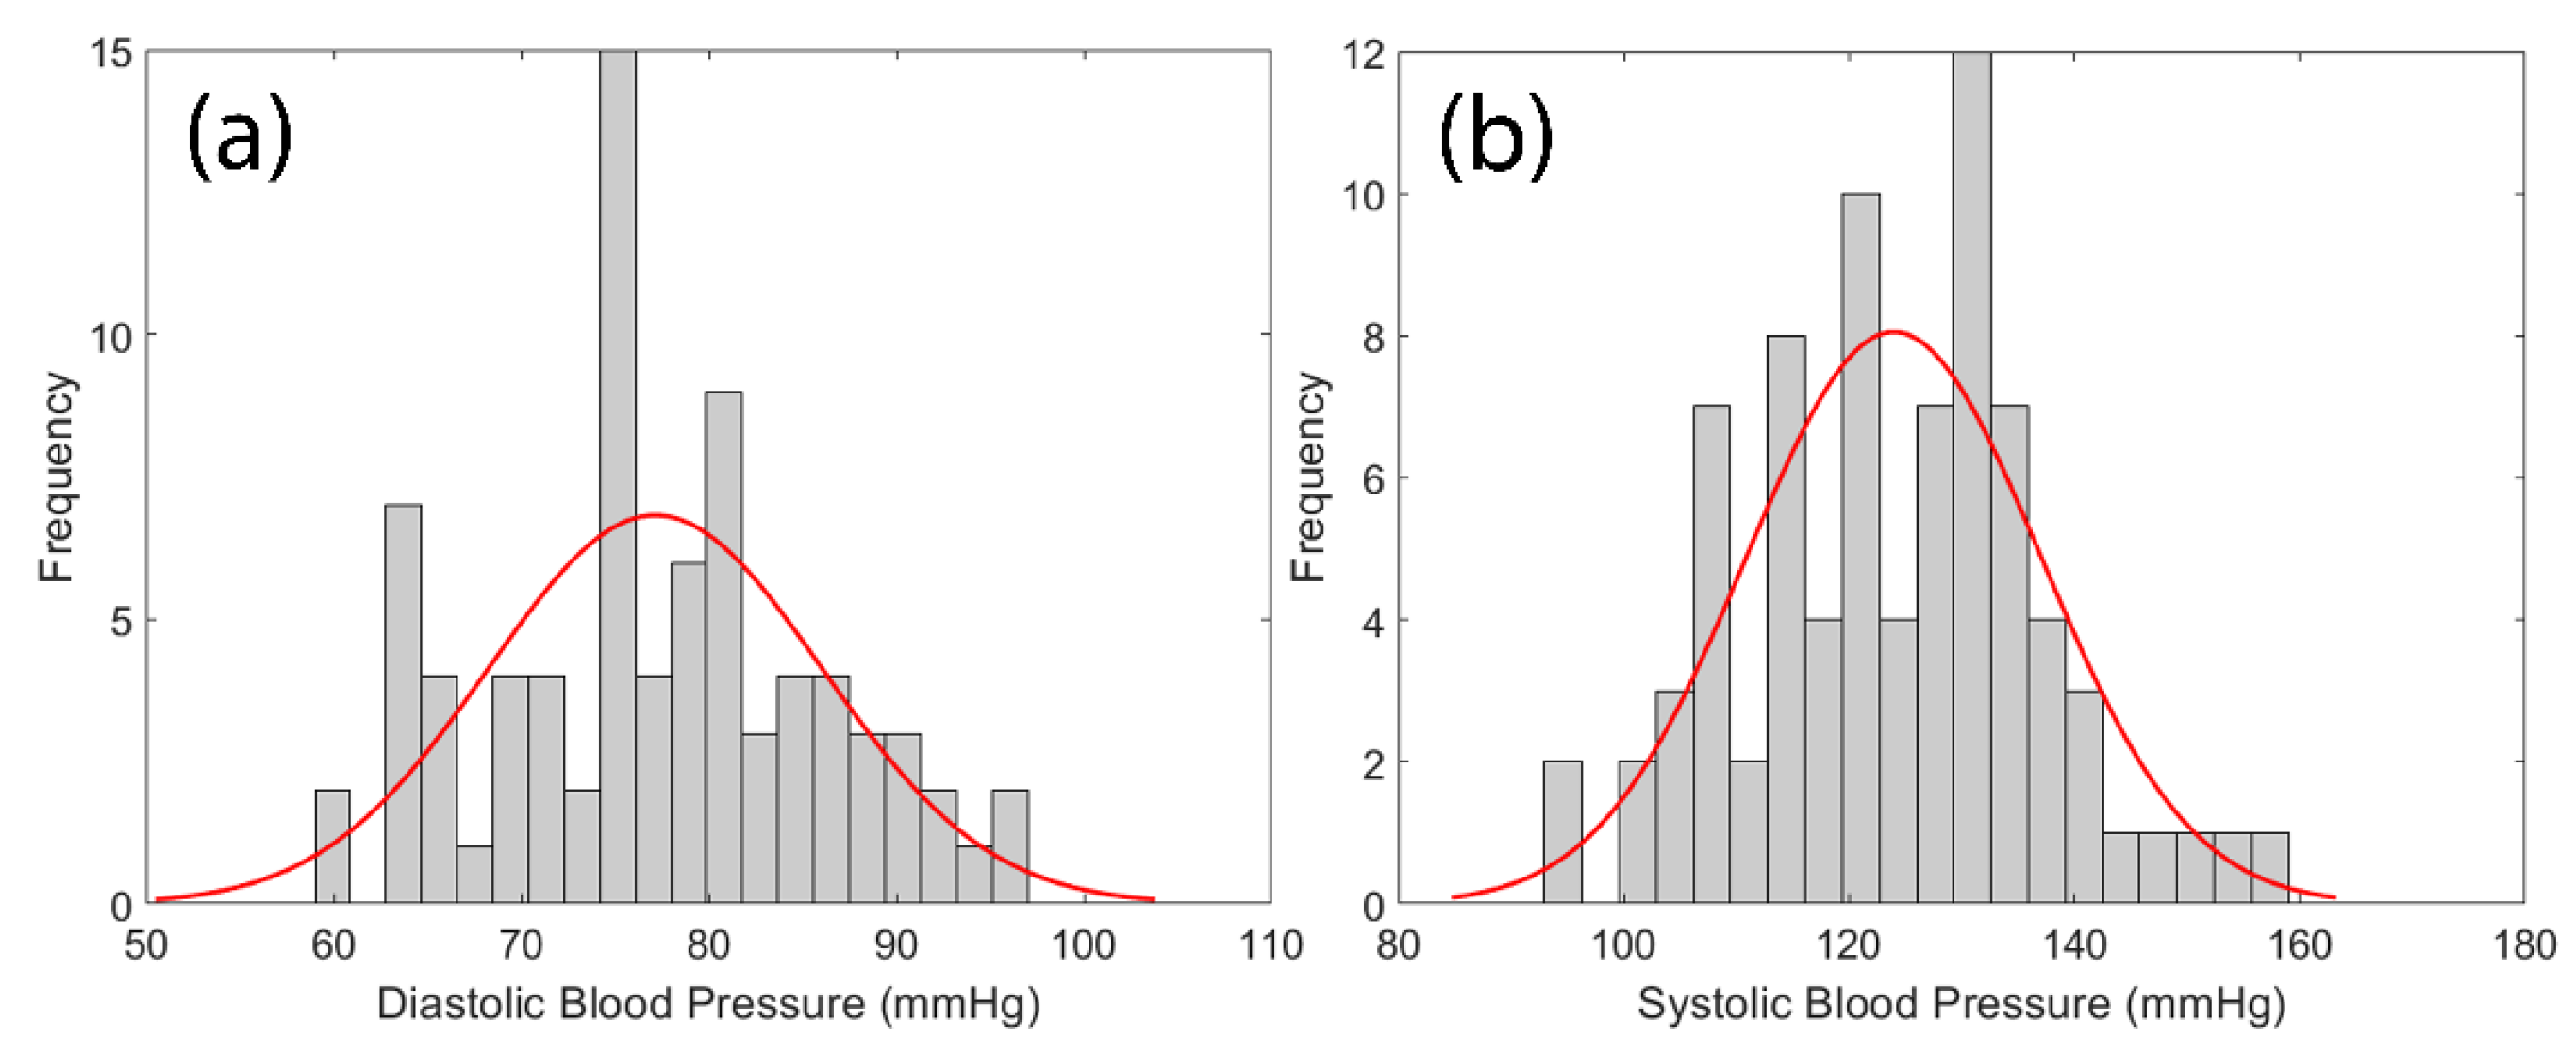
Figure 6.
SBP vs. PTT scatter plot for: (a) finger and toe PPG; (b) DBP vs. PTT scatter diagram for finger and toe PPG.
Figure 6.
SBP vs. PTT scatter plot for: (a) finger and toe PPG; (b) DBP vs. PTT scatter diagram for finger and toe PPG.
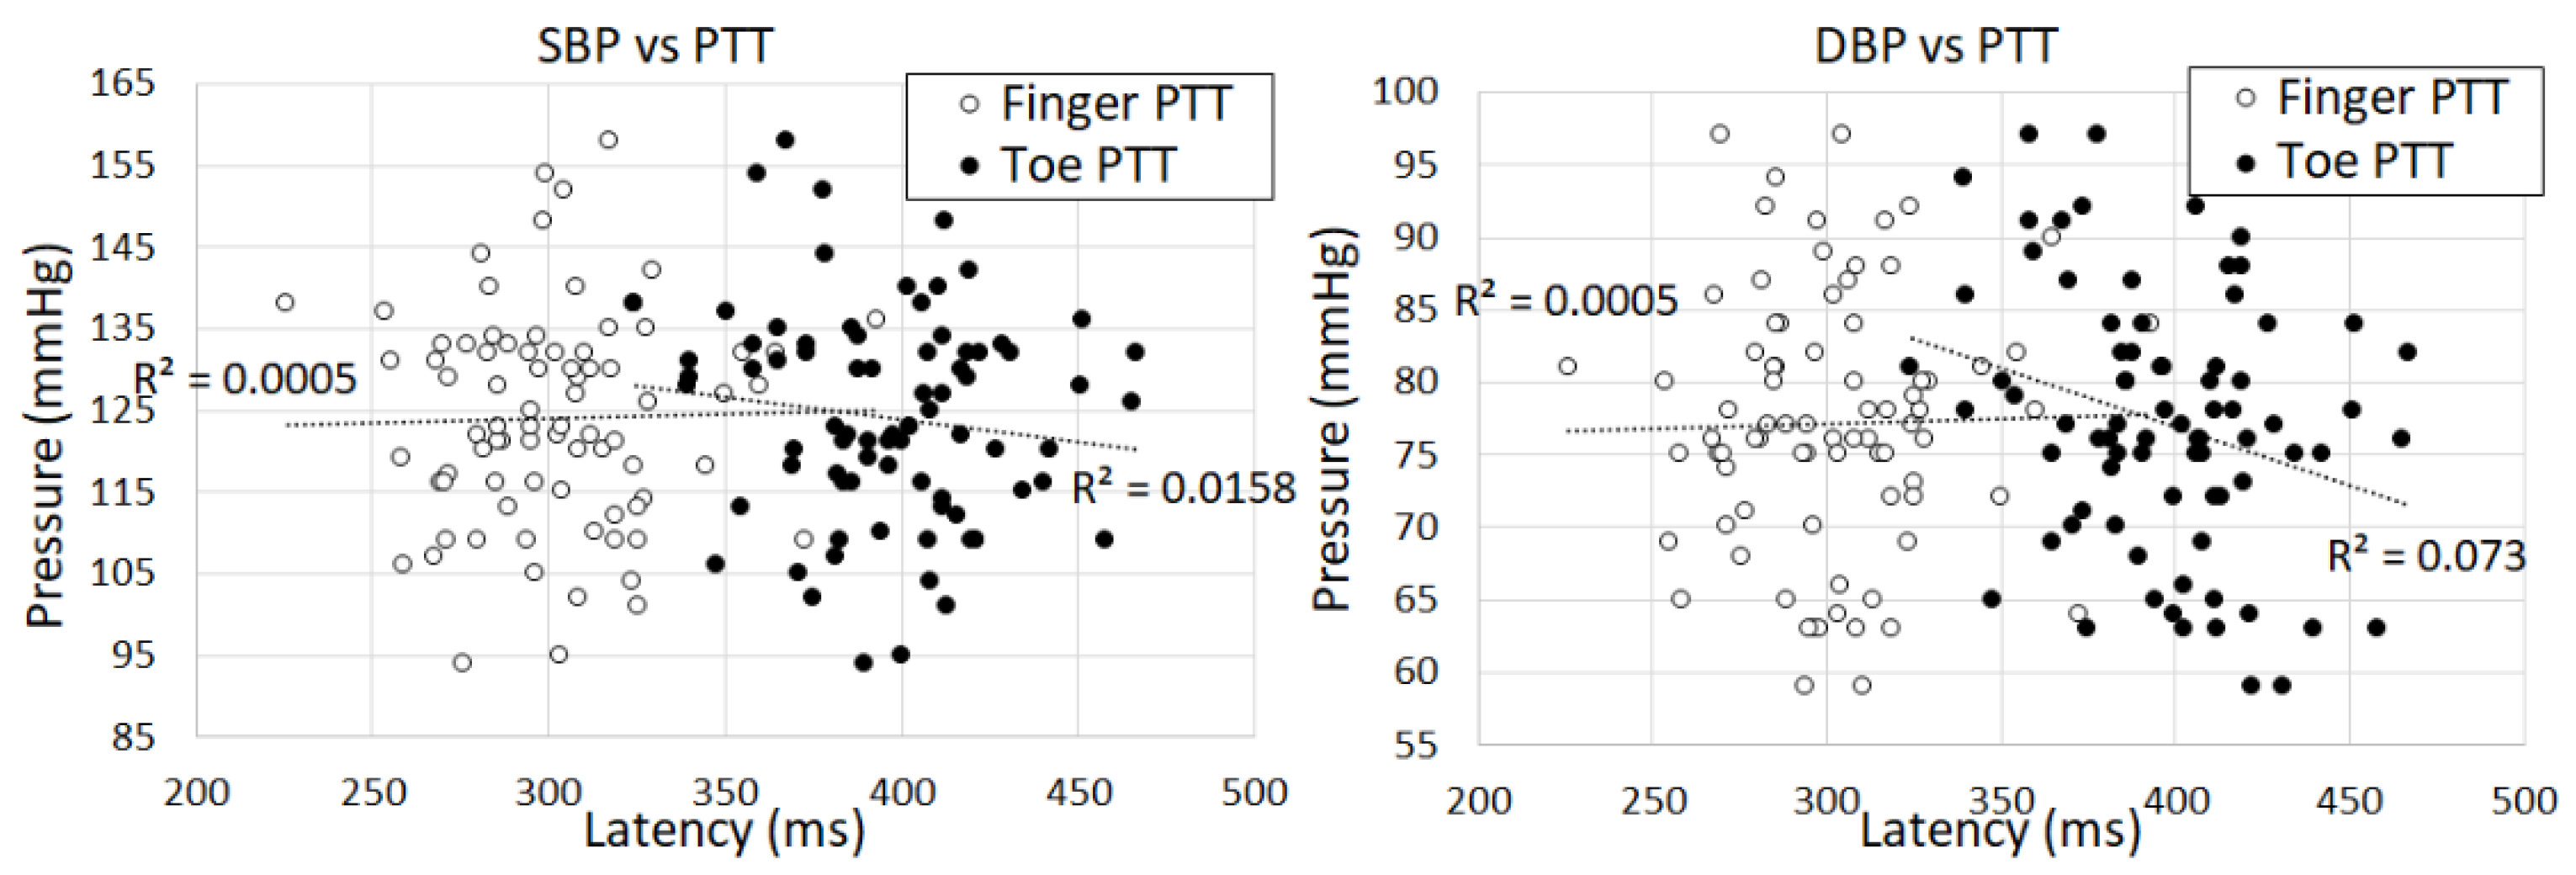
Figure 7.
Regression plots illustrating measured DBP vs. estimated DBP: (a) using finger PPG; (c) using toe PPG; (e) both PPG (finger+toe). Measured SBP vs. estimated SBP: (b) using finger PPG; (d) using toe PPG; (f) using both PPG (finger+toe).
Figure 7.
Regression plots illustrating measured DBP vs. estimated DBP: (a) using finger PPG; (c) using toe PPG; (e) both PPG (finger+toe). Measured SBP vs. estimated SBP: (b) using finger PPG; (d) using toe PPG; (f) using both PPG (finger+toe).
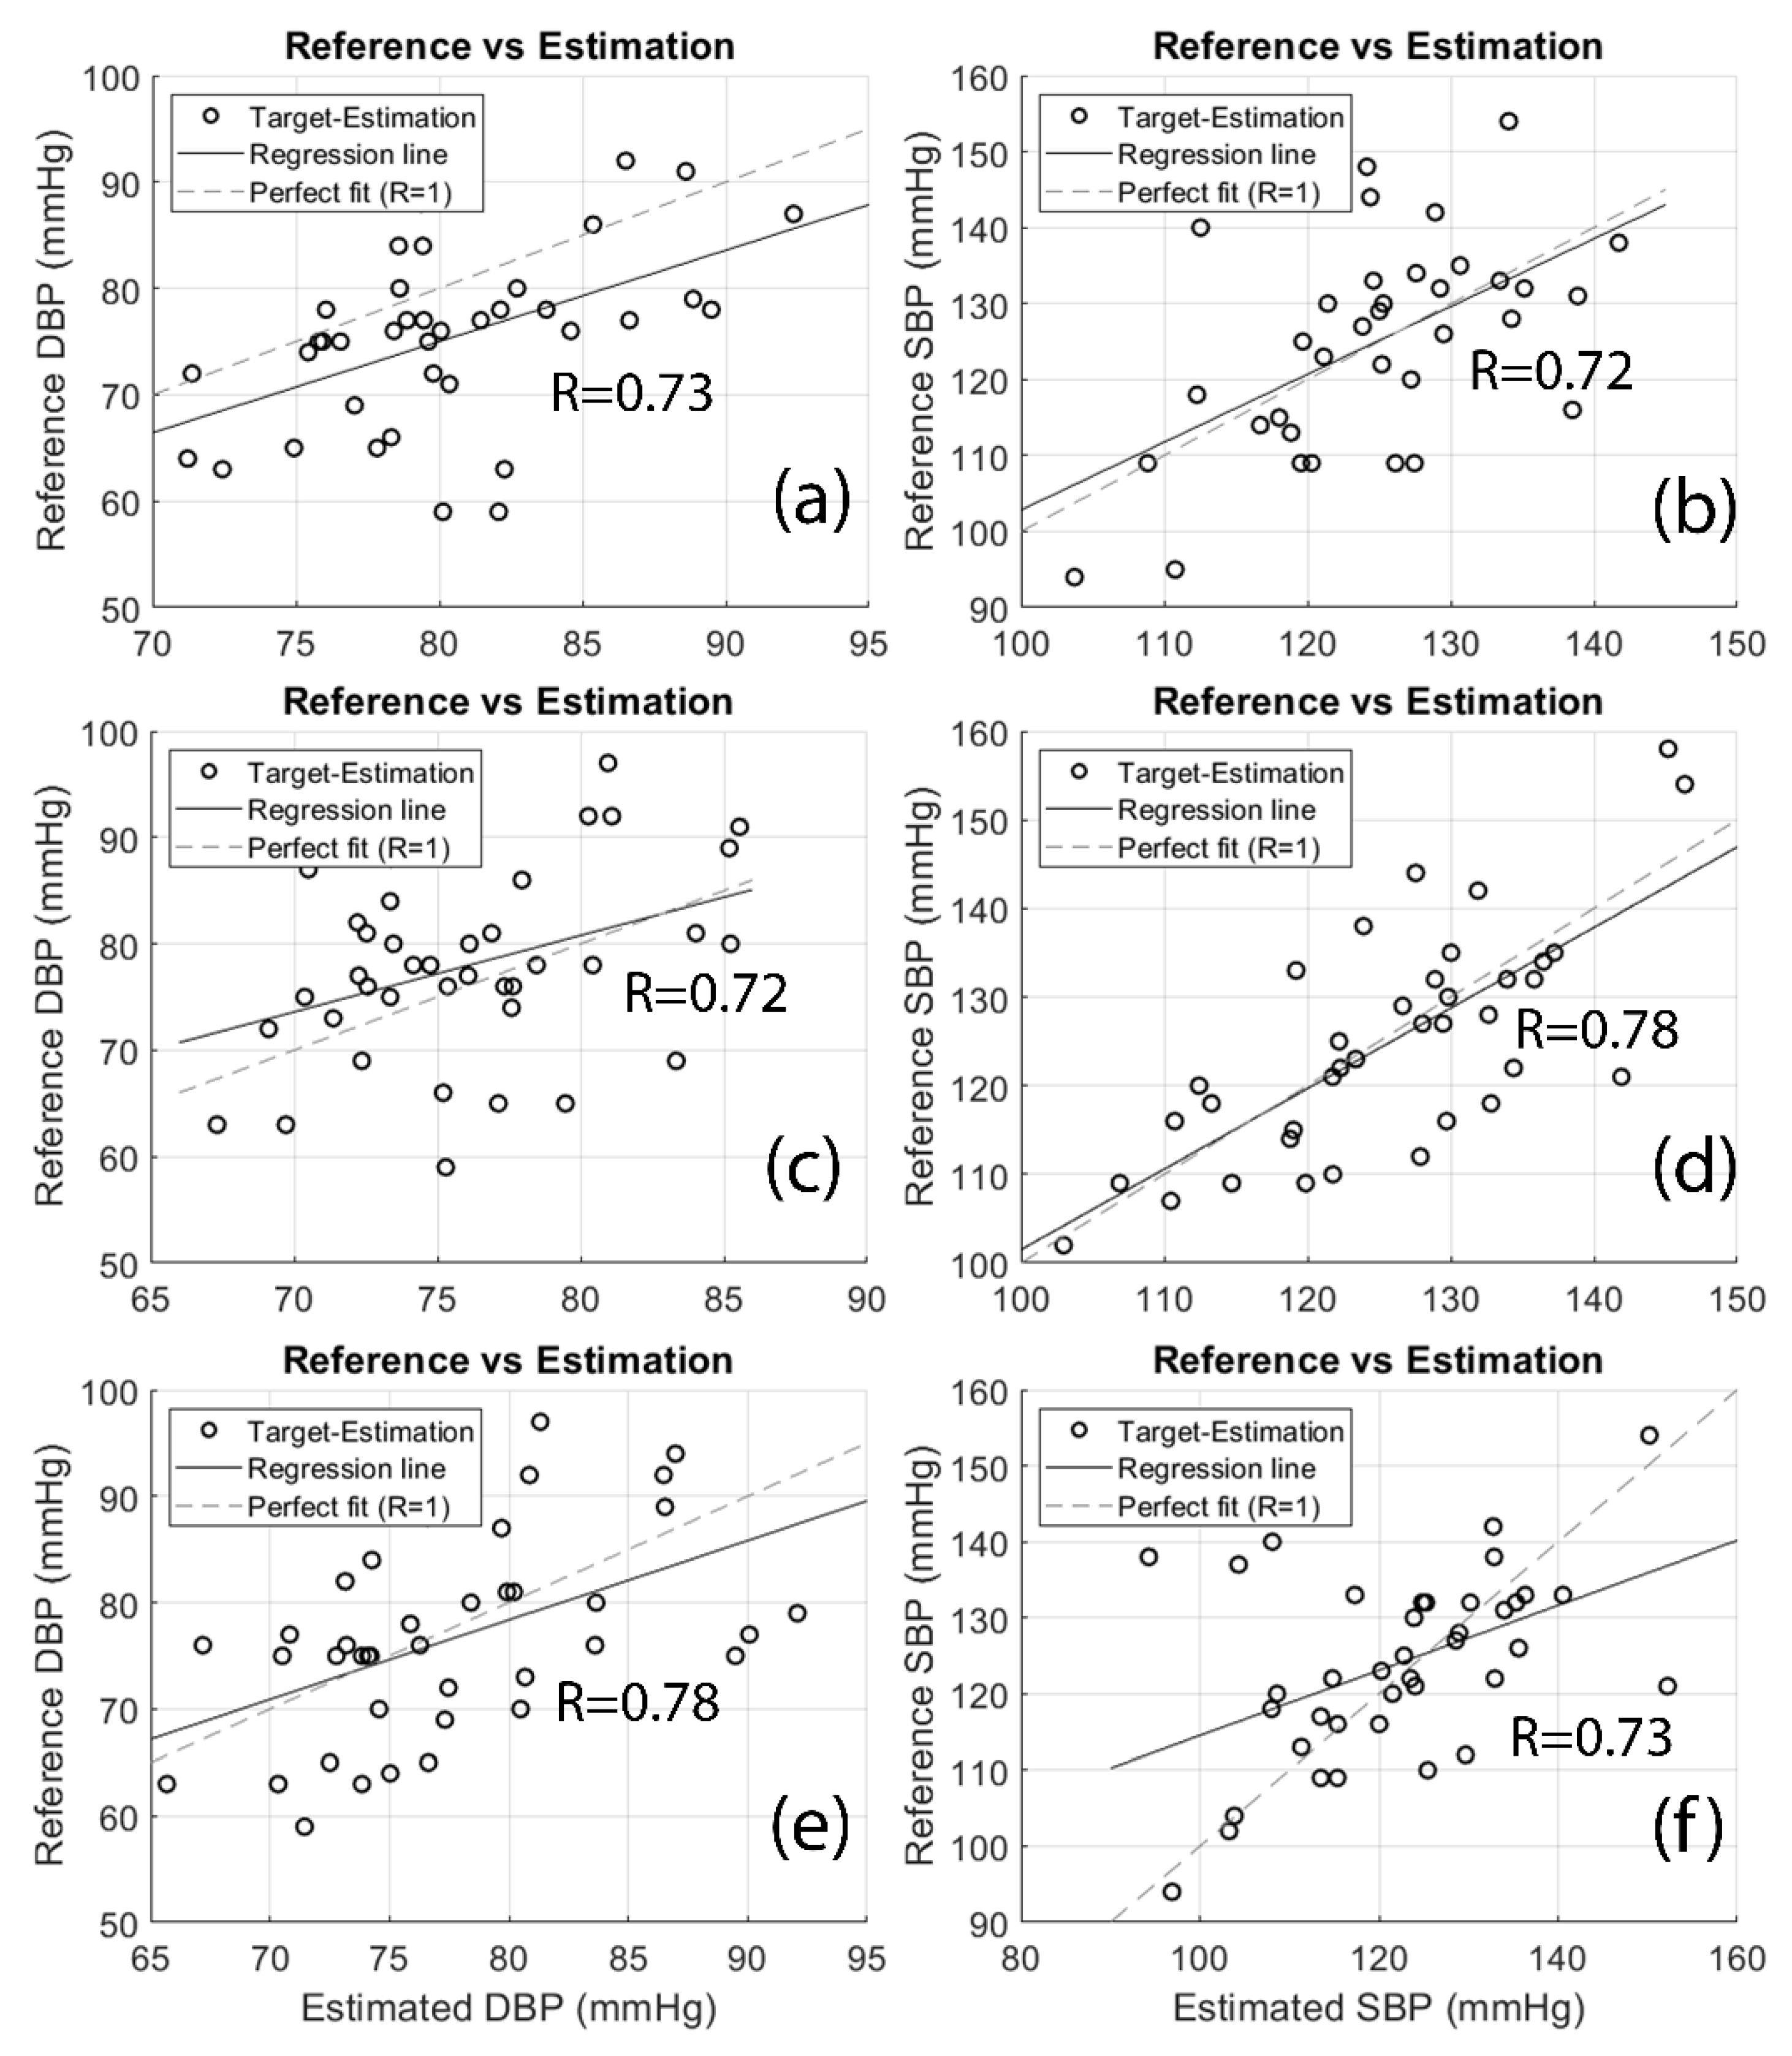
Figure 8.
Bland-Altman plots of BP estimation with the proposed method against the reference: (a) for DBP-finger; (b) SBP-finger; (c) DBP-toe; (d) SBP-toe; (e) DBP-both; (f) SBP-both.
Figure 8.
Bland-Altman plots of BP estimation with the proposed method against the reference: (a) for DBP-finger; (b) SBP-finger; (c) DBP-toe; (d) SBP-toe; (e) DBP-both; (f) SBP-both.
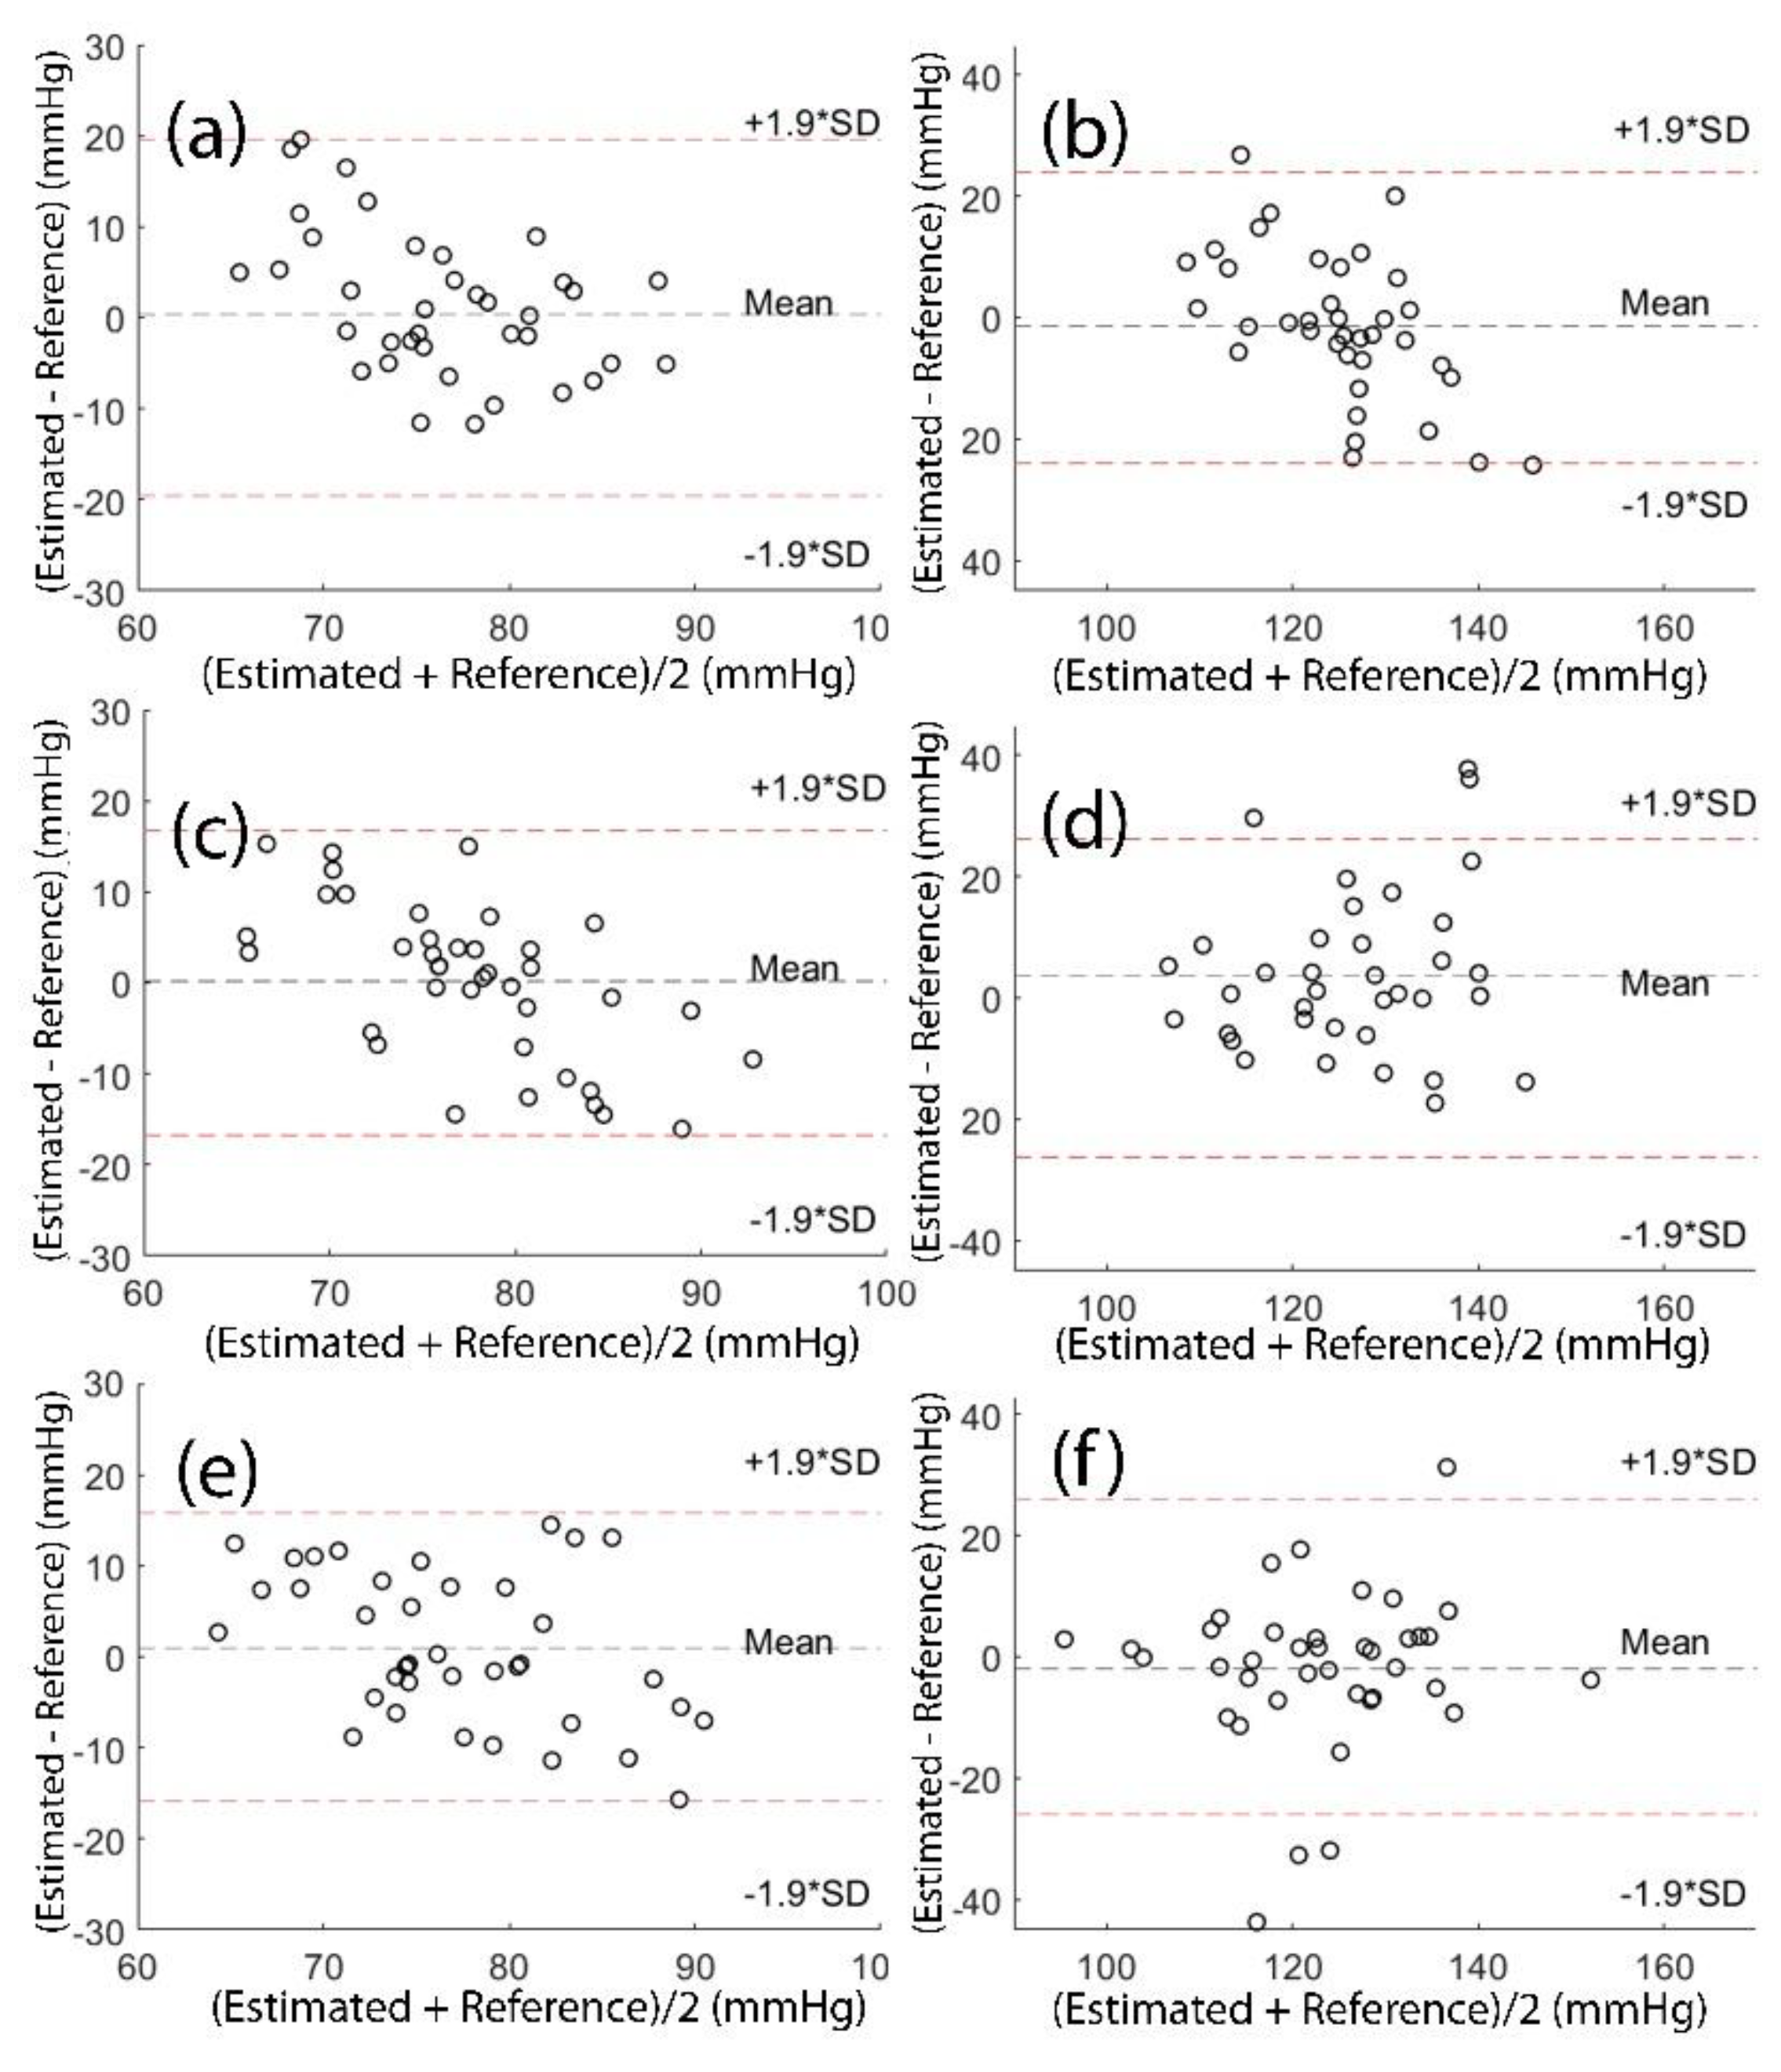
Figure 9.
Histogram of estimation error for: (a) DBP-finger; (b) SBP-finger; (c) DBP-toe; (d) SBP-toe; (e) DBP-both (finger+toe); (f) SBP-both (finger+toe). The distribution curves (in red) are also shown for the histograms.
Figure 9.
Histogram of estimation error for: (a) DBP-finger; (b) SBP-finger; (c) DBP-toe; (d) SBP-toe; (e) DBP-both (finger+toe); (f) SBP-both (finger+toe). The distribution curves (in red) are also shown for the histograms.
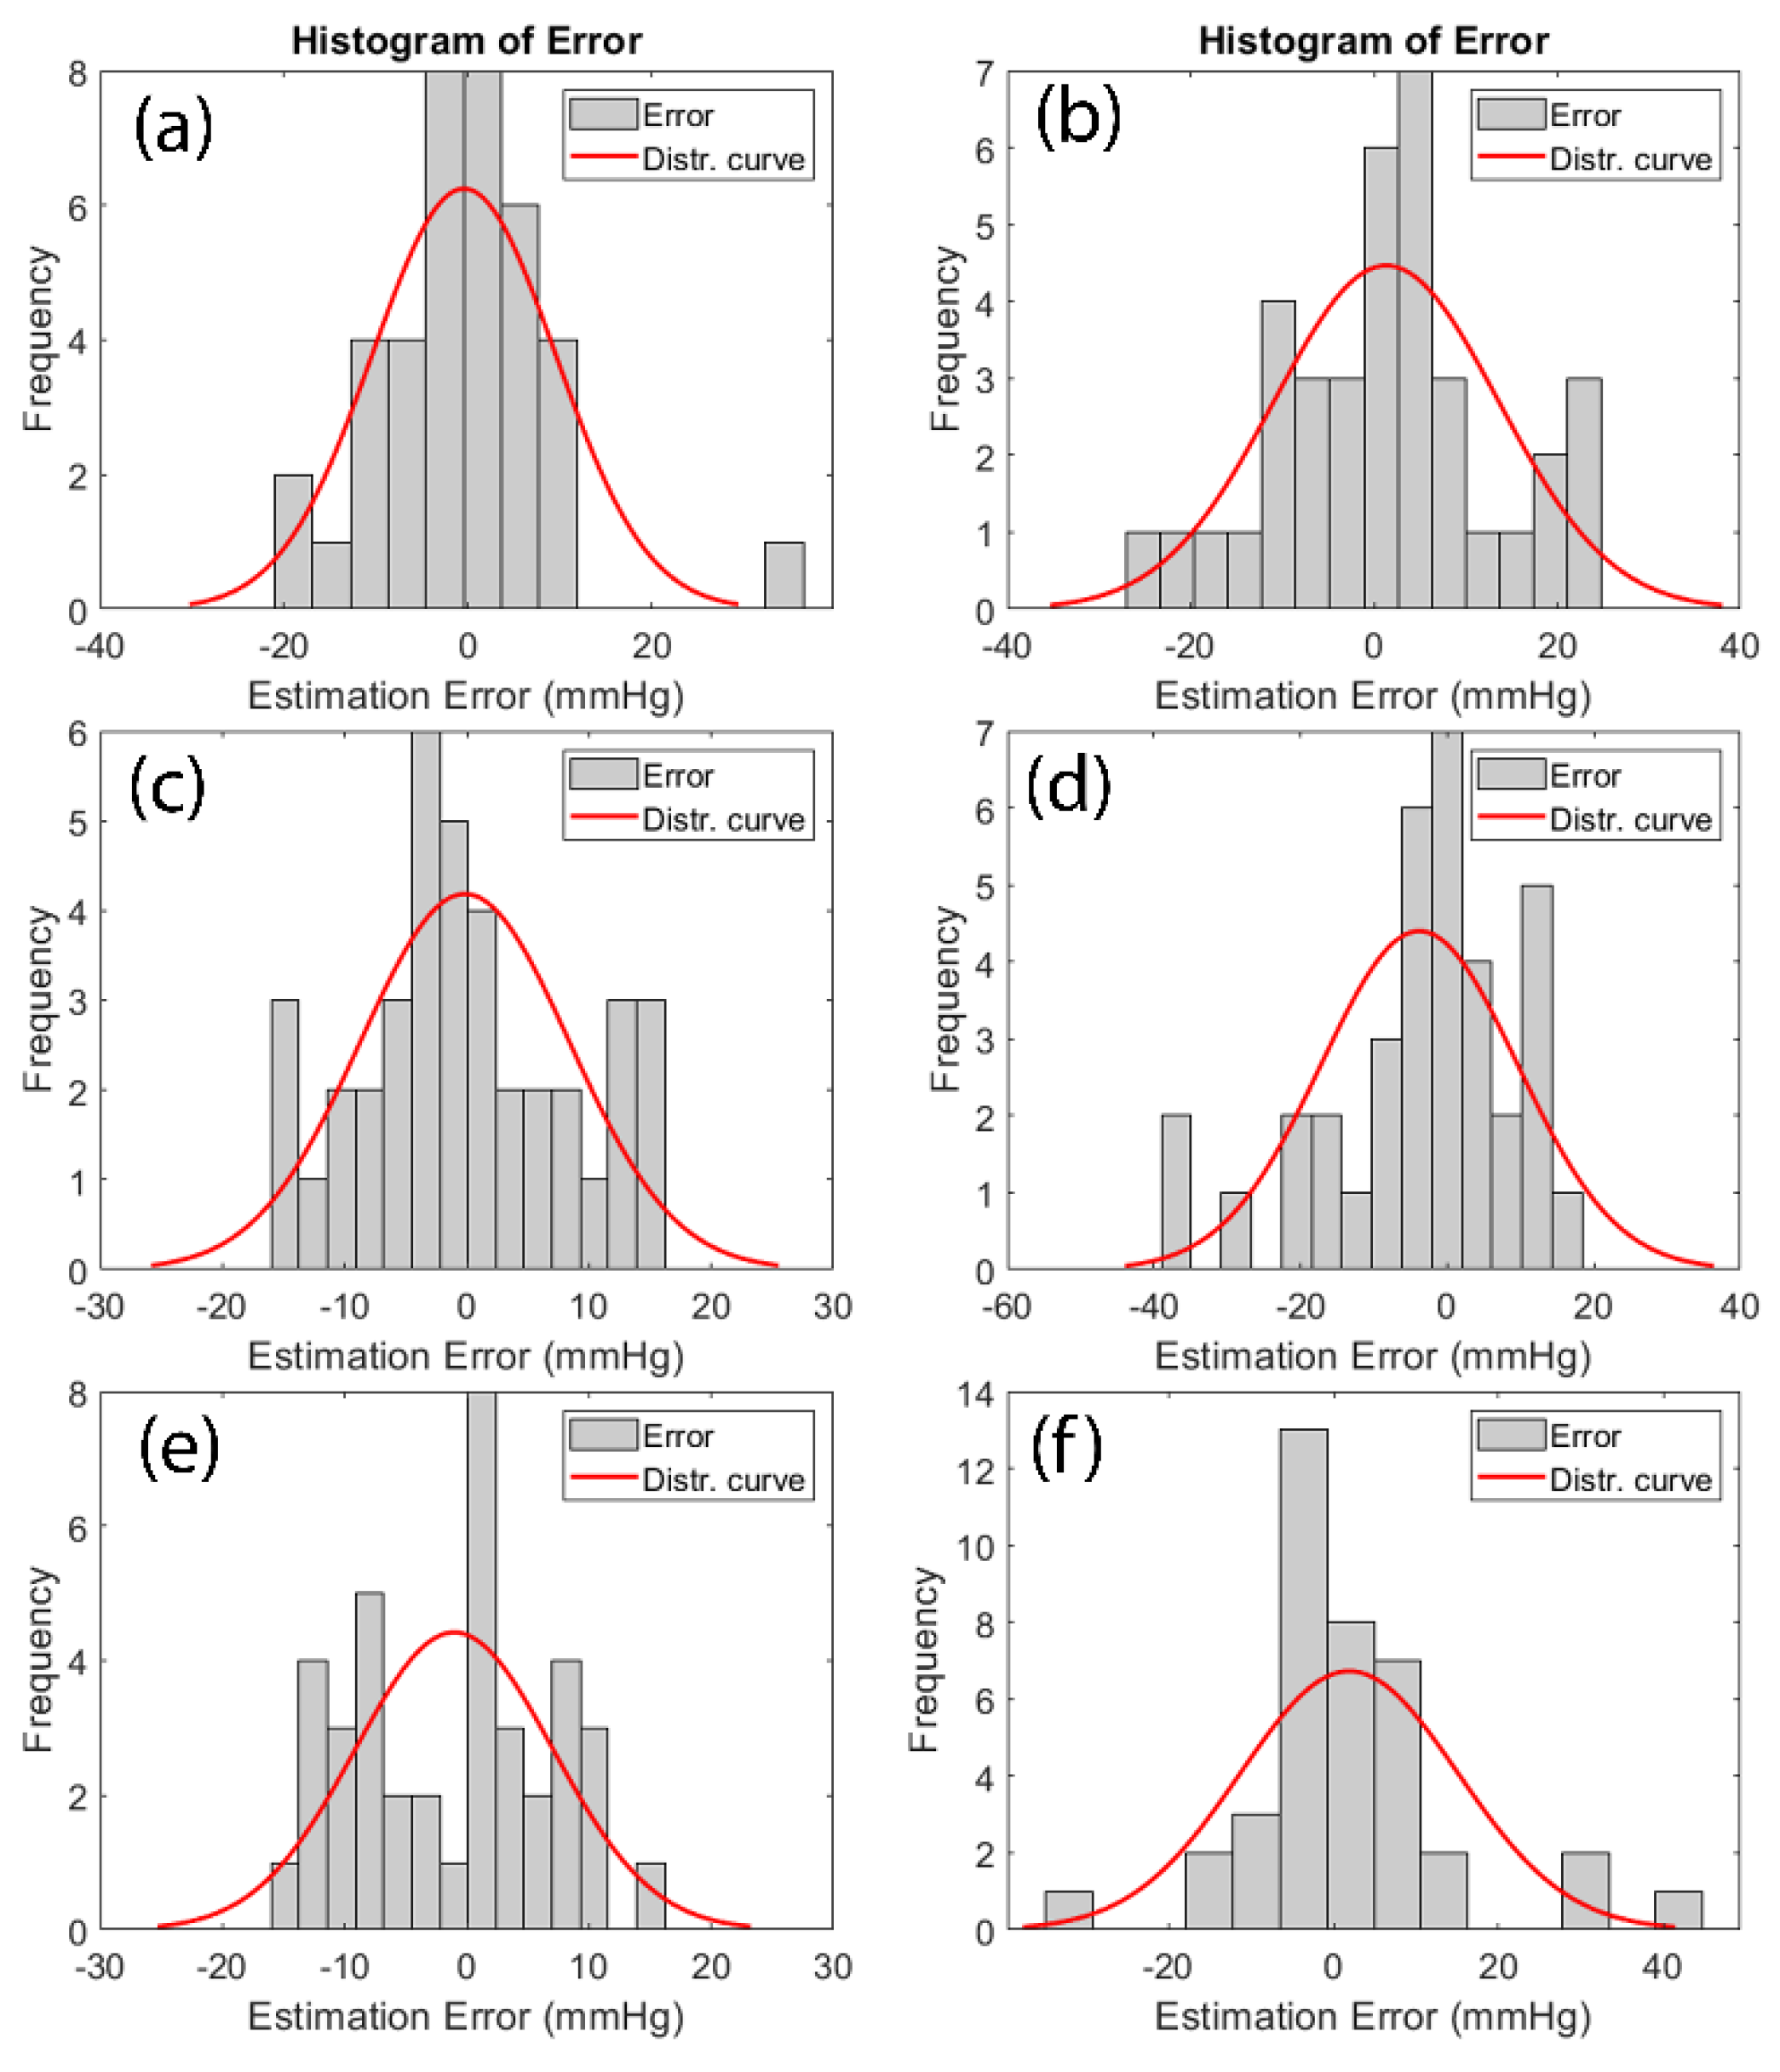

Table 1.
Anthropometric Characteristics of Subjects.
| Parameter | Mean | Standard Deviation |
|---|---|---|
| Age (years) | 25 | 7.9 |
| Height(cm) | 171 | 9.4 |
| Weight (kg) | 75.8 | 18.9 |
| BMI (kg/m2) | 25.8 | 5.7 |
Table 2.
List of Features Used in Analyis.
| Features | Symbol | Mean ± SD | Equation/Definition | Source | |
|---|---|---|---|---|---|
| Finger | Toe | ||||
| Normalized PTT (ms/m) | PTTn | 176.7±15.1 | 232.5±16.7 | ECG, finger and toe PPG | |
| Pulse Acceleration (cm/s2) | ACC | 19.2±3.3 | 11.0±1.6 | ECG, finger and toe PPG | |
| S2/S1 Ratio | S2S1 | 7.8±1.6 | 5.5±0.7 | finger and toe PPG | |
| IPA | IPA | 2.1±0.5 | 0.2±0.1 | finger and toe PPG | |
| LASI (ms) | LASI | 220.6±39.4 | 260.1±56.7 | Sys. to dia. peak latency | finger and toe PPG |
| Heart Rate (beats/min) | HR | 78.6±14.4 | - | ECG | |
| NN (s) | NN | 0.8±0.1 | - | ECG | |
| Weight (kg) | W | 76.2±18.4 | - | Questionnaire | |
| Height (cm) | H | 171.6±9.4 | - | Questionnaire | |
| Body Mass Index (kg/m2) | BMI | 25.8±5.5 | Questionnaire | ||
| Age (years) | AGE | 24.9±7.9 | - | Questionnaire | |
| Ln of Squared PWV | LnPWV2 | 9.2±0.2 | 8.6±0.2 | ECG, finger and toe PPG | |
Table 3.
Features from Toe PPG.
| Toe PPG Features | Coefficient | |
|---|---|---|
| SBP | DBP | |
| Intercept | -322.53 | 56.16 |
| Height | 1.84 | - |
| BMI | 5.44 | - |
| ACCtoe | -28.20 | - |
| ACCtoe×HR | 0.42 | - |
| W2 | -7.9e-3 | - |
| S2S1toe | 6.55 | - |
| (S2S1toe×AGE)2 | - | -128.27 |
| PTTntoe-1 | - | 145.66 |
| PTTntoe2×NN | - | -2.31 |
| 1/(S2S1toe×LnPTTtoe2) | - | -293.12 |
| (LASItoe2)/AGE | - | -1.4e-3 |
| W/(LASItoe2) | - | -622.44 |
Table 4.
Features from Finger PPG.
| Finger PPG Features | Coefficient | |
|---|---|---|
| SBP | DBP | |
| Intercept | -241.15 | 110.20 |
| Height | 0.88 | - |
| BMI | 3.34 | - |
| ACCtoe | -17.67 | - |
| ACCtoe×HR | 0.04 | - |
| W2 | 5.1e-3 | - |
| S2S1toe | -0.40 | - |
| (S2S1toe×AGE)2 | - | -93.01 |
| PTTntoe | - | 17.77 |
| PTTntoe×NN | - | -0.20 |
| LnPWV2 | 20.61 | - |
Table 5.
Features from Combined (Finger +Toe) PPG.
| Combined PPG Features | Coefficient | |
|---|---|---|
| SBP | DBP | |
| Intercept | -973.61 | 132.06 |
| Height | -0.27 | - |
| BMI | 4.95 | - |
| ACCfinger | -66.27 | - |
| ACCtoe | 24.09 | - |
| ACCtoe+×HR | 1.1e-3 | - |
| Weight2 | -7.4e-3 | - |
| S2S1toe | 7.37 | - |
| (S2S1toe/AGE)2 | - | -4.52 |
| (LnPTTtoe)2/LnPTTfinger | - | 10.08 |
| LnPTTfinger / (LnPTTtoe)2 | - | -7.89 |
| (PTTntoe)2×NN | - | -2.71 |
| 1/( LnPTTtoe2×S2S1toe) | - | -211.40 |
| (LASIfinger)2/AGE | - | -2.9e-3 |
| W/(LASIfinger)2 | - | 1.3e3 |
| LnPWV2finger | 122.38 | - |
Table 6.
Comparison of the mean and standard deviation of estimation error between two subject independent studies and our method, where: .
Table 6.
Comparison of the mean and standard deviation of estimation error between two subject independent studies and our method, where: .
| Study | Signal | Method | SBP MAE±SDE | DBP MAE±SDE |
|---|---|---|---|---|
| Calibration-free Method#1 [19] |
ECG and finger PPG |
RLRLF | 14.73 ± 18.5 | 7.24 ± 9.2 |
| RLRPF | 14.46 ± 18.2 | 7.42 ± 10.0 | ||
| ANN | 13.78 ± 17.5 | 6.86 ± 9.0 | ||
| SVM | 12.38 ± 16.2 | 6.34 ± 8.4 | ||
| Calibration-free Method#2 [17] |
ECG and finger PPG |
Linear regression | 14.71 ± 10.8 | 6.74 ± 6.1 |
| Decision tree | 16.28 ± 16.3 | 7.75 ± 8.5 | ||
| SVM | 12.26 ± 10.3 | 5.91 ± 5.8 | ||
| AdaBoost | 11.17 ± 10.1 | 5.35 ± 6.1 | ||
| Our study | ECG, finger PPG, and toe PPG |
MRfinger | 10.28 ± 13.31 | 7.08± 9.18 |
| MRtoe | 9.70 ±12.62 | 6.93± 8.84 | ||
| MRboth | 9.63 ± 12.54 | 6.76 ± 8.38 |
Disclaimer/Publisher’s Note: The statements, opinions and data contained in all publications are solely those of the individual author(s) and contributor(s) and not of MDPI and/or the editor(s). MDPI and/or the editor(s) disclaim responsibility for any injury to people or property resulting from any ideas, methods, instructions or products referred to in the content. |
© 2025 by the authors. Licensee MDPI, Basel, Switzerland. This article is an open access article distributed under the terms and conditions of the Creative Commons Attribution (CC BY) license (http://creativecommons.org/licenses/by/4.0/).
Copyright: This open access article is published under a Creative Commons CC BY 4.0 license, which permit the free download, distribution, and reuse, provided that the author and preprint are cited in any reuse.


