
Submitted:
17 June 2025
Posted:
18 June 2025
You are already at the latest version
Abstract
Traditional cuff-based blood pressure (BP) monitoring methods provide only intermittent readings, while invasive alternatives pose clinical risks. Recent studies have demonstrated feasibility of estimating continuous non-invasive cuff-less BP using photoplethysmogram (PPG) signals alone. However, existing approaches rely on complex manual feature engineering and/or multiple model architectures, resulting in inefficient epoch training numbers and limited performance. This research proposes cBP-Tnet, an efficient single channel and model Multitask Transformer Network designed for PPG signal automatic feature extraction. cBP-Tnet employed specialized hyperparameters — integrating adaptive Kalman filtering, outlier elimination, signal synchronization, and data augmentation, leveraging multi-head self-attention and multi-task learning strategies to identify subtle and shared waveform patterns associated with systolic blood pressure (SBP) and diastolic blood pressure (DBP). We used MIMIC-II public dataset (500 patients with 202,956 samples) for experimentations. Results achieved mean absolute errors of 4.32 mmHg for SBP and 2.18 mmHg for DBP. For first time, both SBP and DBP meet the Association for the Advancement of Medical Instrumentation’s international standard (< 5 mmHg, >85 subjects). Furthermore, it efficiently cuts epochs’ training number by 13.67% when compared to recent deep learning method. Thus, establishes cBP-Tnet’s higher potential for integration into wearable and home-based healthcare devices with continuous non-invasive cuff-less blood pressure monitoring.
Keywords:
non-invasive continuous cuffless blood pressure estimation
; photoplethysmogram
; multitask learning transformer
; automatic PPG feature extraction
; deep learning
1. Introduction
High blood pressure (hypertension) is a prominent cause of death and disability worldwide. Between 1990 and 2019, the number of people with hypertension (blood pressure of systolic or diastolic) or on medication increased from 650 million to 1.3 billion. [1]. Unfortunately, most hypertensive patients are unaware of their ailment, although it silently affects their internal body organs (e.g., brain, eyes, kidneys, and viscus), which is why it is known the silent killer [2]. Therefore, accurate, continuous, beat-to-beat, blood pressure estimation is crucial for preventing heart disease and improving human health.
Traditional blood pressure estimation methods were cuff-based readings and continuous monitoring. But, cuff-based measures can be heavily influenced by aspect such as operator skill, cuff size, measuring setup and going thru to large mistakes [3]. Furthermore, this process only provides a single moment of blood pressure, making it not ideal to trace blood pressure fluctuations over time. Blood pressure (BP) can fluctuate significantly over time due to various factors such as diet, exercise, mental state, and stress [4]. Continuous blood pressure monitoring, on the other hand, allows for a higher accurate estimation of a patient’s blood pressure state, comprising nightly blood pressure changes and variations during exercise. This approach allows doctors to more correctly assess patients’ problems and offer more personalized treatment solutions. It makes the early discovery of BP changes and the application of suitable method to limit the continuation of hypertension. This is particularly crucial for preventing cardiovascular and cerebrovascular events, as well as lowering disease risks [5]. Nonetheless, current continuous blood pressure monitoring techniques usually require intrusive devices such as intravascular catheters, that are prone to infections, difficult to handle and other complications [6]. Traditional blood pressure measuring techniques have limits in practical applications, necessitating a non-invasive, continuous, and accurate method.
More researchers are looking into continuous blood pressure estimate techniques based on biosignals like photoplethysmograms (PPG), electrocardiograms (ECGs), and ballistocardiograms (BCGs) as a result of recent developments in sensor technology, computer science, and artificial intelligence. Compared to traditional blood pressure measurement techniques, these unique systems that use Pulse Transit Time (PTT), Pulse Wave Velocity (PWV), and other manual feature extraction techniques offer various benefits, including non-invasiveness, real-time continuous monitoring, and user-friendliness [7,8,9]. Many substantial gains have been produced in studies focusing on estimating approaches that combine ECG and PPG data, demonstrating remarkable precision in blood pressure measurements [10]. However, there are certain drawbacks to monitoring ECG signals. Prolonged usage of patch electrodes on the skin can limit airflow and cause pain for users [11]. Moreover, blood pressure measurement systems that rely on various biological signals, including PPG, BCG, ECG and other signals, have challenges with data synchronization, information fusion, complex implementation, increased development costs, and limited noise resistance [12]. In comparison, because the PPG waveform is normally recorded in the fingers, it gives a better consistent estimation value than multiple channel signal gathering, making it ideal for long blood pressure estimation trials. Although systems based solely on a single PPG signal provided a more straightforward method by avoiding the intricacies and problems linked with several sensors, machine learning and some deep learning methods relied on a sophisticated manual feature extraction [13,14] that requires professional knowledge and experience. Necessitating a fully automatic PPG feature extraction using deep learning methods to further simplify the data collection/processing procedure. Finally, breaking free and eliminate the need for complex expert domain knowledge manual feature extraction methods [5,15,16].
This research describes a unique approach for continuous blood pressure measurement using an efficient single-model cBP-Tnet Multitask Learning Transformer Network with automated Photoplethysmogram (PPG) feature extraction. cBP-Tnet enhances the accuracy and robustness of non-invasive continuous blood pressure estimate using the large-scale Multiparameter Intelligent Monitoring in Intensive Care II (MIMIC-II) public datasets [17,18]. The proposed cBP-Tnet method for cuffless estimation of blood pressure has the potential to be integrated and enable non-invasive continuous monitoring by home and mobile health-care devices. The key contributions of this work are summarized below:
- 1.
- To date, cBP-Tnet was the only deep learning method with automatic photoplethysmogram feature extraction to have both Systolic (4.32 mmHg) and Diastolic (2.18 mmHg) blood pressure acceptable to the Association for the Advancement of Medical Instrumentation (AAMI) international standards (<5 mmHg, >85 subjects) [19].
- 2.
- 3.
- The cBP-Tnet method efficiently takes 13.67% faster to train and still output better and AAMI accepted results compared to recent studies [5] in the field.
The rest of this work is organized as follows: Section 2 addressed the current AI methods for continuous non-invasive blood pressure measurement with a single-channel photoplethysmogram (PPG). Section 3 covered the pipeline and the suggested cBP-Tnet single channel and model deep learning architecture for blood pressure estimation. Section 4 presents the experimental findings, compares them to the AAMI international standards and other recent publications, and Section 5 concludes the research.
2. Related Works
Existing AI methods for continuous cuff-less non-invasive blood pressure measurement with a single-channel photoplethysmogram (PPG) are divided into two types: classical machine and deep learning methods. Classical machine learning approaches include manually identifying features from raw PPG data and then developing a regression algorithm using classical machine learning models to measure diastolic and systolic blood pressure in people [14]. As an example, one of the initial trials at BP measuremenr using PPG signal only was undertaken by Teng et al. in 2003 [20] wherein they investigated the association between Arterial Blood Pressure (ABP) and specific PPG waveform characteristics. Data was obtained from 15 healthy and young subjects utilizing specialized equipment in a well-controlled atmosphere with no movement, complete silence, and constant temperature. Correlation analysis was utilized for feature selection, and the relationship was modelled with a linear regression approach. In another work, Kurylyak et al. in 2013 [21] retrieved 21 factors from above 15,000 cardiac training samples in the MIMIC database. These characteristics were used as input features ANN that estimated blood pressure with PPG data. This strategy proves to be better than the linear regression technique. Liu et al. in 2017 [22] used 14 features from the 2nd derivative of PPG (SDPPG) and blended them with the 21 features from [21]. To better forecast systolic and diastolic blood pressure, they used a SVM as a BP estimator. Compared to [21] 21 characteristics and ANN, their strategy improved BP estimation accuracy by 40%. The need for superior PPG waveform to reliably detect PPG waveform feature points is a fundamental issue for systems that combine manual features with classical machine learning for blood pressure calculation. But, PPG waveform captured by wearable devices frequently contain high motion aberrations and noise, making it hard to detect crucial feature points such as troughs, inflection points, peaks and dicrotic notches. As a result, the series of features formed by arranging these feature points has significant errors. Furthermore, generating and selecting manual features necessitates professional expertise and experience, as well as multiple efforts to identify the ideal feature set, which limits practical applications.
With the improvement of processing capacity, we have switched our focus to automated feature extraction methodologies for PPG waveform utilizing deep learning models [14]. Deep learning models, unlike classical machine learning models, is great at learning features exactly from original data, removing the requirement for manual feature engineering and capitalizing on the latent data contained in original signals. Slapnicar et al. in 2019 [15] proposed Residual Neural Network (ResNet) Model that used recurrent (RNN) and convolutional neural networks (CNN) to interpret PPG signals’ frequency and time domain details, then combined the recovered characteristics to estimate SBP and DBP. Their analyses of 510 participants from the MIMIC III database yielded MAE of 6.88 mmHg and 9.43 mmHg for DBP and SBP measurements, respectively. However, their ResNet model needs very long training of 10,000 epochs which is prone to overfitting. Additionally, both DBP and SBP failed to meet the accuracy requirements outlined by the AAMI international standard that MAE must be less than 5 mmHg [19]. In another study, Rong et al. in 2021 [16] introduced a multi-type features fusion (MTFF) neural network model for blood pressure (BP) estimation using PPG only. The model consists of two CNN that train the morphological and frequency spectrum aspects of the PPG signal, as well as a Bidirectional Long Short-Term Memory (BiLSTM) network that trains the temporal features of the PPG signal. The MAE of the MTFF-ANN were 5.59 mmHg for SBP and 3.36 mmHg for DBP. But, MTFF-ANN have a complex feature extraction process, low sample size of only 11,546 sample which was not enough for deep learning methodologies, thus, it cannot be generalized. Furthermore, DBP failed to meet the accuracy requirements outlined by the AAMI international standard. Recently, Dai et al. in 2024 [5], proposed a continuous blood pressure estimation model that joins the convolutional block attention module (CBAM) plus temporal convolutional network (TCN). The MAE of SBP and DBP estimation using their TCN-CBAM algorithm are 5.35 mmHg and 2.12 mmHg, respectively, which outperform previous deep learning architecture with convolutional and recurrent neural network architectures. However, TCN-CBAM still needs long training of 1,500 epochs but it becomes more efficient compared to [15]. It also has complex/hybrid deep learning architecture that uses two (2) models. In addition, the DBP still failed to meet the accuracy requirements outlined by the AAMI international standard.
Thus, none of the tested performance of three current deep learning models—ResNet, MTFF-ANN, and TCN-CBAM with automatic feature extraction using PPG signal—met the both SBP and DBP blood pressure estimation accuracy criteria defined by the AAMI international standard [19]. Moreover, previous studies utilized complex automatic feature extraction [16], hybrid models [5], and long training times [15] that limits the developed AI models potential to be integrated and enable non-invasive continuous monitoring by home and mobile health-care devices.
3. Materials and Methods
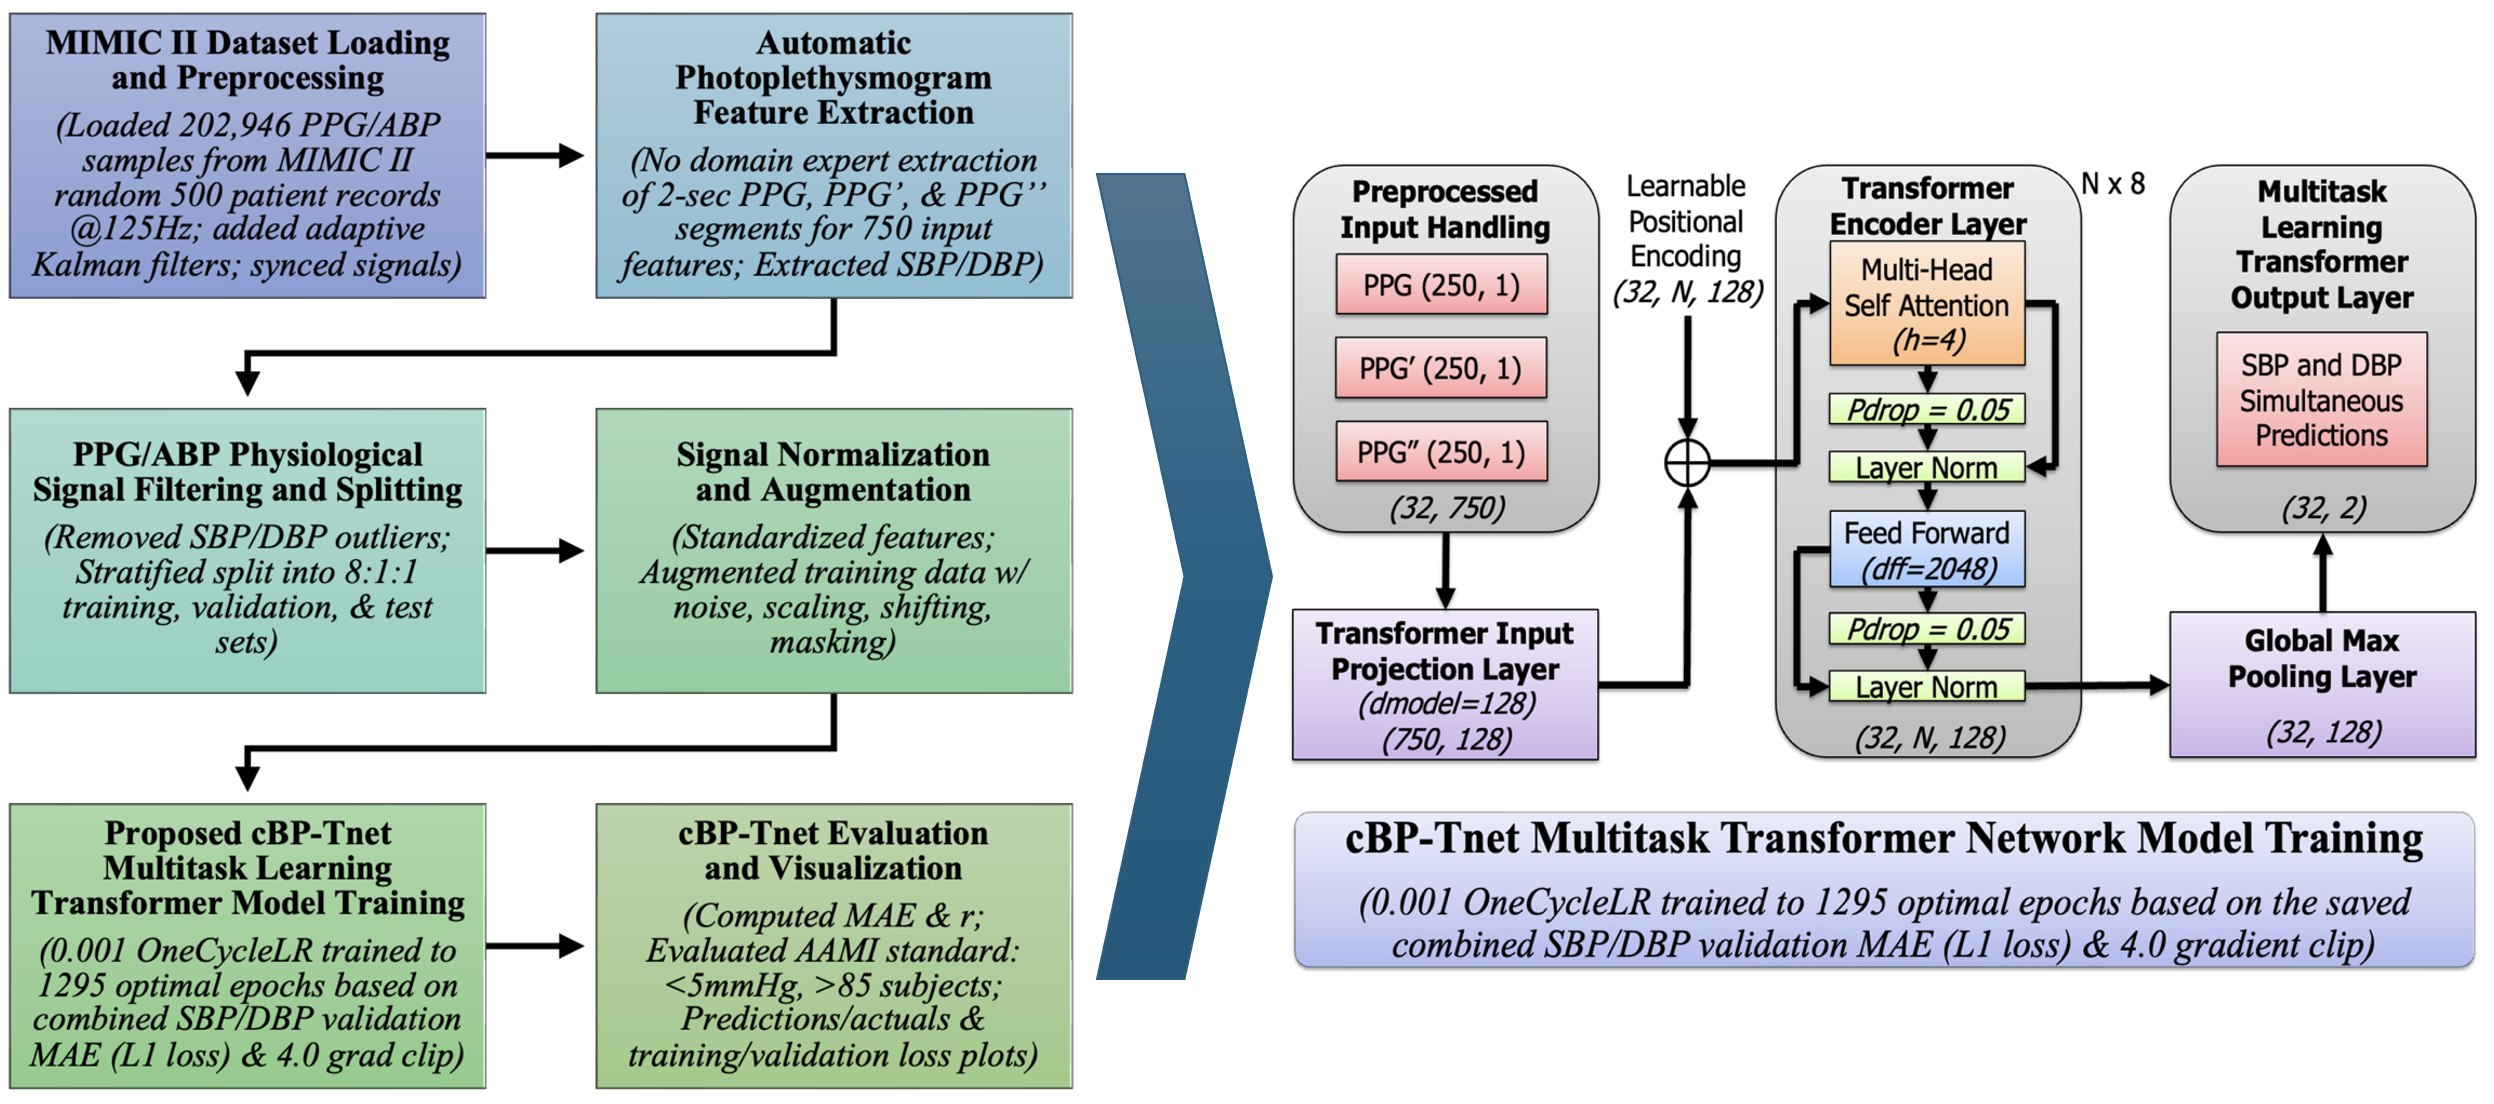
The cBP-Tnet pipeline as shown in Figure 1 employs a multitask learning Transformer-based architecture for continuous non-invasive blood pressure estimation. Transformers, which were originally developed for natural language processing, have proven useful for a variety of sequence modeling challenges due to their ability to capture long-range relationships through self-attention techniques [23]. In this research, the input sequences are derived from physiological signal – Photoplethysmogram (PPG). In classical machine learning contexts, a model is typically trained to perform a single predicted job. For example, you may use a regression model to estimate only SBP without DBP and vice versa However, blood pressure measurement tasks frequently require closely related physiological signals. Systolic (SBP) and diastolic (DBP) blood pressures are not independent; they result from the same underlying circulatory dynamics. Multi-task learning (MTL) takes advantage of this relatedness [24]. By training a single model to predict both SBP and DBP simultaneously, the researchers hope to improve model generalization by sharing representations and constraints between task. Moreover, reducing the requirement for individual models. Potentially increasing estimation accuracy for both SBP and DBP. cBP-Tnet further uses adaptive Kalman filters to preprocess 202,956 synchronized PPG/ABP samples from random 500 subjects from Multi-parameter Intelligent Monitoring in Intensive Care II (MIMIC II) database [25], and it automatically extracts features from raw and derived PPG signals (PPG’ and PPG’’), reducing the need for manual feature engineering. Outliers were removed, and the data was stratified for training (80%), validation (10%), and testing (10%). Signal augmentation and normalization improve robustness, while the multitask learning Transformer model incorporates temporal relationships to predict both systolic and diastolic blood pressure simultaneously.
The pipeline was tested against international clinical benchmark – Advancement of Medical Instrumentation (AAMI) standards (<5 mmHg, >85 subjects), confirming accurate, real-time, non-invasive blood pressure measurement and its potential to be integrated/enable non-invasive continuous monitoring by home and mobile health-care devices.
3.1. MIMIC II Dataset Loading and Preprocessing
The Physionet Multi-parameter Intelligent Monitoring in Intensive Care (MIMIC) II Waveform database [25] contains recordings of numerous physiological signals and parameters from ICU patients. The information was gathered from Boston’s Beth Israel Deaconess Medical Center (BIDMC) over a seven-year period beginning in 2001. MIMIC II version 2.6 had roughly 33,000 patients, with 25,000 adults (age at time of last hospitalization) and 8000 newborns (age at time of initial admission) [26]. The researchers experimented on the subset of Kachuee et al.’s MIMIC II-derived cleaned cuffless Blood Pressure Estimation Data Set [18]. From cleaned dataset, the researchers loaded 202,946 PPG/ABP samples from random 500 patient records at 125 Hz. Before training the multitask Transformer, the raw signals (PPG and ABP) are filtered with an adaptive Kalman filter [27] to decrease noise and then aligned in time using cross-correlation algorithms. These preprocessing stages produce cleaner, more aligned inputs, allowing the multitask Transformer to focus on relevant patterns rather than being confused by noise or misalignment. Since PPG and ABP signals may not be perfectly aligned in time, cross-correlation was used to determine the lag between them. We synchronized signals for model training since the model attempts to map the noninvasive PPG to a continuous estimation of BP that resembles the ABP waveform [14].
3.2. Automatic Photoplethysmogram Feature Extraction
The cBP-Tnet automatically extracts 2-sec features from raw and derived PPG signals, including its first and second derivatives (PPG′ and PPG″). The derivatives of the PPG signal also highlight biologically significant alterations (e.g., systolic and diastolic peaks), which are closely linked with SBP and DBP. First and second derivatives emphasize slope changes and points of inflections which are empirically proven effective to improve the models performance [5,15]. This reduces the need for handmade feature engineering, which was time-consuming and restricted to specific use cases [5,15,16]. Instead, the model learns directly from minimally processed inputs, drawing on multitask learning Transformer networks’ data-driven capabilities,
The combination of [PPG, PPG’, PPG”] generates a rich feature space that captures waveform morphology. That is, a segment of PPG signal (and its derivatives) were truncated or zero-padded to a fixed length L [28] for uniformity in 2-sec interval @125 Hz (250 samples each),
After synchronization, the segments have a total of 750 input features since raw PPG, PPG’ and PPG’’ were sampled at 125Hz. Simultaneously, extracting the SBP and DBP from ABP. By automatically extracting essential features directly from the PPG signal, the model minimizes domain-specific bias and assures scalability over a wide range of patient populations and situations.
3.3. PPG/ABP Data Filtering and Splitting
To provide robustness, the physiological signals were filtered and separated. Outlier elimination protects the model from being impacted by very high and atypical SBP/DBP values (SBP ≥ 180, SBP < 80, DBP ≥ 130, DBP ≤ 60) [13]. After data filtering, to preserve the distribution of physiological targets of systolic (SBP) and diastolic (DBP) blood pressures throughout all subsets, the dataset is stratified (8:1:1 ratio) into training (97,761), validation (12,220), and test sets (12,221). Because SBP and DBP are continuous variables, a common strategy is to bin (N=10) them into discrete categories before stratification. This limits the possibility of overfitting and guarantees a fair and thorough performance evaluation. A stratified splitting method (scikit-learn’s train_test_split with the stratify option, N=10) splits the dataset into training, validation, and test sets, each with similar SBP and DBP distributions [29]. This technique assures that model evaluation represents real-world clinical situations and that performance indicators are not distorted by disproportionate representation of specific blood pressure ranges,
3.4. Signal Normalization and Augmentation
Signal normalization and augmentation are important processes in the cBP-Tnet pipeline. Normalization assigns a consistent scale to all raw 750 input PPG features. Normalizing guarantees that the model does not get biased toward any particular amplitude range, allowing the model to learn patterns rather than exact values. Subsequent data standardization of input features is performed. Because physiological data is frequently limited, several augmentation approaches are used to improve model resilience. By incorporating modifications like noise addition, scaling, shifting, and masking, the model learns to be insensitive to tiny changes in signal amplitude, baseline shifts, and temporal distortions [30]. These strategies simulate real-world variability, such as sensor placement and patient situations, hence improving model robustness.
3.5. Proposed cBP-Tnet Multitask Transformer Model Training
The pipeline’s main component is the proposed cBP-Tnet model, a single channel and model deep learning architecture that makes use of multitask learning Transformer network. Figure 2 below displays a high-level architectural and training overview of a multitask Transformer-based neural network called cBP-Tnet was efficiently designed to predict blood pressure metrics using photoplethysmography (PPG) data with automatic feature extraction. Transformers excel at processing sequential data because of their self-attention processes, which allow the model to dynamically weigh different parts of the input signals [23]. This can help catch tiny waveform patterns associated with blood pressure variations. The multitask configuration (predicting both SBP and DBP) increases overall model performance. By learning both tasks concurrently, the model benefitted from shared underlying representations in the PPG waveform, resulting in better generalization.
The training procedure contains advanced approaches such as OneCycleLR learning rate scheduling that starts with 0.001, which stabilizes and accelerates convergence [31], designed to save the best model based on the best combined validation L1 loss to prevent overfitting [14]. The model was trained across optimal 1295 epochs with a combined SBP and DBP loss function L1 loss, providing task balance and smooth gradient updates with 4.0 grad clip value [32]. The optimal 1295 epochs was found while training the model for 1500 epochs (1500 epochs was the epoch used by the latest previous research, TCN-CBAM method [5]). We coded cBP-Tnet to store the best model and output the optimal model after training for 1500 epochs. Nonetheless, 1295 epochs found is still 13.67% faster than the latest deep learning method in the field, TCN-CBAM method [5], computed based percent change formula. To solve the percent change when transitioning from TCN-CBAM (previous value of 1500 epochs) to cBP-Tnet (new value of 1295 epochs), we defined the old value as and the new value as and used the percent change standard formula. On the left, the model starts with preprocessed input data streams that comprised not just the raw PPG waveform but also its first and second derivatives. These three inputs, each with a 2-sec duration of 250 samples at 125 Hz, were combined to generate a concatenated input dimension of (32,750), for a batch size of 32 instances, each with 750 features from the three PPG-related signals. This preprocessing step was intended to capture both the core form of the PPG pulse wave and the subtle inflections shown by its derivatives. The input data were then projected into a compact, learnt feature space using a linear projection layer, which converts the raw signals into a 128-dimensional embedding.
3.5.1. Input Projection and Positional Encoding
Given an input sequence of features , where N is the sequence length (250 PPG samples) and is the concatenated feature dimension .
here, projects the input to the model dimension (). The output shape was . A learnable positional encoding is added to inject sequence ordering because Transformers are inherently order-agnostic [23]:
The learnable positional encoding output shape was (32, N, 128). This enables the model to distinguish the temporal order of samples which is crucial for time-series data in the study.This stage is crucial because it converts the raw physiological waveforms into a representation that is better suited to the Transformer’s self-attention processes. The next essential activities that take place in the multitask Transformer Encoder Layer was when a multi-head self-attention module (with 4 heads) and a feed-forward network (with a large inner dimension of 2048) collaborate to simulate the PPG signal’s complicated temporal dependencies and non-linear interactions.
3.5.2. Multi-Head Scaled Dot-Product Attention
Each multitask Transformer layer uses multi-head self-attention (). For each attention head h, the input (from the previous layer or the input projection for the first layer) is linearly projected into queries (), keys (), and values ():
where and . The scaled dot-product attention for one head is computed as:
For heads, multi-head attention is:
where denotes concatenation and [23]. This attention technique enables the model to pay to several parts of the input at the same time.
3.5.3. Residual Connections and Layer Normalization
To aid training and stabilize gradients, each sub-layer is wrapped with residual (skip) connections and layer normalization (LN):
This ensures that the model learns more successfully by avoiding vanishing and exploding gradients. The dropout rate () and the existence of layer normalization stabilize training and prevent overfitting.
3.5.4. Position-wise Feed-Forward Network (FFN)
Each multitask Transformer encoder layer has the same feed-forward network () applied to each position in the sequence. Given the input :
where and . Now, is typically larger than to allow more sensitive transformations [33].
3.5.5. Global Max Pooling layer
After passing through N multitask Transformer encoder layers (×8) with an output shape of (32, N, 128), a global max pooling operation [5] reduces the sequence-wide representation to a single 128-dimensional summary vector, which successfully captures the most important properties from the whole input waveform like its peaks, dicrotic notches, troughs, and inflection points. It was applied to produce a fixed-length vector:
and reducing sequence dimension (32, 128).
3.5.6. Multi-task Learning Output Layer
This latent vector z now encodes the learned representation of the input signal segment. For Multitask Learning (MTL), it uses a linear layer that outputs both SBP and DBP simultaneously [33]:
where and . Now, is typically larger than to allow more sensitive transformations [23]
where
Minimizing the combined loss enables the cBP-Tnet model to improve performance on both tasks at the same time, balancing learning and guaranteeing that the latent representation can predict both SBP and DBP. The training section shows the usage of a OneCycleLR learning rate schedule at and an optimal training run (1,295 epochs) that is still 13.67 % faster than the current state of the art [5], saving the best model based on the best combined validation loss. A gradient clipping threshold () was also implemented to stabilize the training phase; that is, it employs the OneCycle learning rate schedule [34] with an loss that initially increases and then decreases the learning rate to help converge to better minima. Gradient clipping prevents the exploding gradients:
where is a predefined threshold (). The final output shape was .
4. cBP-Tnet Experimental Results and Discussions
This section includes Leave-One-Subject-Out (LOSO) experiments, hyperparameter tuning/analysis, comparative analysis with related works, and model evaluation and visualization to understand the effect of gradual performance improvement of various factors added to the model and further optimize model performance.
4.1. Leave-One-Subject-Out (LOSO) Experiments
Table 1 depicts the incremental improvement of the proposed cBP-Tnet for estimating blood pressure from raw photoplethysmography (PPG) signals automatically.
Each row illustrates a different model and preprocessing pipeline, beginning with a simple baseline (just the raw PPG waveform) and gradually introducing additional signal derivatives, filtering algorithms, data synchronization and augmentation mechanisms. The values shown are the mean absolute errors (MAEs) in mmHg for both systolic and diastolic blood pressure measurements using a Leave-One-Subject-Out (LOSO) scheme, in which each individual in the dataset is removed from the training set in turn to assess how well the model generalizes to previously unseen subjects. The validation loss MAE was used initially in the based model while the extended (final) model used the testing loss MAE. It should be noted that based on AAMI international standard the MAE must be less than 5 mmHg with greater than 85 subjects [19]. Firstly, the model reaches certain baseline errors using only the raw PPG signal (for example, 5.72 mmHg for systolic pressure and 3.09 mmHg for diastolic pressure). The error values gradually decrease as more detailed signal processing processes are added to following rows, such as adding the first and second derivatives of the PPG waveform (PPG’ and PPG”). This shows that more information about the signal’s rate of change and acceleration can assist the model capture more subtle blood pressure aspects. Finally, data augmentation procedures artificially increase the diversity and quantity of training samples, hence enhancing model generalization. The model’s error metrics improve gradually when more components are added. The MAEs decrease significantly as the pipeline comprises not only the original signal and its derivatives, but also advanced filtering, outlier treatment, synchronization, and augmentation. These improvements show that blood pressure prediction using PPG signals is sensitive to noise, alignment, and data quality. Systematic signal processing and advanced modeling approaches can considerably improve the reliability of noninvasive blood pressure predictions, as seen by the lower MAEs in the table’s final rows.
4.2. Hyperparameter Tuning/Analysis
Table 2 summarizes hyperparameter tuning experiments performed on the proposed cBP-Tnet model to increase its capabilities to estimate systolic and diastolic blood pressures (SBP and DBP) from raw PPG input data.
Each row represents a change in one or more model parameters, including the model dimensionality (), the number of heads (h) in the multi-head attention mechanism, the number of encoder blocks (N), the probability of dropout (), and the gradient clipping threshold (). Along with these parameter settings, the table shows the corresponding mean absolute error (MAE) values for SBP and DBP, which indicate how well the model predicts blood pressure relative to genuine observed results—lower the MAE, the better. In the “Base” configuration, where , , , , and , the model originally trained for 150 epochs (10 % of the previous state of the art [5]) produces MAEs of for SBP and for DBP. The next rows (A through E) indicate systematic experimental trials to change important parameters. In (A), the model dimensionality is either reduced to 64 or increased to 256. We observe that smaller dimensionality significantly increases error (SBP MAE ), while larger dimensionality (256) improves performance slightly (SBP MAE ) but not beyond the original baseline. Similarly, in (B), decreasing the number of attention heads from four to two impairs forecasts, whereas increasing to eight heads brings SBP MAE closer to the original values but with no substantial improvement over baseline. Part C adjusts the number of encoder layers (N), comparing 6 and 10 layers to the original 8. Adjustments to the depth result in minor error variations, but no significant improvement in performance (SBP MAE – and DBP MAE –). Part (D) tests various dropout probabilities. A dropout rate results in comparable performance (SBP MAE ) to the baseline, indicating that a moderate dropout value may provide stability but is not necessary. A greater dropout rate () somewhat decreases performance, implying that excessive dropout may degrade model accuracy. Finally, part (E) examines the impact of gradient clipping. Eliminating gradient clipping () results in a catastrophic failure (SBP MAE rises to ), indicating that uncontrolled gradients significantly disrupt training. In contrast, a high gradient clip value () returns performance to the baseline, demonstrating the necessity of managing gradient explosion. By the end of these extensive experimental trials and hyperparameter tuning/analysis, the researchers identified the final optimal configuration: and . Training the model for up to the optimal 1295 epochs (based on the best combined SBP/DBP validation loss) yielded a noticeable improvement in accuracy, reducing the SBP MAE to and the DBP MAE to . Showing that careful and methodical tuning of network architecture and training parameters is necessary to achieve robust performance in blood pressure prediction tasks, and that certain settings—particularly controlling model size, maintaining moderate dropout, and preventing gradient explosion—are key to achieving high-quality, stable results.
4.3. Comparison Against Related Deep Learning Methods to Estimate Blood Pressure with Automatic Feature Extraction using Photolethysmogram Feature Extraction
Table 3 summarizes the progress of research methods and performance benchmarks for non-invasive continuous blood pressure estimation using photoplethysmogram (PPG) signals with automatic feature extraction mechanisms.
The top row, representing Slapnicar et al. [15] (2019), uses a ResNet-based architecture on 510 participants but performs poorly, with MAEs well exceeding the AAMI standard threshold of 5 mmHg for both systolic and diastolic pressures. Not only do the results fail the AAMI requirements, but the model apparently requires lengthy training periods (up to 10,000 epochs), indicating problems with training efficiency and scalability. Rong et al. [16] (2021) use a multi-type feature fusion (MTFF-ANN) technique to a small dataset of 11,546 samples only, yielding better but still insufficient systolic MAE. While the diastolic estimate meets the AAMI criteria, the very complex and difficult automatic feature extraction process and the small sample size call into question the model’s applicability to larger populations and situations. Dai et al. [5] (2024) incorporate temporal convolutional networks and a CBAM attention mechanism over a huge dataset of 270,488 samples to achieve even greater improvements. Although the diastolic MAE is great and meets the AAMI standard, the systolic estimation fails, and the model takes at least 1,500 epochs to converge. This intricacy and extensive training burden indicate a smart but not totally efficient system. In contrast, the proposed cBP-Tnet model that makes use of a multitask learning Transformer-based network outperforms all the recent studies. It was based on random 500 patient records (202,956 samples), it achieves significantly lower MAEs for both systolic (4.32 mmHg) and diastolic (2.18 mmHg) pressures, meeting the AAMI requirement. Remarkably, this strategy reduces training time to only 1,295 epochs, a 13.67% improvement over its latest competitor [5], while employing a simpler single-model deep learning framework. This not only simplifies model design, but may also reduce computational and infrastructure demands. The proposed cBP-Tnet AI model demonstrates that systematic improvements in model architectures, sample sizes, and training protocols can finally close the clinical standard gap, paving the way for more practical and widespread use of continuous non-invasive blood pressure monitoring tools. Optimizing the potential to be integrated/enable non-invasive continuous monitoring by home and mobile health-care devices.
4.4. cBP-Tnet Evaluation and Visualization
Figure 3 and Figure 4 shows how well a cBP-Tnet AI model predicts systolic and diastolic blood pressure (DBP) values from specific input signals. In Figure 3, the training loss (blue line) begins very high and rapidly drops in the initial epochs, demonstrating that the model is effectively learning the underlying patterns in the data.
As training develops beyond the early stages, the loss gradually decreases, eventually stabilizing at a lower value. The validation loss (yellow line), while initially higher, follows a general downward trend, indicating that the model is generalizing to previously unseen data rather than overfitting. By 1295 epochs, the training and validation losses appear to have stabilized, indicating that the chosen training duration is appropriate as it is designed to save the best model based on the best combined validation L1 loss. The model’s performance was better highlighted in the SBP and DBP prediction against actual plot as shown in Figure 4.
The predicted SBP (dashed red line) closely reflects the real SBP (solid blue line) values across the sample series, suggesting a high capacity to simulate the dynamic changes of systolic pressure. Similarly, while DBP has higher fluctuation and the peaks and troughs may not coincide completely, the predicted values (green line) show a general relationship with the actual data (yellow line). This shows that the model has learned the most common patterns in DBP, however it may be more susceptible to noise or more complex fluctuations in diastolic pressure. The predicted vs. actual scatter graph test results for systolic blood pressure (SBP) in Figure 5 and diastolic blood pressure (DBP) in Figure 6 shows how the model’s anticipated values compare to the actual measurements.
Each point represents a single test case, with the horizontal axis representing the actual measured blood pressure and the vertical axis representing the model’s predicted value for that same instance. A strong linear trend, as seen in both graphs, implies that the model is capturing a significant portion of the underlying pattern: correlation coefficients of roughly 0.885 for SBP and 0.874 for DBP indicate a high degree of linear relationship. The red regression lines fitted across the data points, with slopes of roughly 0.87 for SBP and 0.84 for DBP and moderate intercept values, demonstrate that forecasts often grow in tandem with actual values.
However, the appearance of substantial scatter around these regression lines indicates that, while the model’s predictions are frequently accurate, they are not flawless. Some examples fall well above or below the line, indicating over- or under-prediction. But, these plots provide a visual assessment of prediction accuracy, demonstrating that the model performs well for a substantial chunk of the data but has room for improvement in terms of precision and consistency.
5. Conclusions
To date, cBP-Tnet was the only deep learning method with automatic photoplethysmogram feature extraction to have both Systolic (4.32 mmHg) and Diastolic (2.18 mmHg) blood pressure acceptable to the Association for the Advancement of Medical Instrumentation (AAMI) international standards (<5 mmHg, >85 subjects) [19]. cBP-Tnet was designed effectively as it is single channel and model compared to the recent deep learning methods for continuous non-invasive blood pressure monitoring [5,15,16] which were hybrids and/or complex in design that needs multiple models. The cBP-Tnet method efficiently takes 13.67% faster to train and still output better and AAMI accepted results compared to recent studies [5] in the field. This establishes cBP-Tnet’s potential for integration into wearable and home-based healthcare devices, paving the way for more accessible, dependable continuous non-invasive blood pressure monitoring. Code is available at: https://github.com/apimentel-ECE/cBP-Tnet.git
Author Contributions
Conceptualization, J.-J.H. and A.R.A.S.; methodology, A.A.P., J.-J.H. and A.R.A.S.; software, A.A.P.; validation, A.A.P., J.-J.H. and A.R.A.S.; formal analysis, A.A.P., J.-J.H. and A.R.A.S.; investigation, A.A.P., J.-J.H. and A.R.A.S.; resources, J.-J.H. and A.R.A.S.; data curation, A.A.P.; writing—original draft preparation, A.A.P.; writing—review and editing, J.-J.H. and A.R.A.S.; visualization, A.A.P.; supervision, J.-J.H. and A.R.A.S.; project administration, J.-J.H.; funding acquisition, J.-J.H. All authors have read and agreed to the published version of the manuscript.
Funding
The authors gratefully acknowledge the financial support from the National Science and Technology Council, R.O.C., under the NSTC Grant No. NSTC 113-2221-E-218-008-
Institutional Review Board Statement
Not applicable
Informed Consent Statement
Not applicable
Data Availability Statement
Public dataset and code available at: https://github.com/apimentel-ECE/cBP-Tnet.git
Conflicts of Interest
The authors declare no conflicts of interest.
Abbreviations
The following abbreviations are used in this manuscript:
| MIMIC-II | Multiparameter Intelligent Monitoring in Intensive Care II |
| TCN-CBAM | Temporal Convolutional Network- Convolutional Block Attention Module |
| MTFF-ANN | Multi-type Features Fusion Artificial Neural Network |
| BiLSTM | Bidirectional Long Short-Term Memory |
| AAMI | Association for the Advancement of Medical Instrumentation |
| Resnet | Residual Neural Network |
| mmHg | Millimetre of Mercury |
| LOSO | Leave-One-Subject-Out |
| ECG | Electrocardiogram |
| BCG | Ballistocardiogram |
| PPG | Photoplethysmogram |
| MTL | Multi-Task Learning |
| PTT | Pulse Transit Time |
| PWV | Pulse Wave Velocity |
| ABP | Arterial Blood Pressure |
| SBP | Systolic Blood Pressure |
| DBP | Diastolic Blood Pressure |
| CNN | Convolutional Neural Networks |
| RNN | Recurrent Neural Networks |
| MAE | Mean Absolute Error |
| AI | Artificial Intelligence |
| BP | Blood Pressure |
| r | Pearson correlation coefficient |
Short Biography of Authors
 |
Angelino A. Pimentel received his B.Sc. in Electronics Engineering (ECE) degree from Saint Mary’s University (SMU), Nueva Vizcaya, Philippines, in 2014. His M.Sc. in Electronics Engineering degree from Mapua University (MU), Manila, Philippines, in 2019. He is currently pursuing Ph.D. in Electrical Engineering, specifically researching in Biomedical Electronic Center at the Southern Taiwan University of Science and Technology (STUST), Tainan City, Taiwan. From 2015, he began his career as an In-process Quality Engineer at SFA Semicon, a subsidiary SAMSUNG company in Pampanga City, Philippines. Since 2017, he has been a researcher/faculty, serving also as the Head of the Electronics Engineering Department & Technology Transfer and Business Development Office (TTBDO) at SMU. His research interests are in Intelligent Biomedical Electronic Devices and Post-harvest Collaborative Robotic (Cobot) e-Systems. |
 |
Ji-Jer Huang is now an associate professor in the Department of Electrical Engineering at Southern Taiwan University of Science and Technology. He received a B.S. in electrical engineering in 1992 from Feng Chia University. He received his M.S. and Ph.D. in biomedical engineering in 1994 and 2001 from the National Cheng Kung University (NCKU), Tainan, Taiwan. He did research in the field of optoelectronic instruments at the Instrument Technology Research Center, National Applied Research Laboratories, before 2006. His research interests are in electrical impedance imaging, the development of bioelectrical impedance analysis technology, the development of noninvasive biomedical measurement technologies, and the design of MCU/DSP-based biomedical instrument circuits. He now focuses on using AI technology to obtain blood pressure parameters using real-time measurement of physiological signals. He also continues to develop measurement and analysis technology from BIA, EMG, and motion detection to estimate sarcopenia. |
 |
Aaron Raymond See was born in Manila, Philippines, and received his B.S. degree in Electronics and Communications Engineering from De La Salle University (DLSU), Manila, in 2006. He obtained his M.S. and Ph.D. degrees in Electrical Engineering with a major in Biomedical Engineering from Southern Taiwan University of Science and Technology (STUST) in 2010 and 2014, respectively. Subsequently, he did his postdoctoral research in neuroscience at the Brain Research Center, National Tsing Hua University (NTHU), Hsin Chu, Taiwan. He was an associate professor in the Department of Electrical Engineering at STUST and is currently an associate professor in the Department of Electronics Engineering at National Chin- Yi University of Technology (NCUT). His research interests are in assistive device design and development, haptics, machine learning, and biomedical signal processing. |
References
- Zhou, B.; Carrillo-Larco, R.M.; Danaei, G.; Riley, L.M.; Paciorek, C.J.; Stevens, G.A.; Gregg, E.W.; Bennett, J.E.; Solomon, B.; Singleton, R.K.; et al. Worldwide trends in hypertension prevalence and progress in treatment and control from 1990 to 2019: a pooled analysis of 1201 population-representative studies with 104 million participants. The lancet 2021, 398, 957–980. [Google Scholar] [CrossRef] [PubMed]
- World Health Organization. Global report on hypertension: the race against a silent killer, 2023. https://www.who.int/publications/i/item/9789240081062 (accessed December 19, 2024).
- Picone, D.S.; Schultz, M.G.; Otahal, P.; Aakhus, S.; Al-Jumaily, A.M.; Black, J.A.; Bos, W.J.; Chambers, J.B.; Chen, C.H.; Cheng, H.M.; et al. Accuracy of cuff-measured blood pressure: systematic reviews and meta-analyses. Journal of the American College of Cardiology 2017, 70, 572–586. [Google Scholar] [CrossRef] [PubMed]
- Kachuee, M.; Kiani, M.M.; Mohammadzade, H.; Shabany, M. Cuff-less high-accuracy calibration-free blood pressure estimation using pulse transit time. In Proceedings of the 2015 IEEE international symposium on circuits and systems (ISCAS); IEEE, 2015; pp. 1006–1009. [Google Scholar]
- Dai, D.; Ji, Z.; Wang, H. Non-invasive continuous blood pressure estimation from single-channel PPG based on a temporal convolutional network integrated with an attention mechanism. Applied Sciences 2024, 14, 6061. [Google Scholar] [CrossRef]
- Corazza, I.; Zecchi, M.; Corsini, A.; Marcelli, E.; Cercenelli, L. Technologies for hemodynamic measurements: past, present and future. In Advances in cardiovascular technology; Elsevier, 2022; pp. 515–566.
- Huang, J.J.; Yu, S.I.; Syu, H.Y.; See, A.R. The non-contact heart rate measurement system for monitoring HRV. In Proceedings of the 2013 35th Annual International Conference of the IEEE Engineering in Medicine and Biology Society (EMBC). IEEE; 2013; pp. 3238–3241. [Google Scholar]
- Huang, J.J.; Huang, Y.M.; See, A.R. Studying peripheral vascular pulse wave velocity using bio-impedance plethysmography and regression analysis. ECTI Transactions on Computer and Information Technology (ECTI-CIT) 2017, 11, 63–70. [Google Scholar] [CrossRef]
- Huang, J.J.; Syu, H.Y.; Cai, Z.L.; See, A.R. Development of a long term dynamic blood pressure monitoring system using cuff-less method and pulse transit time. Measurement 2018, 124, 309–317. [Google Scholar] [CrossRef]
- Huang, B.; Chen, W.; Lin, C.L.; Juang, C.F.; Wang, J. MLP-BP: A novel framework for cuffless blood pressure measurement with PPG and ECG signals based on MLP-Mixer neural networks. Biomedical Signal Processing and Control 2022, 73, 103404. [Google Scholar] [CrossRef]
- Vidhya, C.; Maithani, Y.; Singh, J.P. Recent advances and challenges in textile electrodes for wearable biopotential signal monitoring: A comprehensive review. Biosensors 2023, 13, 679. [Google Scholar] [CrossRef]
- Rastegar, S.; GholamHosseini, H.; Lowe, A. Non-invasive continuous blood pressure monitoring systems: current and proposed technology issues and challenges. Physical and Engineering Sciences in Medicine 2020, 43, 11–28. [Google Scholar] [CrossRef]
- Kachuee, M.; Kiani, M.M.; Mohammadzade, H.; Shabany, M. Cuffless blood pressure estimation algorithms for continuous health-care monitoring. IEEE Transactions on Biomedical Engineering 2016, 64, 859–869. [Google Scholar] [CrossRef]
- González, S.; Hsieh, W.T.; Chen, T.P.C. A benchmark for machine-learning based non-invasive blood pressure estimation using photoplethysmogram. Scientific Data 2023, 10, 149. [Google Scholar] [CrossRef]
- Slapničar, G.; Mlakar, N.; Luštrek, M. Blood pressure estimation from photoplethysmogram using a spectro-temporal deep neural network. Sensors 2019, 19, 3420. [Google Scholar] [CrossRef]
- Rong, M.; Li, K. A multi-type features fusion neural network for blood pressure prediction based on photoplethysmography. Biomedical Signal Processing and Control 2021, 68, 102772. [Google Scholar] [CrossRef]
- Lee, J.; Scott, D.J.; Villarroel, M.; Clifford, G.D.; Saeed, M.; Mark, R.G. Open-access MIMIC-II database for intensive care research. In Proceedings of the 2011 Annual International Conference of the IEEE Engineering in Medicine and Biology Society. IEEE; 2011; pp. 8315–8318. [Google Scholar]
- Kachuee, M.; Kiani, M.M.; Mohammadzade, H.; Shabany, M. Cuff-less blood pressure estimation data set. UCI Machine Learning Repository 2015. [Google Scholar]
- White, W.B.; Berson, A.S.; Robbins, C.; Jamieson, M.J.; Prisant, L.M.; Roccella, E.; Sheps, S.G. National standard for measurement of resting and ambulatory blood pressures with automated sphygmomanometers. Hypertension 1993, 21, 504–509. [Google Scholar] [CrossRef]
- Teng, X.; Zhang, Y. Continuous and noninvasive estimation of arterial blood pressure using a photoplethysmographic approach. Proceedings of the Proceedings of the 25th Annual International Conference of the IEEE Engineering in Medicine and Biology Society (IEEE Cat. No. 03CH37439). IEEE, 2003, Vol. 4, pp. 3153–3156.
- Kurylyak, Y.; Lamonaca, F.; Grimaldi, D. A Neural Network-based method for continuous blood pressure estimation from a PPG signal. In Proceedings of the 2013 IEEE International instrumentation and measurement technology conference (I2MTC). IEEE; 2013; pp. 280–283. [Google Scholar]
- Liu, M.; Po, L.M.; Fu, H. Cuffless blood pressure estimation based on photoplethysmography signal and its second derivative. International Journal of Computer Theory and Engineering 2017, 9, 202. [Google Scholar] [CrossRef]
- Vaswani, A.; Shazeer, N.; Parmar, N.; Uszkoreit, J.; Jones, L.; Gomez, A.N.; Kaiser, Ł.; Polosukhin, I. Attention is all you need. Advances in neural information processing systems 2017, 30. [Google Scholar]
- Caruana, R. Multitask learning. Machine learning 1997, 28, 41–75. [Google Scholar] [CrossRef]
- Goldberger, A.L.; Amaral, L.A.; Glass, L.; Hausdorff, J.M.; Ivanov, P.C.; Mark, R.G.; Mietus, J.E.; Moody, G.B.; Peng, C.K.; Stanley, H.E. PhysioBank, PhysioToolkit, and PhysioNet: components of a new research resource for complex physiologic signals. circulation 2000, 101, e215–e220. [Google Scholar] [CrossRef]
- Clifford, G.D.; Scott, D.J.; Villarroel, M.; et al. User guide and documentation for the MIMIC II database. MIMIC-II database version 2009, 2. [Google Scholar]
- Mehra, R. On the identification of variances and adaptive Kalman filtering. IEEE Transactions on automatic control 1970, 15, 175–184. [Google Scholar] [CrossRef]
- Mousavi, S.S.; Firouzmand, M.; Charmi, M.; Hemmati, M.; Moghadam, M.; Ghorbani, Y. Blood pressure estimation from appropriate and inappropriate PPG signals using A whole-based method. Biomedical Signal Processing and Control 2019, 47, 196–206. [Google Scholar] [CrossRef]
- Pedregosa, F.; Varoquaux, G.; Gramfort, A.; Michel, V.; Thirion, B.; Grisel, O.; Blondel, M.; Prettenhofer, P.; Weiss, R.; Dubourg, V.; et al. Scikit-learn: Machine Learning in Python Gaël Varoquaux Bertrand Thirion Vincent Dubourg Alexandre Passos PEDREGOSA, VAROQUAUX, GRAMFORT ET AL. Matthieu Perrot Edouard Duchesnay. Journal of Machine Learning Research 2011, 12, 2825–2830. [Google Scholar]
- Wen, Q.; Sun, L.; Yang, F.; Song, X.; Gao, J.; Wang, X.; Xu, H. Time Series Data Augmentation for Deep Learning: A Survey. Proceedings of the Thirtieth International Joint Conference on Artificial Intelligence 2021. [Google Scholar] [CrossRef]
- Smith, L.N. A disciplined approach to neural network hyper-parameters: Part 1 – learning rate, batch size, momentum, and weight decay. arXiv:1803.09820 [cs, stat] 2018.
- Pascanu, R.; Mikolov, T.; Bengio, Y. On the difficulty of training recurrent neural networks, 2013.
- Liu, P.; Qiu, X.; Huang, X. Adversarial Multi-task Learning for Text Classification, 2017.
- Smith, L.N. Cyclical Learning Rates for Training Neural Networks, 2017. [CrossRef]
Figure 1.
Pipeline of the Proposed Novel cBP-Tnet Efficient Single Channel and Model Deep Learning Method for Continuous Non-invasive Blood Pressure Monitoring with Photoplethysmogram.
Figure 1.
Pipeline of the Proposed Novel cBP-Tnet Efficient Single Channel and Model Deep Learning Method for Continuous Non-invasive Blood Pressure Monitoring with Photoplethysmogram.
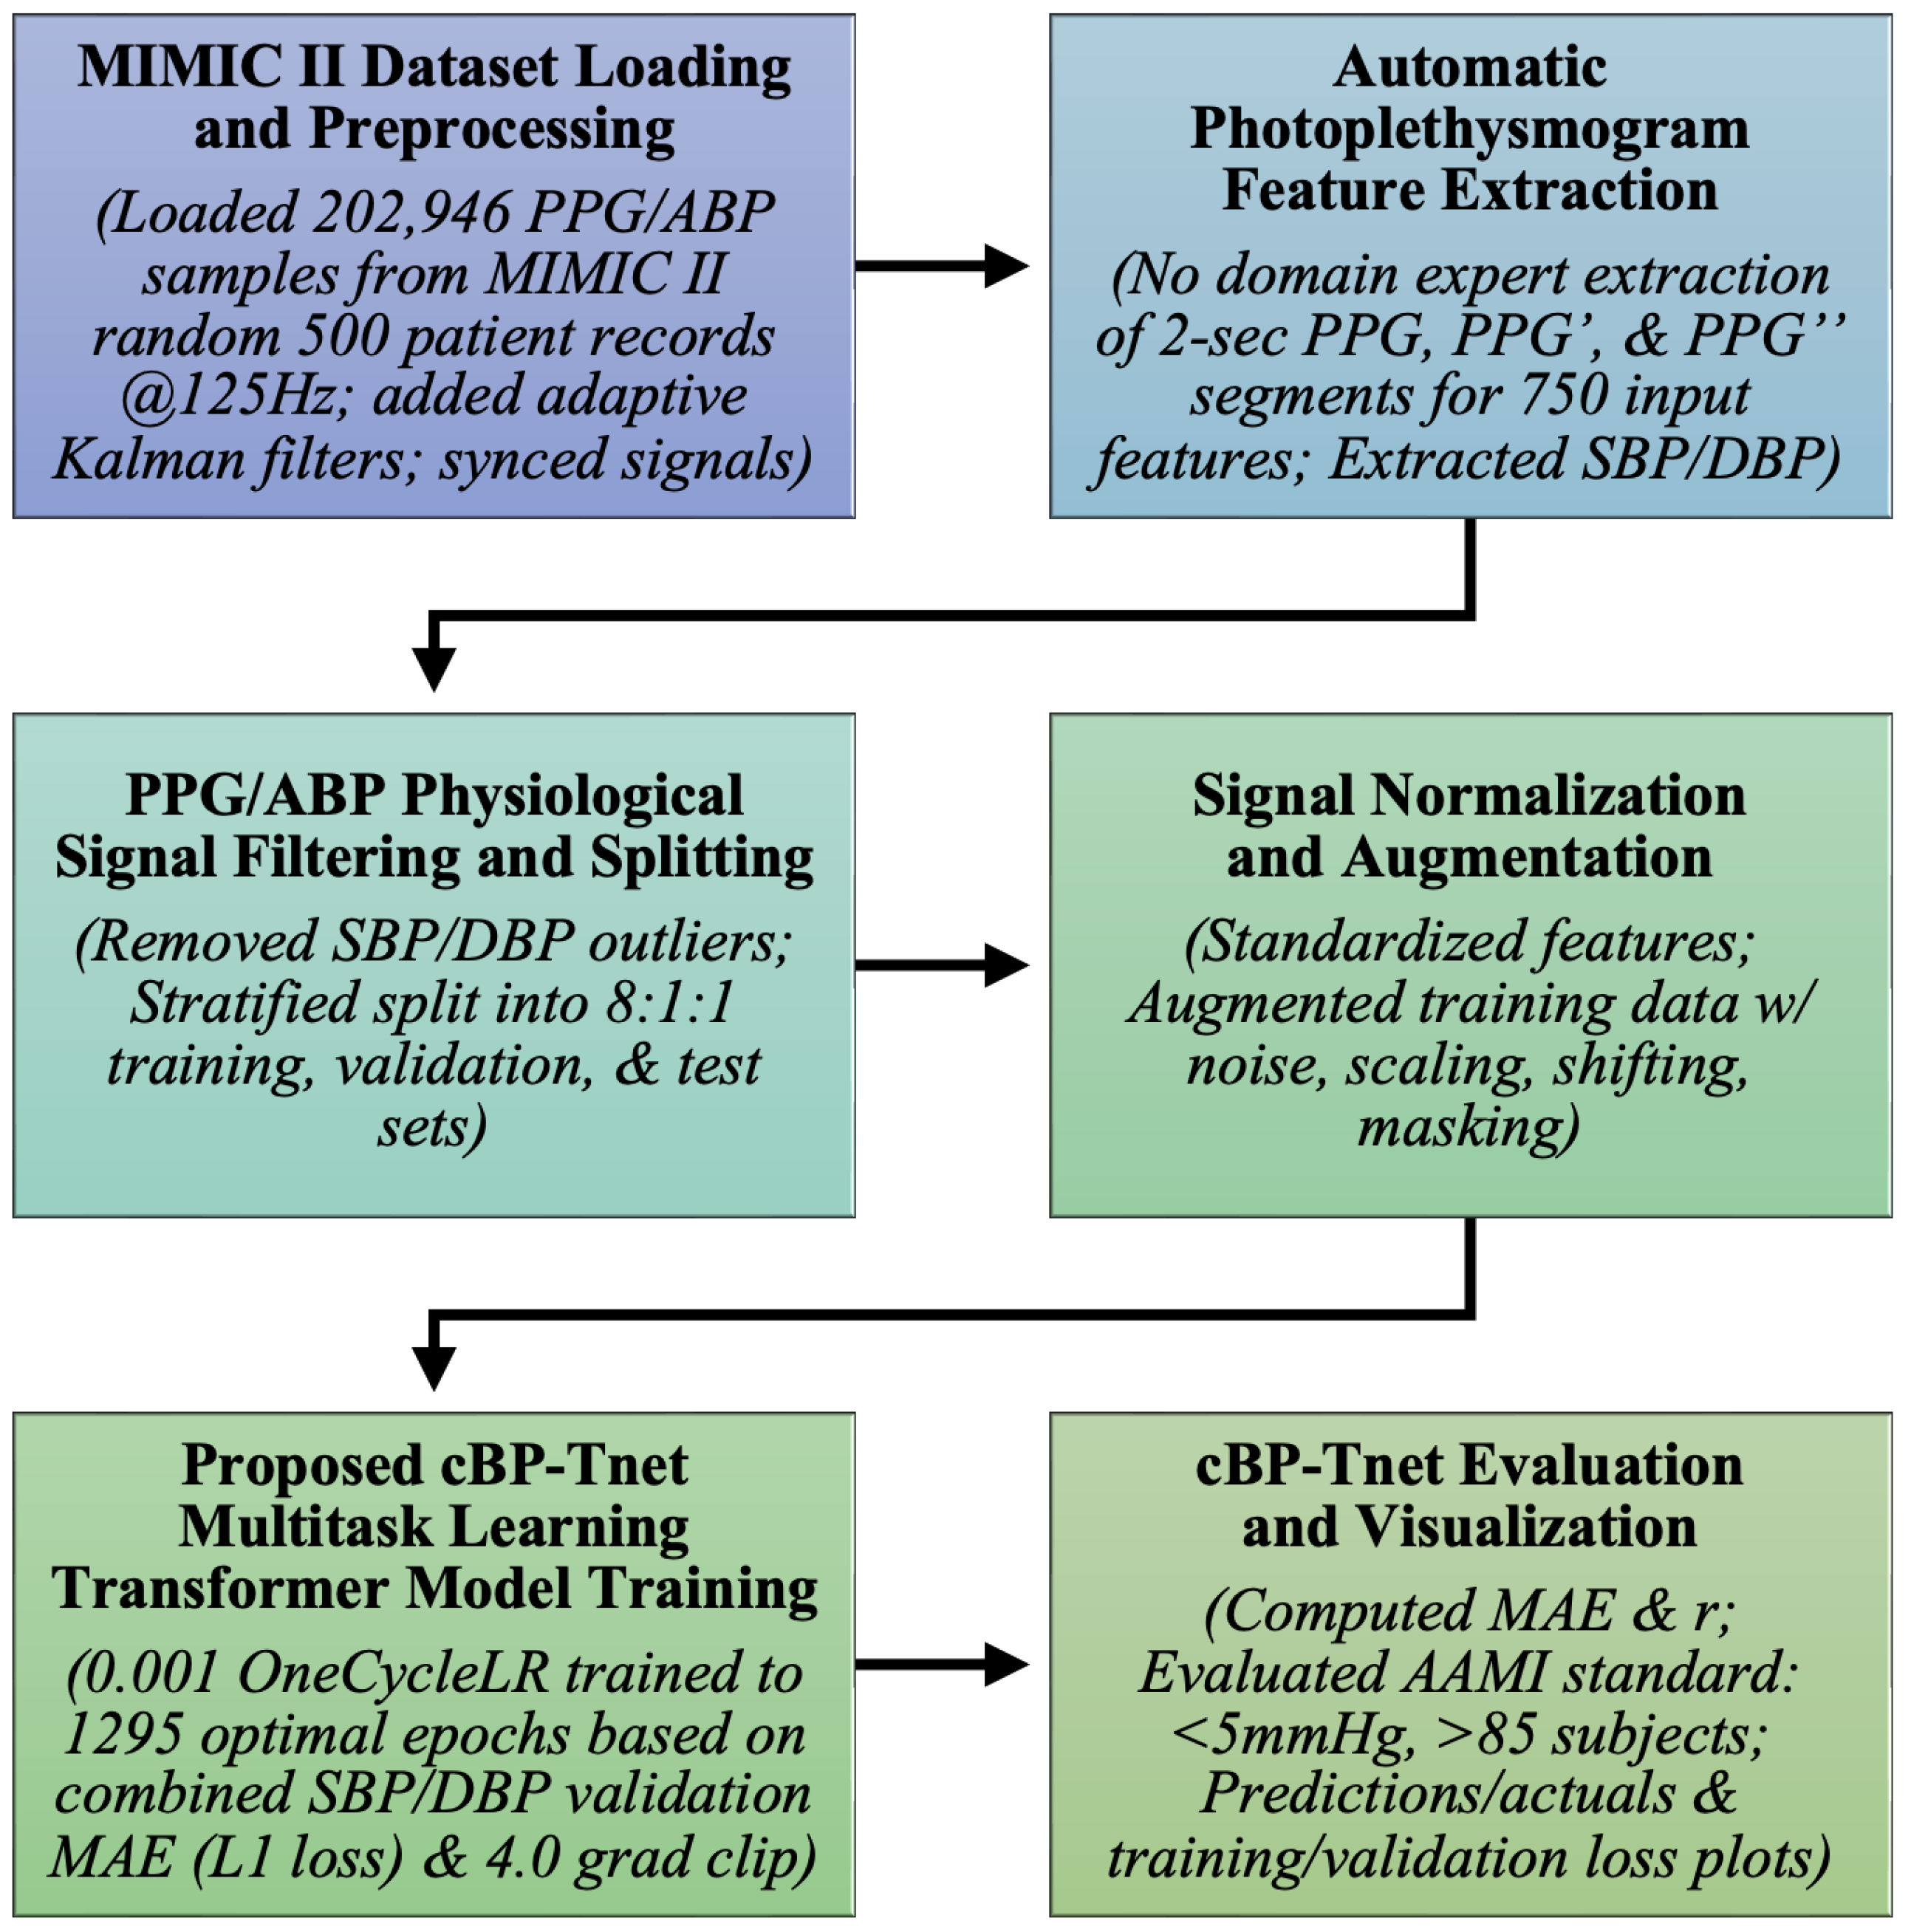
Figure 2.
Architecture of Proposed Novel “cBP-Tnet” Efficient Single Channel and Model Deep Learning Method for Continuous Non-invasive Blood Pressure Monitoring with Photoplethysmogram.
Figure 2.
Architecture of Proposed Novel “cBP-Tnet” Efficient Single Channel and Model Deep Learning Method for Continuous Non-invasive Blood Pressure Monitoring with Photoplethysmogram.
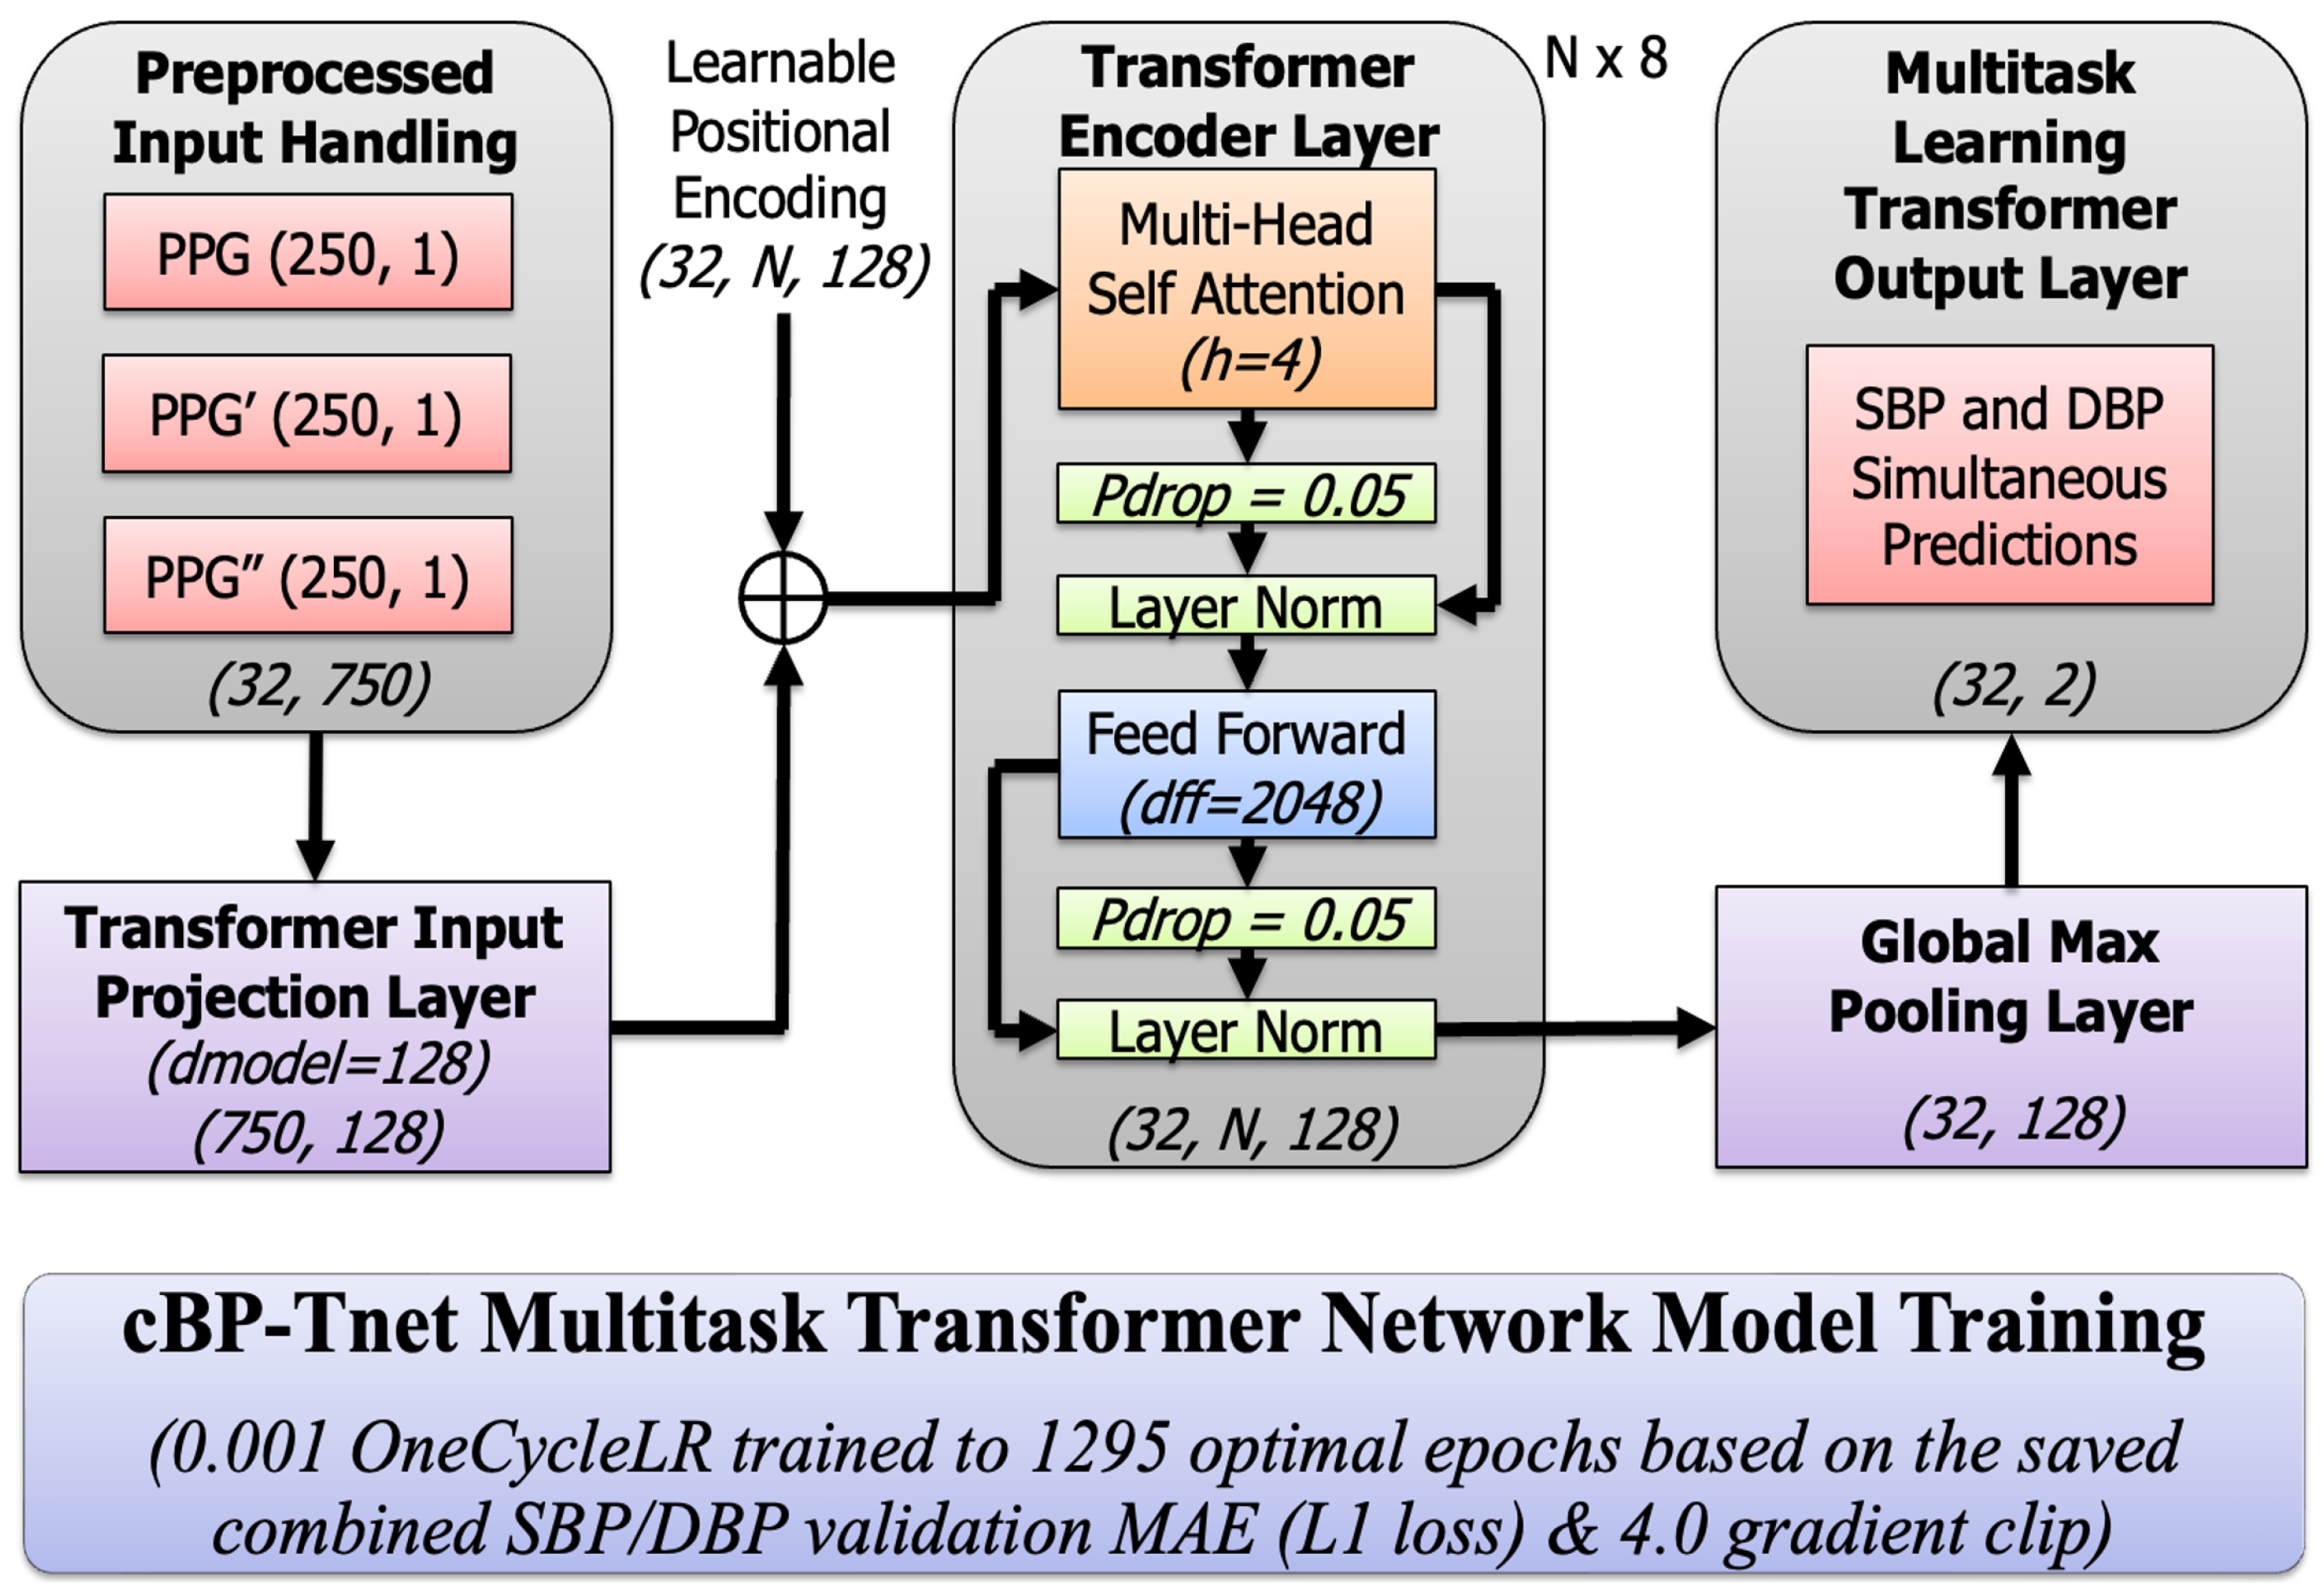
Figure 3.
cBP-Tnet AI Model Training and Validation Loss Plot for SBP and DBP - Optimal Epochs: 1295.
Figure 3.
cBP-Tnet AI Model Training and Validation Loss Plot for SBP and DBP - Optimal Epochs: 1295.
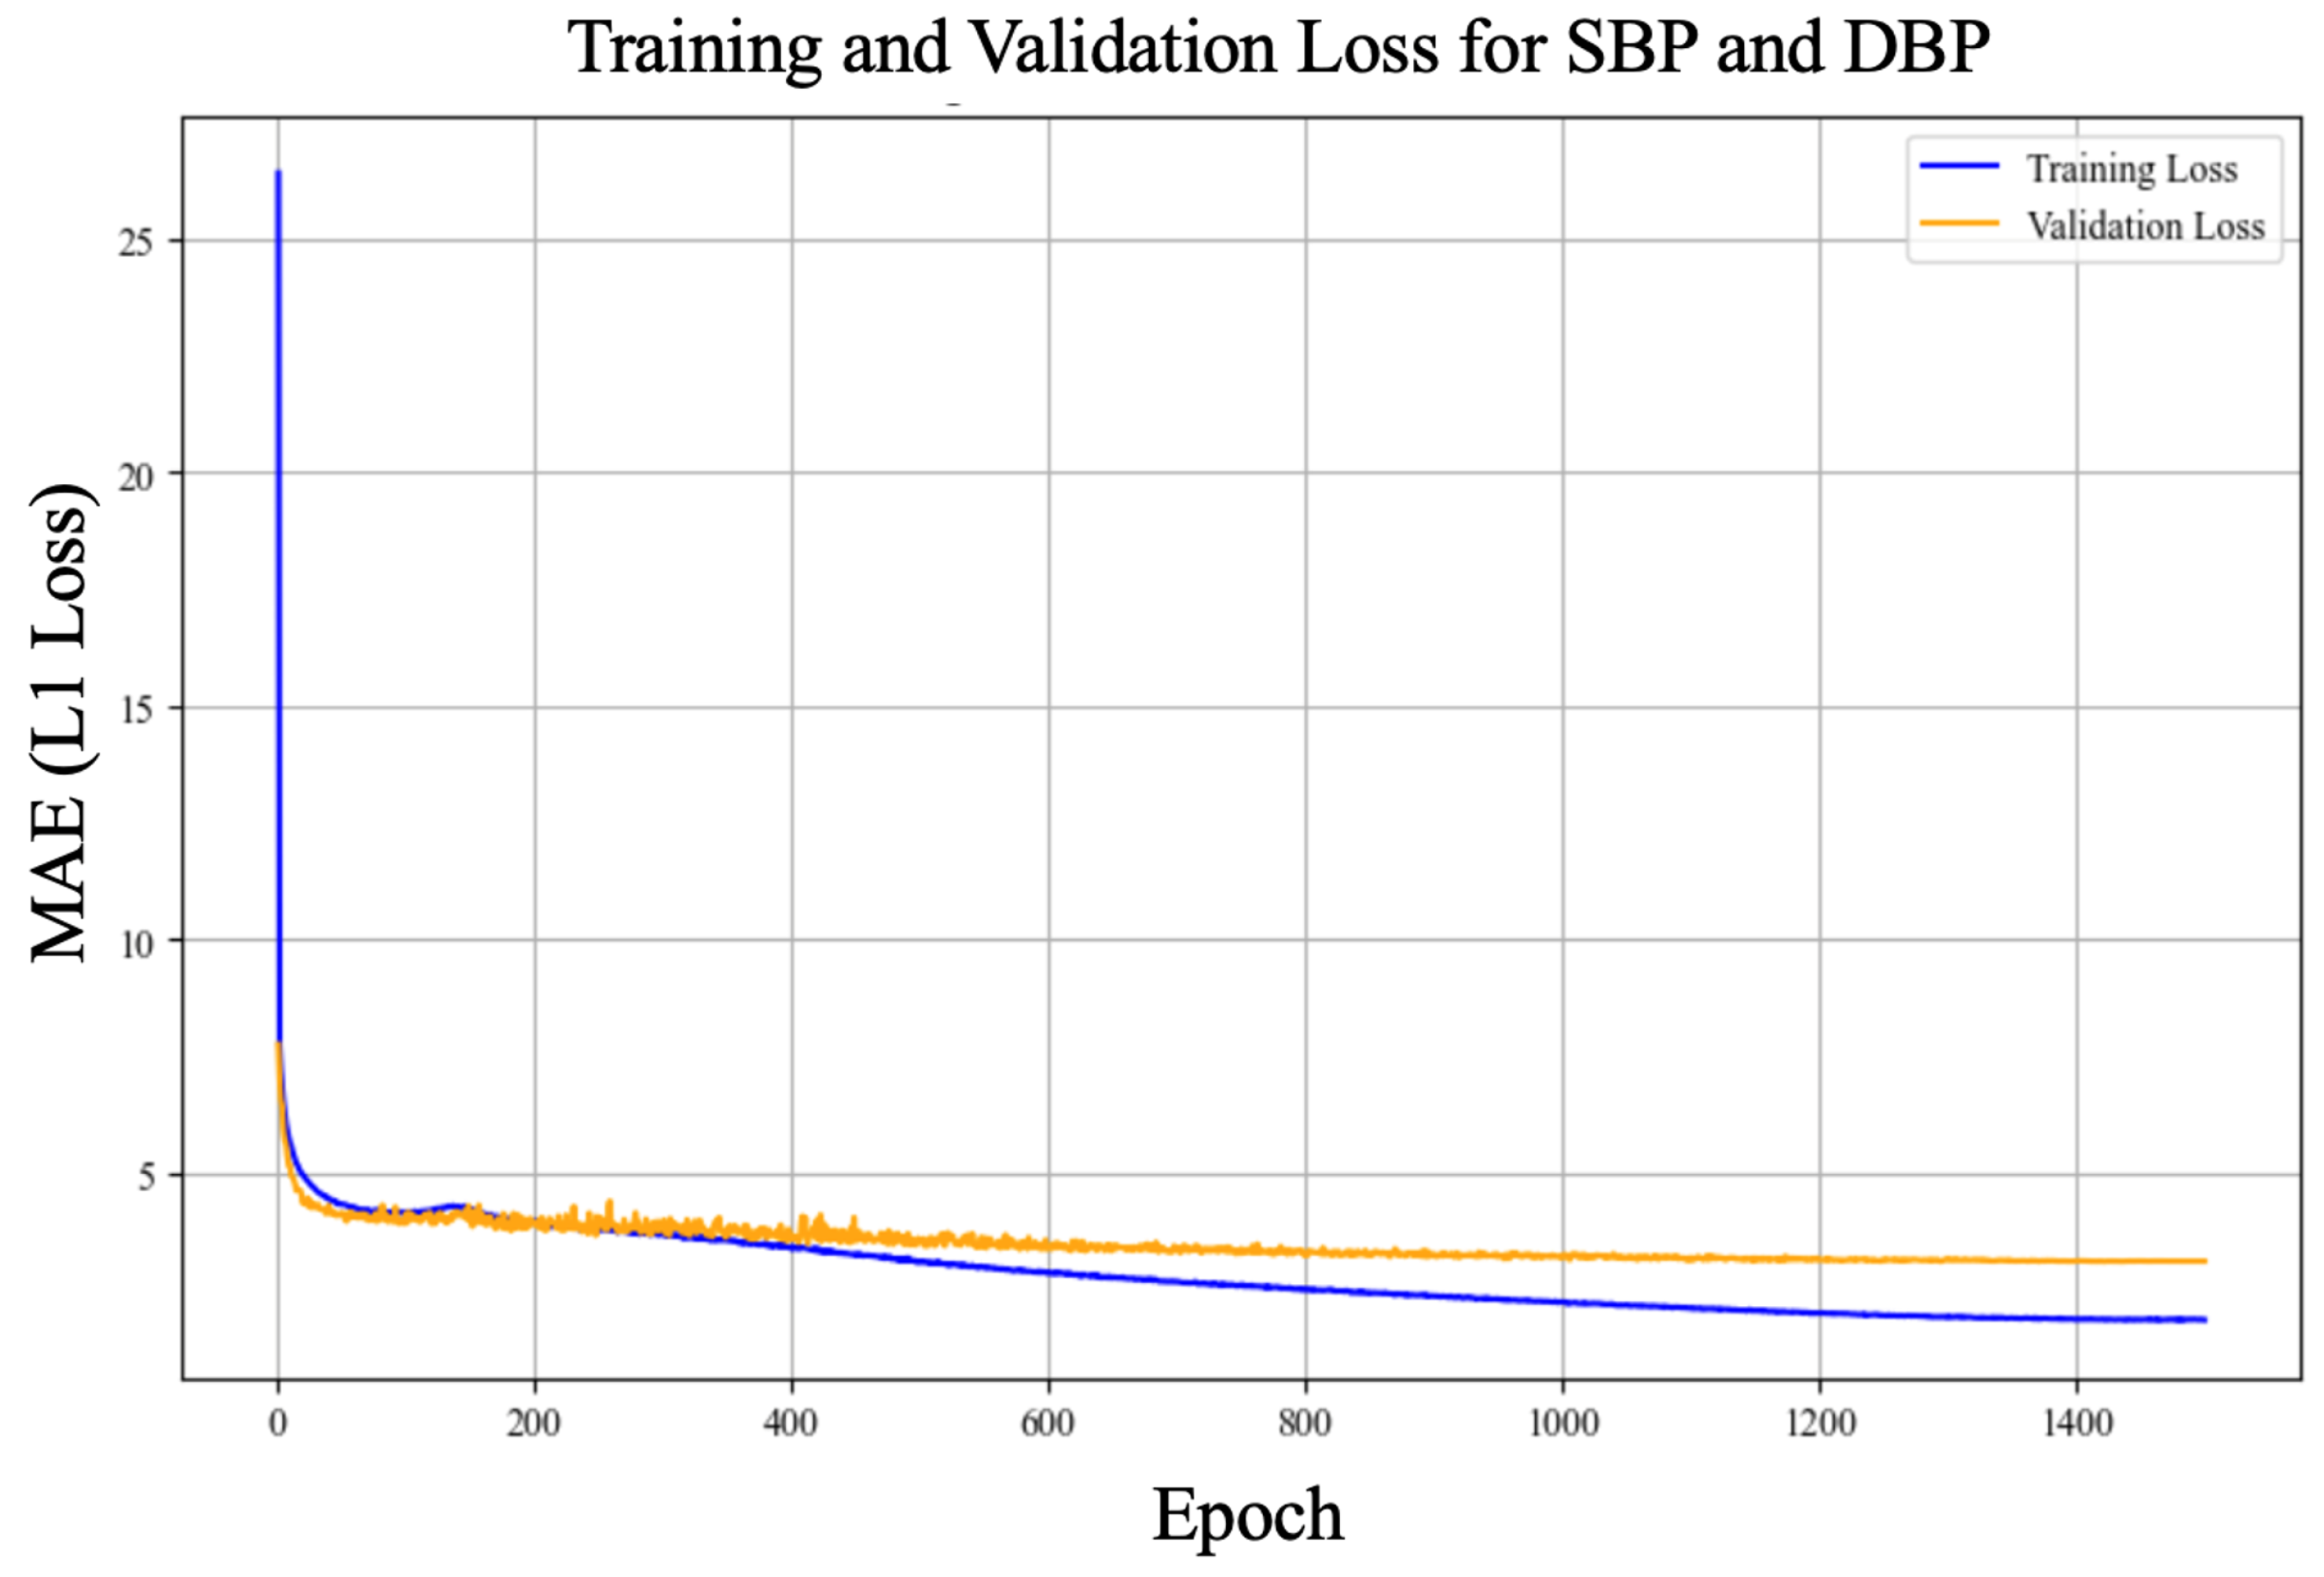
Figure 4.
cBP-Tnet AI Model SBP (Top) and DBP (bottom) Prediction vs. Actual (Test) Plots.
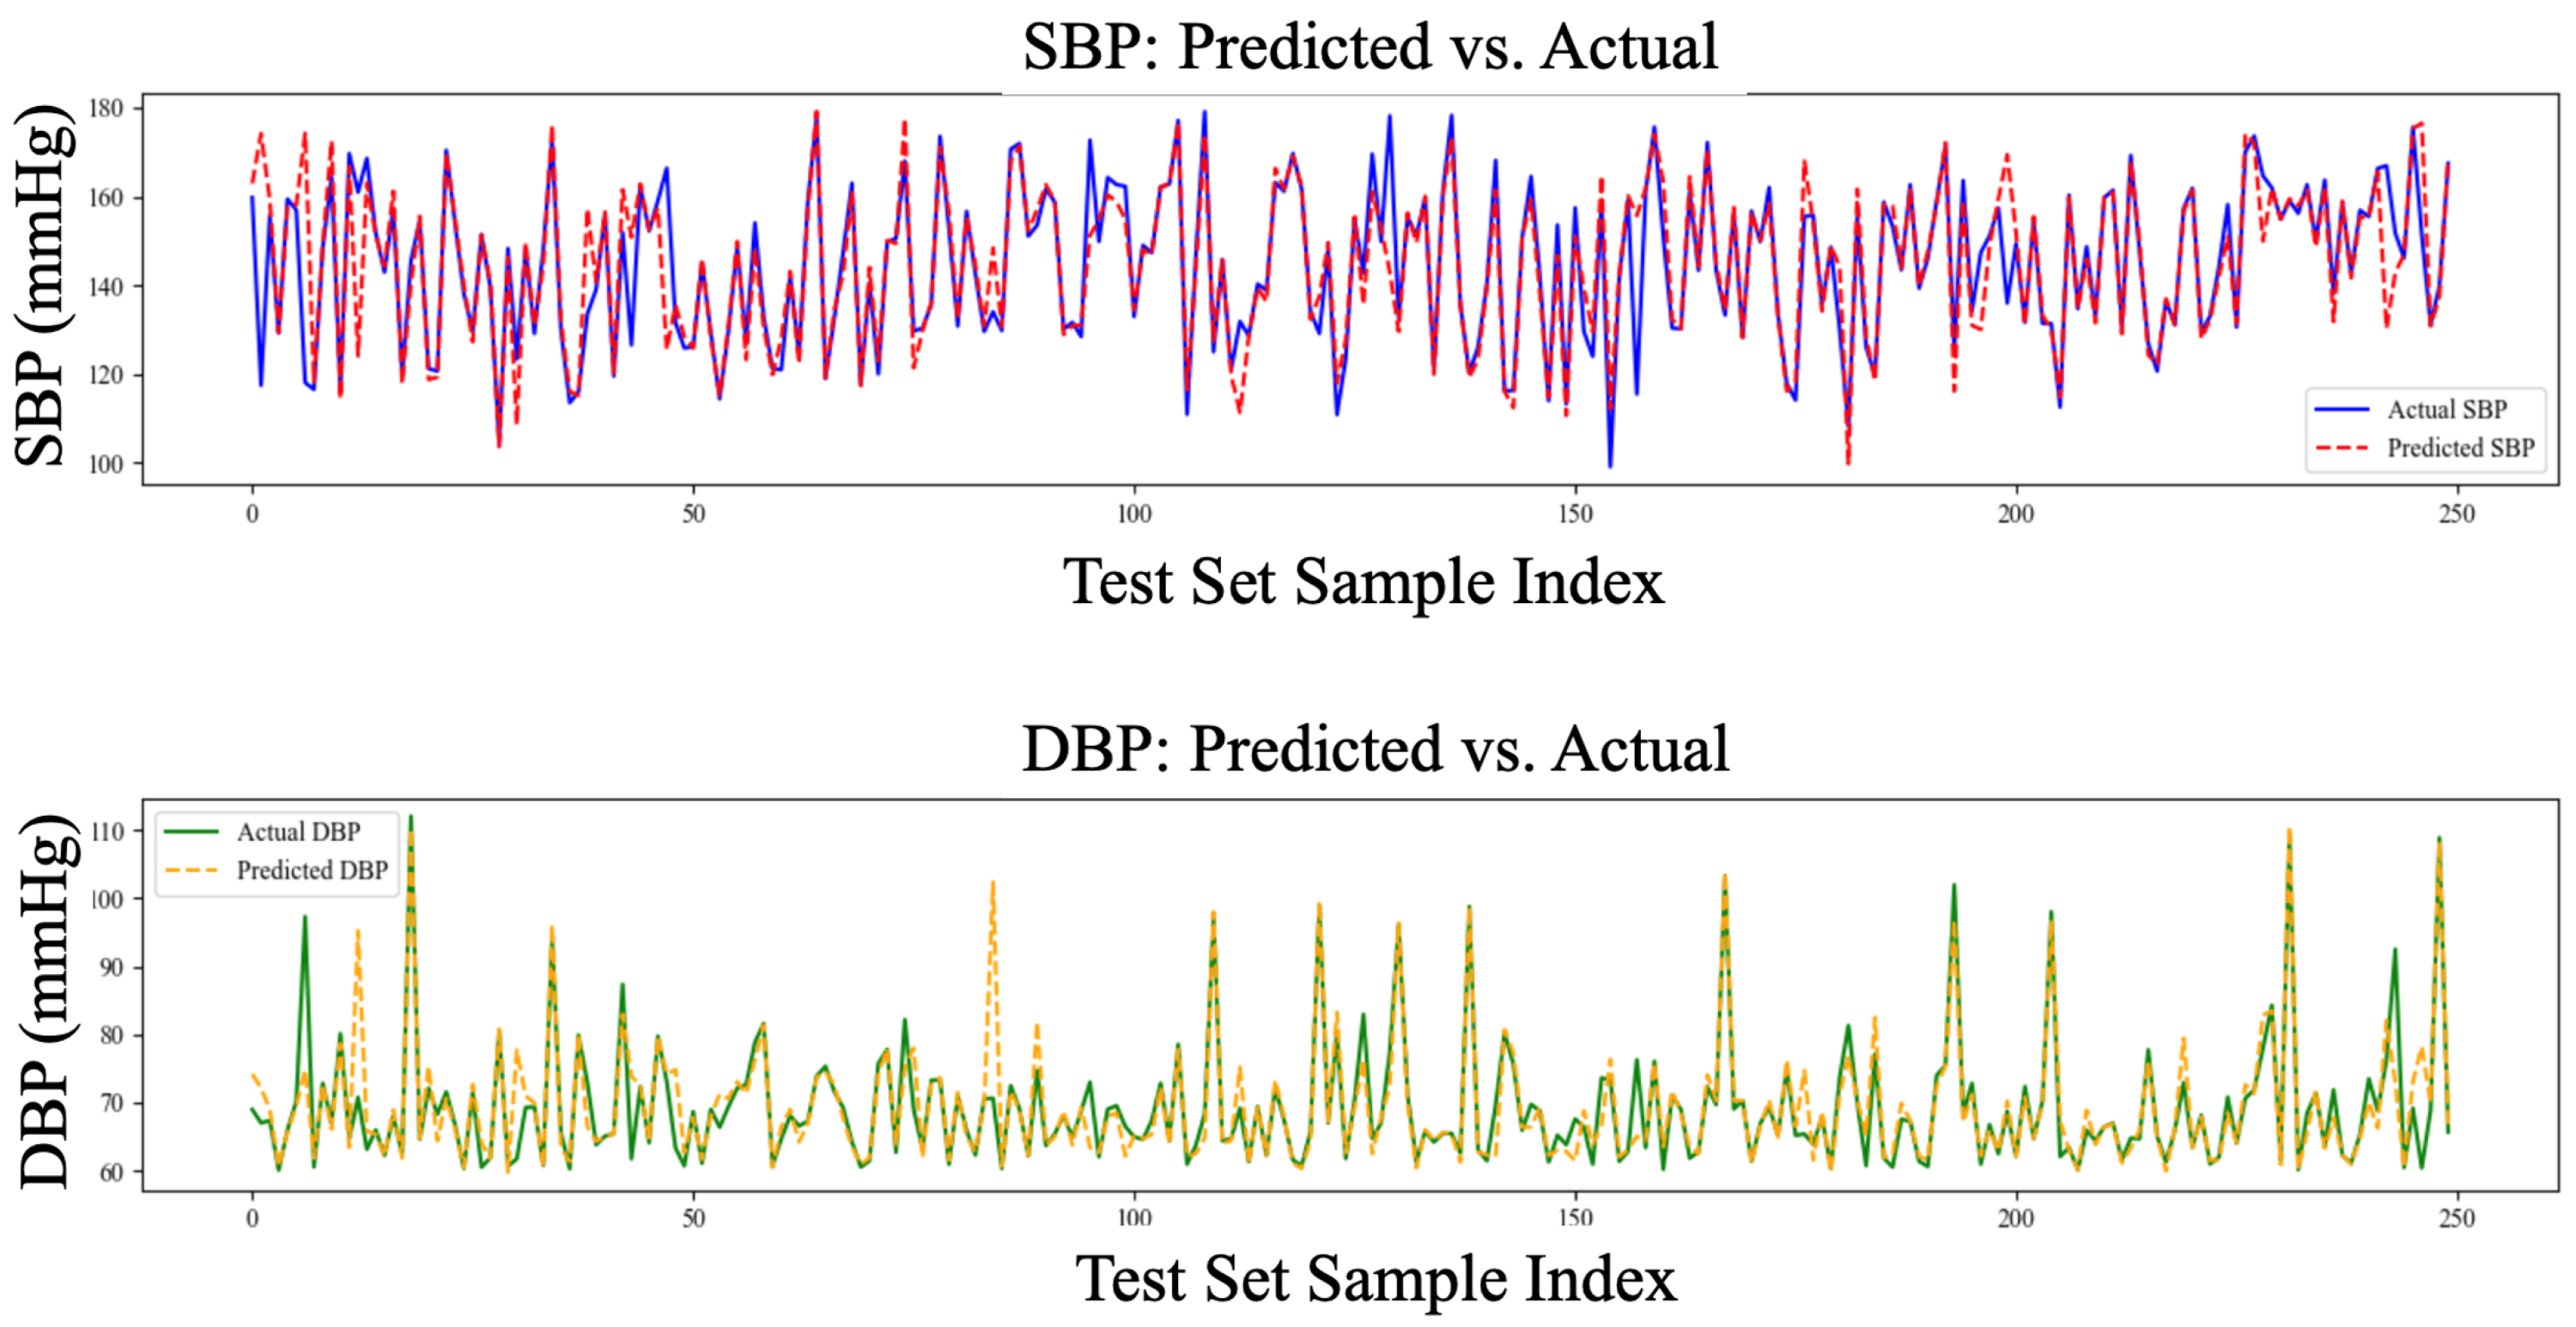
Figure 5.
cBP-Tnet AI Model SBP (Test) Predicted vs. Actual Plot, r=88.5%.
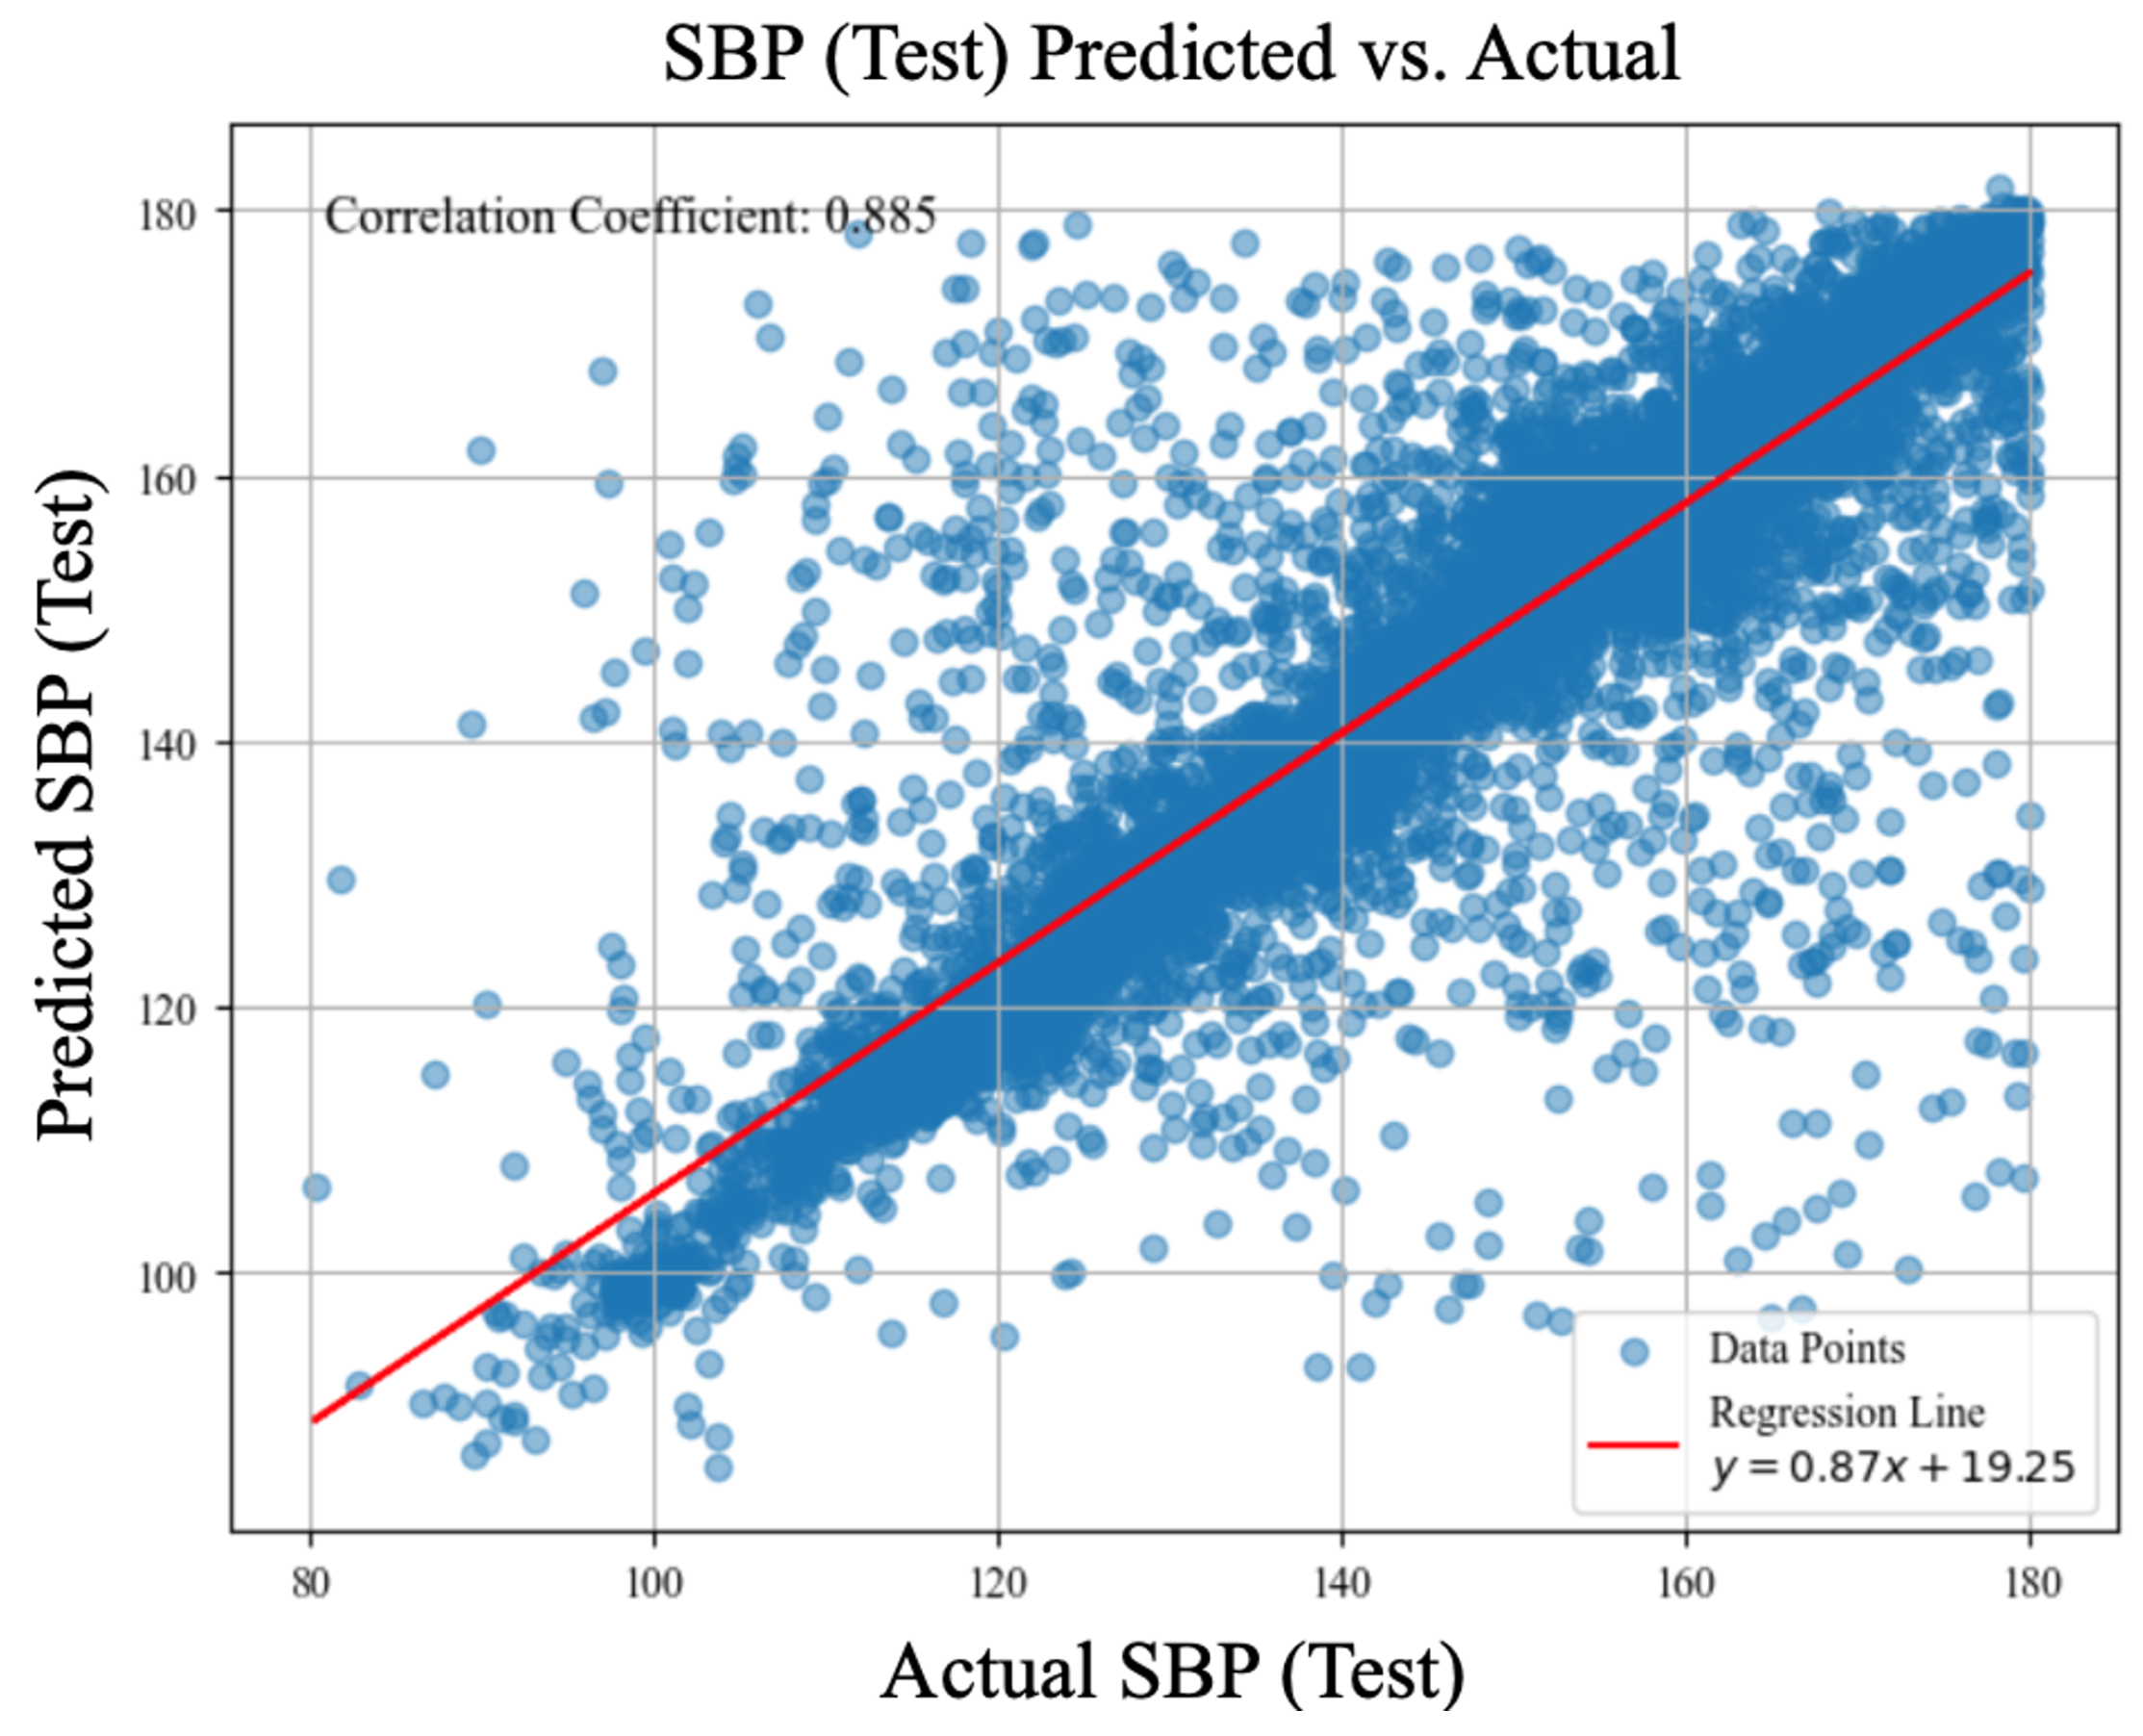
Figure 6.
cBP-Tnet AI Model DBP (Test) Predicted vs. Actual Plot, r=87.4%.
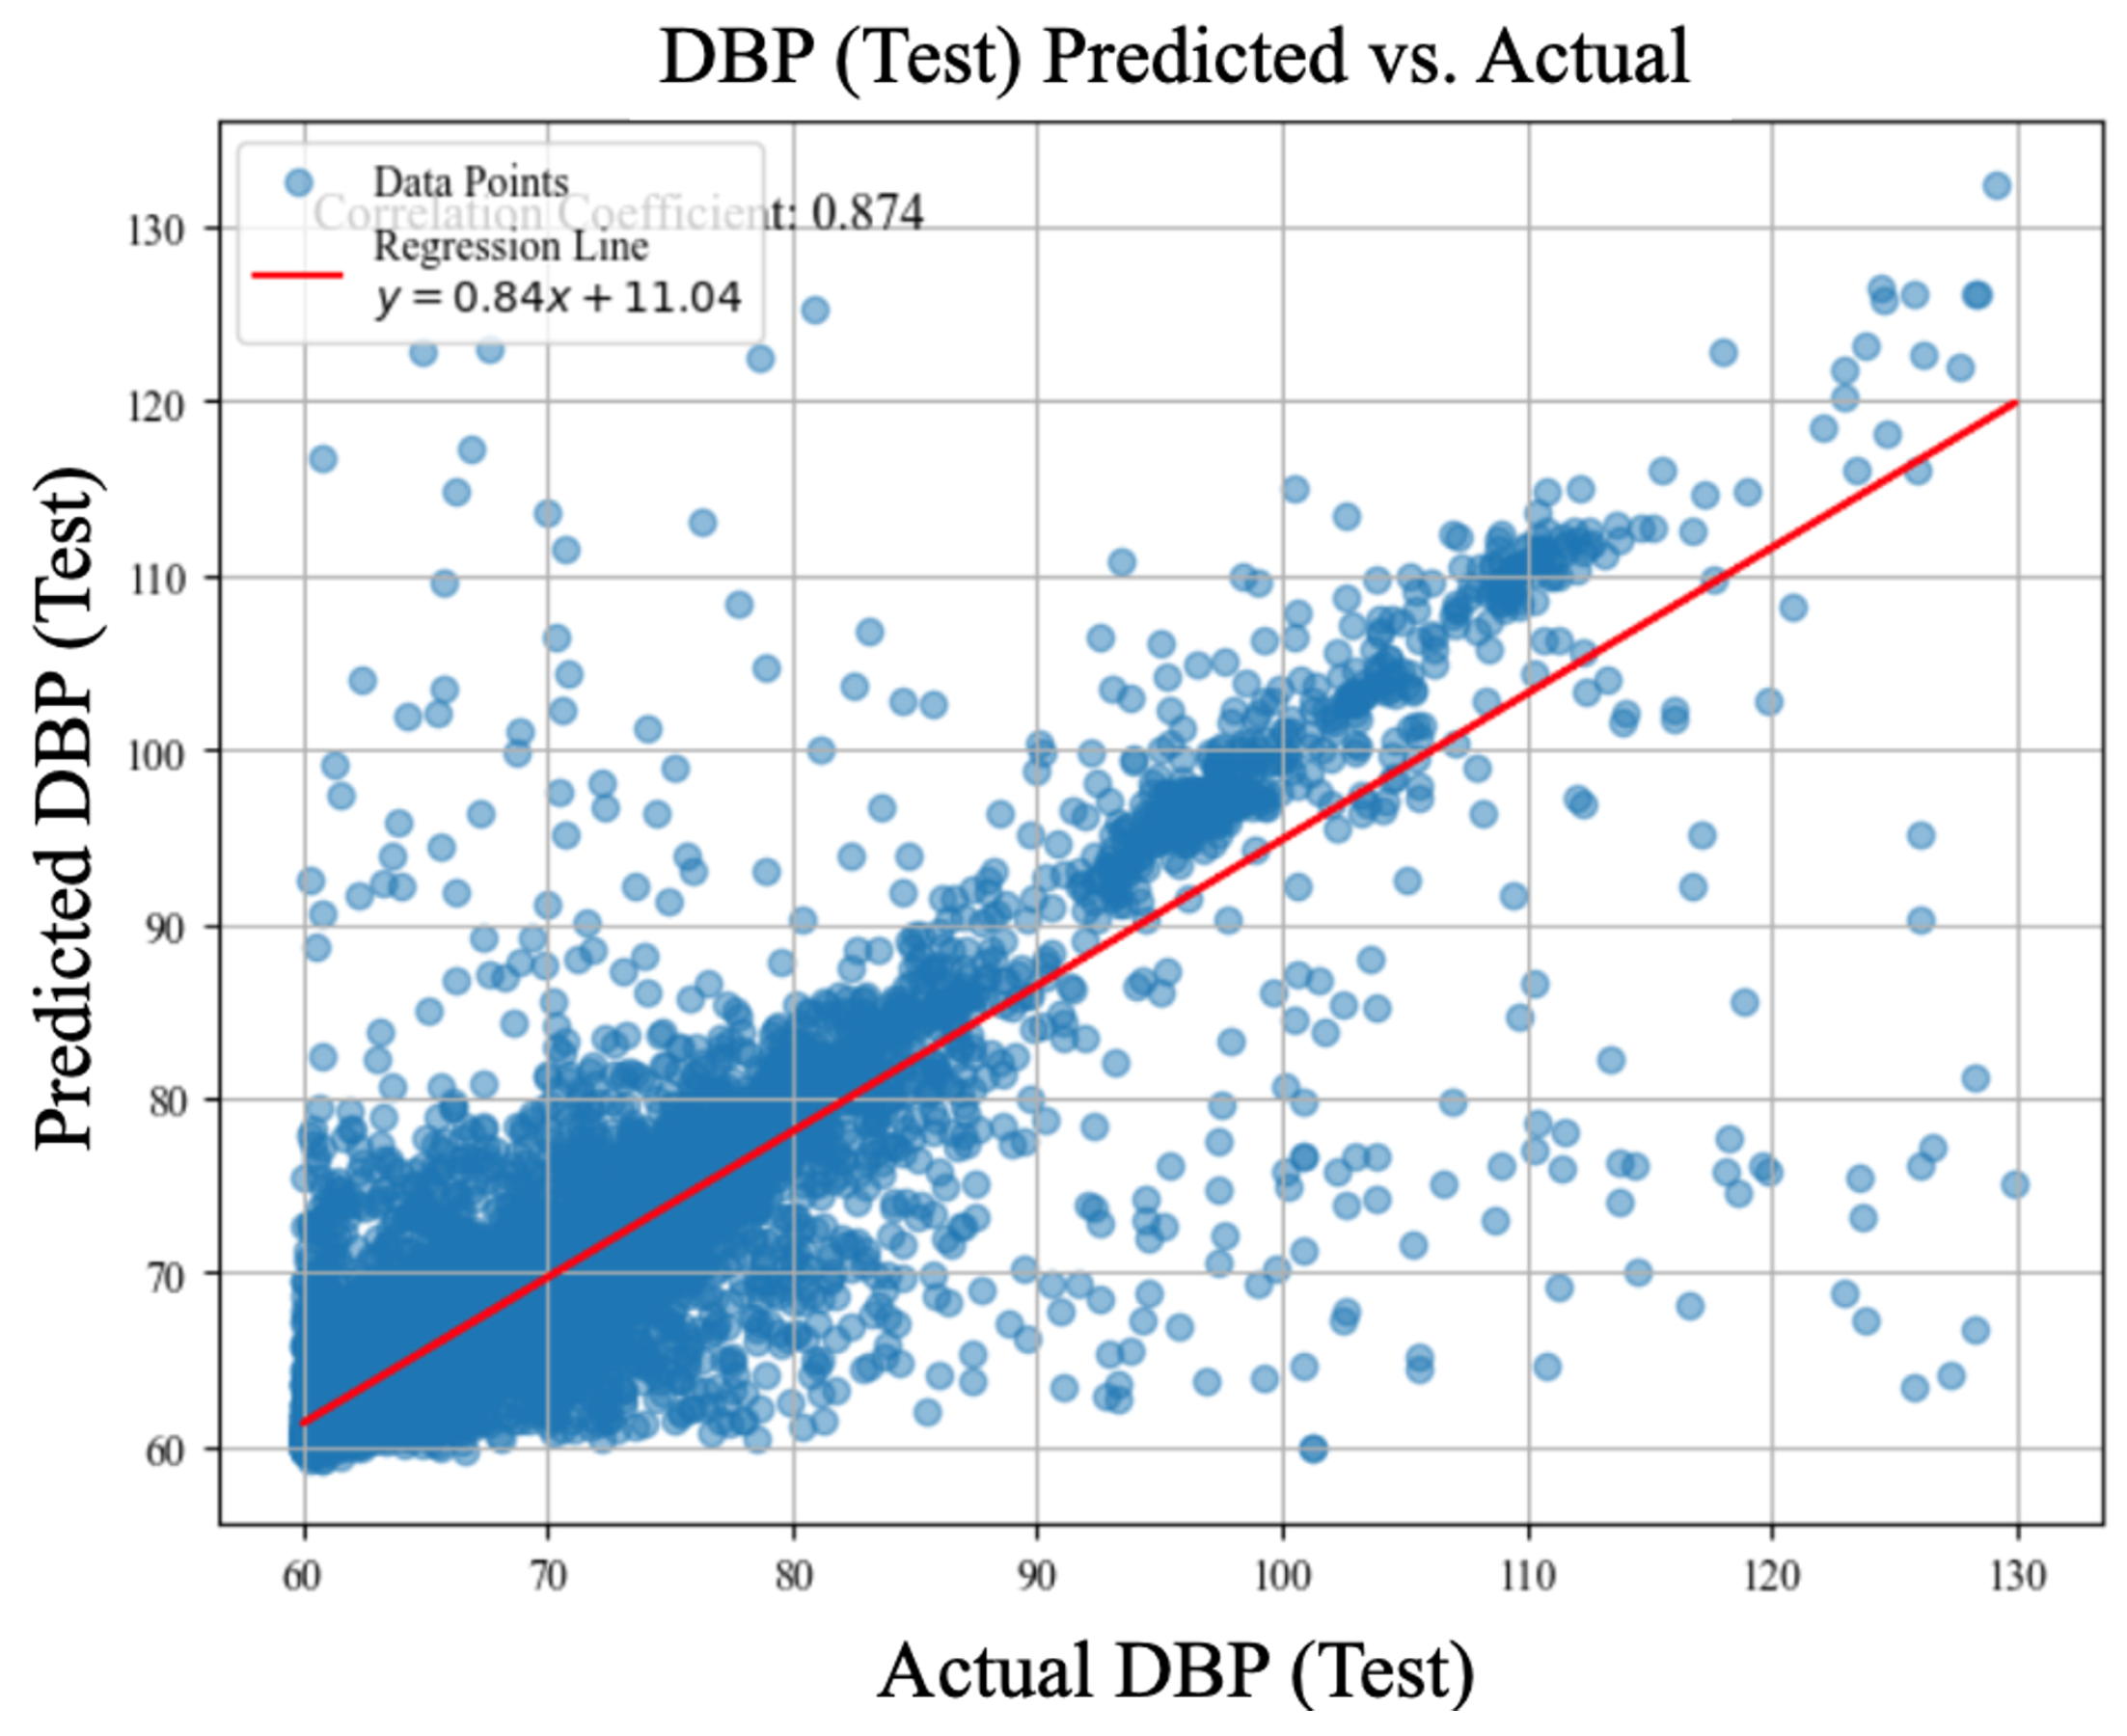

Table 1.
Leave-One-Subject-Out (LOSO) Experiments (2-s Window Raw Signal, Base Model)
| LOSO Experiments | Systolic Blood Pressure (MAE, mmHg) |
Diastolic Blood Pressure (MAE, mmHg) |
|---|---|---|
| cBP-Tnet (raw PPG only) | 5.72 | 3.09 |
| cBP-Tnet (raw PPG + PPG′) | 5.08 (▾11.24%) | 2.79 (▾9.55%) |
| cBP-Tnet (raw PPG + PPG′ + PPG′′) | 5.00 (▾1.56%) | 2.75 (▾1.43%) |
| cBP-Tnet (raw PPG + PPG′ + PPG′′ + Adaptive Kalman Filter) | 4.95 (▾1.06%) | 2.80 (▾1.56%) |
| cBP-Tnet (raw PPG + PPG′ + PPG′′ + Adaptive Kalman Filter + SBP/DBP Outlier Removal) | 4.81 (▾2.69%) | 2.38 (▾14.84%) |
| cBP-Tnet (raw PPG + PPG′ + PPG′′ + Adaptive Kalman Filter + SBP/DBP Outlier Removal + Signal Synchronization) | 4.80 (▾0.29%) | 2.35 (▾1.30%) |
| cBP-Tnet (raw PPG + PPG′ + PPG′′ + Adaptive Kalman Filter + SBP/DBP Outlier Removal + Signal Synchronization +Data Augmentation) | 4.71 (▾1.85%) | 2.34 (▾0.43%) |
Table 2.
cBP-Tnet AI Model Hyperparameter Tuning/Analysis
| cBP-Tnet Hyperparameter Tuning/Analysis |
h | N | grad clip |
SBP MAE (mmHg) |
DBP MAE (mmHg) |
||
|---|---|---|---|---|---|---|---|
| cBP-Tnet (Base) Model | 128 | 4 | 8 | 0.05 | 4.0 | 4.71 | 2.34 |
| (A) | 64 | 7.25 | 3.72 | ||||
| 256 | 5.03 | 2.55 | |||||
| (B) | 2 | 6.02 | 3.15 | ||||
| 8 | 4.75 | 2.36 | |||||
| (C) | 6 | 4.77 | 2.42 | ||||
| 10 | 4.76 | 2.37 | |||||
| (D) | 0.00 | 4.74 | 2.37 | ||||
| 0.10 | 4.87 | 2.46 | |||||
| (E) | 0.0 | 145.43 | 69.72 | ||||
| 8.0 | 4.75 | 2.36 | |||||
| cBP-Tnet (Extended) Model | 128 | 4 | 8 | 0.05 | 4.0 | 4.32 | 2.18 |
Table 3.
Deep Learning-Based Related Methods to Estimate Blood Pressure with Automatic Photoplethysmogram Feature Extraction Mechanisms
Table 3.
Deep Learning-Based Related Methods to Estimate Blood Pressure with Automatic Photoplethysmogram Feature Extraction Mechanisms
| Related Deep Learning Methods | SBP (MAE, mmHg) | DBP (MAE, mmHg) |
|---|---|---|
| ResNet | 9.43 (r=N/A) | 6.88 (r=N/A) |
| MTFF-ANN | 5.59 (r=0.92) | 3.36 (r=0.86) |
| TCN-CBAM | 5.35 (r=0.80) | 2.12 (r=0.60) |
| cBP-Tnet | 4.32 (r=0.89) | 2.18 (r=0.87) |
Disclaimer/Publisher’s Note: The statements, opinions and data contained in all publications are solely those of the individual author(s) and contributor(s) and not of MDPI and/or the editor(s). MDPI and/or the editor(s) disclaim responsibility for any injury to people or property resulting from any ideas, methods, instructions or products referred to in the content. |
© 2025 by the authors. Licensee MDPI, Basel, Switzerland. This article is an open access article distributed under the terms and conditions of the Creative Commons Attribution (CC BY) license (http://creativecommons.org/licenses/by/4.0/).
Copyright: This open access article is published under a Creative Commons CC BY 4.0 license, which permit the free download, distribution, and reuse, provided that the author and preprint are cited in any reuse.


