
Submitted:
02 April 2025
Posted:
02 April 2025
You are already at the latest version
Abstract
The energy transition from fossil fuels to renewables is part of a more general ecological transition that the European Union (EU), among others, is actively pursuing. Despite significant progress, Italy lags far behind the EU's target of generating 55% of its electricity from renewables by 2030, compared to 36% today. Renewable energy is a very spatially dispersed form of energy, and land-use change is a particular issue that needs to be addressed if a significant number of renewable energy installations are to be located on agricultural land. In agrivoltaic systems, energy production is coupled with food production on the same land unit, thus ensuring crop yields. In this way, the conflict between energy and food may be reduced, but the impact of these installations on the landscape remains, and community discontent and unrest are on the rise. These land-use conflicts and impacts recall the need for rigorous spatial planning which must play a leading role in managing this transition. Prior to planning, the availability of resources should be known and evaluated. To this end, a GIS-based analysis was applied, taking into account a set of criteria in a three-step approach: a) the entire protection system identified by the Apulian Landscape Plan was used to obtain a Constraint Map; b) the agricultural land use and capability classification together with land slope and exposure was used to obtain the Availability Map; c) agricultural land conversion scenarios were developed to quantify the achievable capacity of agrivoltaic installations.Pressures undermining the agricultural sector leading to the conversion of land to other uses. The energy sector should be a leverage factor to promote rural development and support agriculture, not the other way around.
Keywords:
land-use planning
; renewable energy
; GIS (Geographic Information System)
; land selection criteria
; land capability
; landscape
; energy transition
1. Introduction
The European Union aims to reduce greenhouse gas emissions by 55% from 1990 levels by 2030 [1]. The ecological-energy transition refers to a comprehensive climate change mitigation strategy that involves a shift from fossil fuels to renewable energy sources (RES), which directly entails a technological shift but also has deep economic, social, cultural, environmental, political and, crucially, large land implications [2,3,4].
RES generally include biomass, hydropower, geothermal, wind and solar, with so-lar being the most abundant and accessible [5]. The provision of renewable energy through photovoltaic (PV) installations is considered one of the best ways to accelerate the energy transition due to the low and competitive unit cost of energy production achieved by this technology today [6] such as photovoltaic (PV) arrays which convert sunlight into electrical energy [7]. While the number of PV installations is growing rapidly around the world, their implementation often leads to land-use conflicts with food and energy production [8]. There are also landscaping issues with PV systems, which are often high-capacity systems with large land footprints [9,10]. These land-use conflicts and landscape impacts recall the need for rigorous spatial planning approaches [11].
1.1. The Renewable Energy Transition in Italy
Italy is trying to find a realistic path that will lead to a transition to renewable energy in line with the European Union (EU) targets set out in the Fit For 55 (2021) and Repower EU (2022) packages. The National Energy and Climate Plan [12] sets a target of 55% of electricity from renewable sources by 2030, and net climate neutrality by 2050. Looking at Italy's annual energy production (totaling over 320 TWh), more than a third (36%) is now generated by renewable energy sources and PV has a share of 28% of electricity production from renewable sources [13]. Of the total target of 131 GW of renewables by 2030, 80 GW is expected to come from solar [14]. At the end of 2022, Italy had a cumulative capacity of 25 GW, which means that to meet its 2030 target, installed solar power will need to grow by 55 GW in just a few years [15]. Despite significant progress, Italy is seriously lagging behind in meeting its 2030 renewable energy target.
1.2. Agrivoltaic as a Possible Solution to the Land-Energy Conflict
Agrivoltaics (AV) is a system that combines renewable energy production with agricultural activities and has emerged as a novel approach to potentially increase land productivity while addressing climate change [16]. A different terminology can be used to refer to AV such as “dual use”, “co-location”, “Agri-PV”, “Agro-PV”, “agrivoltaics”, “agri-solar”, “solar sharing”, depending on the region and specific applications around the world [17].
First conceived in 1982 [18], in the AV solution crops were proposed as an additional income to utilize the previously neglected area below solar panels. Since the revival of AV in Europe in 2011 [19], crop production under AV has become an increasingly important issue. By safeguarding crop yields, large areas of agricultural land can be made available for sustainable energy production while maintaining their agronomic value. Various benefits can be associated with AV systems, such as providing shade and protecting crops from extreme weather conditions (heat waves, for example), creating a beneficial microclimate that reduces temperature, evapotranspiration and wind speed under the system [20]. This can result in potential yield benefits, particularly as system size increases. In addition, agrivoltaic systems can be integrated with rainwater harvesting systems and used to power on-site facilities [21,22,23,24]. By creating these synergies, AV systems could increase crop resilience to climate change [25].
Overall, the use of AV is very diverse and there are several farming practices that can be combined with different AV systems [24]. These applications include horticulture, orchards, viticulture, arable farming and permanent grassland [26]. If well designed, AV, also has the potential to conserve biodiversity on the uncultivated land and restore ecosystem services such as regulating climate, water, soil and air quality [27].
1.3. Agrivoltaic and Social Acceptance on Renewables
As with other renewables such as wind turbines, the introduction of conventional PV into the landscape is often met with resistance and opposition from local communities and several stakeholders [28,29]. Community acceptance of PV is related to local stakeholder acceptance, and in general, as RES penetration rates increase and utility-scale systems become more intrusive in the landscape, local communities become less accepting, despite positive opinion from the general public. Although social opposition to PV is usually directed at ground-mounted PV systems, AV systems may face similar opposition due to their similarities to conventional PV, especially in terms of landscape impact. The different types of agrivoltaics systems, each with its own technical, structural and configurational characteristics, can profoundly change the characteristics and features of the landscape in a number of ways. These changes, in turn, have led to concerns and public opposition even to these agrivoltaic systems [30]. The reasons for this opposition can be diverse, ranging from soil sealing to agricultural land use change, from threats to biodiversity to impacts on landscape and cultural heritage.
On the other hand, agrivoltaics can also expect greater rates of public acceptance compared to conventional PV due to the spatial continuity of agricultural land use and the potential increase in crop yields [8]. Beyond the technical benefits that could increase energy generation and food production, AV technology can also bring potential economic and social benefits to farmers [26] through the diversification and increasing of incomes [31,32] resulting from the sales of both electricity and agricultural products [33] as well as the possibility of expanding employment opportunities [34].
1.4. Land Eligibility as a Preliminary Analysis
In order to promote the development of agrivoltaic systems, it is important to establish land use policies that can regulate their implementation, address landscape change, assess eligible areas and minimize any potential impacts [8].
While common for PV and wind turbine, there are few studies on site suitability specific to AV. In Japan, a Geographical Information System (GIS) study on AV has identified 'good AV practices' and provided a case study of the town of Ine in Kyoto Prefecture [35]. However, only marginal farmland was selected for AV expansion, with no additional geographical or socio-economic input. A GIS-based study of Canada's AV potential found that converting 1% of existing available farmland to AV systems could be enough to meet Canada's energy needs [36]. Elkadeem et al. [37] described an AV-specific GIS multi-criteria decision analysis (MCDA) method for the Swedish territory, based on a range of criteria including irradiance, precipitation, water stress and seasonal evapotranspiration, which identified 8.6% of the country's total area as suitable for AV systems. A similar approach has been undertaken for Gunungkidul Regency in Indonesia [38]. Criteria such as climate, land use, ease of connection to the power grid, and nearby water resources were integrated with a number of other constraints. Recently, Fattoruso et al. [39] developed a methodological framework for an advanced agrivoltaics land eligibility analysis at a regional level, in Italy, based on a spatial multicriteria analysis. The challenge was to identify the many factors that can affect land eligibility for agrivoltaics systems and combine them to maximize energy and agricultural yields while minimizing the impact on the surrounding landscape. In 2025 Reher et al. [40] presented a multi-attribute decision making (MADM) analysis to identify suitable areas for AV systems in Flanders, where commercial AV systems are beginning to be deployed. They began by identifying techno-agro-socio-economic criteria applicable to AV land suitability, assigning weights to the main evaluation criteria and defining restriction criteria for areas where AV would be unsuitable. Dere et al. [41] utilized a systematic decision-making methodology to select and review potential sites for AV investments and generated suitability maps for five cities in Turkey.
1.5. The Urgent Need for Land Use Planning and Policy
To date, there are few policies in the European Union that specifically address AV systems (as they differ significantly from conventional PV systems), while the potential, but likely landscape impacts are often ignored [42].
The use of AV in Italy is gradually increasing and is finally being recognized as a relevant strategy for achieving decarbonization targets. In March 2022, the Ministry of Ecological Transition, in coordination with several other research organizations has published national guidelines on agrivoltaics [43]. This document provides information on the criteria for classifying photovoltaic systems as 'agrivoltaic' and distinguishes between ‘standard’ AV and ‘advanced’ AV, the latter being eligible for government incentives. These guidelines are based on Italian Law no. 108 of 29 July 2021, which defines AV as ‘photovoltaic systems that adopt solutions aimed at preserving the continuity of existing agricultural and livestock activities at the installation site’. Italian regions hold the authority to assess appropriate solar developments, also taking into account the proliferation of large ground-mounted PV plants over the past two decades [44]. As a result, the regulatory framework for the authorization of AV installations in Italy today is an unclear patchwork of national and regional regulations. The Italian Ministry for the Environment and Energy Security (MASE) is incentivizing AV through the National Recovery and Resilience Plan (PNRR), which aims to install at least 1.04 GW of AV by June 2026.
1.6. Objectives of the Work
In this study, as a first step, a GIS-based territorial analysis was carried out to identify and quantify eligible land areas for the installation of renewable energy systems in the Apulia region (southern Italy), taking into account a series of specified land protection criteria, restrictions and constraints as provided by national and regional legislation. This procedure has apparently never been applied before, at least on a regional scale, and should be considered of preliminary importance for any possible future land-use planning. It answers an essential and unavoidable question: how much land do we have potentially at our disposal for the installation of renewable energy systems, while safeguarding the land that, for various reasons, is the most sensitive or valuable and must therefore be excluded?
The second step, following on from the first, focused specifically on AV systems that, for obvious reasons, can only be installed on agricultural land. The unconstrained agricultural area that could therefore be used for AV systems and that also met certain selective requirements was calculated. The applied criteria were related to land capability and certain technical feasibility characteristics in order to quantify the area of potential land specifically available for AV systems.
Finally, in the third phase, it was examined what could be the effective contribution of the Apulia Region and its provinces to the fulfillment of the so-called "burden share", i.e. the total capacity for AV installations, assuming that a certain percentage of agricultural land would be dedicated to this type of energy use.
2. Materials and Methods
2.1. The Study Area
The study area is the Apulia region in the south-eastern Italy. Apulia is divided into six provinces. North to South: Foggia (FG), Barletta-Andria-Trani (BT), Bari (BA), Taranto (TA), Brindisi (BR), and Lecce (LE) as shown in Figure 1.A.
Its territory is mostly flat (53% of surface <300 m above sea level), rather hilly (45% of surface between 300-600 m above sea level) and very little mountainous (only 2% of surface >600 m above sea level), making it the least mountainous region in Italy. This characteristic, together with its ideal sunshine regime, makes the region particularly suitable (in general spatial terms) for solar energy production.
In Italy, average annual insolation varies from 3.6 kWh/m2/day in the Po Valley (northern Italy) to 4.7 kWh/m2/day in central-southern Italy and 5.4 kWh/m2/day in the Sicilian region (extreme south). The highest radiation levels are detected in the center-south of the country. Particularly favorable geographical areas for high radiation intensity are the southern coast of Sicily, southern Sardinia and, in the case of Apulia, the Salento peninsula. In these favorable areas it is possible to harvest up to 2,000 kWh/m2 per year, while in the rest of Italy the figure ranges from 1,750 kWh/m2 in the Tyrrhenian belt (Italian west coast of the Adriatic Sea) to 1,300 kWh/m2 in the Po Valley or in the Alps (northern Italy). The climate is typically Mediterranean with semi-arid summers and mild winters.
2.2. Past and Future of Solar Energy in the Apulia Region
By 2030, the Apulia region will need to achieve an additional 7.4 GW of installed renewable energy capacity compared to 2021. This is the target defined at the national level policy (national ministerial decrees dated June 21, 2024). To achieve these impressive results on time, it is necessary to rely on high-capacity, utility-scale PV systems. This inevitably means PV installations with a very large panel surface area. However, in the last two decades the Apulia region has seen already a fast increase in the number and size of PV plants. With reference to the 2021 figures [46], the national record in terms of installed power is indeed in Apulia, with 2,900 MW (13.4 % of the national total); the same region also has the highest average plant size (53.4 kW) and the highest electricity production (3,839 GWh). In addition, from 2010 onwards, the majority of these installations (70%) have been implemented with PV systems built directly ‘on the ground’, i.e. completely covering the soil, leading to a worrying conversion of land use from agriculture to energy. This is now considered unsustainable and no longer allowed [47]. When it comes to developing new PV installations in agricultural areas, the only acceptable solution is now AV systems. In any case, PV installations in the Apulia region have been more ‘aggressive’ compared to other Italian regions, both in terms of the absolute number and size of PV systems, and in terms of their relative incidence on the land, i.e. surface density (Figure1.B).
This kind of implementation has led to general discontent, public protests, conflicts, a crisis of social acceptance and an ideological dispute between environmental organizations. On the one hand, there is the need to meet the ambitious targets set by the EU strategy to reduce net emissions by at least 55% by 2030 compared to 1990 levels. On the other hand, the significant increase in the number and size of renewable energy installations requires the assessment and mitigation of their impacts on the landscape, on the ecological and biodiversity features of the land, and on threatened cultural and historical heritage values.
2.3. The National and Regional Regulatory Framework on Renewable Energy Installations
From October 28, 2024 to November 16, 2024, the Apulia region held a public consultation to collect opinions and suggestions on the Draft Law no. 222 of October 23, 2024, aimed at identifying eligible, available and unavailable areas for the installation of renewable energy systems (considering the implementation of two national ministerial decrees dated November 8, 2021 and June 21, 2024, respectively).
With regard to RES, the Italian regions are required to identify the following types of areas
- Eligible areas: areas whose characteristics are fully compatible with the installation of renewable energy systems; for example, areas for the reclamation of polluted sites, abandoned quarries and mines, areas adjacent to railroads and within airports, agricultural areas within a buffer of 500 meters from industrial areas, areas within industrial zones, areas adjacent to the highway network, etc. For these areas, there is an expedited and simplified permitting process for the installation of renewable energy systems.
- Unavailable areas: areas whose characteristics are incompatible with the installation of renewable energy systems by taking into account a range of protection criteria, i.e. restrictions, limitations and constraints.
- Available areas: include areas other than the first and second categories previously defined, in which it would be possible to install the systems by applying the ordinary authorization regimes.
2.4. The Methodological Approach
2.4.1. Agricultural Land Use
The dynamics of agricultural land use has been analyzed over a period of almost forty years. For this purpose, the data of five consecutive agricultural censuses (1982, 1990, 2000, 2010 and 2020) were processed [48]. The total and utilized agricultural area (TAA and UAA, respectively) were considered together with the so-called unutilized agricultural area (NUA). The NUA includes all the land on the holding which, for whatever reason (economic, social or other), is not used for agricultural purposes. However, it is land that can be used for agriculture with ordinary and normally available means.
If the NUA is significant and shows an increasing trend over time, this could re-duce the pressure from an increasing rate of renewable installations on agricultural land. Conversely, if the NUA tends to shrink over time, this means that the productive pressure on agricultural land will increase and thus the competition for alternative uses will be greater. In other words, NUA can be thought of as a kind of "land buffer" with respect to potential land use changes. This is just a hypothesis that needs to be tested.
2.4.2. Restriction Criteria and Estimation of Available AV Agricultural Land
The eligible areas for renewable energy sources have been selected according to the criteria presented in the Apulian Landscape Plan (ALP). [43]. The ALP aims to promote sustainable socio-economic development and a mindful use of the regional territory, also through the preservation and recovery of specific aspects and characteristics related to the social, cultural and environmental identity of the region, to be taken into account in all processes related to landscape planning and management. Specifically, ALP identifies a composite set of territorial values to be protected, and the combination of all these constraints forms what is known as the regional 'protection system'. In particular, the above-mentioned Apulian draft law no. 222 of 23 October 2024 considers this 'protection system' as the set of constraints to be taken into account in the definition of areas eligible for the installation of renewable energy systems.
This "protection system" consists of three different categories (each forming a subsystem), listed in Table 1: a) areas of ecological and environmental importance; b) areas of anthropological, cultural and historical relevance; c) areas of hydro-geomorphological vulnerability.
Correspondently, in this study we considered as constrains the complete list of the protection system components identified by the ALP. Moreover, we decided to consider as additional constraints the areas defined in the Hydro-Geological Plan prepared by the River Basin Authority (RBA) and identified as areas of high and medium hydro-geological and geomorphological hazard, also listed in Table 1. These latter areas partially overlap the hydro-geomorphological structure identified by the ALP ‘protection system’.
The GIS software ArcGis 10.1 was used to spatially process all the geodata for the entire Apulia region, reported at the provincial level (FG, BT, BA, TA, BR, LE).
Three methodological steps were taken to process the spatial data. First, a ‘Constraint Map’ was created. This map shows which areas are theoretically eligible for renewable energy installations. It was produced by applying the 'union' function of all the protected and constrained areas listed in Table 1. The sets of applied criteria are intended as exclusion/inclusion criteria. Each criterion is represented by a digital map, formalized by a Boolean operator applied to the vectors of the map. This ‘union’ function combines multiple sets into a single set that contains all unique elements from the given sets. It ensures that there are no duplicate values in the final set (Figure 2 A).
In the second step of the analysis, specific criteria for AV installation were applied. To this end, it was preliminary necessary to select only and exclusively agricultural land use types from the Land Use Map (LUM) [49] and intersect them with the Constrain Map. It was then assumed that the best (most fertile and productive) agricultural land should not be used for AV installations but only the land with a relatively lower production potential. In this way, the importance of preserving farmland where valuable, typical and certified crops are grown was emphasized. Accordingly, the Land Capability Classification (LCC) [50] was adopted to evaluate the productive potential of the agricultural land.
LCC was developed by the USDA Soil Conservation Service in 1961 and adopted by the Food and Agriculture Organization (FAO) in 1974. The LCC system identifies eight soil classes with increasing restrictions on specific uses. The first four classes show the capability for agriculture, while from the fifth to the seventh class the capability is limited to pasture and/or forest. In the eighth class, no human activity is possible. Class I and II lands are those with better agricultural production potential and fewer restrictions; therefore, they were not further included in the analysis. On the other hand, Class III and IV lands are more restricted in some way for agricultural use and were therefore included in the analysis. In short, only agricultural classes belonging to Class III and IV of the LCC were extracted and used for the subsequent processes. It was also decided to consider the LCC classification with respect to agricultural land use without irrigation support for crops.
Other selected AV feasibility criteria considered in the analysis were the slope of the terrain and its orientation (Figure 2.B). The terrain slope affects both the optimal conditions for orientation and inclination of the PV modules and the technical feasibility of the PV plant. As reported in the literature, the maximum slope that makes installation technically feasible is generally set at 15% [51,52].
As slopes become steeper, the installation of PV systems raises issues of soil erosion and foundation instability, making installation more difficult and costly. Considering the geographical orientation (azimuth) of the AV system, its effect is combined with the slope and greatly affects the technical feasibility of the plant; for low slopes the orientation is irrelevant, but over steeper slopes, the orientation of the site is a constraint and only in south-oriented terrains can be considered.
Large, high-capacity, utility-scale PV systems can only be installed on flat or low-slope land conditions (< 5%); when slope is limited and still acceptable (5-15%), solar installations should be built on south-facing land. Therefore, it was assumed that the available areas should meet one of the following conditions: a) land with a slope ≤ 5%; b) land with a slope between 5 and 15% facing south (between 135 and 225 angular degrees).
To obtain the Availability Map, the considered land capability classes, together with land slope and orientation constrains, were processed by using an ‘intersect’ function (Figure 2.B). This function calculates the overlapping area of all the three considered conditions, i.e. the areas in common to all features.
The final third step was dedicated to the development of simple scenarios reflecting a given land allocation for AV systems on a regional scale. In particular, it was hypothetically assumed that 0.5 and 1% of the agricultural area (a fraction of the UAA) could be dedicated to AV installations. This was necessary to verify the possibility of achieving the target defined at the national policy level with respect to the Apulia region.
3. Results
3.1. Solar Energy Time Trend
It should be emphasized that the Apulia region has already seen a significant installation of PV systems (as well as wind turbines) in recent years; the latest target for 2030 adds another large number of installations to an already problematic past in terms of agricultural land occupation and conversion. The pace of this PV development will even increase compared to recent years. Figure 3 clearly shows how the two reported lines (the national and the regional line, respectively) see a sudden increase in their slopes starting in 2022, i.e. at the beginning of the period related to the National Energy Plan [12].
From 2022 onward, the figures in Figure 3 are forward-looking and identify a period in which 10 GW of PV installations per year are expected to be developed nationally and 1 GW per year regionally. As can be see fron the same Figure 3, Apulia contributes about 10% of the national PV installation capacity quite regularly over time.
Looking at the spatial density of PV systems, expressed as the ratio of installed PV capacity to surface area (kW km-2), Apulia has always had the highest concentration among all the other regions, therefore well above the national average. This condition has been consistently confirmed over the past decade (as shown in Figure 4), but even earlier. Looking at 2022, the PV spatial density in the Apulia region was nearly twice as high as in Italy.
3.2. Agricultural Land Use
At the national level, the area of TAA, UAA, and NUA has declined impressively over time (Figure 5.A). From 1982 to 2020, TAA decreased by nearly 6 million hectares (more than 25%); similarly, UAA decreased by 3.3 million hectares (more than 20%) over the same period. In the Apulia region, the downward trend of TAA and UAA was proportionally less pronounced than at the national level, especially in the last 20 years, but it was still considerable, amounting to a decrease of 282 thousand hectares (about 17%) and 230 thousand hectares (about 16%) from 1982 to 2020, respectively (Figure 5.B).
The NUA values also decreased proportionally even more than the TAA and UAA values, i.e. by 66% at the national level and by almost 50% at the regional level between 1982-2020. This indicates a strong pressure on the remaining land to be cultivated in areas where agricultural land has not been retired.
In Apulia, the TAA covers 70.5% of the entire regional territory, the UAA 66.5%: both figures represent the highest values among the Italian regions. Apulia is the third region in terms of absolute TAA and UAA extension (after the two islands of Sicily and Sardinia). On the other hand, Foggia (FG, one of the Apulia province) has the largest TAA and UAA in Italy with respect to all other provinces in Italy.
It can be assumed that, on average, at least 2.5 hectares of agricultural land are needed to install a agrivoltaic system with a peak power of 1 MW. This particular value takes into account the fact that in Italy a 1 MW ground-mounted AV system occupies an average of 1.8 ha, while in Apulia it reaches 2.0 ha [46]. It follows that, as a first approximation and for the same capacity, a utility-scale AV system will have at least 25% more surface area, i.e. 2.5 ha [53]. This estimate allows an initial, purely indicative and arbitrary consideration, as developed below. If, for the sake of analysis, the entire NUA were to be allocated to agrivoltaics, what would be the actual installable capacity in the provinces and in the entire region of Apulia resulting from this calculation? Table 2 is very useful in this respect.
It could be argued that the theoretical assumption of full utilization of the regional NUA for AV systems would allow 5.7 GW of peak power to be installed, a significant amount compared to the total 7.4 GW required and to be achieved by 2030. But, as mentioned, this is only an indicative, certainly not realistic, rough and preliminary estimate.
3.3. Estimation of Agricultural ‘Available Land’
The geographical distribution of each of the three component of the ALP "protection system" along with the HGP vulnerability components are shown in Figure 6.A, B, and C, while the overall representation of all components together is shown in Figure 6.D. This last map represents what we have called the Constrain Map.
Table 3 shows the entire territorial areas of the Apulian provinces together with the constrained areas related to the “protection system” (EE, ACH and HGM).
The total constrained areas shown in Table 3 cannot be the simple sum of the three components, but the result of applying their "union" (a specific GIS operator), which takes into account any overlapping areas. The total regional overlapping area (areas where the different constraints are jointly applied) is the 64%. Considering the whole Apulia region, the total constrained area is about 75% of the entire territory. The highest relative constrained area is recorded for LE (79%), while the lowest for both the provinces of BR and BT (71%). ACH area is almost twice as large as the EE and HGM areas, representing the 80% of the total constrained area. Concerning the provinces BR and LE, it is noteworthy that the EE and HGM areas are quite low, while the ACH area is high in relation to the total constrained area. Differently, the FG province shows a high relative incidence of HGM vulnerable areas.
Once the Constrain Map was obtained, the first stage of geospatial processing was completed (Figure 2.A). The second step is the following.
Table 4 shows the allocation of agricultural land (extracted from the LUM) in relation to the Land Capacity Classification (LCC).
The Constrain map was then intersected twice, first with the regional LUM to select only areas of agricultural use. From the areas thus identified, a second intersection was made with the LCC map, further selecting those areas that met the AV feasibility criteria, i.e. land slope and exposure. This second stage of geospatial processing (Figure 2.B) allowed to obtain the final Availability Map.
The area of all agricultural classes (from I to IV) covers about 73% of the total regional territory. A certain diversity can be observed at the provincial level, where BR has the highest value of about 83%, while TA and FG have the lowest values, ranging from 66 to about 69%. If only classes III and IV are considered, the percentage of agricultural land for the whole region drops to about 57%. At the provincial level, the highest values were recorded for BT and FG (62 and 59%, respectively), while the other provinces show comparable values ranging from 51 to about 56% (Table 4).
After removing the areas classified as “constrained” (according to the Constrain Map) the AV feasibility criteria were applied and the AV available areas were mapped for each province and the region as a whole (Figure 7).
Table 5 shows the unconstrained agricultural land that can be potentially allocated to AV systems (i.e., available land) according to the three successive feasibility criteria (see the footnote legend).
According to Table 5, the total regional area potentially available for AV installations is about 350 thousand hectares, with FG expressing the highest availability (160 thousand hectares), much more than the other Apulian provinces, with areas between 25-55 thousand hectares.
The potentially available land addressed to AV installations represents, for the entire Apulian region, the 18% of the territorial land and the 27% of the utilized agricultural area (Table 6).
The relative incidence of the available area in relation to the territorial area is about 18% (maximum value FG=23%; minimum values LE and BR=13%); in relation to the UAA, this incidence is about 27% (maximum value FG=32%, minimum value BR=20%).
Finally, two separate scenarios were generated, considering a low and a high threshold for directing the UAA to the installation of AV systems. The low threshold envisages a 0.5% occupation of the UAA, to be chosen, of course, within the defined available areas. The high threshold, on the other hand, is doubled, i.e. 1% occupation of the UAA, again within the available areas.
According to the two scenarios reported in Table 7, a 0.5% of agricultural land occupation would allow a regional installed AV capacity of 2.6 GW, while doubling this percentage (i.e. 1%) is also doubled the installed capacity that reaches 5.2 GW. It is worth recalling that by 2030, the Apulia region will have to reach an additional 7.4 GW of installed renewable energy capacity compared to 2021. Considering our estimates, with 0.5 and 1.0% of the UAA occupation, it is possible to reach, respectively, 35 and 70% of the 2030 regional target. It is very important to define the total agricultural area needed to achieve these results. The areas potentially occupied by AV plants would be 6.5 and 13.0 thousand hectares for the first (lower) and second (upper) scenarios, respectively. The areas potentially occupied by AV plants would be 6.5 and 13.0 thousand hectares for the first (lower) and second (upper) scenarios, respectively. These areas represent 1.9 and 3.8%, respectively, of the total available agricultural land (350 thousand hectares) in the region.
It should be noted that the remaining amount of renewable energy capacity to meet the regional target should come from installations in both eligible and available areas, taking into account renewable technologies other than AV. For this reason, the percentages of land coverage envisaged by the proposed scenarios result to be very large and largely overestimated compared to the actual needs, taking into account, for example, the contribution of wind turbines, another widely used (also discussed and controversial) technology in the region.
4. Discussion
The current historical phase is characterized by severe climate and energy crises, making action to replace fossil fuels and mitigate climate change compelling and also urgent. This has a major impact on our territories, given the low spatial density of renewable energy technologies and, as a result, determines the wide distribution of these installations across regional lands. The high speed with which this process must take place also leads to a drastic and sudden change in the characteristics of the landscapes we are used to, which take on a new, mostly pejorative form.
Both renewable energy sources (RES) and land use/landscape are the main components of the current ecological transition. The switch to RES and the substitution of fossil fuels are factors that significantly improve environmental quality and mitigate climate change, but should not jeopardize the landscape, which should be considered a priceless common heritage. Large-scale RES installation programs and possible landscape degradation are at the center of today's public debate and social turmoil in Italy, especially in those regions where RES installation has reached an impressive land concentration.
In the midst of this ecological transition, we need to emphasize the specific relevance of applying land planning procedures, with the Regional Landscape Plan (in our case the ALP) as a powerful reference tool. Public planning must play a leading role in managing this transition and be able to regulate its territorial deployment without being influenced or pressured by industrial system and market interests. At the national level, the responsibility for identifying eligible areas for the installation of renewable energy systems has been delegated from the central state administration to the regional administrations. This carries the risk of strong fragmentation and lack of homogeneity in the siting and permitting rules applied in each region, despite greater flexibility to adapt energy installations to specific and particular local conditions.
PV is a very good technology for deploying distributed energy systems, but unfortunately, roof surfaces and open industrial areas alone are not enough to meet the overall energy target. Small-scale energy systems, although insufficient, are very important because they support bottom-up energy projects and promotes citizen participation and their direct responsibility. On the other hand, high-capacity, utility-scale PV installations are considered essential to effectively achieve the binding 2030 and 2050 target with the necessary speed.
Recently, the Italian Institute for Environmental Protection and Research [54], based on the current total area of buildings in Italy, estimated the net area eligible for PV installations between 760 and 992 km2. Assuming flat roofs and a requirement of approximately 10 m2 for each kW installed (i.e. 1 MW=1 ha), it was estimated that between 76 and 99 GW of PV capacity could be installed on existing buildings. Similar results were obtained in a previous estimate from the Energy & Strategy research group of the Politecnico di Milano [55], which calculated a total urban surface area of 3,481 km2, an eligible urban area of between 680 and 890 km2 and therefore a potential installed capacity of between 68 and 89 GW. This energy capacity is exactly or almost enough to cover the increase in total renewable energy foreseen by the PNIEC until 2030 (80 GW), but not the increase foreseen until 2050 (200 MW).
In any case, there is no doubt that the most reasonable solution should be to install PV systems first on the roofs of new buildings, on public buildings, in industrial areas, in abandoned and reclaimed areas, along the buffer strips of main roads and wherever the impact on the landscape is negligible. Recognizing that this will not be enough in the long run, it is important that installations are also directed towards larger PV systems that do not require the new land occupation, through compatible technologies such as AV installations in rural areas, thus avoiding agricultural land use change and land consumption, the most serious mistakes of the past renewable energy "golden rush".
Energy land planning involves a complex interplay of geographic, management, and design decisions [40]. When agricultural land is used to support renewable energy development, especially considering the need for large-scale AV systems, the identification and classification of potentially available areas for AV systems becomes paramount [42].
GIS methods and applications play an essential role in any kind of planning process, especially in issues such as energy land-use planning. Before any policy decision is made, a preliminary territorial analysis is needed to identify the resources at stake and the compatibility of their use with other possible development scenarios in the province or region.
In line with the above recommendations, the aim of this study was to develop a methodological procedure to identify agricultural areas eligible for the installation of AV systems in the Apulia region, using a GIS approach. Specifically, in this study the analysis has been carried out taking into account the regional Draft Law no. 222 of October 23, 2024. Although this law is still in draft form, it should be emphasized that it incorporates some key aspects already established by the ALP and existing national legislation. First of all, this law recalls the definition of eligible areas as defined by national law and distinguishes them from available and unavailable areas. This is a crucial point that should be explained and further clarified (see subsection 2.3). “Eligible" land for PV installations is land that is not contested, disputed or in competition with alternative uses, especially if these uses are economically viable, i.e. land that could be considered "empty" and therefore potentially usable without particular problems (note: of course, no land is actually “empty” and nature is everywhere as well as the ecosystem services associated to nature). Conversely, if the land can be defined as "available" for potential RES installations, it means that it has been identified through a specific selection process using a set of multiple criteria, and that this process was necessary because other land uses, values or constraints are at stake and conflicts between different options should be resolved through land use planning. Finally, a land (or more correctly, a “site”) can be defined as "suitable" if it is within the available land area for that specific use (i.e., PV or AV), and also meets certain feasibility criteria, resulting in the site being considered optimal for that type of use.
Therefore, a first objective of this work was to quantify the area of what we defined as "available" land for AV installations, i.e., agricultural land without any type of protective restriction or constraint (cultural, historical, geomorphological, landscape, ecological, etc.). This should minimize the risk of impacting the environment and the most representative landscape features. The union of all the constraint layers mapped by the ALP has shown that particular attention has been paid to the protection of the land, as evidenced by the fact that 75% of the total territory of the Apulia region is protected, although some differences can be observed at the provincial level.
A second objective of this work is to prevent AV installations from becoming an excessive occupation of agricultural land. In order to proceed, it is necessary to make another clarification by distinguishing the agricultural area from a land use map and the agricultural area from the national censuses (TAA). In fact, the first one is obtained through a general photo-interpretation of satellite images of the entire regional territory, while the second one records the area occupied by farms, thus indicating private areas, i.e. productively active economic units. This is the reason why the agricultural area is higher according to the land use map and slightly lower according to the TAA census data (1,420 vs. 1,377 kha, respectively).
NUA should not be considered tout court available for AV systems. In fact, farmers receiving support from the CAP (i.e. the Common Agricultural Policy) have to comply with EU standards for Good Agricultural and Environmental Conditions (GAEC). This is part of what is known as "conditionality". GAEC8 states that at least 4% of the arable land of each farm should be devoted to non-productive areas. Although the compulsory nature of this measure has now been abolished and the measure has been transferred to Eco-scheme 5 (another CAP measure) as a voluntary measure, the fact remains that it is considered useful, if not necessary, to have "ecological focus areas" (EFAs) on the farm. In the Apulia region, NUAs represent about 1% of the UAA (see Table 2) and 2% of the arable land, which is well below the threshold of 4%. Despite these conditions, a maximum and theoretical AV capacity of 5.7 GW could be installed if all NUAs were potentially dedicated to this use.
Another critical issue to consider is not only the amount of agricultural land to be devoted to the installation of AV systems, but also the quality of that land, in other words, its soil fertility class or land capability [37,39,40]. Since this study does not aim to promote the uncontrolled installation of AV systems on highly productive and fertile land, it was decided to focus on classes III and IV of the LCC map under non-irrigated conditions. This resulted in a reduction from 73% to 57% of the total regional territorial area (see Table 4). The final steps in the calculation were to select only the agricultural land from the total land area and to introduce two alternative feasibility criteria, slope and exposure, in order to select only more favorable areas of the land potentially available for the AV system. This resulted in a further reduction of the total agricultural available areas from 354 to 350 thousand hectares, i.e. a decrease of 25% (see Table 5).
In general, and independently from the renewable "land grabbing" on the territory, as someone is used to say, the main problem of agriculture is that the TAA, UAA and NUA have impressively decreased from 1982 to 2020, as shown by the census data, both at national and regional levels (see Figure 5). There are multiple, deep and critical stresses that undermine the agricultural sector and trigger the conversion of its land to other uses. For this reason, it should be emphasized that the energy sector should be a leverage factor to promote rural development and support agriculture, and not the other way around.
It is precisely by considering soil fertility or land capability as reference options that it would be necessary to define what the maximum yield reduction should be that is compatible with AV agricultural land use [19]. Although such a threshold has not been established by the Italian ministry guidelines [56], it can be found in several guidelines or regulations of other states, both inside and outside the EU.
In Germany, the Fraunhofer ISE, the University of Hohenheim, the German Institute for Standardization (DIN), and representatives from academia and industry have developed the standard DIN SPEC 91434 “Agri-photovoltaic systems - Requirements for primary agricultural use” [57]. Among other things, the guidelines set a threshold for the agricultural yield under AV systems to be at least 66% of the reference yield and divide AV systems into different categories for which the land loss cannot be >10% for category I, or 15% for category II.
In France, the law does not set any constraints on the agricultural production where AV systems are placed or the maximum threshold for the coverage area of PV modules. However, it defines AV systems as systems where the colocation of agricultural activities and solar AV energy conversion is possible, but agricultural production should be maintained and developed [42,58].
In Japan, legislation allows the operation of AV farms only if the crop yield is at least 80% compared to the yield before AV installation [59,60].
Finally in Italy, the guidelines for AV systems state that at least 70% of the agricultural areas should be kept for agricultural activities [56] and the ratio between the total surface area of the AV panels and the total area occupied by the latter should be lower than 40%. It is interesting to note that in the Italian guidelines the only minimum production target is related to electricity, while no similar limit is provided in other national guidelines. On the other hand, the Italian guidelines do not indicate any minimum limit for the agricultural productivity that can be obtained from crops grown under AV systems. It is reasonable to fear that the absence of this constraint may lead to design and management choices contrary to a truly integrated agricultural model, effective for the economic valorization of agricultural activity. In this respect, a standard for AV systems has recently been issued, which sets a threshold for the agricultural yield of AV systems of at least 70% of the crop yield in open field conditions [61].
According to our calculations, with 0.5 and 1.0% of the UAA coverage, respectively, 35 and 70% of the 2030 regional target can be achieved. This area represents 1.9 and 3.8%, respectively, of the estimated total agricultural land available in the region for AV installations. Actual AV deployment and the resulting agricultural land occupation will be the result of several factors (most of which are beyond the scope of this study), such as societal acceptance, technical challenges, and economic feasibility [7,62,63]. Public perception and resistance (due to visual impact, NIMBY, wildlife concerns, etc.) with respect to AV systems by a wide range of stakeholders can play a critical role [62]. Conversely, AV systems may also be perceived as a favorable renewable energy alternative by the general public. In one study, more than 40 percent of respondents said they would be willing to pay a premium for a company to install AV [64]. AV systems are certainly viewed more favorably than ground-mounted PV [65], but they are still not a priority compared to rooftop alternatives. In addition, uncertainty about the environmental impacts of AV systems can sometimes be a bottleneck.
5. Conclusions
While the renewable energy industry is in a frenzy of business opportunities but a large part of public opinion is in turmoil, expressing concerns and organizing protests (starting with city mayors and not just environmental organizations), the central government as well as the regional administrations (with some exceptions) are standing still and have been doing so for several years, without responding to the urgent demand to guide the energy/ecological transition. This is not conducive to a fair and balanced process and leaves room for ungovernability and approximation in the management of territories, especially considering the agriculture sector and the agriculture land. There is an urgent need to apply a land planning approach to the definition of properly land use rules to be followed. Land and landscape quality should be considered as an irreplaceable collective heritage that requires, as a priority, precise spatial information in order to develop effective guidelines that can reconcile the gradually worsening social contrasts on renewable energy sources.
The analyses carried out in this work should be considered as a preliminary or preparatory set of information to proceed with political decisions and define how to manage the energy and environmental transition. We sincerely hope that this contribution will be useful also for contexts outside Italy or the Apulia region.
Author Contributions
Conceptualization, A.R.B.C., M.M, L.P. and M.M.; methodology, A.R.B.C. and M.M.; software A.R.B.C.; formal analysis, A.R.B.C. and M.M.; investigation, A.R.B.C., M.M, L.P. and M.M; writing—original draft preparation, A.R.B.C. and M.M; writing—review and editing, A.R.B.C. and M.M; supervision, M.M.; funding acquisition, M.M. All authors have read and agreed to the published version of the manuscript.
Data Availability Statement
The raw data supporting the conclusions of this article will be made available by the authors on request.
Conflicts of Interest
The authors declare no conflicts of interest
Abbreviations
The following abbreviations are used in this manuscript:
| ALP | Apulian Landscape Plan; |
| AV | Agrivoltaics; |
| GAEC | Good Agriculture and Ecological Condition |
| GIS | |
| Geographical Information System; | |
| HGP | Hydro-Geological Plan; |
| LCC | Land Capability Classification; |
| LUM | Land Use Map; |
| MASE | Italian Ministry for the Environment and Energy Security; |
| NECP | National Energy and Climate Plan; |
| CAP | Common Agricultural Policy; |
| PNRR | National Recovery and Resilience Plan; |
| PV | Photovoltaic; |
| RBA | River Basin Authority; |
| RES | Renewable Energy Sources. |
References
- EU Council, 2023. Green Deal.
- Miller, C.A.; Iles, A.; Jones, C.F. The Social Dimensions of Energy Transitions. Science as Culture 2013, 22, 135–148. [Google Scholar] [CrossRef]
- Pasqualetti, M.J. Morality, Space, and the Power of Wind-Energy Landscapes. Geographical Review 2000, 90, 381. [Google Scholar] [CrossRef]
- Sovacool, B.K. What Are We Doing Here? Analyzing Fifteen Years of Energy Scholarship and Proposing a Social Science Research Agenda. Energy Research & Social Science 2014, 1, 1–29. [Google Scholar] [CrossRef]
- Moreira, H.S.; Lucas De Souza Silva, J.; Gomes Dos Reis, M.V.; De Bastos Mesquita, D.; Kikumoto De Paula, B.H.; Villalva, M.G. Experimental Comparative Study of Photovoltaic Models for Uniform and Partially Shading Conditions. Renewable Energy 2021, 164, 58–73. [Google Scholar] [CrossRef]
- Oudes, D.; Van Den Brink, A.; Stremke, S. Towards a Typology of Solar Energy Landscapes: Mixed-Production, Nature Based and Landscape Inclusive Solar Power Transitions. Energy Research & Social Science 2022, 91, 102742. [Google Scholar] [CrossRef]
- Ketzer, D.; Schlyter, P.; Weinberger, N.; Rösch, C. Driving and Restraining Forces for the Implementation of the Agrophotovoltaics System Technology – A System Dynamics Analysis. Journal of Environmental Management 2020, 270, 110864. [Google Scholar] [CrossRef]
- Pascaris, A.S.; Schelly, C.; Burnham, L.; Pearce, J.M. Integrating Solar Energy with Agriculture: Industry Perspectives on the Market, Community, and Socio-Political Dimensions of Agrivoltaics. Energy Research & Social Science 2021, 75, 102023. [Google Scholar] [CrossRef]
- Chiabrando, R.; Fabrizio, E.; Garnero, G. The Territorial and Landscape Impacts of Photovoltaic Systems: Definition of Impacts and Assessment of the Glare Risk. Renewable and Sustainable Energy Reviews 2009, 13, 2441–2451. [Google Scholar] [CrossRef]
- Scognamiglio, A. ‘Photovoltaic Landscapes’: Design and Assessment. A Critical Review for a New Transdisciplinary Design Vision. Renewable and Sustainable Energy Reviews 2016, 55, 629–661. [Google Scholar] [CrossRef]
- Hermoso, V.; Bota, G.; Brotons, L.; Morán-Ordóñez, A. Addressing the Challenge of Photovoltaic Growth: Integrating Multiple Objectives towards Sustainable Green Energy Development. Land Use Policy 2023, 128, 106592. [Google Scholar] [CrossRef]
- European Commission National Energy and Climate Plan 2023.
- SolarPower Europe (2023): Global Market Outlook for Solar Power 2023-2027.
- Chamber of Deputies - Italian Republic - Study Service, 2023. Public Policies on Renewa-Ble Energy Sources (in Italian).
- Industry – Chemistry, 2023. Alliance for Photovoltaics in Italy: “100 GW Needed for Energy Transition by 2030” (in Italian).
- IPCC, 2022. Factsheet Energy. Switzerland, Geneva.
- Macknick, J.; Hartmann, H.; Barron-Gafford, G.; Beatty, B.; Burton, R.; Seok-Choi, C.; Davis, M.; Davis, R.; Figueroa, J.; Garrett, A.; et al. The 5 Cs of Agrivoltaic Success Factors in the United States: Lessons from the InSPIRE Research Study; 2022; p. NREL/TP-6A20-83566, 1882930, MainId:84339.
- Goetzberger, A.; Zastrow, A. On the Coexistence of Solar-Energy Conversion and Plant Cultivation. International Journal of Solar Energy 1982, 1, 55–69. [Google Scholar] [CrossRef]
- Dupraz, C.; Marrou, H.; Talbot, G.; Dufour, L.; Nogier, A.; Ferard, Y. Combining Solar Photovoltaic Panels and Food Crops for Optimising Land Use: Towards New Agrivoltaic Schemes. Renewable Energy 2011, 36, 2725–2732. [Google Scholar] [CrossRef]
- Asa’a, S.; Reher, T.; Rongé, J.; Diels, J.; Poortmans, J.; Radhakrishnan, H.S.; Van Der Heide, A.; Van De Poel, B.; Daenen, M. A Multidisciplinary View on Agrivoltaics: Future of Energy and Agriculture. Renewable and Sustainable Energy Reviews 2024, 200, 114515. [Google Scholar] [CrossRef]
- Amaducci, S.; Yin, X.; Colauzzi, M. Agrivoltaic Systems to Optimise Land Use for Electric Energy Production. Applied Energy 2018, 220, 545–561. [Google Scholar] [CrossRef]
- Barron-Gafford, G.A.; Pavao-Zuckerman, M.A.; Minor, R.L.; Sutter, L.F.; Barnett-Moreno, I.; Blackett, D.T.; Thompson, M.; Dimond, K.; Gerlak, A.K.; Nabhan, G.P.; et al. Agrivoltaics Provide Mutual Benefits across the Food–Energy–Water Nexus in Drylands. Nat Sustain 2019, 2, 848–855. [Google Scholar] [CrossRef]
- Neupane Bhandari, S.; Schlüter, S.; Kuckshinrichs, W.; Schlör, H.; Adamou, R.; Bhandari, R. Economic Feasibility of Agrivoltaic Systems in Food-Energy Nexus Context: Modelling and a Case Study in Niger. Agronomy 2021, 11, 1906. [Google Scholar] [CrossRef]
- Schindele, S.; Trommsdorff, M.; Schlaak, A.; Obergfell, T.; Bopp, G.; Reise, C.; Braun, C.; Weselek, A.; Bauerle, A.; Högy, P.; et al. Implementation of Agrophotovoltaics: Techno-Economic Analysis of the Price-Performance Ratio and Its Policy Implications. Applied Energy 2020, 265, 114737. [Google Scholar] [CrossRef]
- Al-Amin; Shafiullah, G.M.; Ferdous, S.M.; Shoeb, M.; Reza, S.M.S.; Elavarasan, R.M.; Rahman, M.M. Agrivoltaics System for Sustainable Agriculture and Green Energy in Bangladesh. Applied Energy 2024, 371, 123709. [Google Scholar] [CrossRef]
- Gorjian, S.; Bousi, E.; Özdemir, Ö.E.; Trommsdorff, M.; Kumar, N.M.; Anand, A.; Kant, K.; Chopra, S.S. Progress and Challenges of Crop Production and Electricity Generation in Agrivoltaic Systems Using Semi-Transparent Photovoltaic Technology. Renewable and Sustainable Energy Reviews 2022, 158, 112126. [Google Scholar] [CrossRef]
- Walston, L.J.; Barley, T.; Bhandari, I.; Campbell, B.; McCall, J.; Hartmann, H.M.; Dolezal, A.G. Opportunities for Agrivoltaic Systems to Achieve Synergistic Food-Energy-Environmental Needs and Address Sustainability Goals. Front. Sustain. Food Syst. 2022, 6, 932018. [Google Scholar] [CrossRef]
- Enserink, M.; Van Etteger, R.; Van Den Brink, A.; Stremke, S. To Support or Oppose Renewable Energy Projects? A Systematic Literature Review on the Factors Influencing Landscape Design and Social Acceptance. Energy Research & Social Science 2022, 91, 102740. [Google Scholar] [CrossRef]
- Roddis, P.; Roelich, K.; Tran, K.; Carver, S.; Dallimer, M.; Ziv, G. What Shapes Community Acceptance of Large-Scale Solar Farms? A Case Study of the UK’s First ‘Nationally Significant’ Solar Farm. Solar Energy 2020, 209, 235–244. [Google Scholar] [CrossRef]
- Toledo, C.; Scognamiglio, A. Agrivoltaic Systems Design and Assessment: A Critical Review, and a Descriptive Model towards a Sustainable Landscape Vision (Three-Dimensional Agrivoltaic Patterns). Sustainability 2021, 13, 6871. [Google Scholar] [CrossRef]
- Wagner, J.; Bühner, C.; Gölz, S.; Trommsdorff, M.; Jürkenbeck, K. Factors Influencing the Willingness to Use Agrivoltaics: A Quantitative Study among German Farmers. Applied Energy 2024, 361, 122934. [Google Scholar] [CrossRef]
- Chae, S.-H.; Kim, H.J.; Moon, H.-W.; Kim, Y.H.; Ku, K.-M. Agrivoltaic Systems Enhance Farmers’ Profits through Broccoli Visual Quality and Electricity Production without Dramatic Changes in Yield, Antioxidant Capacity, and Glucosinolates. Agronomy 2022, 12, 1415. [Google Scholar] [CrossRef]
- Guerrero Hernández, A.S.; Ramos De Arruda, L.V. Technical–Economic Potential of Agrivoltaic for the Production of Clean Energy and Industrial Cassava in the Colombian Intertropical Zone. Environmental Quality Mgmt 2022, 31, 267–281. [Google Scholar] [CrossRef]
- Kumpanalaisatit, M.; Setthapun, W.; Sintuya, H.; Pattiya, A.; Jansri, S.N. Current Status of Agrivoltaic Systems and Their Benefits to Energy, Food, Environment, Economy, and Society. Sustainable Production and Consumption 2022, 33, 952–963. [Google Scholar] [CrossRef]
- Nakata, H.; Ogata, S. Integrating Agrivoltaic Systems into Local Industries: A Case Study and Economic Analysis of Rural Japan. Agronomy 2023, 13, 513. [Google Scholar] [CrossRef]
- Jamil, U.; Bonnington, A.; Pearce, J.M. The Agrivoltaic Potential of Canada. Sustainability 2023, 15, 3228. [Google Scholar] [CrossRef]
- Elkadeem, M.R.; Zainali, S.; Lu, S.M.; Younes, A.; Abido, M.A.; Amaducci, S.; Croci, M.; Zhang, J.; Landelius, T.; Stridh, B.; et al. Agrivoltaic Systems Potentials in Sweden: A Geospatial-Assisted Multi-Criteria Analysis. Applied Energy 2024, 356, 122108. [Google Scholar] [CrossRef]
- Tri Nugroho, A.; Pramono Hadi, S.; Sutanta, H.; Adikara Ajrin, H. Optimising Agrivoltaic Systems: Identifying Suitable Solar Development Sites for Integrated Food and Energy Production. PEC 2024, 1, 1–11. [Google Scholar] [CrossRef]
- Fattoruso, G.; Toscano, D.; Venturo, A.; Scognamiglio, A.; Fabricino, M.; Di Francia, G. A Spatial Multicriteria Analysis for a Regional Assessment of Eligible Areas for Sustainable Agrivoltaic Systems in Italy. Sustainability 2024, 16, 911. [Google Scholar] [CrossRef]
- Reher, T.; Lavaert, C.; Ottoy, S.; Martens, J.A.; Van Orshoven, J.; Cappelle, J.; Diels, J.; Van De Poel, B. Room for Renewables: A GIS-Based Agrivoltaics Site Suitability Analysis in Urbanized Landscapes. Agricultural Systems 2025, 224, 104266. [Google Scholar] [CrossRef]
- Dere, S.; Elçin Günay, E.; Kula, U.; Kremer, G.E. Assessing Agrivoltaics Potential in Türkiye – A Geographical Information System (GIS)-Based Fuzzy Multi-Criteria Decision Making (MCDM) Approach. Computers & Industrial Engineering 2024, 197, 110598. [Google Scholar] [CrossRef]
- European Commission. Joint Research Centre. Overview of the Potential and Challenges for Agri-Photovoltaics in the European Union.; Publications Office: LU, 2023. [Google Scholar]
- Federazione A. Sistemi Agro-Fotovoltaica. 2022.
- Renewable Energies and European Landscapes: Lessons from Southern European Cases; Frolova, M., Prados, M.-J., Nadaï, A., Eds.; Springer Netherlands: Dordrecht, 2015; ISBN 978-94-017-9842-6. [Google Scholar]
- Impianti FER DGR 2122. Https://Webapps.Sit.Puglia.It/Freewebapps/ImpiantiFERDGR2122/.
- GSE Rapporto Statistico Solare-Fotovoltaico. Il Solare Fotovoltaico in Italia. Stato Di Sviluppo e Trend Del Settore 2022.
- https://www.gazzettaufficiale.it/eli/gu/2024/07/13/163/sg/pdf DL 12 Luglio 2024, n. 101 - Disposizioni Urgenti per Le Imprese Agricole, Della Pesca e Dell’acquacoltura, Nonché per Le Imprese Di Interesse Strategico Nazionale.
- https://www.istat.it/notizia/censimento-agricoltura-2020-online-i-principali-dati/ ISTAT, 2020. Censimento Agricoltura.
- Apulian Land Use Map 2011.
- Land Capability Classification, Apulia Region.
- Viviani, N.; Wijaksono, S.; Mariana, Y. Solar Radiation on Photovoltaics Panel Arranging Angles and Orientation. IOP Conf. Ser.: Earth Environ. Sci. 2021, 794, 012230. [Google Scholar] [CrossRef]
- Borgogno Mondino, E.; Fabrizio, E.; Chiabrando, R. Site Selection of Large Ground-Mounted Photovoltaic Plants: A GIS Decision Support System and an Application to Italy. International Journal of Green Energy 2015, 12, 515–525. [Google Scholar] [CrossRef]
- Bošnjaković, M.; Santa, R.; Crnac, Z.; Bošnjaković, T. Environmental Impact of PV Power Systems. Sustainability 2023, 15, 11888. [Google Scholar] [CrossRef]
- ISPRA Efficiency and Decarbonization Indicators in Italy and in the Biggest European Countries 2024.
- Energy & Strategy Group, Politecnico di Milano. Renewable Energy Report. Gli Scenari Future Delle Rinnovabili in Italia (Future Scenarios for Renewables in Italy). 2019.
- Italian Ministry of the Environment and Energy Security. Guidelines in the Field of Agrivoltaic Systems. 2023.
- European Standards. DIN SPEC 91434. Agri-Photovoltaic Systems - Requirements for Primary Agricultural Use. 2023.
- L´egisfrance LAW N◦ 2023–175 of March 10, 2023 Relating to the Acceleration of the Production of Renewable Energies 2023.
- US Department of Energy Market Research Study. Agrivoltaics. 2022.
- Gonocruz, R.A.; Uchiyama, S.; Yoshida, Y. Modeling of Large-Scale Integration of Agrivoltaic Systems: Impact on the Japanese Power Grid. Journal of Cleaner Production 2022, 363, 132545. [Google Scholar] [CrossRef]
- UNI/PdR 148:2023. Sistemi Agrivoltaici - Integrazione Di Attivit`a Agricole e Impianti Fotovoltaici. 2023.
- Torma, G.; Aschemann-Witzel, J. Social Acceptance of Dual Land Use Approaches: Stakeholders’ Perceptions of the Drivers and Barriers Confronting Agrivoltaics Diffusion. Journal of Rural Studies 2023, 97, 610–625. [Google Scholar] [CrossRef]
- Sacchelli, S.; Garegnani, G.; Geri, F.; Grilli, G.; Paletto, A.; Zambelli, P.; Ciolli, M.; Vettorato, D. Trade-off between Photovoltaic Systems Installation and Agricultural Practices on Arable Lands: An Environmental and Socio-Economic Impact Analysis for Italy. Land Use Policy 2016, 56, 90–99. [Google Scholar] [CrossRef]
- Ha, J.; Nguyen, J.; Pearce, J.M. Determinants of Consumers’ Willingness to Pay for Agrivoltaic Produce: The Mediating Role of Trust. SSRN Journal 2024. [Google Scholar] [CrossRef]
- Ketzer, D.; Weinberger, N.; Rösch, C.; Seitz, S.B. Land Use Conflicts between Biomass and Power Production – Citizens’ Participation in the Technology Development of Agrophotovoltaics. Journal of Responsible Innovation 2020, 7, 193–216. [Google Scholar] [CrossRef]
Figure 1.
A) Apulia region and its six provinces were considered as the study area. B) spatial density of photovoltaic installations in Apulia [45].
Figure 1.
A) Apulia region and its six provinces were considered as the study area. B) spatial density of photovoltaic installations in Apulia [45].
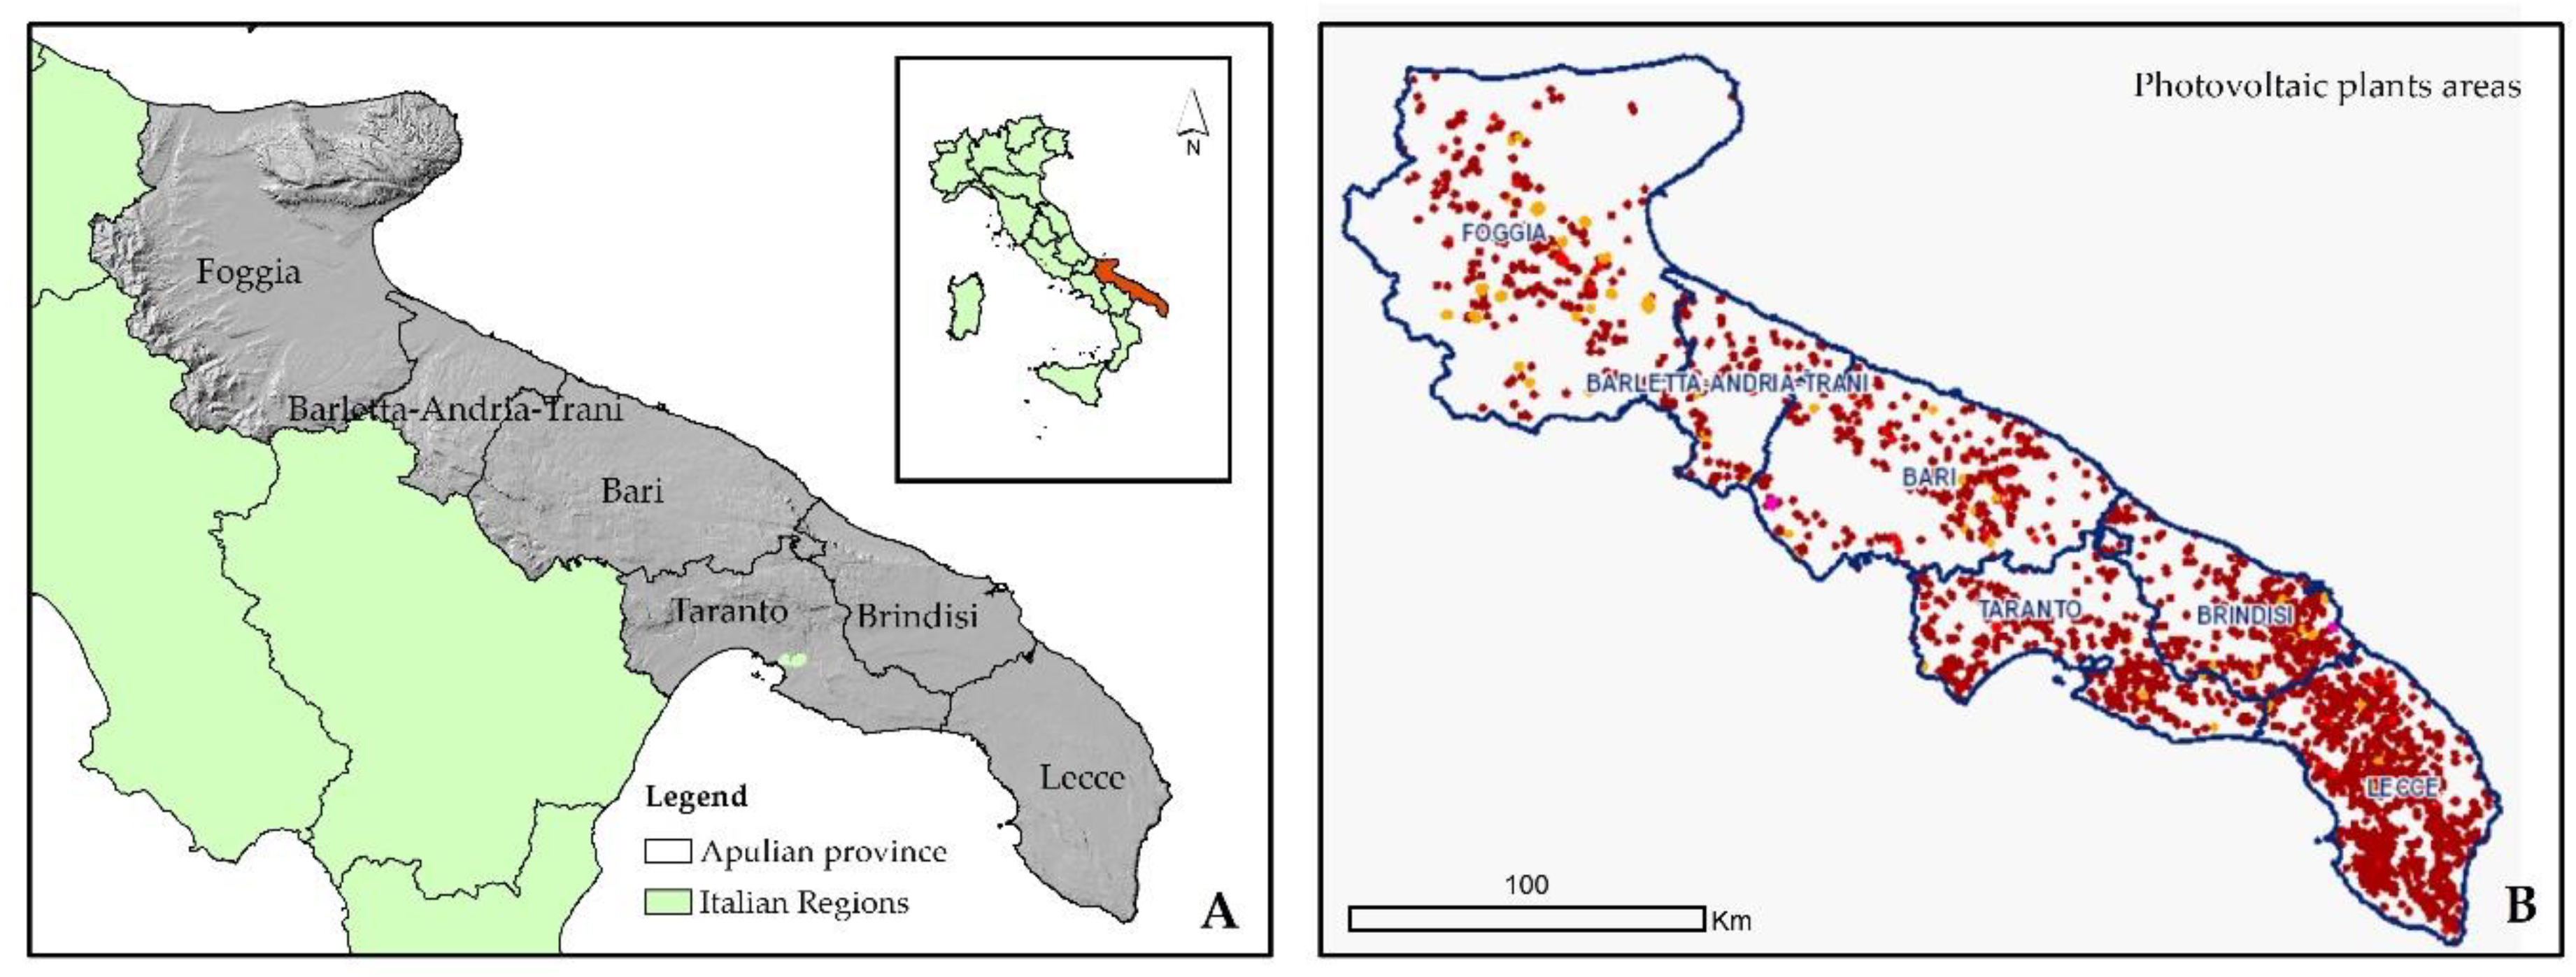
Figure 2.
The first two steps of the applied methodological approach. A) the Constraint Map was developed by the union of all the constrained areas in the region; B) the Availability Map was developed by intersecting the Constraint Map with feasibility criteria such as land capability, terrain slope and exposure.
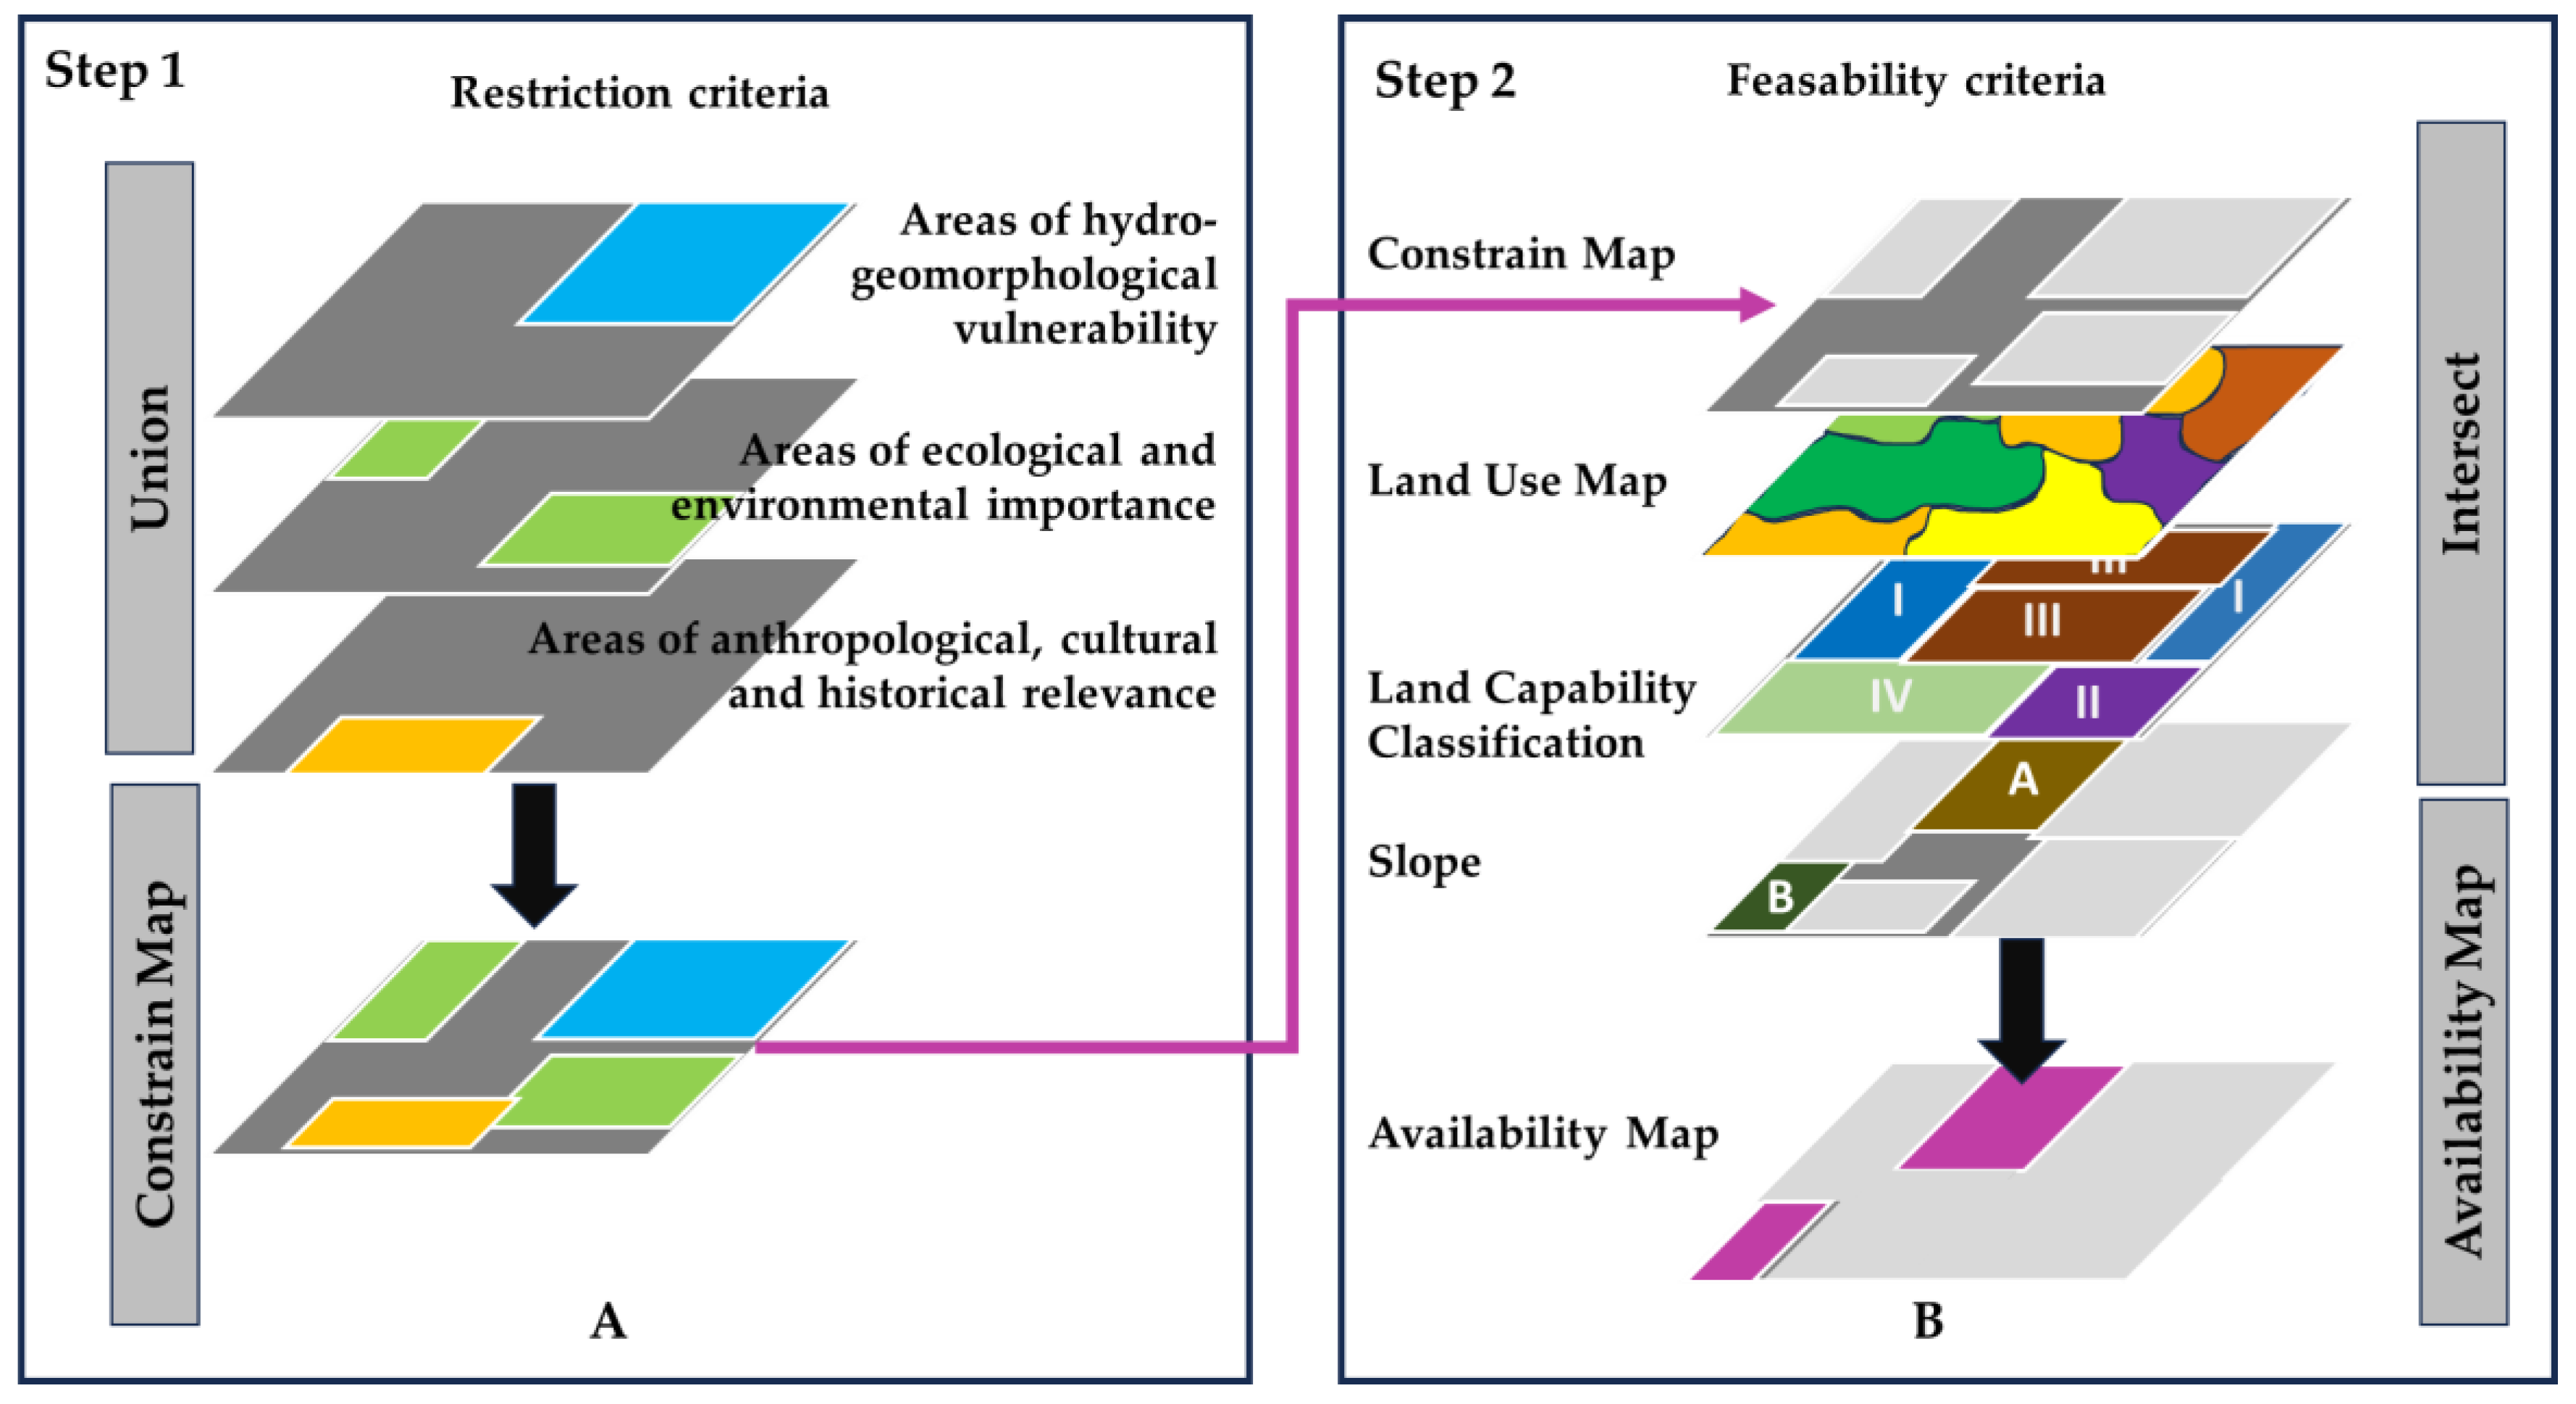
Figure 3.
Time trends of photovoltaic installations both at national level (Italy) and at regional level (Apulia). The "full dots" refer to installations already implemented by 2022 (Italy-1 and Apulia-1), while the "empty dots" refer to installations foreseen by the National Energy Plan (PNIEC) and the Ministerial Decree (Italy-2 and Apulia-2).
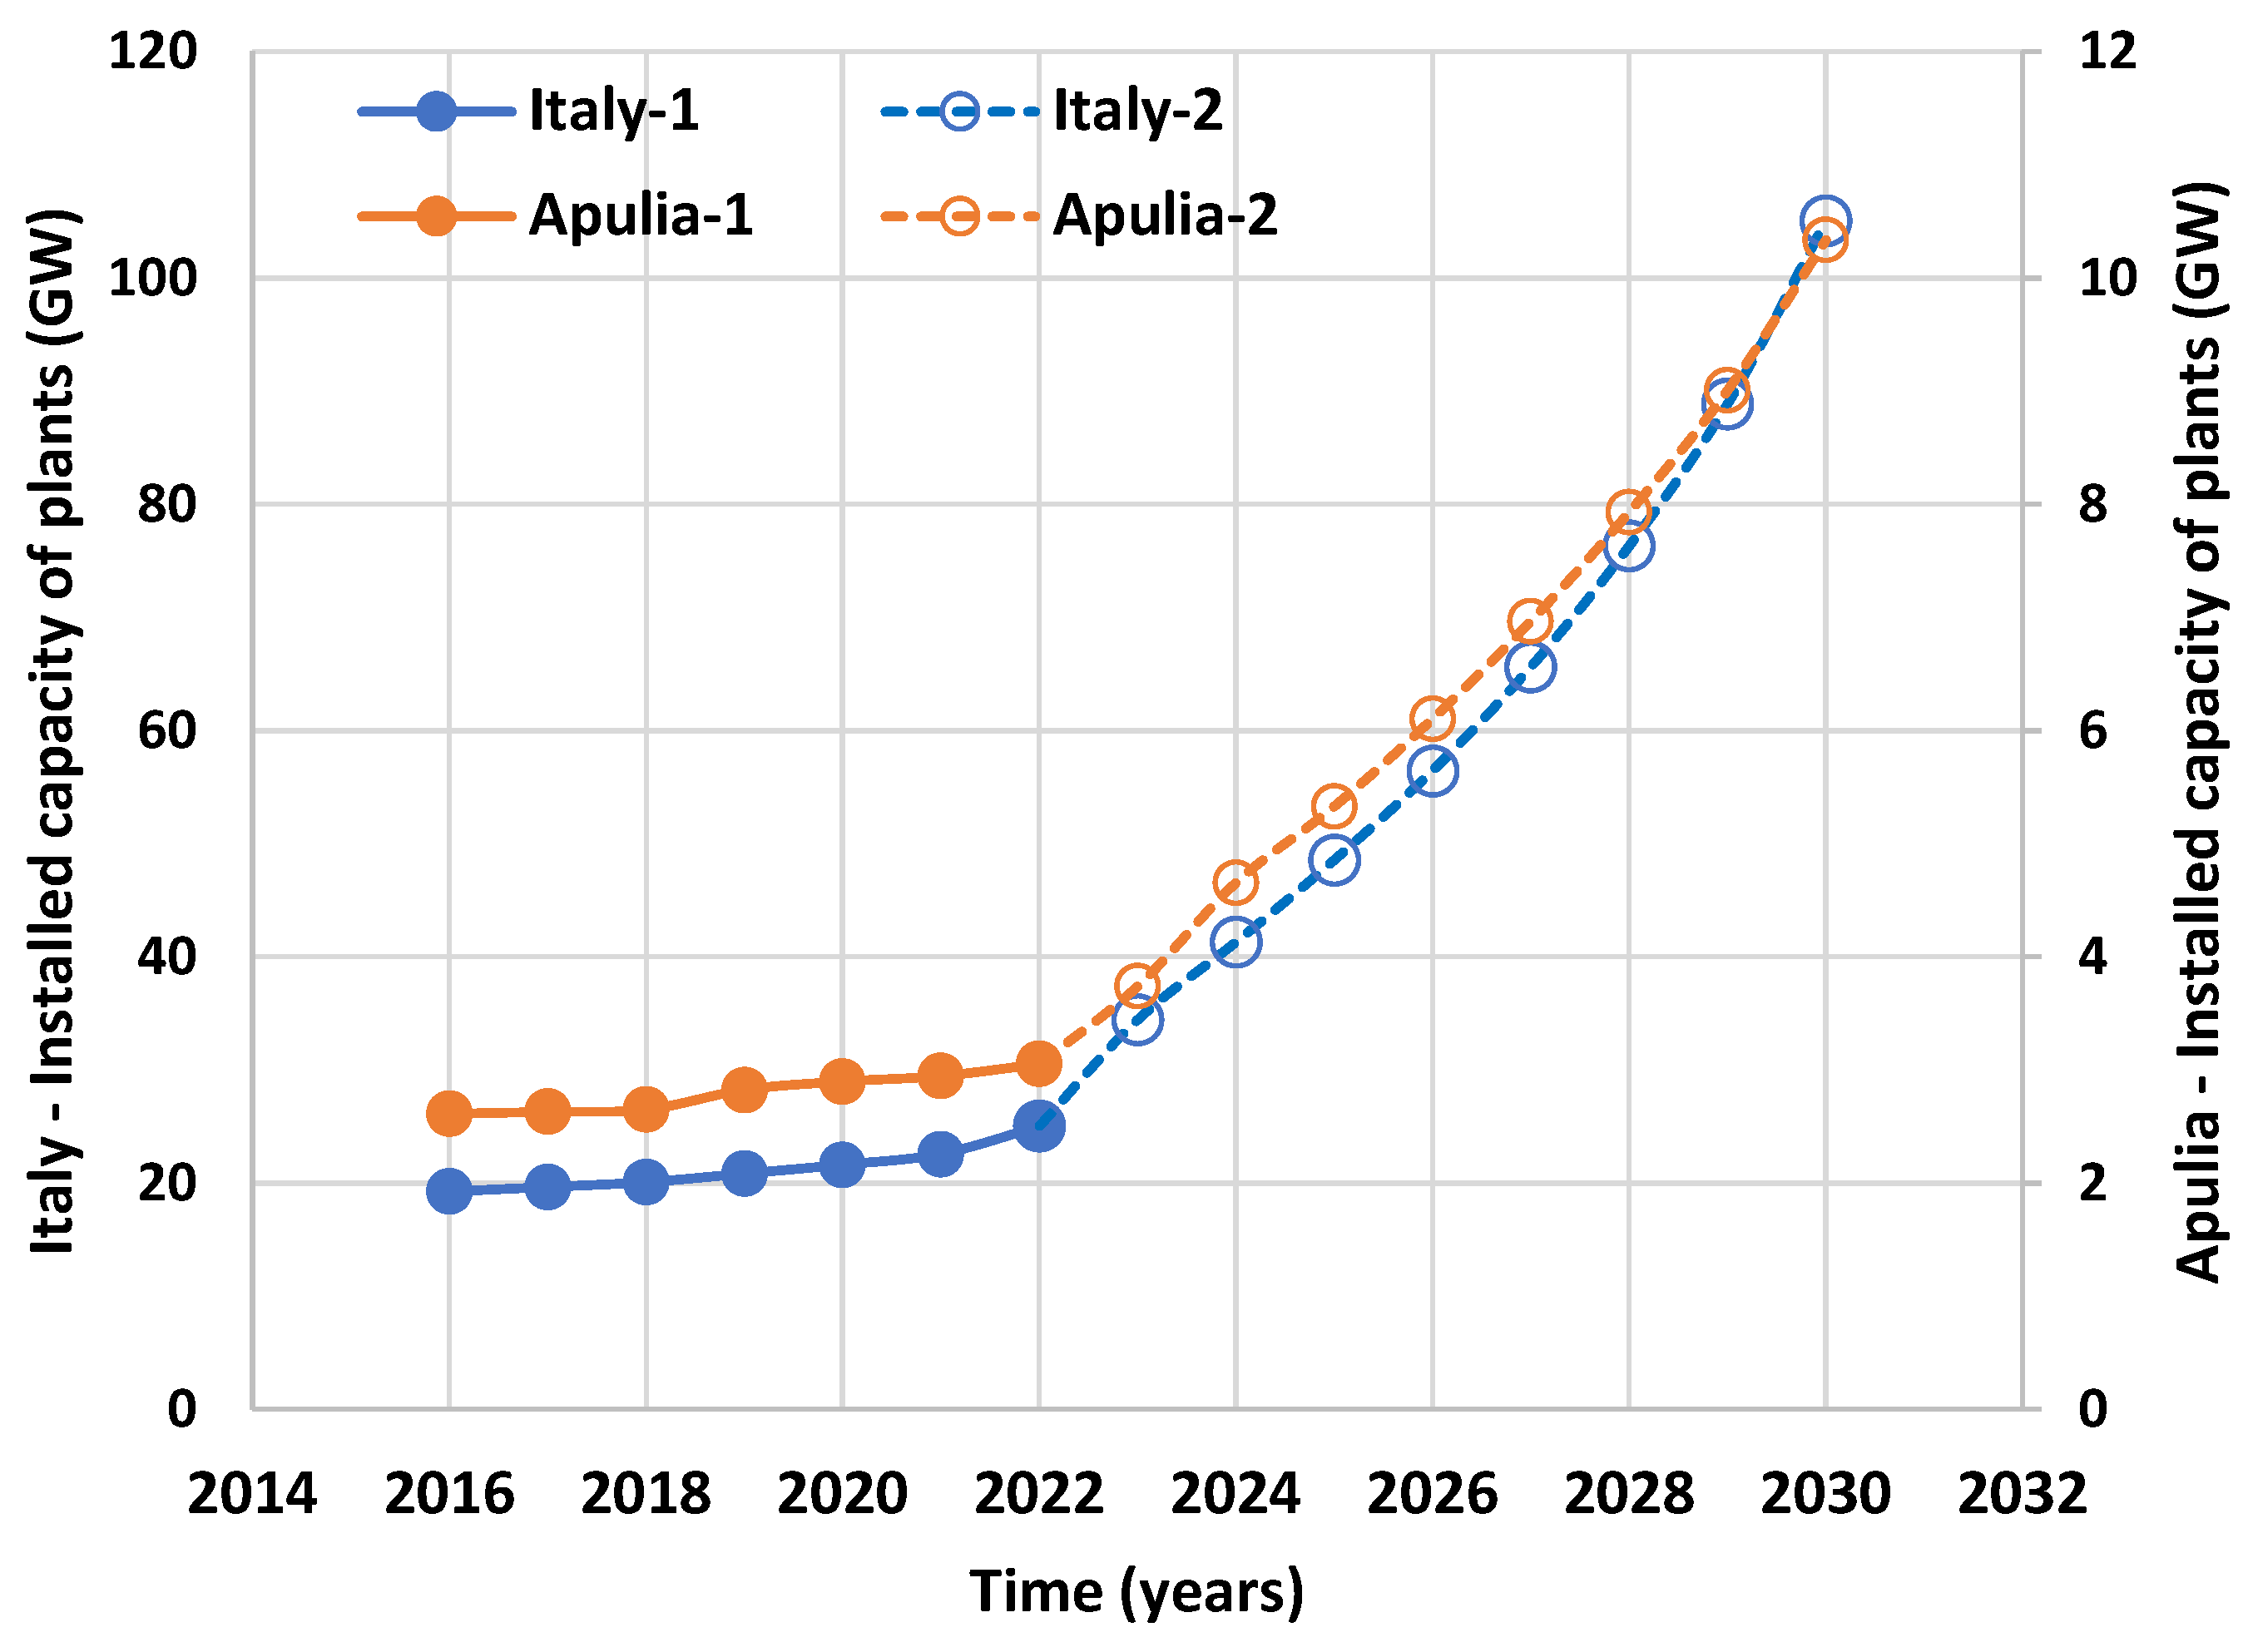
Figure 4.
Time trends of the spatial density of photovoltaic installations at the national level (Italy), regional level (Apulia), and also considering regions of Italy statistically combined into five groups: north-western, northeastern, central, southern and islands. Data refer to plants built up to 2022,, the year in which the National Energy Plan (PNIEC) was launched.
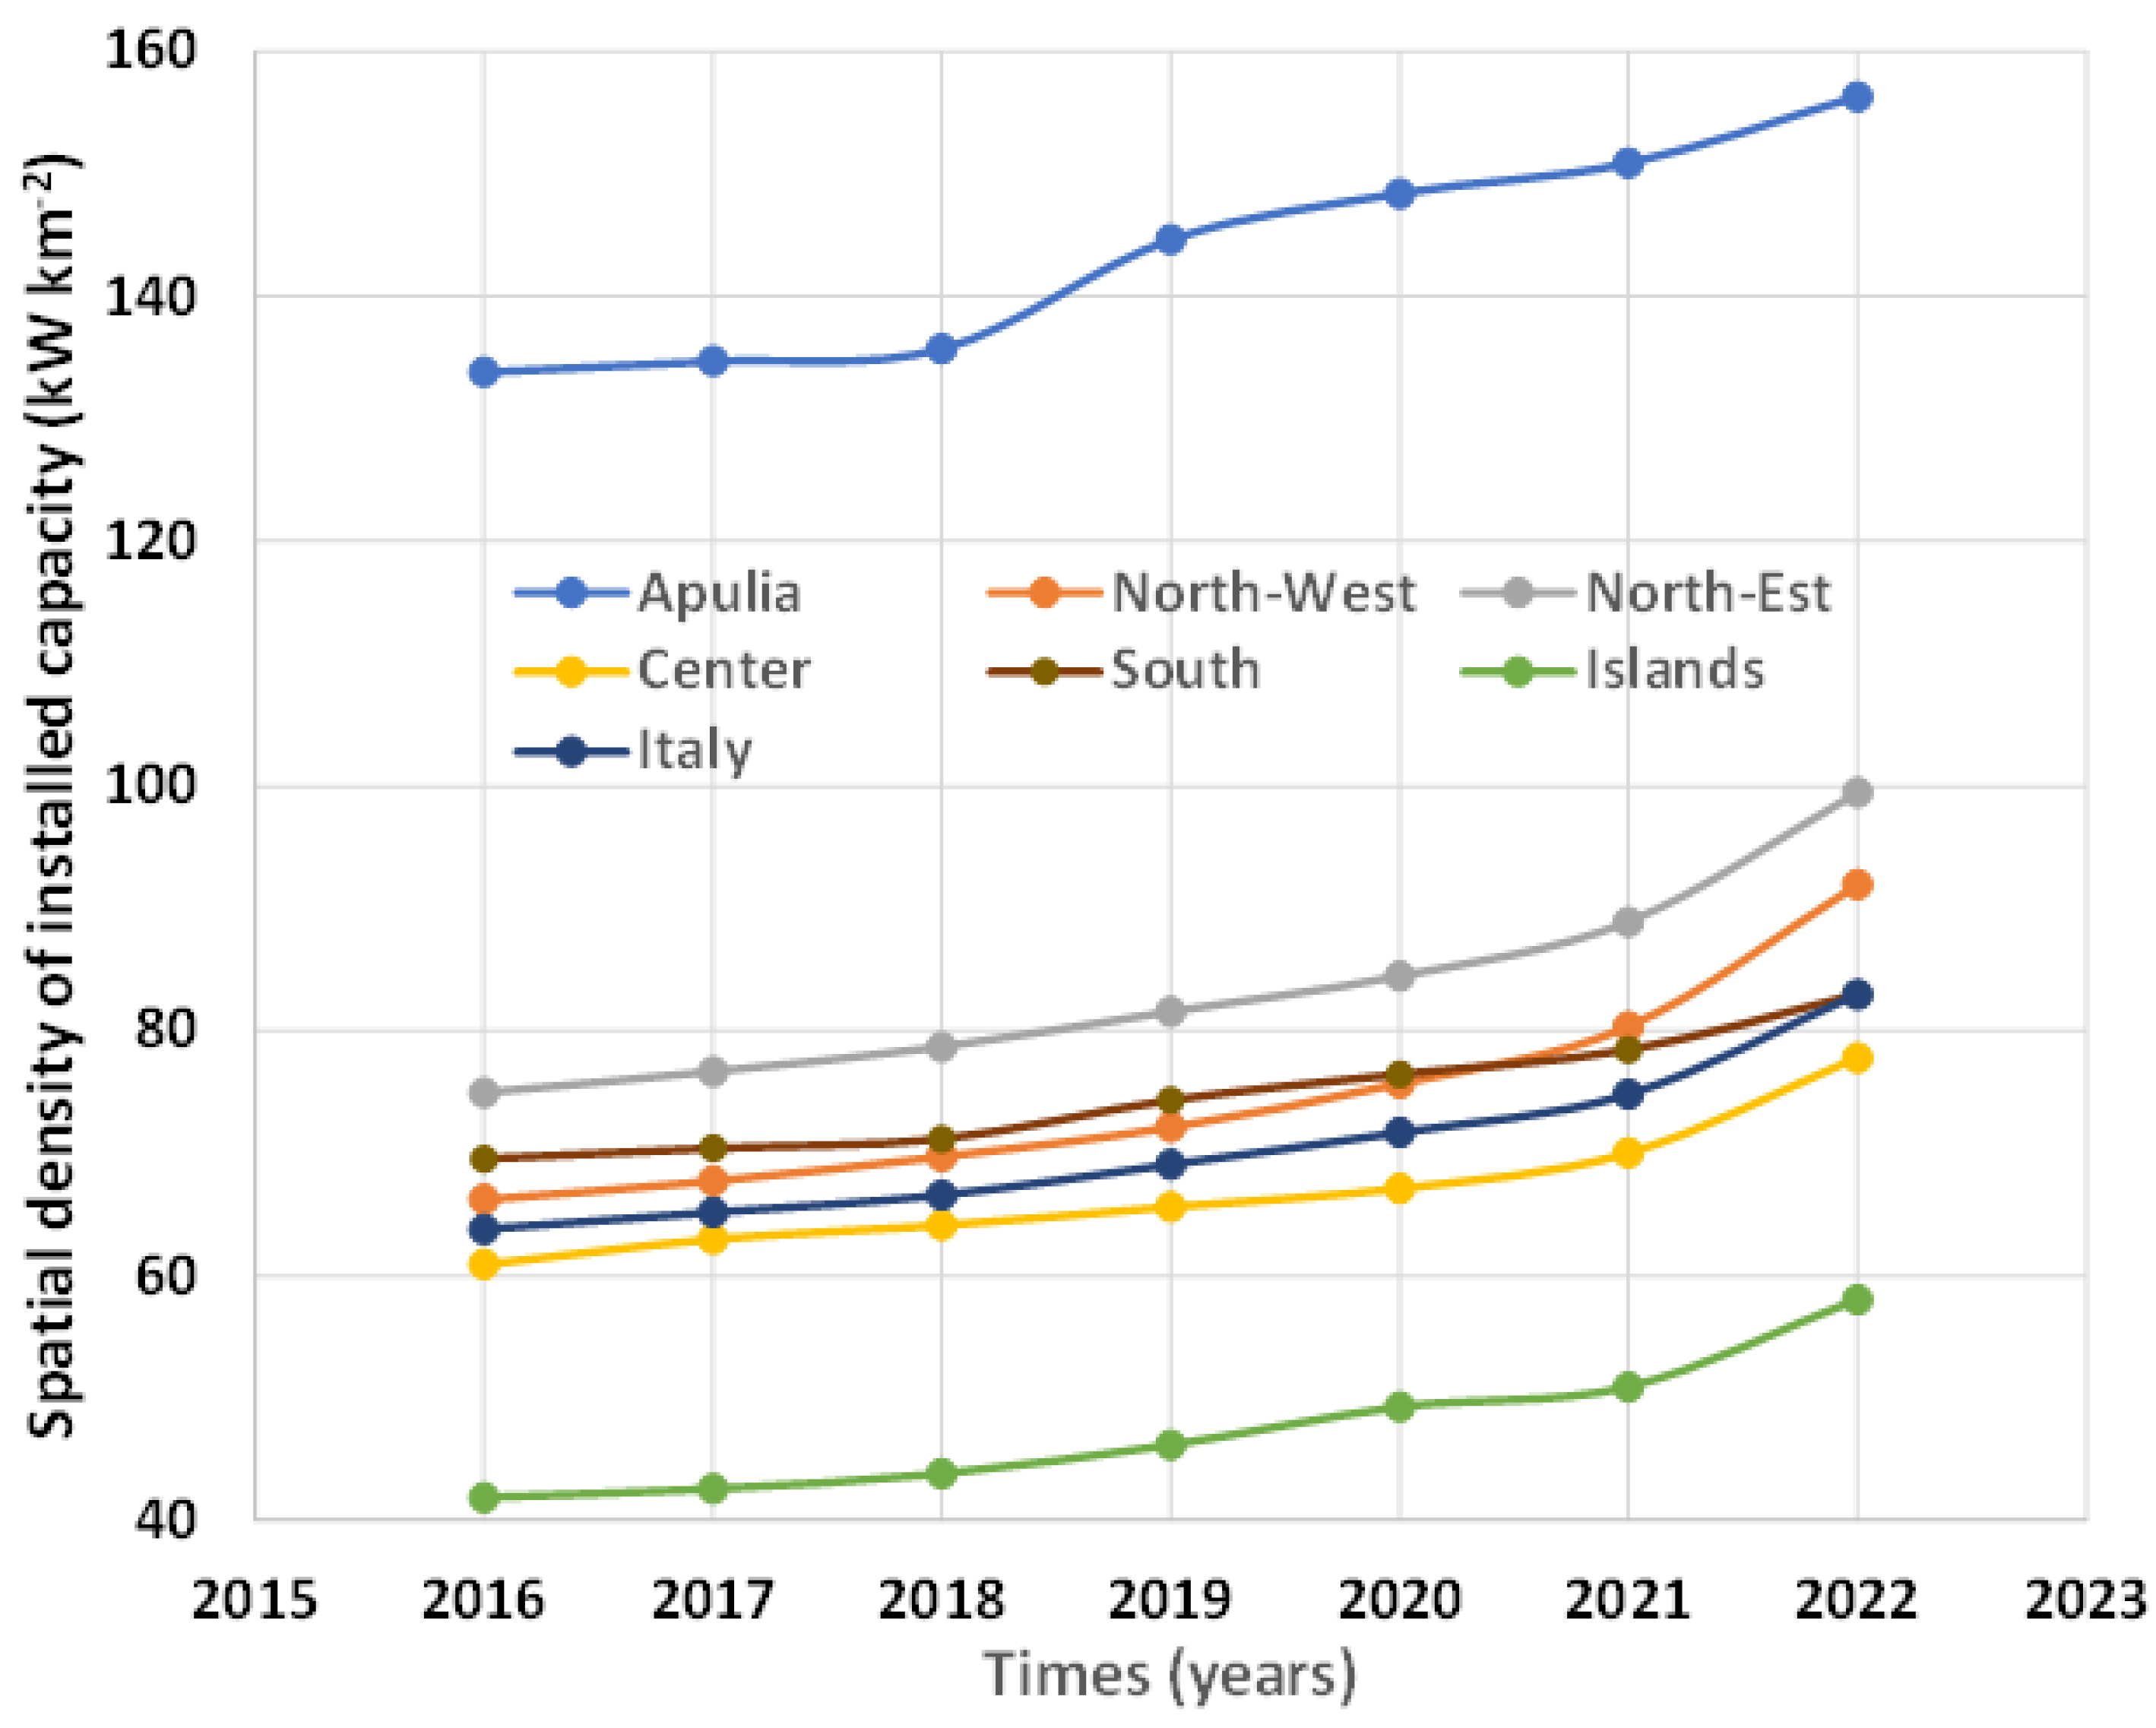
Figure 5.
Total Agricultural Area (TAA), Utilized Agricultural Area (UAA) and Non-Utilized Agricultural Area (NUA) with reference to the national scale (A) and the regional scale of Apulia (B). The data presented refer to the national agricultural censuses (from ISTAT).
Figure 5.
Total Agricultural Area (TAA), Utilized Agricultural Area (UAA) and Non-Utilized Agricultural Area (NUA) with reference to the national scale (A) and the regional scale of Apulia (B). The data presented refer to the national agricultural censuses (from ISTAT).
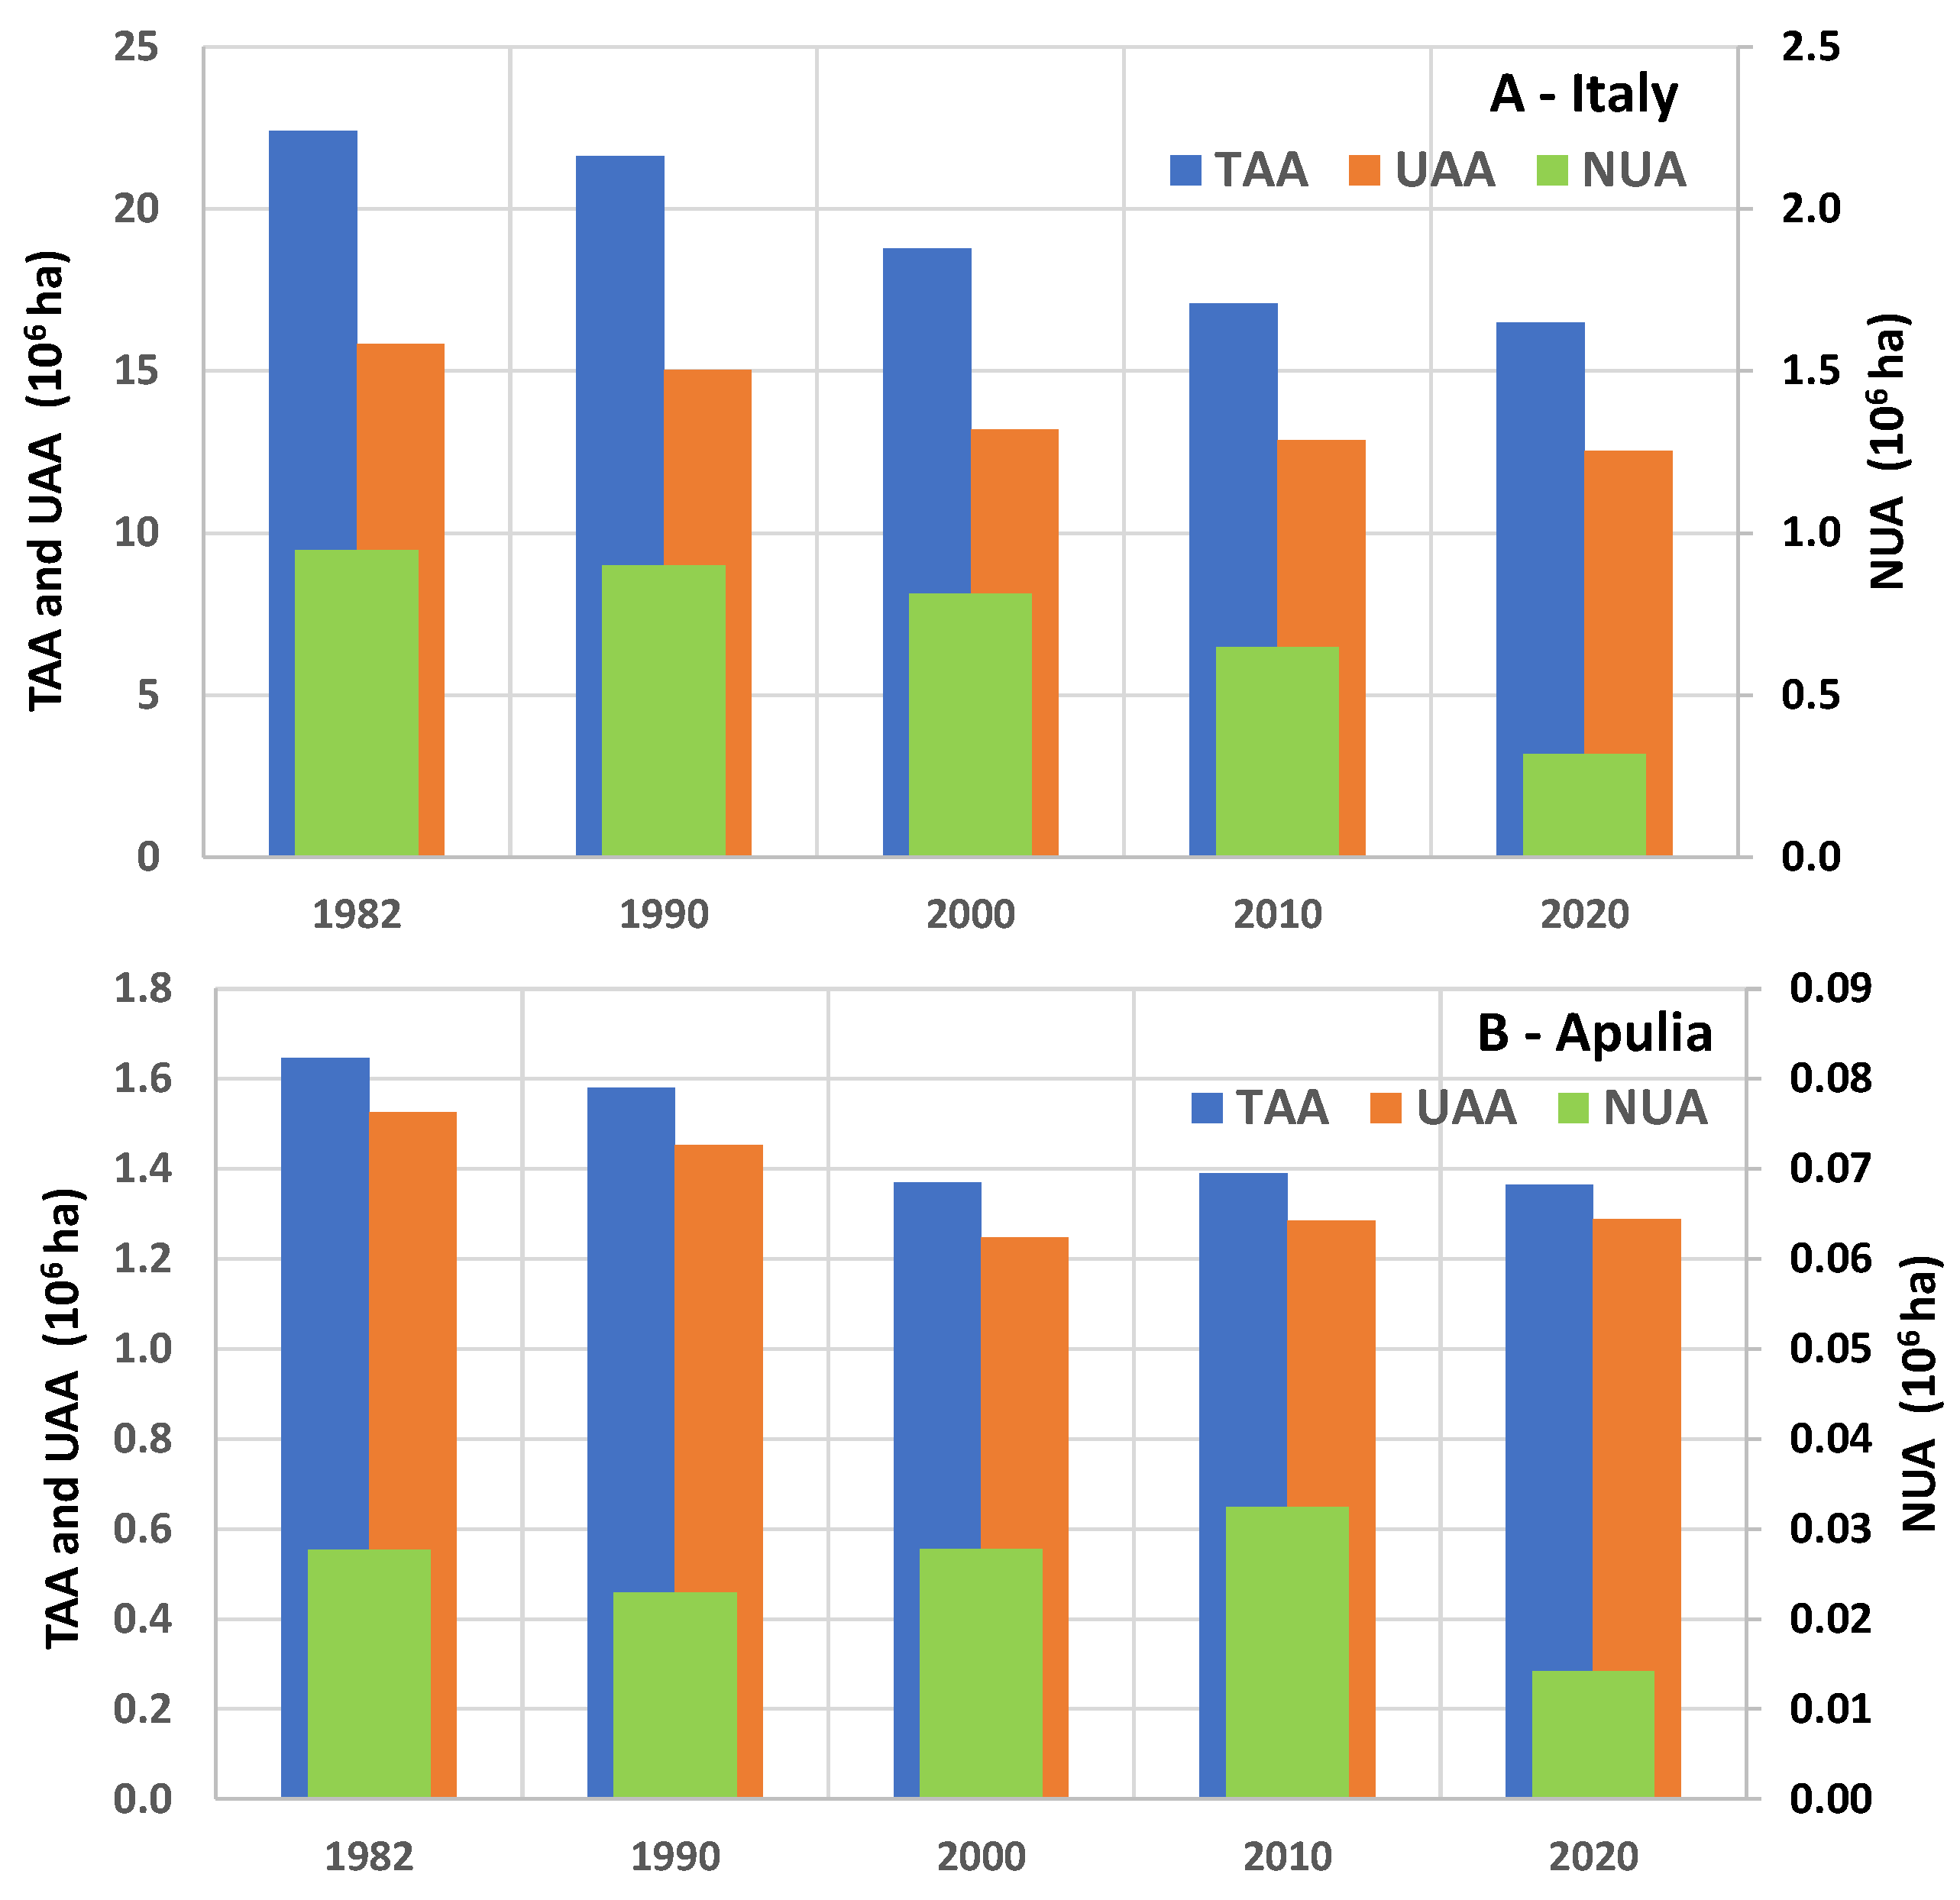
Figure 6.
Geographical maps (A, B and C) of each component of the "protection system" and of specific sets of constraints from both the Apulian Landscape Plan (ALP) and the Hydro-Geological Plan (HGP). Geographical map (D) of the entire regional constraint system.
Figure 6.
Geographical maps (A, B and C) of each component of the "protection system" and of specific sets of constraints from both the Apulian Landscape Plan (ALP) and the Hydro-Geological Plan (HGP). Geographical map (D) of the entire regional constraint system.
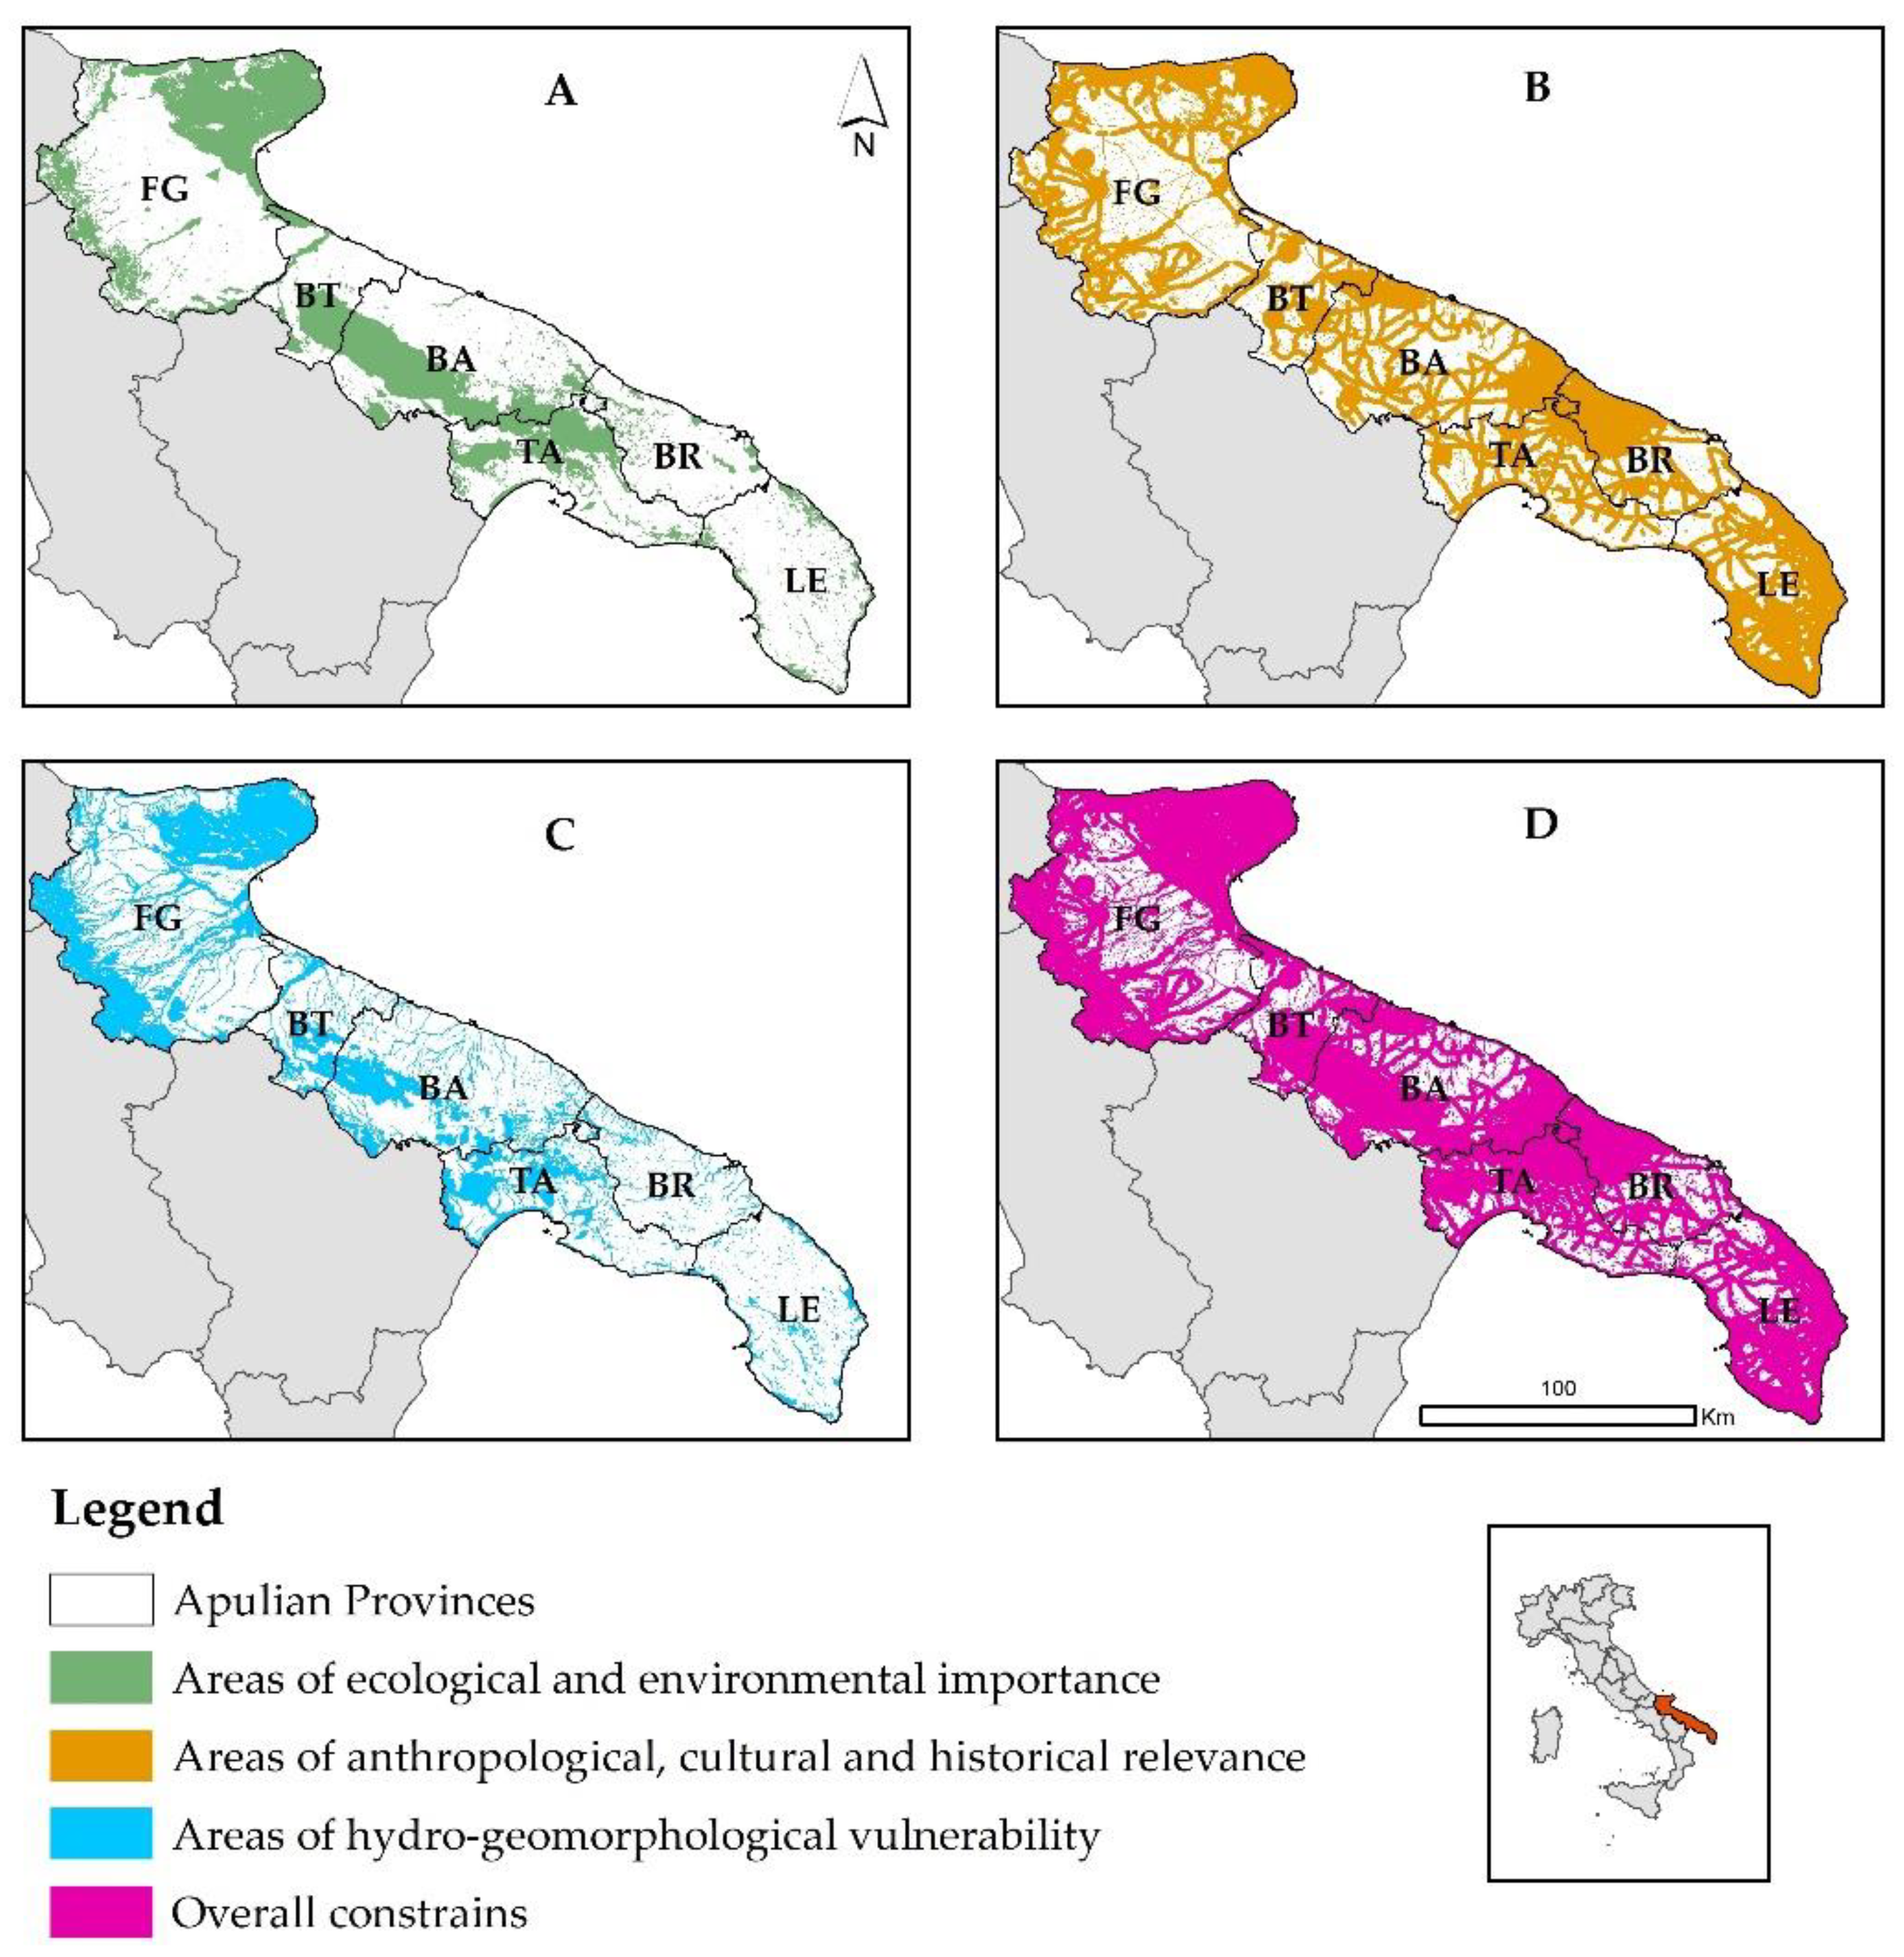
Figure 7.
Map of agricultural available areas (or availability map) for AV installations in the region of Apulia and its provinces.
Figure 7.
Map of agricultural available areas (or availability map) for AV installations in the region of Apulia and its provinces.
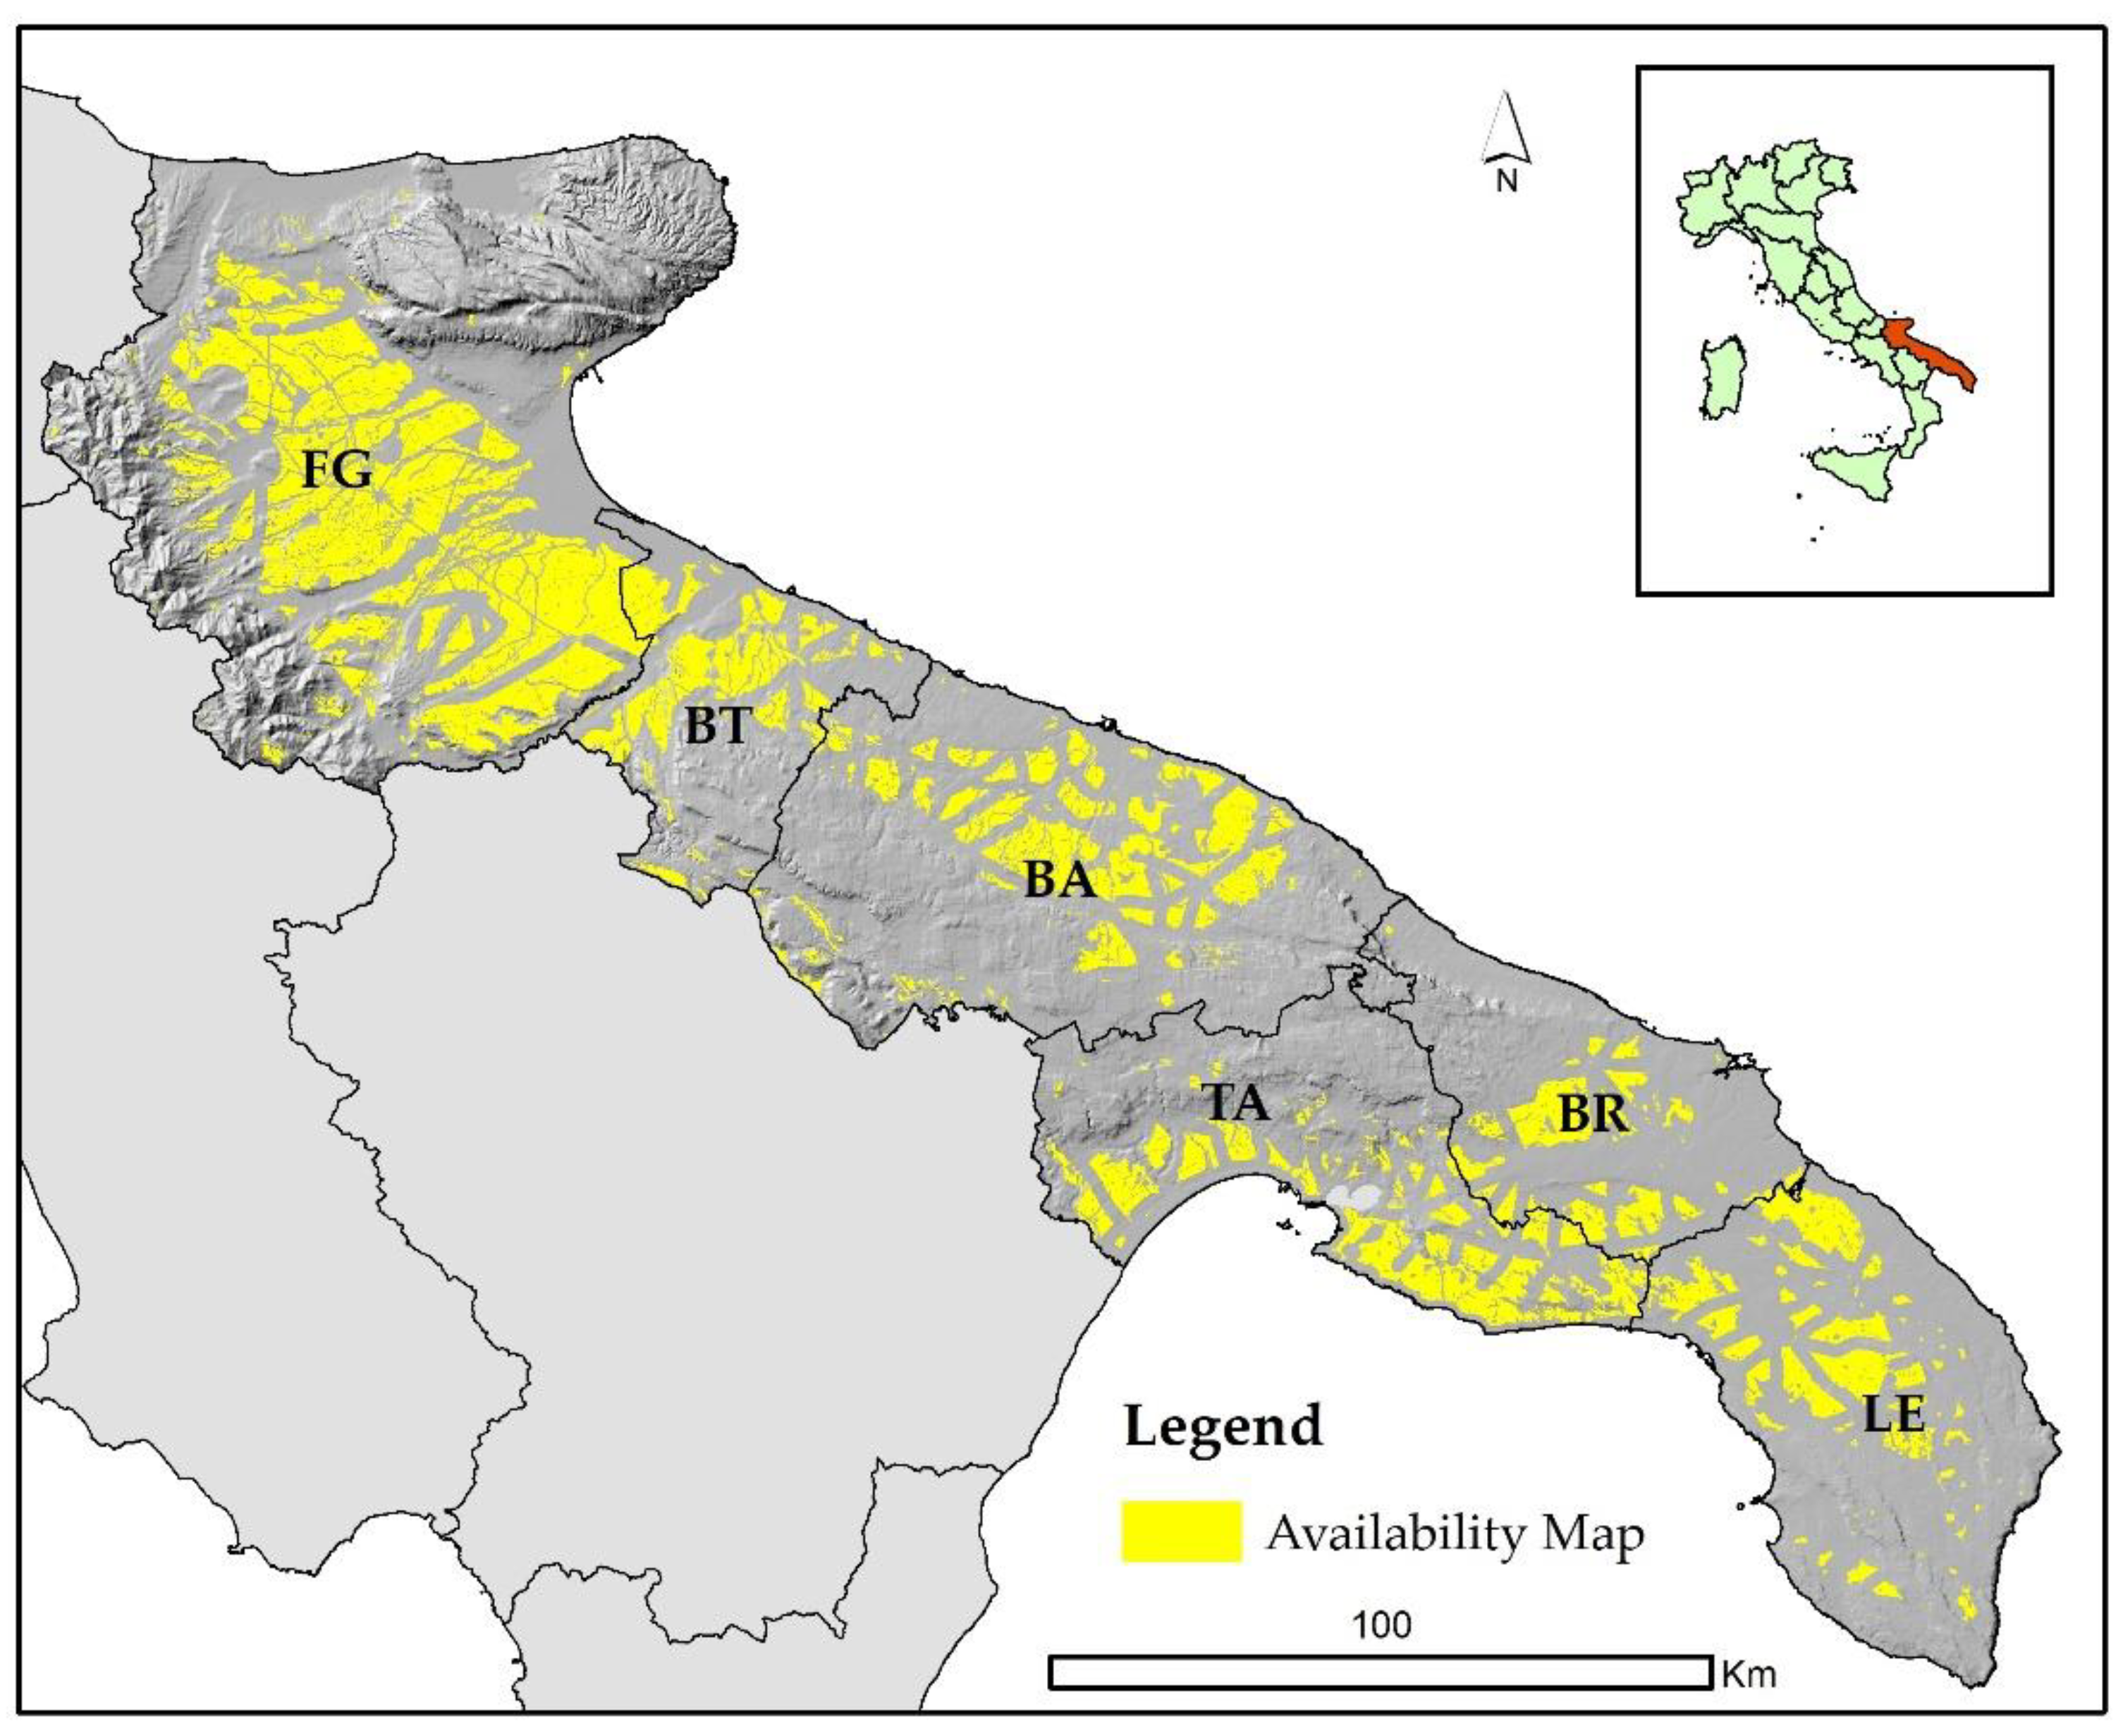

Table 1.
List of the protection criteria and constraints considered in the analysis according to the Regional Landscape Plan and the Hydro-Geological Plans.
Table 1.
List of the protection criteria and constraints considered in the analysis according to the Regional Landscape Plan and the Hydro-Geological Plans.
| Protection criteria and constraints | Description |
|---|---|
| a) Areas of ecological and environmental importance1 | (1) |
| Botanical and Vegetational components | Woods + 100 m buffer; Natural pastures, Shrublands, Wetlands. |
| Protected areas and naturalistic sites | Natural parks + 100 m buffer, Other sites of naturalistic interest. |
| b) Areas of anthropological, cultural and historical relevance 1 | (1) |
| Cultural and settlements components | Historical and cultural sites + buffer of 100 m; relevant rural landscapes; areas of archeological interest + 100 m buffer; sheep tracks network + 100 m buffer. |
| Landscape components | Scenic roads + 1 km buffer; view cones; scenic places + 1 km buffer. |
| c.1) Areas of hydro-geomorphological vulnerability 1 | (1) |
| Geomorphological components | Slopes greater than 20 %; blades and ravines; dolines; caves + 100 m buffer, geosites + 100 m buffer; sinkholes + 50 m buffer; dune belts. |
| Hydrogeological components | Coastal territories + 300 m buffer; territories contiguous to lakes + 300 m buffer; rivers, streams, watercourses + 100 m buffer; hydrographic network as a link to the ecological network + 100 m buffer; springs + 25 m buffer; areas of hydrogeological risk. |
| c.2) Areas of hydro-geomorphological vulnerability 2 | (2) |
| Hydrological hazard | - High hazard (HA): areas subject to flooding with a return period ≤ 30 years.- Medium Hazard (MH): areas subject to flooding with a return period between 30 and 200 years. |
| Geomorphological hazard | - High hazard (PG3): areas affected by active or quiescent landslide phenomena.- Medium hazard (PG2): areas characterized by the presence of two or more geomorphological factors predisposing the occurrence of slope instability and/or stabilized landslides. |
(1) From the Apulian Landscape Plan (ALP); (2) From the Hydro-Geological Plan (HGP) by the River Basin Authority (RBA).
Table 2.
Non-Utilized Agricultural Area (NUA) and Utilized Agricultural Area (UAA) in relation to the provinces of the Apulia region, together with the incidence (expressed in %) of the NUA on the UAA. under the (purely theoretical) hypothesis that all NUA would be used for this purpose.
Table 2.
Non-Utilized Agricultural Area (NUA) and Utilized Agricultural Area (UAA) in relation to the provinces of the Apulia region, together with the incidence (expressed in %) of the NUA on the UAA. under the (purely theoretical) hypothesis that all NUA would be used for this purpose.
| Province | NUA | NUA/UAA | AV Capacity |
|---|---|---|---|
| (ha) | (%) | (GW) | |
| BA | 3,145 | 1.20 | 1.26 |
| BR | 1,593 | 1.32 | 0.64 |
| BT | 866 | 0.80 | 0.35 |
| FG | 4,154 | 0.82 | 1.66 |
| LE | 1,744 | 1.14 | 0.70 |
| TA | 2,678 | 1.79 | 1.07 |
| Total (Apulia) | 14,183 | 1.10 | 5.67 |
Table 3.
Constrained areas according to the "protection system" of the Apulia region. The areas are reported according to the three criteria considered in the analysis (see the footnote legend).
Table 3.
Constrained areas according to the "protection system" of the Apulia region. The areas are reported according to the three criteria considered in the analysis (see the footnote legend).
| Province | Terr. Area (ha) |
Area EE (ha) |
Area ACH (ha) |
Area HGM (ha) |
Constr. Area (ha) |
Constr. Area (%) |
|---|---|---|---|---|---|---|
| BA | 382,478 | 134,040 | 223,251 | 107,839 | 292,025 | 76.35 |
| BR | 183,942 | 20,394 | 120,211 | 22,321 | 130,189 | 70.78 |
| BT | 153,003 | 51,258 | 77,431 | 46,624 | 108,001 | 70.59 |
| FG | 695,679 | 261,694 | 359,498 | 336,361 | 511,608 | 73.54 |
| LE | 276,230 | 34,937 | 210,048 | 37,193 | 217,430 | 78.71 |
| TA | 244,068 | 99,967 | 136,262 | 87,292 | 187,453 | 76.80 |
| Apulia | 1,935,400 | 602,290 | 1,126,701 | 637,630 | 1,446,706 | 74.75 |
Legend: Terr. area= the territorial area of the provinces and of the region as a whole; EE = Areas of ecological and environmental importance; ACH = Areas of anthropological, cultural and historical relevance; HGM = Areas of hydro-geomorphological vulnerability. Constr. Area: constrained areas are the result of applying the 'union' function of all the protected and constrained areas (i.e. EE, ACH and HGM).
Table 4.
Land allocation by agricultural capability classes for each province and the region as a whole, and their relative proportions with respect to the total land area.
Table 4.
Land allocation by agricultural capability classes for each province and the region as a whole, and their relative proportions with respect to the total land area.
| Province | A Terr. Area (ha) |
B LCC I-IV (ha) |
C LCC III-IV (ha) |
D B/A (%) |
E C/A (%) |
|---|---|---|---|---|---|
| BA | 382,478 | 290,095 | 213,153 | 75.85 | 55.73 |
| BR | 183,942 | 152,132 | 93,726 | 82.71 | 50.95 |
| BT | 153,003 | 117,374 | 94,470 | 76.71 | 61.74 |
| FG | 695,679 | 479,233 | 408,266 | 68.89 | 58.69 |
| LE | 276,230 | 204,449 | 152,844 | 74.01 | 55.33 |
| TA | 244,068 | 162,504 | 132,876 | 66.58 | 54.44 |
| Apulia | 1,935,400 | 1,405,788 | 1,095,334 | 72.64 | 56.59 |
Legend: A= the territorial area of the provinces and the region as a whole; B= agricultural areas with land capacity I to IV; C= agricultural areas with land capacity III to IV; D= relative ratio of B to A; E= relative ratio of C to A (both expressed as percentages).
Table 5.
Allocation of unconstrained agricultural land according to three selected feasibility criteria (see the footnote legend), potential available land for AV installations.
Table 5.
Allocation of unconstrained agricultural land according to three selected feasibility criteria (see the footnote legend), potential available land for AV installations.
| Province | FC.1 (ha) |
FC.2 within FC.1 (ha) |
FC.3 within FC.1 (ha) |
FC.2 or FC.3 within FC.1 (ha) |
|---|---|---|---|---|
| BA | 55,173 | 54,487 | 104 | 54,591 |
| BR | 24,725 | 24,725 | 0 | 24,725 |
| BT | 33,757 | 33,056 | 102 | 33,158 |
| FG | 162,741 | 159,342 | 736 | 160,078 |
| LE | 35,782 | 35,780 | 0 | 35,780 |
| TA | 42,087 | 41,982 | 33 | 42,015 |
| Apulia | 354,264 | 349,373 | 975 | 350,348 |
Legend: FC.1= first feasibility criterion: unconstrained LCC III-IV, referring to land without irrigation; FC.2= second feasibility criterion: as for FC.1 but selecting slope within 5%; FC.3= third feasibility criterion: as for FC.1 but selecting slope between 5 and 10% facing south; finally, the last column (FC.2 or FC.3 within FC.1) is the sum of FC.2 and FC.3 and represents the potential available land for AV installation.
Table 6.
Territorial areas, utilized agricultural areas and available areas for AV installations, together with the relative incidence of available areas in relation to territorial and utilized agricultural areas (expressed as percentages).
Table 6.
Territorial areas, utilized agricultural areas and available areas for AV installations, together with the relative incidence of available areas in relation to territorial and utilized agricultural areas (expressed as percentages).
| Province | Terr. Area (ha) |
UAA (ha) |
Available area (ha) |
Avail/Terr. (%) |
Avail/UAA (%) |
|---|---|---|---|---|---|
| BA | 382,478 | 262,924 | 54,591 | 14.27 | 20.76 |
| BR | 183,942 | 121,098 | 24,725 | 13.44 | 20.42 |
| BT | 153,003 | 108,270 | 33,158 | 21.67 | 30.63 |
| FG | 695,679 | 505,337 | 160,078 | 23.01 | 31.68 |
| LE | 276,230 | 152,954 | 35,780 | 12.95 | 23.39 |
| TA | 244,068 | 149,542 | 42,015 | 17.21 | 28.10 |
| Apulia | 1,935,400 | 1,300,125 | 350,348 | 18.10 | 26.95 |
Table 7.
Scenarios of Utilized Agricultural Area (UAA) addressed to the installation of AV systems. Two scenarios are compared: a lower scenario (0.5% UAA) and an upper scenario (1% UAA). Simulation results are reported in terms of installed power.
Table 7.
Scenarios of Utilized Agricultural Area (UAA) addressed to the installation of AV systems. Two scenarios are compared: a lower scenario (0.5% UAA) and an upper scenario (1% UAA). Simulation results are reported in terms of installed power.
| Province | UAA (ha) |
Available area (ha) |
Lower Scenario Power Capacity (MW) |
Upper Scenario Power Capacity (MW) |
|---|---|---|---|---|
| BA | 262,924 | 54,591 | 526 | 1,052 |
| BR | 121,098 | 24,725 | 242 | 484 |
| BT | 108,270 | 33,158 | 217 | 433 |
| FG | 505,337 | 160,078 | 1,011 | 2,021 |
| LE | 152,954 | 35,780 | 306 | 612 |
| TA | 149,542 | 42,015 | 299 | 598 |
| Apulia | 1,300,125 | 350,348 | 2,600 | 5,201 |
Disclaimer/Publisher’s Note: The statements, opinions and data contained in all publications are solely those of the individual author(s) and contributor(s) and not of MDPI and/or the editor(s). MDPI and/or the editor(s) disclaim responsibility for any injury to people or property resulting from any ideas, methods, instructions or products referred to in the content. |
© 2025 by the authors. Licensee MDPI, Basel, Switzerland. This article is an open access article distributed under the terms and conditions of the Creative Commons Attribution (CC BY) license (http://creativecommons.org/licenses/by/4.0/).
Copyright: This open access article is published under a Creative Commons CC BY 4.0 license, which permit the free download, distribution, and reuse, provided that the author and preprint are cited in any reuse.


