
Submitted:
02 April 2025
Posted:
02 April 2025
You are already at the latest version
Abstract
As one of the main routes of vaccine production, cell suspension culture technology has become an inevitable trend in the development of biopharmaceutical industry. Its main advantage is that it can maximize the product quality while achieving high yield through accurate and effective process control means. As the basic material needed in the process of cell suspension culture, cell culture medium mainly provides energy through substances such as glucose. In order to obtain high-quality and high-performance cell products, it is necessary to continuously monitor the culture process. Traditional biochemical method can achieve the purpose of monitoring, but the detection cycle is long which making it hard to meet the needs of real-time monitoring. In contrast, Near-infrared (NIR) spectroscopy can detect glucose concentration in cell culture medium in real time without loss and it has the advantages of fast, accurate, and high sensitivity. In this study, a partial least squares regression (PLSR) model was established based on the near infrared spectrum of cell medium containing a certain amount of glucose to verify its validity and feasibility. Efforts have been made on the processing of sample outlier, spectrum preprocessing and wavelength optimization method. And good prediction results were obtained with the coefficient of determination (R2) of the model was 0.998, the cross-validation mean square error (RMSECV) was 0.0036 and the residual prediction deviation (RPD) value was 4.15. On this basis, in order to further improve the prediction accuracy of the model, this paper introduced glutamine variables to establish a multi-component fusion model and further optimized the combined wavelength selection method. The results showed that the model could achieve better prediction accuracy when using our proposed optimization method which indicated that the method of real-time detection of glucose concentration in cell medium based on near infrared spectroscopy was feasible.
Keywords:
Cell medium
; Near-infrared spectroscopy
; Stoichiometry
1. Introduction
In recent years, on the one hand, with the change of population structure and people’s awareness of disease prevention, the demand for biological products such as vaccines and therapeutic drugs has increased rapidly around the world. On the other hand, considering the particularity of its use scenarios and groups, the requirements for the quality of related products are also getting higher and higher. Many biological drugs are obtained by cell culture. The instability in the culture process will make the product quality and yield of different batches inconsistent, which means it will affect the safety of drugs. And on the other hand, it will also affect the production cost of enterprises. Therefore, in order to improve the yield and supply efficiency while minimizing the production cost of vaccines under the premise of the safety and effectiveness of vaccine products, the cell culture process needs to be strictly monitored. And appropriate detection technologies and analytical methods can help optimize this process quickly.
In the process of cell culture, the medium can provide sufficient nutrients for cell growth as well as a good growth and metabolic environment, wherein the cell energy in the cell culture medium is mainly provided by glucose. Therefore, in order to obtain more stable and better-quality vaccine products or biological drugs, the concentration of glucose in the cell culture medium should be strictly maintained within a fixed range. The by-products of glucose metabolism can inhibit cell growth and protein, which is not conducive to glycosylation of protein products. High concentration of glucose will accelerate the production of lactic acid, resulting in a decrease of living cells. Conversely, a low glucose concentration is not sufficient to provide the minimum energy for cell growth, resulting in slow or stagnant growth. In addition, the introduction and proliferation of bacteria such as Staphylococcus aureus can also cause abnormal consumption of glucose and other components, which means a possible threat to the cell culture process. In order to overcome these effects, many research groups have analyzed and monitored the changes in physical parameters of cell culture medium and the concentration of target products online in real time. Maintaining glucose as the main carbon source at a constant level to reduce the generation of metabolic inhibitors and solve different problems that may occur in the culture process.
Near-infrared spectroscopy (NIRS) has been widely used in various fields because of its advantages of safety, speed, non-destructive, simultaneous detection of multiple components, etc. The research on the changes of characteristic spectral that caused by glucose concentration is relatively mature [1,2,3,4,5]. At present, standard near-infrared measurement methods have also been established in the production of vaccines, biopharmaceutical production and other related fields. Combined with stoichiometric methods, they can effectively detect the concentration of related components in cell media containing C-H bonds, O-H bonds, and N-H bonds by establishing reliable and accurate quantitative models. For example, Takuya et al. [6] collected spectroscopy of CHO cell culture by an online ultrasound assisted near-infrared spectrometer and predicted the glucose concentration in it through a calibration model established by partial least squares regression. SG filter was adopted in their research for pre-processing and the measurement error was 0.6%. Daniel [7] used different spectral models to monitor glucose in cell media and distinguish the specificity that exists between different cell media batches. Austin et al. [8] used various methods of orthogonal signal correction (OSC) combined with partial least square method to predict the glucose and other components in samples. Results indicated that the method of DOSC increased the glucose standard prediction error (SEP) by 4.6%. The principle and process of real-time online monitoring of nutrients or metabolites in the medium through NIRS to realize the monitoring of the culture process is relatively simple. The difference between it and the traditional detection method is that the glucose concentration is not directly measured, but used the mathematical correction mode as a bridge to achieve indirect measurement. It can be said that the establishment of quantitative model plays a key role in it and its reliability directly affects the accuracy of analysis results. This paper focuses on the application of near-infrared spectroscopy in the real-time monitoring of glucose concentration in cell culture medium and the selection of stoichiometric methods in the analysis process. The key of the research process is how to maximize the accuracy of the prediction model and make it more stable and universal. On the one hand, through the reasonable selection of spectral pretreatment method and the introduction of wavelength screening method to determine the joint modeling interval, the detection accuracy of glucose concentration in cell culture medium based on NIRS technology was further improved while simplifying the model. On the other hand, considering the influence and interference of other components, a multi-component fusion model was established by introducing other component variables to increase the universality of the prediction model. On this basis, aiming at the problem of declining prediction accuracy of the model, wavelength optimization was further proposed based on the best joint interval proposed above. And results all verified the effectiveness of the proposed method.
2. Theory and Method
2.1. Selection of Characteristic Wavelengths
The model in NIR quantitative analysis is realized by stoichiometric software and algorithms commonly used multiple linear regression, partial least square method, principal component regression analysis, etc [9]. These algorithms usually apply the full band spectral information of near-infrared spectra to establish regression model with the purpose of improving the information content and solving the influence of spectral peak overlap and complex background. However, the data of each spectrum also contains measurement errors. It means that the more data used in the model, the greater the measurement errors. Moreover, the processing of complex spectral data also requires a large amount of calculation, which are time consuming and inefficient. Therefore, in order to reduce some spectral regions with poor information but large distortion in the NIR spectrum, it is quite necessary to optimize the wavelength that used in regression model [10,11]. That is, selecting the wavelength variables with high correlation with the measured components.
iPLS (interval partial least squares, iPLS) and siPLS (synergy interval partial least squares) are adopted in this paper for the wavelength optimization [12,13,14]. iPLS segments the full spectrum to several subintervals with the same width. A functional relationship is established between the component content to be measured and the wavelength variable of each subinterval. Then regression analysis is carried out and the RMSECV value of each subinterval can be obtained through interactive verification. The smaller the RMSECV value is, the more information of components to be measured can be reflected. However, a single interval is used in iPLS to modeling analysis, which easily leads to the loss of important spectral information. In contrast, siPLS can select the optimal variables more comprehensively based on iPLS. Several intervals with small RMSECV of the above subintervals are selected and combined as a joint wavelength region to establish the model to improve the prediction accuracy of it.
2.2. The Optimal Method
Considering the universality of the method or model [15], a multi-component fusion model is established by introducing variables in this part. And the wavelength optimization method is also further improved.
2.2.1. The Multi-Component Fusion
Amino acids, as one of the indispensable components in large-scale cell culture, will change and consume with different proteins expressed by cells during the culture process. Glutamine and glucose contain similar functional groups, thus the concentration of glutamine in cell culture medium may have influence on the detection of glucose. In order to make the prediction model more accurate and better applied to actual production, a multi-component fusion model was established by introducing glutamine variables in the experiment.
2.2.2. siPLS-LASSO Wavelengths Selection Method
The information contained in multicomponent fusion spectra is more complex. Although the wavelength optimization method mentioned in section 2.1 could also obtain better results compared with full wavelength modeling, the effect is somewhat decreased in terms of accuracy or correlation between predicted value and actual value when introducing another variable. For this, the siPLS-LASSO wavelength selection method is adopted in this section. Instead of simply selecting the modeling interval according to the value of RMSE of subintervals obtained by iPLS, the LASSO method [16] is introduced to determine the optimal combination variable.
3. Experiments
3.1. Sample Preparation
This paper consisted of two kinds of samples with single glucose variable and multi-component variables respectively. The glucose concentrations of samples were measured using a high-precision testing instrument. In each experiment, five samples were randomly selected from the sample pool to ensure the stability and integrity of glucose concentration in the cell culture medium.
(1) Sample with single glucose variable
1L DMEM low-sugar liquid culture medium samples with fixed components were selected and divided into 20 equal parts according to the fixed proportion. The culture medium samples containing different concentrations of glucose were prepared with 1mM as the concentration gradient. After preparation, the culture medium samples were left stand for two hours at room temperature of 26°C and relative humidity of 40% ensure that the cell medium was fully fused with the newly added glucose of different concentrations.
(2) Sample with multi-component variables
Using the same method as (1), the following three types of cell culture medium samples were prepared in this part:
1) Only contained different concentrations of glucose with 1mM as the concentration gradient.
2) Only contained different concentrations of glutamine with 0.5mM as the concentration gradient.
3) Contained different concentrations of both glucose and glutamine with 1mM and 0.5mM as the concentration gradient respectively.
3.2. Spectrum Acquisition
NIRQuest spectrometer (HALMA, UK) was used for spectral acquisition. The resolution was set to 9.0nm. Measurement wavelength ranged from 900 nm to 1700nm. Integration time and average frequency were set to 3ms and 10 respectively. Before collecting the sample spectrum, the background spectrum was recorded first. Then the background spectrum was automatically subtracted after obtaining the sample spectrum.
The light source is HL-2000-FHSA halogen light source (Ocean Optics, Inc., USA), which integrated functions of fan cooling, shutter, and manual attenuator to ensure continuous and stable light output. In addition, in order to avoid interference that may be introduced by ambient light, the experiment was conducted in a dark environment. The experimental diagram and system diagram were shown in Figure 1.
4. Results and Discussion
4.1. Subsection
Glucose (C6H12O6), in which the hydrogen-containing groups (methyl and hydroxyl) are the main genes of near-infrared light absorption, has second-order frequency doubling absorption at 900-1200nm and first-order frequency doubling absorption at 1400-1800nm. The original spectra of 20 cell culture medium samples were shown in Figure 2.
It could be seen from the results shown in Figure 2 that the trend of changes in the original absorption spectra of cell medium with different concentrations of glucose was basically the same.
Corresponding to the characteristic absorption wavelength of glucose, the spectrum varies greatly depending on its concentration. Obvious intensity changes could be observed at 925nm, 1074nm and 1269nm. In addition, no significant changes were observed in the first-order frequency doubling absorption region of glucose from the original spectrum. It mainly because the cell medium was a water system, and the absorption peak of water (1440 ~ 1470nm) was close to that of glucose which would mask the spectral changes caused by changes in glucose concentration. Therefore, stoichiometric methods were applied to further extract the effective information in the spectral data.
4.2. Modeling of Single Glucose Variable
4.2.1. Outliers Excluding
With Residual (the absolute error of chemical value) and spectral Leverage as the criteria, the outliers in the samples were excluded. The threshold of leverage value was set to 1.8 and Residual was set to 52. Principal component regression and total cross-validation methods were used to calculate all the spectral and chemical values of the cell culture medium samples. Results were shown in Figure 3.
As can be seen from Figure 3, the Leverage of the sample with a glucose concentration of 9.5mmol/L exceeded the set threshold. Therefore, this value was determined as the sample outlier in the spectral data set and then removed from the spectral data set in the subsequent modeling.
4.2.2. Determination of the Optimal Potential Variables
The principal component analysis method was used to extract the most relevant information of glucose in the cell culture medium to the linear combination potential variable representing the original variable, so that the dimension of the strongly correlated X dataset was reduced, and the best number of potential variables of the original dataset and the simulated spectral independent dataset were estimated, as shown in Figure 4.
As can be seen from the results of the principal component analysis, the variance contribution rate of the first two principal components, PC1 and PC2, reached 96.88%, of which the variance contribution rate of PC1 was 94.66% and that of PC2 was 2.22%. This indicates that almost all samples can be analyzed to the maximum extent through only two principal components. Starting from the third principal component, the contribution degree became smaller and smaller, which could be neglected. Therefore, the optimal number of potential variables of the model was finally determined to be 2.
4.2.3. Selection of Spectral Pretreatment Method
In order to improve the spectral quality and the accuracy of the prediction model, 15 methods such as first derivative (1st Der), second derivative (2nd Der), convolution smoothing (SG), moving average smoothing (MA), vector normalization (SNV), multivariate scattering correction (MSC) and standardization (N) were used to preprocess the spectra.
By comparing the modeling results of different pretreatment methods, R2, RMSECV and RPD values were taken as the main evaluation indicators. Then the optimal pretreatment method was selected according to the principle of minimum RMSECV value and maximum R2 and RPD, as shown in Table 1.
It could be seen from the results in the table that the prediction ability of the spectral model of cell culture medium samples was improved to varying degrees after pretreatment with the above methods. Among them, the first-order derivative combined with convolutional smoothing and vector normalization showed a best effect. The R2 and RPD of the corresponding model are higher than those of other models, and the RMSECV was lower than those of other models. The values of R2, RPD and RMSECV were 0.991, 0.0081, 4.30 respectively. Based on this, the method of 1st Der+SG+SNV was chosen to pretreatment the original spectra.
4.2.4. Selection of Characteristic Wavelengths
iPLS algorithm was used to segment the pre-processed NIR spectra in the above section into 5, 10 and 15 sub-intervals, and the partitioning results were shown in Figure 5. It could be seen that the modeling results obtained by different subintervals were not the same. When the number of intervals was 5, the second sub-interval with the wavelength range of 1061~1221nm achieved the smallest RMSECV, 0.0041. In contrast, the RMSECV of the fifth subinterval model was as high as 1.2. it was mainly because no significant absorption of glucose or water exited in this band. Similar modeling results could be obtained when the intervals were 10 or 15. In addition, compared with the full-band modeling results shown in Table 1 (under the optimal preprocessing combination), RMSECV had been significantly improved when a single subinterval with feature absorption was used for modeling.
In each large interval, the two sub-intervals with the smallest RMSECV value were selected. For example, the second and third sub-intervals were selected when the intervals were 5 and represented by 5 (2) and 5 (3) respectively. A model was established for the random combination of these 6 sub-intervals and the results of sub-interval selection and evaluation indicators were shown in Table 2.
It should be noted that due to the overlap of sub-interval bands under different number of divided intervals, the combination of three intervals appeared in Table 2. However, the wavelength bands were still 2.
As can be seen from Table 2, when 2 or 3 subintervals with low RMSECV were selected together, the established siPLS prediction model showed a better effect. Among them, the RMSECV obtained by modeling was 0.0036 when 10 (3), 15 (5) and 15 (9) intervals were adopted corresponding the wavelength ranges of 1061-1165nm and 1325-1376nm. The position of selected wavelength in the original spectrum was indicated in Figure 6. The corresponding wavelength was the optimal wavelength extracted by the siPLS method, which contained 157 wavelength variables.
A PLSR model was established for the pre-treated spectrum in the preferred band, and the results were shown in Figure 7. Compared with the full-band modeling, the R2 was increased by 0.7% and the RMSECV was reduced by 125% after wavelength optimization. It showed that the model was of good prediction ability and strong robustness. And only 30% of the wavelength information of the full spectrum was used which indicating the reduction of the amount of computation. In addition, the result was also improved to a certain extent compared with a single interval modeling. Compared with the minimum RMSECV shown in Figure 7 (when the total number of intervals was 15 and the wavelength range of the fifth sub-interval was 1113-1165nm, the RMSECV was 0.0038), R2 was increased by 0.1% and RMSECV was decreased by 5.5%.
4.3. Modeling of Multi-Component Variables
The spectra of the three types of samples mentioned in Section 3.1 were collected as shown in Figure 8. It could be seen that, on the one hand, the spectra of the three types of cell culture-medium corresponding to different component concentration changes were basically consistent in the trend of morphological change. On the other hand, affected by the change of concentration, difference could be observed in various wavelengths, especially the wavelengths where specific absorption occurred, such as 925nm, 1074nm, 1269nm.
Similar to the analysis methods in Section 3.2, abnormal samples were removed (cell culture medium samples with glucose concentration of 6.5mmol/L), the optimal number of variables was determined, and spectrum pretreatment was performed. Due to space limitations, it would not be shown in detail here. In order to displayed the optimization effect more intuitively, the wavelength selection method in Section 1.1 was first used to determine the characteristic wavelength of the pre-treated spectrum (the process was the same as 3.2.4). Then the multi-component modeling analysis was carried out. The results were shown in Figure 9.
According to the results, the R2 and RMSECV of the multi-component fusion model using the conventional wavelength screening method were 0.910 and 0.0893 respectively. Compared with the modeling effect of single glucose model, R2 decreased by 8.89% and RMSECV increased by 0.0857mM. The main reason for this result was that the addition of other components increased the complexity of the model and put forward higher requirements for its accuracy and stability. Therefore, this section conducted a more in-depth exploration, that is, further optimized the wavelength selection based on the optimal joint spectral subinterval by using the siPLS-LASSO wavelength screening method mentioned in Section2.2.2.
4.3.1. Selection of Characteristic Wavelengths
Figure 10 showed the variation of variable coefficient and model variance in the Lasso regression process with the change of λ. The ordinate was the root-mean-square error which used to calculate the difference between the predicted value and the true value of the model and the dashed line on the left indicated the horizontal coordinate corresponding to the minimum RMSE obtained through 5-fold cross-validation. It could be seen that the RMSE was minimum when λ was 0.02.
The process of reducing the number of variables and adjusting coefficients in the LASSO model was shown in Figure 11 and the ordinate represented the coefficients of each variable in the model. This graph reflected the importance of each variable with different colored lines representing different variables. The influence of the penalty term λ on the variable coefficients was negatively correlated with the importance of the variables. With the increase of the penalty term λ, some unimportant variable coefficients soon became 0. And the more important the variables were, the more they could be retained to the end.
After LASSO wavelength screening, the wavelength range obtained included 946~969nm, 1050~1057nm, 1091~1099nm, 1121~1163nm, 1312~1342nm and 1358~1558nm. Combined with siPLS method, the wavelength regions further reduced to 1091~1099nm, 1121~1163nm, 1325~1342nm and 1358-1376nm. 87 wavelengths were included and he positions of them in the original spectrum were shown in Figure 12.
4.3.2. Modeling Results
Similarly, a PLSR model was established for the pre-treated spectrum in the preferred band and the results were shown in Figure 13.
According to the results shown in the figure, R2 was increased by 1.6% and the RMSECV was reduced by 8.9% compared with the modeling with the joint interval, which indicated that the proposed siPLS-LASSO wavelength screening method was helpful to improve the accuracy of the model. In addition, the characteristic spectral information optimized by siPLS-LASSO method only accounted for 16.6% of the total spectrum, which further reduced the calculation amount and improves the efficiency while improving the accuracy.
Then 20 samples not used for model building were selected randomly as external validation sets to verify the reliability and generalization ability of the prediction model. Results were shown in Table 3. The R2, RMSECV and RPD of external validation were 0.925, 0.0820 and 2.98 respectively, and all evaluation indicators met the requirements of the quantitative model.
5. Conclusions
In this study, the concentration of glucose in cell culture medium was predicted accurately, quickly and in real time based on near infrared spectroscopy and chemometrics, which has certain significance for vaccine production and preparation. In order to further improve the prediction accuracy and universality of the model, the methods of outlier removal, optimal variable determination, optimal preprocessing, and characteristic wavelength selection that involved in the analysis process were explored in this paper. Firstly, NIRS of glucose in cell medium was obtained taking DMEM low-glucose liquid medium as the research object. And conventional pretreatment methods including first-order derivative, vector normalization, multiple scattering correction et al. were used to pretreat it. Combined with the quantitative results of PLSR model, it was found that the pre-processing method of first derivative combined with convolutional smoothing and vector normalization (1st Der+SG+SNV) was more suitable for this study. Then iPLS and siPLS were used to optimize the wavelength selection. The results showed that the prediction accuracy of the model was improved significantly compared with full-wavelength modeling. In one case, R2 was increased by 0.7% and the RMSECV was reduced by 125% after wavelength optimization. And the model was simplified.
Secondly, the glutamine variable was introduced into the real-time monitoring of glucose concentration in cell culture medium to increase the universality of the prediction model and the multi-component fusion model of glucose concentration prediction was established. A better prediction result was achieved by using the spectrum preprocessing and the joint interval mentioned above.
In addition, siPLS-LASSO wavelength selection method was further used to optimize the multi-component fusion model. According to the modeling results, after the introduction of the new wavelength screening method, all factors of the model were significantly improved, including the determination coefficient (R2) value increased by 1.6%, and the cross-validation root mean square error (RMSECV) value decreased by 8.9%. Although the prediction ability of this model was reduced compared with the prediction model with a single component change, it had still achieved a good prediction effect overall. And its universality was greatly improved, so it was expected to be applied to vaccine production in the future.
Funding
This research was funded by National Natural Science Foundation of China (grant number 61905176).
Conflicts of Interest
The authors declare no conflicts of interest.
References
- Kaneko H.; Kono S.; Nojima A., et al. Transfer learning and wavelength selection method in NIR spectroscopy to predict glucose and lactate concentrations in culture media using VIP-Boruta. Analytical Science Advances 2021, 2(9-10), 470-479. [CrossRef]
- Pemberton R. M.; Xu J.; Pittson R., et al. A screen-printed microband glucose biosensor system for real-time monitoring of toxicity in cell culture. Biosensors and Bioelectronics 2011, 26(5), 2448-2453. [CrossRef]
- Clavaud M.; Roggo Y.; Daeniken R. V., et al. Chemometrics and in-line near infrared spectroscopic monitoring of a biopharma- ceutical Chinese hamster ovary cell culture: Prediction of multiple cultivation variables. Talanta 2013, 111, 28-39. [CrossRef]
- Hazen K.H.; Arnold M.A.; Small G.W. Measurement of Glucose in Water with First-Overtone Near-Infrared Spectra. Appl. Spectrosc. 1998, 52(12), 1597–1605. [CrossRef]
- Rani A.; Singh V., et al. Prospects and Limitations of Non-Invasive Blood Glucose Monitoring Using Near-Infrared Spectroscopy. Biomed. Signal Process. Control. 2015, 18, 214-227. [CrossRef]
- Kambayashi T, Noguchi T, Nojima A, et al. Glucose monitoring in cell culture with online ultrasound-assisted near-infrared spectroscopy. Analytical Chemistry 2020, 92(4), 2946-2952. [CrossRef]
- Zavala-Ortiz D. A.; Denner A.; Aguilar-Uscanga M. G., et al. Comparison of partial least square, artificial neural network, and support vector regressions for real-time monitoring of CHO cell culture processes using in situ near-infrared spectroscopy. Biotechnology and Bioengineering 2022, 119(2), 535-549. 379. [CrossRef]
- Gessell A.; Small G.W. Longitudinal study comparing orthogonal signal correction algorithms coupled with partial least-squares for quantitative near-infrared spectroscopy. Analytical Letters 2022, 55(3), 449-466. [CrossRef]
- Patchava K. C.; Ge S. S.; Benaissa M. Sammon’s mapping regression for the quantitative analysis of glucose from both mid infrared and near infrared spectra. Analytical Methods 2021, 13(38), 4485-4494. [CrossRef]
- Ni L.; Chen H.; Hong S., et al. Near infrared spectral calibration model transfer without standards by screening spectral points with scale invariant feature transform from master samples spectra. Spectrochimica Acta Part A: Molecular and Biomolecular Spectroscopy 2021, 260, 119802. [CrossRef]
- Xie J.; Pan T.; Chen J., et al. Wavenumbers Combination Optimization for NIRS Analysis of Glucose in Human Serum. 2010 Symposium on Photonics and Optoelectronics 2010. [CrossRef]
- Zuo X. B.; Fang S.; Liang X. L. Synergy Interval Partial Least Square (siPLS) with Potentiometric Titration Multivariate Calibration for the Simultaneous Determination of Amino Acids in Mixtures. Advance Journal of Food Science and Technology 2014, 6(11), 1209-1218.
- Wang X.; Bao Y.; Liu G., et al. Study on the Best Analysis Spectral Section of NIR to Detect Alcohol Concentration Based on SiPLS. .Procedia Engineering 2012, 29, :2285-2290. [CrossRef]
- Ferrao M. F.; Viera M. D. S.; Pazos R. E. P., et al. Simultaneous determination of quality parameters of biodiesel/diesel blends using HATR-FTIR spectra and PLS, iPLS or siPLS regressions. Fuel 2011, 90(2),701-706. [CrossRef]
- Fuglerud S. S.; Ellingsen R.; Aksnes A.;, et al. Investigation of the effect of clinically relevant interferents on glucose monitoring using near-infrared spectroscopy. Journal of Biophotonics 2021, 14(5), e202000450. [CrossRef]
- Cong-Li M.; Yao C.; Liang Y., et al. Wavelength Selection by siPLS-LASSO for NIR Spectroscopy and Its Application. Spectroscopy and Spectral Analysis 2018, 38(2), 110-114.
Figure 1.
Glucose concentration monitoring experiment and system diagram. (a) Schematic diagram; (b) System diagram.
Figure 1.
Glucose concentration monitoring experiment and system diagram. (a) Schematic diagram; (b) System diagram.

Figure 2.
Raw near infrared spectra.
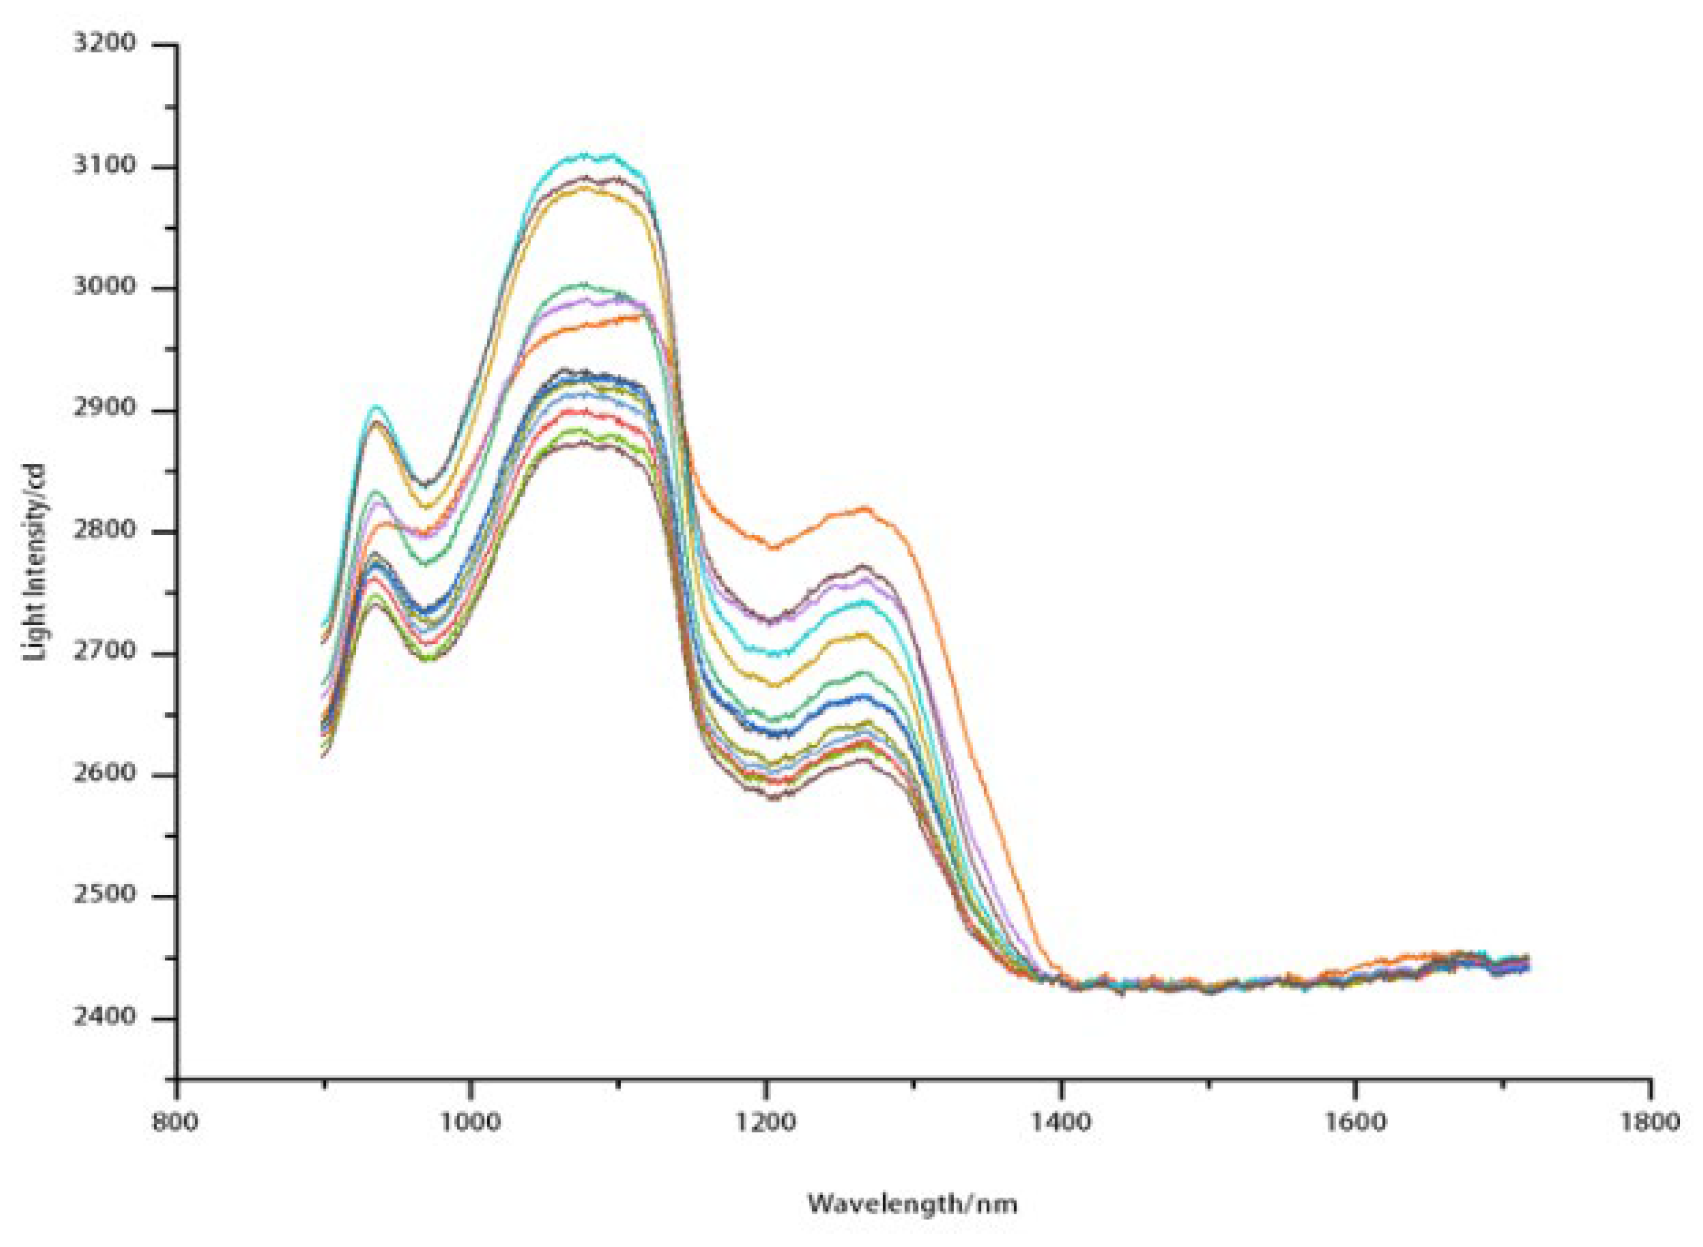
Figure 3.
Outlier test results.
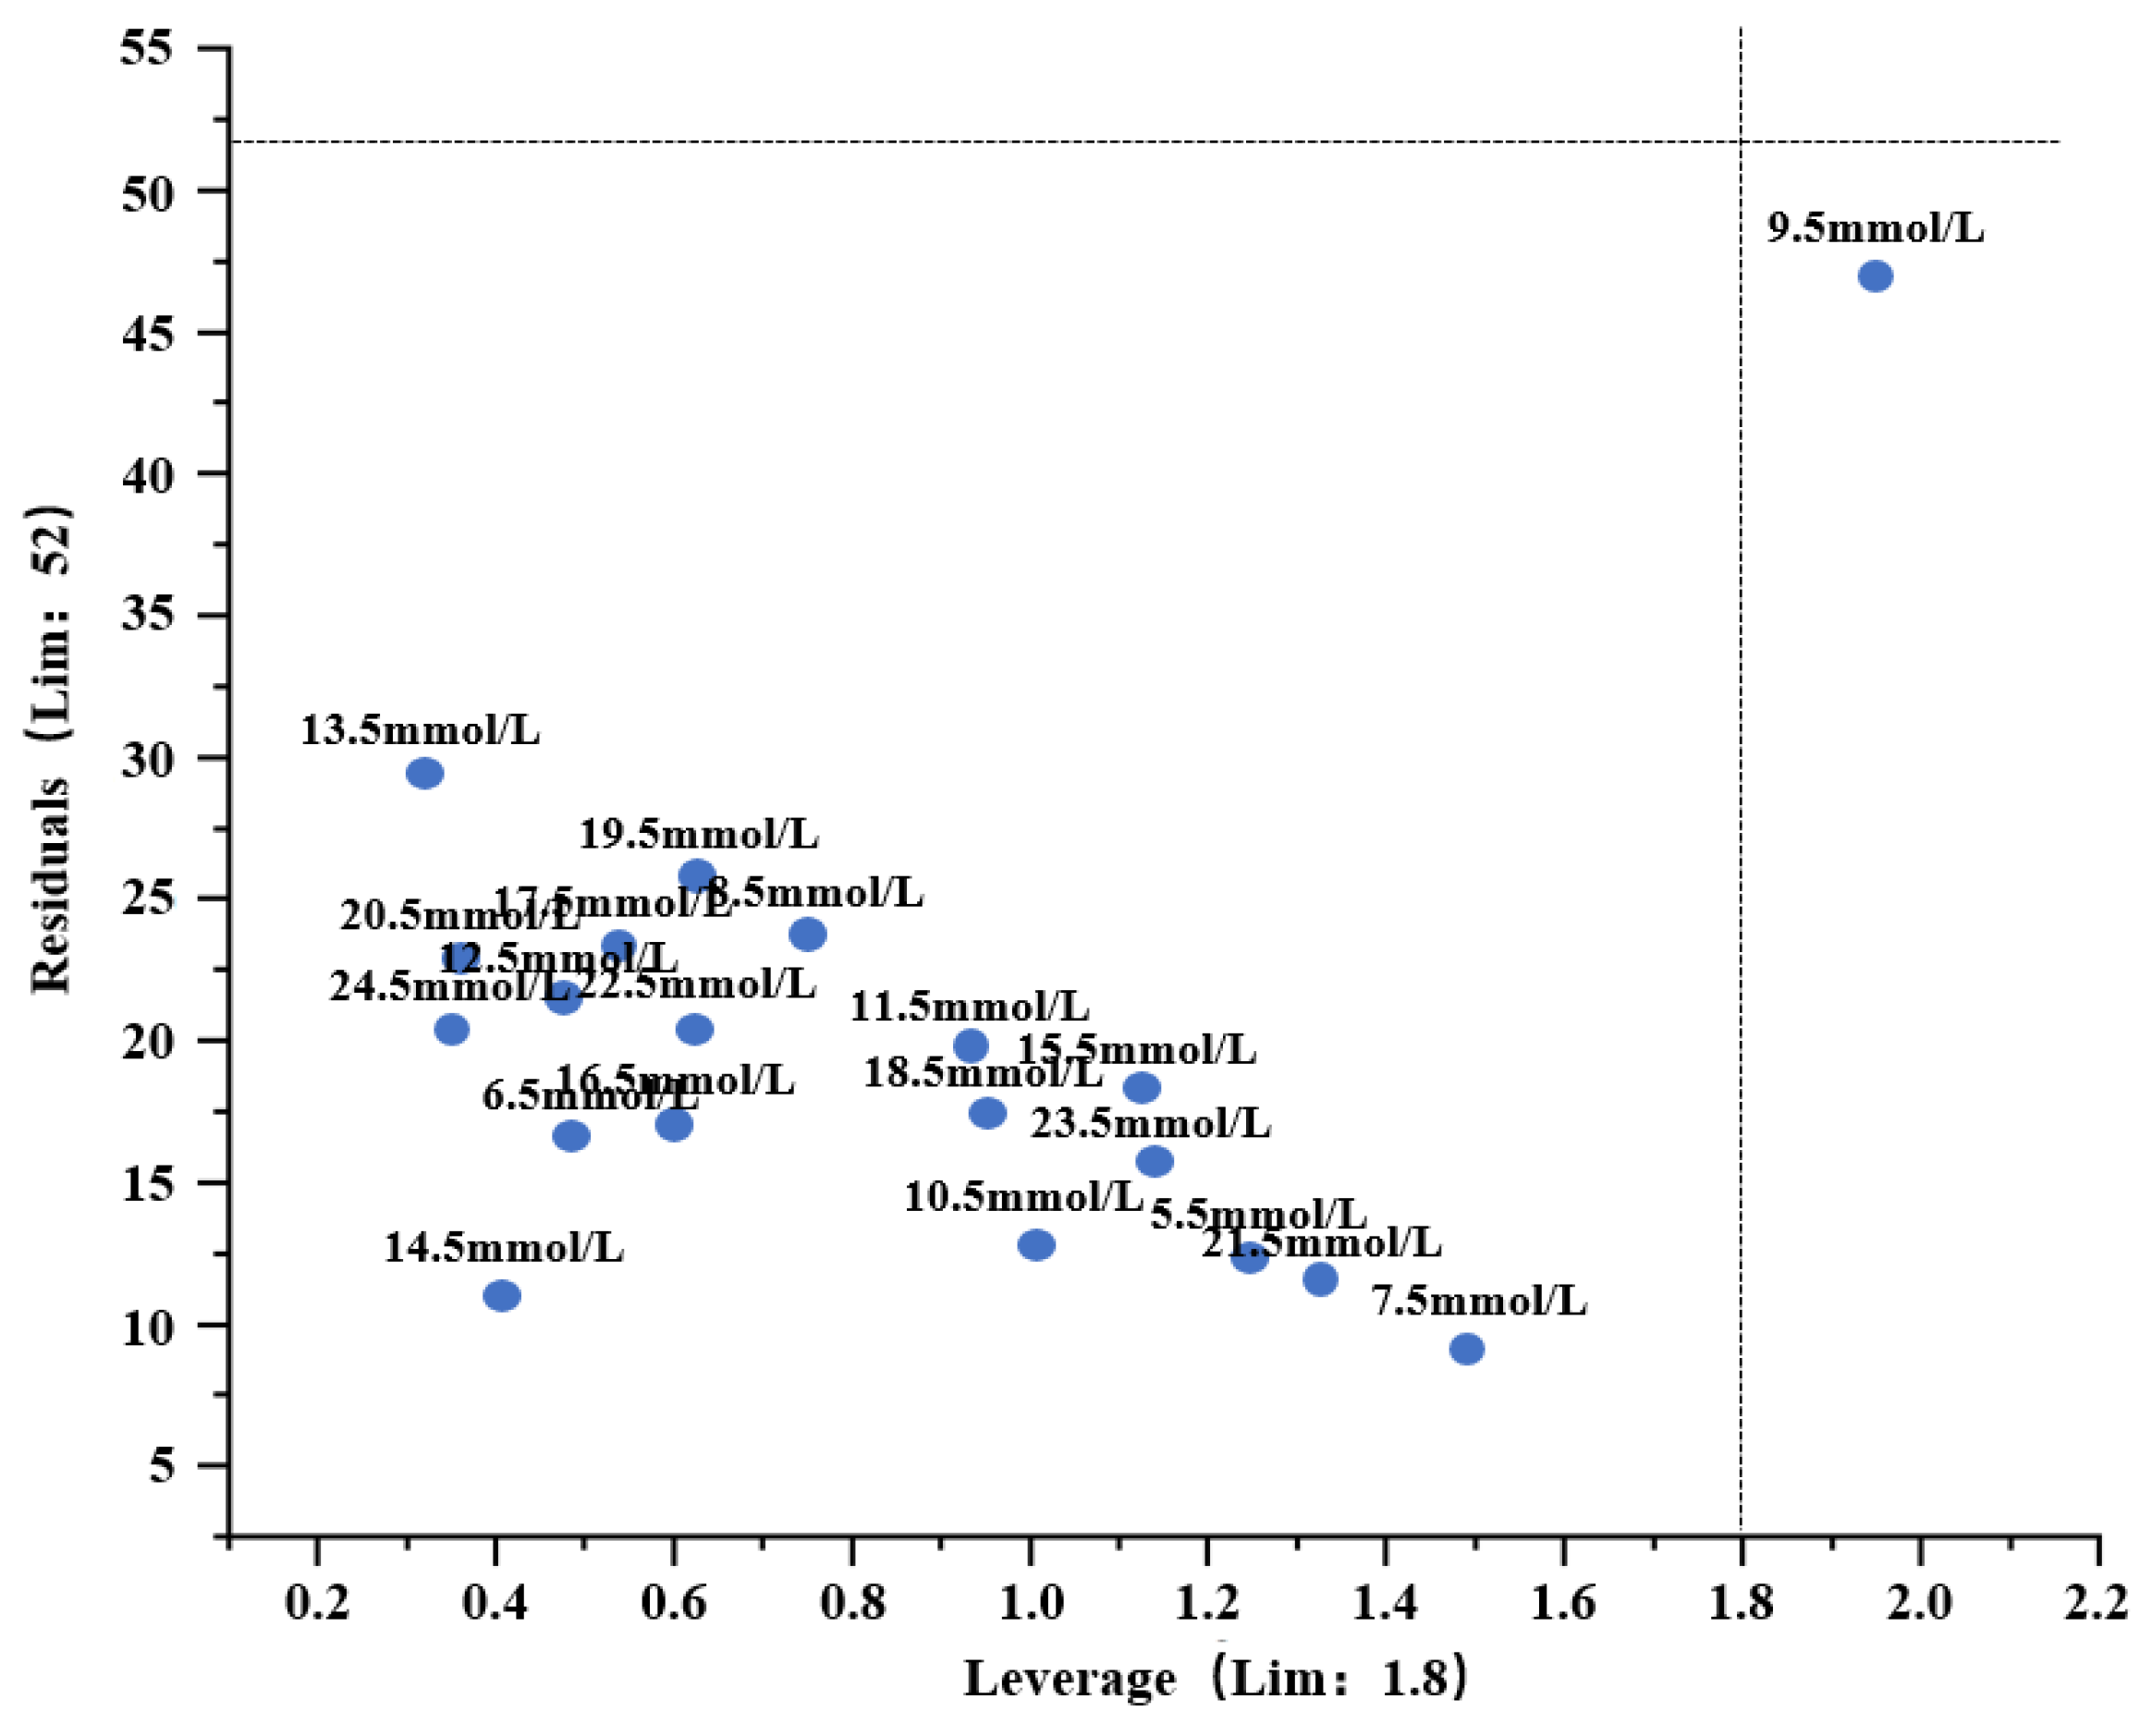
Figure 4.
Principal component analysis diagram.
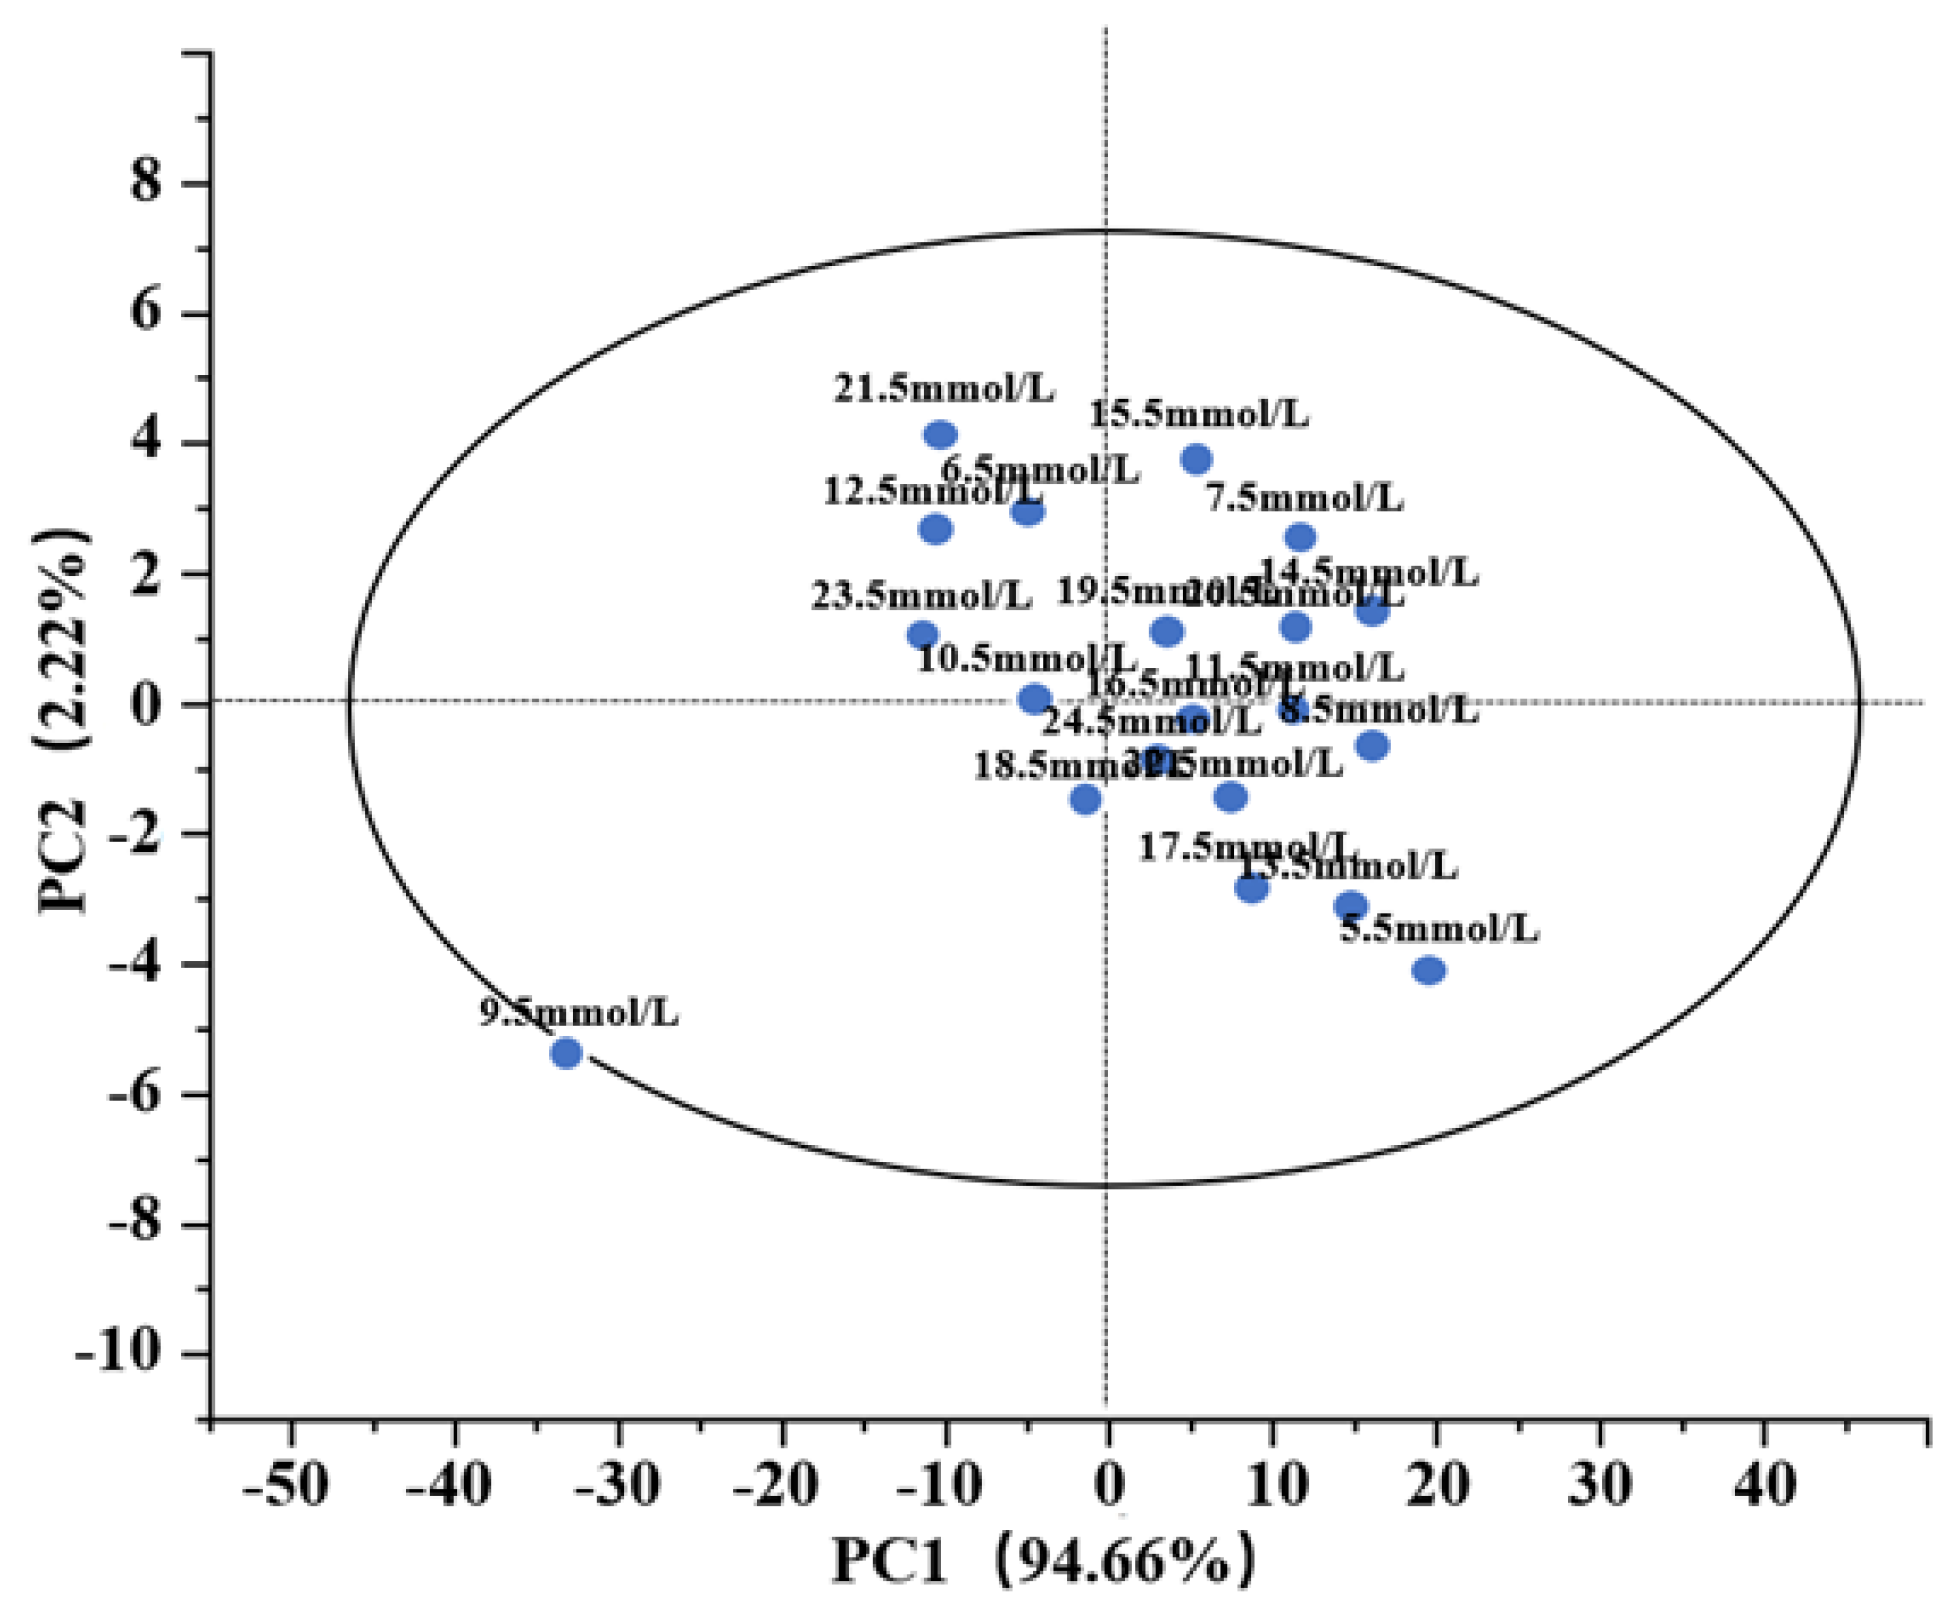
Figure 5.
Results of iPLS division of molecular intervals. (a) Five subsegments; (b) 10 subsegments; (c) 15 subsegments.
Figure 5.
Results of iPLS division of molecular intervals. (a) Five subsegments; (b) 10 subsegments; (c) 15 subsegments.
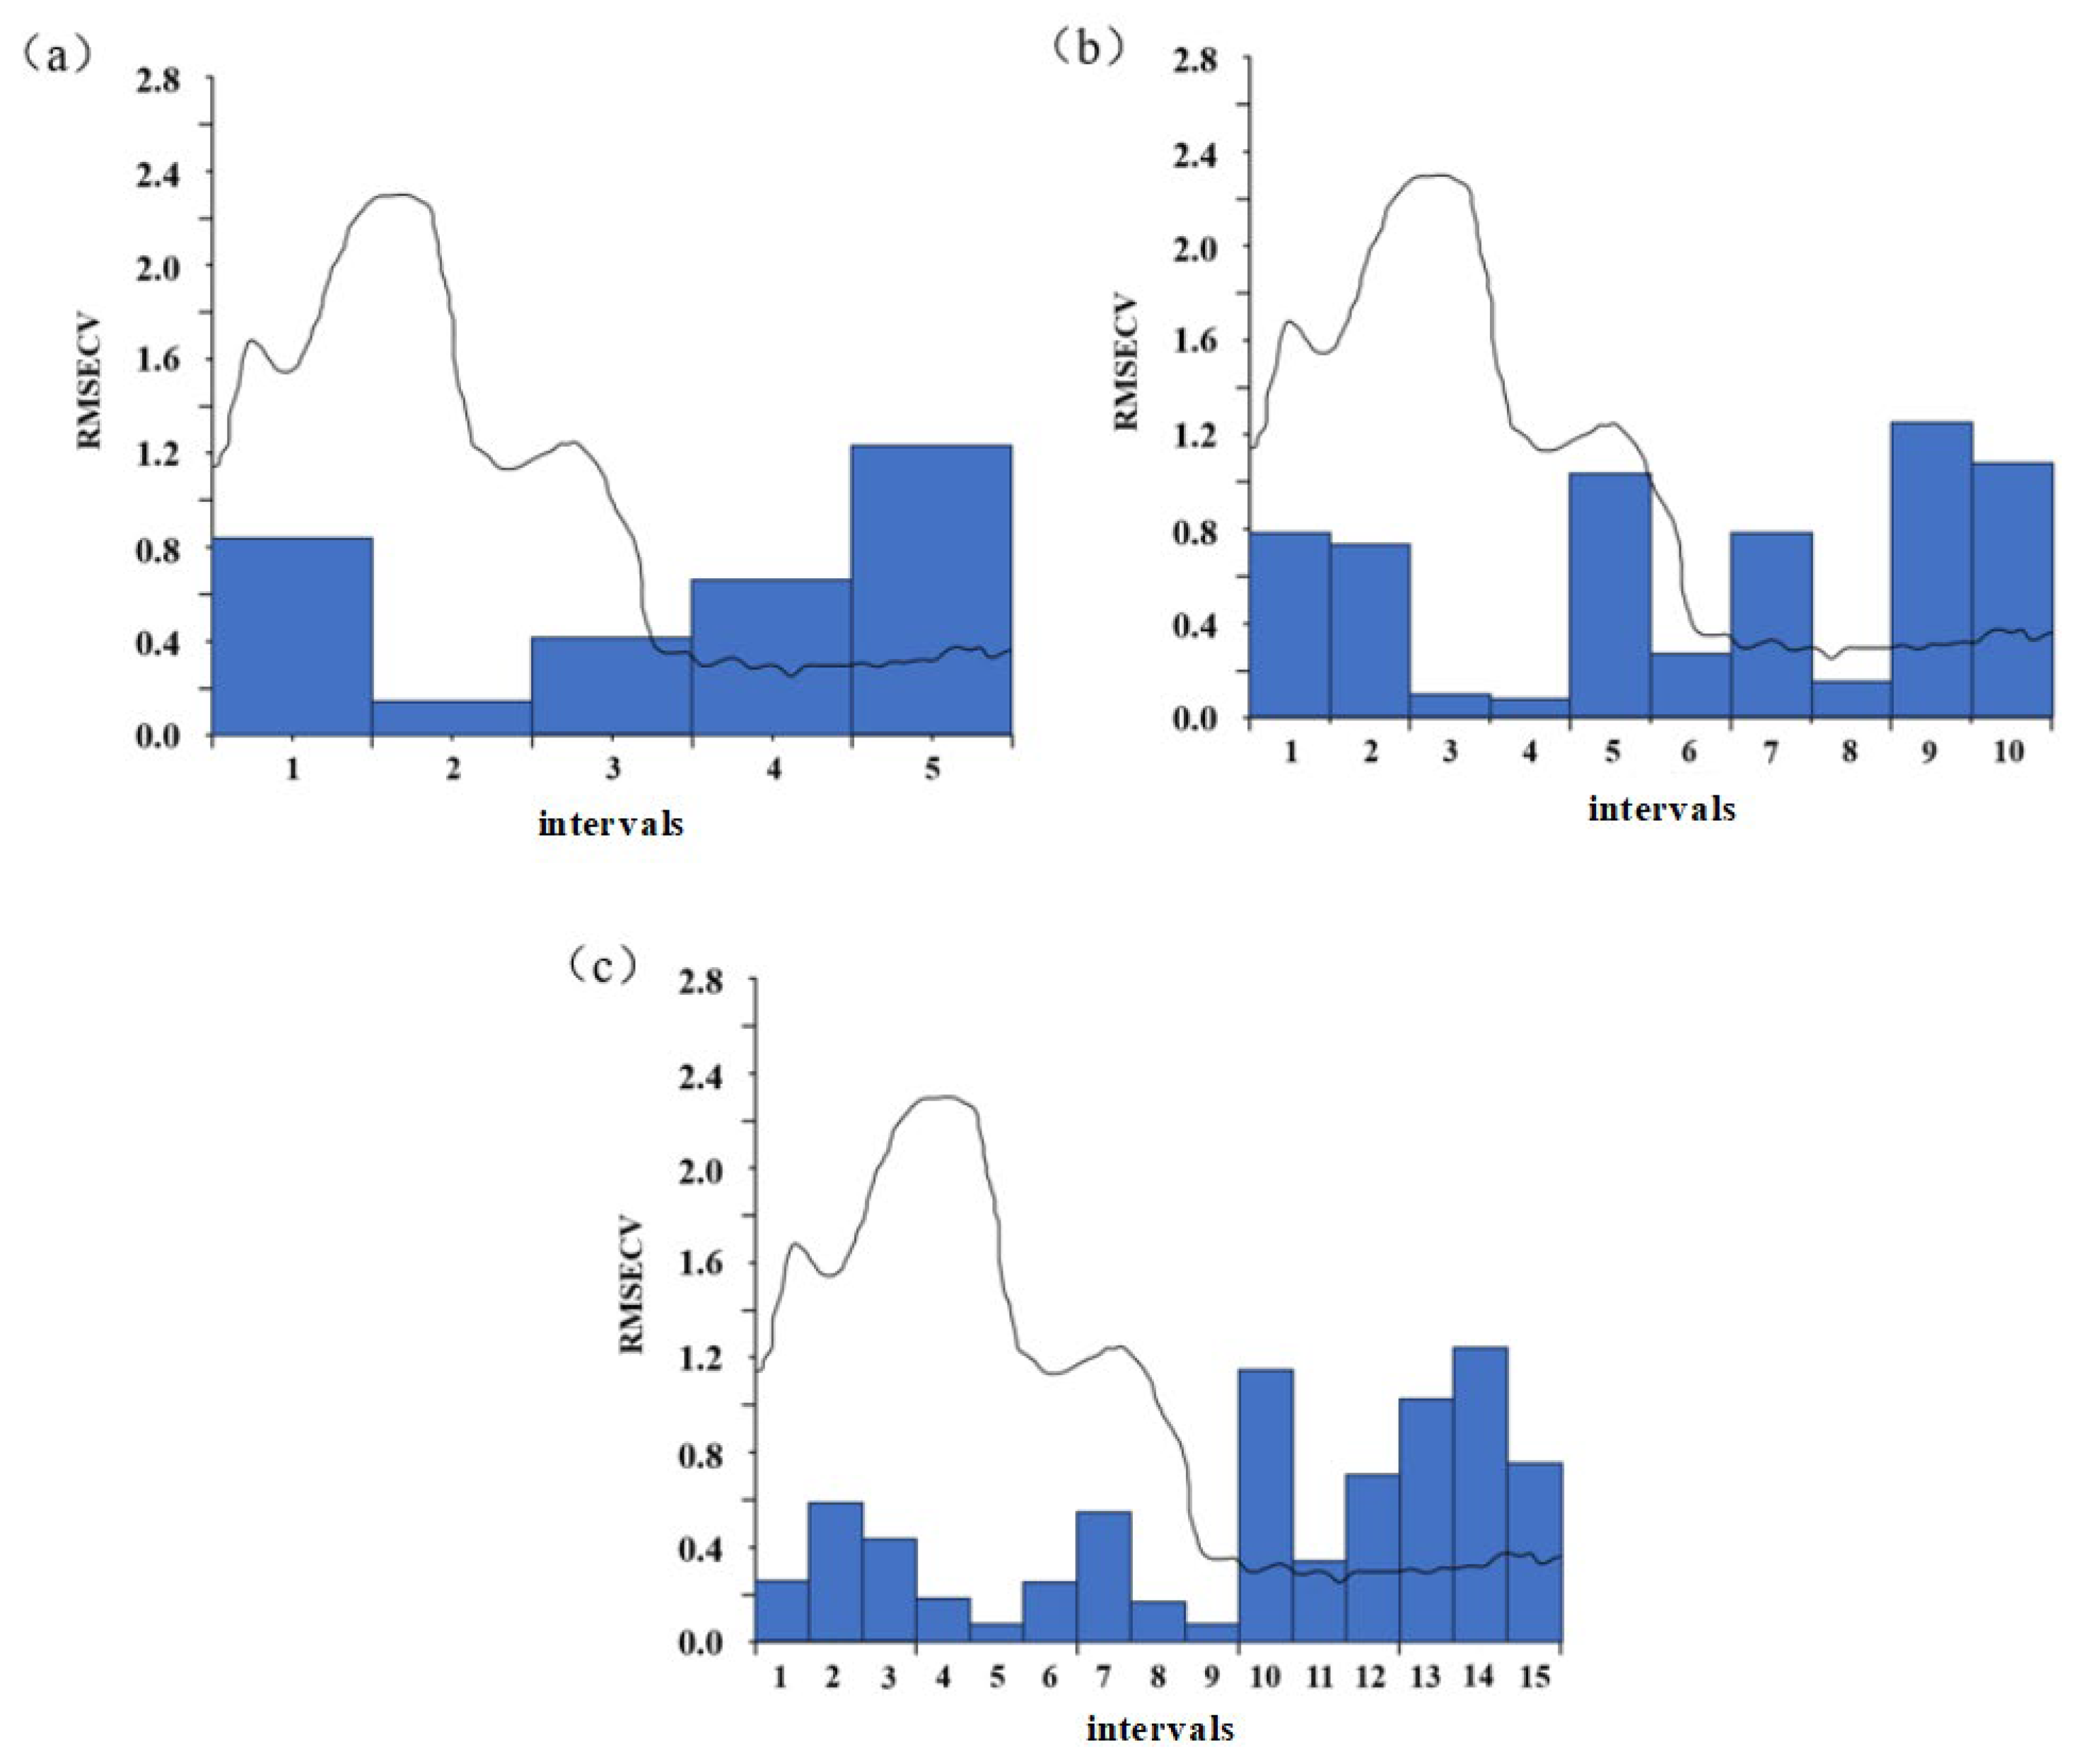
Figure 6.
Results of siPLS division of molecular intervals.
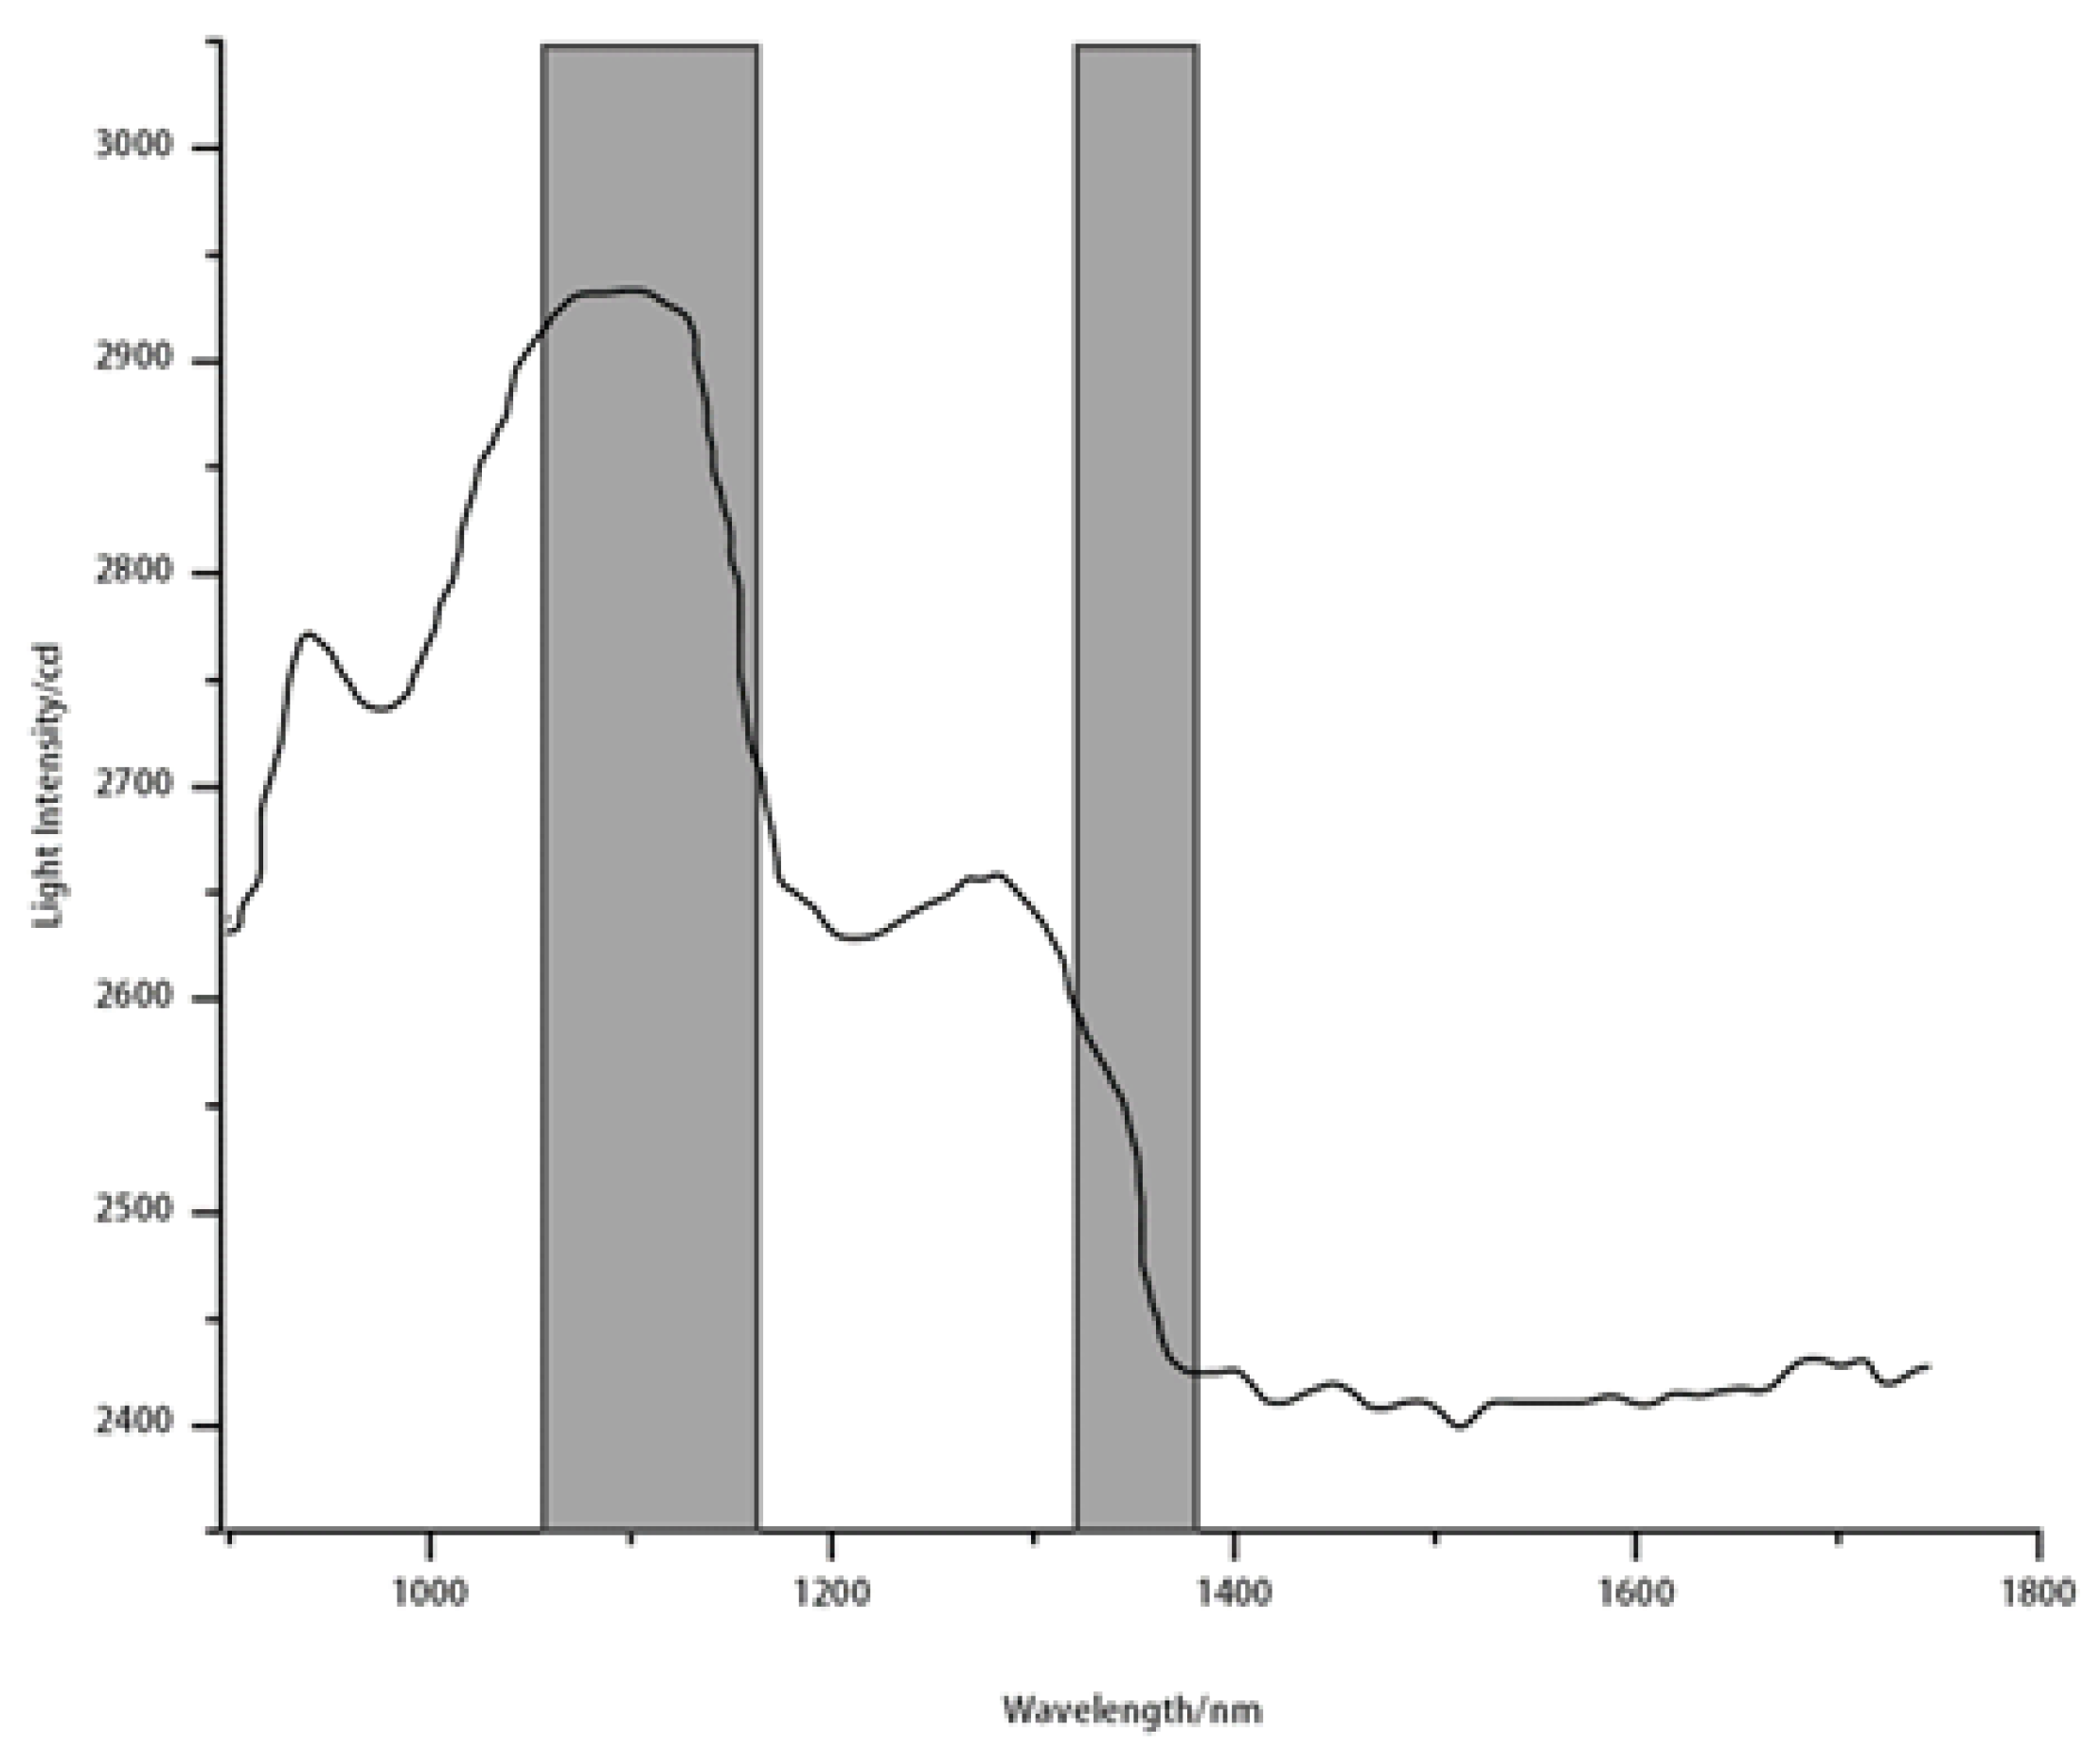
Figure 7.
Modeling result.
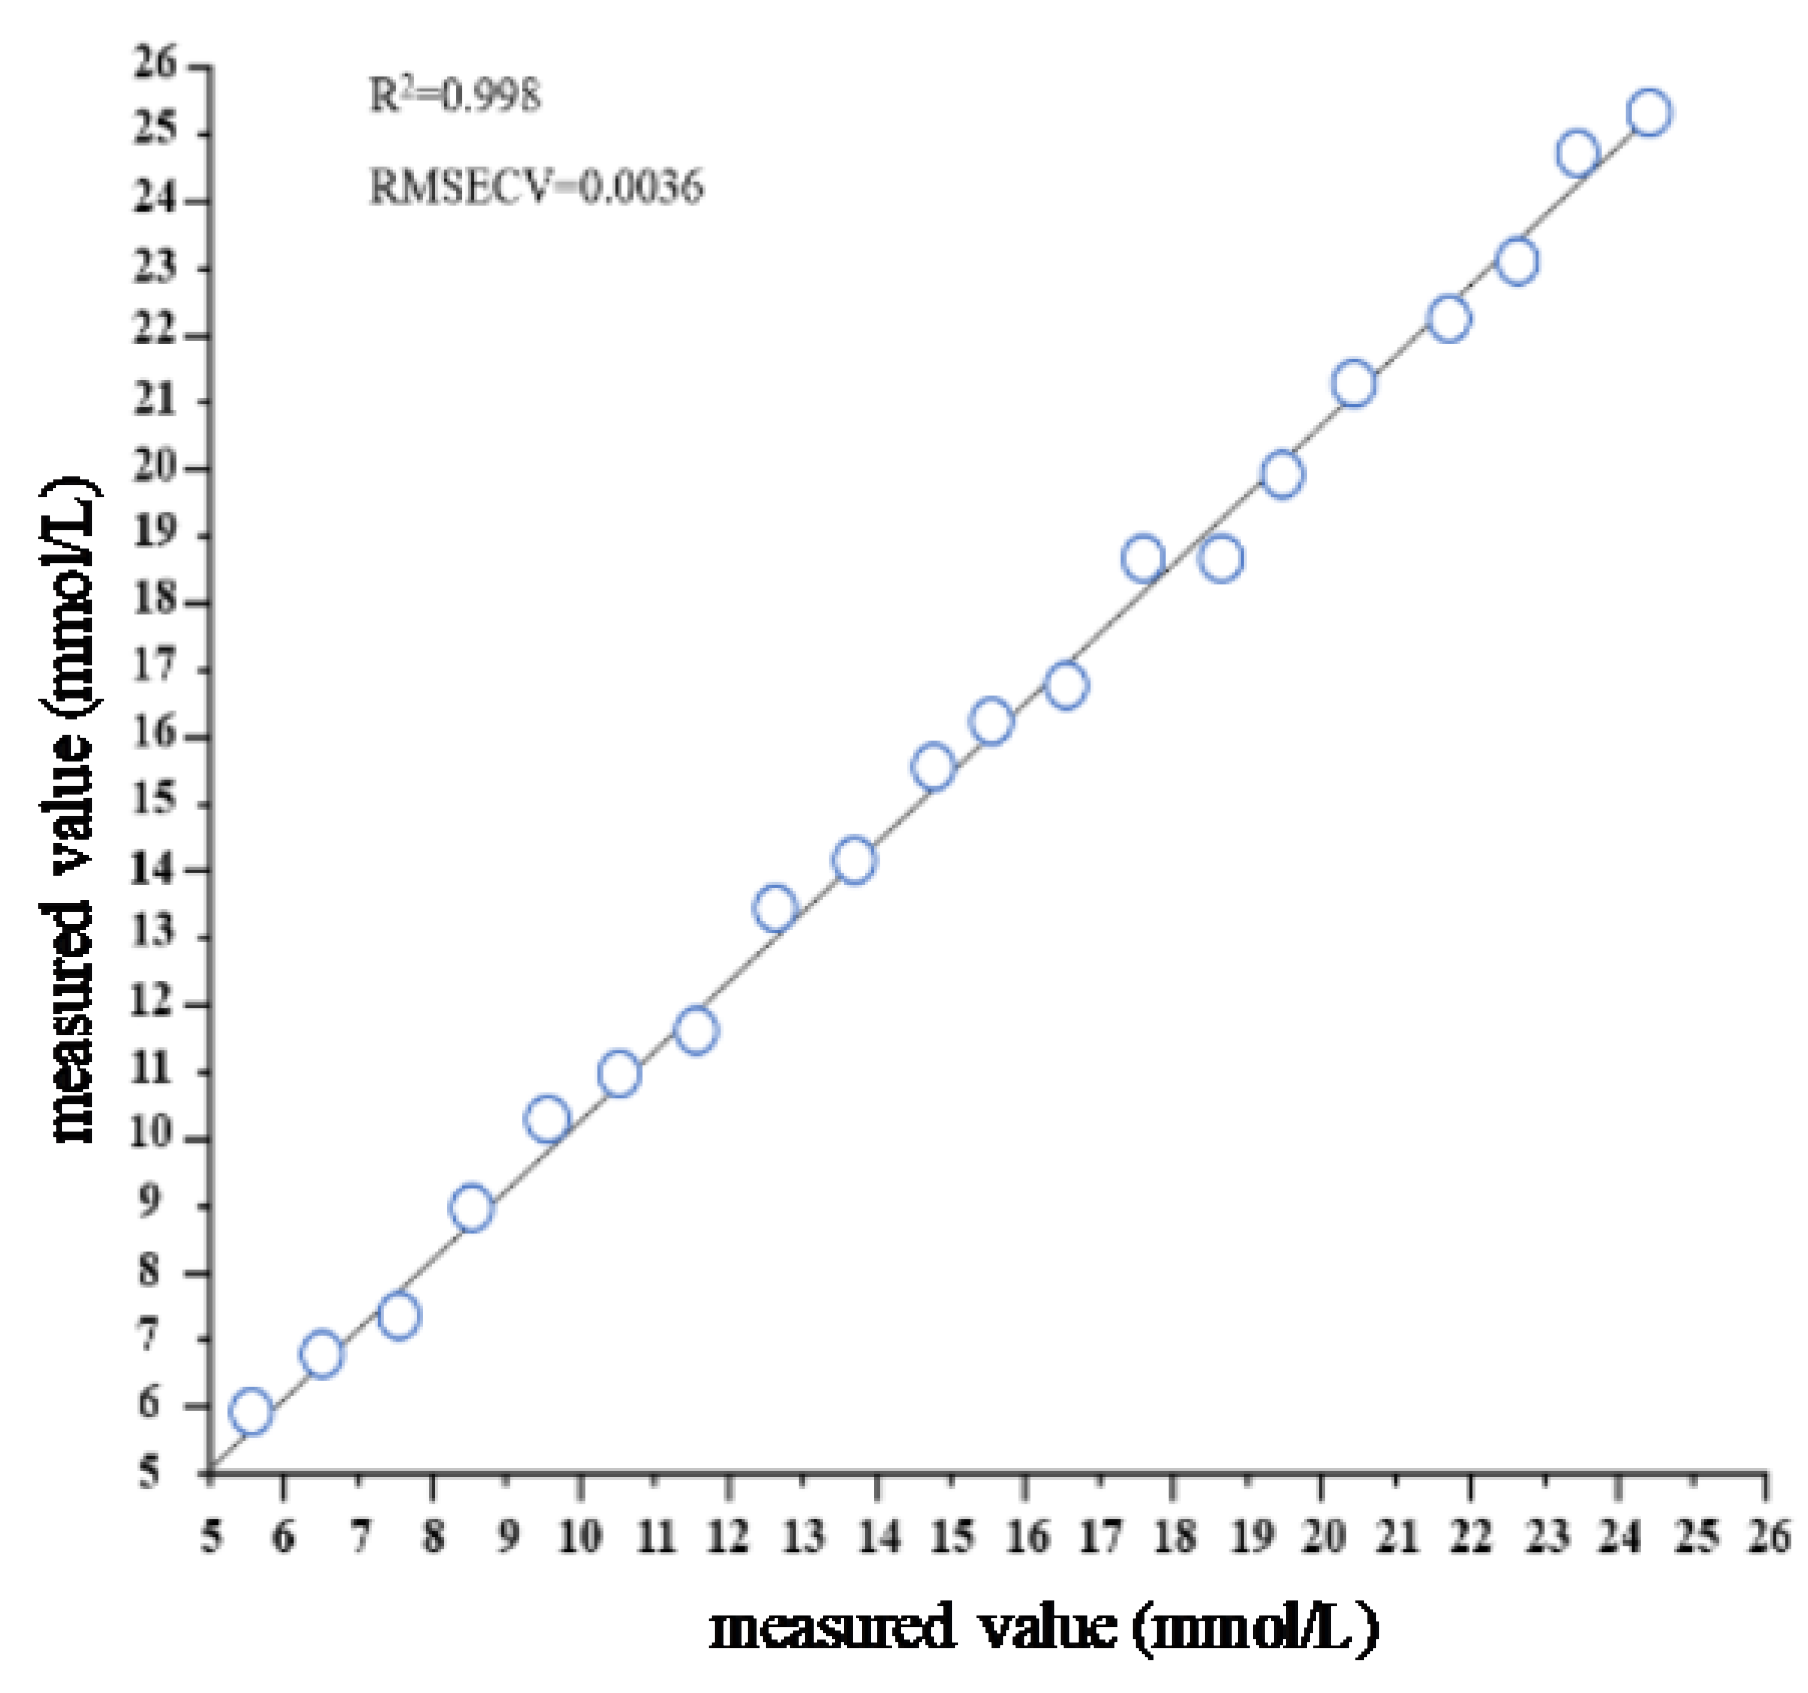
Figure 8.
Average spectral contrast diagram.
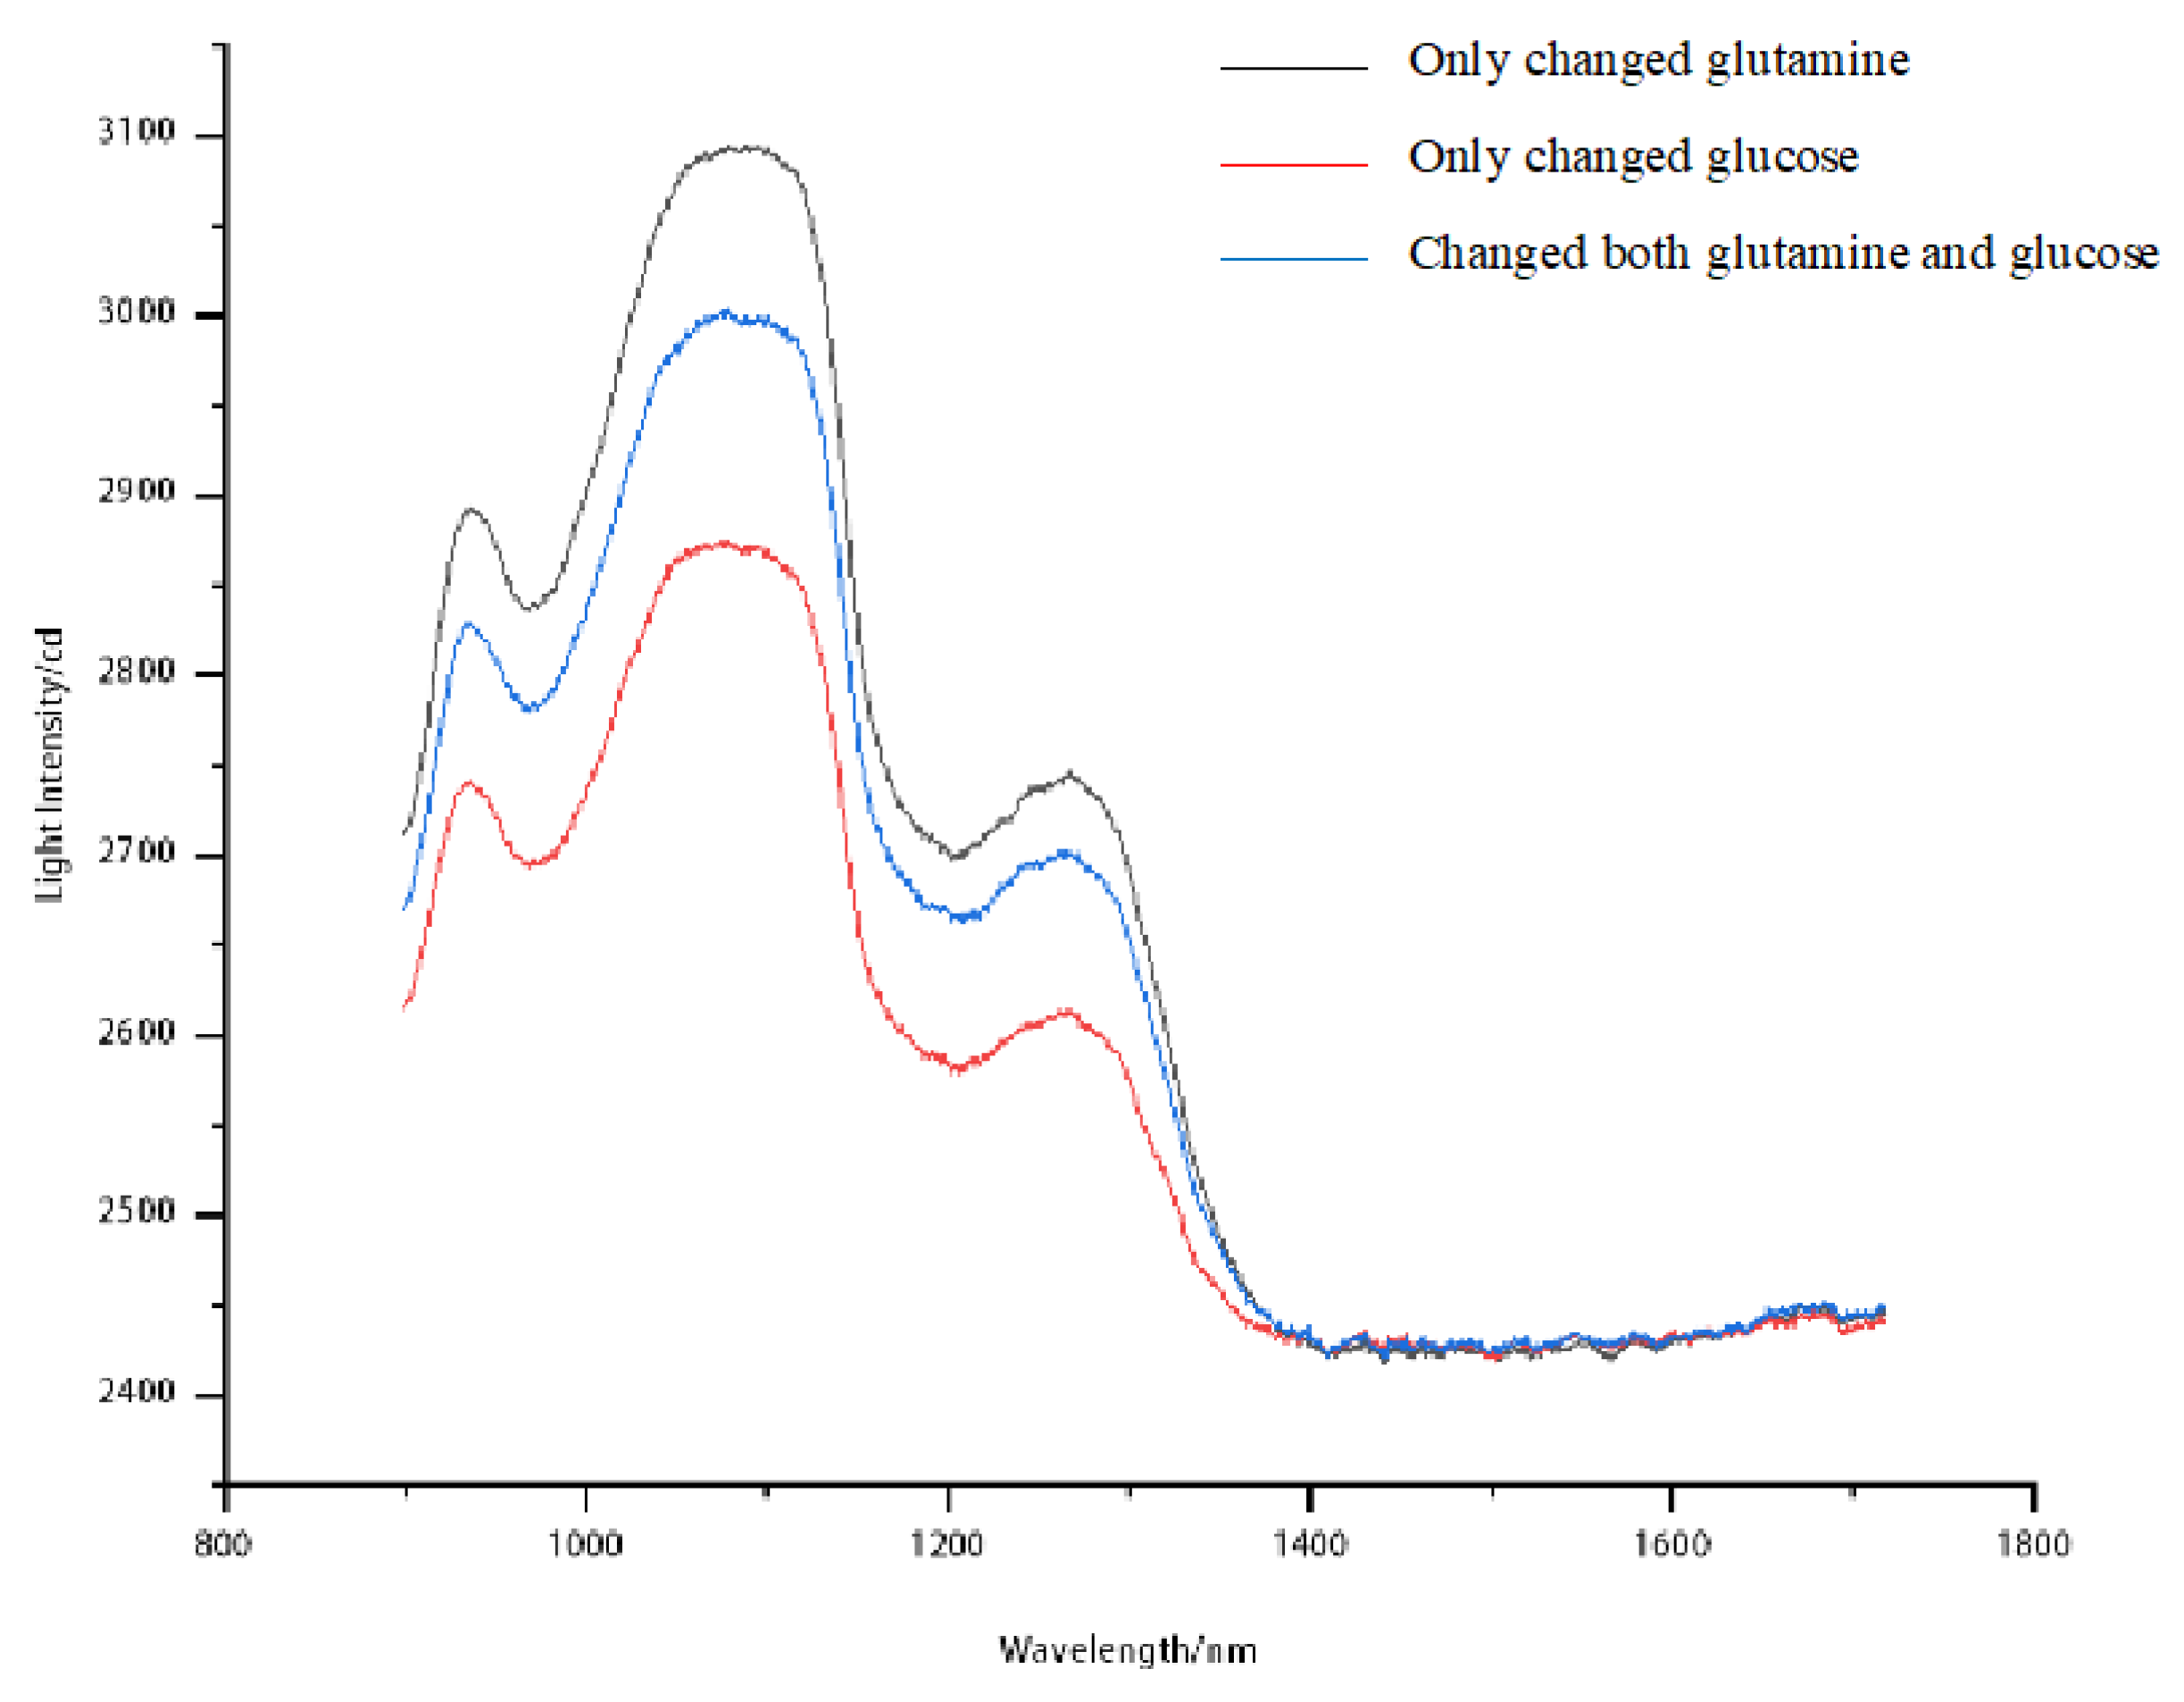
Figure 9.
Modeling result of multicomponent model.
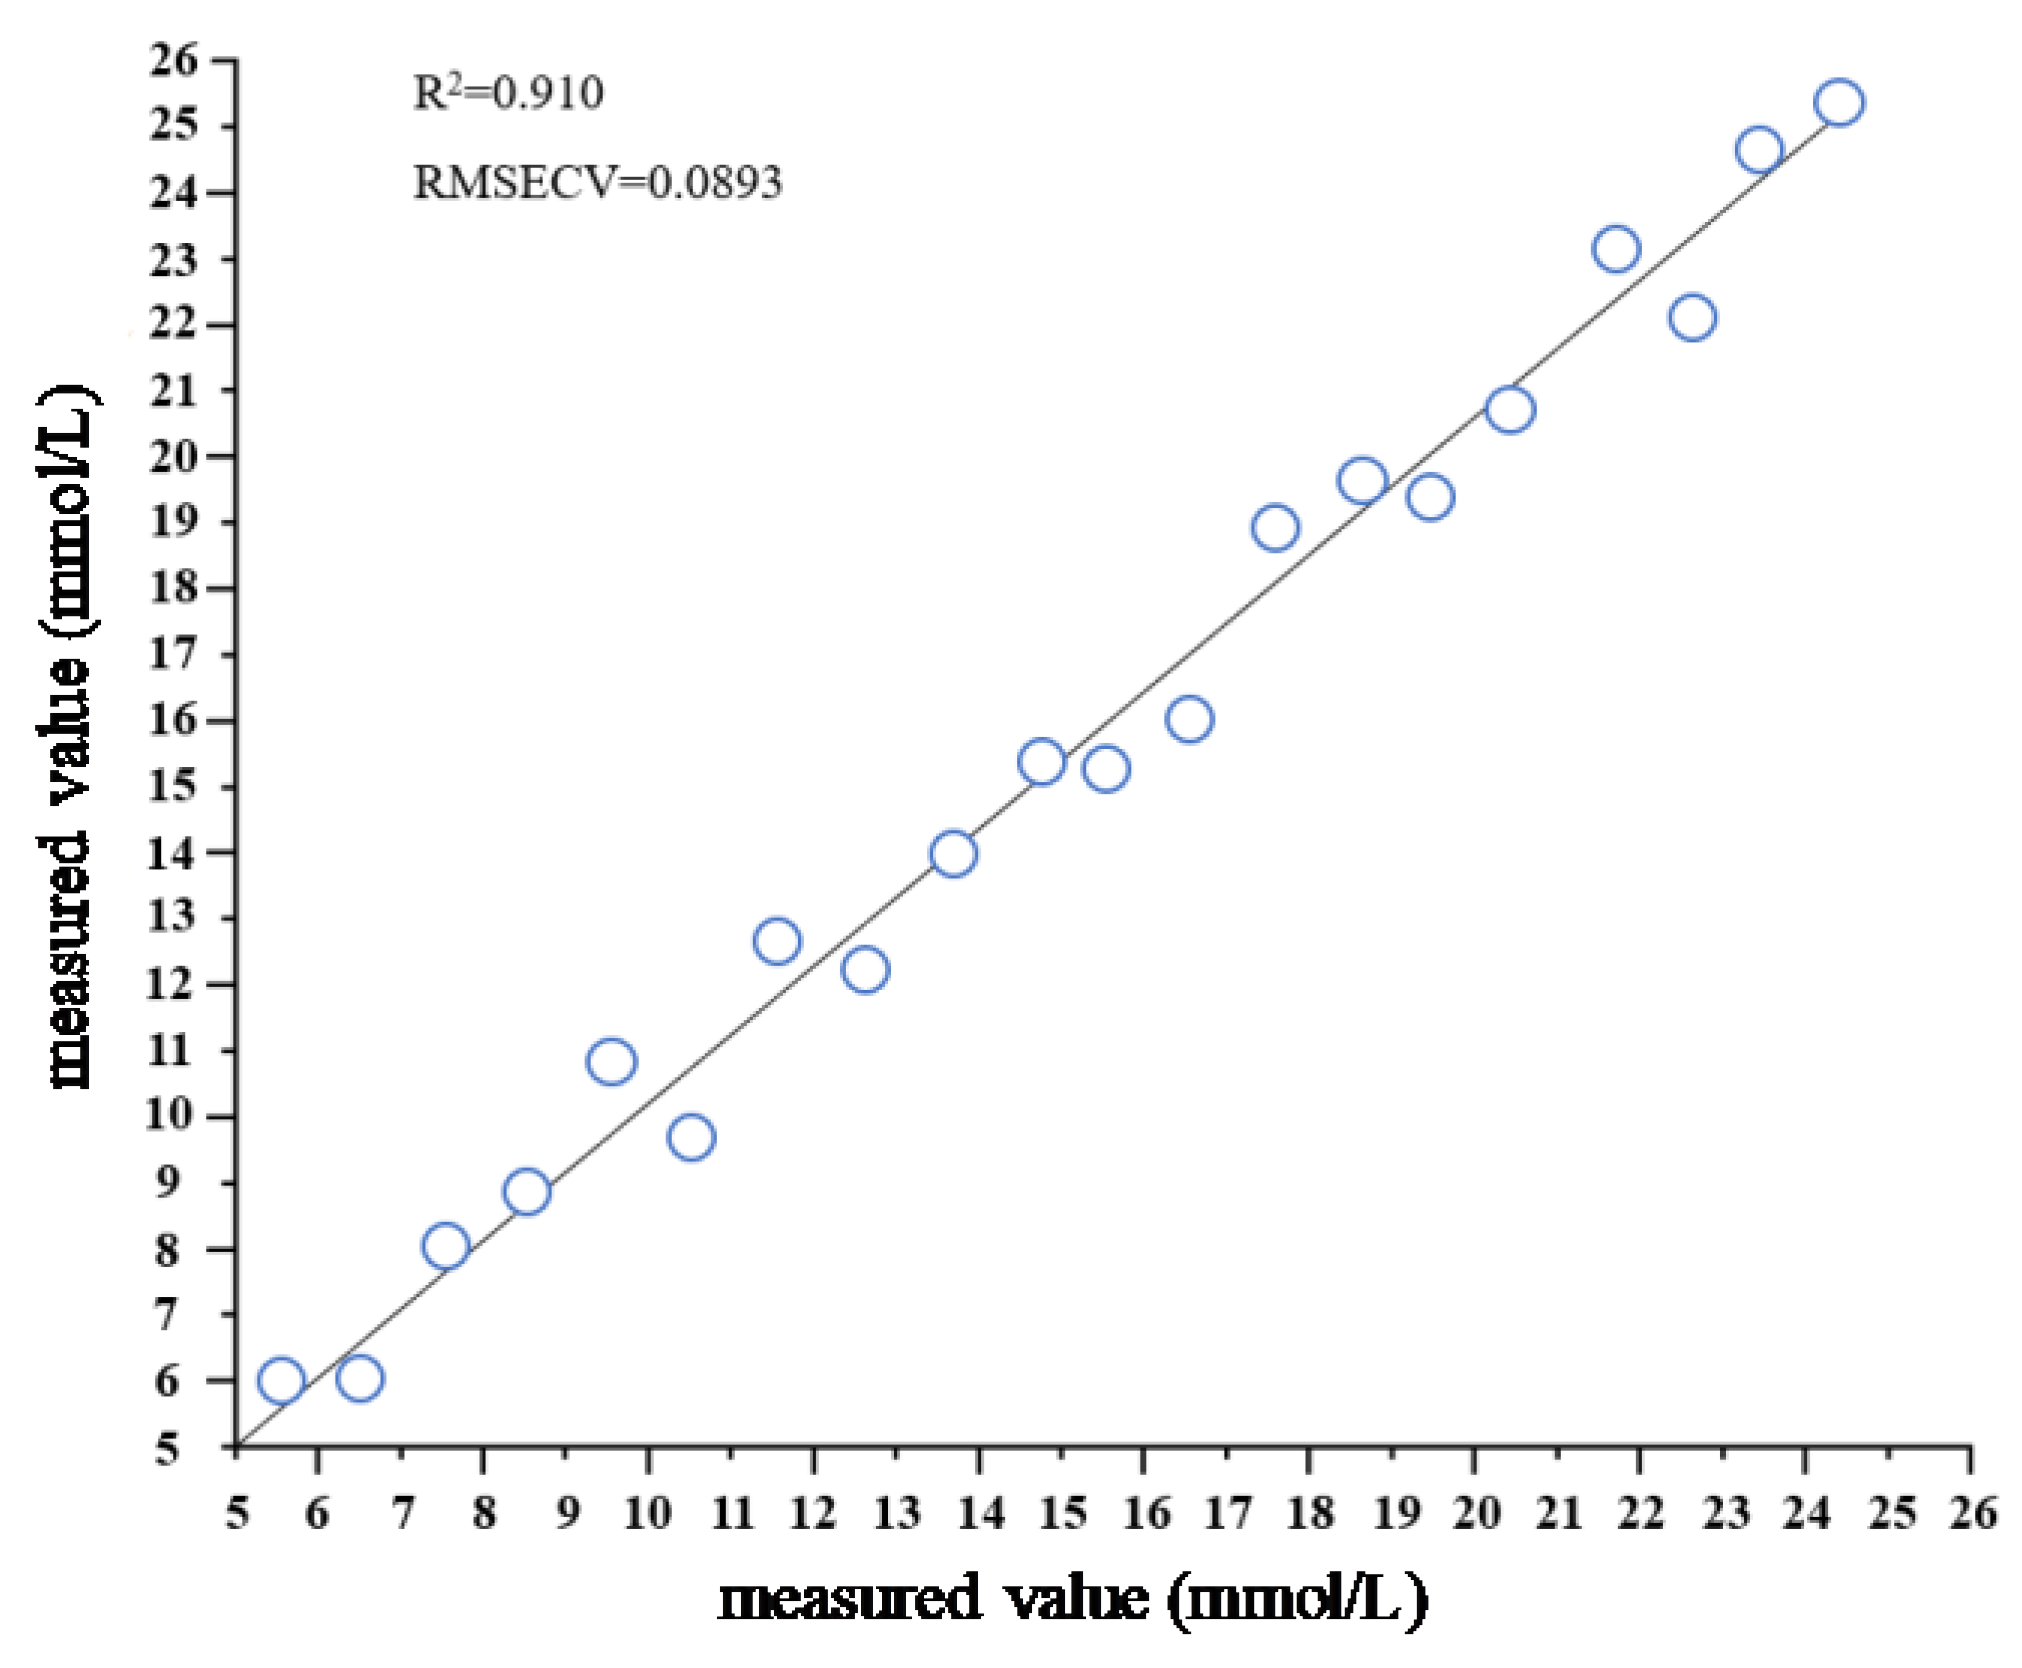
Figure 10.
Plot of RMSE of a dataset with λ values.
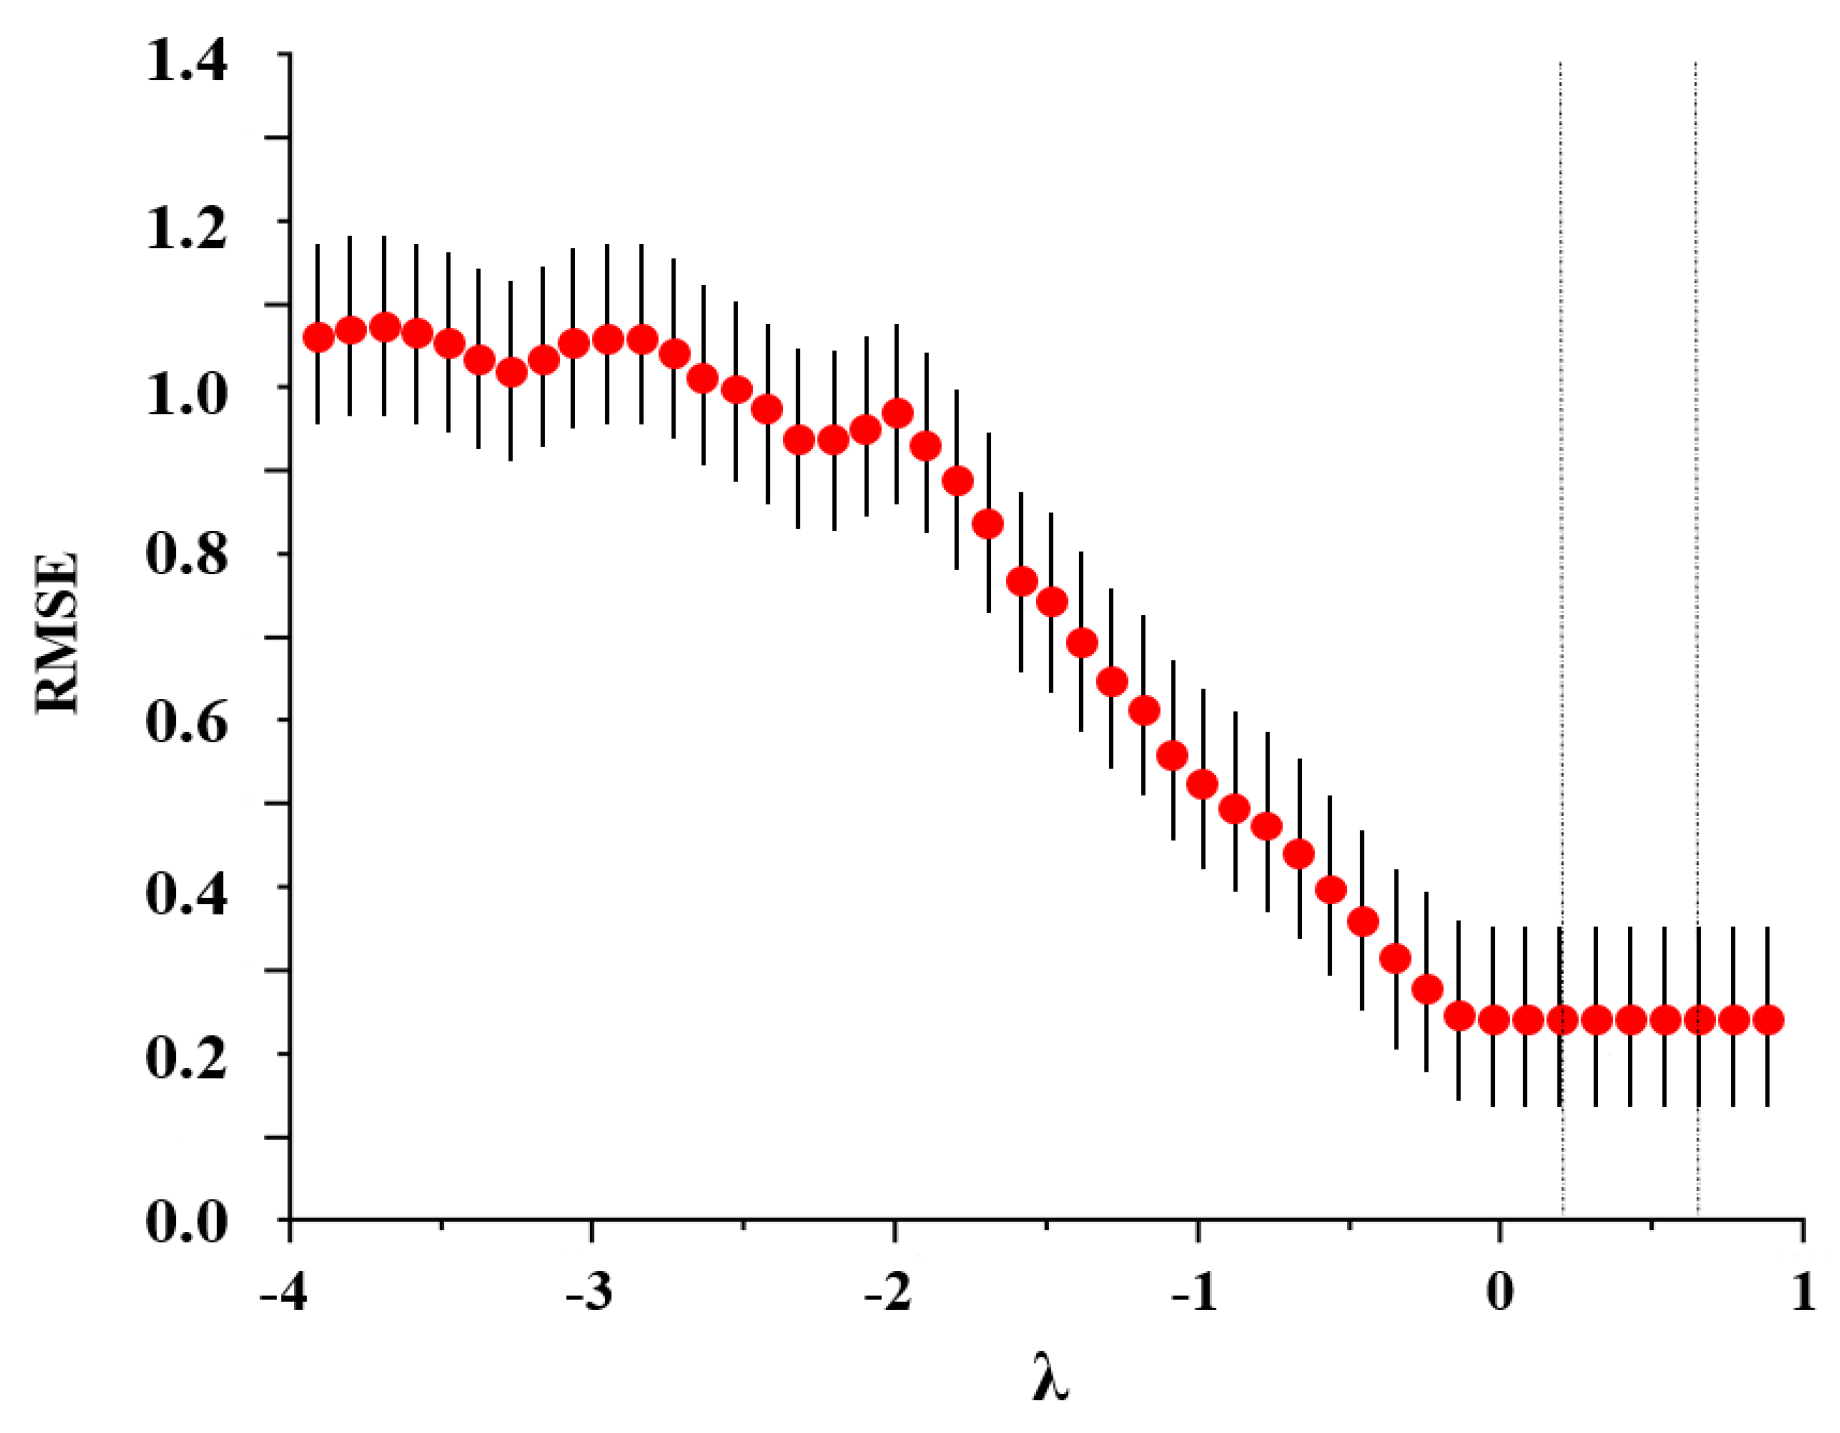
Figure 11.
Plot of LASSO’s β coefficients with λ values for a dataset.
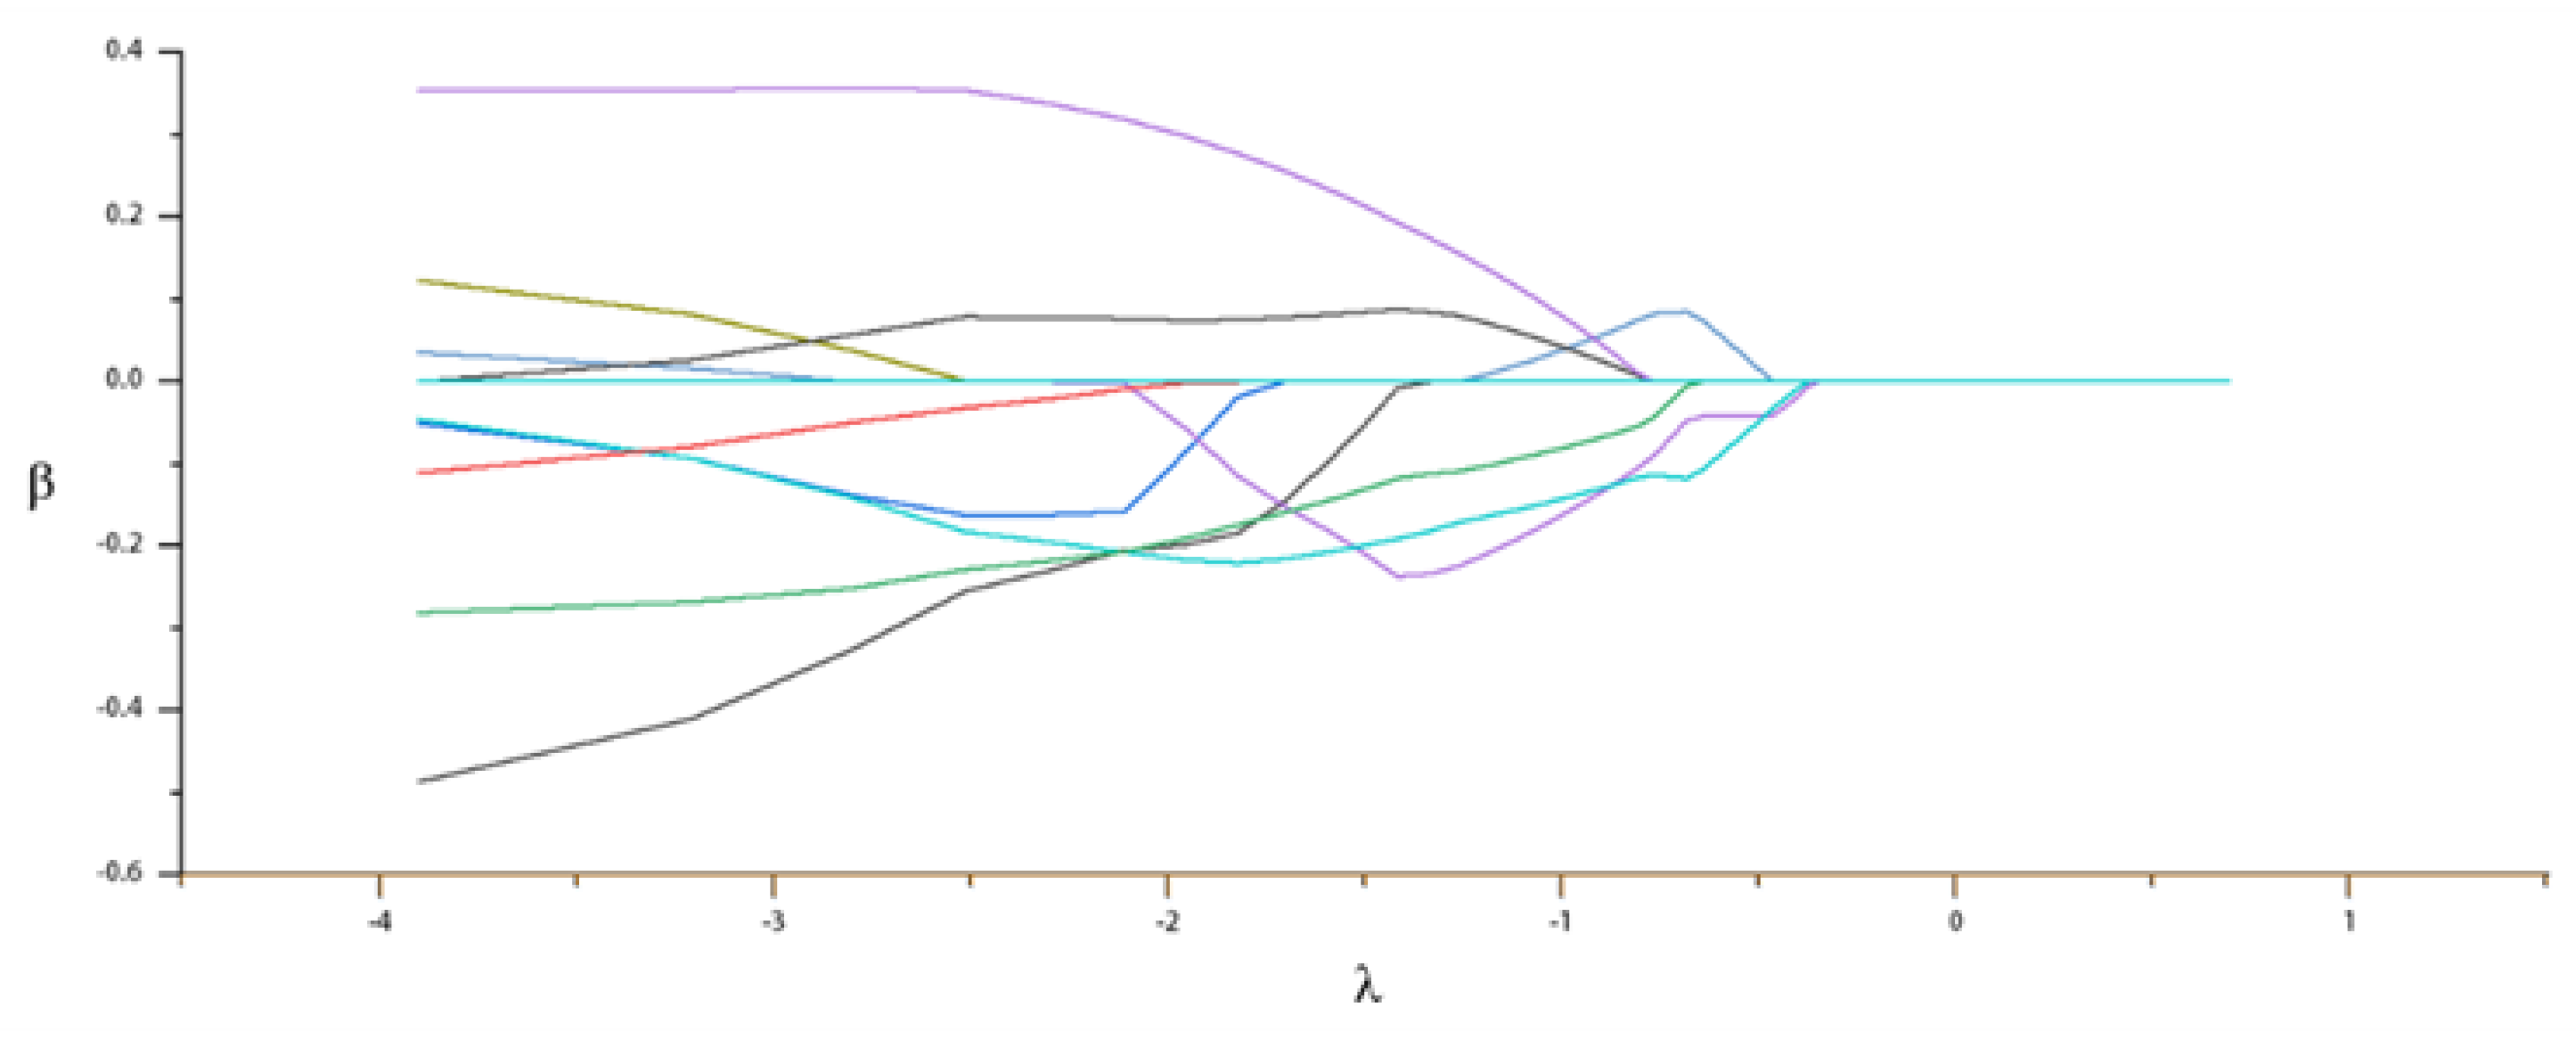
Figure 12.
siPLS-LASSO variable filtering results.
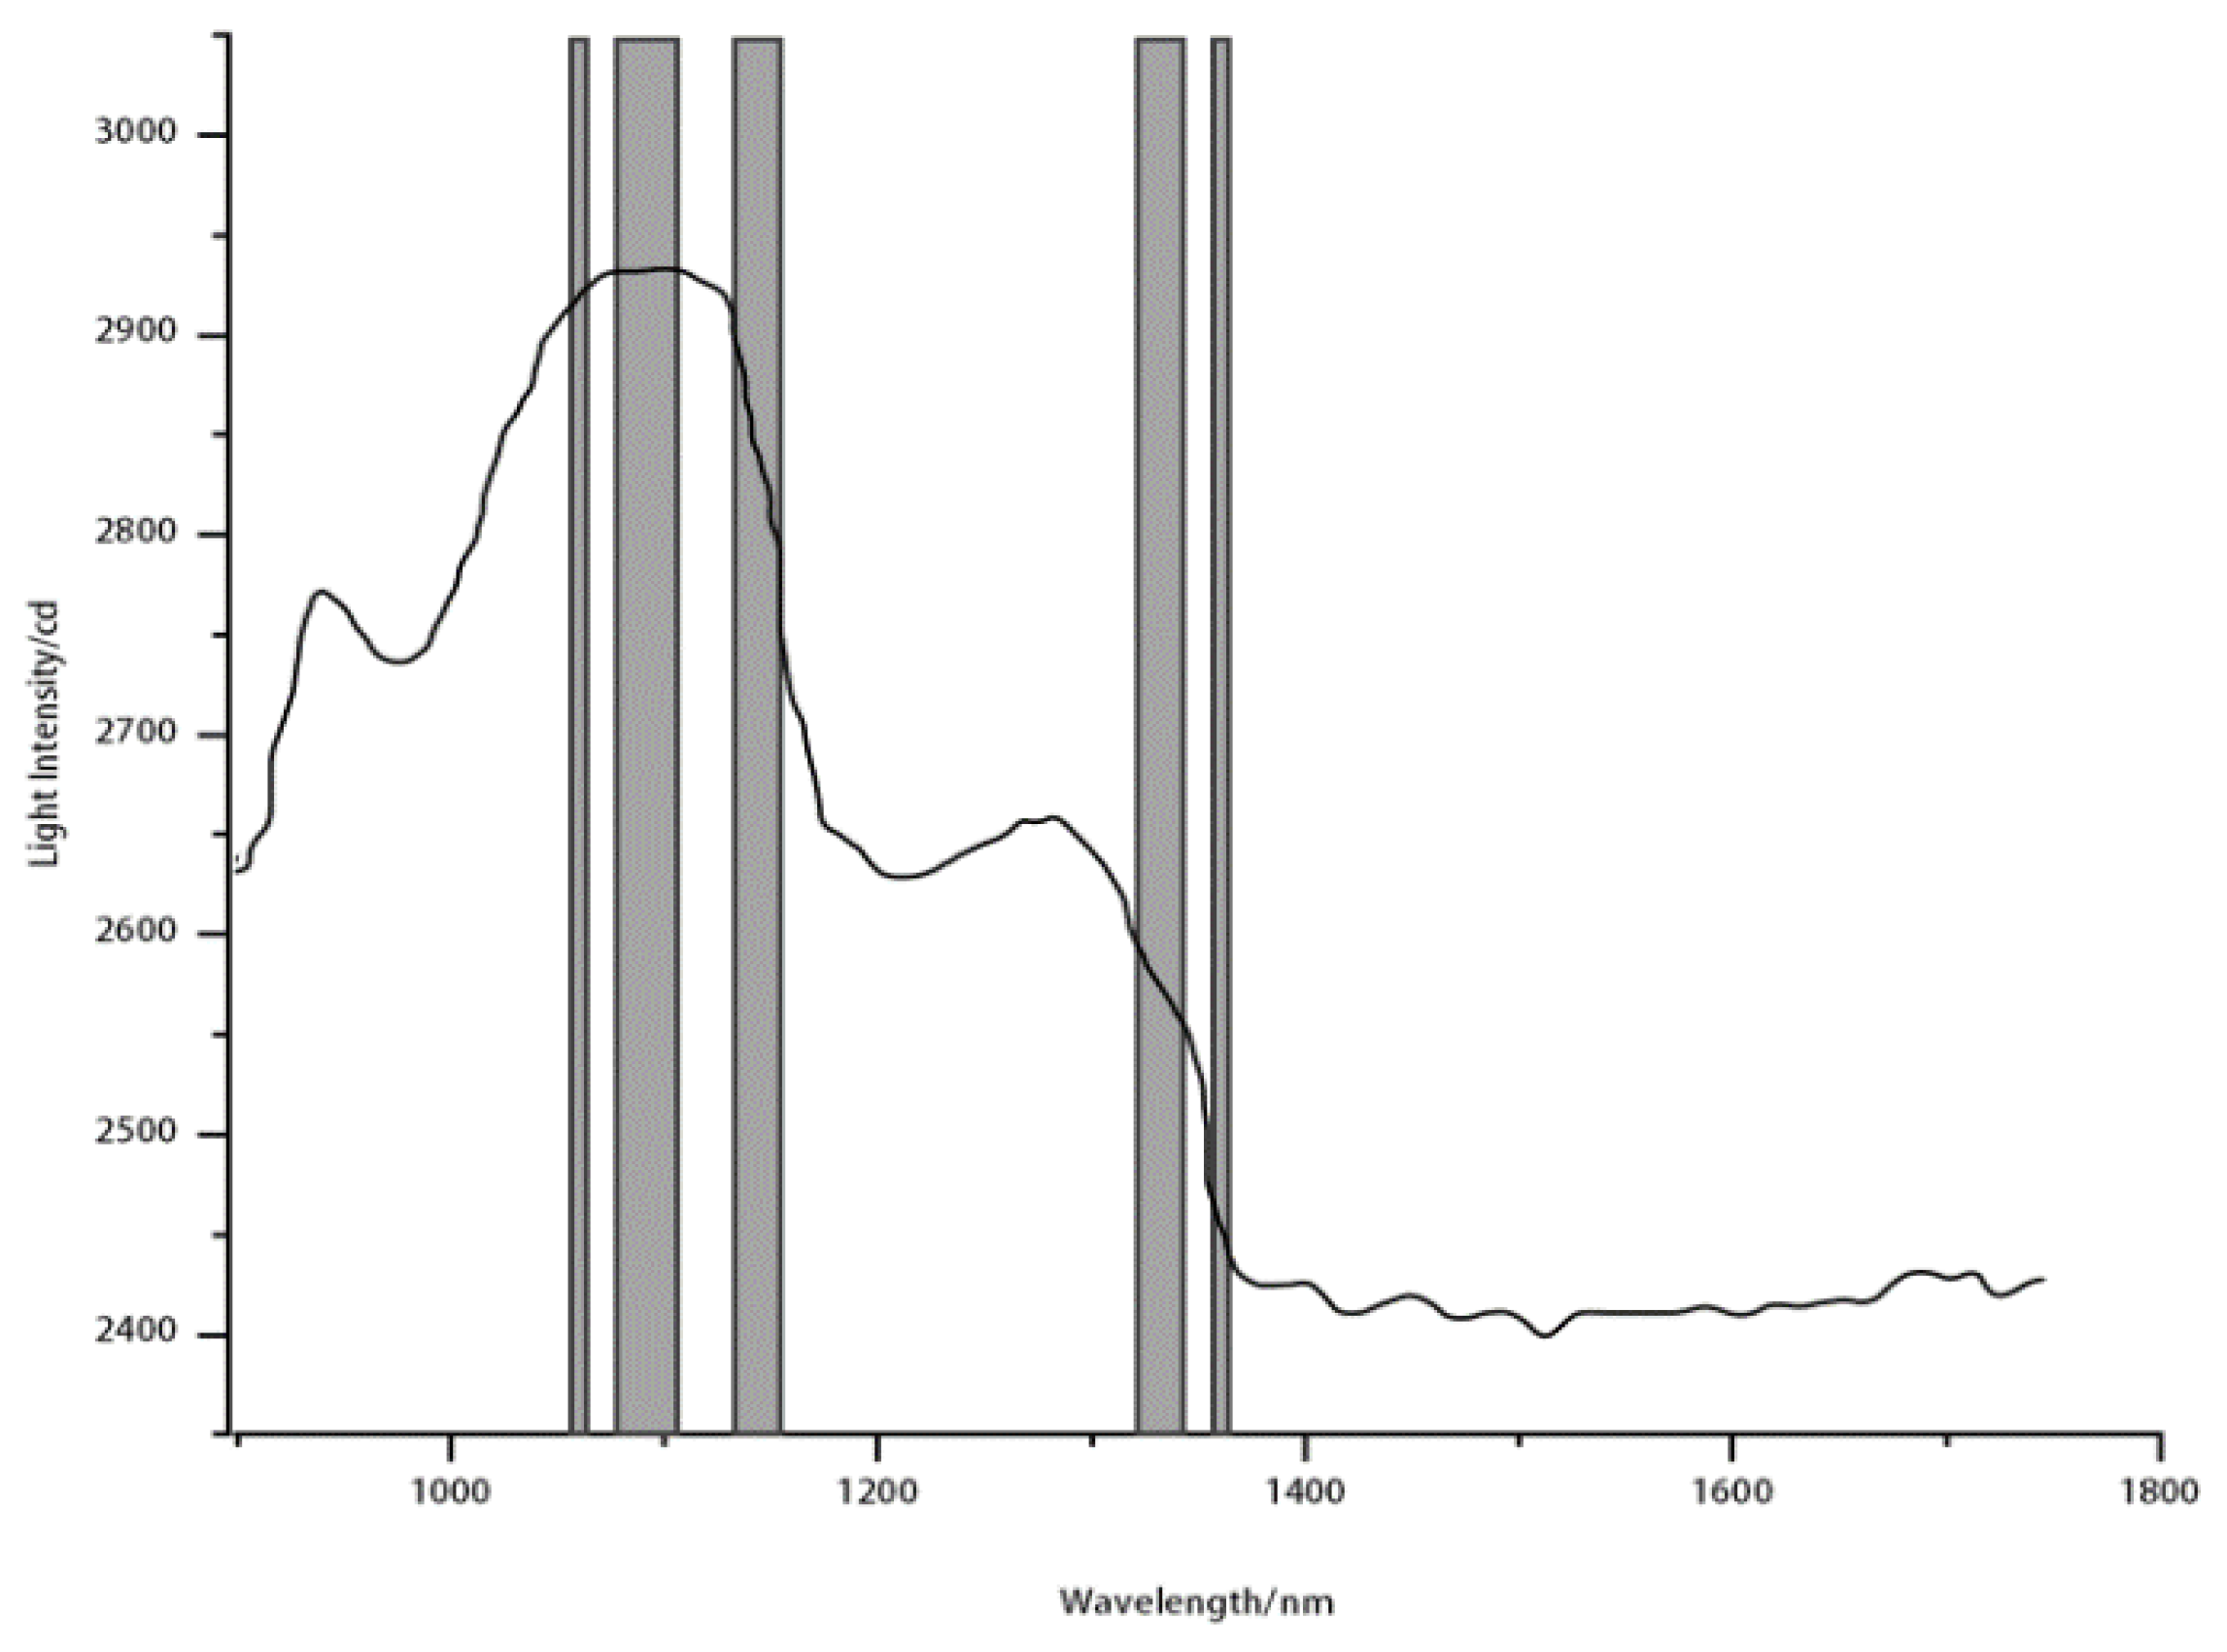
Figure 13.
Modeling result of multicomponent model after siPLS-LASSO.
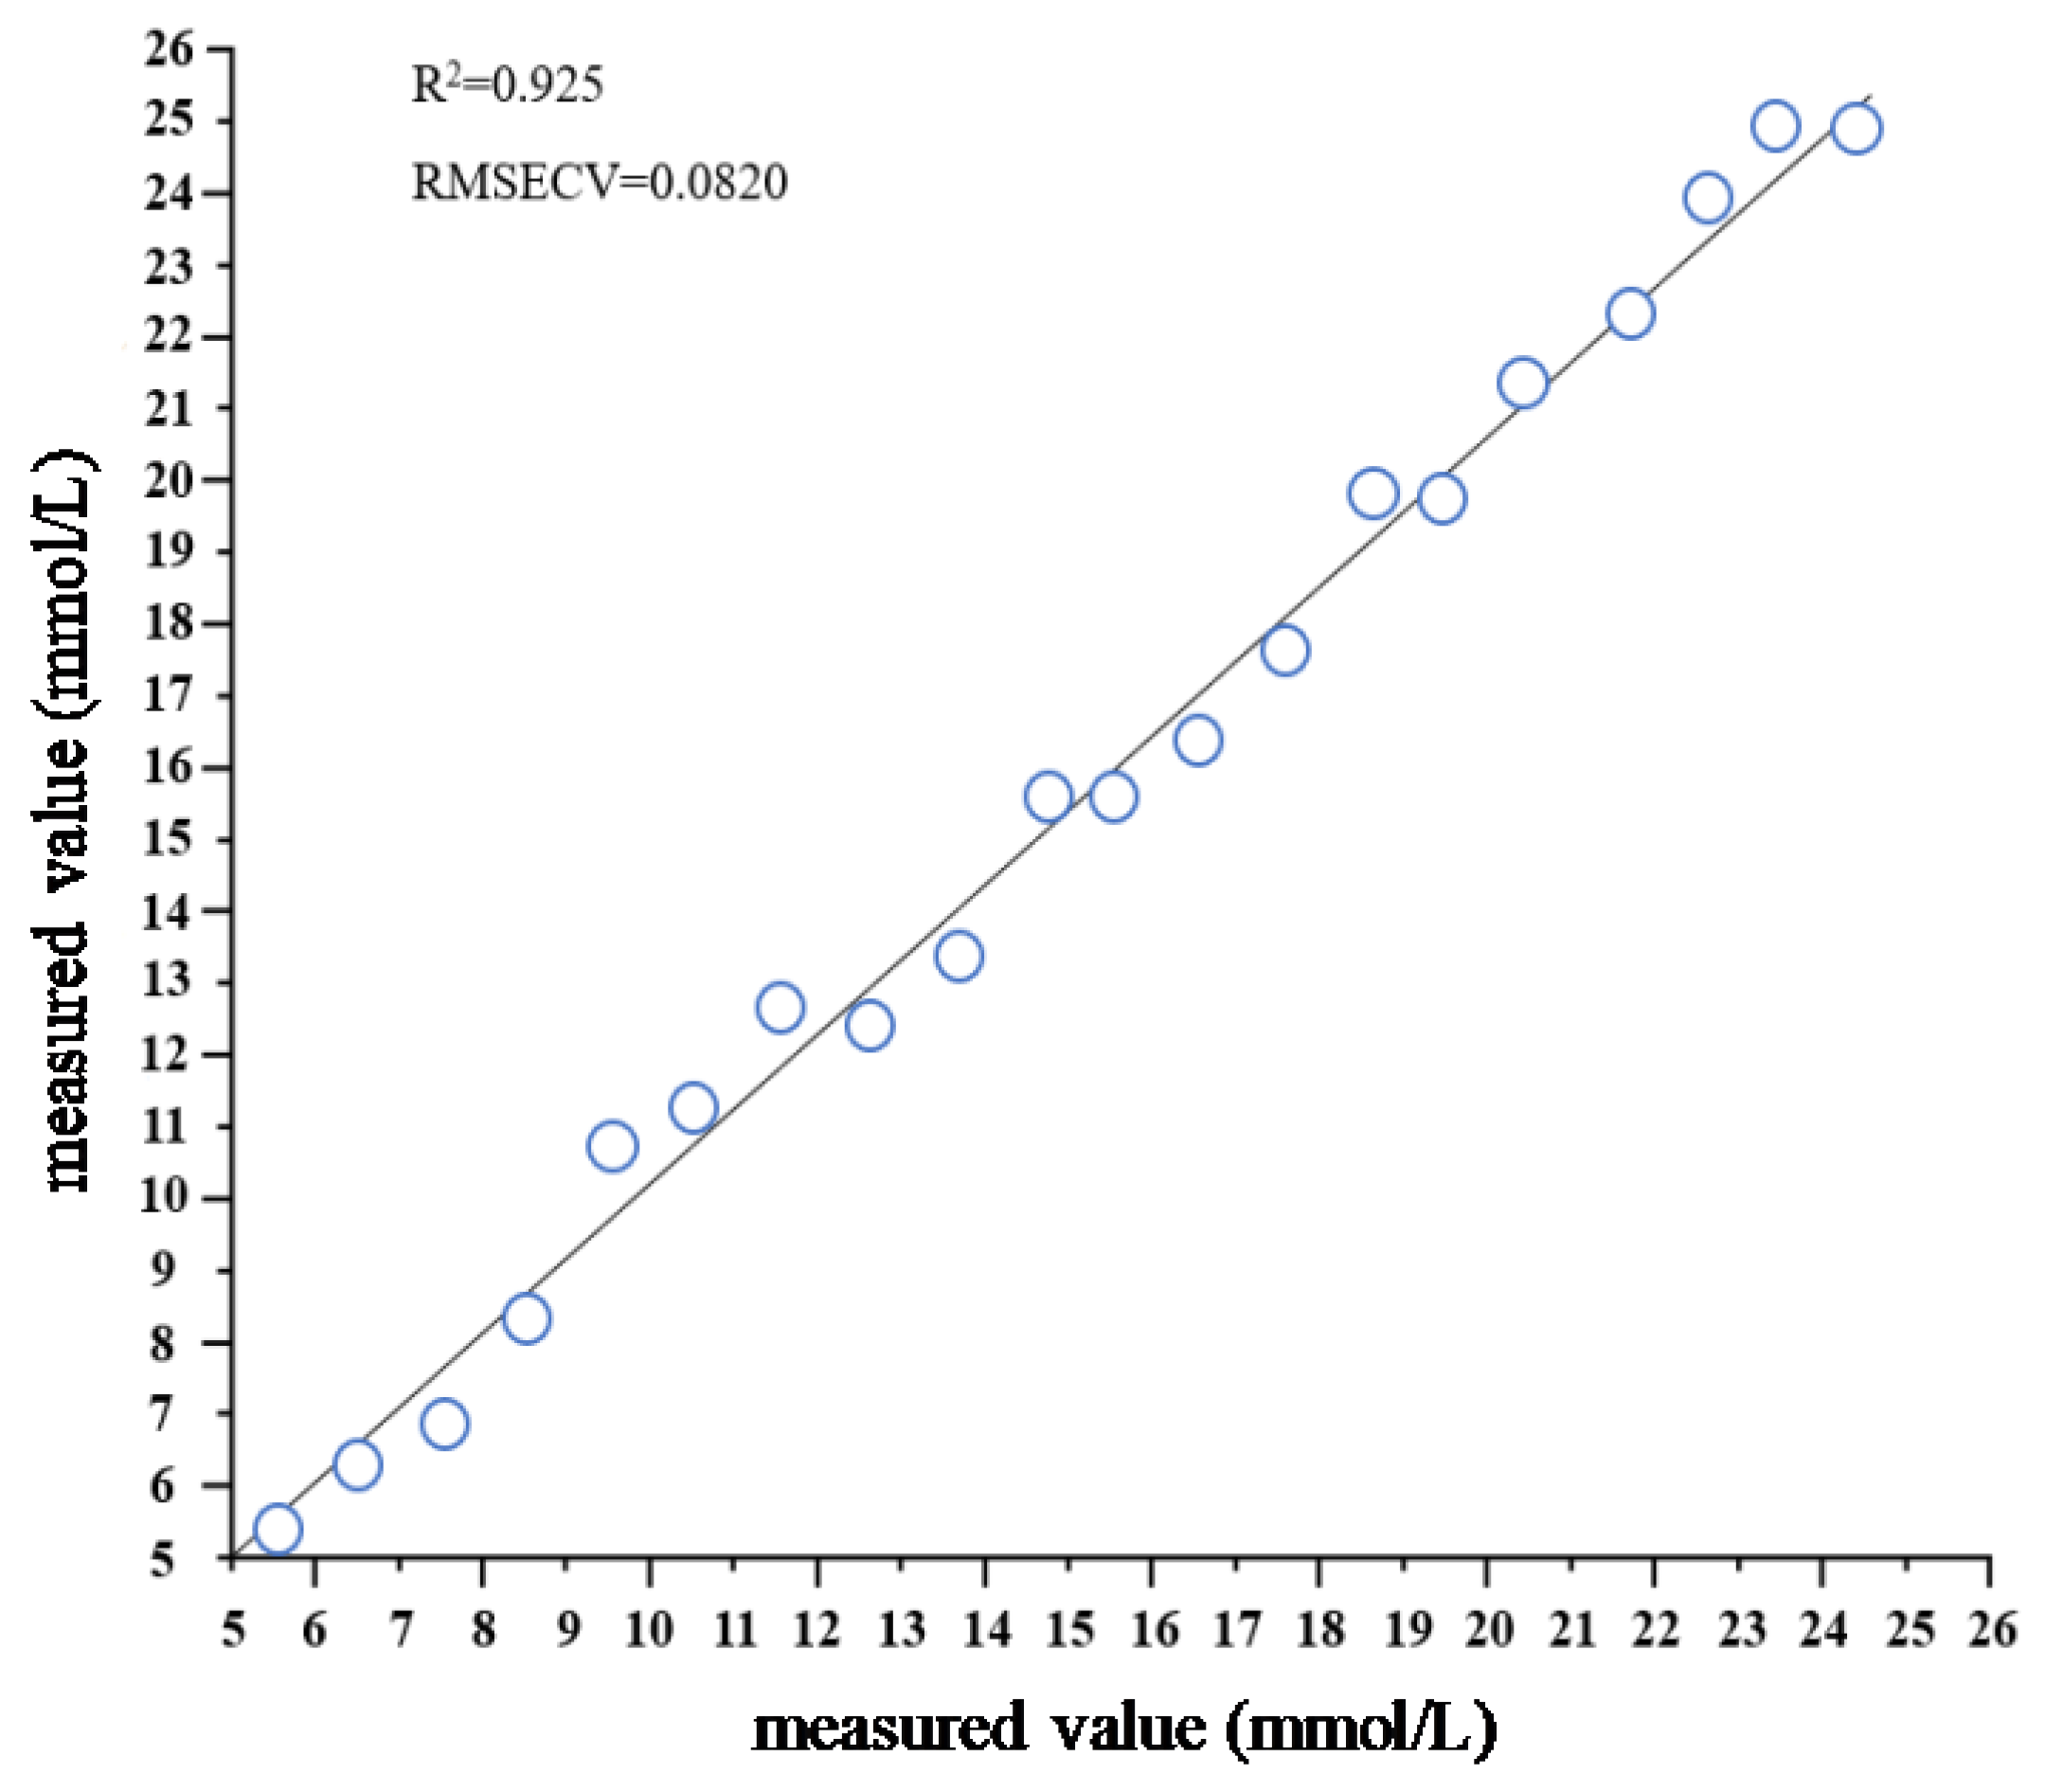

Table 1.
The preprocessing method models the parameters.
| Method | R2 | RMSECV(mM) | RPD | Principal factors |
|---|---|---|---|---|
| - | 0.889 | 0.7210 | 1.76 | 5 |
| 1st Der | 0.934 | 0.3521 | 2.83 | 7 |
| 2nd Der | 0.929 | 0.3591 | 2.74 | 5 |
| SG | 0.936 | 0.1866 | 2.56 | 7 |
| MA | 0.922 | 0.4104 | 1.92 | 6 |
| SNV | 0.976 | 0.0100 | 3.13 | 6 |
| MSC | 0.951 | 0.0192 | 2.98 | 5 |
| N | 0.873 | 1.0945 | 1.77 | 4 |
| 1st Der+SG | 0.931 | 0.2072 | 2.27 | 6 |
| 1st Der+SNV | 0.989 | 0.0095 | 3.84 | 7 |
| 1st Der+MSC | 0.985 | 0.0103 | 3.51 | 7 |
| 2nd Der+SG | 0.932 | 0.2230 | 2.78 | 5 |
| 2nd Der+SNV | 0.974 | 0.0102 | 2.71 | 6 |
| 2nd Der+MSC | 0.961 | 0.0149 | 2.52 | 5 |
| 1st Der+SG+SNV | 0.991 | 0.0081 | 4.30 | 6 |
Table 2.
siPLS algorithm selects evaluation indexes.
| Interval combination | Wavelength range/nm | RMSECV(mM) |
|---|---|---|
| 5 (2), 5 (3) | 1061-1381 | 0.0172 |
| 10 (3), 10 (4) | 1061-1221 | 0.0065 |
| 15 (5), 15 (9) | 1113-1165, 1325-1376 | 0.0054 |
| 10 (3), 10 (4), 15 (9) | 1061-1221, 1325-1376 | 0.0042 |
| 10 (3), 15 (5), 15 (9) | 1061-1165, 1325-1376 | 0.0036 |
| 10 (4), 15 (5), 15 (9) | 1113-1221, 1325-1376 | 0.0058 |
Table 3.
External validation evaluation indicators.
| Sample size | Pre-processing method | Wavelength selection method | R2 | RMSECV(mM) | RPD |
|---|---|---|---|---|---|
| 20 | 1st Der+SG+SNV | siPLS-LASSO | 0.921 | 0.0882 | 2.98 |
Disclaimer/Publisher’s Note: The statements, opinions and data contained in all publications are solely those of the individual author(s) and contributor(s) and not of MDPI and/or the editor(s). MDPI and/or the editor(s) disclaim responsibility for any injury to people or property resulting from any ideas, methods, instructions or products referred to in the content. |
© 2025 by the authors. Licensee MDPI, Basel, Switzerland. This article is an open access article distributed under the terms and conditions of the Creative Commons Attribution (CC BY) license (http://creativecommons.org/licenses/by/4.0/).
Copyright: This open access article is published under a Creative Commons CC BY 4.0 license, which permit the free download, distribution, and reuse, provided that the author and preprint are cited in any reuse.


