
Submitted:
01 April 2025
Posted:
01 April 2025
You are already at the latest version
Abstract
In the 2020 and 2021 vintages, the basic physicochemical parameters and main phenolic compounds (anthocyanins and flavanols) of Aglianico and Cabernet Sauvignon grapes grown in three regions of Southern Italy (Sicilia, Campania, Molise) were determined. Monomeric anthocyanin profiles were then analyzed on wines made from the different grapes. The data collected showed that phenolic compounds were affected by different variables such as vintage, grape variety and geographic location. In the Aglianico grape in particular, the latitude and vintage highly influenced the acidity and phenolic compounds, in terms of richeness in flavanols, respect to Cabernet Sauvignon. On the other hand, the vineyard location affected monomeric anthocyanins in both varieties. These results support the concept that the interaction of intrinsic (such as grape variety) and extrinsic (such as location and winemaking techniques) factors are directly involved in the quality of the wines.
Keywords:
Grapes
; Aglianico
; Cabernet Sauvignon
; phenolic compounds
; terroir
; wine
1. Introduction
The quality of a wine is the result of a complex interplay of factors, from the vineyard to the winery. These factors, including soil type, environmental conditions, grapevine microbiome, viticultural practices, climatic conditions, vine phenology, and winemaking processes all contribute to the “terroir” effect that can determine the chemical composition and quality of grapes and wines [1,2,3,4,5,6,7]. In this regard, the resolution OIV/VITI 333/2010 of the International Organization of Vine and Wine (OIV) defines vitivinicultural “terroir” as a concept that refers to an area in which collective knowledge of the interactions between the identifiable physical and biological environment and applied vitivinicultural practices develop, providing distinctive characteristics for the products originating from this area [8]. The cultivated grapevine, Vitis vinifera subsp. vinifera, possesses a rich biodiversity with numerous varieties. Each variety adapts differently to different soil and climate conditions, which greatly influence the expression of terroir. [9,10,11]. Thus, the same grape variety cultivated in different regions gives rise to wines with different features [3,12]. Moreover, the quality of the wines is directly linked to the composition of the different tissues of the fruit (pulp, skin and seeds) and indirectly to the wine-making process.
Over the years, phenolic compounds have received much attention because they are a key factor in the quality of wines, particularly red wines. [13]. They are secondary metabolites found in grapes and wine that can be formed and transformed during the winemaking process and ageing [14,15]. Especially anthocyanins, flavanols, catechin and other flavonoids, are responsible for the sensory characteristics of wine, particularly color, astringency, bitterness and flavor [16]. In addition, phenolic compounds have various positive effects on human health, especially due to their antioxidant properties [17,18,19].
During berry maturation, the biosynthesis and accumulation of phenolic compounds through the general phenylpropanoid pathway, and its downstream reactions, are influenced by several factors, including cultivar varieties, the environmental factors (agro-pedological, topographical, and climatic), and the cultural practices [15,20,21]. For these reasons, the same grape variety growing in different viticultural regions with diverse climatic conditions, can give rise to wines with different content of phenolic compounds in different vintages or in the same vintage [22,23,24,25,26]. Several studies have emphasized the role of phenolic compounds as markers of different aspects of wine quality, from grape varieties, to geographical origin, to the year of harvest, to the winemaking process and to the ageing of the wine [27,28,29]. Recently, it has been shown that the phenotypic response of Aglianico and Cabernet Sauvignon grape varieties in terms of vigour, production and fruit quality is strongly influenced by soil and climate conditions and, in particular, by the physical properties of the soil [1,30,31].
In this study, we investigated the influence of vineyard location, vintage on the main phenolic compounds (anthocyanins and flavanols) of the Aglianico and Cabernet Sauvignon grapes grown in three different regions of Southern Italy (Sicilia, Campania, Molise), and on wines made from the different grapes.
2. Materials and Methods
2.1. Vineyard Characteristics and Winemaking Trials
The studied grapevines were Aglianico and Cabernet Sauvignon cultivars planted between 2008 and 2010 on 140 Ruggieri rootstocks. All vines were planted in north-south rows, trained according to espalier Guyot, placed in a flat area. The study areas were located in three hilly environments in southern Italy: Molise (41° 42′; 606 m a.s.l.), Campania (41° 35′; 300 a.s.l.) and Sicilia (37° 40′; 400 m a.s.l.), in farms oriented to the production of high-quality wines. Six experimental samples were considered: Aglianico Molise (AM), Aglianico Campania (AC), Aglianico Sicilia (AS), Cabernet Sauvignon Molise (CM), Cabernet Sauvignon Campania (CC) and Cabernet Sauvignon Sicilia (CS). Grapes were harvested during the 2020 and 2021 vintages at the full ripening stage [32,33]. In each vintage, the grapes were transported to the laboratory of the Department of Agricultural, Environmental, and Food Sciences of the University of Molise where they were destemmed and crushed without the addition of adjuvants. The chemical parameters of the must samples are reported in Table S1 (Supplementary material). Before the vinification process started, 80 mg/L of potassium metabisulfite (Essedielle srl, Italy) was added to the grape musts. All samples were inoculated with 20 g/hL of Saccharomyces cerevisiae Lalvin ICV D254 (Lallemand Inc., Montreal, Canada). The fermentation took place at 26 ◦C in stainless steel tanks and the caps were immersed twice a day. After 8 days of maceration, the musts were pressed and free-run and press-run fractions were assembled in stainless steel tanks (working volume 1 hL). At the end of alcoholic fermentation, the wines obtained were subjected to chemical analysis.
2.2. Grapes Analysis and Basic Parameters of Wines
Standard chemical analyses of wines included pH, soluble solids (°Brix), titratable acidity (g/L as tartaric acid), volatile acidity (g/L as acetic acid), alcohol content (% v/v), acetaldehyde content (mg/L) were carried out according to the OIV methods [34]. Flavanols were determined as vanillin reactive flavans according to Gambuti et al. [35]. The total polymeric pigments were determined according to Harberston et al. [36] and were expressed as the sum of short polymeric pigments (SPP) and large polymeric pigments (LPP). L-malic acid (g/L), L-lactic acid (g/L) and citric acid (mg/L) were determined using enzymatic kits (Steroglass, Perugia, Italy), according to the manufacturer’s instructions.
Grapes were also analysed. For this purpose, two independent pools of 100 whole berries for each experimental sample were selected prior to the winemaking process. pH, soluble solids (°Brix), titratable acidity (g/L as tartaric acid) were measured as described above. For the analysis of polyphenols, separate extractions from skin and seeds, simulating the maceration process necessary for red wine production was performed [37]. Flavanols were determined as vanillin reactive flavans according to Gambuti et al. [35].
2.3. High-Performance Liquid Chromatography Analyses of Anthocyanins
Analyses of monomeric anthocyanins for each experimental sample was performed by a HPLC Shimadzu LC10 ADVP apparatus (Shimadzu Italy, Milan, Italy) equipped with a SCL-10AVP system controller, two LC-10ADVP pumps to create the needed solvent gradient, an SPD-M 10 AVP detector and an injection system full Rheodyne model 7725 (Rheodyne, Cotati, CA, USA). The analysis was performed according to the OIV methods [34].
The HPLC solvents were the following: solvent A: water milli-Q (Sigma-Aldrich, Milan, Italy)/formic acid (Sigma-Aldrich ≥ 95%)/acetonitrile (Sigma-Aldrich ≥ 99.9%) (87:10:3) v/v; solvent B: water/formic acid/acetonitrile (40:10:50) v/v. The gradient was: zero-time conditions 94% A and 6% B; after 15 min, the pumps were adjusted to 70% A and 30% B, at 30 min to 50% A and 50% B, at 35 min to 40% A and 60% B, at 41 min, end of analysis, to 94% A and 6% B. 5 minutes re-equilibration time were applied before the successive analysis. The column used for the analyses was a waters spherisorb column (C 18, Silica particle substrate, ODS2 250 x 4.6 mm, 5 μm particles diameter, 80 Å pore size) with a precolumn was used. 50 µL of calibration standards or wine was injected onto the column. The absorbance signals at 520 nm were detected. Detector sensitivity was 0.01 Absorbance units full scale (AUFS). All the samples were filtered through 0.45 µm Durapore membrane filters (Millipore-Ireland) into glass vials and immediately injected into the HPLC system. The calibration curve was obtained by injecting 5 solutions (in triplicate) containing increasing concentrations of malvidin-3-monoglucoside (Extrasynthese, Lyon, France).
2.4. Statistical Analysis
Quantitative data were compared using Tukey’s least significant differences procedure, all the variance resulted homogeneous. When the variances were not homogeneous, data were analyzed using Kruskall–Wallis test. When results of the Kruskal–Wallis test were significant (p < 0.05), the significance of between-group differences was determined by the Bonferroni–Dunn test (5% significance level). These analyses were performed using XLSTAT (version 2013.6.04; Addinsoft, Paris, France). All the data are expressed as means ± standard deviation of four replicates (two experimental replicates x two analytical replicates).
3. Results and Discussion
3.1. Chemical Parameters in Grapes and Wines
Grape technological ripening was evaluated by determining the soluble solids content (Figure 1), titratable acidity (Figure 2), technological maturity index, and pH (Figure 3 and Figure 4, respectively) in the 2020 and 2021 vintages. As shown in Figure 1, no clear trend in sugar content was observed across the two experimental vintages.
Notably, when vintage and location were considered, significant differences in sugar contents were registered in all samples. Commonly, the temperature has been shown to significantly influence the rate and total amount of sugar accumulation [38,39]. In our study, the biosynthesis of sugars in the 2020 and 2021 vintages may have influenced by climatic fluctuations recorded in these years [40].
The effect of vintage and vineyard location was also observed for titratable acidity (Figure 2) regardless of the different climatic conditions [40]. In particular, in the 2020, titratable acidity in Aglianico grapes ranged from 6.16 g/L to 10.30 g/L, while in Cabernet Sauvignon, it ranged from 5.23 g/L to 8.57 g/L. In the 2021 vintage, the values ranged from 4.26 g/L to 11.89 g/L for Aglianico and from 4.85 g/L to 8.39 g/L for Cabernet Sauvignon. Titratable acidity is significantly influenced by temperature, whereas tartaric acid, the primary organic acid in grapes, remains relatively stable under temperature variations. In contrast, malic acid levels are highly dependent on both ripeness and temperature, decreasing as temperature increases [41,42].
The trend of the technological maturity index, given by the soluble solids/titratable acidity ratio, was strongly influenced by vintage and vineyard location (Figure 3), as already reported for soluble solids and titratable acidity. The maturity index is a useful indicator to understand if the raw material is suitable for winemaking and if the resulting wine is balanced from a compositional point of view. Values higher than 4 were detected for grape samples AS 2021, CS 2021 and CC 2020, In general, high values of the maturity index may indicate an impairment of the smooth progress of wine fermentation and possible microbial contamination that could cause an imbalance in the composition of the wine, with production of unpleasant flavors by contaminating and undesirable microorganisms. [43].
As for pH, significant increase in this parameter is generally due to high temperatures, as has already been reported in many wine-growing regions worldwide [44,45]. The pH is also influenced by vineyard location and, in general, by pedo-climatic conditions [1]. In our case (Figure 4), the pH of both Cabernet Sauvignon and Aglianico grapes resulted influenced by these factors.
The results of the chemical analysis of the wines are shown in Table 1. Alcoholic fermentation was completed in all wine samples from both the 2020 and 2021 vintages. Considering Cabernet Sauvignon wines, the highest alcohol contents were observed in CC 2020 and CM 2021 wines (14.0 % and 14.5% v/v, respectively), while the lowest alcohol content was detected in CS 2020 (11.5% v/v), in accordance with the initial sugar concentration in the grapes (Figure 1). A similar observation can be made for Aglianico wines, as the highest (13.8% v/v) and the lowest (12.4% v/v) alcohol contents were observed in wines AM 2020 and AS 2020, respectively, in agreement with the initial sugar concentration. The sugar content of grape berries directly affected the final alcohol concentration of the wines. In turn, sugar composition and accumulation undergo dynamic changes during berry ripening and are influenced by multiple factors, including environmental conditions and viticultural practices [46].
The highest titratable acidity values were recorded in the AM wines with 7.28 g/L and 9.30 g/L in the 2020 and 2021 vintages, respectively. This difference could be attributed to the occurrence of malolactic fermentation in the sample AM 2020, but not in the AM 2021, as evidenced by the respective malic and lactic acid concentrations (Table 1). Malolactic fermentation is known to reduce the titratable acidity by converting malic acid into lactic acid and carbon dioxide, thereby modulating the acidity of the wine and giving it more roundness [47]. The lowest titratable acidity values were found in the wines AS 2021(4.42 g/L) and CS 2021 (4.54 g/L). The variation in titratable acidity among the different samples is strongly influenced by geographical conditions, grape variety and harvest time, all factors that influence the composition of grapes and wine [45,48].
pH values of the wine samples ranged between 3.28 and 3.80, considering both different experimental years (2020 and 2021) and vineyard locations. The increase in pH is primarily attributed to the direct effect of temperature on the rate of malic acid degradation [49]. However, evidence of increased potassium levels at higher temperatures may also play a crucial role in the observed increase in wine pH [42]. The lower titratable acidity, which is typically associated with higher pH values, is probably due to the interaction between potassium and tartaric acid, leading to its precipitation [42]. In addition, the degradation of malic acid, especially in the AM, CM, CC and AS samples of the 2020 vintage, may have further contributed to the observed increase in pH, since an increase in lactic acid was also found in the same samples.
The highest citric acid values were found in the 2021 vintage in particular for the CC (0.53 g/L) and AC (0.61 g/L) wines, but in general all wines showed citric acid concentrations in normal ranges. The citric acid values are related to the cultivar and to the pedoclimatic conditions. Moreover, the concentration of citric acid is strongly dependent on oxygen availability during the alcoholic fermentation [50]. Citric acid can be partially or fully metabolized by lactic acid bacteria, leading to the formation of acetic acid, diacetyl, acetoin, and 2,3-butanediol [51,52].
Finally, the volatile acidity values found in all analysed wines ranged between 0.24-0.59 g/L, that is, within the acceptable range established by current regulations, which set the maximum allowable limit for wines at 1.2 g/L [53].
3.2. Polyphenolic Content of Grapes and Wines
Total flavanols and anthocyanins were the main classes of phenolic compounds considered. Flavanols are compounds contained in wine and responsible for bitterness and astringency. The content of total flavanols extracted from the skin and seeds of the grapes is shown in Figure 5.
In 2021, the accumulation of these compounds was higher for both cultivars in almost all samples compared to 2020, probably due to the effect of higher biosynthesis and lower water content in the berries [40]. The effect of the vintage was more pronounced in the case of Cabernet Sauvignon grapes than Aglianico grapes, while vineyard location had a lower effect. In agreement with the literature [1,54], a higher concentration of flavonols was observed in Aglianico compared to Cabernet Sauvignon, especially in the vintage 2020.
Considering the wines (Figure 6), the lower values of total flavanols detected in wines in comparison to grapes is imputable to reactions of oxidation, polymerization, and precipitation that native phenolic compounds underwent, as already reported by Iorizzo et al. [1]. Specifically, the data analysis showed higher values of total flavonols in the 2021 vintage than in the 2020 vintage in all samples, generally mirroring what has already been observed for grape berries. The location of the vineyard had a minor influence on the flavonol content. It is necessary to underline that, in some cases, a higher flavonol content can give an excessive astringency to wines and, therefore, it is important to define winemaking protocols useful to limit their extraction during maceration and fermentation of grapes [55].
A significant effect of vineyard location was found for the monomeric anthocyanin content in grapes (Figure 7) and wines (Figure 8). In particular, for both cultivars the content decreased from the highest latitude (Molise) to the lowest (Sicilia) for grapes, with a few exceptions, such as the grape sample CS 2021 (Figure 7). The same trend has not been observed in wines (Figure 8), probably due to transformations of these compounds during vinification processes [14,15]. It is known that the biosynthesis of anthocyanins depends on the UV radiation and thermal excursion. The higher the radiation and the thermal excursion, the higher the synthesis of anthocyanins. On the other hand, a high night temperature determines a degradation of anthocyanins during berry ripening [56]. Therefore, the higher night temperature and the lower thermal excursion of Sicilia can easily explain the great difference between Molise and Sicilia for both cultivars. The cultivar most sensitive to latitude was Aglianico, which showed approximately twofold higher values of total monomeric anthocyanins in grapes from the Molise region than in Sicilia.
Concerning the monomeric anthocyanins (Table 2), in agreement with previous literature, the Cabernet Sauvignon wines distinguished from Aglianico for the higher ratio among acetyl and coumaroyl anthocyanins [26]. This datum confirms that, regardless environmental conditions, this ratio is genetically driven and it is a good marker for the authenticity of grapes and wines when young, before that native anthocyanins are consumed in reactions giving new pigments [57]. The content of malvidin-3-monoglucoside was significantly influenced by the years, especially in the Molise area and for the Aglianico grape variety. On the other hand, a strong effect of the year was observed only for Cabernet Sauvignon wines produced in Campania and Sicilia. Since the effect was observed for all anthocyanin derivatives, it is clear that it depends more on the synthesis of anthocyanidin aglycones than on the acylation and possible degradation of monomeric anthocyanins during winemaking [58].
Data on polymeric pigments can help to understand the overall effect environmental conditions on red wine pigments and provide more complete information (Figure 9). Native anthocyanins started to react with other grape phenolics from maceration-fermentation, thanks to the fact that they have both electrophylic and nucleophylic carbons, so that flavanols can react with them to give condensation products [59]. These reactions produce new pigments that are more stable, that can have a different molecular weight and that can be divided into short and large polymeric pigments on the basis of their reactivity towards BSA and SO2 [36]. Our data clearly show that these compounds were higher in wines obtained from grapes with a higher flavanol/anthocyanin ratio. Similar results were also obtained in Aglianico, Barbera and Sangiovese wines when subjected to oxidative stress such as that occurring during wine ageing [60].
The large amount of polymeric pigments in samples CS from Sicilia in 2021 compared to 2020 could also be attributed to a greater formation of structures containing ethanal bridges due to the higher amount of acetaldehyde in wines produced in 2021 (Figure 10).
Acetaldehyde is a strong electrophile at wine pH and reacts with many other compounds in the medium [57,58]. On the other hand, it is also of great interest to understand why it is only in these specific wines that the concentration of acetaldehyde is more than twice as high as in other wines. It is known that acetaldehyde has multiple origins, microbial and chemical. The higher values of acetaldehyde found in wines produced from grapes grown in Sicilia could be related to the lower levels of titratable acidity of these grapes determining a higher risk of oxidation [61]. Data on acetaldehyde detected are well below the sensory threshold and the higher was the level of this electrophile, the higher was the stability of color and polymeric pigments present in aged wines, confirms the positive role of moderate amounts of acetaldehyde for wine ageing [62,63].
4. Conclusions
The parameters of the wines evaluated in this study were influenced by the grape variety, but also by other important factors such as the vintage and the location of the vineyard. In both cultivars, the monomeric anthocyanin content decreased as a function of latitude due to different environmental conditions. Aglianico wine in particular was found to be richer in flavanols than Cabernet Sauvignon, while the effect of latitude was observed for monomeric anthocyanins in both varieties. As for the varietal effect, acidity and phenolic compounds, the grape variety with the highest sensitivity to latitude and vintage was Aglianico. In light of our results, the technological maturity index, which is still determined by the sugar/acidity ratio of the grape pulp, should be combined with phenolic maturity indices, which should, however, be determined according to the cultivar and the different environmental conditions.
Supplementary Materials
The following supporting information can be downloaded at the website of this paper posted on Preprints.org, Table S1. Chemical parameters of Aglianico and Cabernet Sauvignon musts obtained from grapes harvested in 2020 and 2021 vintages.
Author Contributions
Conceptualization, A.G. and M.I.; methodology, A.G. and B.T.; software, F.C. and B.T.; formal analysis, F.C., A.L., L.P.; investigation, F.C., M.I., and B.T.; data curation, F.C., M.S., A.G., and B.T.; writing—original draft preparation, F.C., M.I., and A.G.; writing—review and editing, B.T., F.C., and M.S.; visualization, F.C., M.S., and B.T.; supervision, M.I. All authors have read and agreed to the published version of the manuscript.
Funding
This research received no external funding.
Institutional Review Board Statement
Not applicable.
Informed Consent Statement
Not applicable.
Data Availability Statement
All the data are available within the article.
Conflicts of Interest
The authors declare no conflicts of interest.
References
- Iorizzo, M.; Sicilia, A.; Nicolosi, E.; Forino, M.; Picariello, L.; Lo Piero, A.R.; Vitale, A.; Monaco, E.; Ferlito, F.; Succi, M.; et al. Investigating the Impact of Pedoclimatic Conditions on the Oenological Performance of Two Red Cultivars Grown throughout Southern Italy. Front. Plant Sci. 2023, 14, 1250208. [Google Scholar] [CrossRef] [PubMed]
- Iorizzo, M.; Bagnoli, D.; Vergalito, F.; Testa, B.; Tremonte, P.; Succi, M.; Pannella, G.; Letizia, F.; Albanese, G.; Lombardi, S.J.; et al. Diversity of Fungal Communities on Cabernet and Aglianico Grapes from Vineyards Located in Southern Italy. Front. Microbiol. 2024, 15. [Google Scholar] [CrossRef] [PubMed]
- Mansour, G.; Ghanem, C.; Mercenaro, L.; Nassif, N.; Hassoun, G.; Caro, A.D. Effects of Altitude on the Chemical Composition of Grapes and Wine: A Review. OENO One 2022, 56, 227–239. [Google Scholar] [CrossRef]
- Bonfante, A.; Brillante, L. Terroir Analysis and Its Complexity: This Article Is Published in Cooperation with Terclim 2022 (XIVth International Terroir Congress and 2nd ClimWine Symposium), 3-8 July 2022, Bordeaux, France. OENO One 2022, 56, 375–388. [Google Scholar] [CrossRef]
- Testa, B.; Coppola, F.; Iorizzo, M.; Di Renzo, M.; Coppola, R.; Succi, M. Preliminary Characterisation of Metschnikowia pulcherrima to Be Used as a Starter Culture in Red Winemaking. Beverages 2024, 10, 88. [Google Scholar] [CrossRef]
- Testa, B.; Coppola, F.; Letizia, F.; Albanese, G.; Karaulli, J.; Ruci, M.; Pistillo, M.; Germinara, G.S.; Messia, M.C.; Succi, M.; et al. Versatility of Saccharomyces cerevisiae 41CM in the Brewery Sector: Use as a Starter for “Ale” and “Lager” Craft Beer Production. Processes 2022, 10, 2495. [Google Scholar] [CrossRef]
- Karaulli, J.; Xhaferaj, N.; Coppola, F.; Testa, B.; Letizia, F.; Kyçyk, O.; Kongoli, R.; Ruci, M.; Lamçe, F.; Sulaj, K.; et al. Bioprospecting of Metschnikowia pulcherrima Strains, Isolated from a Vineyard Ecosystem, as Novel Starter Cultures for Craft Beer Production. Fermentation 2024, 10, 513. [Google Scholar] [CrossRef]
- Definition of Vitivinicultural “Terroir” | OIV. Available online: https://www.oiv.int/node/3362 (accessed on 21 March 2025).
- Bonfante, A.; Monaco, E.; Langella, G.; Mercogliano, P.; Bucchignani, E.; Manna, P.; Terribile, F. A Dynamic Viticultural Zoning to Explore the Resilience of Terroir Concept under Climate Change. Sci. Total Environ. 2018, 624, 294–308. [Google Scholar] [CrossRef]
- van Leeuwen, C. 9 - Terroir: The Effect of the Physical Environment on Vine Growth, Grape Ripening, and Wine Sensory Attributes. In Managing Wine Quality (Second Edition); Reynolds, A.G., Ed.; Woodhead Publishing Series in Food Science, Technology and Nutrition; Woodhead Publishing, 2022; pp. 341–393 ISBN 978-0-08-102067-8.
- Cameron, B. Phenology and Terroir Heard Through the Grapevine. In; 2025; pp. 573–593 ISBN 978-3-031-75026-7.
- Rouxinol, M.I.; Martins, M.R.; Barroso, J.M.; Rato, A.E. Wine Grapes Ripening: A Review on Climate Effect and Analytical Approach to Increase Wine Quality. Appl. Biosci. 2023, 2, 347–372. [Google Scholar] [CrossRef]
- Gutiérrez-Escobar, R.; Aliaño-González, M.J.; Cantos-Villar, E. Wine Polyphenol Content and Its Influence on Wine Quality and Properties: A Review. Molecules 2021, 26, 718. [Google Scholar] [CrossRef]
- Silva, A.; Silva, V.; Igrejas, G.; Aires, A.; Falco, V.; Valentão, P.; Poeta, P. Phenolic Compounds Classification and Their Distribution in Winemaking By-Products. Eur. Food Res. Technol. 2022, 249. [Google Scholar] [CrossRef]
- Lu, H.-C.; Han, X.; Tian, M.-B.; Shi, N.; Li, M.-Y.; Duan, C.-Q.; He, F.; Wang, J. Integrated Metabolome and Transcriptome Analyses Reveal Insights into How Macro-Terroir Affects Polyphenols of Cabernet Sauvignon Grapes. Sci. Hortic. 2025, 341, 113996. [Google Scholar] [CrossRef]
- Cheynier, V.V.; Duenas-Paton, M.; Salas, E.; Maury, C.; Souquet, J.M.J.M.; Manchado-Sarni, P.; Fulcrand, H. Structure and Properties of Wine Pigments and Tannins. Am. J. Enol. Vitic. 2006, 57, 298–305. [Google Scholar] [CrossRef]
- El Rayess, Y.; Nehme, N.; Azzi-Achkouty, S.; Julien, S.G. Wine Phenolic Compounds: Chemistry, Functionality and Health Benefits. Antioxidants (Basel) 2024, 13, 1312. [Google Scholar] [CrossRef]
- Rahman, M.M.; Rahaman, M.S.; Islam, M.R.; Rahman, F.; Mithi, F.M.; Alqahtani, T.; Almikhlafi, M.A.; Alghamdi, S.Q.; Alruwaili, A.S.; Hossain, M.S.; et al. Role of Phenolic Compounds in Human Disease: Current Knowledge and Future Prospects. Molecules 2021, 27, 233. [Google Scholar] [CrossRef]
- Testa, B.; Coppola, F.; Succi, M.; Iorizzo, M. Biotechnological Strategies for Ethanol Reduction in Wine. Fermentation 2025, 11, 159. [Google Scholar] [CrossRef]
- Deng, Y.; Lu, S. Biosynthesis and Regulation of Phenylpropanoids in Plants. Crit. Rev. Plant Sci. 2017, 36, 1–34. [Google Scholar] [CrossRef]
- Rienth, M.; Vigneron, N.; Darriet, P.; Sweetman, C.; Burbidge, C.; Bonghi, C.; Walker, R.P.; Famiani, F.; Castellarin, S.D. Grape Berry Secondary Metabolites and Their Modulation by Abiotic Factors in a Climate Change Scenario–A Review. Front. Plant Sci. 2021, 12. [Google Scholar] [CrossRef]
- Eder, R.; Pajovic Scepanovic, R.; Raicevic, D.; Popović, T.; Korntheuer, K.; Wendelin, S.; Forneck, A.; Philipp, C. Study of the Effects of Climatic Conditions on the Phenolic Content and Antioxidant Activity of Austrian and Montenegrin Red Wines. OENO One 2023, 57, 68–85. [Google Scholar] [CrossRef]
- Cosme, F.; Vilela, A.; Moreira, L.; Moura, C.; Enríquez, J.A.P.; Filipe-Ribeiro, L.; Nunes, F.M. Terroir Effect on the Phenolic Composition and Chromatic Characteristics of Mencía/Jaen Monovarietal Wines: Bierzo D.O. (Spain) and Dão D.O. (Portugal). Molecules 2020, 25, 6008. [Google Scholar] [CrossRef]
- Costa, E.; Cosme, F.; Rivero-Perez, M.; Jordão, A.; González-SanJosé, M.L. Influence of Wine Region Provenance on Phenolic Composition, Antioxidant Capacity and Radical Scavenger Activity of Traditional Portuguese Red Grape Varieties. Eur. Food Res. Technol. 2015, 241. [Google Scholar] [CrossRef]
- Xing, R.-R.; He, F.; Xiao, H.-L.; Duan, C.-Q.; Pan, Q.-H. Accumulation Pattern of Flavonoids in Cabernet Sauvignon Grapes Grown in a Low-Latitude and High-Altitude Region. S. Afr. j. enol. vitic. 2016, 36. [Google Scholar] [CrossRef]
- Chen, X.; Wang, Z.; Li, Y.; Liu, Q.; Yuan, C. Survey of the Phenolic Content and Antioxidant Properties of Wines from Five Regions of China According to Variety and Vintage. LWT 2022, 169, 114004. [Google Scholar] [CrossRef]
- Merkytė, V.; Longo, E.; Windisch, G.; Boselli, E. Phenolic Compounds as Markers of Wine Quality and Authenticity. Foods 2020, 9, 1785. [Google Scholar] [CrossRef]
- Urvieta, R.; Buscema, F.; Bottini, R.; Coste, B.; Fontana, A. Phenolic and Sensory Profiles Discriminate Geographical Indications for Malbec Wines from Different Regions of Mendoza, Argentina. Food Chem. 2018, 265, 120–127. [Google Scholar] [CrossRef]
- Kumšta, M.; Pavloušek, P.; Kárník, P. Use of Anthocyanin Profiles When Differentiating Individual Varietal Wines and Terroirs. Food Technol. Biotechnol. 2014, 52, 383–390. [Google Scholar] [CrossRef]
- Ferlito, F.; Nicolosi, E.; Sicilia, A.; Villano, C.; Aversano, R.; Lo Piero, A.R. Physiological and Productive Responses of Two Vitis Vinifera L. Cultivars across Three Sites in Central-South Italy. Horticulturae 2023, 9, 1321. [Google Scholar] [CrossRef]
- Sicilia, A.; Villano, C.; Aversano, R.; Di Serio, E.; Nicolosi, E.; Ferlito, F.; Lo Piero, A.R. Study of Red Vine Phenotypic Plasticity across Central-Southern Italy Sites: An Integrated Analysis of the Transcriptome and Weather Indices through WGCNA. Front. Plant Sci. 2024, 15. [Google Scholar] [CrossRef]
- Meier, U. Growth Stages of Mono- and Dicotyledonous Plants: BBCH Monograph. 2018. [CrossRef]
- LORENZ, D.H.; EICHHORN, K.W.; Bleiholder, H.; KLOSE, R.; MEIER, U.; WEBER, E. Growth Stages of the Grapevine: Phenological Growth Stages of the Grapevine (Vitis Vinifera L. Ssp. Vinifera)? Codes and Descriptions According to the Extended BBCH Scale? Aust. J. Grape Wine Res. 2008, 1, 100–103. [Google Scholar] [CrossRef]
- Compendium of International Methods of Wine and Must Analysis | OIV. Available online: https://www.oiv.int/standards/compendium-of-international-methods-of-wine-and-must-analysis (accessed on 24 March 2025).
- Gambuti, A.; Han, G.; Peterson, A.L.; Waterhouse, A.L. Sulfur Dioxide and Glutathione Alter the Outcome of Microoxygenation. Am. J. Enol. Vitic. 2015, 66, 411–423. [Google Scholar] [CrossRef]
- Harbertson, J.; Picciotto, E.; Adams, D. Measurement of Polymeric Pigments in Grape Berry Extracts and Wines Using a Protein Precipitation Assay Combined with Bisulfite Bleaching. Am. J. Enol. Vitic. 2003, 54, 301–306. [Google Scholar] [CrossRef]
- Mattivi, F.; Zulian, C.; Nicolini, G.; Valenti, L. Wine, Biodiversity, Technology, and Antioxidants. Ann. N. Y. Acad. Sci. 2002, 957, 37–56. [Google Scholar] [CrossRef] [PubMed]
- Sadras, V. o.; Petrie, P. r. Climate Shifts in South-Eastern Australia: Early Maturity of Chardonnay, Shiraz and Cabernet Sauvignon Is Associated with Early Onset Rather than Faster Ripening. Aust. J. Grape Wine Res. 2011, 17, 199–205. [Google Scholar] [CrossRef]
- Greer, D.; Weedon, M. Temperature-Dependent Responses of the Berry Developmental Processes of Three Grapevine (Vitis Vinifera) Cultivars. New. Zeal. J. Crop. Hort. 2014, 42, 233–246. [Google Scholar] [CrossRef]
- Gli indicatori del clima in Italia nel 2021 – Anno XVII. Available online: https://www.isprambiente.gov.it/it/pubblicazioni/stato-dellambiente/gli-indicatori-del-clima-in-italia-nel-2021-2013-anno-xvii (accessed on 24 March 2025).
- Tarara, J.M.; Lee, J.; Spayd, S.E.; Scagel, C.F. Berry Temperature and Solar Radiation Alter Acylation, Proportion, and Concentration of Anthocyanin in Merlot Grapes. Am. J. Enol. Vitic. 2008, 59, 235–247. [Google Scholar] [CrossRef]
- Mira de Orduña, R. Climate Change Associated Effects on Grape and Wine Quality and Production. Food Res. Int. 2010, 43, 1844–1855. [Google Scholar] [CrossRef]
- Meléndez, E.; Ortiz, M.C.; Sarabia, L.A.; Íñiguez, M.; Puras, P. Modelling Phenolic and Technological Maturities of Grapes by Means of the Multivariate Relation between Organoleptic and Physicochemical Properties. Anal. Chim. Acta 2013, 761, 53–61. [Google Scholar] [CrossRef]
- Adelsheim, D.; Busch, C.; Catena, L.; Champy, B.; Coetzee, J.; Coia, L.; Croser, B.; Draper, P.; Durbourdieu, D.; Frank, F.; et al. Climate Change: Field Reports from Leading Winemakers. J. Wine Econ. 2016, 11, 5–47. [Google Scholar] [CrossRef]
- van Leeuwen, C.; Destrac-Irvine, A.; Dubernet, M.; Duchêne, E.; Gowdy, M.; Marguerit, E.; Pieri, P.; Parker, A.; de Rességuier, L.; Ollat, N. An Update on the Impact of Climate Change in Viticulture and Potential Adaptations. Agronomy 2019, 9, 514. [Google Scholar] [CrossRef]
- Jordão, A.M.; Vilela, A.; Cosme, F. From Sugar of Grape to Alcohol of Wine: Sensorial Impact of Alcohol in Wine. Beverages 2015, 1, 292–310. [Google Scholar] [CrossRef]
- Pannella, G.; Lombardi, S.J.; Coppola, F.; Vergalito, F.; Iorizzo, M.; Succi, M.; Tremonte, P.; Iannini, C.; Sorrentino, E.; Coppola, R. Effect of Biofilm Formation by Lactobacillus plantarum on the Malolactic Fermentation in Model Wine. Foods 2020, 9, 797. [Google Scholar] [CrossRef] [PubMed]
- González-Barreiro, C.; Rial-Otero, R.; Cancho-Grande, B.; Simal-Gándara, J. Wine Aroma Compounds in Grapes: A Critical Review. Crit. Rev. Food Sci. Nutr. 2015, 55, 202–218. [Google Scholar] [CrossRef] [PubMed]
- Fraga, H.; Malheiro, A.C.; Moutinho-Pereira, J.; Santos, J.A. An Overview of Climate Change Impacts on European Viticulture. Food Energy Secur. 2012, 1, 94–110. [Google Scholar] [CrossRef]
- Chidi, B.S.; Rossouw, D.; Buica, A.S.; Bauer, F.F. Determining the Impact of Industrial Wine Yeast Strains on Organic Acid Production Under White and Red Wine-like Fermentation Conditions. S. Afr. j. enol. vitic. 2015, 36, 316–327. [Google Scholar] [CrossRef]
- Wu, W.; Zhao, N. Metabolomics of Lactic Acid Bacteria. In Lactic Acid Bacteria: Omics and Functional Evaluation; Chen, W., Ed.; Springer Nature: Singapore, 2019; pp. 167–182. ISBN 978-981-13-7832-4. [Google Scholar]
- Capozzi, V.; Tufariello, M.; De Simone, N.; Fragasso, M.; Grieco, F. Biodiversity of Oenological Lactic Acid Bacteria: Species- and Strain-Dependent Plus/Minus Effects on Wine Quality and Safety. Fermentation 2021, 7, 24. [Google Scholar] [CrossRef]
- Maximum Acceptable Limits | OIV. Available online: https://www.oiv.int/it/standards/international-code-of-oenological-practices/annexes/maximum-acceptable-limits (accessed on 24 March 2025).
- Muccillo, L.; Gambuti, A.; Frusciante, L.; Iorizzo, M.; Moio, L.; Raieta, K.; Rinaldi, A.; Colantuoni, V.; Aversano, R. Biochemical Features of Native Red Wines and Genetic Diversity of the Corresponding Grape Varieties from Campania Region. Food Chem. 2014, 143, 506–513. [Google Scholar] [CrossRef]
- Peña-Neira, A. Chapter 18 - Management of Astringency in Red Wines. In Red Wine Technology; Morata, A., Ed.; Academic Press, 2019; pp. 257–272 ISBN 978-0-12-814399-5.
- Mori, K.; Goto-Yamamoto, N.; Kitayama, M.; Hashizume, K. Loss of Anthocyanins in Red-Wine Grape under High Temperature. J. Exp. Bot. 2007, 58, 1935–1945. [Google Scholar] [CrossRef]
- Zhang, X.-K.; Lan, Y.-B.; Huang, Y.; Zhao, X.; Duan, C.-Q. Targeted Metabolomics of Anthocyanin Derivatives during Prolonged Wine Aging: Evolution, Color Contribution and Aging Prediction. Food Chem. 2021, 339, 127795. [Google Scholar] [CrossRef]
- Delić, K.; Milinčić, D.D.; Pešić, M.B.; Lević, S.; Nedović, V.A.; Gancel, A.-L.; Jourdes, M.; Teissedre, P.-L. Grape, Wine and Pomace Anthocyanins: Winemaking Biochemical Transformations, Application and Potential Benefits. OENO One 2024, 58. [Google Scholar] [CrossRef]
- Waterhouse, A.; Zhu, J. A Quarter Century of Wine Pigment Discovery. J. Sci. Food Agric. 2019, 100. [Google Scholar] [CrossRef]
- Coppola, F.; Picariello, L.; Forino, M.; Moio, L.; Gambuti, A. Comparison of Three Accelerated Oxidation Tests Applied to Red Wines with Different Chemical Composition. Molecules 2021, 26, 815. [Google Scholar] [CrossRef] [PubMed]
- Marrufo-Curtido, A.; Ferreira, V.; Escudero, A. Factors That Affect the Accumulation of Strecker Aldehydes in Standardized Wines: The Importance of pH in Oxidation. Molecules 2022, 27, 3056. [Google Scholar] [CrossRef] [PubMed]
- Aleixandre-Tudo, J. l.; Lizama, V.; Álvarez, I.; Nieuwoudt, H.; García, M. j.; Aleixandre, J. l.; du Toit, W. j. Effect of Acetaldehyde Addition on the Phenolic Substances and Volatile Compounds of Red Tempranillo Wines. Aust. J. Grape Wine Res. 2016, 22, 205–214. [Google Scholar] [CrossRef]
- Gambuti, A.; Picariello, L.; Moio, L.; Waterhouse, A. Cabernet Sauvignon Aging Stability Altered by Micro-Oxygenation. Am. J. Enol. Vitic. 2019, 70, ajev.2019–18061. [Google Scholar] [CrossRef]
Figure 1.
Soluble solid (°Brix) of Aglianico and Cabernet Sauvignon grapes harvested in 2020 and 2021 vintages. Uppercase letters (A, B, C, D, E, F) indicate significant differences (p < 0.05) among all samples for each single year; lowercase letters (a, b) indicate significant differences (p < 0.05) among each single sample in two years.
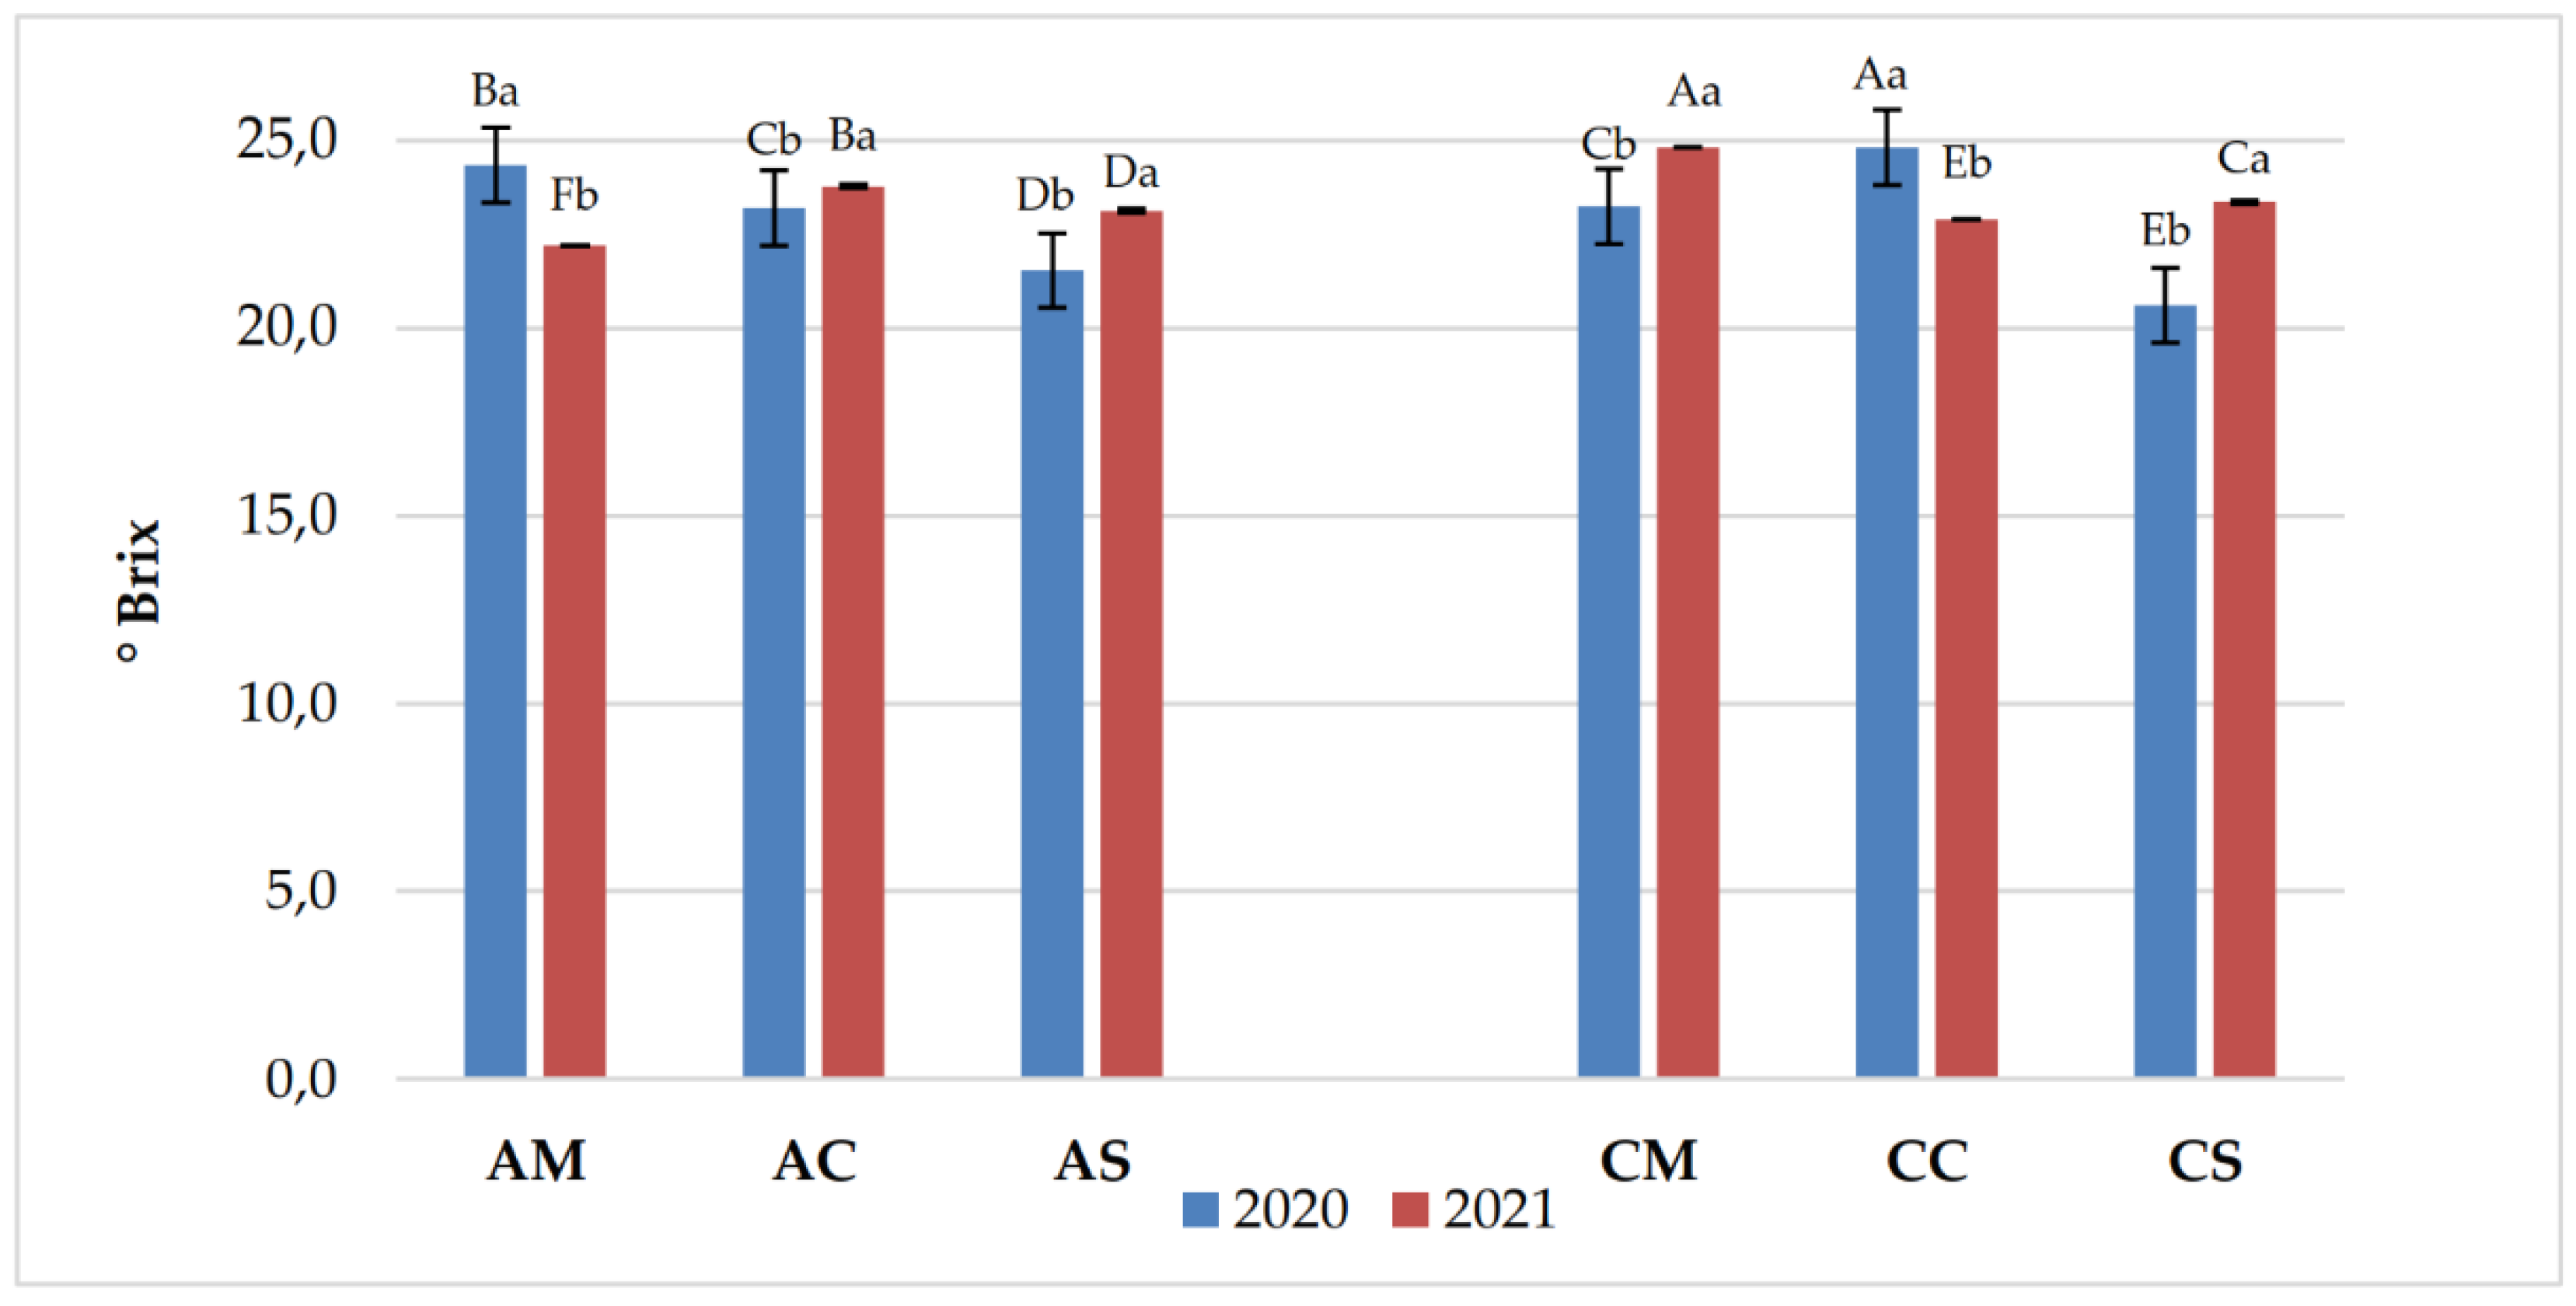
Figure 2.
Titratable acidity (g/L) of Aglianico and Cabernet Sauvignon grapes harvested in 2020 and 2021 vintages. Uppercase letters (A, B, C, D, E, F) indicate significant differences (p < 0.05) among all samples for each single year; lowercase letters (a, b) indicate significant differences (p < 0.05) among each single sample in two years.
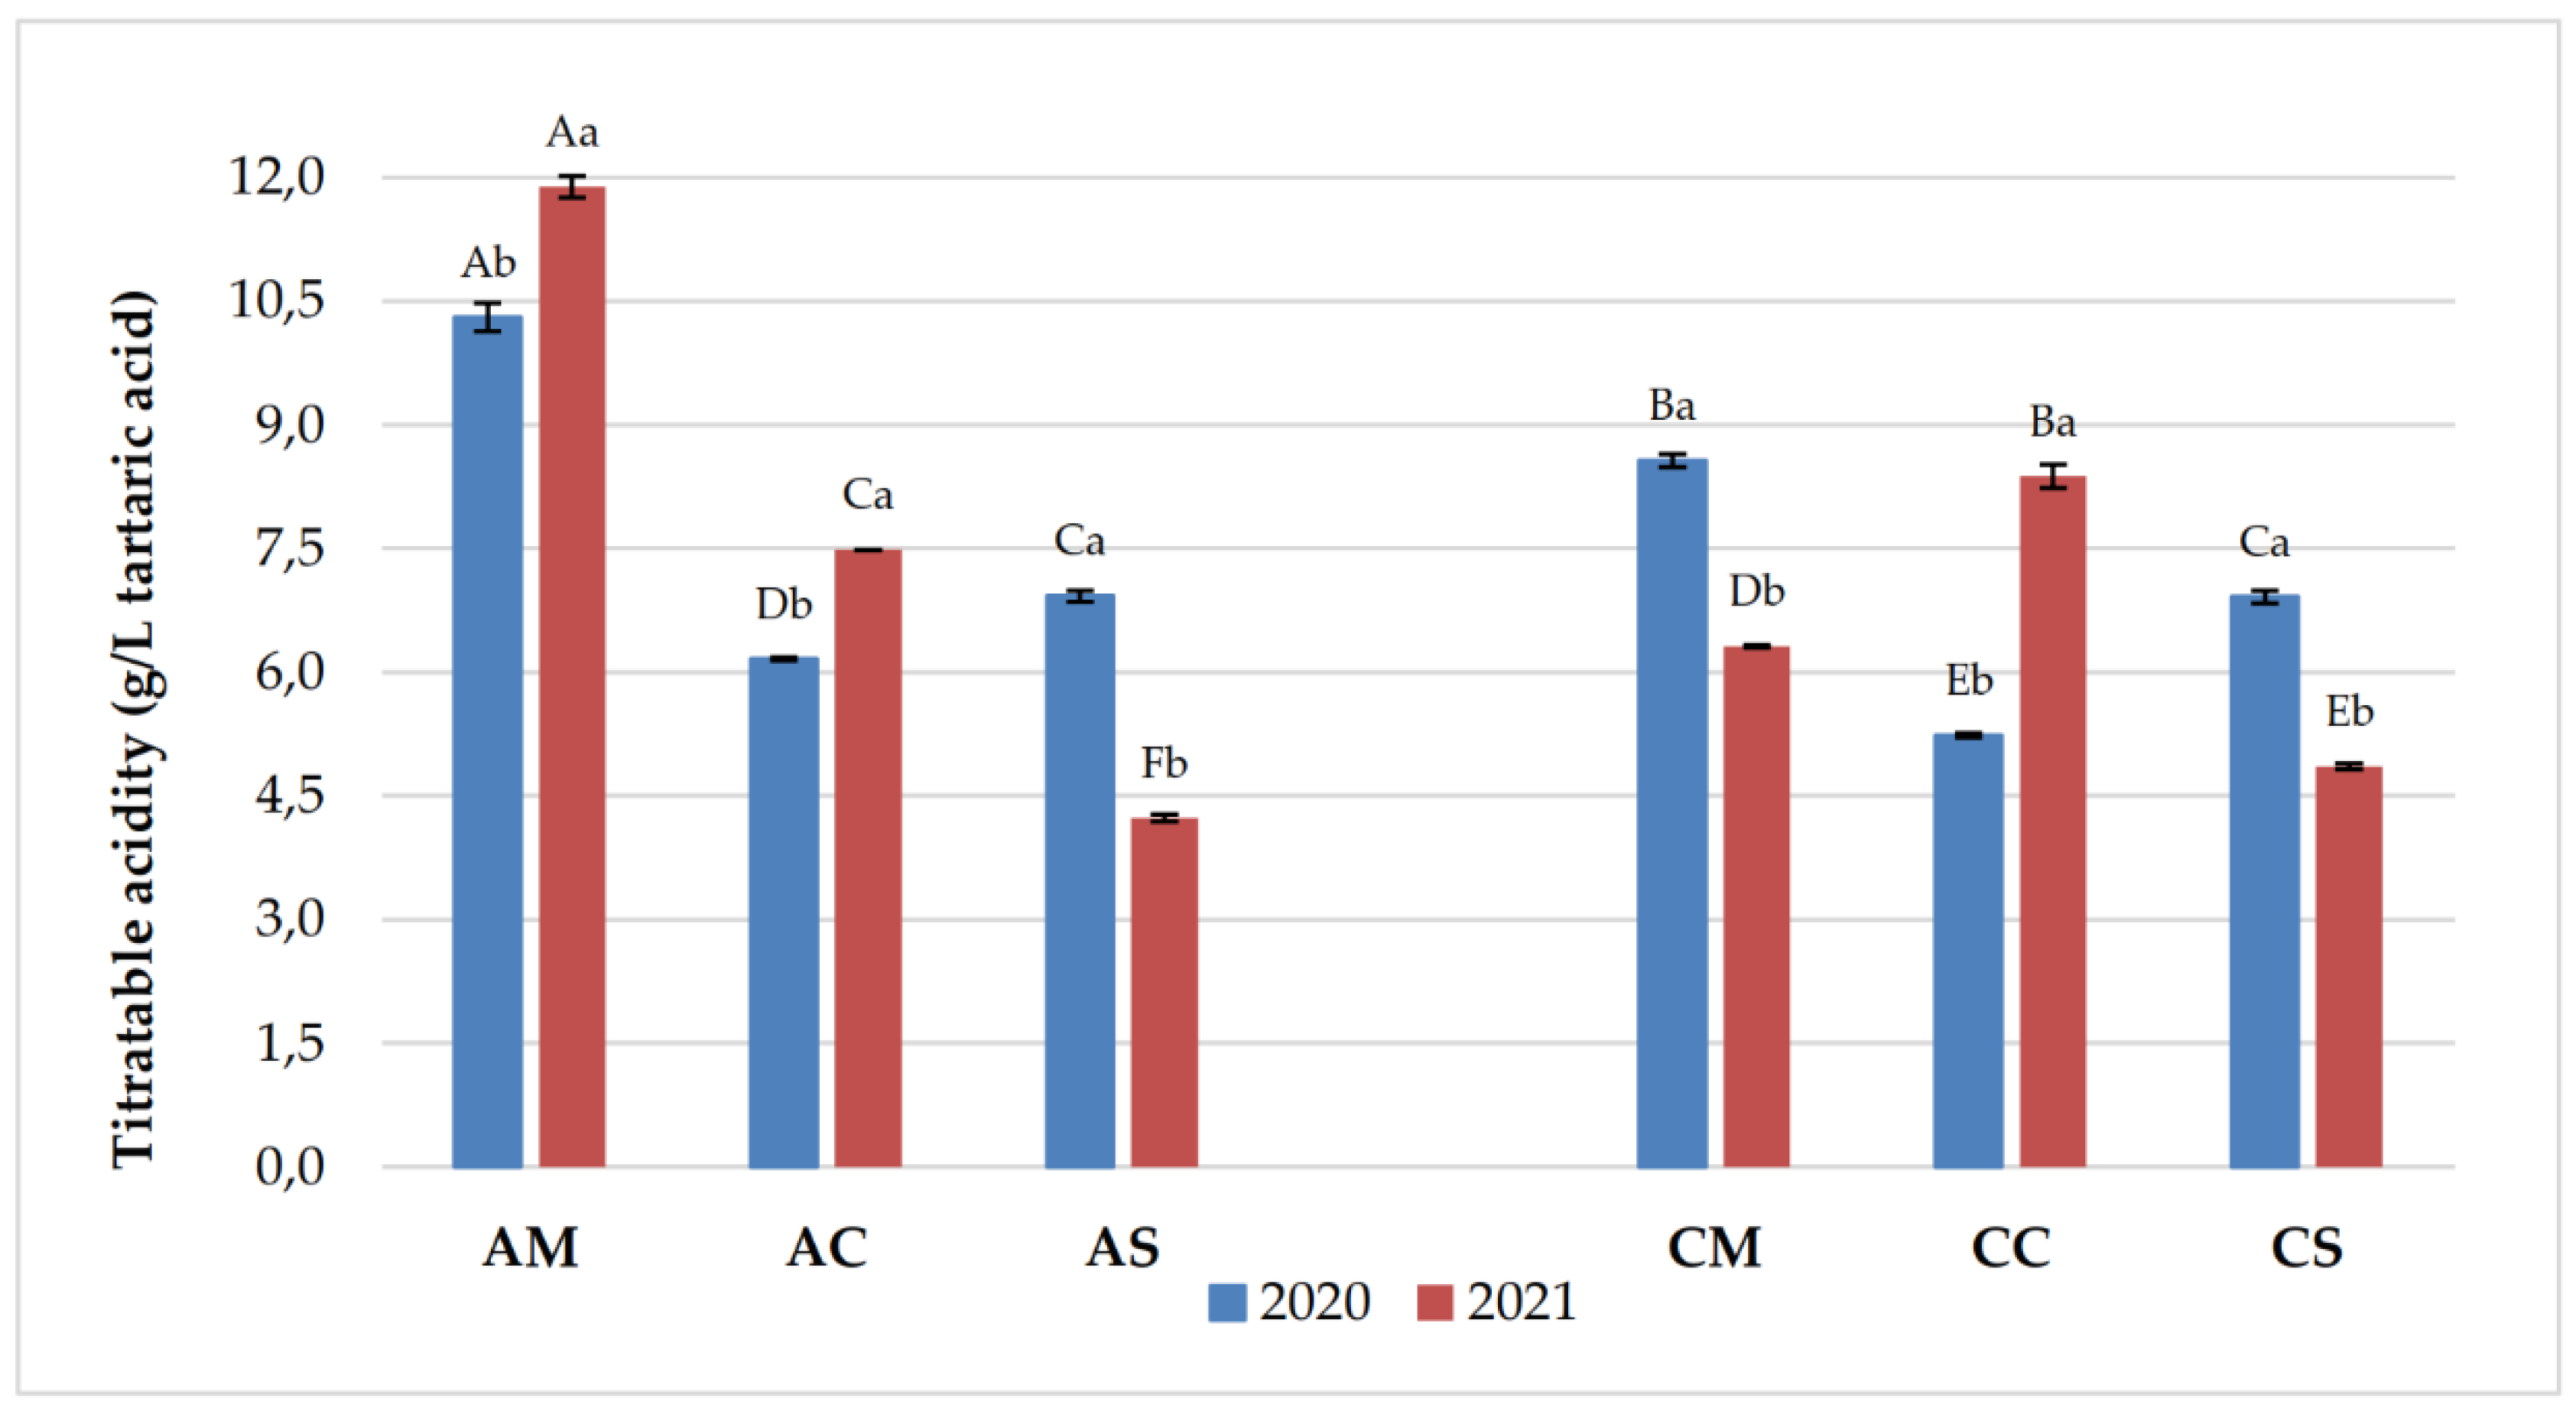
Figure 3.
Technological maturity index (soluble solids/titratable acidity ratio) of Aglianico and Cabernet Sauvignon grapes harvested in 2020 and 2021 vintages. Uppercase letters (A, B, C, D, E, F) indicate significant differences (p < 0.05) among all samples for each single year; lowercase letters (a, b) indicate significant differences (p < 0.05) among each single sample in two years.
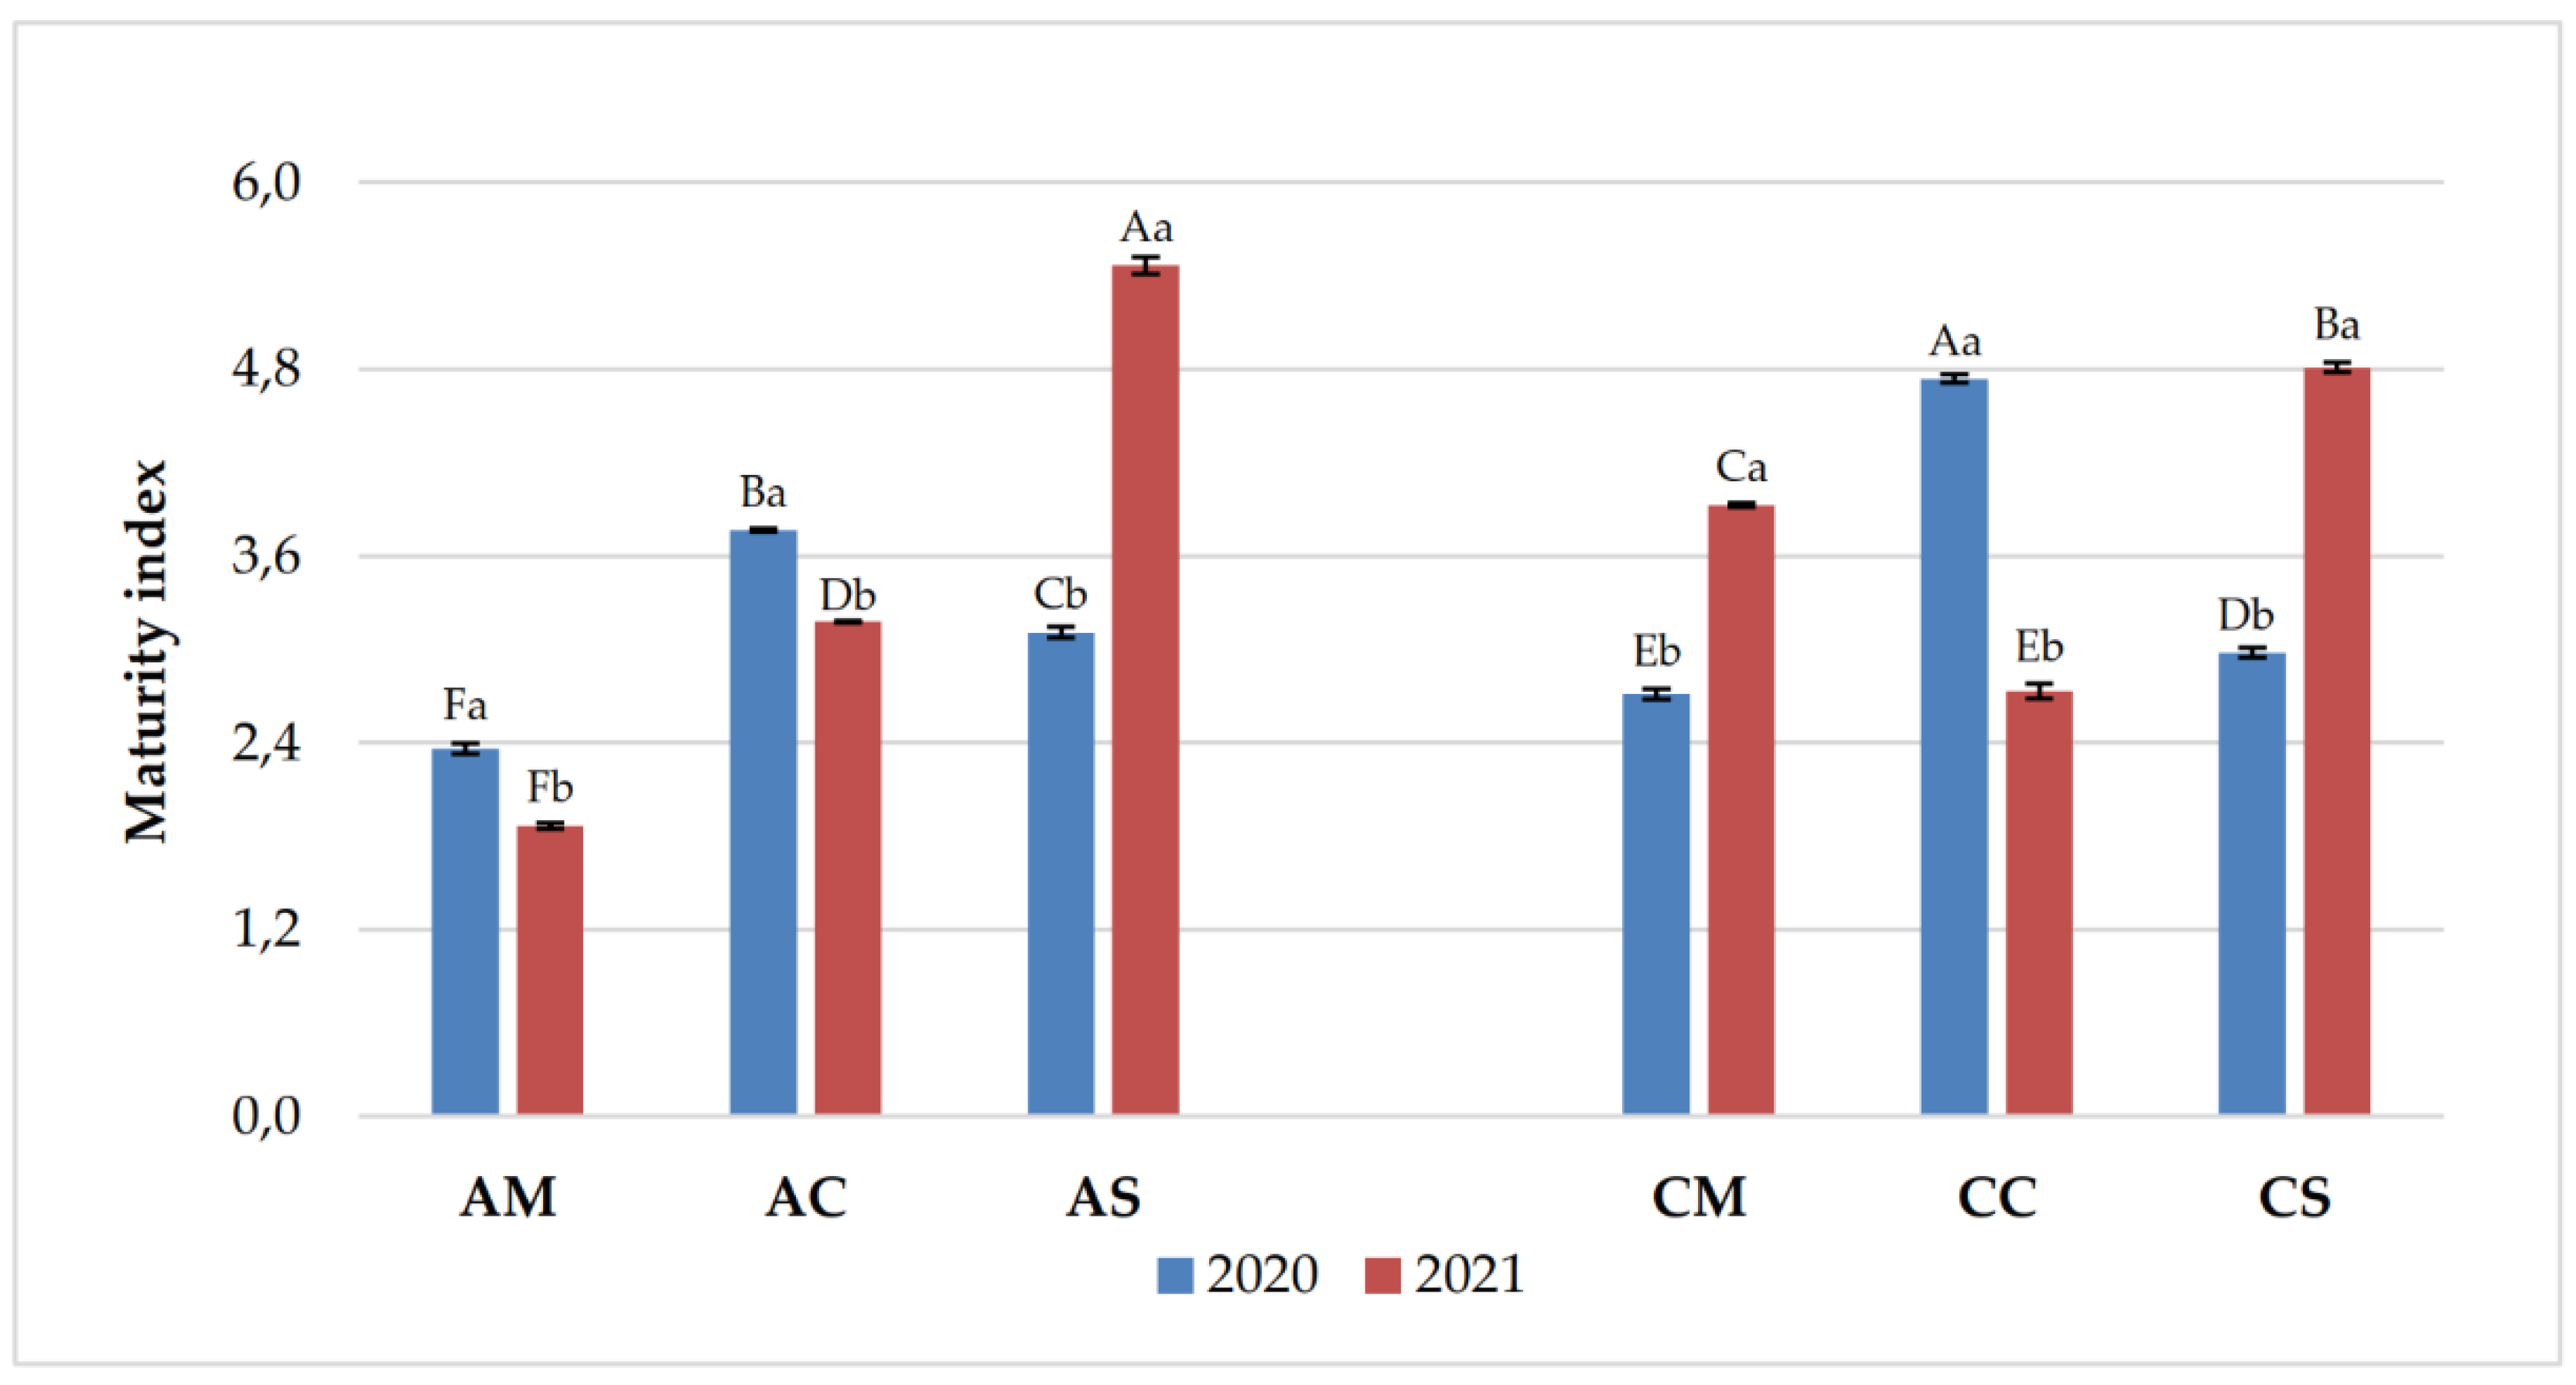
Figure 4.
pH values of Aglianico and Cabernet Sauvignon grapes harvested in 2020 and 2021 vintages. Uppercase letters (A, B, C, D, E) indicate significant differences (p < 0.05) among all samples for each single year; lowercase letters (a, b) indicate significant differences (p < 0.05) among each single sample in two years.
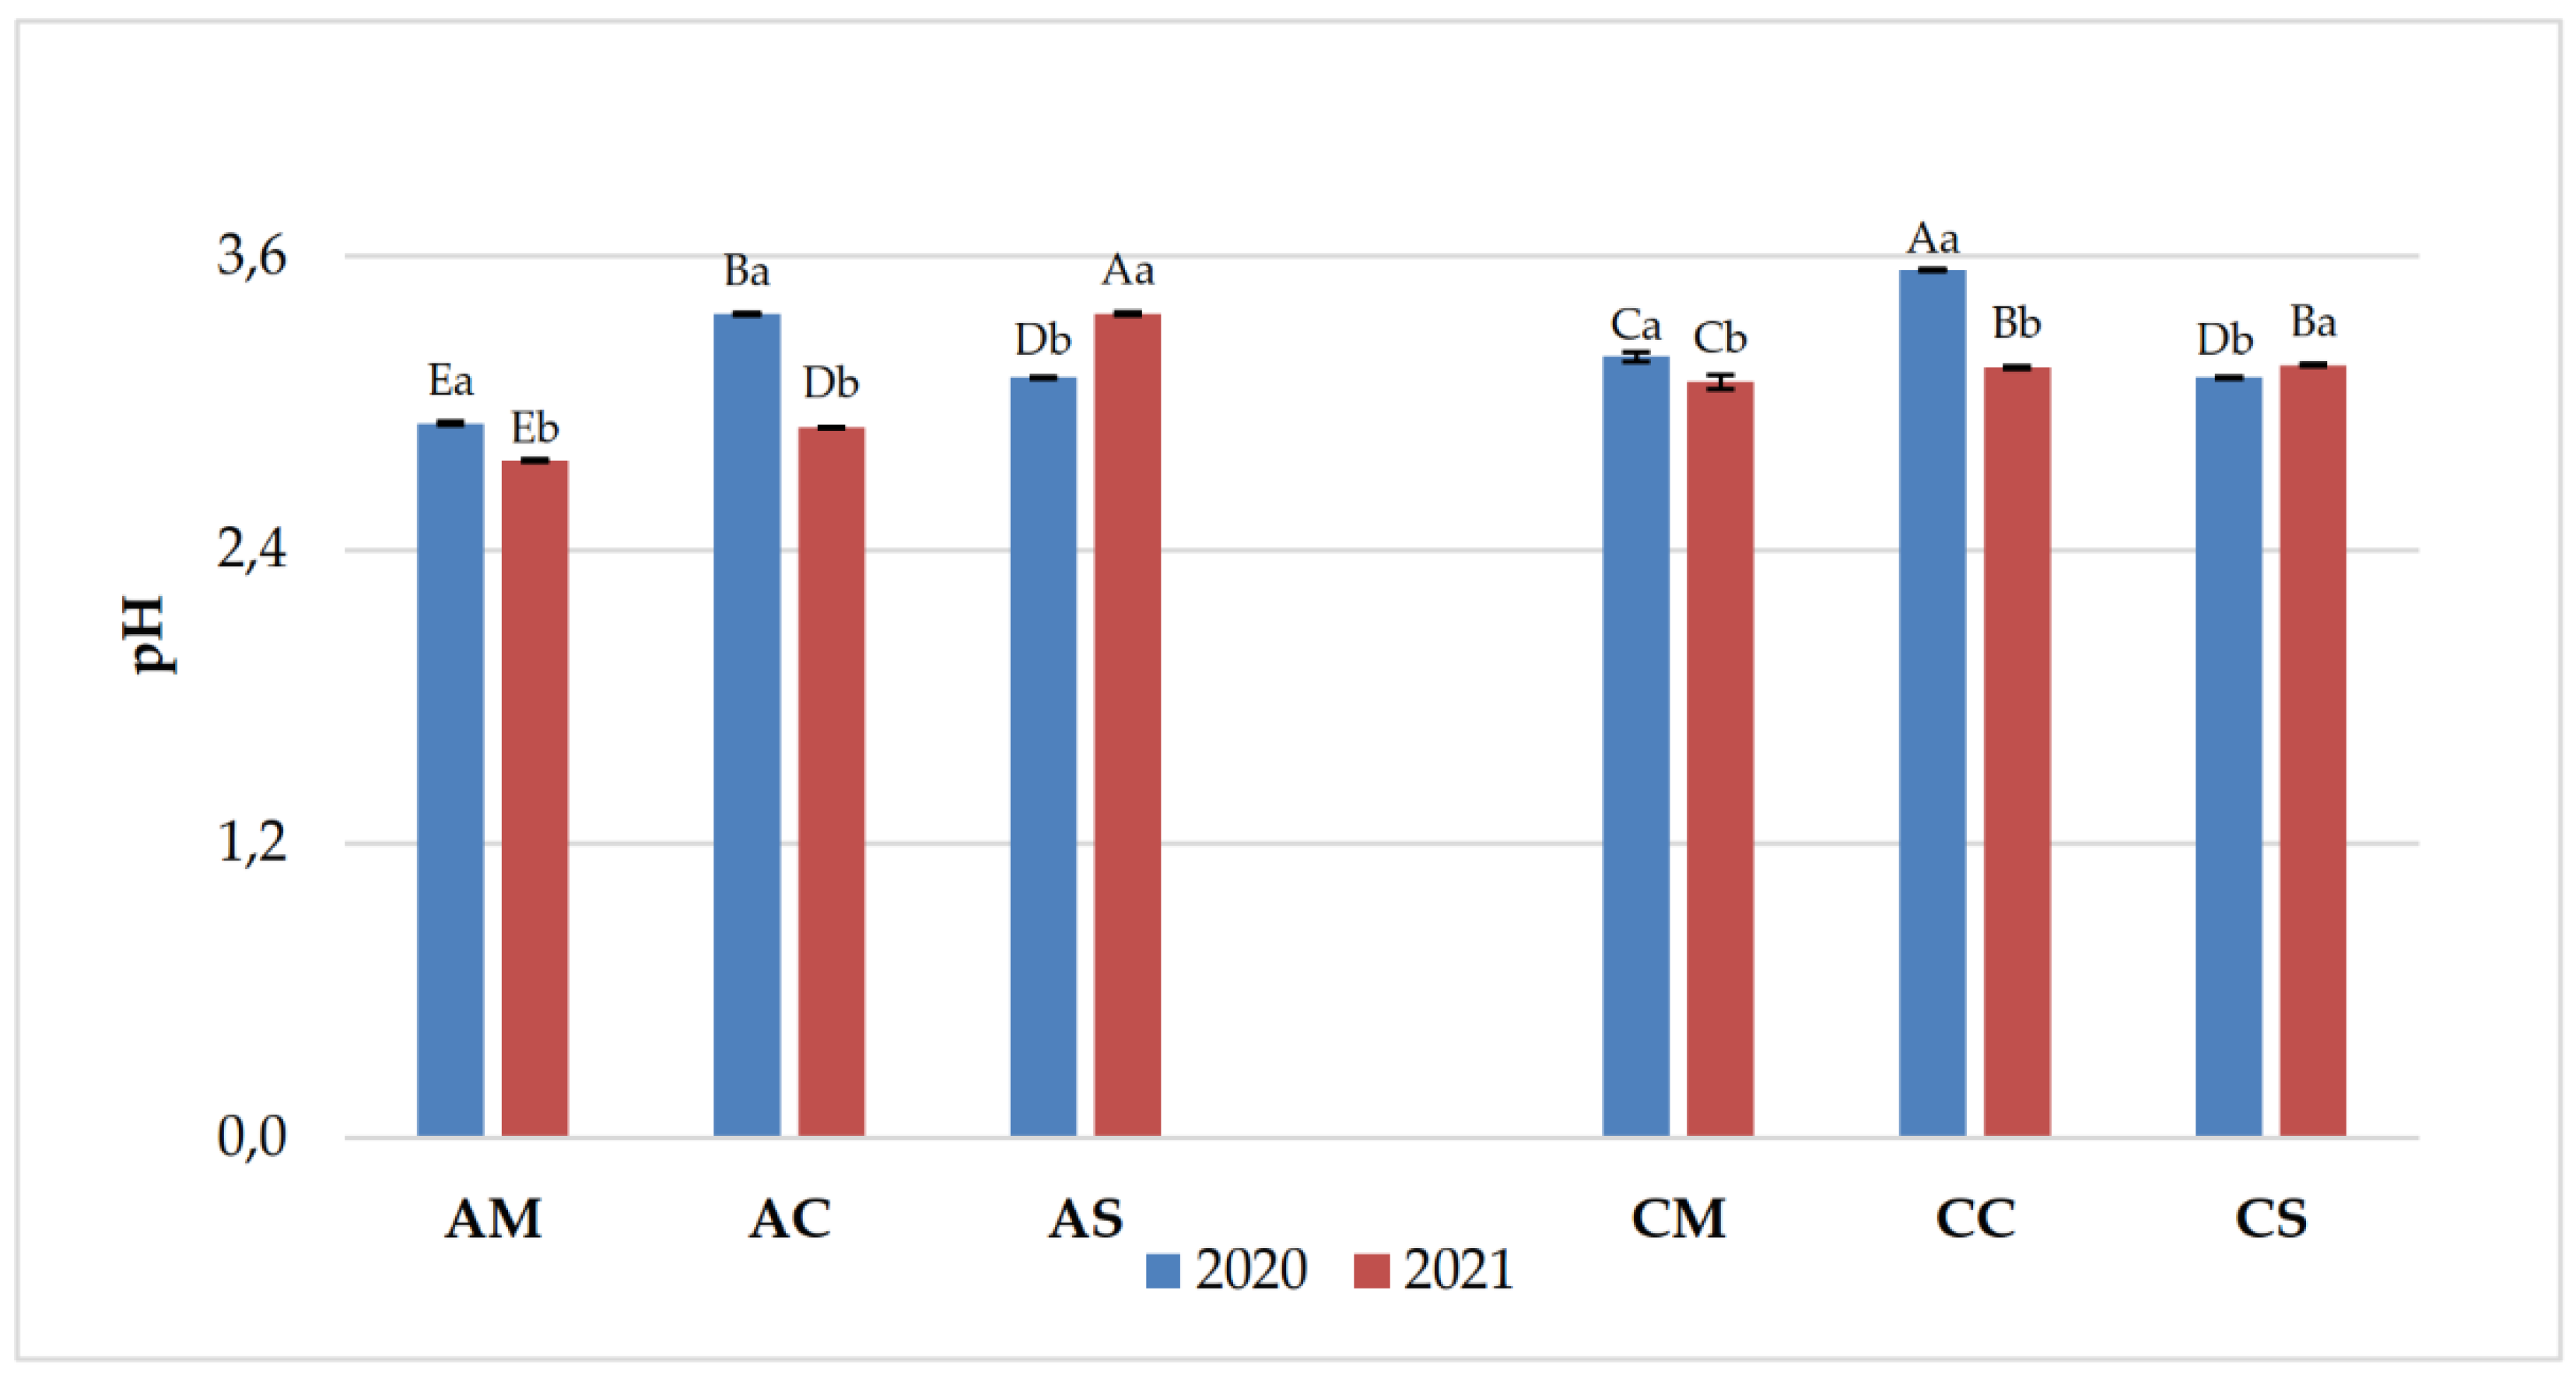
Figure 5.
Total flavanols (mg/Kg) in grape skin and seeds of Aglianico and Cabernet Sauvignon in 2020 and 2021 vintages. Uppercase letters (A, B, C, D) indicate significant differences (p < 0.05) among all samples for each single year; lowercase letters (a, b) indicate significant differences (p < 0.05) among each single sample in two years.
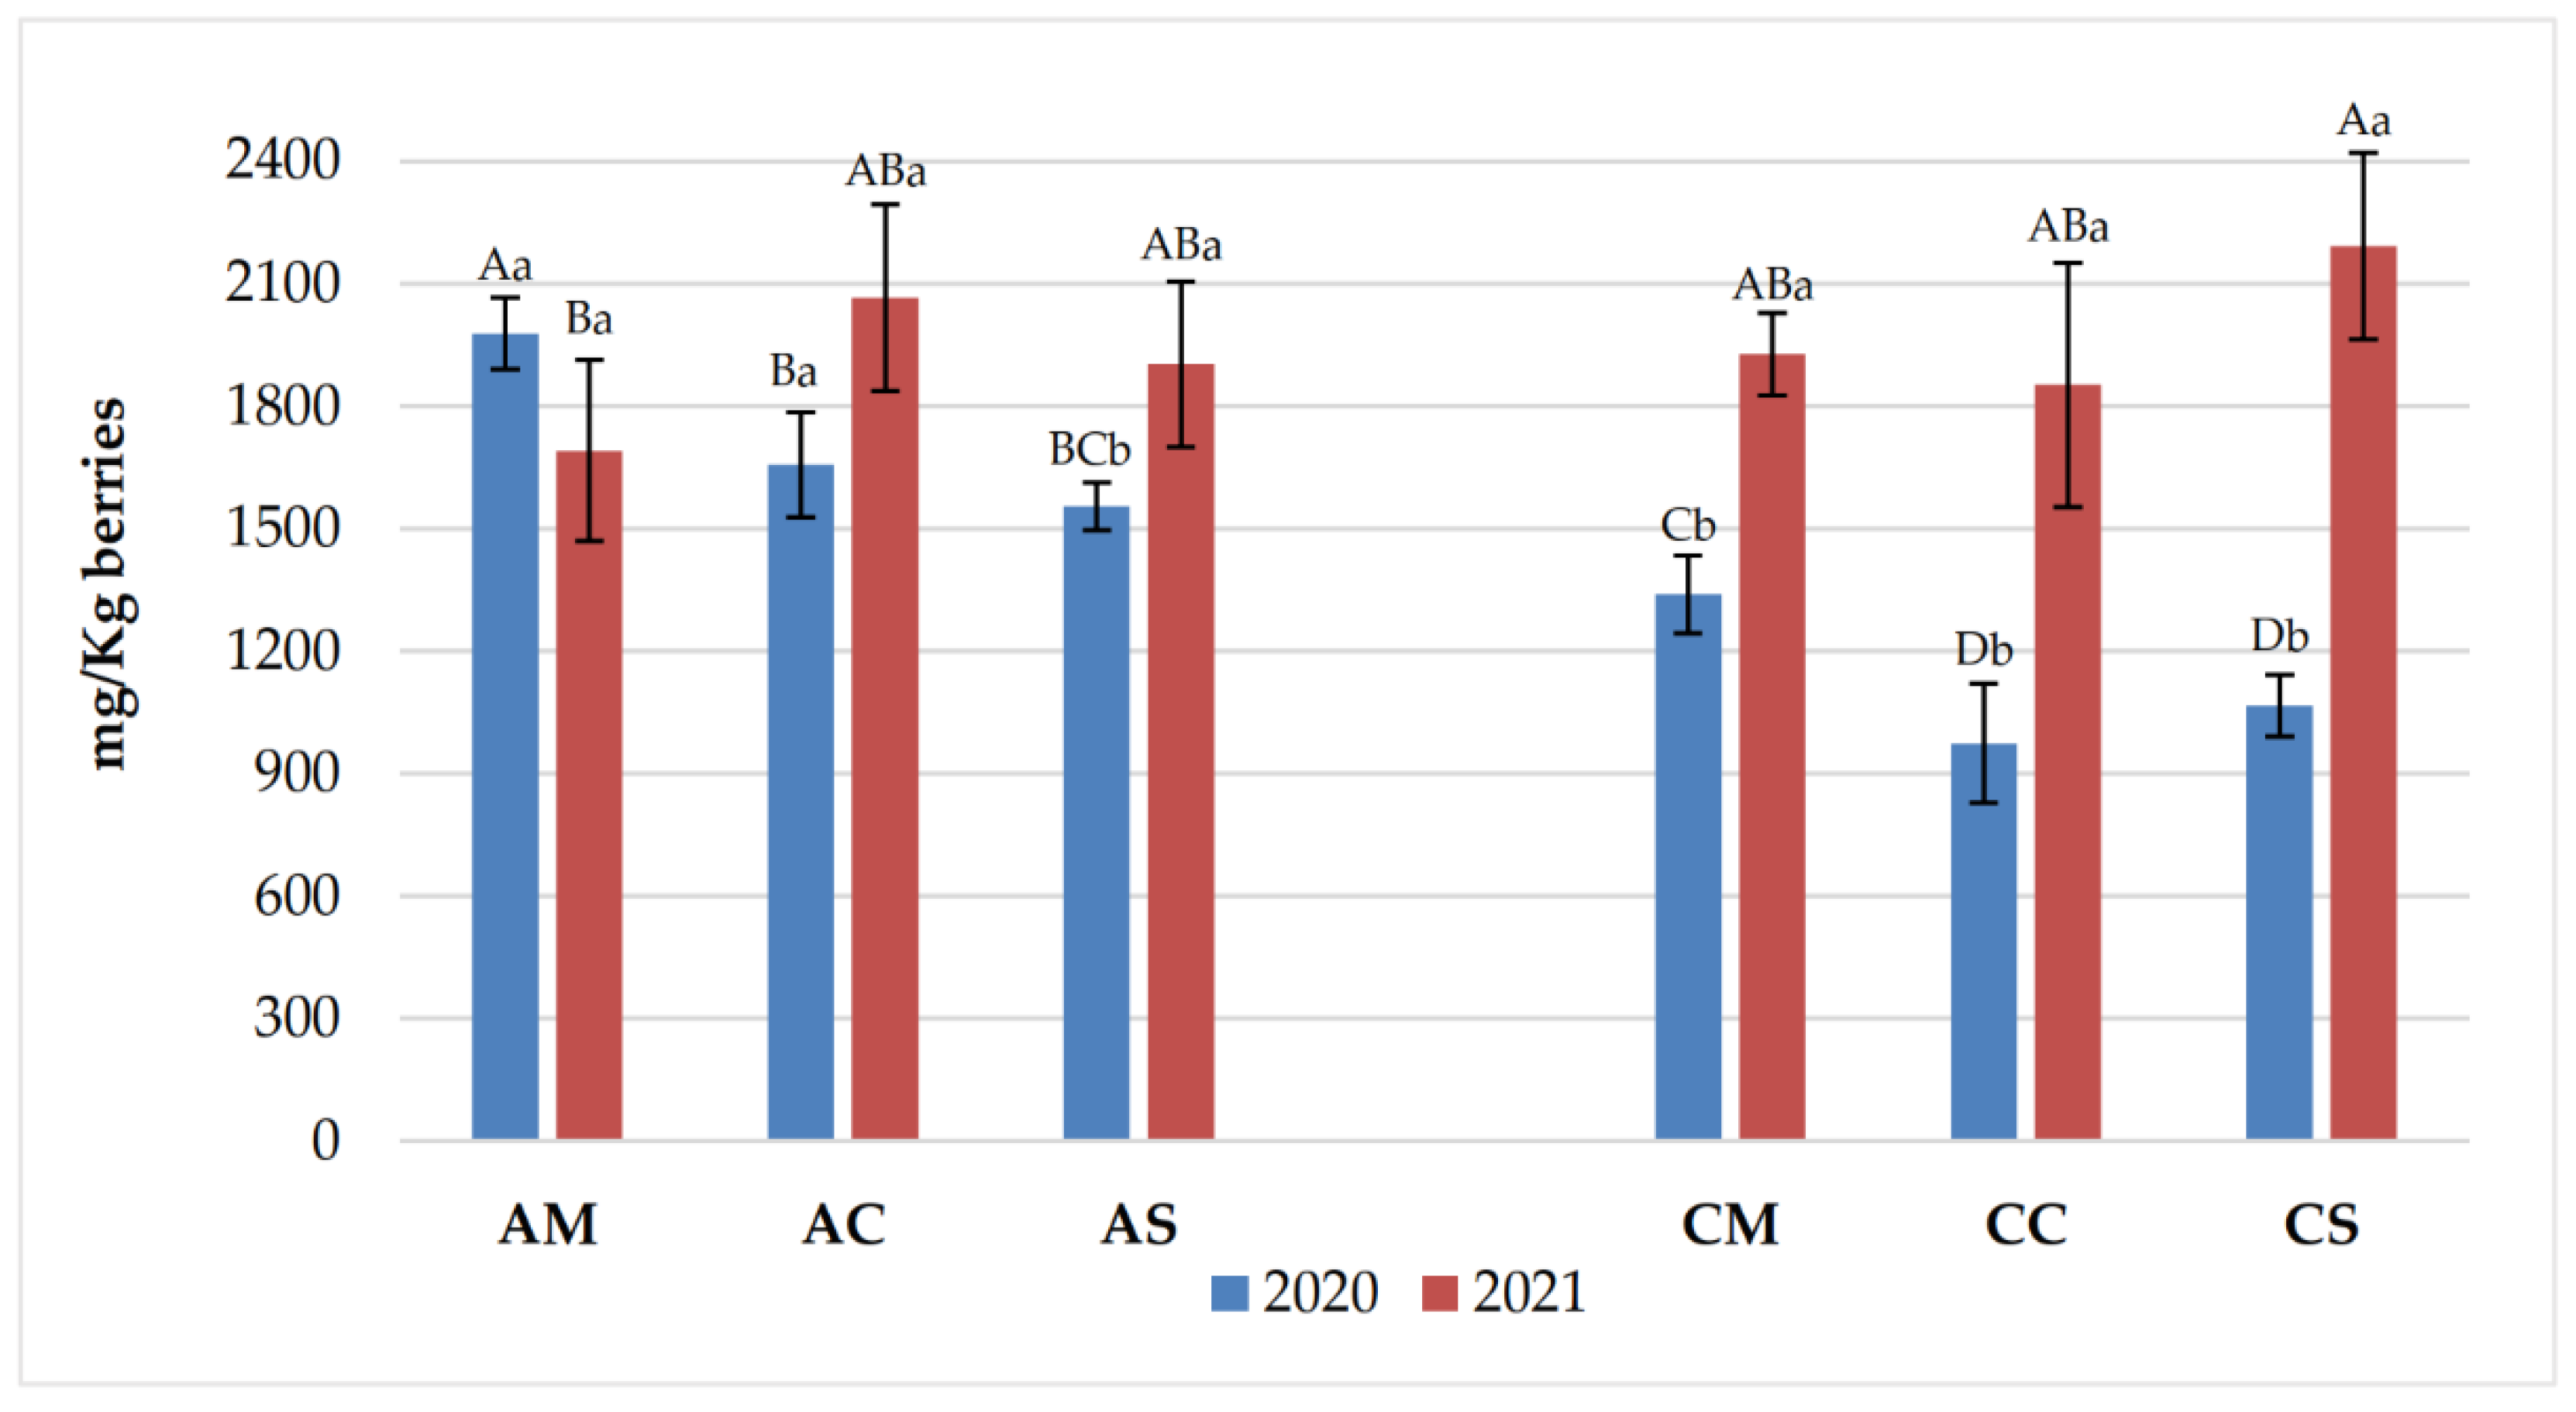
Figure 6.
Total flavanols (mg/L) of Aglianico and Cabernet Sauvignon wines produced in 2020 and 2021 vintages. Uppercase letters (A, B, C, D) indicate significant differences (p < 0.05) among all samples for each single year; lowercase letters (a, b) indicate significant differences (p < 0.05) among each single sample in two years.
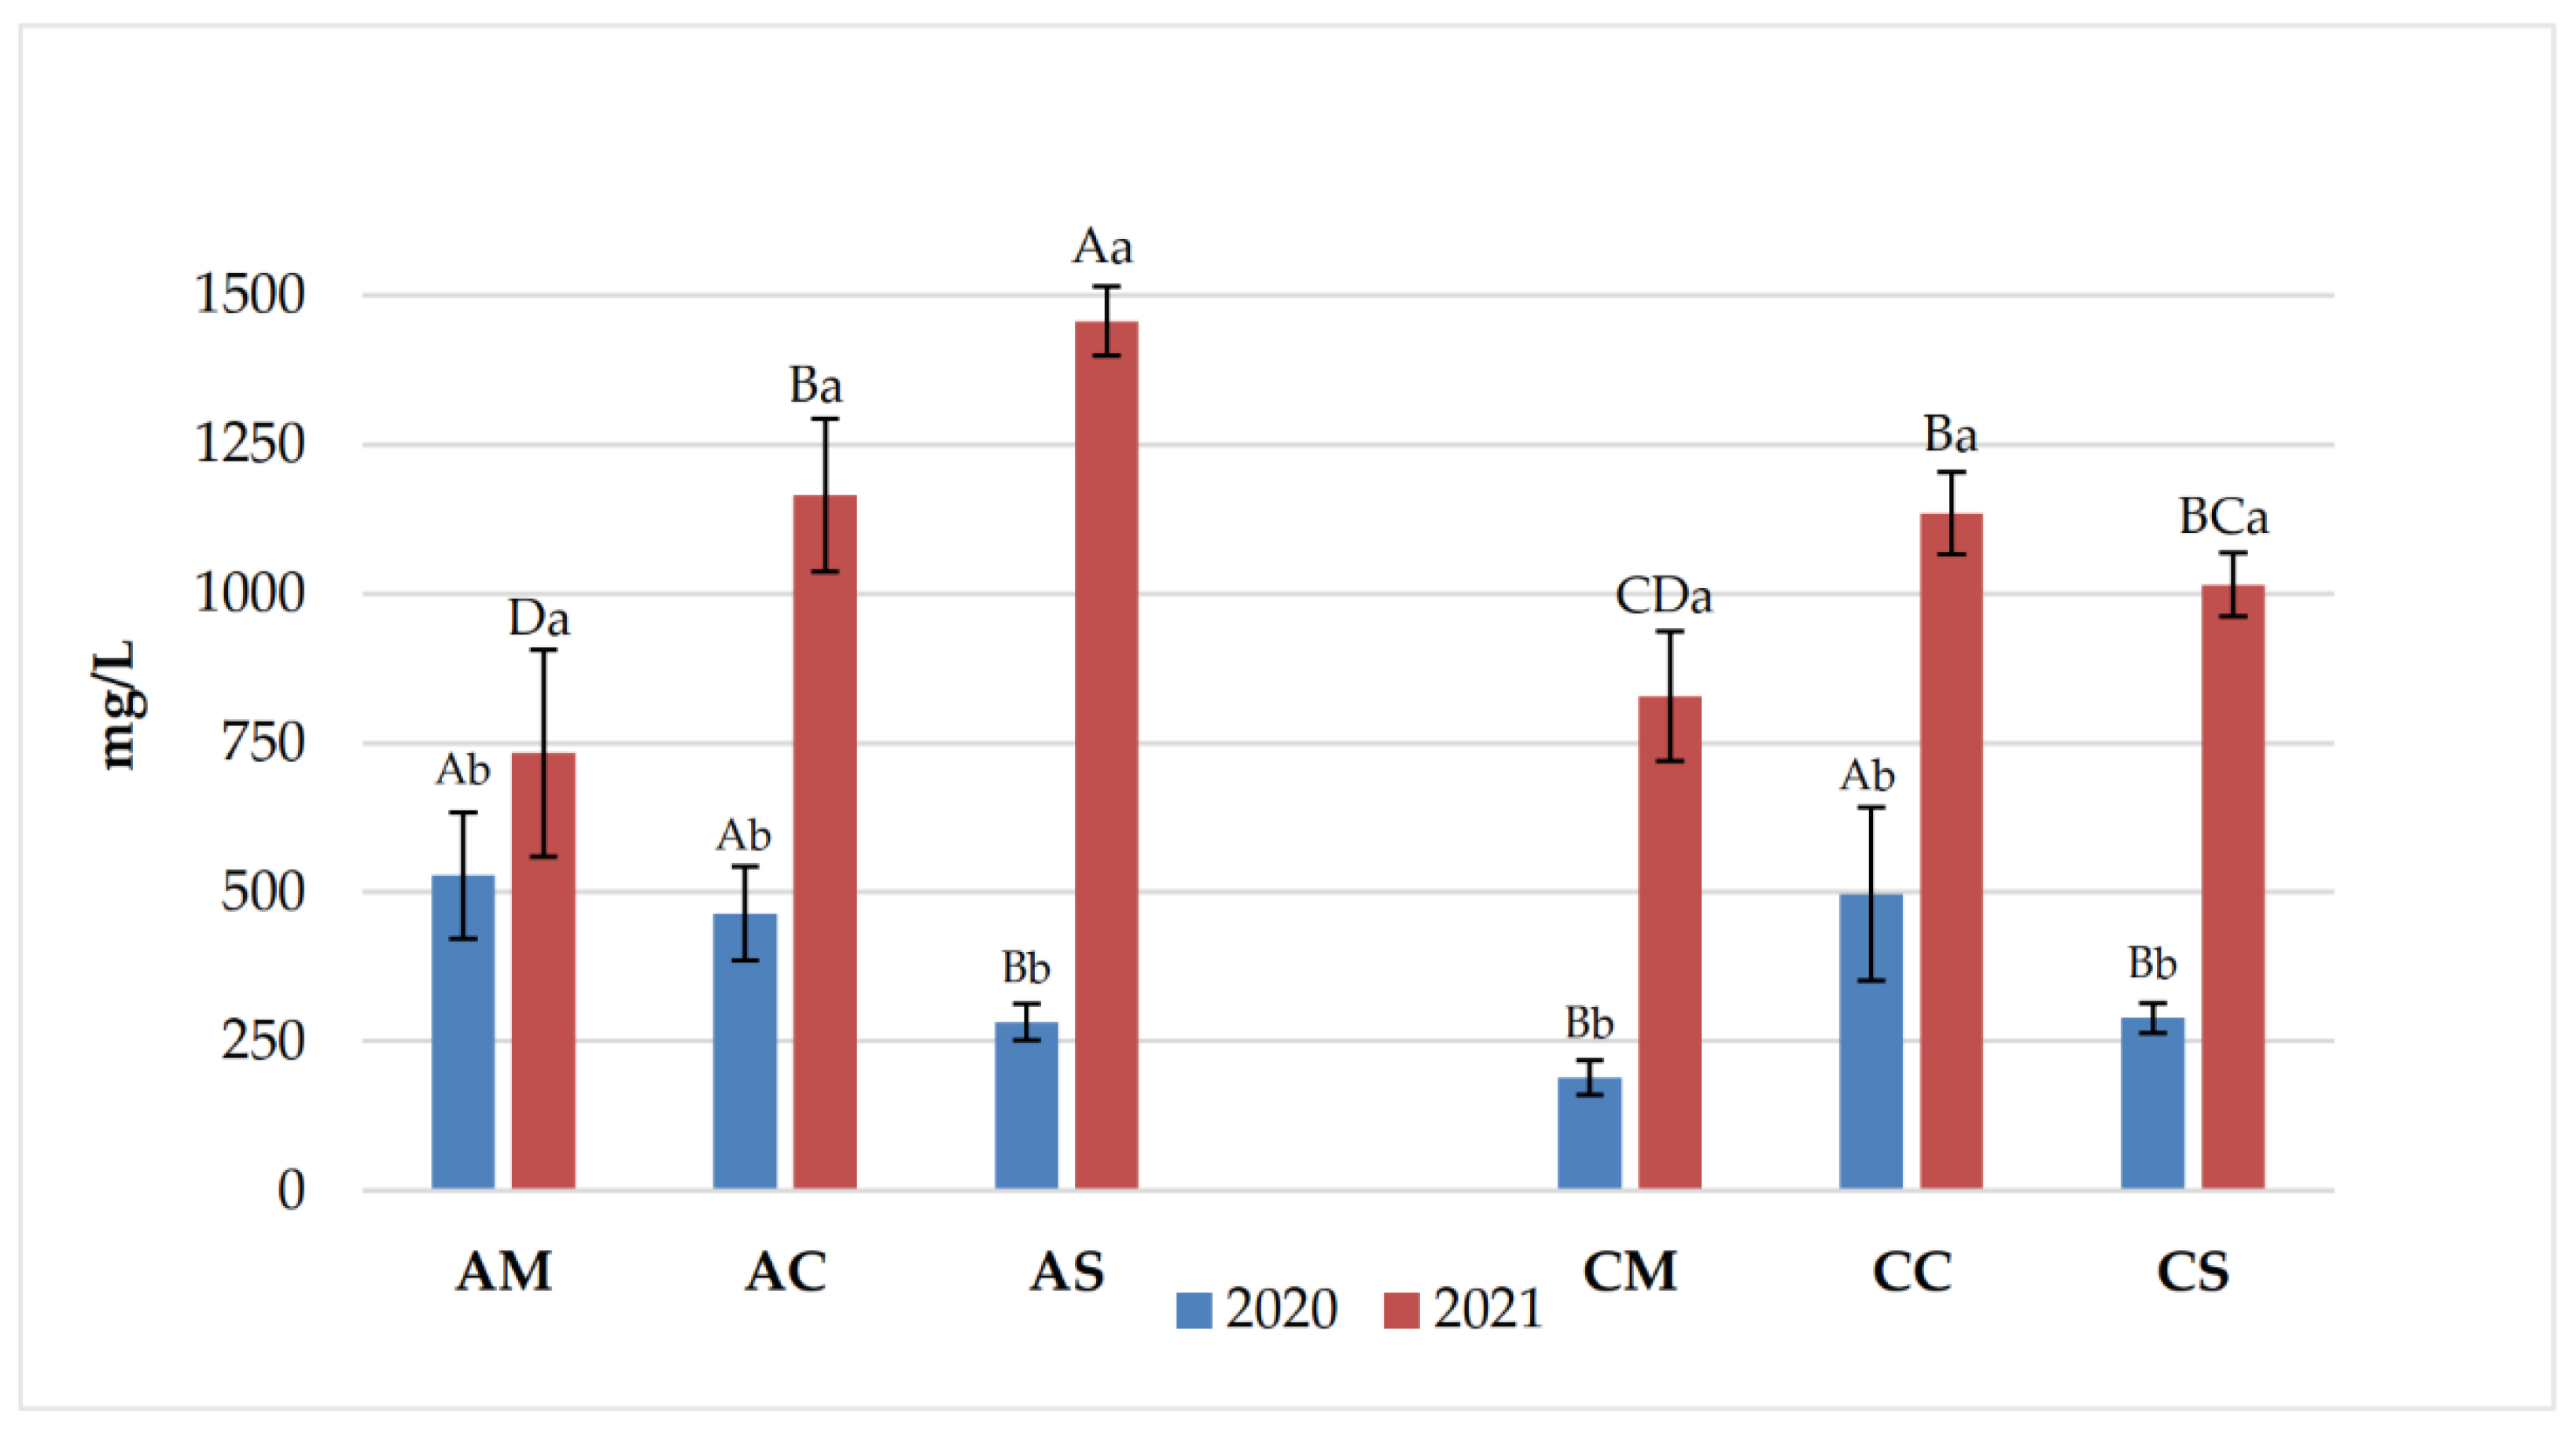
Figure 7.
Total monomeric anthocyanins (mg/Kg) of Aglianico and Cabernet Sauvignon grapes in 2020 and 2021 vintages. Uppercase letters (A, B, C, D) indicate significant differences (p < 0.05) among all samples for each single year; lowercase letters (a, b) indicate significant differences (p < 0.05) among each single sample in two years.
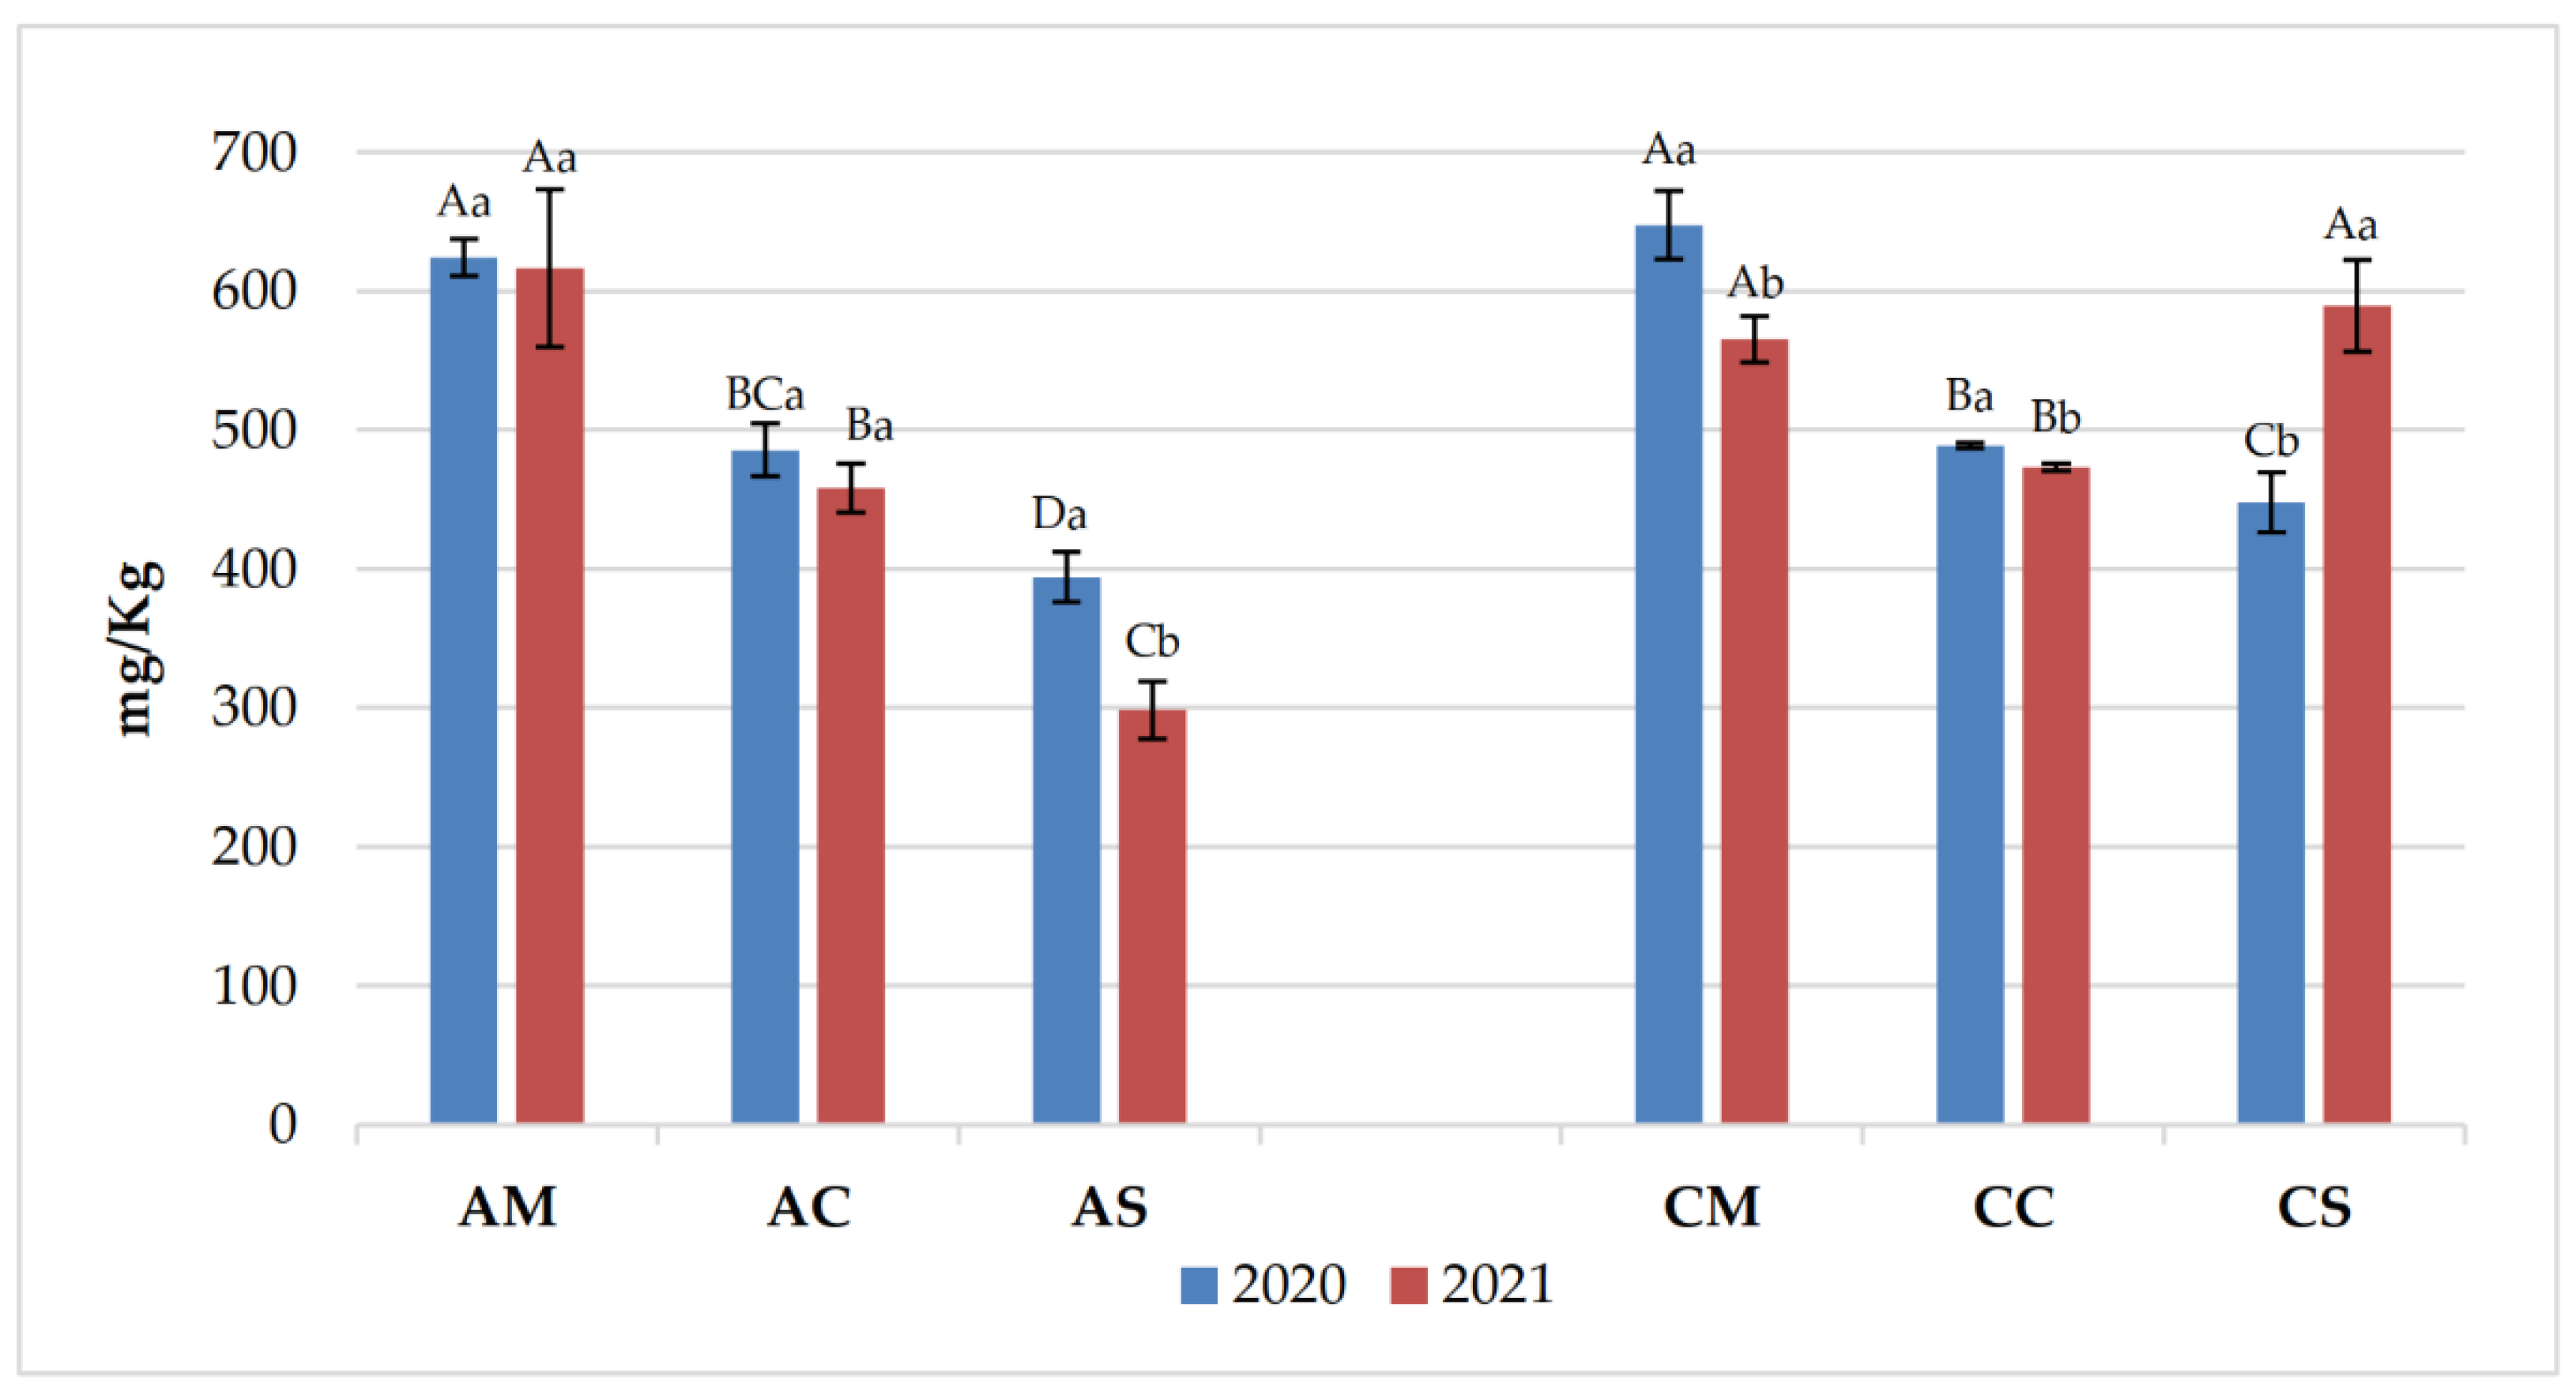
Figure 8.
Total monomeric anthocyanins (mg/L) of Aglianico and Cabernet Sauvignon wines produced in 2020 and 2021 vintages. Uppercase letters (A, B, C, D, E) indicate significant differences (p < 0.05) among all samples for each single year; lowercase letters (a, b) indicate significant differences (p < 0.05) among each single sample in two years.
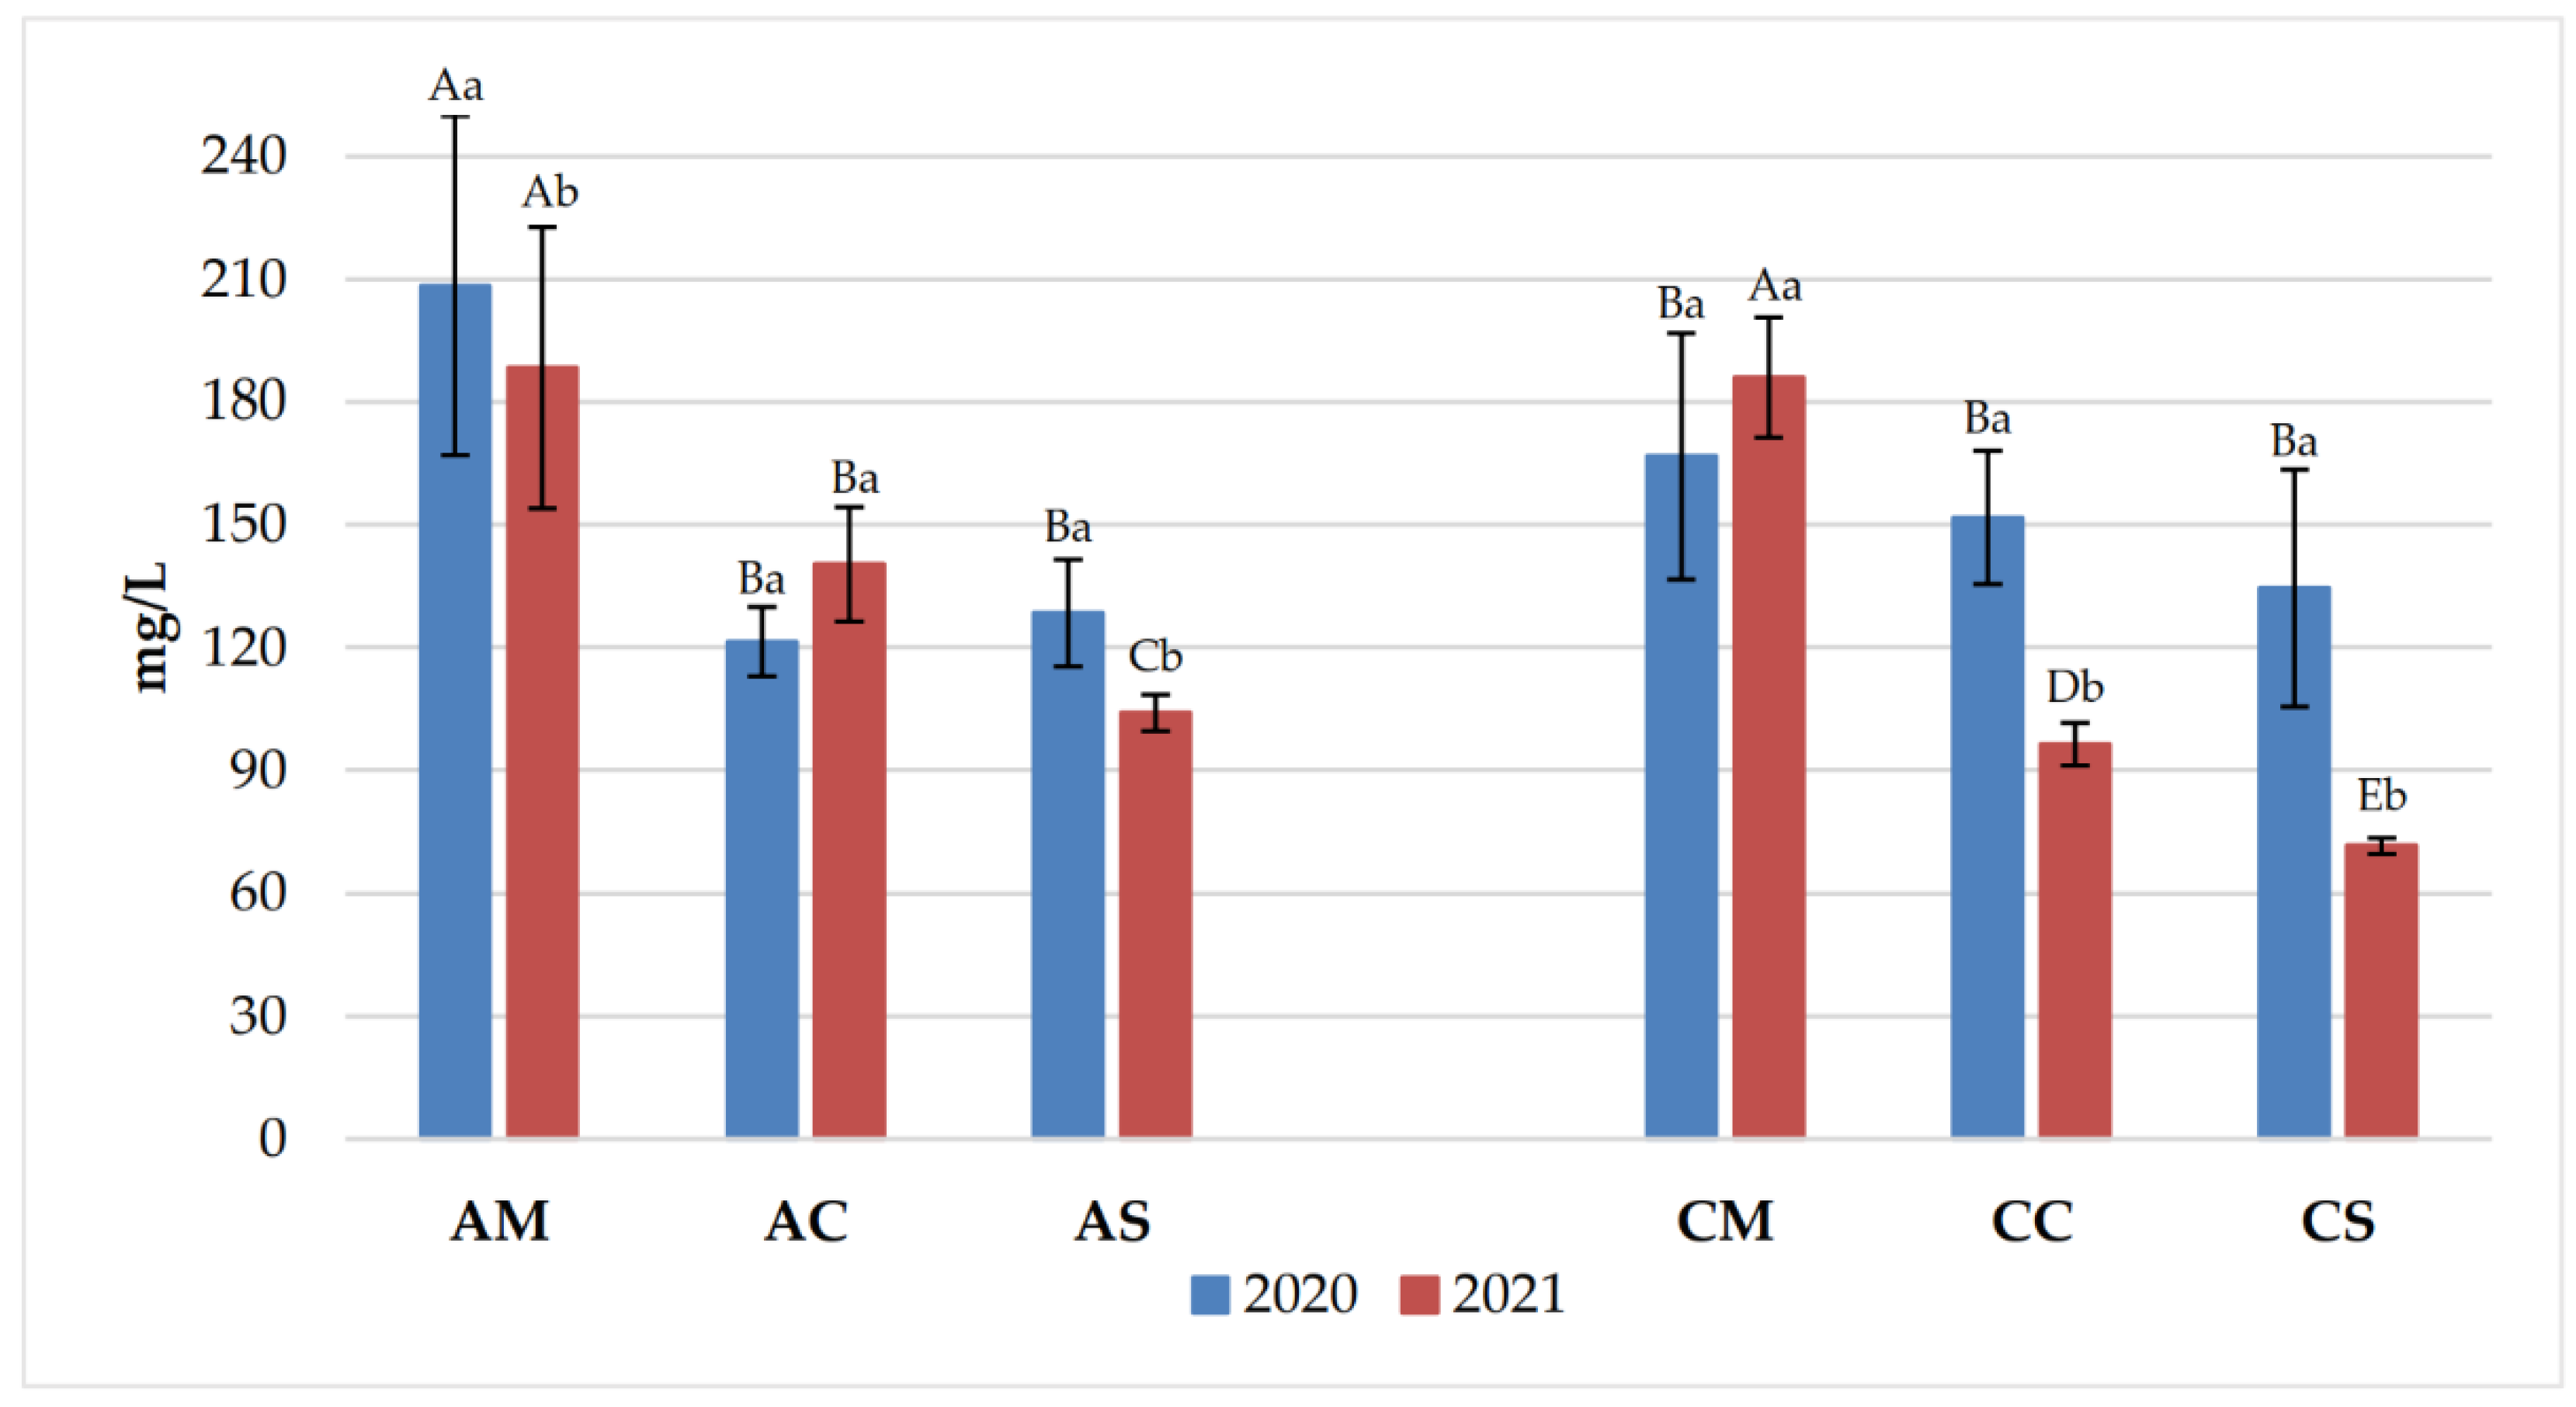
Figure 9.
Total polymeric pigments (mg/L) of Aglianico and Cabernet Sauvignon wines produced in 2020 and 2021 vintages. Uppercase letters (A, B, C, D, E) indicate significant differences (p < 0.05) among all samples for each single year; lowercase letters (a, b) indicate significant differences (p < 0.05) among each single sample in two years.
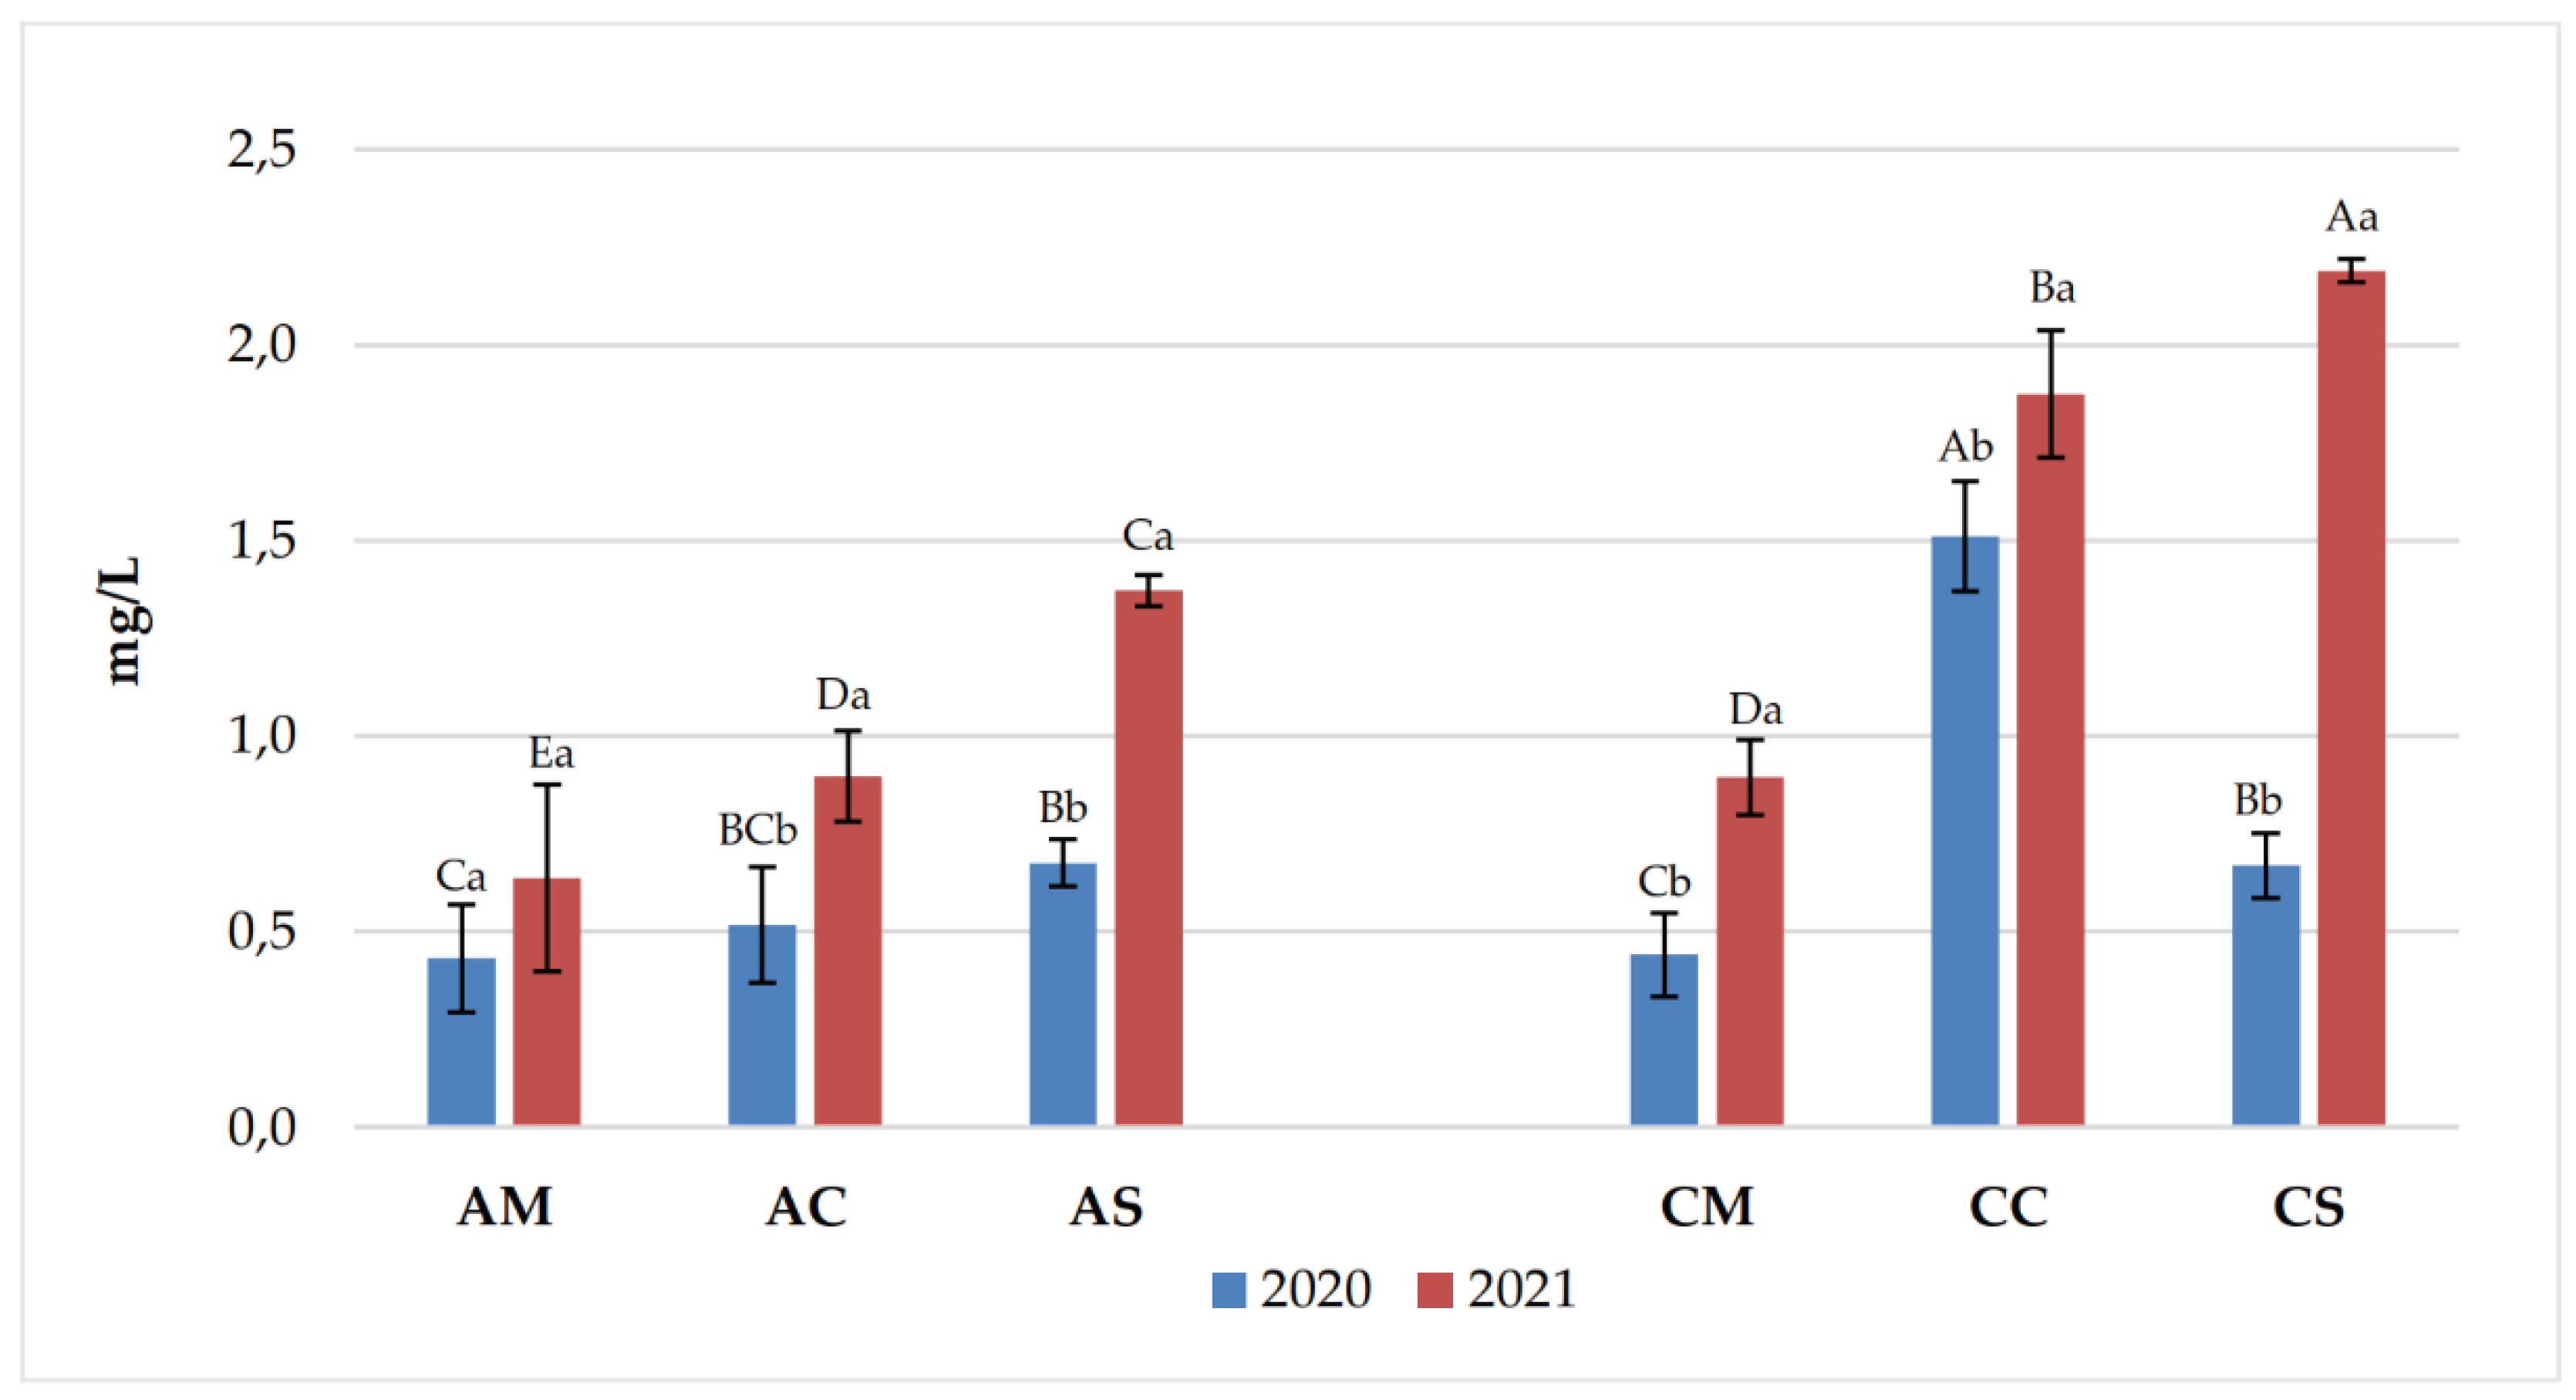
Figure 10.
Acetaldehyde content (mg/L) of Aglianico and Cabernet Sauvignon wines produced in 2020 and 2021 vintages. Uppercase letters (A, B, C,) indicate significant differences (p < 0.05) among all samples for each single year; lowercase letters (a, b) indicate significant differences (p < 0.05) among each single sample in two years.
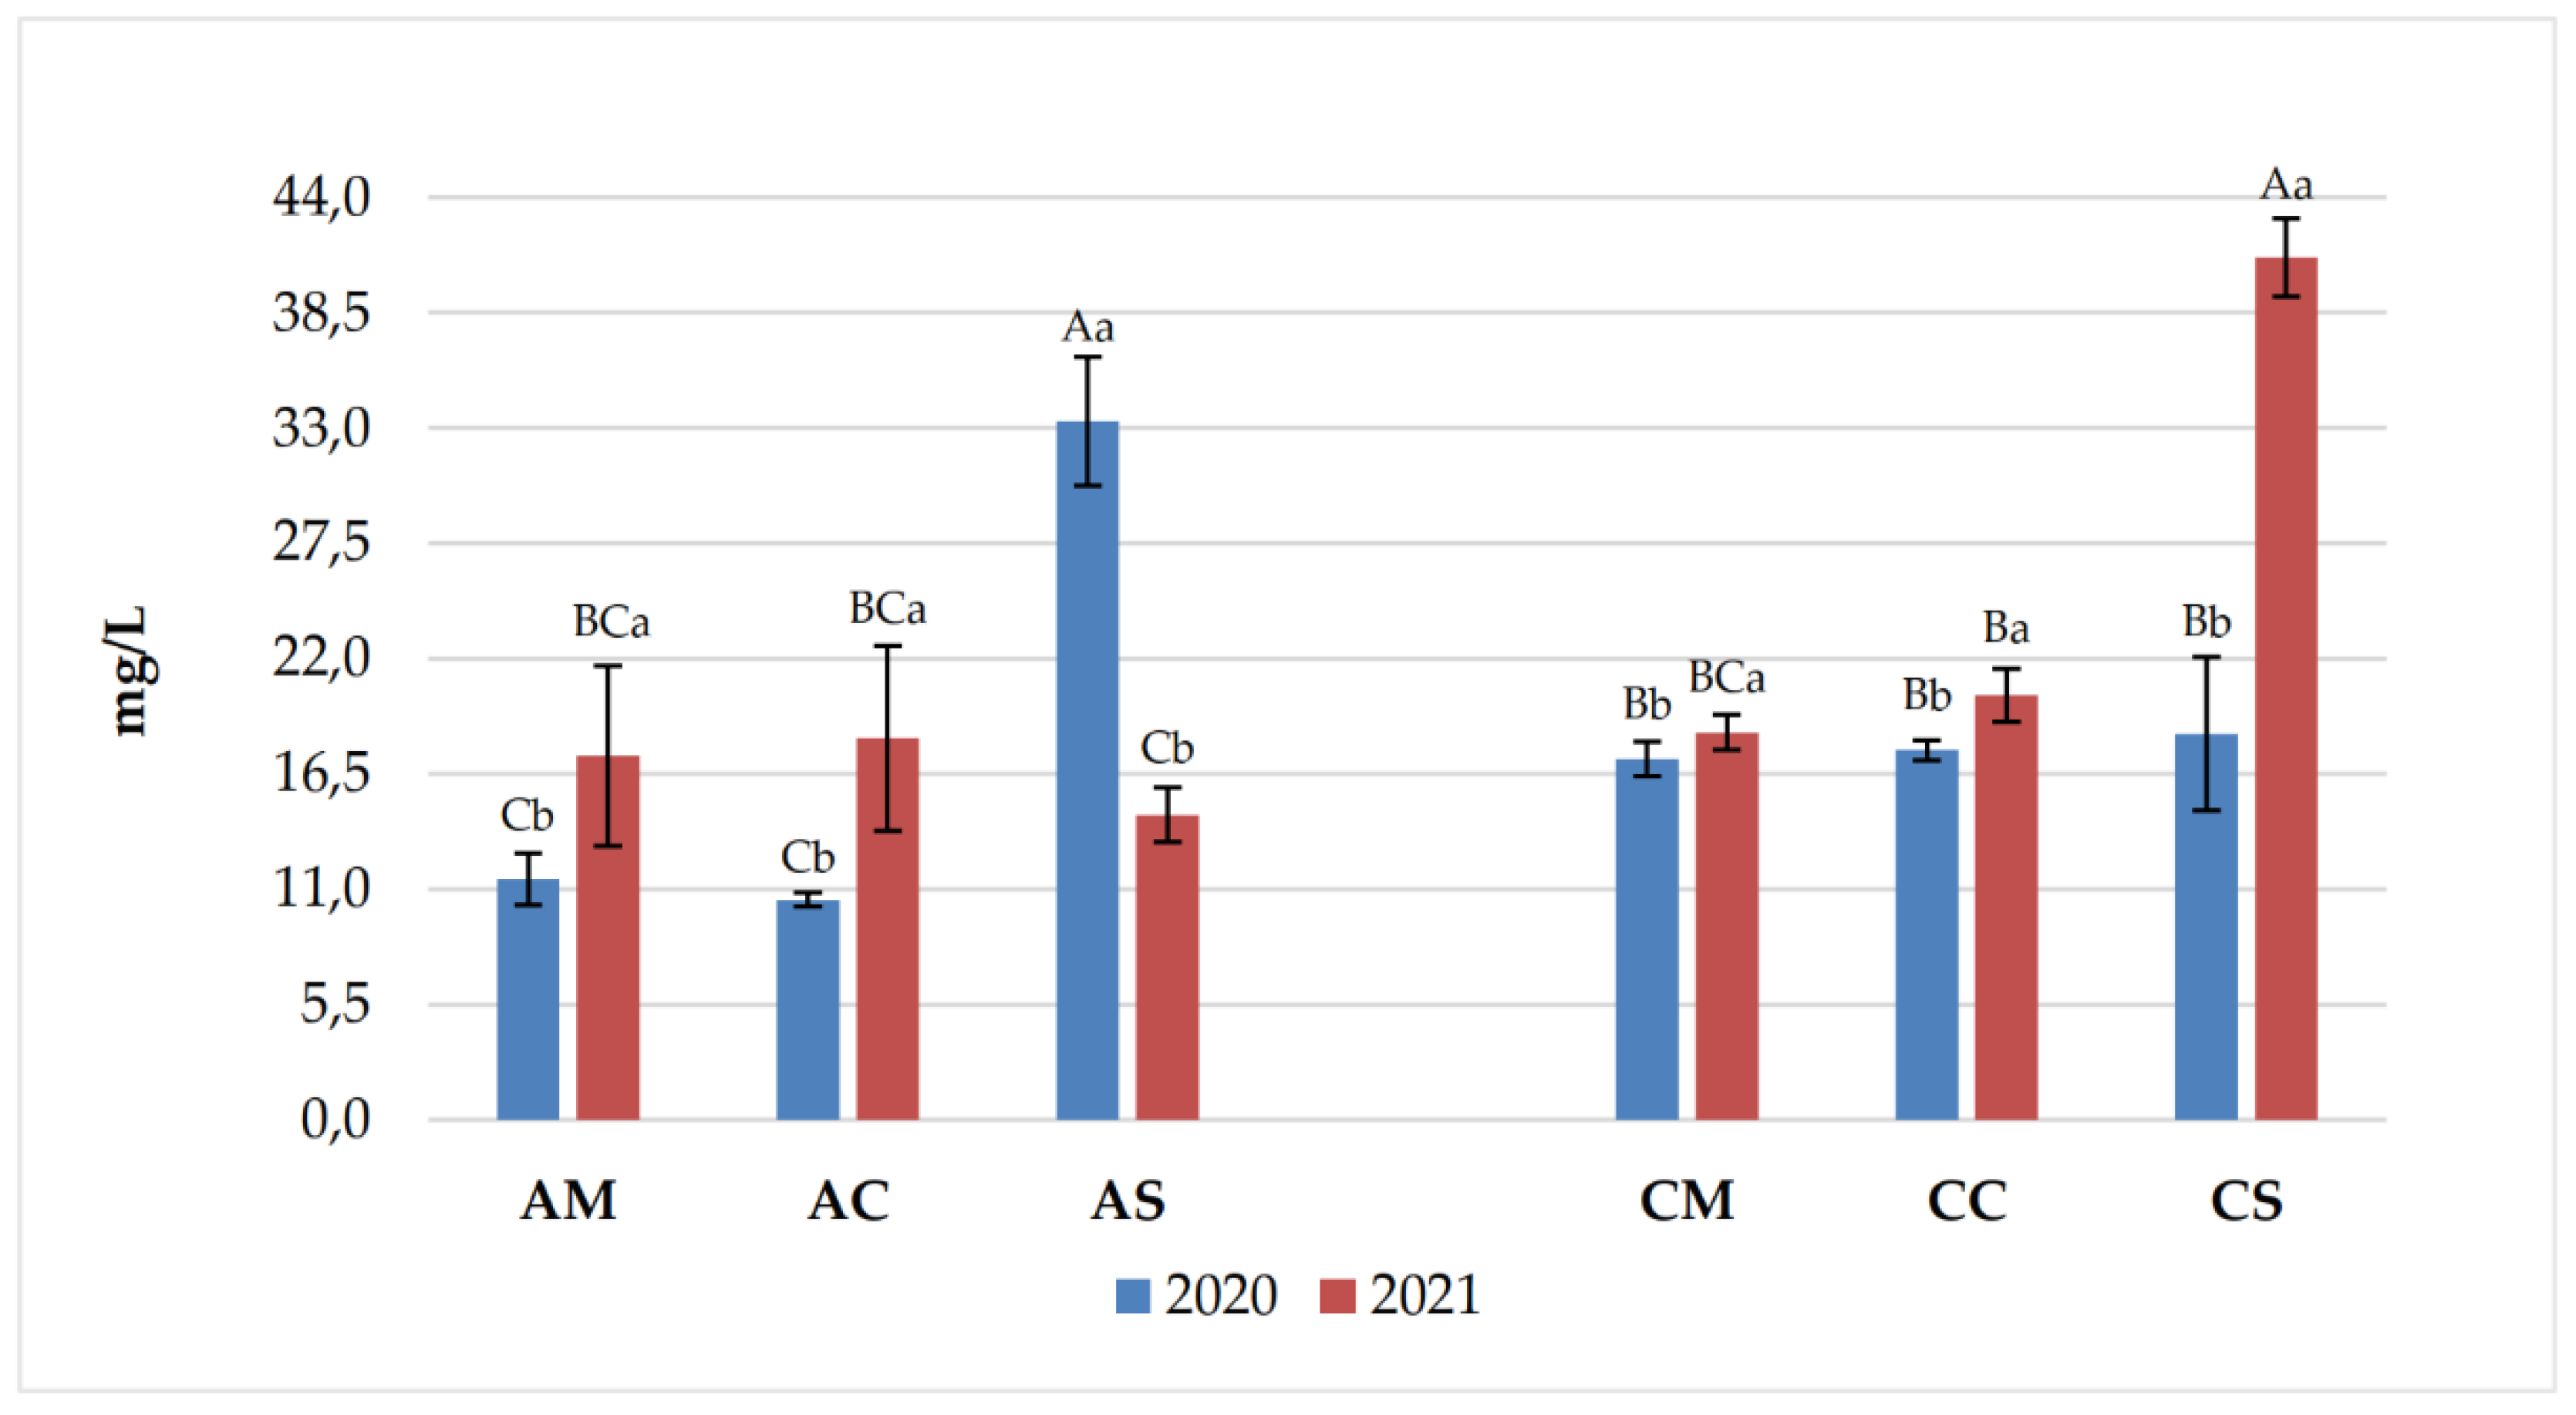

Table 1.
Chemical parameters of Aglianico and Cabernet Sauvignon wines produced from grapes harvested in 2020 and 2021 vintages. For each year, different lowercase letters in each column indicate significant differences (p < 0.05).
Table 1.
Chemical parameters of Aglianico and Cabernet Sauvignon wines produced from grapes harvested in 2020 and 2021 vintages. For each year, different lowercase letters in each column indicate significant differences (p < 0.05).
| Years | Samples | pH | Titratable acidity (g/L) | Volatile acidity (g/L) |
Alcohol (%v/v) |
L-malic acid (g/L) |
L-lactic acid (g/L) |
Citric acid (mg/L) |
|---|---|---|---|---|---|---|---|---|
| AM | 3.30 ± 0.01d | 7.28 ± 0.14a | 0.34 ± 0.04bc | 13.8 ± 0.1a | 0.21 ± 0.06c | 1.05 ± 0.05a | 0.25 ± 0.03c | |
| AC | 3.63 ± 0.02c | 5.55 ± 0.16b | 0.27 ± 0.02c | 13.2 ± 0.1b | 0.24 ± 0.06bc | 0.54 ± 0.03d | 0.37 ± 0.06a | |
| 2020 | AS | 3.80 ± 0.01a | 5.23 ± 0.13bc | 0.53 ± 0.05a | 12.4 ± 0.2c | 0.51 ± 0.07a | 1.05 ± 0.03a | 0.33 ± 0.01abc |
| CM | 3.70 ± 0.05bc | 4.85 ± 0.17c | 0.35 ± 0.05bc | 13.5 ± 0.2ab | 0.24 ± 0.06bc | 0.94 ± 0.04ab | 0.35 ± 0.01ab | |
| CC | 3.80 ± 0.05ab | 5.00 ± 0.20c | 0.40 ± 0.05abc | 14.0 ± 0.2a | 0.33 ± 0.05bc | 0.83 ± 0.05bc | 0.26 ± 0.01c | |
| CS | 3.70 ± 0.03bc | 5.15 ± 0.13bc | 0.41 ± 0.06ab | 11.5 ± 0.2d | 0.39 ± 0.01ab | 0.74 ± 0.03c | 0.27 ± 0.04bc | |
| AM | 3.28 ± 0.02c | 9.30 ± 0.20a | 0.24 ± 0.04d | 12.7 ± 0.1de | 2.46 ± 0.06a | 0.43 ± 0.07bc | 0.44 ± 0.01c | |
| AC | 3.32 ± 0.02c | 6.38 ± 0.12b | 0.39 ± 0.04c | 13.5 ± 0.3b | 1.32 ± 0.06c | 0.29 ± 0.08c | 0.53 ± 0.02b | |
| 2021 | AS | 3.78 ± 0.02a | 4.42 ± 0.17d | 0.49 ± 0.03b | 13.4 ± 0.1bc | 1.06 ± 0.04d | 0.63 ± 0.09ab | 0.37 ± 0.01cd |
| CM | 3.45 ± 0.05b | 5.40 ± 0.10c | 0.34 ± 0.04c | 14.5 ± 0.1a | 1.95 ± 0.05b | 0.29 ± 0.09c | 0.32 ± 0.02d | |
| CC | 3.54 ± 0.04b | 5.10 ± 0.10c | 0.59 ± 0.01a | 12.2 ± 0.2e | 0.84 ± 0.04e | 0.67 ± 0.03a | 0.61 ± 0.03a | |
| CS | 3.53 ± 0.05b | 4.54 ± 0.24d | 0.51 ± 0.02ab | 12.9 ± 0.1cd | 0.65 ± 0.02f | 0.46 ± 0.06abc | 0.41 ± 0.03c |
Table 2.
Monomeric anthocyanins (mg/L) of Aglianico and Cabernet Sauvignon wines produced in 2020 and 2021 vintages.
Table 2.
Monomeric anthocyanins (mg/L) of Aglianico and Cabernet Sauvignon wines produced in 2020 and 2021 vintages.
| Years | Anthocyanins | AM | AC | AS | CM | CC | CS |
| 2020 | Delf-3mg | 12.62 ±4.37 Aa | 3.30 ±0.22 Bb | 1.57 ±0.42 Ba | 8.87 ±2.52 Ab | 2.91 ±0.40 Bb | 4.50 ±0.81 Ba |
| Cyan-3mg | 0.43 ±0.09 ABb | 0.21 ±0.04 Cb | 0.21 ±0.17 Cb | 0.55 ±0.15 Aa | 0.35 ±0.03 ABCa | 0.24 ±0.06 BCb | |
| Pet-3mg | 16.96 ±4.59 Aa | 5.51 ±0.21 Cb | 3.22 ±0.45 Ca | 11.54 ±2.35 Bb | 6.91 ±0.87 Ca | 6.24 ±1.40 Ca | |
| Peon-3mg | 3.82 ±1.11 Bb | 8.50 ±0.88 Aa | 2.54 ±0.25 Ca | 0.91 ±0.28 Db | 0.82 ±0.09 Db | 2.56 ±0.32 Ca | |
| Malv-3mg | 145.10 ±26.50 Aa | 89.27 ±6.05 Bb | 101.74 ±9.34 Ba | 101.65 ±16.27 Ba | 88.06 ±9.26 Ba | 86.41 ±19.16 Ba | |
| Malv-Ac | 14.18 ±2.30 Ca | 5.78 ±0.32 Da | 9.57 ±1.18 CDa | 35.31 ±7.22 ABa | 41.56 ±4.27 Aa | 28.02 ±5.65 Ba | |
| Malv-Cum | 15.28 ±2.49 Aa | 8.86 ±0.77 BCDb | 9.64 ±1.25 BCa | 7.92 ±1.33 CDa | 11.19 ±1.40 Ba | 6.56 ±1.57 Da | |
| Delf-3mg | 13.01 ±4.09 Ba | 4.647 ±0.14 Ca | 1.28 ±0.33 Da | 17.21 ±1.41 Aa | 4.93 ±0.42 Ca | 3.89 ±0.09 CDa | |
| 2021 | Cyan-3mg | 0.86 ±0.27 Aa | 0.523 ±0.09 BCa | 0.46 ±0.04 BCa | 0.58 ±0.07 Ba | 0.38 ±0.18 BCa | 0.32 ±0.04 Ca |
| Pet-3mg | 14.73 ±1.08 Aa | 8.538 ±0.68 Ba | 2.94 ±0.12 Da | 14.43 ±1.19 Aa | 5.74 ±0.31 Cb | 3.85 ±0.11 Db | |
| Peon-3mg | 5.97 ±0.24 Aa | 5.174 ±0.17 Bb | 2.20 ±0.07 Cb | 5.60 ±0.51 ABa | 2.35 ±0.10 Ca | 2.35 ±0.07 Ca | |
| Malv-3mg | 125.64 ±8.13 Aa | 104.879 ±10.19Ba | 84.32 ±3.06 Cb | 104.94 ±8.36 Ba | 56.67 ±3.05 Db | 44.09 ±1.13 Eb | |
| Malv-Ac | 16.79 ±17.96 BCa | 4.485 ±0.68 Cb | 8.68 ±0.49 Ca | 35.99 ±2.64 Aa | 22.93 ±0.93 Bb | 15.01 ±0.37 BCb | |
| Malv-Cum | 11.36 ±2.59 Ab | 12.080 ±1.98 Aa | 4.21 ±0.34 Cb | 7.29 ±0.51 Ba | 3.40 ±0.28 Cb | 2.03 ±0.12 Cb |
Delf-3mg = delphinidin monoglucoside. Cyan-3mg = cyanidin 3-monoglucoside. Pet-3mg = petunidin 3-monoglucoside. Peon-3mg = peonidin 3-monoglucoside. Malv-3mg = malvidin 3-glucoside. Malv-Ac = malvidin 3-(6II-acetyl)-glucoside. Malv-Cum = malvidin 3-(6II-coumaroyl)-glucoside. All the data are expressed as means ± standard deviation of four replicates (two experimental replicates x two analytical replicates). Uppercase letters (A, B, C) indicate significant differences (p<0.05) among the same molecules among wines produced in the same year. Lowercase letters (a, b) indicate significant differences (p < 0.05) among the same wine in different year.
Disclaimer/Publisher’s Note: The statements, opinions and data contained in all publications are solely those of the individual author(s) and contributor(s) and not of MDPI and/or the editor(s). MDPI and/or the editor(s) disclaim responsibility for any injury to people or property resulting from any ideas, methods, instructions or products referred to in the content. |
© 2025 by the authors. Licensee MDPI, Basel, Switzerland. This article is an open access article distributed under the terms and conditions of the Creative Commons Attribution (CC BY) license (http://creativecommons.org/licenses/by/4.0/).
Copyright: This open access article is published under a Creative Commons CC BY 4.0 license, which permit the free download, distribution, and reuse, provided that the author and preprint are cited in any reuse.


