
Submitted:
31 March 2025
Posted:
01 April 2025
You are already at the latest version
Abstract
Background: Nutrition knowledge is positively associated with energy intake in athletes, and therefore, improving nutrition knowledge may offer a cost-effective approach to prevent negative performance and health outcomes associated with low energy availability (LEA) described in the Relative Energy Deficiency in Sports (REDs) syndrome model. The aim was to assess the short-term influence of a 60-min group-based nutrition education intervention on sports nutrition knowledge and dietary intake in elite athletes.
Method: Twenty-five elite Canadian athletes were enrolled into a 3-week prospective single blinded randomized pragmatic trial. Participants were randomly assigned to 1 of 2 group-based nutrition education interventions. Education content was similar between both groups with 1 group assigned an additional 5-10 mins to review athlete testimonials on the negative impacts of REDs. Participants were assessed, before and about 10 days after the intervention, using anthropometry, Platform to Evaluate Athlete Knowledge of Sports Nutrition, Athlete Food Choice, Eating Disorder Examination 6.0, LEA/Triad, Athlete Diet Index questionnaires, and consecutive 5-day food record.
Results: The education intervention that was supplemented with athlete testimonials performed similarly to the intervention without (p>0.05). Overall, nutrition knowledge (score from 69.8, to 72.8) and the intake of carbohydrate-rich foods (12.4 to 14.3) increased while disordered eating/eating symptoms decreased (0.788 to 0.642) after the education intervention (all p< 0.05). No changes in daily energy and carbohydrate intake were observed after the education intervention (p>0.05).
Conclusion: The nutrition education sessions were associated with an in-crease in nutrition knowledge and other factors associated with food choice leading to increased consumption of carbohydrate-rich foods and reducing disordered eating/eating disorder symptoms. More research is required on methods to influence athlete eating behaviours to optimize energy intake to prevent associated negative health and performance outcomes.
Keywords:
Relative Energy Deficiency in Sport
; low energy availability
; LEA
; REDs
; nutrition knowledge
; nutrition education
; eating behavior
; food choice
; diet quality
; elite athletes
1. Introduction
Inadequate energy intake increases an athlete’s risk of exposure to low energy availability (LEA) [1]. Inadequate energy intake may result from disordered eating/eating disorder, misguided approaches to reduce body mass/fat and/or inadequate time, resources or knowledge to meet the increased energy needs for heavy training or competition [2]. LEA may become problematic to an athlete’s health and performance described under the Relative Energy Deficiency in Sports (REDs) syndrome model [3]. Signs of LEA have been reported in international and world class (tier 4-5) level athletes and may detrimentally affect preparations for major competition [4,5,6,7].
Dietary intake is influenced by factors that are organized into two main categories - food choice and eating behaviour [8]. Assessment of key determinants of food choice in international and world class athletes revealed that unique performance-related factors and specific sport-related items can influence food choice [9]. Energy and carbohydrate intake are positively associated with nutrition knowledge in female endurance and male team-based athletes [10,11]. Education interventions designed to improve nutrition knowledge may offer a cost-effective approach to prevent and correct the negative health and performance consequences associated with inadequate energy and carbohydrate intake in athletes [12,13,14].
Nutrition education aimed to enhance nutrition knowledge and support positive dietary changes has occasionally shown to enhance performance and health in athletes. Clinical counselling by a dietitian over 12 months increased energy intake, restored menstrual function and improved metabolism in exercising women secondary to LEA [15]. An educational intervention coupled with several group-based behavioural change strategies over 2 weeks ahead of competition increased energy and carbohydrate intake and improved resting metabolism in elite male soccer players [16]. However, an increase in nutrition knowledge resulting from a 16-week nutrition education program with individualized counseling failed to change dietary intake in female endurance athletes [17]. An increased in nutrition knowledge without changes to dietary intake was also observed in male and female endurance athletes who completed 3 nutrition education lectures with and without food tracking over 4-weeks [18]. The inconsistent success of change in dietary intake may be related to the differences among group participants, differences in research design, and/or some interventions being unsuitable to influence behaviour change [19]. The Capability, Opportunity, Motivation-Behaviour (COM-B) model offers a conceptual approach to inform intervention planning to bring about a desired behaviour (i.e. adherence to nutrition guidance) [20].
Inequalities in financial funding across sport programs may associate with limited ability to individualize nutrition support and optimize the athletes’ food environment. However, in-group sessions were reportedly a top 3 method, behind in-group session + one on one session (25%) and one on one session (19.2%), with the highest preference for sessions to last 31-60min with same caliber athletes and facilitated by a knowledgeable, experienced and credible performance dietitian or nutritionist [21]. Athletes’ (n=124 (tier 3-4) across 22 sports) preferences for nutrition education have also indicated that the most essential general and performance topics were energy requirements and recovery, respectively and that life examples, visual content, discussions with the facilitator and interesting examples and stories were top 4 desirable methods of teaching [21]. Therefore, it is important to examine the impact of different group-based nutrition interventions that aim to increase nutrition knowledge in order to improve dietary intake.
The aim of this project is to assess the short-term association of 2 different 60-min nutrition education interventions on sport nutrition knowledge, eating behaviors and dietary intake in elite athletes. We hypothesize that the nutrition education that incorporates athlete stories through testimonials will associate with improved nutrition knowledge, eating behaviors and energy intake.
2. Materials and Methods
2.1. Design
Twenty-five elite Canadian athletes (tier 4-5 international – world class level) [6] across five sport disciplines were enrolled into a single blinded randomized pragmatic trial between August and December 2022 at the Institut National du Sport du Québec (clinical trials#: NCT05709678). Pre-testing was completed before randomization to match groups by level of baseline nutrition knowledge according to the Platform to Evaluate Athlete Knowledge of Sports Nutrition Questionnaire (PEAKS-NQ) overall score [22]. Participants were block randomized into a 60-min group nutrition education session or the same 60-min group nutrition education with the additional review of testimonial by elite athlete of the negative health and performance outcomes associated with REDs [23,24]. Post-testing was scheduled 12-14 days after the group education intervention to control for the maturation effect. To be eligible to participate, participants had to be ≥18 years of age, and training (to ensure typical in-season dietary habits). Potential participants were excluded if a medical diagnosis of an eating disorder using criteria outlined in the Diagnostic and Statistical Manual of Mental Disorders-5 was documented. Athletes provided written informed consent, and the study was approved by the McGill University’s Research Ethics Board 4 in accordance with the declaration of Helsinki (22-05-051-02).
2.2. Education Intervention
The education intervention included lecturing and discussions. The content was developed based on the top 7 general nutrition curriculum topics reported by 124 tier 3-4 athletes from 22 sports and administered via PowerPoint by the investigator (ES) who is a registered dietitian with 8-years of experience in high-performance sports [21]. The content was designed to influence 2 components (i.e. capacity and motivation) associated with behaviour change described in the COM-B model. The educational content listed in Table 1 focused on foundational nutrition knowledge to inform food choices to support protein, carbohydrate and energy needs during moderate to high intensity training.
2.3. Anthropometry
Body mass, standing height, bi-epicondylar breadths, body girths and skinfolds at eight sites were measured by a level III accredited anthropometrist from the International Society for the Advancement of Kinanthropometry (ISAK) (ES) using techniques previously described [26]. Standing height was measured using a stadiometer (Rosscraft, Surrey, BC, Canada), body mass on a calibrated digital scale with a precision of ± 0.1 kg (BWB-800S Tanita, Illinois, USA), bone breadths with a Campbell 10 sliding bone caliper (Rosscraft, Surrey, BC, Canada), body girths with a flexible steel tape (Rosscraft, Surrey, BC, Canada) and skinfolds with Harpenden calipers (Baty International, Burgess Hill, England). Somatotype scores were calculated as previously described [27]. Estimation of fat-free mass was derived from the Withers regression model [28].
2.4. Platform to Evaluate Athlete Knowledge of Sports Nutrition Questionnaire (PEAKS-NQ)
Athlete knowledge on sport nutrition was assessed through PEAKS-NQ, a validated 50-item electronic questionnaire [22]. It is based on a total score of 75 across two sections: General Nutrition and Sports Nutrition. Correct answers are given one mark. Incorrect and “not sure” responses are given a zero mark. The items with multiple correct answers score one mark per correct answer and are deducted one mark per incorrect option. Negative scores resulting from multiple incorrect answers are adjusted to zero.
2.5. Athlete Food Choice Questionnaire (AFCQ)
Factors that reportedly influence food choices in elite athletes were assessed with the AFCQ which is a validated 32-item questionnaire to assess nine factors influencing food choices in elite athletes. Items are presented as neutral statements and participants rank each on a frequency scale from 1 (never) to 5 (always) [9]. Food choices assessment included both foods and beverages.
2.6. Eating Behaviour and Diet Quality
Cognitive restraint eating behaviour was assessed with the Three-Factors Eating Questionnaire R-18 (TFEQ-R18) ) [29]. The participants’ diet quality was assessed with the validated Athlete Diet Index (ADI) questionnaire to examine reported eating behaviours and habits over the last seven days [30]. The total ADI score, sub-scores (i.e. Core Nutrition, Special Nutrients, and Dietary Habits), and non-scored information (i.e. 7-day training log, special diets and dietary supplement use) were used in combination to provide an indication of overall diet quality, nutritional adequacy and usual dietary pattern of the athletes. Although the sub-score for Core Nutrition was based on the Australian Dietary Guidelines (NHMRC, 2013), the principals were similar to the Canadian Food Guide and was therefore included in the group analysis [31,32]. A score ≥90 was classified as exceeds recommendations (i.e. Gold status); a score 66–89 was classified as meets recommendations (i.e. Silver status); while a score ≤65 was classified as below recommendations (i.e. Bronze status). Additional non-scored data (i.e. medical conditions, current injuries, training schedule) collected as descriptive data helped contextualise the dietary trends and scores.
2.7. Eating Disorder Examination Questionnaire (EDE-Q 6.0)
Participants completed a 28-item questionnaire derived from the semi-structured interview EDE-Q 6.0 to assess the range and severity of features associated with a diagnosis of eating disorder using four subscales (Restraint, Eating Concern, Shape Concern and Weight Concern) and a global score [33]. It focuses on the past 28 days and uses a seven-point rating scale (0-6). Total scores >2.5 for females and >1.6 for males are indicative of disordered eating [34]. The two subscales related to shape and weight concerns (i.e. EDE 6.0 physique concern score = (shape concern score + weight concern score)/2) was used to assess change in self-reported concerns with physique.
2.8. Food Intake Diary
Each athlete completed a 5-day dietary intake report using the Keenoa phone application (Version 1.0.3, Montréal, Québec, Canada) [35]. The intake assessment focused on five consecutive days of coach-directed training. Athletes received detailed online instructions on how to record all food, fluids, and dietary supplement intake. Participants were instructed to weigh and take pictures of each food item with their smartphone prior to consumption. A food scale was provided to facilitate data capture. Participants could search and record food items manually from a database linked to the Canadian Nutrient File (Health Canada, 2015). If the athlete ate out or was unable to find a suitable food match among the available food choice on the app, they were instructed to provide the name of the restaurant food, and fluid orders with size; or name of the food with brand and portion size, respectively, to enable cross-checking. ES reviewed all dietary records and analysis reports for consistency. The Cunningham (1991) predictive resting metabolic rate equation was used to operate the Goldberg cut-off to assess cases of under-reporting energy intake (EI):basal metabolic rate (BMR) ≤ 1.19 or over-reporting ≥ 2.92 based on a physical activity level of 1.8 for moderate activity [36,37].
2.9. Low Energy Availability Questionnaire
Male participants completed the low energy availability male questionnaire (LEAM-Q), a 42-item questionnaire to screen for self-reported physiological symptoms related to LEA [38]. Higher total scores indicate a higher relative risk of LEA, with lower sex-drive being a more sensitive indicator. Low sex drive was identified based on the scoring matrix (>2) previously discussed [38].
Female participants completed the low energy availability female questionnaire (LEAF-Q), a 25-item questionnaire to screen for self-reported physiological symptoms related to LEA [39]. Participants were categorized as being at risk for REDs based on the scoring matrix (>9) previously discussed [39].
2.10. Statistics
A power analysis was based on the minimum absolute energy intake deficit reported to induce metabolic and endocrine responses associated with LEA in men and women (400kcal/d) and the mean reported change in energy- carbohydrate intake (weight controlled) from nutrition education interventions in athletes [19,40,41]. This determined a sample size of 12 for each group (24 in total) to assess outcome markers with a statistical power of 80%, with an alpha level of 0.05.
All data were analyzed using SPSS (SPSS v23.0; IBM Inc., Chicago, IL, USA). Descriptive statistics are presented as mean (μ) ± standard deviation (SD) (parametric) or median ± interquartile range (non-parametric) or percent proportions. Normality was assessed via Shapiro–Wilk test. Differences in baseline data between intervention groups was investigated with either independent t-test (continuous normally distributed data) or Mann–Whitney U test (ordinal or non-normally distributed continuous data) with significance set to p < 0.05. A two-way repeated measures analysis of variance (ANOVA) was used to assess for a group, time and interactive effects between treatment groups. Significance was set at p<0.05. Pearson’s correlation coefficient (normally distributed data) or Spearman’s correlation coefficient (non-normally distributed data) were used to identify relationships between PEAKS-NQ overall score, BMI, somatotype scores, mean relative energy and carbohydrate intake at baseline.
3. Results
3.1. Participants
Characteristics of the 25 participants are presented in Table 2.
At baseline, there was no significant difference in determinants of food choice, characteristics of eating behaviour and outcomes of dietary intake between groups (Table 3.
Ten participants (40%) were rated as under-reporting energy intake for moderate exercise (EI:BMR≤1.19). Nineteen (76%) participants under-consumed carbohydrate based on sport nutrition recommendations for moderate exercise (4-6g/kg/d). Thirty-two percent of participants screened positive for LEA. Thirty-two percent had a diet quality that was below recommendations based on the ADI scoring matrix. One female and one male athlete screened positive for potential disordered eating. At baseline, knowledge on sport nutrition (i.e., PEAKS-NQ total score) was positively associated with relative energy intake (r= 0.491; p=0.01) and negatively associated with risk of eating disorders (EDE 6.0 global score; r= -0.420; p=0.04). Mesomorphy score was negatively associated with relative energy (r= -0.509; p=0.01) and carbohydrate (r= -0.580; p=0.001) intake. No associations were observed between EDE 6.0 global score and energy and carbohydrate intake, as well as somatotype and BMI values.
3.2. Changes in Factors Associated with Nutrition Knowledge
There was a main effect of time on overall nutrition knowledge (Figure 1). Overall nutrition knowledge increased after the education intervention in both groups.
3.3. Changes in Factors Associated with Food Choices
3.4. Changes in Eating Behaviour and Dietary Intake
There was a main effect of time on overall eating disorder symptoms, body weight/shape concerns and total carbohydrate food servings per day in both groups (Figure 1 and Table 3). Overall eating disorder symptoms and body weight/shape concerns decreased, and the intake of total carbohydrate -rich foods, particularly starchy vegetables and dairy servings per day, increased. The main effect of time for the consumption of total carbohydrate -rich foods remained significant (p=0.01) after controlling for changes in overall eating disorder symptoms and body weight/shape concerns. The main effect of time was insignificant after controlling for changes in overall nutrition knowledge, or usual eating practices, weight control or sensory appeal. The main effect of time in the overall eating disorder symptoms was insignificant after controlling for change in overall nutrition knowledge.
Two participants had a diet quality that fell below recommendations based on the ADI scoring matrix after the education intervention. One of those participants reportedly moved to a temporary place of residence on the 3rd week and the food environment was not well organized to support his weekly schedule. The other participant did not indicate any alterations to his food environment. Both participants had a 0.9kg decrease in body mass (overall group mean change = -0.2 kg (95% confidence interval: -0.6-0.1kg)) with no intentions of changing body mass and composition.
4. Discussion
We assessed the short-term association of a single group-based nutrition education intervention, enhanced or not with athletes’ testimonials on the negative consequences of REDS, on nutrition knowledge and dietary intake in elite Canadian athletes (tier 4 and 5). Our main findings were (1) the education intervention that was supplemented with athlete testimonials performed similarly to the intervention without (p>0.05); (2) total nutrition knowledge (score from 69.8, to 72.8) and the intake of carbohydrate-rich foods (12.4 to 14.3) increased while disordered eating/eating symptoms decreased (0.788 to 0.642) after the education intervention (all p<0.05) and (3) no changes in daily energy and carbohydrate intake were observed after the education intervention (p>0.05).
This is the first study to investigate the impact of a nutrition education intervention on eating behaviours in elite Canadian athletes (tier 4-5). On average, our group sample was rated as meeting dietary recommendations for health and sport. However, a meaningful proportion of total participants (32%) were rated as not meeting dietary recommendations. Those not meeting dietary recommendations (70%) had a high restraint eating score similar to observations in elite male volleyball athletes [42]. Underreporting of energy intake was noted in 40% (n=10) of our participants, but the assessment protocol cannot distinguish those who are dieting (2 of 10 aimed to reduce body fat) or underestimate their energy requirements for weekly training [36]. Diet quality was reportedly lower in individual sport athletes compared to team sports and in those training longer than 12 hrs per week, suggesting that insufficient time for food preparation may negatively impact diet quality [43]. Recognizing that most participants were in weight sensitive sports, the high restraint eating habit may have been intended for weight control. Two aspects supporting this consideration is that as 83% of our sample under consumed energy and carbohydrate for moderate exercise and 94% of these participants had a notably lower total skinfold value than norms reported in elite Canadian athletes [44,45,46]. Insufficient food preparation (ie. skills and/or time), dieting for weight control and disordered eating trends have previously been noted to increase the risk of LEA in athletes and may explain why some athletes in our sample screened positive for LEA and/or poor diet quality [3,43].
Higher nutrition knowledge was associated with higher energy and carbohydrate intake as previously reported in elite female endurance athletes [18]. The education sessions with lecturing and discussions were designed to increase psychological capacity as well as reflective and automatic motivation among the participants in order to influence eating habits based on the COM-B intervention model to improve energy and carbohydrate intake [47]. Nutrition education was delivered over 60min through a lecture and slide presentation, which informed an athlete driven discussion with the lecturer during the 10-15min question period. Although an increase in nutrition knowledge (based on PEAKS-NQ) and in intake of carbohydrate -rich foods (AFCQ) were observed in both groups, it was insufficient to increase energy intake at a magnitude that was previously estimated to influence physiological signs resulting from energy deficit (i.e., approx. 400kcal/d). The degree of change in dietary intake may depend on the magnitude of change in knowledge and/or knowledge threshold as athletes who self monitored dietary intake for individualized dietetic feedback along with weekly nutrition education resources reported moderate improvements in nutrition knowledge [48]. Alternatively, the failure to observe a change in energy and carbohydrate intake may also be a consequence of excluding a COM-B component (opportunity) from the intervention design. Opportunity such as message prompting by a sport nutritionist to increase carbohydrate intake was rated as an effective strategy when coupled with an educational workshop, food intake monitoring and the presence of the sport nutritionist at mealtimes, for elite athletes to acutely increase energy and carbohydrate intake [16,20]. Intervening on all components of the COM-B model also appears effective for sustaining longer term increases in energy intake to correct for metabolic and reproductive dysfunction associated with LEA in active women [49].
The combined use of eating behaviour and behaviour change intervention models has provided some interesting insights for field application. The range of educational content appeared to have impacted a variety of factors associated with food choice and eating behaviour [8]. An increase in nutrition knowledge was accompanied by a decrease in usual eating practices, sensory appeal and weight control determinants associated with food choice as well as a decrease in eating disorder symptoms associated with weight and shape concerns. Among those changes, the decrease in the eating disorder symptoms seemed less important for the degree of increase observed in the daily carbohydrate -rich food servings in this group of weight sensitive athletes. This suggests that alterations in other determinants of food choice associated with increases in nutrition knowledge is required to influence eating behaviours. Nevertheless, the reduction in eating disorder symptoms through an increase in nutrition knowledge may help to inform support interventions aimed at improving mental health issues associated with eating.
5. Limitations
Several decisions around study design may have impacted our results. First, the design lacked a true control to adequately assess the degree of impact on the education intervention on food choice and eating behaviour outcomes. Second, the study may have been underpowered to detect a small change in energy and carbohydrate intake, but it was sufficiently powered to detect a small meaningful change associated with negative physiological effects of energy deficit in men and women [40,41]. It is possible that energy intake may have increased over the weekend, but unfortunately the dietary intake protocol for estimating relative energy and carbohydrate intake was focused on dietary intake over training days. Third, the short observation period limited the assessment of moderate and long-term changes to eating behaviours but may have assisted in controlling for the influence of the maturation effect. Finally, the intervention design excluded an approach to influence the component of opportunity to optimize the intervention response recognized by nutrition experts in sports. However, the investment in nutrition support across elite sport programs is highly variable and group education intervention continues to be used in real world settings. It is important to observe the influence of these methods of intervention on eating behaviour and nutrition outcomes to inform care planning by field practitioners.
6. Conclusions
The nutrition education sessions were associated with an increase in nutrition knowledge, reduction in usual eating practices, weight control and disordered eating/eating disorder symptoms and increase in the consumption of carbohydrate -rich foods. However, the increase in reported food intake from the ADI was not associated with an increase in the daily relative energy and carbohydrate intake. Given the health and performance risks of exposure to LEA, it is important to continue exploring different educational interventions aimed at optimizing energy and carbohydrate intake to optimize health and performance.
Author Contributions
The study was designed by ES, CD, KI, PT, LC, RT, MM and ASB, data were collected by ES & PT and analyzed by ES, data interpretation and manuscript preparation were undertaken by ES, CD, KI, PT, LC, RT, MM and ASB. All authors approved the final version of the paper.
Funding
This research was Programme de Recherche, d’Innovation et de Diffusion de l’Information (PRIDI No. 69).
Institutional Review Board Statement
The study was conducted in accordance with the Declaration of Helsinki and approved by the Institutional Review of McGill University (protocol code 22-05-051-02 on September 29, 2022) for studies involving humans.
Informed Consent Statement
Informed consent was obtained from all subjects involved in the study.
Data Availability Statement
The data that supports the findings of this article cannot be made publicly available because they contain commercially sensitive information.
Acknowledgments
The authors acknowledge coaches, staff and players for supporting the project.
Conflicts of Interest
The authors declare no conflict of interest. The funders had no role in the design of the study; in the collection, analyses, or interpretation of data; in the writing of the manuscript, or in the decision to publish the results.
Abbreviations
The following abbreviations are used in this manuscript:
| ADI AFCQ EDE 6.0 LEA LEAF-Q LEAM-Q PEAKS-NQ REDs |
Athlete diet index Athlete food choice questionnaire Eating disorder examination 6.0 Low energy availability Low energy availability female questionnaire Low energy availability male questionnaire Platform to evaluate athlete knowledge in sport nutrition questionnaire Relative energy deficiency in sports |
| EI:BMR | Energy intake:basal metabolic rate |
| COM-B | Capability, Opportunity, Motivation - behaviour |
References
- Loucks, A. B., Kiens, B., & Wright, H. H. (2011). Energy availability in athletes. Journal of Sports Sciences, 29(sup1), Article sup1. [CrossRef]
- Wells, K. R., Jeacocke, N. A., Appaneal, R., Smith, H. D., Vlahovich, N., Burke, L. M., & Hughes, D. (2020). The Australian Institute of Sport (AIS) and National Eating Disorders Collaboration (NEDC) position statement on disordered eating in high performance sport. British Journal of Sports Medicine, 54(21), 1247–1258. [CrossRef]
- Mountjoy, M., Ackerman, K. E., Bailey, D. M., Burke, L. M., Constantini, N., Hackney, A. C., Heikura, I. A., Melin, A., Pensgaard, A. M., Stellingwerff, T., Sundgot-Borgen, J. K., Torstveit, M. K., Jacobsen, A. U., Verhagen, E., Budgett, R., Engebretsen, L., & Erdener, U. (2023). 2023 International Olympic Committee’s (IOC) consensus statement on Relative Energy Deficiency in Sport (REDs). British Journal of Sports Medicine, 57(17), 1073–1098. [CrossRef]
- Drew, M., Vlahovich, N., Hughes, D., Appaneal, R., Burke, L. M., Lundy, B., Rogers, M., Toomey, M., Watts, D., Lovell, G., Praet, S., Halson, S. L., Colbey, C., Manzanero, S., Welvaert, M., West, N. P., Pyne, D. B., & Waddington, G. (2018). Prevalence of illness, poor mental health and sleep quality and low energy availability prior to the 2016 Summer Olympic Games. British Journal of Sports Medicine, 52(1), 47–53. [CrossRef]
- Heikura, I. A., McCluskey, W. T. P., Tsai, M.-C., Johnson, L., Murray, H., Mountjoy, M., Ackerman, K. E., Fliss, M., & Stellingwerff, T. (2024). Application of the IOC Relative Energy Deficiency in Sport (REDs) Clinical Assessment Tool version 2 (CAT2) across 200+ elite athletes. British Journal of Sports Medicine, bjsports-2024-108121. [CrossRef]
- McKay, A. K. A., Stellingwerff, T., Smith, E. S., Martin, D. T., Mujika, I., Goosey-Tolfrey, V. L., Sheppard, J., & Burke, L. M. (2022). Defining Training and Performance Caliber: A Participant Classification Framework. International Journal of Sports Physiology and Performance, 17(2), Article 2. [CrossRef]
- Rogers, M. A., Appaneal, R. N., Hughes, D., Vlahovich, N., Waddington, G., Burke, L. M., & Drew, M. (2021). Prevalence of impaired physiological function consistent with Relative Energy Deficiency in Sport (RED-S): An Australian elite and pre-elite cohort. British Journal of Sports Medicine, 55(1), Article 1. [CrossRef]
- Stok, F. M., Renner, B., Allan, J., Boeing, H., Ensenauer, R., Issanchou, S., Kiesswetter, E., Lien, N., Mazzocchi, M., Monsivais, P., Stelmach-Mardas, M., Volkert, D., & Hoffmann, S. (2018). Dietary Behavior: An Interdisciplinary Conceptual Analysis and Taxonomy. Frontiers in Psychology, 9, 1689. [CrossRef]
- Thurecht, R. L., & Pelly, F. E. (2021). The Athlete Food Choice Questionnaire (AFCQ): Validity and Reliability in a Sample of International High-Performance Athletes. Medicine & Science in Sports & Exercise, 53(7), Article 7. [CrossRef]
- Alaunyte, I., Perry, J. L., & Aubrey, T. (2015). Nutritional knowledge and eating habits of professional rugby league players: Does knowledge translate into practice? Journal of the International Society of Sports Nutrition, 12(1), 18. [CrossRef]
- Kettunen, O., Heikkilä, M., Linnamo, V., & Ihalainen, J. K. (2021). Nutrition Knowledge Is Associated with Energy Availability and Carbohydrate Intake in Young Female Cross-Country Skiers. Nutrients, 13(6), 1769. [CrossRef]
- Kettunen, O., Mikkonen, R., Mursu, J., Linnamo, V., & Ihalainen, J. K. (2023). Carbohydrate intake in young female cross-country skiers is lower than recommended and affects competition performance. Frontiers in Sports and Active Living, 5, 1196659. [CrossRef]
- Sesbreno, E., Blondin, D., Dziedzic, C., Sygo, J., Haman, F., Leclerc, S., Brazeau, A.-S., & Mountjoy, M. (2023). Signs of low energy availability in elite male volleyball athletes but no association with risk of bone stress injury and patellar tendinopathy. European Journal of Sport Science, 1–9. [CrossRef]
- Tam, R., Beck, K. L., Manore, M. M., Gifford, J., Flood, V. M., & O’Connor, H. (2019). Effectiveness of Education Interventions Designed to Improve Nutrition Knowledge in Athletes: A Systematic Review. Sports Medicine, 49(11), Article 11. [CrossRef]
- De Souza, M. J., Mallinson, R. J., Strock, N. C. A., Koltun, K. J., Olmsted, M. P., Ricker, E. A., Scheid, J. L., Allaway, H. C., Mallinson, D. J., Kuruppumullage Don, P., & Williams, N. I. (2021). Randomised controlled trial of the effects of increased energy intake on menstrual recovery in exercising women with menstrual disturbances: The ‘REFUEL’ study. Human Reproduction, 36(8), Article 8. [CrossRef]
- Carter, J. L., Lee, D. J., Fenner, J. S. J., Ranchordas, M. K., & Cole, M. (2024). Contemporary educational and behavior change strategies improve dietary practices around a match in professional soccer players. Journal of the International Society of Sports Nutrition, 21(1), 2391369. [CrossRef]
- Fahrenholtz, I. L., Melin, A. K., Garthe, I., Hollekim-Strand, S. M., Ivarsson, A., Koehler, K., Logue, D., Lundström, P., Madigan, S., Wasserfurth, P., & Torstveit, M. K. (2023). Effects of a 16-Week Digital Intervention on Sports Nutrition Knowledge and Behavior in Female Endurance Athletes with Risk of Relative Energy Deficiency in Sport (REDs). Nutrients, 15(5), 1082. [CrossRef]
- Heikkilä, Lehtovirta, Autio, Fogelholm, & Valve. (2019). The Impact of Nutrition Education Intervention with and Without a Mobile Phone Application on Nutrition Knowledge Among Young Endurance Athletes. Nutrients, 11(9), Article 9. [CrossRef]
- Boidin, A., Tam, R., Mitchell, L., Cox, G. R., & O’Connor, H. (2021). The effectiveness of nutrition education programmes on improving dietary intake in athletes: A systematic review. British Journal of Nutrition, 125(12), Article 12. [CrossRef]
- Bentley, M. R., Mitchell, N., Sutton, L., & Backhouse, S. H. (2019). Sports nutritionists’ perspectives on enablers and barriers to nutritional adherence in high performance sport: A qualitative analysis informed by the COM-B model and theoretical domains framework. Journal of Sports Sciences, 37(18), Article 18. [CrossRef]
- Solly, H., Badenhorst, C. E., McCauley, M., Slater, G. J., Gifford, J. A., Erueti, B., & Beck, K. L. (2023). Athlete Preferences for Nutrition Education: Development of and Findings from a Quantitative Survey. Nutrients, 15(11), 2519. [CrossRef]
- Tam, R., Beck, K., Scanlan, J. N., Hamilton, T., Prvan, T., Flood, V., O’Connor, H., & Gifford, J. (2021). The Platform to Evaluate Athlete Knowledge of Sports Nutrition Questionnaire: A reliable and valid electronic sports nutrition knowledge questionnaire for athletes. British Journal of Nutrition, 126(4), Article 4. [CrossRef]
- Gillbanks, L., Mountjoy, M., & Filbay, S. R. (2022). Lightweight rowers’ perspectives of living with Relative Energy Deficiency in Sport (RED-S). PLOS ONE, 17(3), e0265268. [CrossRef]
- Vickers, A. J. (2006). How to randomize. Journal of the Society for Integrative Oncology, 4(4), Article 4. [CrossRef]
- Davies, C., & Mann, A. (2023). Factors influencing women to accept diet and exercise messages on social media during COVID-19 lockdowns: A qualitative application of the health belief model. Health Marketing Quarterly, 40(4), 415–433. [CrossRef]
- Stewart, A. D., Marfell-Jones, M., Olds, T., & de Ridder, H. (2011). International standards for anthropometric assessment (pp. 1–112). International Society for the Advancement of Kinanthropometry.
- Norton, K., & Olds, T. (1996). Measurement techniques in anthropometry. In Anthropometrica (pp. 25–75). University of the New South Wales Press, Australia.
- Withers, R. T., Whittingham, N. O., Norton, K. I., Forgia, J. L., Ellis, M. W., & Crockett, A. (1987). Relative body fat and anthropometric prediction of body density of female athletes. European Journal Applied Physiology, 56, 169–180. [CrossRef]
- de Lauzon, B., Romon, M., Deschamps, V., Lafay, L., Borys, J.-M., Karlsson, J., Ducimetière, P., Charles, M. A., & the Fleurbaix Laventie Ville Sante (FLVS) Study Group. (2004). The Three-Factor Eating Questionnaire-R18 Is Able to Distinguish among Different Eating Patterns in a General Population. The Journal of Nutrition, 134(9), Article 9. [CrossRef]
- Capling, L., Tam, R., Beck, K. L., Slater, G. J., Flood, V. M., O’Connor, H. T., & Gifford, J. A. (2021). Diet Quality of Elite Australian Athletes Evaluated Using the Athlete Diet Index. Nutrients, 13(1), Article 1. [CrossRef]
- Canada’s Food Guide. Government of Canada. 2024 Nov 20. Available from: https://food-guide.canada.ca/en/.
- National Health and Medical Research Council. (2013). Australian Dietary Guidelines. Canberra: National Health and Medical Research Council.
- Fairburn, C. G., & Beglin, S. J. (n.d.). Assessment of eating disorders: Interview or self-report questionnaire? International Journal Eating Disorders, 16(4), 363–370.
- Kuikman, M. A., Mountjoy, M., & Burr, J. F. (2021). Examining the Relationship between Exercise Dependence, Disordered Eating, and Low Energy Availability. Nutrients, 13(8), Article 8. [CrossRef]
- Moyen, A., Rappaport, A. I., Fleurent-Grégoire, C., Tessier, A.-J., Brazeau, A.-S., & Chevalier, S. (2022). Relative Validation of an Artificial Intelligence–Enhanced, Image-Assisted Mobile App for Dietary Assessment in Adults: Randomized Crossover Study. Journal of Medical Internet Research, 24(11), e40449. [CrossRef]
- Black, A. (2000). The sensitivity and specicity of the Goldberg cut-off for EI:BMR for identifying diet reports of poor validity. European Journal of Clinical Nutrition, 54, 395–404. [CrossRef]
- Cunningham, J. J. (1991). Body composition as a determinant of energy expenditure: A synthetic review and a proposed general prediction equation. The American Journal of Clinical Nutrition, 54(6), Article 6. [CrossRef]
- Lundy, B., Torstveit, M. K., Stenqvist, T. B., Burke, L. M., Garthe, I., Slater, G. J., Ritz, C., & Melin, A. K. (2022). Screening for Low Energy Availability in Male Athletes: Attempted Validation of LEAM-Q. Nutrients, 14(9), Article 9. [CrossRef]
- Melin, A., Tornberg, Å. B., Skouby, S., Faber, J., Ritz, C., Sjödin, A., & Sundgot-Borgen, J. (2014). The LEAF questionnaire: A screening tool for the identification of female athletes at risk for the female athlete triad. British Journal of Sports Medicine, 48(7), Article 7. [CrossRef]
- Fahrenholtz, I. L., Sjödin, A., Benardot, D., Tornberg, Å. B., Skouby, S., Faber, J., Sundgot-Borgen, J. K., & Melin, A. K. (2018). Within-day energy deficiency and reproductive function in female endurance athletes. Scandinavian Journal of Medicine & Science in Sports, 28(3), 1139–1146. [CrossRef]
- Torstveit, M. K., Fahrenholtz, I., Stenqvist, T. B., Sylta, Ø., & Melin, A. (2018). Within-Day Energy Deficiency and Metabolic Perturbation in Male Endurance Athletes. International Journal of Sport Nutrition and Exercise Metabolism, 28(4), Article 4. [CrossRef]
- Sesbreno, E., Dziedzic, C. E., Sygo, J., Blondin, D. P., Haman, F., Leclerc, S., Brazeau, A.-S., & Mountjoy, M. (2021). Elite Male Volleyball Players Are at Risk of Insufficient Energy and Carbohydrate Intake. Nutrients, 13(5), Article 5. [CrossRef]
- Capling, L., Gifford, J. A., Beck, K. L., Flood, V. M., Halar, F., Slater, G. J., & O’Connor, H. T. (2021). Relative validity and reliability of a novel diet quality assessment tool for athletes: The Athlete Diet Index. British Journal of Nutrition, 126(2), Article 2. [CrossRef]
- Kerksick, C. M., Wilborn, C. D., Roberts, M. D., Smith-Ryan, A., Kleiner, S. M., Jäger, R., Collins, R., Cooke, M., Davis, J. N., Galvan, E., Greenwood, M., Lowery, L. M., Wildman, R., Antonio, J., & Kreider, R. B. (2018). ISSN exercise & sports nutrition review update: Research & recommendations. Journal of the International Society of Sports Nutrition, 15(1), Article 1. [CrossRef]
- Burke, L. M., Hawley, J. A., Wong, S. H. S., & Jeukendrup, A. E. (2011). Carbohydrates for training and competition. Journal of Sports Sciences, 29(sup1), Article sup1. [CrossRef]
- Sesbreno, E., Slater, G., Mountjoy, M., & Galloway, S. D. R. (2020). Development of an Anthropometric Prediction Model for Fat-Free Mass and Muscle Mass in Elite Athletes. International Journal of Sport Nutrition and Exercise Metabolism, 30(2), Article 2. [CrossRef]
- Atkins, L., & Michie, S. (2015). Designing interventions to change eating behaviours. Proceedings of the Nutrition Society, 74(2), Article 2. [CrossRef]
- Simpson, A., Gemming, L., Baker, D., & Braakhuis, A. (2017). Do Image-Assisted Mobile Applications Improve Dietary Habits, Knowledge, and Behaviours in Elite Athletes? A Pilot Study. Sports, 5(3), 60. [CrossRef]
- Strock, N. C. A., De Souza, M. J., Mallinson, R. J., Olmsted, M., Allaway, H. C. M., O’Donnell, E., Plessow, F., & Williams, N. I. (2023). 12-months of increased dietary intake does not exacerbate disordered eating-related attitudes, stress, or depressive symptoms in women with exercise-associated menstrual disturbances: The REFUEL randomized controlled trial. Psychoneuroendocrinology, 152, 106079. [CrossRef]
Figure 1.
Eating behaviours and determinants of food choice influenced by the education intervention. Data presented as mean ± standard deviation, Significance set at p<0.05. amissing n=1 under treatment group, bmissing n=2 in group education and n=2 group education + testimonials(T)
Figure 1.
Eating behaviours and determinants of food choice influenced by the education intervention. Data presented as mean ± standard deviation, Significance set at p<0.05. amissing n=1 under treatment group, bmissing n=2 in group education and n=2 group education + testimonials(T)
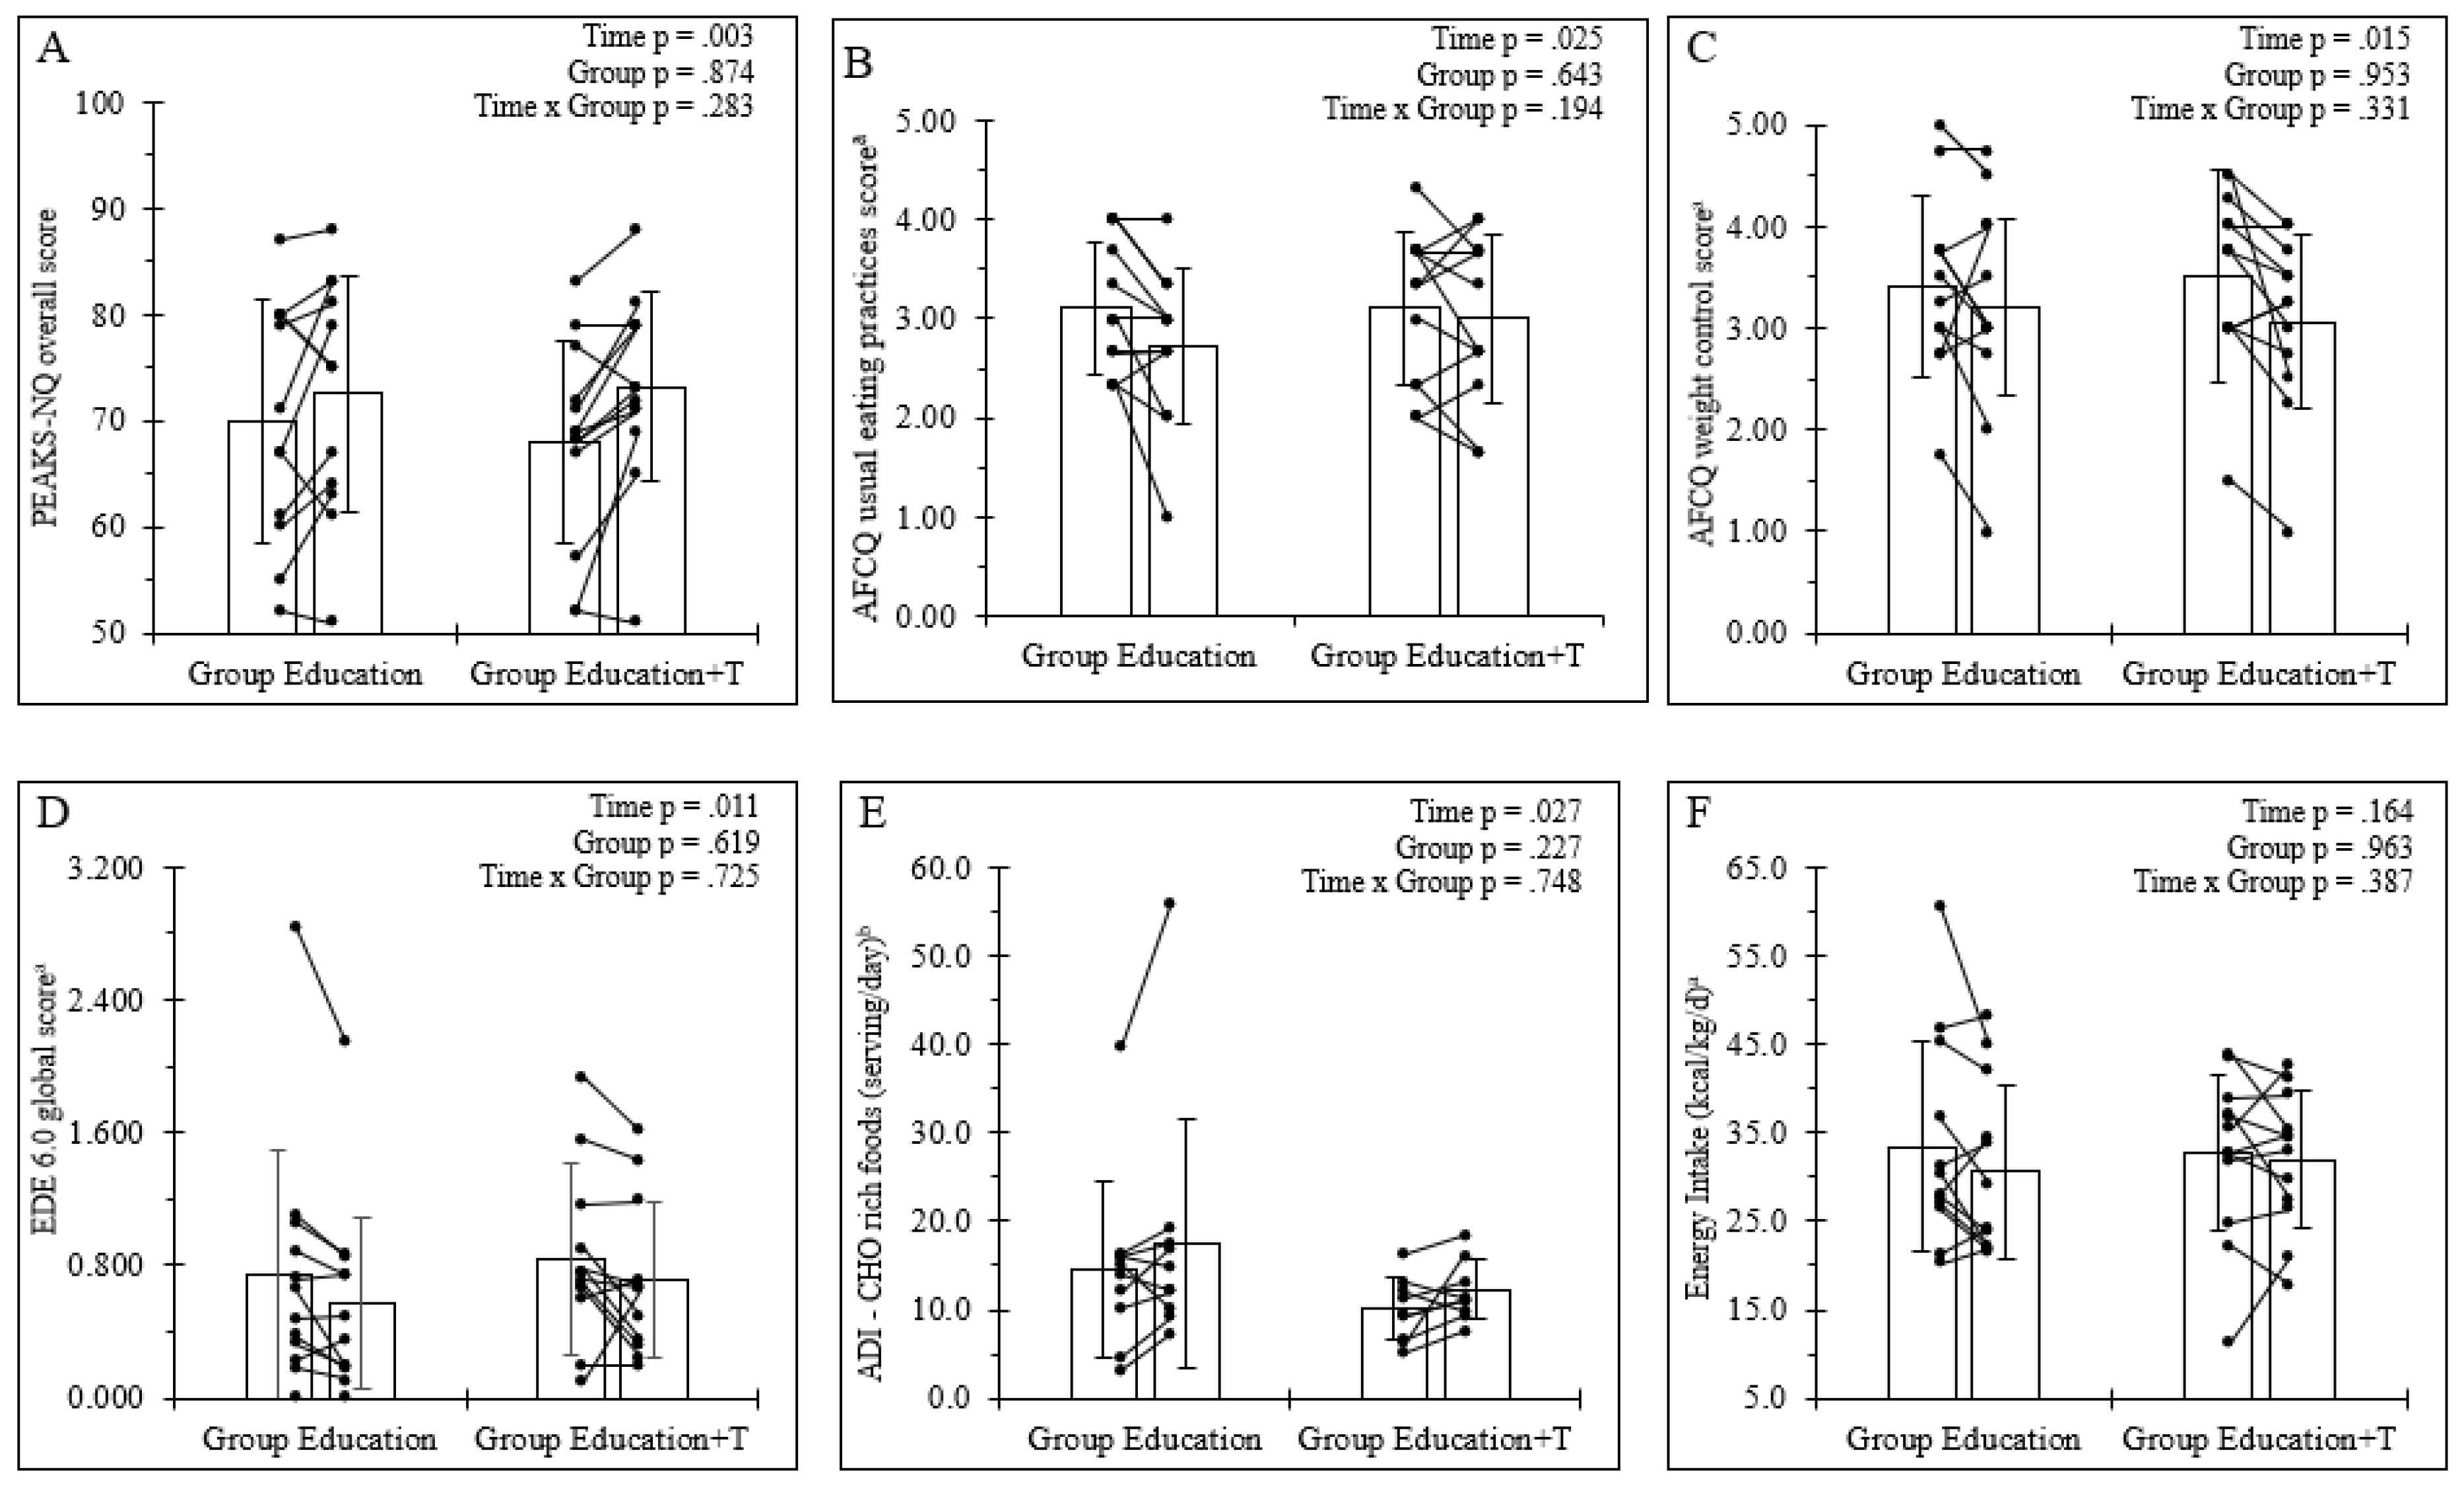

Table 1.
Nutrition education activity.
| Intervention Function | Definition | Link to components of COM-B model | Educational content | |
|---|---|---|---|---|
| Group education | Group education + testimonials | |||
| Education | Increase knowledge or understanding | Capacity-psychological Motivation-reflective |
|
|
| Persuasion | Using communication to induce positive or negative feelings or stimulate action | Motivation-reflective Motivation-automatic |
||
| Persuasion | Using communication to induce positive or negative feelings or stimulate action | Motivation-reflective Motivation-automatic |
|
|
*Thomas et al., 2016; #Mountjoy et al., 2018; **Sesbreno et al., 2021; +Rogers et al., 2021; ªJurov et al., 2021; bGillbanks et al., 2022Common risk factors associated with energy deficit such as weight/fat mass reduction, restraint eating behaviours, failure to increase dietary intake for exercise demands, and the consequences of LEA on bone health and neuromuscular function were addressed. Testimonials from athletes with lived experiences of REDs were provided to the education + testimonial group to review for 5-10 min. The use of athlete testimonials was to provide greater interventional emphasis on the motivational component as it was previously reported that peer testimonials/stories are perceived by athletes and non-athletes as effective teaching techniques and may deepen cues to action [16,25]. The sessions were recorded to examine content delivery for the assessment of fidelity.
Table 2.
Baseline characteristics of participants.
|
Group education (n = 12; 3 female) |
Group education + testimonials (n = 13; 3 female) |
p value | |
| Age (years) | 25.4 ± 2.8 | 24.1 ± 2.9 | 0.288 |
| Anthropometry | |||
| Body mass (kg) | 75.9 ± 17.0 | 68.4 ± 10.0 | 0.187 |
| Standing height (cm) | 172.4.7 ± 10.6 | 168.0 ± 6.6 | 0.221 |
| Body mass index (kg/m2) | 25.3 ± 3.8 | 24.2 ± 2.3 | 0.383 |
| Sum of skinfolds (mm) | 66.1 ± 41.3 | 49.4 ± 14.7 | 0.584 |
| Ectomorphya | 1.7 ± 1.3 | 1.6 ± 0.7 | 0.847 |
| Mesomorphya | 6.0 ± 1.3 | 6.3 ± 0.8 | 0.300 |
| Endomorphya | 2.1 ± 1.3 | 1.6 ± 0.6 | 0.847 |
| Positive for low energy availability risk (n) | |||
| LEAM-Q score | 3 | 0 | |
| LEAF-Q score | 3 | 2 | |
| Primary sport (n) | |||
| Sprint kayak | 2 (0 female) | 2 (2 female) | |
| Amateur boxing | 2 (1 female) | 2 (0 female) | |
| Olympic weightlifting | 3 (1 female) | 1 (0 female) | |
| Artistic gymnastics | 4 (0 female) | 6 (0 female) | |
| Trampoline gymnastics | 1 (1 female) | 2 (1 female) | |
| Stage of training cycle (n) | |||
| In-season | 9 (3 female) | 9 (1 female) | |
| Injured/off-season | 3 (0 female) | 4 (2 female) | |
| Training history (n) | |||
| Training 11-15 hours/week | 1 (0 female) | 1 (0 female) | |
| Training 16-20 hours/week | 5 (2 female) | 5 (1 female) | |
| Training 20+ hours/week | 8 (1 female) | 7 (2 female) | |
Data presented as mean ± standard deviation and median (minimum-maximum); significance set at p<0.05; amissing n=2, bmissing=3.
Table 3.
Baseline characteristics of participants.
|
Group education (n = 12; 3 female) |
Group education + testimonial (n = 13; 3 female) |
p value | |
| Factors associated with food choice | |||
| Weekly food budget ($) | 100 (50-350) | 150 (80-500) | 0.114 |
| AFCQ Nutritional attributes of food | 3.53 ± 0.82 | 3.23 ± 0.82 | 0.406 |
| AFCQ Usual eating practices | 3.11 ± 0.67 | 3.10 ± 0.74 | 0.979 |
| AFCQ Food and health awareness | 3.75 ± 0.57 | 3.50 ± 0.64 | 0.315 |
| AFCQ Influence of others | 2.25 ± 0.98 | 2.21 ± 0.66 | 0.896 |
| AFCQ Weight control | 3.42 ± 0.89 | 3.54 ± 0.83 | 0.726 |
| AFCQ Food values and beliefs | 1.86 ± 0.50 | 1.59 ± 0.70 | 0.225 |
| AFCQ Performance | 4.25 ± 0.59 | 4.03 ± 0.80 | 0.470 |
| AFCQ Emotional influences | 2.17 ± 0.53 | 2.37 ± 0.66 | 0.437 |
| AFCQ Sensory appeal | 4.14 ± 0.52 | 3.95 ± 0.79 | 0.769 |
| Culinary skillsa (n) | |||
| Advanced | 4 (2 female) | 7 (2 female) | |
| Intermediate | 7 (1 female) | 5 (1 female) | |
| Basic | 1 (0 female) | 1 (0 female) | |
| Cooking (n) | |||
| Always | 6 (2 female) | 6 (2 female) | |
| Usually | 1 (1 female) | 3 (1 female) | |
| Sometimes | 1 (0 female) | 2 (0 female) | |
| Rarely | 4 (0 female) | 1 (0 female) | |
| Never | 0 (0 female) | 1 (0 female) | |
| Eating behaviour | |||
| Dietary supplement use (n)b | 5 (3 female) | 5 (3 female) | |
| Dietary intake/nutrition | |||
| Energy (g/kg/d) | 33.4 ± 11.9 | 32.7 ± 8.9 | 0.868 |
| Carbohydrate (g/kg/d) | 3.8 ± 1.5 | 3.6 ± 1.1 | 0.728 |
| Protein (g/kg/d) | 1.8 ± 0.6 | 1.8 ± 0.5 | 0.611 |
| Fat (% of energy) | 33.6 ± 6.4 | 34.3 ± 5.6 | 0.775 |
| ADI total score | 77.1 ± 15.2 | 72.3 ± 11.3 | 0.410 |
| ADI Core Nutrition sub-score | 50.7 ± 11.2 | 50.9 ± 8.4 | 0.959 |
| ADI Special Nutrients sub-score | 19.5 ± 4.6 | 15.1 ± 4.5 | 0.036 |
| ADI Dietary Habits sub-score | 6.9 ± 0.9 | 6.3 ± 1.2 | 0.228 |
Data presented as mean ± standard deviation and median (minimum-maximum); significance set at p<0.05; Athlete food choice questionnaire (AFCQ); aData derived from the Athlete Diet Index (ADI),bmissing=3.
Table 4.
Assessment of education intervention on outcomes related to dietary intake behaviour under the COM-B model.
Table 4.
Assessment of education intervention on outcomes related to dietary intake behaviour under the COM-B model.
|
Group education (n = 12, 3 female) |
Group education + testimonials (n = 13, 3 female) |
P values | |||||
| Pre | Post | Pre | Post | Grp | Time | Grp x Time | |
| Psychological capability | |||||||
| PEAKS-NQ general | 69.3 ± 11.9 | 72.8 ± 7.4 | 75.7 ± 8.9 | 79.3 ± 6.7 | 0.050 | 0.052 | 0.954 |
| PEAKS-NQ sport | 70.1 ± 11.2 | 71.9 ± 16.5 | 61.5 ± 13.1 | 67.9 ± 13.4 | 0.225 | 0.058 | 0.277 |
| AFCQ nutritional attributes of fooda | 3.53 ± 0.82 | 3.38 ± 1.02 | 3.28 ± 0.83 | 3.22 ± 0.82 | 0.544 | 0.367 | 0.727 |
| AFCQ usual eating practicesa | 3.11 ± 0.67 | 2.72 ± 0.78 | 3.11 ± 0.77 | 3.00 ± 0.84 | 0.643 | 0.025 | 0.194 |
| AFCQ food and health awarenessa | 3.75 ± 0.57 | 2.65 ± 0.54 | 3.45 ± 0.65 | 3.48 ± 0.52 | 0.248 | 0.752 | 0.637 |
| Social opportunity | |||||||
| AFCQ influence of othersa | 2.24 ± 0.98 | 2.19 ± 0.91 | 2.22 ± 0.69 | 2.11 ± 0.66 | 0.863 | 0.444 | 0.794 |
| Reflective motivation | |||||||
| AFCQ weight controla | 3.42 ± 0.88 | 3.21 ± 1.05 | 3.52 ± 0.86 | 3.06 ± 0.85 | 0.953 | 0.015 | 0.331 |
| AFCQ food values and beliefsa | 1.86 ± 0.50 | 1.92 ± 0.45 | 1.64 ± 0.70 | 1.81 ± 0.78 | 0.470 | 0.330 | 0.636 |
| AFCQ performancea | 4.25 ± 0.59 | 4.08 ± 0.67 | 4.06 ± 0.87 | 4.02 ± 0.55 | 0.645 | 0.790 | 0.604 |
| Automatic motivation | |||||||
| AFCQ emotional influencesa | 2.17 ± 0.52 | 2.29 ± 0.86 | 2.31 ± 0.66 | 2.10 ± 0.57 | 0.934 | 0.698 | 0.130 |
| AFCQ sensory appeala | 4.14 ± 0.52 | 3.80 ± 0.66 | 4.03 ± 0.77 | 3.89 ± 0.74 | 0.949 | 0.036 | 0.377 |
| Eating behaviour | |||||||
| EDE 6.0 Intake subscorea | 0.708 ± 0.663 | 0.558 ± 0.596 | 0.567 ± 0.360 | 0.483 ± 0.430 | 0.311 | 0.218 | 0.721 |
| EDE 6.0 Physique concern subscorea | 0.766 ± 0.847 | 0.588 ± 0.655 | 1.106 ± 0.821 | 0.937 ± 0.735 | 0.274 | 0.009 | 0.946 |
| TFEQ-R18 restraint eating scorea | 13.5 ± 3.8 | 13.6 ± 4.5 | 14.1 ± 3.5 | 13.0 ± 3.3 | 0.976 | 0.442 | 0.442 |
| ADI - fruit (serves/day) b | 2.2 ± 1.2 | 2.3 ± 1.4 | 1.7 ± 1.1 | 2.3 ± 1.4 | 0.530 | 0.392 | 0.630 |
| ADI - non-Starchy Vegetables (serves/day)b | 1.8 ± 1.1 | 2.1 ± 1.2 | 2.0 ± 0.9 | 1.9 ± 1.3 | 0.945 | 0.743 | 0.386 |
| ADI - starchy Vegetables (serves/day)b | 0.8 ± 0.6 | 1.3 ± 1.2 | 0.7 ± 1.0 | 1.1 ± 1.4 | 0.810 | 0.026 | 0.737 |
| ADI - grains (serves/day) b | 5.9 ± 3.0 | 4.2 ± 2.0 | 5.2 ± 2.2 | 4.6 ± 1.3 | 0.865 | 0.045 | 0.339 |
| ADI - dairy (serves/day) b | 1.7 ± 1.4 | 3.0 ± 2.3 | 1.5 ± 0.9 | 2.4 ± 1.3 | 0.468 | 0.008 | 0.584 |
| ADI - meat (serves/day) b | 2.0 ± 0.6 | 2.1 ± 0.8 | 2.2 ± 0.5 | 2.3 ± 0.5 | 0.328 | 0.522 | 0.882 |
| ADI - discretionary food (serves/day) b | 4.1 ± 8.8 | 6.6 ± 12.8 | 1.0 ± 0.7 | 1.9 ± 1.4 | 0.274 | 0.025 | 0.271 |
| ADI - alcohol (serves/week) b | 1.4 ± 1.7 | 1.4 ± 1.4 | 2.4 ± 2.4 | 1.8 ± 2.9 | 0.730 | 0.161 | 0.538 |
| Dietary intake | |||||||
| Carbohydrate (g/kg/d)a | 3.8 ± 1.5 | 3.6 ± 1.5 | 3.5 ± 1.1 | 3.6 ± 1.2 | 0.822 | 0.746 | 0.502 |
| Protein (g/kg/d)a | 1.8 ± 0.6 | 1.7 ± 0.5 | 1.8 ± 0.5 | 1.7 ± 0.5 | 0.954 | 0.113 | 0.672 |
| Fat (% of energy)a | 33.6 ± 6.4 | 33.2 ± 7.1 | 34.6 ± 5.7 | 34.8 ± 6.2 | 0.592 | 0.901 | 0.815 |
| ADI total scoreb | 77.1 ± 15.2 | 71.6 ± 13.8 | 72.3 ± 11.3 | 70.4 ± 10.4 | 0.525 | 0.206 | 0.535 |
| ADI Core Nutrition sub-scoreb | 50.7 ± 11.2 | 48.3 ± 8.4 | 50.9 ± 8.4 | 49.1 ± 7.0 | 0.879 | 0.270 | 0.881 |
| ADI Special Nutrients sub-scoreb | 19.5 ± 4.6 | 16.2 ± 6.5 | 15.1 ± 4.5 | 14.5 ± 4.6 | 0.118 | 0.096 | 0.236 |
| ADI Dietary Habits sub-scoreb | 6.9 ± 0.9 | 7.1 ± 1.1 | 6.3 ± 1.2 | 6.8 ± 0.7 | 0.288 | 0.088 | 0.451 |
Data presented as mean ± standard deviation, Significance set at p<0.05; *difference between groups at baseline; amissing n=1 under treatment group, bmissing n=2 in group education and n=2 group education + testimonials.
Disclaimer/Publisher’s Note: The statements, opinions and data contained in all publications are solely those of the individual author(s) and contributor(s) and not of MDPI and/or the editor(s). MDPI and/or the editor(s) disclaim responsibility for any injury to people or property resulting from any ideas, methods, instructions or products referred to in the content. |
© 2025 by the authors. Licensee MDPI, Basel, Switzerland. This article is an open access article distributed under the terms and conditions of the Creative Commons Attribution (CC BY) license (http://creativecommons.org/licenses/by/4.0/).
Copyright: This open access article is published under a Creative Commons CC BY 4.0 license, which permit the free download, distribution, and reuse, provided that the author and preprint are cited in any reuse.


