Submitted:
01 April 2025
Posted:
01 April 2025
You are already at the latest version
Abstract
Highly differentiated tissues and organs play essential biological functions in multicellular organisms. Coordination of organ developmental process with tissue differentiation is necessary to achieve proper development of mature organs, but mechanisms for such coordination is not well understood. We use cotyledon margin cells from Arabidopsis plant as a new model system to investigate cell elongation and cell division during organ growth, and found that margin cells endured developmental phase transition from the “elongation” phase to the “elongation and division” phase at the early stage in germinating seedlings. We also discovered that the stem cell factors BARELY ANY MERISTEM 1 (BAM1) and WUSCHEL-related homeobox1 (WOX1) are involved in the regulation of margin cell developmental phase transition. Furthermore, low concentration auxin promotes cell division, especially longitudinal cell division. This promotion of cell division is suppressed by BAM1 and WOX1. Based on these findings, we hypothesized a new “moderate auxin concentration” model which emphasizes that a moderate auxin concentration is the key to trigger developmental transition of meristematic cells.
Keywords:
BAM1
; WOX1
; margin cells
; auxin
Introduction
Plant leaf epidermis consists of several differentiated cell types, such as stomatal guard cells for gas exchange and trichomes that may serve protective roles for herbicides. Pavement cells (PCs) are most frequent cell types on leaf epidermis in model plant Arabidopsis [1,2]. They form characteristic intercalating structure with multiple lobes and indentations. PCs in adaxial side of leaves show distinctively different shape with PCs in abaxial sides, and those 2 types of cells are separated by a few layers of marginal cells with elongated cylindrical shape [3]. Marginal cells have roles beyond physical distinction of adaxial/abaxial cells, since they are suggested to transport essential hormone auxin [4,5]. Moreover, recent report showed that marginal cells have meristematic activity specifically at the early stage of cotyledon/leaf development, which only maintains for a few days after germination of cotyledon or emergence of leaves [6]. WUSCEL (WUS) and related homeobox transcription factors are regulators of stem cell activity in different tissues such as shoot apical meristem (SAM), root apical meristem (RAM) and vascular cambium [7]. Among WUSCHEL-RELATED HOMEOBOX (WOX) genes, WOX1 and PRESSED FLOWER (PRS)/WOX3 are involved in the development of marginal cells. Plants lacking function of those genes have multiple defects in leaves and floral organs, most notably defects in blade outgrowth[8]. The double mutant is reported to lose marginal cells in leaves as well as sepals [9]. Both WOX1 and PRS are expressed in the middle domain of leaf primordium and marginal cells [10], supporting their role in maintaining stem cell activity of those cells. Further support of their roles in maintaining stem cell activity of marginal cells came from studies on orthologous genes in other plant species that have similar functions [11,12]. Adaxial-expressed MONOPTEROS (MP), abaxial-enriched auxin and abaxial expressed auxin response factor (ARF) repressors together act as positional cues for defining the WOX expression in margin cells. MP regulates expression of WOX genes by directly binding to the WOX1 and PRS promoters. Furthermore, the ARF2, ARF3, ARF4 repressors suppress WOX1 and PRS expression, also through direct binding [10]. This work suggested that the nuclear auxin signal pathway is involved in WOX regulated leaf margin development. However, molecular mechanisms underlying acquisition of meristematic activity as well as developmental phase shift to lose such activity in marginal cells are unknown.
Phosphorylation of proteins has important biological significance not only by altering properties of phosphorylated protein itself, but also for inducing signaling cascades to enable dynamic regulation of downstream processes. In plants, receptor-like kinases (RLKs) mediated signaling plays key roles in multiple developmental events [13]. Small peptides as well as other small molecule ligands such as plant hormones are perceived by RLKs for activating downstream signaling [14]. Signaling mediated by CLAVATA3 (CLV3) peptide-CLAVATA1 (CLV1) RLK pair is involved in stem cell maintenance in the SAM and one of the most extensively characterized example of small peptide mediated signaling in plants [15]. CLAVATA3/ESR (CLE) peptides act as mobile ligand in apoplast to activate signaling in neighboring cells [16], and they typically involve in regulation of stem cells in plants [17]. Direct binding of CLV3 as well as other CLE peptides to several closely related RLKs including CLV1, BAM1 and BAM2 has been detected [18], and the signaling module is proposed to restrict meristematic activity of SAM stem cells by repressing WUS expression in the central zone of the SAM [19]. Hormonal signaling is believed to cross-talk with WUS mediated signaling in both upstream and downstream of WUS [20,21,22]. Although CLV1-related RLKs are proposed to have function beyond SAM based on severe abnormalities induced by loss of function of multiple BAM genes [23], exact function of these proteins in other tissues as well as their relationship to WOXs have not been investigated in detail yet.
In root tip, the auxin maximum is considered as a polarity signal for the cell layer patterning [24,25]. Besides auxin maximum, low concentration auxin also plays critical roles for plant development. For example, during leaf adaxial-abaxial patterning, it has been shown that a transient low auxin zone in the adaxial domain of early leaf primordia worked as a signal to promotes leaf adaxial-abaxial patterning [26]. The formation of a local auxin minimum is necessary for the specification of the valve margin separation layer where Arabidopsis fruit opening takes place [27]. It is reported that auxin minimum triggers the developmental switch from cell division to cell differentiation in the Arabidopsis root [28].
In this work, we used cotyledon margin cells as a new system to study meristematic activity of plant cells through analysis of cell elongation and cell division. In root, transition of the cell division stage to the cell elongation stage occurs successively along the root growth axis determined by the position of cells and thus regulated by spatial positional cues. In contrast, switching of cell division phase to cell division with cell elongation phase in margin cells seems to be regulated in a temporal and spatial manner. By utilizing this beneficial feature of margin cells for analysis, we demonstrated that stem cell factors BAM1 and WOX1 are involved in the suppression of cell division of margin cells evoked by low concentration auxin, which may connect auxin and stem cell factors in regulating meristematic activity of stem cells in plants.
Results
Cell Elongation of Margin Cells Precedes Cell Division in Wild Type Cotyledons During Germination
Epidermal cells locate at the marginal region in cotyledons and leaves play important roles in leaf shape formation [29,30] and plants adaptation to the environment [2]. Although margin cells have been recognized as specialized cells with distinct shape compared to other cell types in leaf epidermis such as pavement cells or stomatal lineage cells, the developmental process of margin cells has not been characterized in detail [6,31]. There is no explicit definition on margin cells in Arabidopsis cotyledon. In this study, we only focus attention on the rectangle cells located at the outermost adaxial side and use them to represent margin cells while the small round cells besides the rectangle cells and the rectangle cells located in the abaxial side were not counted. We use mPS-PI staining method [32] to visualize cell walls and measure cell number and longitudinal cell length. Since cotyledon is plane symmetric, we analyzed one side of cotyledon. Through counting the rectangle cells located at the outermost region of adaxial epidermis of wild type Col-0 (Col) plants at 1 dag (day after growth condition) to 3 dag (Figure 1A–C), we found that the cell number of margin cells of 1 dag cotyledons has little variation ranging from 13 cells to 15 cells. The cell number of margin cells at 2 dag did not show significant change compare to 1 dag (Figure 1D). These results indicated that margin cells do not endure cell division at 1 dag and 2 dag. In contrast, we found that the cell number increased at 3 dag (Figure 1D). Then we measured the longitudinal cell length from the top of the margin cell to the bottom of the margin cell. The quantification of cell length in 1 dag, 2 dag and 3 dag showed that margin cells already increased in cell length at 2 dag, and thus they endured cell elongation without division before 2 dag (Figure 1E).
Thus, we concluded that the cell elongation of margin cells precedes the cell division in developing wild type cotyledons, and the developmental phase transition from the “elongation” phase to the “elongation and division” phase occurs in cotyledons right after germination.
BAM1 Regulates Margin Cell Developmental Phase Transition
Our data showed that the cell elongation of margin cells precedes the cell division in developing wild type cotyledons, and we hypothesized that there is a signaling mechanisms to regulate such developmental phase transition. We have previously found that bam1-3 mutant (SALK_015302; Supplementary information, Figure S1A) has increased number of margin cells at 2 dag [33]. Thus, we decided to check if bam1-3 shows abnormality in the margin cell developmental phase transition (Figure 2A–E). At 1dag, the cell number of margin cells in both Col and bam1-3 cotyledons showed little variation ranging from 13 cells to 15 cells. However, unlike Col cotyledons, the average cell number of margin cells of 2 dag cotyledons in bam1-3 increased up to 17 cells indicating that the cell division occurred between 1 dag to 2 dag (Figure 2A, 2B and 2D). In contrast, unlike Col plants, the cell length of bam1-3 did not increase from 1dag to 2dag (Figure2E). Similar to our previous analysis [33], the cell number of palisade cells (Supplementary information, Figure S1B and S1C) and cotyledon size (Supplementary information, Figure S1D) of Col and bam1-3 showed no significant difference at 2 dag, suggesting that the defect of bam1-3 is specific to margin cells.
To test whether other BAM protein members, BAM2 and BAM3 are involved in regulating margin cells developmental phase transition, we observed margin cell development of bam1 bam2 bam3 triple mutant and found that bam1 bam2 bam3 displayed margin cell developmental phase transition defect as bam1-3, neither reinforcing nor alleviating margin cell developmental phase transition defect of bam1-3 mutant (Figure 2C-2E). This data suggested that there is no genetic redundancy between BAM1 and BAM2/BAM3 in regulating margin cell developmental phase transition.
Next, to further confirm increase of cell division in bam1-3, we applied a pulse-chase strategy for EdU labelling assay [34] to quantify cell division frequency of margin cells of 1 dag, 1.5 dag and 2 dag in Col and bam1-3 mutant. The EdU assay can monitor the cell division occurrs during the EdU treatment. Pulse-chasing allowed us to monitor the cell division orientation by identifying daughter cell pairs. We found that bam1-3 displayed more longitudinal cell divisions than Col, from 32% to 16% of 1 dag and from 44% to 30% of 1.5 dag respectively (Table 1). These data confirmed that longitudinal cell division is increased during 1 dag to 2 dag in bam1-3 compared to Col.
Margin Cells of bam1-3 Mutants Show Abnormal Auxin Response Monitored by an Auxin Response Marker
Auxin regulates timing of cell division or cell differentiation in different tissues [35,36,37]. Since the developmental phase transition of margin cells is altered in bam1-3 mutant, it is necessary to check whether the auxin response changed in bam1-3 mutant. We checked GFP signal in pDR5::GFP-ER and found that the GFP intensity increased from 1 dag to 2 dag with maximum intensity mainly around the tip area (Figure 3A). The maximum GFP intensity displayed in the cotyledon tip in bam1-3 at 1.5 dag, demonstrating that the auxin accumulation at the tip is not affected in bam1-3 (Figure 3B). However, the GFP signal is much higher in margin cells compared to other epidermal cells in bam1-3 at 1.5 dag and 2 dag (Figure 3B). In Col cotyledons,the margin regions show only a slight increase in GFP intensity compared to other regions. However, we detected significant increase in GFP intensity in the margin region of bam1-3 cotyledons (Figure 3C). These results suggested that margin cells may endure higher auxin response compare to other cell types in bam1-3.
WOX1 Coordinately Regulates Margin Cell Development with BAM1
Previous reports showed that WUS like transcription factors WOX1 and PRS are involved in the development of marginal cells in various shoot organs [38,39,40], and wox1 prs lacks leaf margin cells [9]. We checked the cotyledon of wox1 prs and found that the long, rectangular margin cells, were also absent in wox1 prs cotyledons (Figure 4A,B). Then, we checked single loss of function alleles for WOX1 and PRS on developmental defects in margin cells. Unlike margin cells of Col cotyledons which did not divide before 2 dag, margin cells of the wox1-101 cotyledons divided from 1 dag similar to bam1-3 (Figure 4C,D). In contrast, prs-2 cotyledons did not show alteration in margin cell development (Figure 4E). Neither wox1 bam1-3 nor prs-2 bam1-3 showed enhancement of margin cell developmental defects from defects observed for bam1-3 (Figure 4F,G). We crossed bam1-3 with wox1 prs, and found that the bam1 wox1 prs triple mutants lacks margin cell as in wox1 prs mutant (Figure 4H). Quantification of cell division and cell elongation in mutants confirmed that bam1-3 and wox1-101 show similar alteration in developmental phase transition of margin cells (Figure 4I,J). However, in wox1-101 and wox1 bam1, the cell number of margin cells increased up to 15 and 16 respectively at 1 dag (Figure 4I). Given that in both Col and bam1-3 the cell number of margin cells at 1dag is constant around 14, the results suggested that WOX1 may regulate margin cells development in an early stage before 1dag.
Next, in order to detect early developmental defects before germination, we checked mature embryo of Col, bam1-3, wox1-101 and wox1 bam1 (Figure 5A–D). We found that the margin cell number of mature embryo in bam1-3 and wox1-101 are similar to Col. The cell number of mature embryo margin cells in wox1 bam1 is increased slightly to around 15 (Figure 5E) and the cell length of this mutant is decreased slightly (Figure 5F), suggesting that the BAM1 has synergistic function with WOX1 in regulating margin cell numbers in embryo stage.
The pulse-chase EdU labelling assay showed that at 1 dag the frequency of longitudinal cell divisions in wox1-101 and wox1 bam1 increased, from 16% to 34% and 16% to 26% respectively. However, at 2 dag, the frequency of longitudinal cell divisions in wox1-101 and wox1 bam1 decreased, from 16% to 4% and 16% to 8% respectively. Thus, synergistic effect of combining wox1-101 and bam1-3 is limited to embryo development stage, while it shows no enhancement of abnormality in post-embryonic development.
To check the expression pattern of BAM1 and WOX1 in young cotyledons, we constructed the promoter reporter line for BAM1 and WOX1 which contained YFP fused with nucleus localization signal downstream of promoter sequence. Consistent with the defects at the germinating cotyledons, the transgenic line proBAM1::YFP-NLS started to show YFP signal from the middle region of cotyledon at 1dag and the signal expanded to appear on cells over the whole cotyledon after 2 dag (Supplementary information, Figure S2A–C). The transgenic line proWOX1::YFP-NLS started to show YFP signal from the margin cells of cotyledons at 1 dag and the signal was restricted to the margin region till later stage (Supplementary information, Figure S2D–F). These results suggested that the margin cell development in cotyledon is regulated by BAM1 and WOX1 at different stages. WOX1 works from the mature embryo to 2dag while BAM1 acts at a relatively later stage, from 1 dag to 2 dag. However, BAM1 seems to play roles in margin cell development in embryo stage with WOX1 which may be hindered by genetic redundancy with other BAMs/RLKs.
Low Concentration Auxin Suppresses Longitudinal Cell Division of Margin Cells
Next, to gain further insights into the effect of auxin on margin cell development, we examined whether different concentrations of auxin has differential effect on cell division of margin cells in Col by applying EdU labelling assay to monitor cell division. Seedlings were divided into 5 groups and cultured in 1/2 MS with 0.1 nM NAA, 1 nM NAA, 10 nM NAA and EtOH as control respectively before EdU staining assay at 1.5 dag. The results demonstrated that with 1 nM NAA treatment, the frequency of transversal and longitudinal cell divisions increased, from 23% to 30% and from 20% to 46% respectively (Table 2). With 100 nM NAA treatment, the frequency of transversal and longitudinal cell divisions decreased, from 23% to 10% and from 20% to 6% respectively (Table 2). These results suggested that 1 nM NAA treatment accelerate longitudinal cell division while 100 nM NAA depress both transversal and longitudinal cell division.
Then we tested potential negative contribution of BAM1 and WOX1 in the low concentration auxin response, since bam1-3 and wox1-1 showed similar alteration of cell division frequency to the low concentration auxin treatment. When we applied pulse-chase EdU labelling assay with 1 nM NAA treatment in bam1-3 and wox1-101 at 1.5 dag, we found that neither bam1-3 nor wox1-101 showed increased cell division frequency compared to Col (Table 3). All together, these data suggest that BAM1 and WOX1 act as negative regulators of longitudinal cell division induced by low concentration auxin treatment.
Discussion
Our results show that margin cells elongated before 2 dag and then started to divide along with the growth of cotyledon. Suppression of margin cell division before 2 dag is dependent on BAM1. Importantly, initiation of cell elongation of margin cells is retarded in bam1-3. This indicates that defects we observed for bam1-3 are not caused by simple acceleration of developmental program inducing a precocious developmental phase shift, but caused by alteration of developmental program to prevent cell division. Similar to bam1-3, margin cells developmental phase transition occurs at earlier timing in wox1-101 (Figure 4I). Phenotype analysis of mature embryo margin cells in wox1-101, bam1-3 and bam1 wox1 demonstrated that BAM1 and WOX1 work synergistically to control embryo margin cells development (Figure 5E,F). Unlike opposite phenotype of clv1 and wus exhibited in the CLV3-WUS feedback loop of controlling SAM maintenance, wox1-101 and bam1-3 seem to have abnormal phenotype in similar direction. Increased division of stem cells may result in loss of stem cell activity, which in turn leads to consumption of proliferating cells in meristem. Detail analysis on mutants with weaker phenotype due to reduction of WUS genes and genetic analysis among multiple mutants in the CLV-WUS pathway using such weak mutants may reveal whether this idea is correct or not.
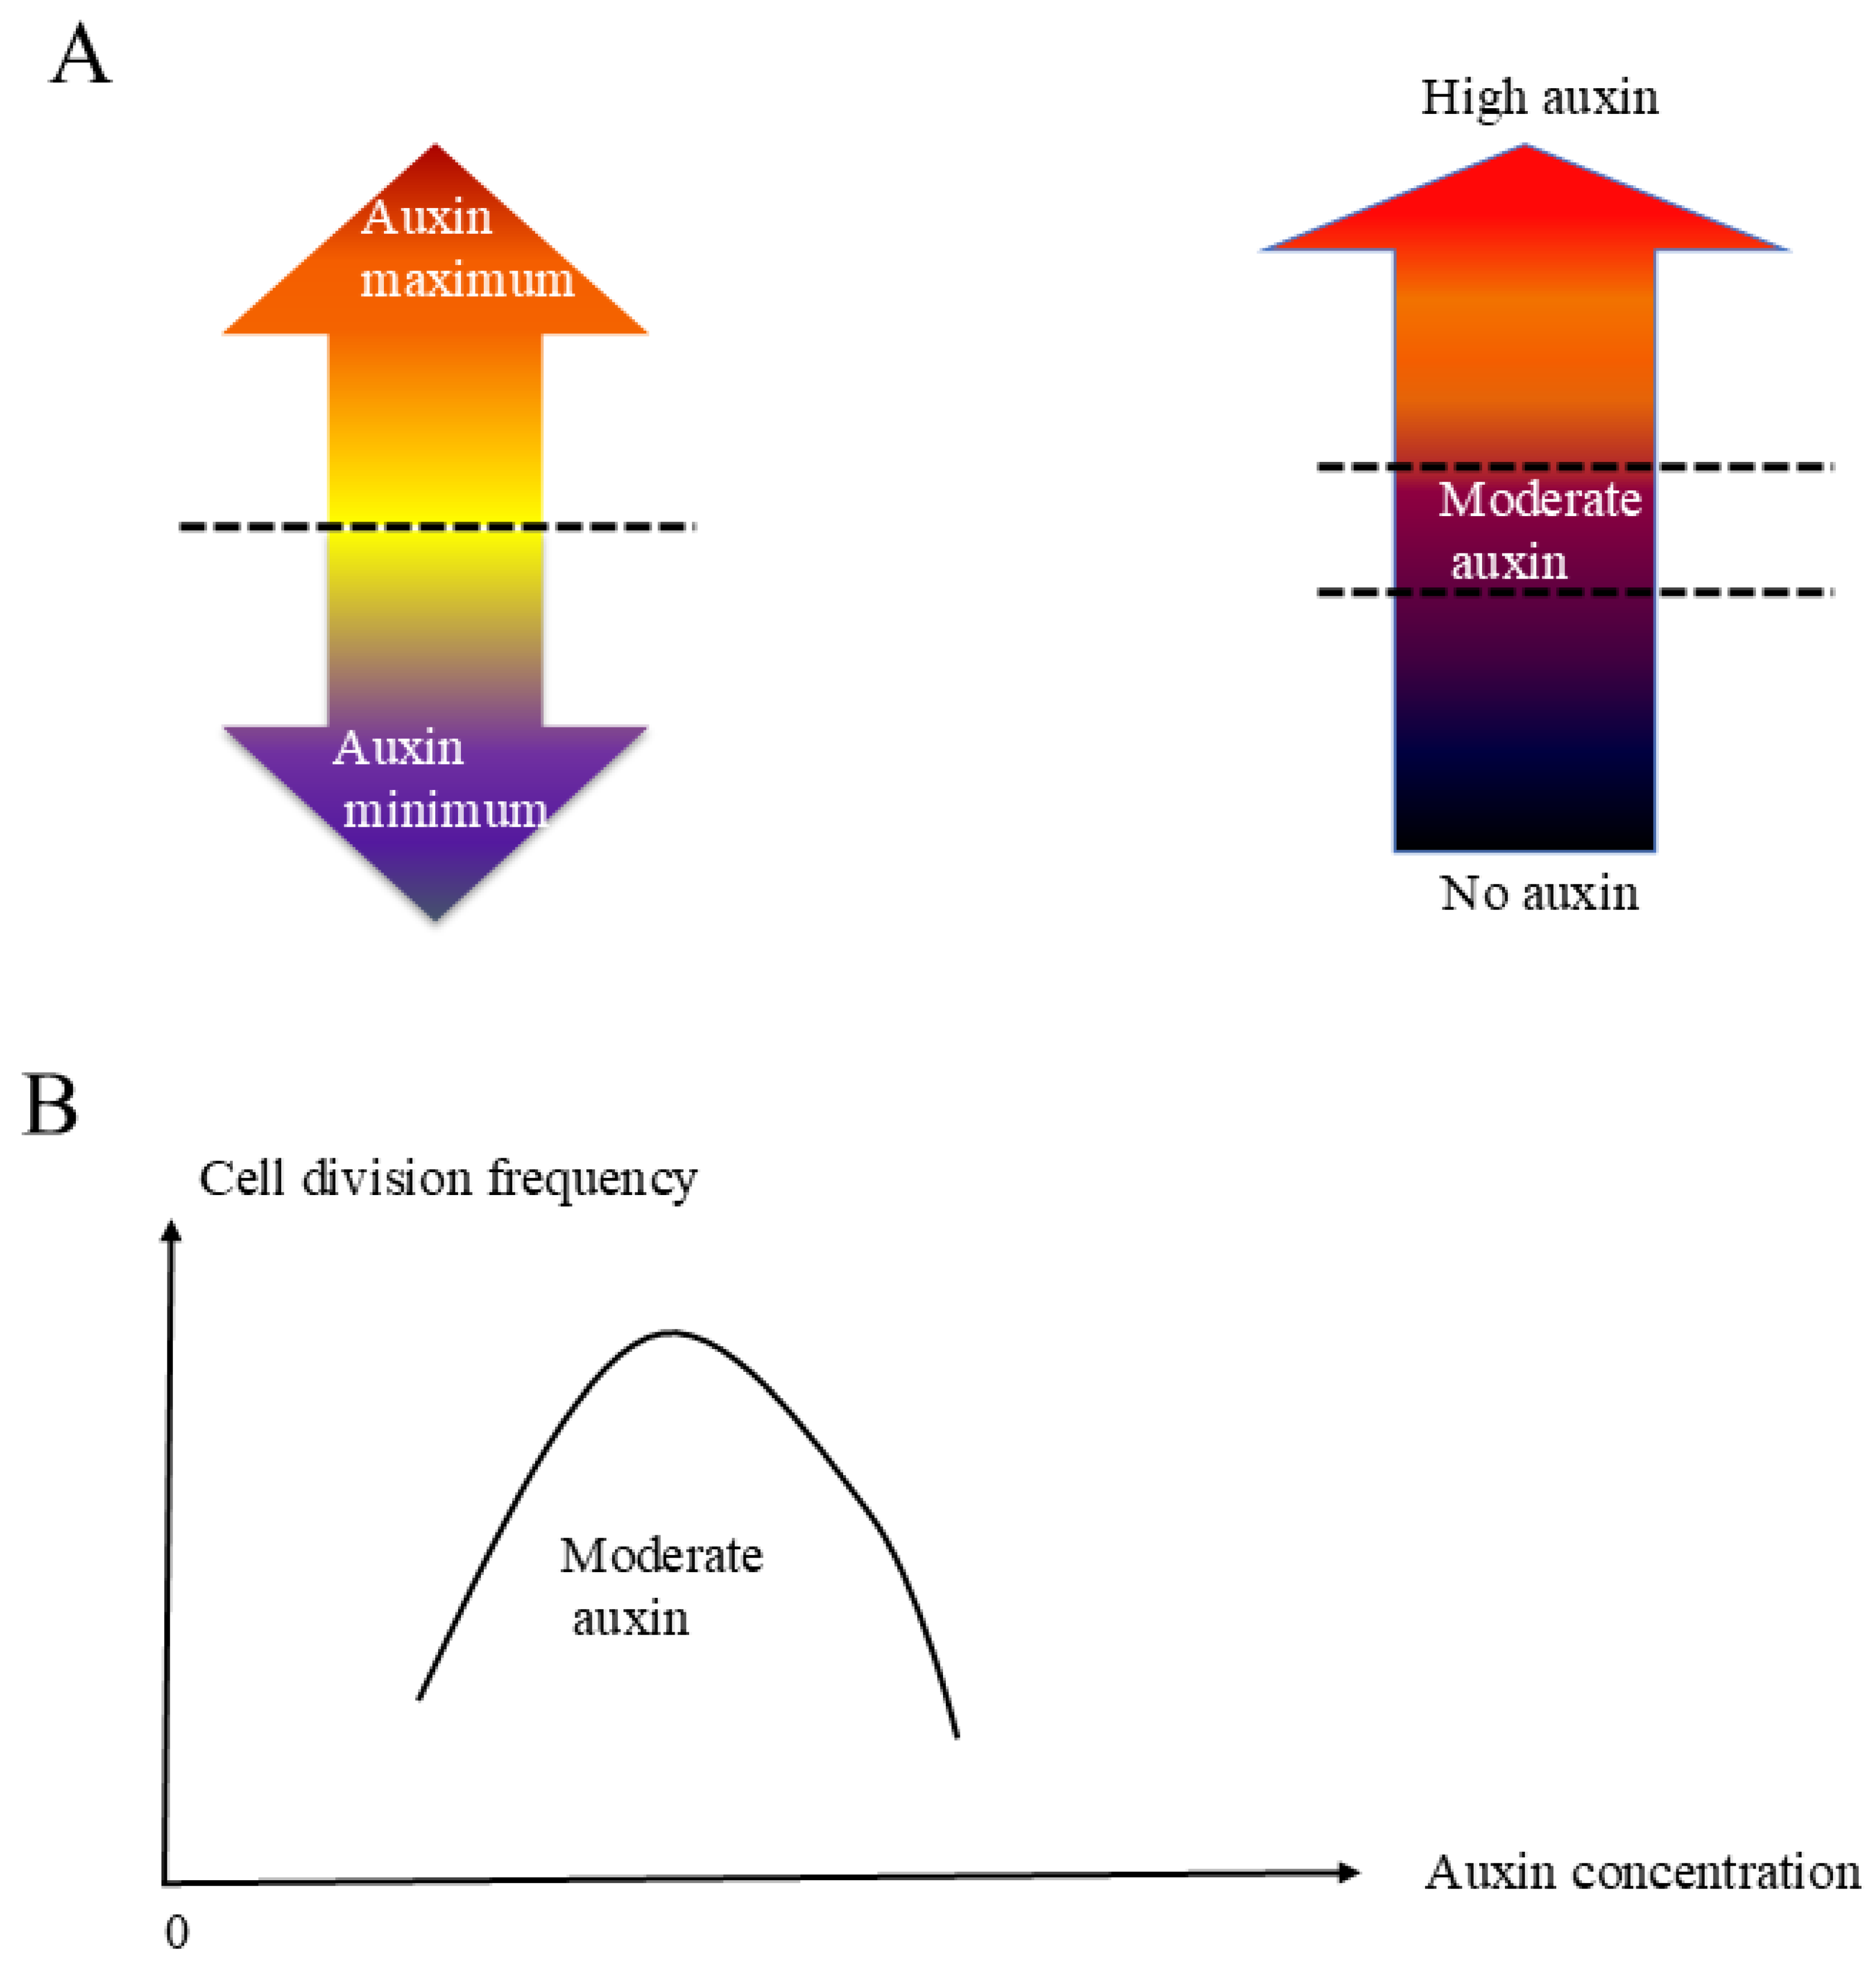
As Figure 3A shows, gradient of auxin response is formed over cotyledon surface with pronounced accumulation of signal along margin cells by 2 dag. Thus, it is reasonable to assume that increased auxin evokes the cell division after 2 dag. Interestingly, exogenously applied low concentration NAA promotes cell division while high concentration NAA application inhibits cell division. These data suggests that a moderate auxin concentration is necessary for margin cells to transit from “elongation” phase to the “elongation and division” phase, and higher or lower concentration of auxin out of that range keeps cells to be elongated. Auxin concentration is controlled by auxin biosynthesis, auxin transport and auxin degradation. Since our data was obtained from exogenously applied auxin, exact concentration range of auxin to induce margin cell division is currently unclear. Further experiments such as characterizing development of margin cells in auxin synthesis mutant lines or testing the effect of blocking auxin transportation or inhibiting auxin degradation will be done in the future. Different from previous hypothesis that the auxin maximum or auxin minimum triggers the developmental switch[41], our work suggested that an appropriate moderate auxin concentration triggers the transition of margin cells from the cell elongation to the cell division. Thus, we would like to introduce a new “moderate auxin concentration model”, which proposes the existence of mechanisms to achieve switching of developmental program specifically by a certain auxin concentration range. The major differences between the auxin maximum or minimum model and the moderate auxin concentration model are summarized in Figure 6A. Auxin maximum or minimum model emphasizes that achieving high or low auxin concentration works as a trigger to developmental regulation. The moderate auxin concentration model proposes that there is a moderate range for auxin to trigger developmental regulation. Too high or too low auxin concentration will not trigger the relevant developmental regulation (Figure 6B). It is possible that the reported auxin minimum is actually a moderate auxin concentration instead of minimum auxin concentration since the auxin markers used in those studies, DR5-GFP or DII-VENUS are both based on TIR mediated auxin response expected to reflect only certain range of high auxin concentration. To confirm this idea, a new auxin marker to detect low auxin concentration at a few nM range need to be developed and investigated in each developmental context where auxin minimum is reported to be playing important role. Experiments using auxin inducible lines and auxin markers in auxin biosynthesis mutants to control auxin concentration artificially should be done. Plant development is complicated, and auxin concentration is not the only factor determines margin cells fate. It is reported that cytokinin and brassinosteroid can affect cell elongation and cell division together with or without auxin as well [42,43]. Whether the two hormones also participate in the margin cell development and whether they have crosstalk with auxin need to be clarified in the future. Besides, cell division is a result from cell cycle. Whether the cell division increase triggered by moderate auxin concentration changes the expression of some key regulators in cell cycle, for example, translation elongation factor 2 (EF2) needs to be investigated in the future studies [44].
Materials and Methods
Plant Materials and Growth Conditions
All Arabidopsis mutants and transgenic plants used in this work are in the Col-0 background. The bam1-3 mutant is described in DeYoung et al., 2006 [45]. The wox1prs2 double mutant is described in Nakata et al., 2012 [9]. The seeds are kindly offered by Prof. Kiyotaka Okada. wox1-101 and prs-2 single mutant is generated through crossing. bam1 DR5-GFP is generated through crossing. bam1 bam2 bam3 is from Dr, Rosa Lozano-Duran. The promoter sequences of BAM1 and WOX1 were amplified by PCR and cloned into a pBGYN vector described in Kubo et cl, 2005 [46].
Arabidopsis seeds were surface-sterilized in 10% NaClO and 0.1% triton for 30 seconds and rinsed with sterile water for 1 minute, repeating 4 times. Then seeds were placed at 4℃ for 4 days. Afterwards, we placed the seeds on 1/2 MS nutrient medium (Murashige and Skoog salts with 1% w/v of sucrose, PH = 5.8, adjusted by KOH) plates with 0.8% (w/v) agar. The plates were then transferred to growth condition with 16-hour light/8-hour dark cycles, 22℃ and relative humidity of 40%.
RNA Extraction and qRT-PCR
Total RNA was extracted from Col-0 and bam1-3seedlings at 1.5 dag using ‘RNeasy Plant Mini Kit’ supplied by QIAGEN. 1µg total RNA of each sample was used for synthesizing cDNA using ‘TransScript II One-Step gDNA Removal and cDNA Synthesis SuperMix’ from Transgene company. The primers used for quantitative RT-PCR are shown in Supplementary information, Table S1.
mPS-PI Staining
Whole seedlings were fixed in 2 ml of an aged solution of ethanol:acetic acid (3:1) (stored for a minimum of 4 months at 4°C), and then put under vacuum for 30 minutes and left on a shaker at 4°C for 2 days. The following steps are the same as described in Wuyts et cl, 2010 [32].
EdU Labelling Assay
Whole seedlings without any damage were cultured in 1 ml 1/2 MS liquid medium containing 1% (w/v) sucrose in growth condition with 10 μM EdU for 45 minutes followed by 8 hours MS liquid medium culture without EdU. Fixation and cocktail treatment were done as described in Yin and Tsukaya, 2016 [34].
Microscopy
Leica TCS SP8 confocal microscope was used for acquiring the images. PI was excited with a 561 nm solid-state laser, 10% laser power and emission was detected at bandwidths of 570-620 nm. Z-stack was applied for each sample and the step size was set as 2 μm. For GFP, excitation was achieved by 488 nm from Argon laser, 40% laser power and emission was set at 500-550 nm. For DAPI, excitation was achieved by 405 nm solid-state laser, 10% laser power and emission was set at 415-450 nm.
Author Contributions
Y. J and S. N. designed research. Y. J, C.W, J.L, T. L and S. N. conducted experiments. Y. J, Y. K and S. N. analyzed data. All authors contributed in writing paper.
Acknowledgments
We thank Hong Zhu at Center for Excellence in Molecular Plant Science, Shanghai for technical assistance. Y. K. was supported by the National Natural Science Foundation in China (31572073 and 31772246), Chinese Academy of Sciences Hundred Talents Program (173176001000162114), Chinese Academy of Sciences, Shanghai Center for Plant Stress Biology, CAS Center of Excellence for Molecular Plant Sciences, and JSPS KAKENHI. S.N. was supported by Shanghai Center for Plant Stress Biology.
Conflicts of Interest
Authors have no conflict of interests.
References
- Qian, P., S. Hou, and G. Guo, Molecular mechanisms controlling pavement cell shape in Arabidopsis leaves. Plant Cell Rep 2009, 28, 1147–57. [CrossRef] [PubMed]
- Tsukaya, H. Leaf development. Arabidopsis Book 2013, 11, e0163. [Google Scholar] [CrossRef] [PubMed]
- Nakata, M. and K. Okada. The Leaf Adaxial-Abaxial Boundary and Lamina Growth. Plants (Basel) 2013, 2, 174–202. [Google Scholar] [CrossRef]
- Kasprzewska, A.; et al. Auxin influx importers modulate serration along the leaf margin. Plant J 2015, 83, 705–18. [Google Scholar] [CrossRef]
- Bilsborough, G.D.; et al. Model for the regulation of Arabidopsis thaliana leaf margin development. Proc Natl Acad Sci U S A 2011, 108, 3424–9. [Google Scholar] [CrossRef]
- Horstman, A.; et al. AIL and HDG proteins act antagonistically to control cell proliferation. Development 2015, 142, 454–64. [Google Scholar] [CrossRef] [PubMed]
- Dolzblasz, A.; et al. Stem Cell Regulation by Arabidopsis WOX Genes. Mol Plant 2016, 9, 1028–39. [Google Scholar] [CrossRef]
- Xu, L.; et al. WOX1 controls leaf serration development via temporally restricting BRASSINAZOLE RESISTANT 1 and CUP SHAPED COTYLEDON 3 expression in Arabidopsis. Journal of Experimental Botany 2025, 76, 478–492. [Google Scholar] [CrossRef] [PubMed]
- Nakata, M.; et al. Roles of the middle domain-specific WUSCHEL-RELATED HOMEOBOX genes in early development of leaves in Arabidopsis. Plant Cell 2012, 24, 519–35. [Google Scholar] [CrossRef]
- Guan, C.; et al. Spatial Auxin Signaling Controls Leaf Flattening. Curr Biol 2017, 27, 2940–2950.e4. [Google Scholar] [CrossRef]
- Tadege, M.; et al. STENOFOLIA regulates blade outgrowth and leaf vascular patterning in Medicago truncatula and Nicotiana sylvestris. Plant Cell 2011, 23, 2125–42. [Google Scholar] [CrossRef]
- Yoshikawa, T.; et al. Barley NARROW LEAFED DWARF1 encoding a WUSCHEL-RELATED HOMEOBOX 3 (WOX3) regulates the marginal development of lateral organs. Breed Sci 2016, 66, 416–24. [Google Scholar] [CrossRef] [PubMed]
- Johnson, K.L. and G.C. Ingram. Sending the right signals: regulating receptor kinase activity. Curr Opin Plant Biol 2005, 8, 648–56. [Google Scholar] [CrossRef] [PubMed]
- Shiu, S.H. and A.B. Bleecker. Plant receptor-like kinase gene family : diversity, function, and signaling. Sci STKE 2001, 2001. [Google Scholar] [CrossRef]
- Miwa, H.; et al. Plant meristems: CLAVATA3/ESR-related signaling in the shoot apical meristem and the root apical meristem. J Plant Res 2009, 122, 31–9. [Google Scholar] [CrossRef] [PubMed]
- Rojo, E.; et al. CLV3 Is Localized to the Extracellular Space, Where It Activates the Arabidopsis CLAVATA Stem Cell Signaling Pathway. Plant Cell 2002, 14, 969–77. [Google Scholar] [CrossRef]
- Yamaguchi, Y.L., T. Ishida, and S. Sawa, CLE peptides and their signaling pathways in plant development. J Exp Bot 2016, 67, 4813–26. [CrossRef]
- Shinohara, H. and Y. Matsubayashi. Reevaluation of the CLV3-receptor interaction in the shoot apical meristem: dissection of the CLV3 signaling pathway from a direct ligand-binding point of view. Plant J 2015, 82, 328–36. [Google Scholar] [CrossRef]
- Somssich, M.; et al. CLAVATA-WUSCHEL signaling in the shoot meristem. Development 2016, 143, 3238–48. [Google Scholar] [CrossRef]
- Meng, W.J.; et al. Type-B ARABIDOPSIS RESPONSE REGULATORs Specify the Shoot Stem Cell Niche by Dual Regulation of WUSCHEL. Plant Cell 2017, 29, 1357–1372. [Google Scholar] [CrossRef]
- Chickarmanea, V.S.; et al. Cytokinin signaling as a positional cue for patterning the apical-basal axis of the growing Arabidopsis shoot meristem. Proc Natl Acad Sci U S A 2012, 109, 4002–7. [Google Scholar] [CrossRef] [PubMed]
- Liu, X.; et al. AUXIN RESPONSE FACTOR 3 integrates the functions of AGAMOUS and APETALA2 in floral meristem determinacy. Plant J 2014, 80, 629–41. [Google Scholar] [CrossRef] [PubMed]
- Asnacios, A. and O. Hamant. The mechanics behind cell polarity. Trends Cell Biol 2012, 22, 584–91. [Google Scholar] [CrossRef] [PubMed]
- Ikeda, Y.; et al. Local auxin biosynthesis modulates gradient-directed planar polarity in Arabidopsis. Nat Cell Biol 2009, 11, 731–8. [Google Scholar] [CrossRef]
- Gomes, G.L.B., K.C. Scortecci. Auxin and its role in plant development: structure, signalling, regulation and response mechanisms. Plant Biology 2021, 23, 894–904. [Google Scholar] [CrossRef]
- Qi, J.; et al. Auxin depletion from leaf primordia contributes to organ patterning. Proc Natl Acad Sci U S A 2014, 111, 18769–74. [Google Scholar] [CrossRef] [PubMed]
- Sorefan, K.; et al. A regulated auxin minimum is required for seed dispersal in Arabidopsis. Nature 2009, 459, 583–86. [Google Scholar] [CrossRef]
- Di Mambro, R.; et al. Auxin minimum triggers the developmental switch from cell division to cell differentiation in the Arabidopsis root. Proc Natl Acad Sci U S A 2017, 114, E7641–E7649. [Google Scholar] [CrossRef]
- Runions, A., M. Tsiantis, and P. Prusinkiewicz, A common developmental program can produce diverse leaf shapes. New Phytol 2017. [CrossRef]
- Reinhardt, B.; et al. Restoration of DWF4 expression to the leaf margin of a dwf4 mutant is sufficient to restore leaf shape but not size: the role of the margin in leaf development. Plant J 2007, 52, 1094–104. [Google Scholar] [CrossRef]
- Alvarez, J.P.; et al. Active suppression of a leaf meristem orchestrates determinate leaf growth. Elife 2016, 5. [Google Scholar] [CrossRef] [PubMed]
- Wuyts, N.; et al. High-contrast three-dimensional imaging of the Arabidopsis leaf enables the analysis of cell dimensions in the epidermis and mesophyll. Plant Methods 2010, 6, 17. [Google Scholar] [CrossRef] [PubMed]
- Rosas-Diaz, T.; et al. A virus-targeted plant receptor-like kinase promotes cell-to-cell spread of RNAi. Proc Natl Acad Sci U S A 2018, 115, 1388–93. [Google Scholar] [CrossRef]
- Yin, X. and H. Tsukaya. A pulse-chase strategy for EdU labelling assay is able to rapidly quantify cell division orientation. New Phytol 2016, 211, 1462–9. [Google Scholar] [CrossRef]
- Strader, L.S. and Y. Zhao. Auxin perception and downstream events. Current Opinion in Plant Biology 2016, 33, 8–14. [Google Scholar] [CrossRef] [PubMed]
- Pan, X., J. Chen, and Z. Yang, Auxin regulation of cell polarity in plants. Curr Opin Plant Biol 2015, 28, 144–53. [CrossRef]
- Teale, W.D., I.A. Paponov, and K. Palme, Auxin in action: signalling, transport and the control of plant growth and development. Nat Rev Mol Cell Biol 2006, 7, 847–59. [CrossRef]
- Costanzo, E., C. Trehin, and M. Vandenbussche, The role of WOX genes in flower development. Ann Bot 2014, 114, 1545–53. [CrossRef]
- Breuninger, H.; et al. Differential expression of WOX genes mediates apical-basal axis formation in the Arabidopsis embryo. Dev Cell 2008, 14, 867–76. [Google Scholar] [CrossRef]
- Zhang, F. and M. Tadege. Repression of AS2 by WOX family transcription factors is required for leaf development in Medicago and Arabidopsis. Plant Signal Behav 2015, 10, e993291. [Google Scholar] [CrossRef]
- Perrot-Rechenmann, C. Cellular Responses to Auxin: Division versus Expansion. Cold Spring Harbor Perspectives in Biology 2010, 2, a001446–a001446. [Google Scholar] [CrossRef] [PubMed]
- Gordon, S.P.; et al. Multiple feedback loops through cytokinin signaling control stem cell number within the Arabidopsis shoot meristem. Proc Natl Acad Sci U S A 2009, 106, 16529–34. [Google Scholar] [CrossRef] [PubMed]
- Wang, Z.; et al. Brassinosteroid Signaling Network and Regulation of Photomorphogenesis. Annu Rev Genet 2012, 46, 701–24. [Google Scholar] [CrossRef] [PubMed]
- Yagi, N.; et al. VAJ/GFA1/CLO is involved in the directional control of floral organ growth. Plant Cell Physiol 2009, 50, 515–27. [Google Scholar] [CrossRef]
- DeYoung, B.J.; et al. The CLAVATA1-related BAM1, BAM2 and BAM3 receptor kinase-like proteins are required for meristem function in Arabidopsis. Plant J 2006, 45, 1–16. [Google Scholar] [CrossRef]
- Kubo, M.; et al. Transcription switches for protoxylem and metaxylem vessel formation. Genes Dev 2005, 19, 1855–60. [Google Scholar] [CrossRef]
Figure 1.
Cell elongation of margin cells preceding cell division in wild type cotyledons during germination process. (A-C) Images of cotyledons with mPS-PI staining at 1 dag (A), 2 dag (B) and 3 dag (C) in Col. Maximum projection images of Z-stacks are showed in upper panel. Single slice of optimal sections of margin cells are showed in middle panel. Bottom panels show magnified images of middle panels (outlined in yellow boxes). White stars indicate margin cells. Bars = 50 μm. (D, E) Quantitative analysis of cell number (D) and cell length (E) of margin cells in (A-C). Cell lengths are measured by drawing straight line in longitudinal axis along a cell as indicated in the bottom left panel in (A). Data are presented as mean ± SD. Student’s t-tests were performed based on the differences of 2 dag to 1 dag and 3 dag to 2 dag (***p < 0.001, n = 16).
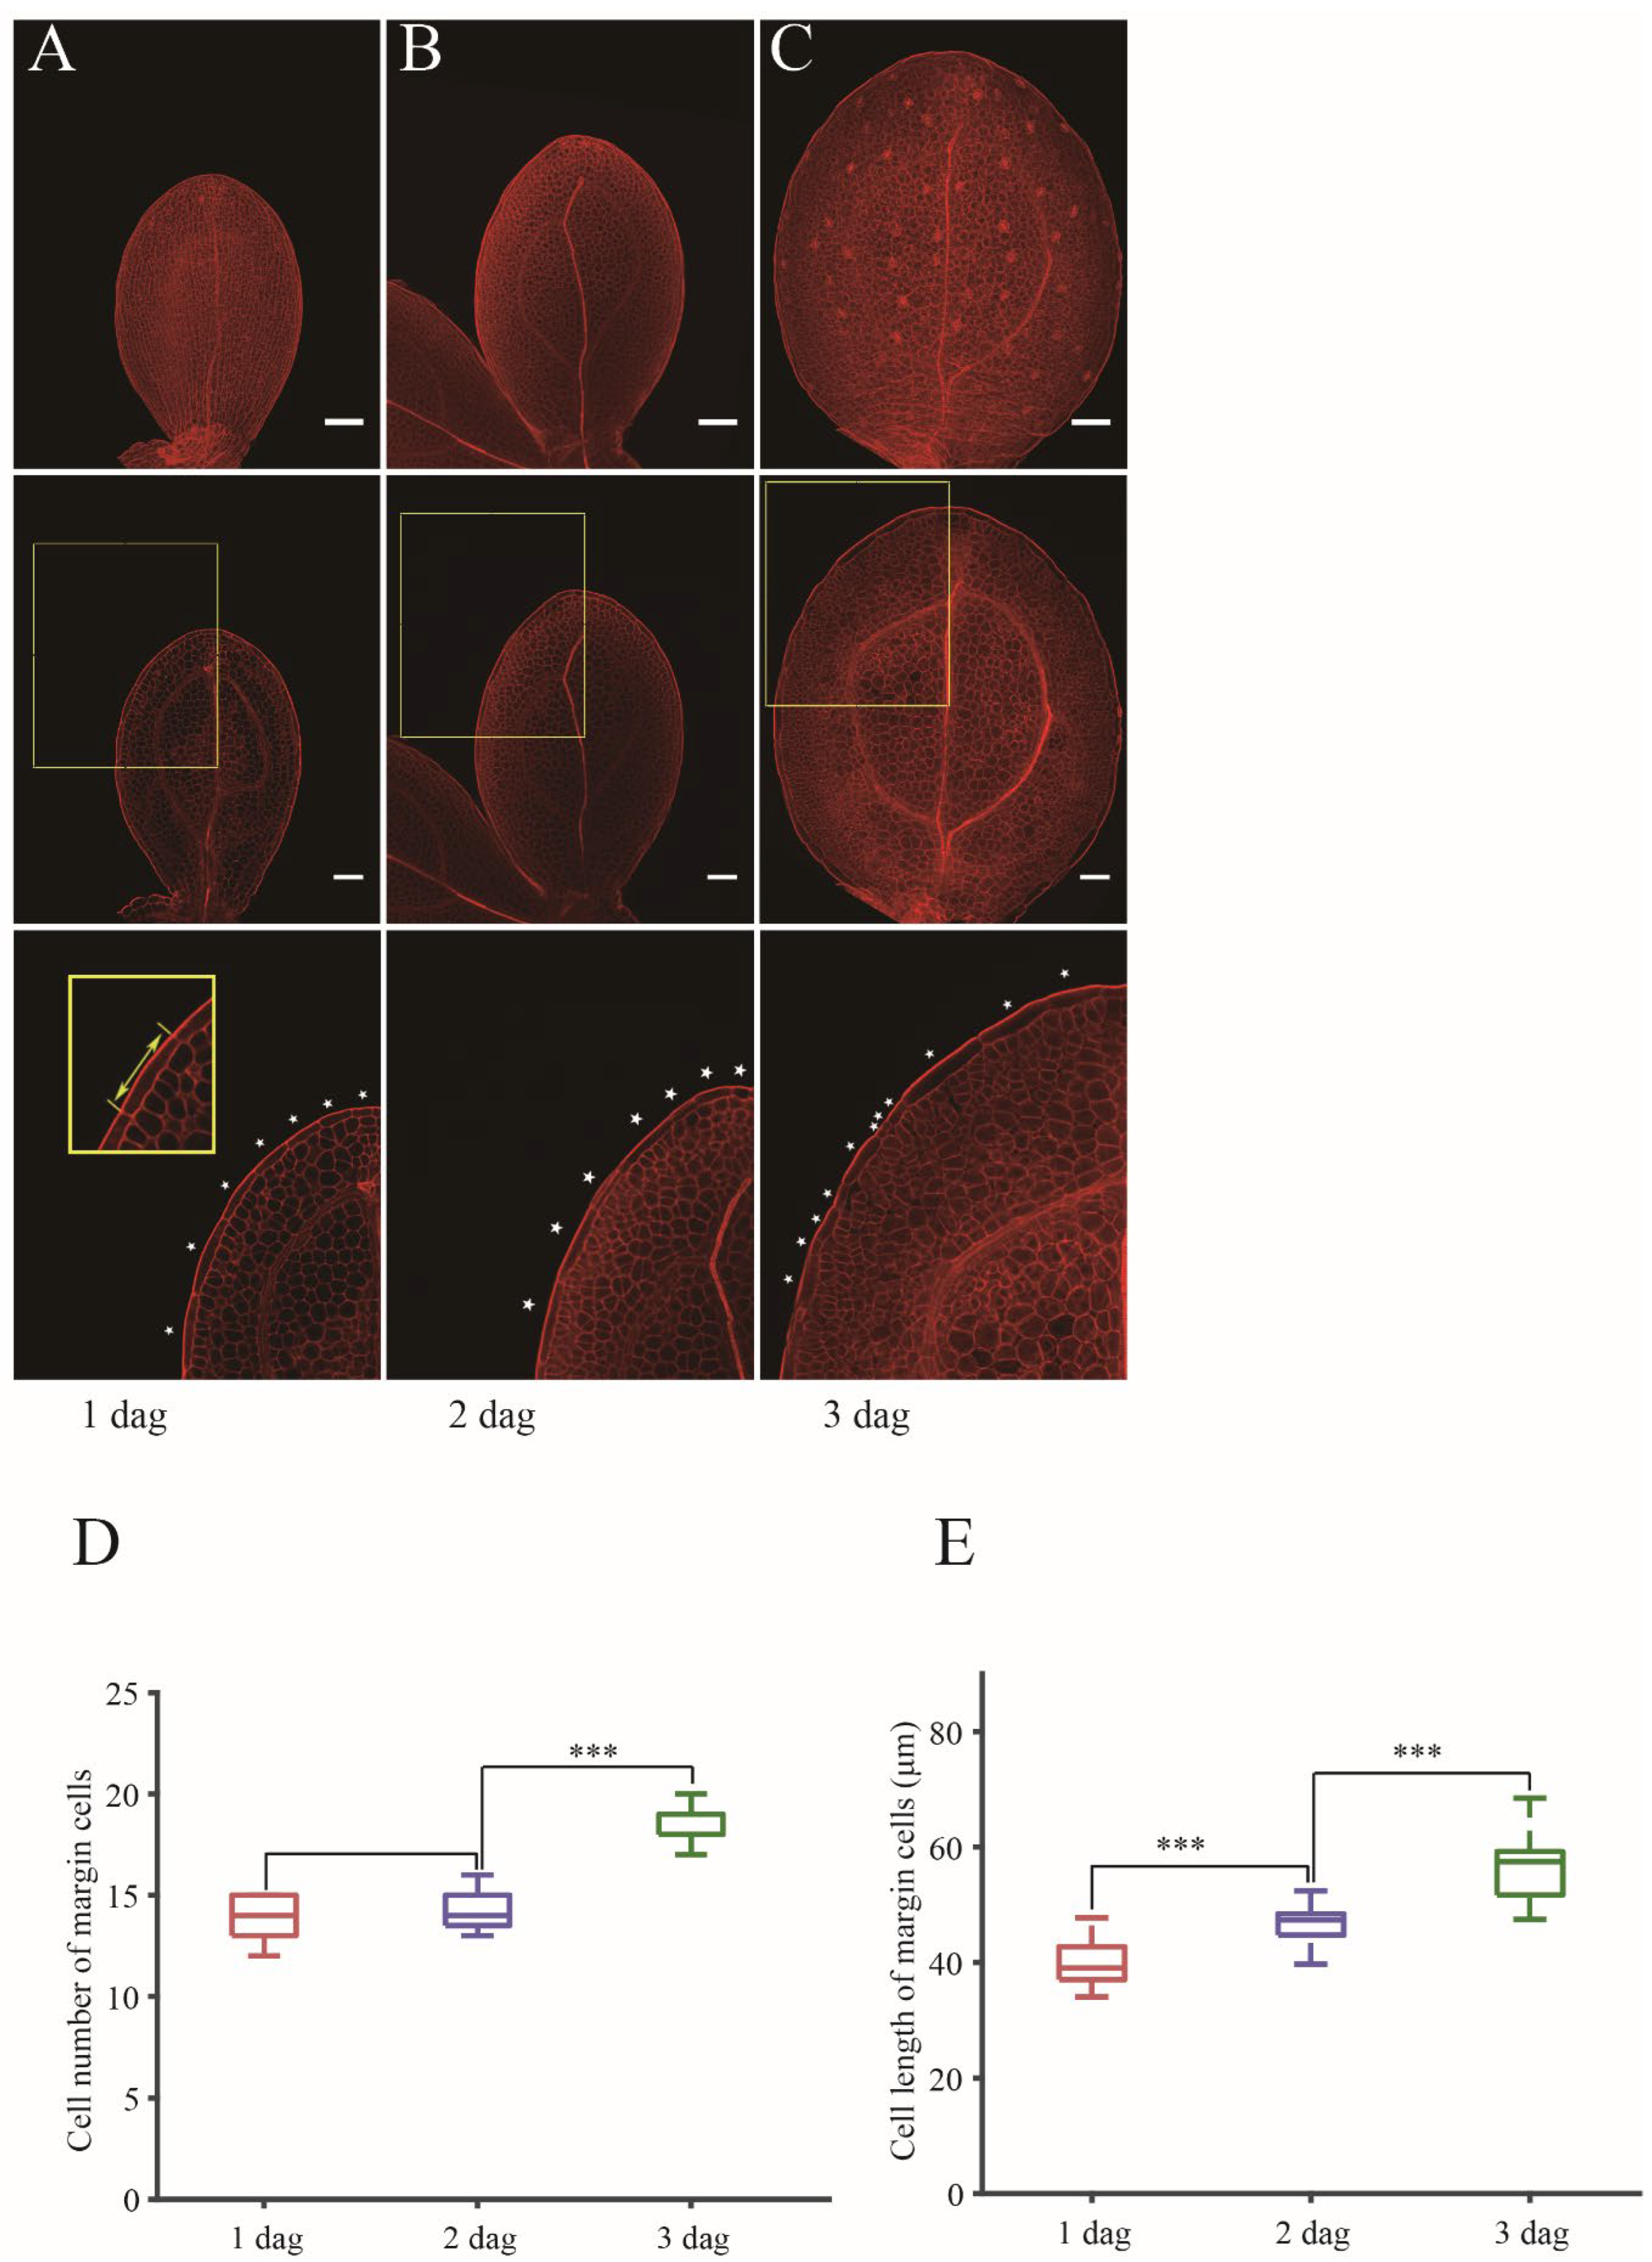
Figure 2.
BAM1 regulating margin cell developmental phase transition. (A-C) mPS-PI stained 2 dag cotyledons of Col (A), bam1-3 (B) and bam1, 2, 3 (C). Single optimal section of margin cells is showed in upper panel. Bottom panels show magnified images of upper panels (outlined in yellow boxes). White stars indicate margin cells. Bars = 50 μm. (D, E) Quantitative analysis of cell number (D) and cell length (E) of margin cells in Col, bam1-3 and bam1, 2, 3. Data are presented as mean ± SD. Student’s t-test was performed to assess significance of differences of between 2 dag to 1 dag and 3 dag to 2 dag in each group. The difference between each mutant line and Col was determined by two-way ANOVA. (*, ** and *** denote p < 0.05, p < 0.01 and p < 0.001, respectively. n = 8).
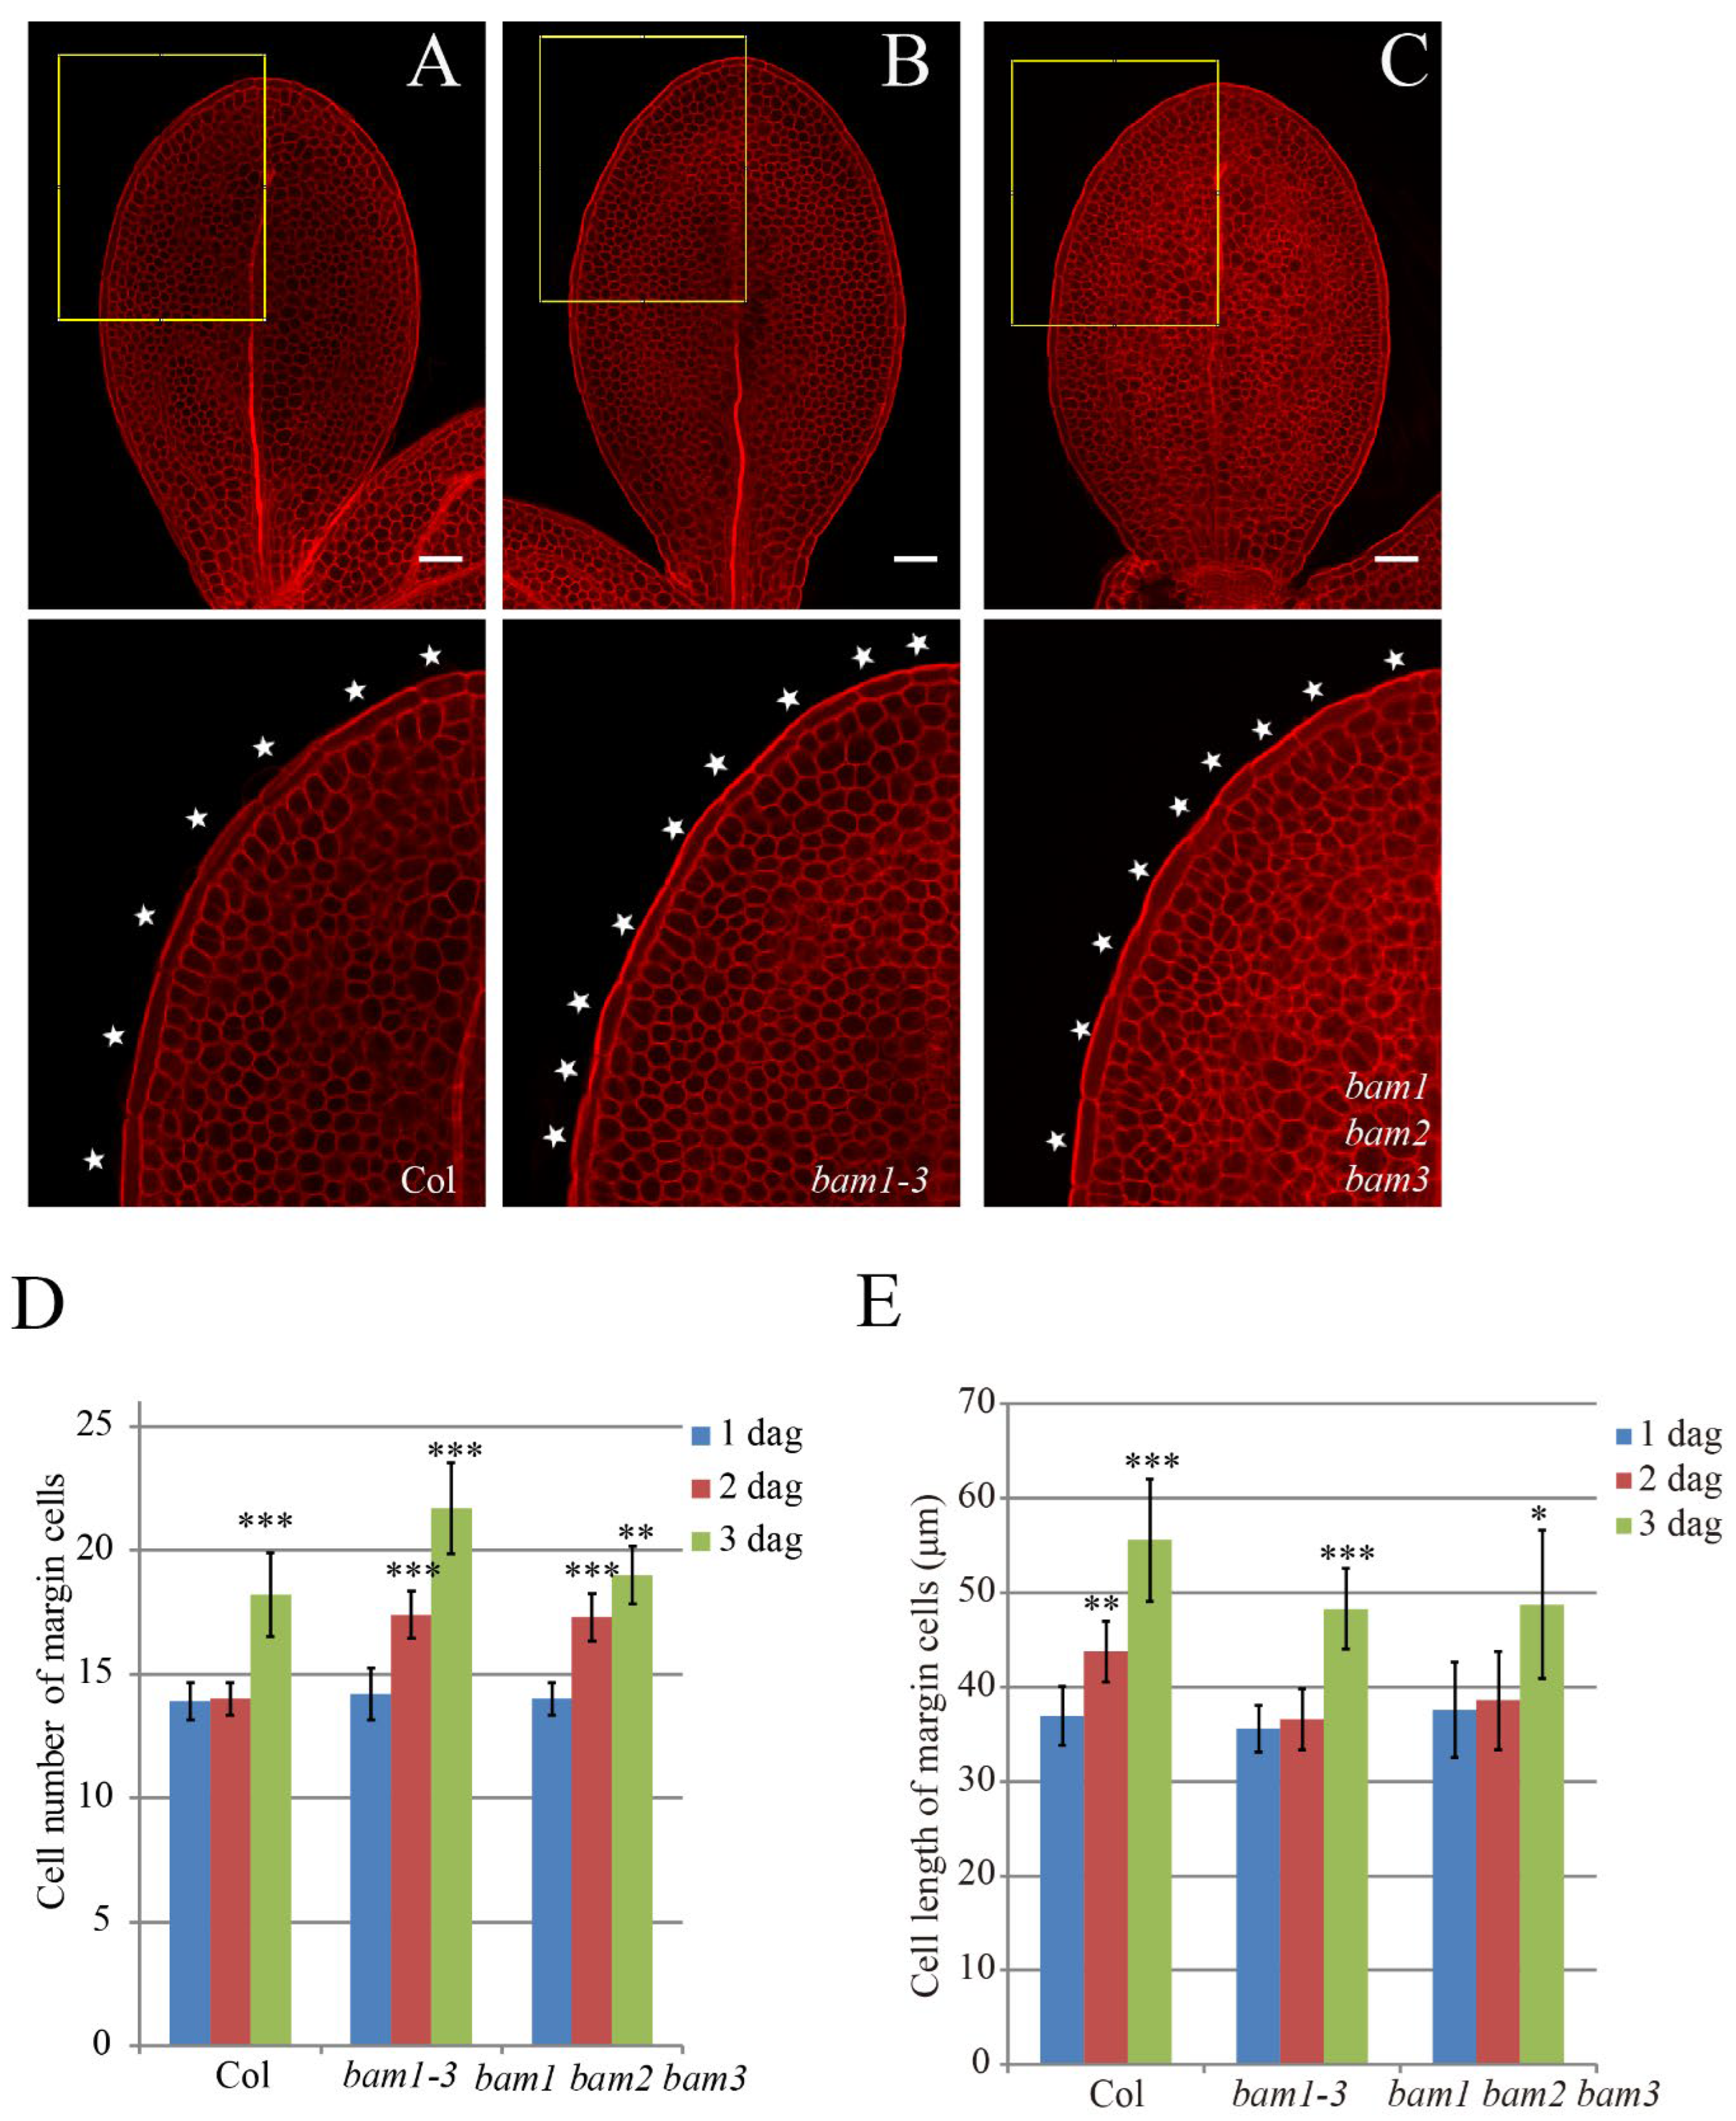
Figure 3.
Margin cells of bam1-3 mutant show abnormal accumulation of GFP signal from DR5-GFP. (A, B) DR5-GFP expression pattern in Col (A) and bam1-3 (B) cotyledons at early stage of germination. From left to right, 1 dag, 1.5 dag. 2 dag. Bars = 50 μm. Signal intensities are coded from violet to red corresponding to increasing intensity levels (see colour scale). (C) Mean ratio of DR5-GFP abundance at the margin cells versus other epidermal cells in Col and bam1-3 at 1.5 dag. n = 8 with 20 cells for each plants were analyzed. Error bars represent SD, P-value was calculated according to Student’s t-test. * denotes p < 0.05.
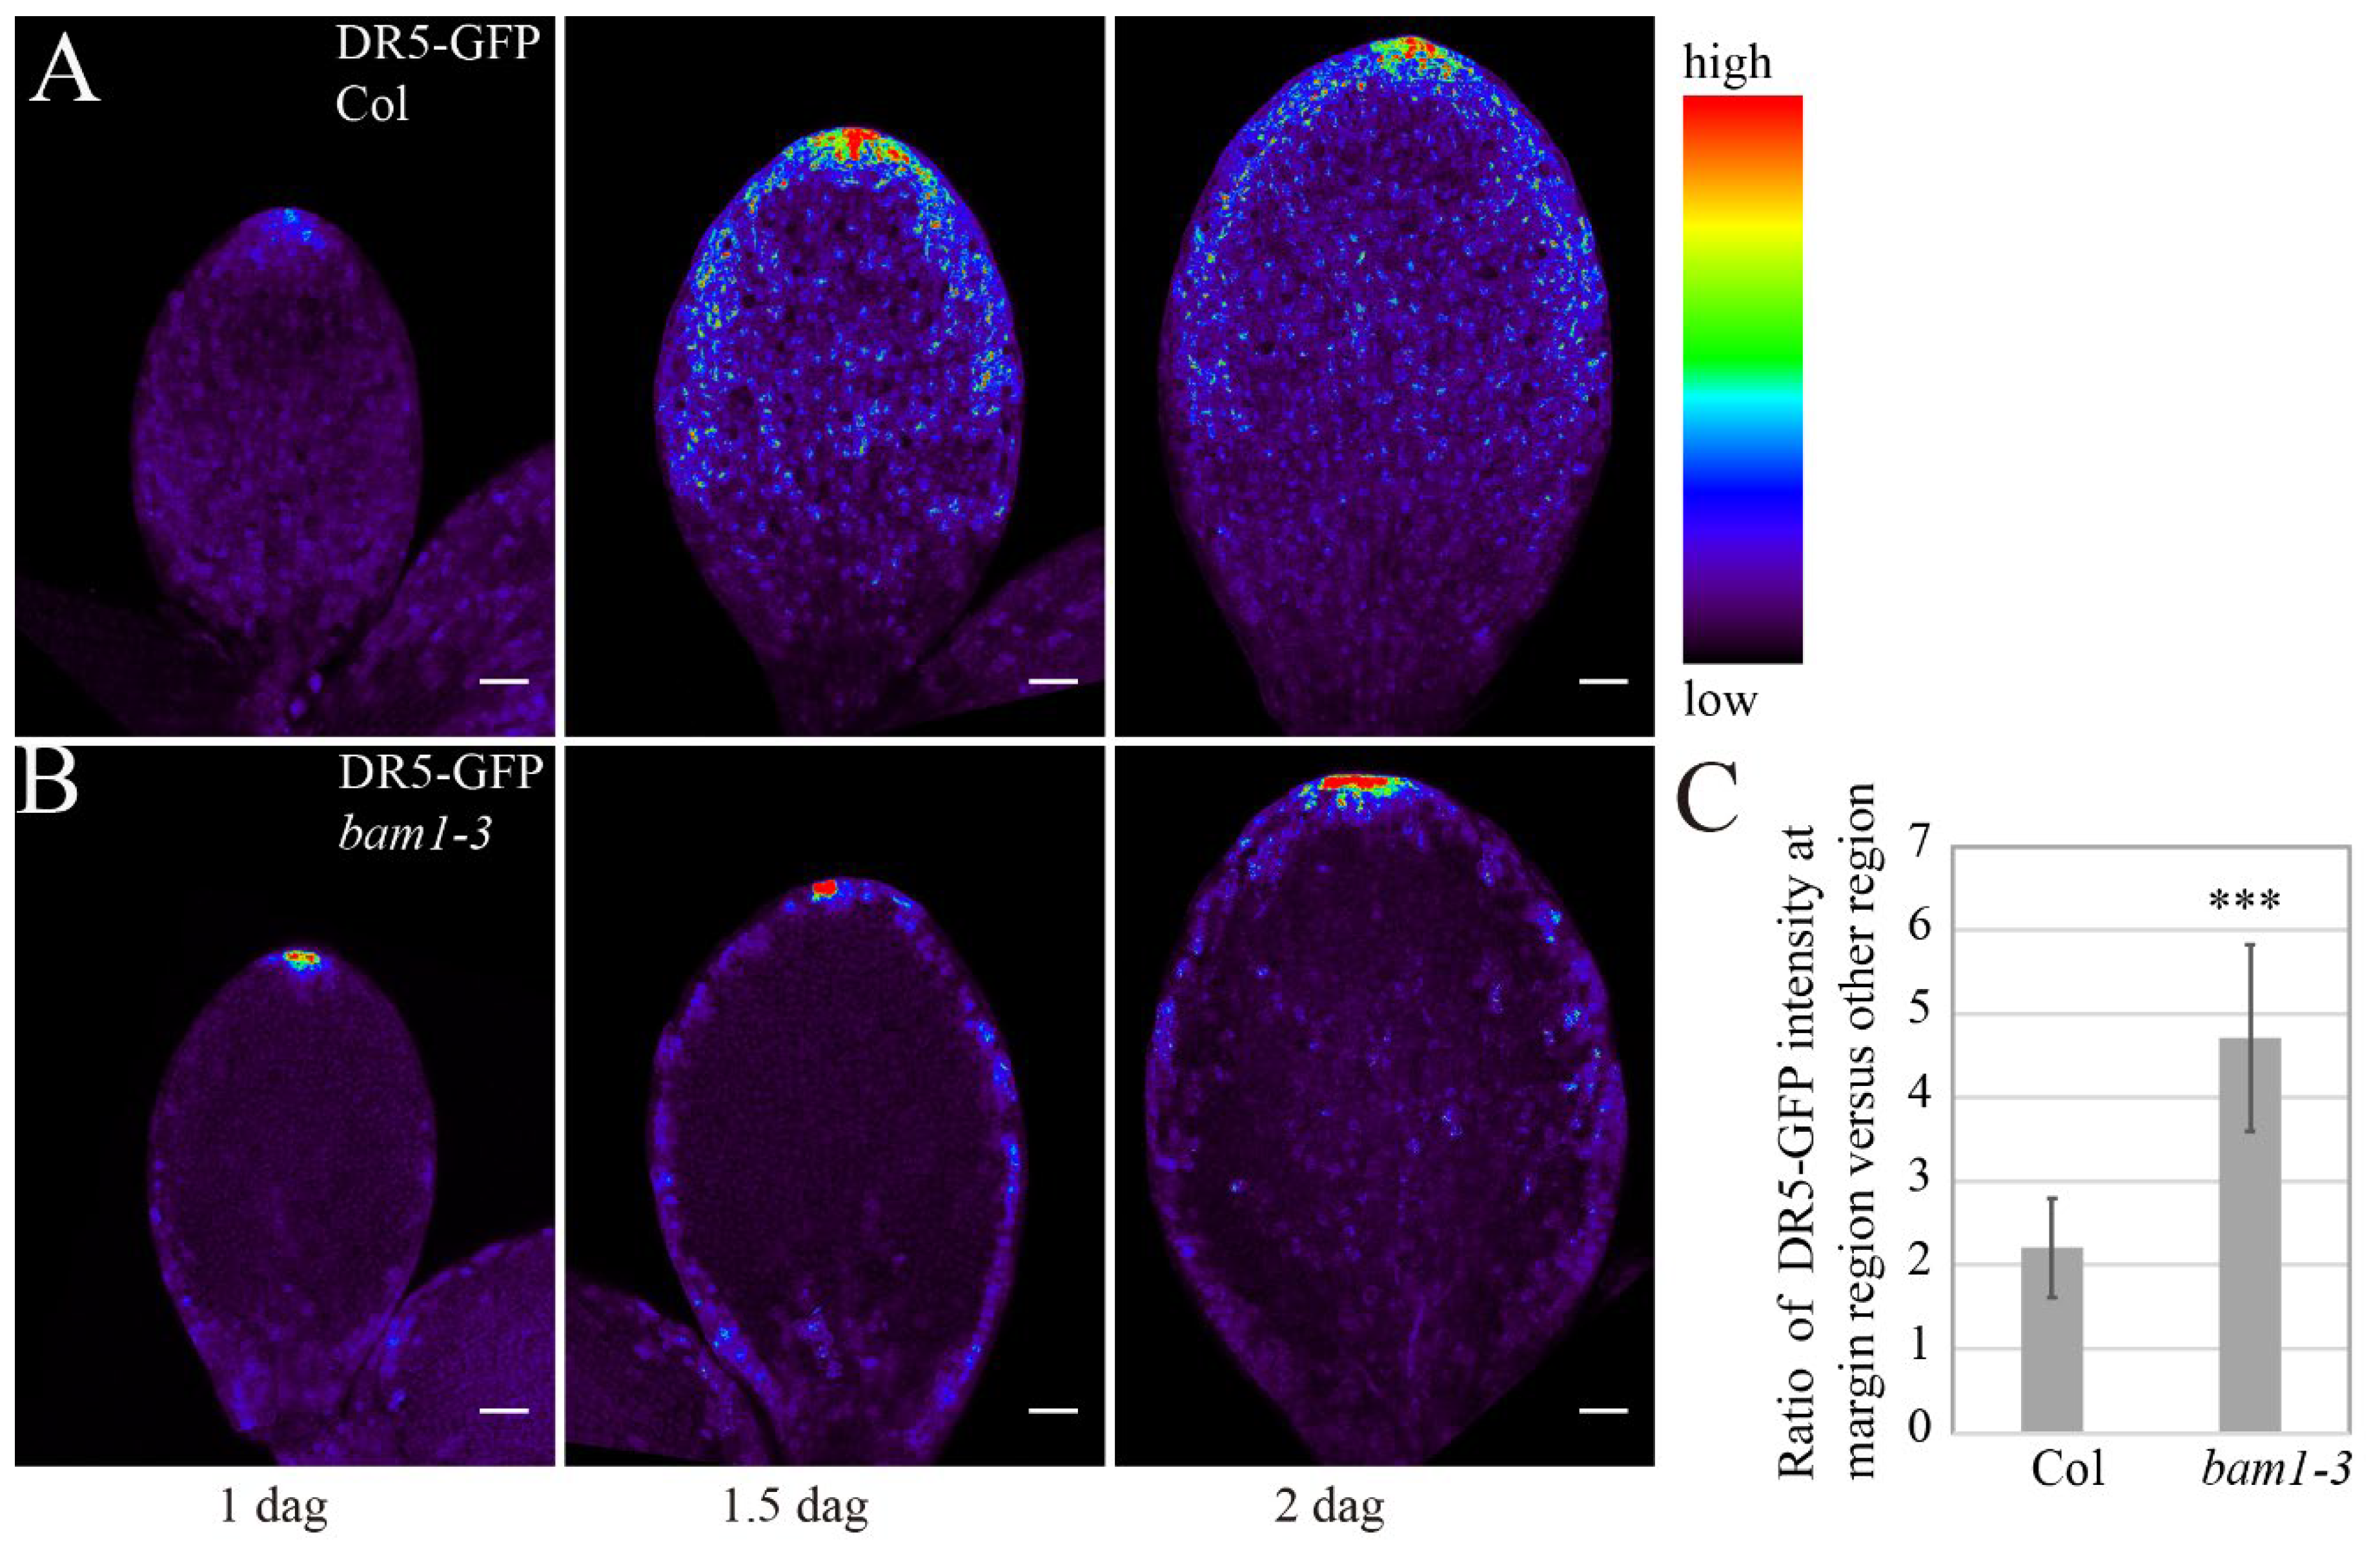
Figure 4.
The role of WOX in regulating margin cells development. (A-H) mPS-PI stained cotyledons in Col (A), wox1 prs (B), bam1-3 (C), wox1-101 (D), prs-2 (E), bam1 wox1 (F), bam1 prs (G) and bam1 wox1 prs (H) at 2 dag. Single slice of optimal sections of margin cells are showed in upper panel. Bottom panels show magnified images of upper panels (outlined in yellow boxes). White stars indicate margin cells. Bars = 50 μm. (I, J) Quantitative analysis of cell number (I) and cell length (J) of margin cells in Col and the mutants. Data are presented as mean ± SD. Student’s t-tests were performed to assess significance of based on the differences between of 2 dag to 1 dag and 3 dag to 2 dag in each group. The significance of differences between each mutant line and Col was assessed by two-way ANOVA. (*, ** and *** denote p < 0.05, p < 0.01 and p < 0.001, respectively. n = 8).
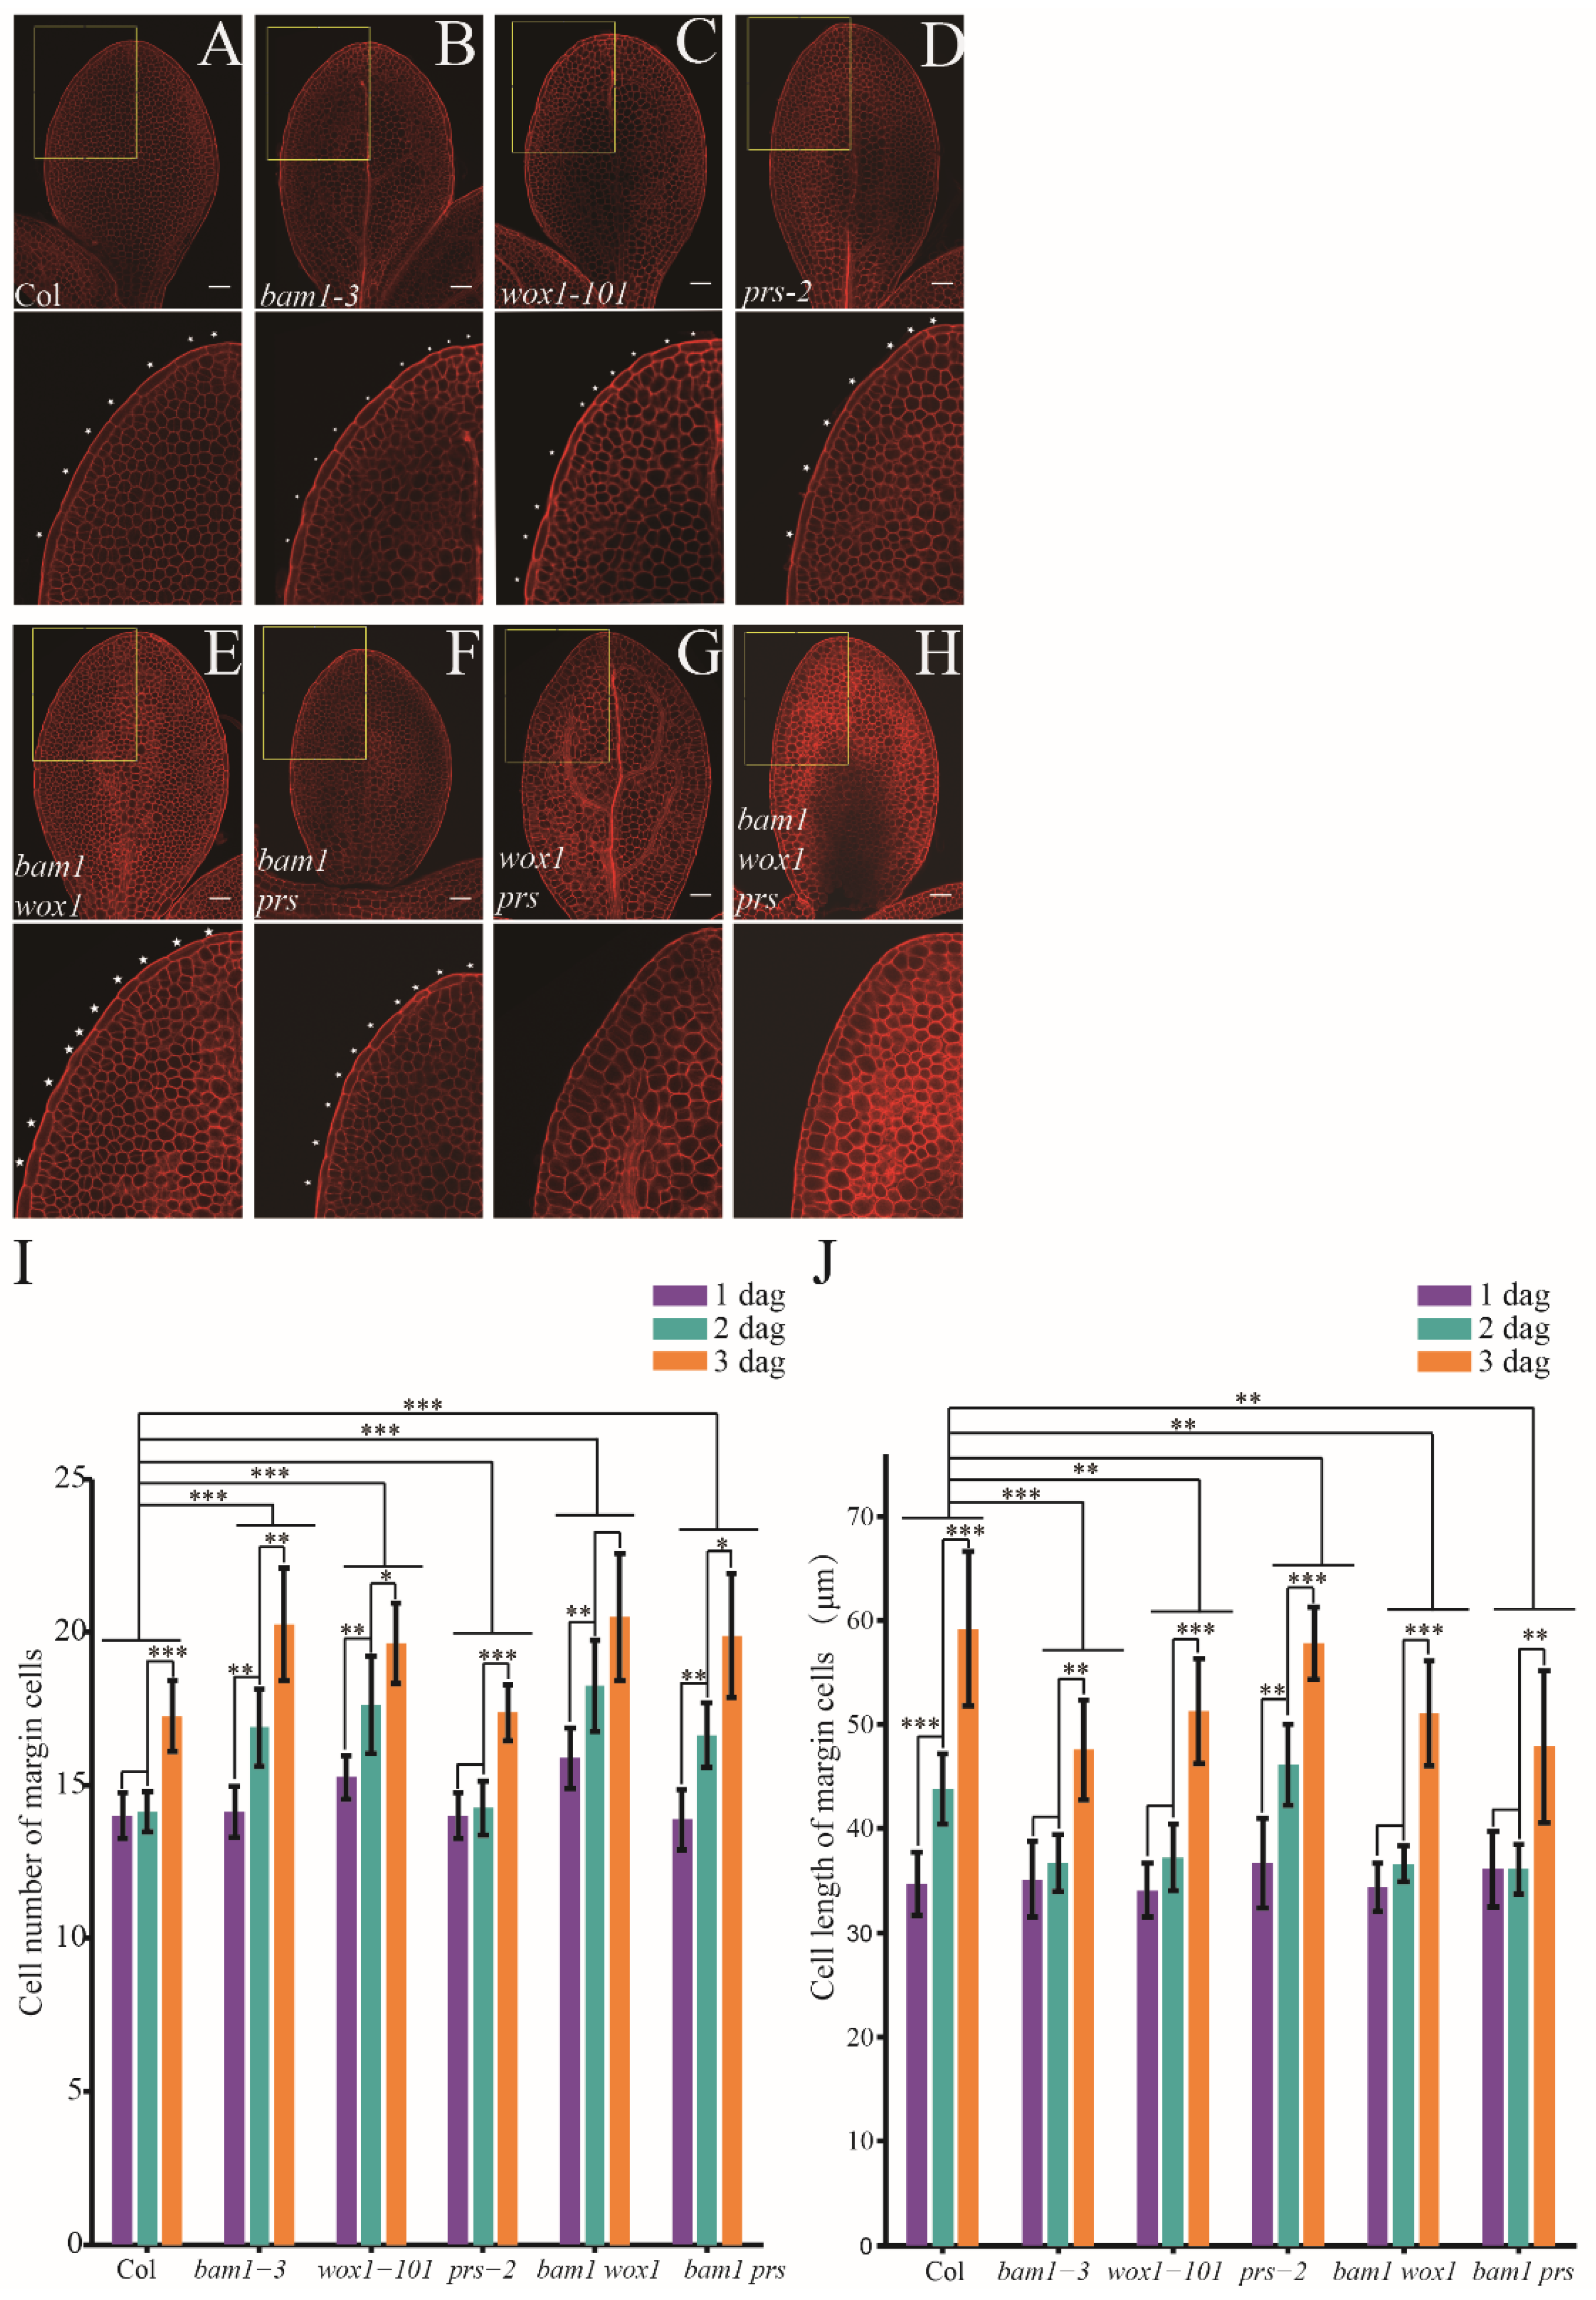
Figure 5.
BAM1 and WOX1 synergistically regulate margin cell development in mature embryo. (A-D) mPS-PI stained mature embryos of in Col (A), bam1-3 (B), wox1-101 (C) and bam1 wox1 (D). Maximum projection images of Z-stacks are showed in left panels. Single slices of optimal section of margin cells are showed in middle panels. Right panels show magnified images of middle panels (outlined in yellow boxes). Bars = 50 μm. (E, F) Quantitative analysis of cell number (E) and cell length (F) of margin cells in Col and the mutants. Data are presented as mean ± SD. Student’s t-tests were performed to assess significance of the differences between the mutant lines and Col (* p < 0.05, *** p < 0.001, n = 14).
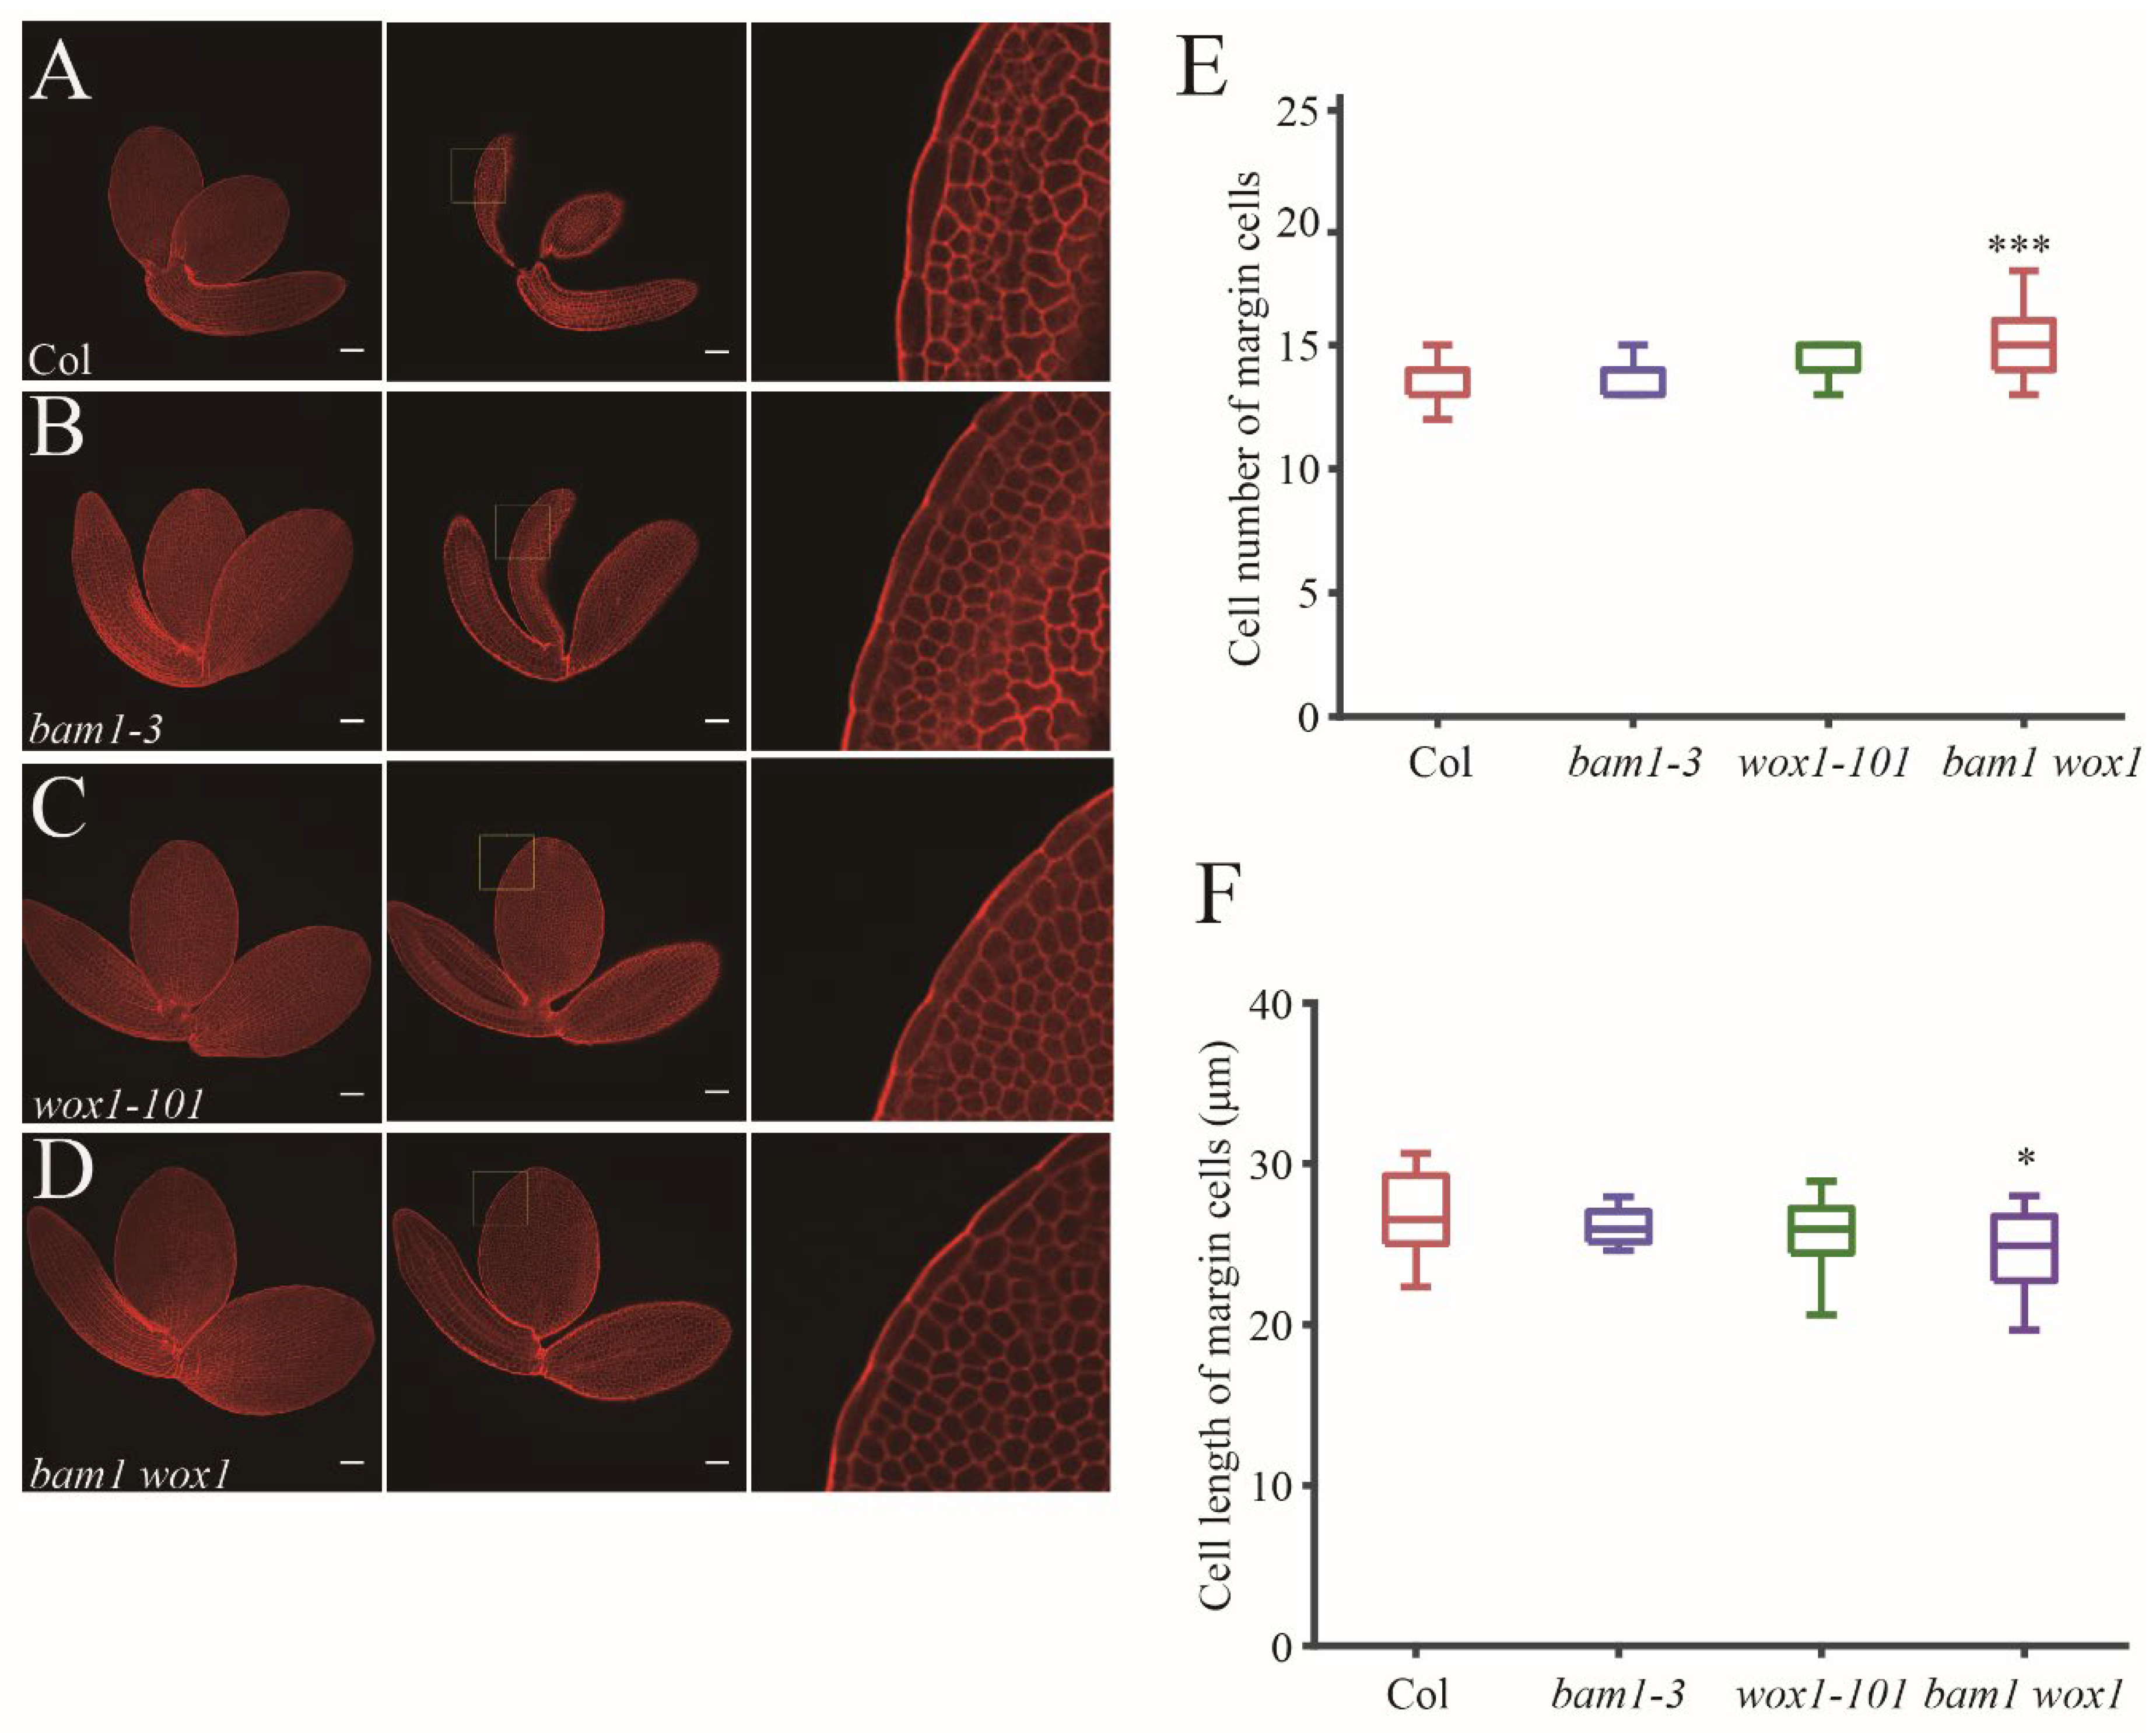
Figure 6.
A moderate auxin concentration model for cell division control in margin cells. (A) Basic description of auxin minimum model (left panel) and moderate auxin concentration model (right panel). (B) The relationship of auxin concentration and cell division frequency. Our data suggest that there is a moderate auxin concentration range which promotes margin cell division. In normal condition without exogenous auxin, this moderate auxin concentration showed up around 2 dag. However, if we treat the seedlings with low concentration exogenous auxin at 1.5 dag, the moderate auxin concentration will be achieved earlier and additional cell division happen at this stage.
Disclaimer/Publisher’s Note: The statements, opinions and data contained in all publications are solely those of the individual author(s) and contributor(s) and not of MDPI and/or the editor(s). MDPI and/or the editor(s) disclaim responsibility for any injury to people or property resulting from any ideas, methods, instructions or products referred to in the content. |
© 2025 by the authors. Licensee MDPI, Basel, Switzerland. This article is an open access article distributed under the terms and conditions of the Creative Commons Attribution (CC BY) license (http://creativecommons.org/licenses/by/4.0/).
Copyright: This open access article is published under a Creative Commons CC BY 4.0 license, which permit the free download, distribution, and reuse, provided that the author and preprint are cited in any reuse.


