
Submitted:
31 March 2025
Posted:
01 April 2025
You are already at the latest version
Abstract
Developing sustainable and circular urban precincts requires the buy-in and participation of users of the infrastructure in an optimal manner. The most well designed and developed infrastructure will achieve its objectives only if they are used in the intended manner. To achieve this, planners need to consider social behaviour and expectations of users, and design precincts to facilitate sustainable behaviour. This paper presents research on developing a social simulation tool to aid decision making in an urban regeneration project. Findings from a community survey of typical users of the precinct was used to understand sustainability behaviours and challenges. Outcome-based recommendations were assessed by the team to explore how these relationships could translate into tangible, built environment outcomes. Alternative options for different elements within the precinct were identified and prioritised based on optimal environmental impacts for each option. These options were then used to develop a proof of concept of a social-simulation tool, which was validated through focus group sessions with stakeholders within the precinct. Further research in this area will focus on disseminating the tool for use by different stakeholders and understanding the preferences of options for different groups of stakeholders and their related environmental impacts.
Keywords:
Circular Economy
; sustainability
; urban precincts
; social simulation
; urban regeneration
1. Introduction
Urban precincts play a major role in human lives, with an increasing proportion of the population living, working and playing in urban areas. Human wellbeing and urban spaces are interconnected in various ways with the urban spaces influencing health and quality of life aspects, while human activities affect the ecological impacts of such areas. The built-environment and urban areas contribute to a majority of resource consumption and energy use and can alter microclimates leading to positive feedback effects such as urban heat islands. Therefore, urban planners and developers are taking vital steps for precincts to be more inclusive and sustainable by design. Including sustainability aspects at the outset of a development project has the potential to include more sustainability considerations, whilst contributing to a more lasting impact rather than trying to include such additions after the completion of a project.
Although, the built-environment sector focuses on designing infrastructure to help urban spaces to be more socially and environmentally sustainable, such outcomes rely heavily on user behaviour. If user behaviour is not accounted for, infrastructure may be designed for sustainability but utilized ineffectively, leading to suboptimal outcomes. A well-known example is the building of overhead pedestrian bridges, that are not used by pedestrians due to psychological biases (Räsänen et al., 2007). This illustrates that users of infrastructure play an important role aiding the intended sustainability outcomes of a project. In addition, pedestrian bridges also make cities less walkable by prioritising motorised traffic over pedestrian access, which can have a further detrimental effect on pedestrian behaviour. Therefore, it is vital to consider potential user behaviour when designing infrastructure, as the main aim of infrastructure is to aid better outcomes for those using it. This paper presents research conducted to understand user behaviour within a precinct and explains how a social simulation tool was developed to aid in decision making for sustainability outcomes. The tool is intended for use by project proponents, developers, architects and researchers to simulate different sustainable and circular interventions that could be included in an urban renewal project.
2. Designing Regenerative Precincts
Urban regeneration is the development of inner-city areas, through efficient land reutilisation, the revival of cultural heritage, and the restoration of natural environment, which lead to new vibrant inner-city communities that are both sustainable and inclusive (Wang et al., 2021). From an ecological point of view, the term regeneration is considered going above and beyond the commonly used term of sustainability. While sustainability is understood as how to maintain the current way of life and environment, regeneration refers to the improvement of living systems through regrowth and flourishing of nature (Hahn and Tampe, 2021). Regenerative urban precincts thus aim to create more social revival for communities, while regenerating nature.
Circular Economy (CE) is a relatively recent concept within the broader environmental discipline and has gained interest in academic, business and policy sectors due to major crises caused by waste and pollution. CE is based on three principles driven by design; eliminating waste and pollution, circulate products and materials (at their highest value) and regenerate nature (Ellen MacArthur Foundation, 2022). Therefore, designing urban precincts based on CE principles can culminate in regenerative precincts, which are not only environmentally sustainable but help regenerate ecologically degraded areas, relatively common in urban regions.
Higher educational institutions play an influential role in advancing CE and broader environmental practices by providing the necessary knowledge and the development of tools, instilling the ethical and sustainable values (Merli et al., 2018), and by encouraging policymakers and corporate decision makers to learn, think and act differently (Serrano-Bedia and Perez-Perez, 2022). Within this climate, universities also need to exemplify these values and methods that they teach, through their actions. Universities are increasingly looking inward to improve their sustainability impacts, with university rankings considering institutions’ efforts towards achieving sustainable development goals (De la Poza et al., 2021). From a built environment perspective, universities could design and implement the regenerative principles, which form their circular economy education, research and corporate strategies.
Most university buildings were constructed long before the principles of circular economy and sustainability became prevalent. Consequently, these structures must be adapted to meet contemporary needs, as well as updated standards and building codes that address environmental sustainability (Vergani, 2024). Older buildings could also have heritage value and repurposing such buildings need to consider how such values can be maintained, while catering to current educational needs (Domingo Calabuig and Lizondo Sevilla, 2019). Such adaptive reuse strategies of older buildings can be used as learning tools to understand the efficacy of circular strategies, which are instilled in educational courses (Nunes et al., 2018). Refurbishing buildings instead of knock-down rebuilds, typically generates more jobs, comparable energy consumption, less use of water and new materials (Crawford et al., 2014).
As universities grow, they also build new facilities and infrastructure, providing an opportunity for such new builds to act as living labs. Some strategies that could be used in such instances are replacing conventional, energy-intensive building materials with more circular alternatives (Kumanayake and Luo, 2018). However, it is vital that such substitution of material considers broader environmental impacts from an entire life cycle approach. Circular and regenerative buildings needs to consider not just the structural elements but also the internal fit outs, with the reuse and repurposing of products for fixtures and fittings (Fortes et al., 2021).
Regenerative buildings go further than reducing the environmental impacts of the buildings, by sequestering carbon dioxide, clean the air, treat waste water, and turn sewage back into soil nutrients during the operational phase of the building (Benyus, 2015). These buildings should be integrated into a precinct that is also regenerative. Such precincts may feature liveable green spaces that harmonize with the built environment, thoughtfully designed areas that enhance thermal, visual, and auditory comfort, bioclimatic design strategies, and fossil-free transportation within the campus (Bakos and Schiano-Phan, 2021), wildlife corridors and urban agriculture (Benyus, 2015).
Within city campuses a more holistic approach to campus regeneration is required, as spaces are used by the public, who are not involved in academic activities. Therefore, repurposed facilities need to be open and welcoming to the public and be multifunctional spaces (Zheleznyak and Korelina, 2022). City campuses could also showcase how circular design could be implemented not only to learners but also to the wider public, catalysing the mind set changes that are needed for a systemic transition. As city campuses are open to the public, understanding behaviour and mind set of typical users is a vital aspect in designing sustainable and circular campus precincts.
3. Social Simulations for Sustainability Assessments
Sustainability is a very broad but complex concept and can be interpreted in a multitude of different ways. Assessing sustainability impacts of a specific activity can be challenging, due to the multiplicity of factors contributing sustainability (Moon, 2017). Some of these aspects include the broad temporal and spatial dimensions of consequences as decisions related to sustainability often unfold over extended periods of time and may manifest far from their origin. Sustainability typically encompasses economic, environmental and social factors, which can have competing interests and intricate interdependencies between them, which can complicate efforts to understand the full range of impacts and outcomes. The dynamic, non-monotonic, and non-deterministic nature of these interactions also make it difficult to predict and analyze the long-term effects of specific activities or decisions. Assessing sustainability related interventions require an ability to integrate different levels of granularity, such as tracing the connections between individual human activities and their broader, long-term effects on the planet. Integrating the behavioural aspects of individuals to sustainability assessments typically take an interdisciplinary approach, by combining the behavioural sciences with the technical, engineering related interventions.
Social simulations is one method that can be used to bridge this gap between the subjective individual decision making and the objective technical solutions to find optimal interventions. Social simulations, is a type of simulation modelling, that aims to incorporate vital human factors into agent architectures and simulated environments (Shults and Wildman, 2020). Social simulations aim to account for the cognitive and cultural complexity of individuals, as well as for the role individuals take in the decision making process that influence societal and ecological outcomes. Social simulations help in understanding and providing insights into system dynamics, evaluating and comparing different options prior to implementation, supporting decision-making processes, developing new investigative tools, and facilitating training and education at individual level (Moon, 2017).
Social simulations allow for researchers and policymakers to identify and model plausible and desirable futures based on individual decision makers (de Oliveira and Mahmoud, 2024). In addition to simulating future scenarios they also facilitate diverse decision-making strategies where cooperation and information exchange are important (Lane, 2023). Social simulations can be used to understand agents’ preferences in cases where conflicts and contradictions occur. This is an important area within sustainability as actions can have competing demands on the different pillars of sustainability: social, environmental and economic. Research has used social simulations to model how policies impact economic growth and environmental impacts (Gerst et al., 2013). The complexity of sustainability interventions also needs to consider the different types of environmental impacts that can be created. With increased attention to global warming and resultant climate change impacts, there has been an increase in attention to carbon emissions, with reduced attention to other environmental impacts in life cycle analysis (Dinesh et al., 2024). Social simulations can thus help draw attention to these contradictions and be used to understand the mental models that underlie decision making.
Social simulations also help in understanding how public participation can be used to develop collective sustainable management practices (Aguirre and Nyerges, 2014) and identifying emerging patterns based on individual differences of actors (Sircova et al., 2015). Such studies play a critical role in understanding optimal solutions for urban and community planning, where individuals’ behaviours and preferences have a high influence on the operations of the plans (Haase et al., 2010, Katoshevski-Cavari et al., 2011, Gaube and Remesch, 2013). Although understanding human interactions and decision making is essential in considering human centred design approaches in the built environment, systematically incorporating human experience in social simulation research is limited in scope (Moon, 2017). Therefore, it has been recommended that refining currently available software as well as creating new software for sustainability related social simulations are necessary and desirable. This project, therefore takes an action research approach where a social simulation model was developed, in order to increase user awareness of the sustainability aspects within an urban precinct and to understand preferences of specific sustainable options. The paper presents the methods adopted in developing the model and the outcomes of it.
4. Methods
This paper took an action research approach to understand how user behaviour and practices could be integrated into an urban renewal project. The study area is a university precinct, which has been identified for urban renewal. The research used information on community behaviour of individuals who will be using the precinct and business practices of firms located within and abutting the precinct from two questionnaire surveys distributed previously (Gajanayake et al., 2024). The major insight from the survey responses was that individuals were lacking the supporting infrastructure to act in a more sustainable manner. The four key areas where infrastructure could aid circularity were identified as public transport, waste management, repair and reuse solutions and more sustainable dining options. The responses received through these surveys were analysed and translated to potential actions that could be implemented in an urban planning setting.
The different strategies were presented to the university community through a temporary exhibition and a focus group session, which included researchers and staff members from across the university and broader industry partners including community development organisations. This presented an opportunity to validate the potential solutions and identify areas for improvement. The feedback received highlighted the lack of focus on the social benefit aspect, especially for the broader community who would frequent this area. Possible interventions proposed in the focus group session, were setting up of community gardens for food waste recycling and refund collection points for used containers.
Further engagement with students through a micro-internship program revealed that student participation will be higher if strategies can be visually experienced, increased social media engagement and incentivised to take sustainability related actions. Based on feedback received through the focus group sessions and the student programs, place-based strategies for specific areas within the precinct were developed.
Areas with high foot traffic within the precinct were identified to design optimal solutions based on the initial data collected. These areas were photographed and the most relevant CE strategies that could be adopted were identified based on accepted CE techniques and the behavioural surveys conducted. Each proposed element was selected for its potential to enhance sustainability, community engagement, and alignment with circular economy principles, ensuring a comprehensive approach to urban development.
Different intervention options were selected for elements within the precinct. These interventions are designed to address key areas such as waste management, energy efficiency, stormwater management, and public health, while also fostering community participation and social benefits. The selection of intervention strategies for urban renewal follows scientifically validated sustainability principles, focusing on environmental, economic, and social impact. Multi-criteria decision analysis (MCDA) was employed to integrate both quantitative and qualitative assessments from peer-reviewed studies. Cost-effectiveness was evaluated through life-cycle cost analysis (LCCA), ensuring long-term material value (Fuller & Petersen, 1996), while balancing initial installation costs against maintenance and operational savings (Kibert, 2016).
Environmental impacts of strategies were evaluated based on various environmental factors such as water management, urban heat island effect and incorporation of recycled content. For example, options for road pavement included permeable materials that mitigate urban flooding through increased infiltration (Fletcher et al., 2015), lighter, porous materials that lower surface temperatures and decrease cooling demand (Santamouris, 2013), incorporating recycled materials align with circular economy (CE) principles (Geissdoerfer et al., 2017).
Social impact considerations include public health benefits, such as reduced waterborne disease risks due to improved flood management (WHO, 2018), and enhanced walkability and safety through smooth, permeable surfaces (Litman, 2013). These criteria ensured that interventions were selected based on robust scientific evidence, optimizing sustainability outcomes.
For instance, porous asphalt and pervious concrete are proposed for road pavement due to their ability to manage stormwater runoff, reduce urban heat island effects, and lower energy consumption for cooling nearby buildings. These materials align with the precinct’s goal of enhancing environmental sustainability and resilience to climate change (EPA, 2021; MIT News, 2021). Similarly, green façades and photovoltaic (PV) façades are recommended for building exteriors to improve air quality, reduce energy demand, and support biodiversity, which are critical in a dense urban environment like Melbourne’s CBD North (Green Roofs Australasia, 2024; MDPI, 2024).
Community-focused interventions such as tool libraries, swap shops, and community fix-it stations are particularly relevant as they promote circular economy practices by reducing waste, encouraging reuse, and fostering community engagement. These initiatives address the lack of supporting infrastructure identified in the surveys and align with the precinct’s goal of creating a more sustainable and inclusive urban environment (Gajanayake et al., 2024). Overall, the proposed interventions are scientifically justified and relevant to the precinct’s context, as they address both environmental and social sustainability goals while aligning with the circular economy principles emphasized in the paper.
To prioritize interventions, a weighted composite index approach is applied, ensuring an evidence-based selection of strategies. The evaluation process involves defining criteria, assigning weights, normalizing values, and computing a final score for ranking interventions.
4.1. Scoring Formula
The composite score for each intervention is calculated as:
where:
- C (Cost-effectiveness) = Negative weighting applied to penalize higher costs
- Q (Quantified Benefits) = Includes carbon sequestration, energy savings, stormwater management, urban heat reduction, biodiversity, and social/health impact
4.2. Weight Assignments
Weights for each criterion were selected based on sustainability principles and findings from previous research (Anumol et al., 2015, van Loon-Steensma and Vellinga, 2013, Lange et al., 2013, Neufeldt et al., 2015) and is presented in Table 1.
4.3. Normalization & Ranking
All values were normalized to a [0,1] scale to ensure comparability across different measurement units. The final weighted composite score determines the ranking, with higher scores indicating superior overall performance. This approach ensured flexibility, quantitative objectivity, and a balanced evaluation incorporating economic, environmental, and social factors, allowing for informed decision-making in urban renewal planning. Five interventions for each element within the precinct were chosen based on the sustainability ranking and the community feedback obtained through the surveys and focus groups sessions.
An Agent Based Simulation Model was developed, where users could interact with their environment. And agent-based model allows to model complex systems, adopting a bottom-up approach, starting from induvial agents. An Agent-Based Simulation Model was used to capture the complexity of human–environment interactions in the precinct. This method was chosen for its ability to model individual decision-making and simulate emergent collective behaviours based on diverse user preferences, knowledge, and values. By allowing users to explore various intervention options and observe outcomes, the model supports the identification of strategies with broad user acceptance and systemic impact, aligning with bottom-up, participatory planning approaches.
The model provides users with the ability to select different intervention options for different elements within the precinct. It is assumed that that each user (agent) is an individual entity possessing its own intelligence, values and beliefs and that they make decisions based on what they perceive from their inherent knowledge and assumptions and any additional information provided through the model. The additional information provided for the model included the financial cost and environmental impacts of each intervention. As the number of users of the model increase, emerging behaviours, patterns and structures could be understood. These patterns and structures could then be used to identify optimal interventions that will have broad scale buy-in from users of the actual precinct.
5. Developed Social Simulation Model
The social simulations are based on four elements within the precinct that were identified as the most appropriate for interventions to be simulated. These elements were: building facades, road pavements, internal building spaces, outdoor spaces. These elements were selected as incorporating interventions at different stages of the life cycle of the project was possible. Three specific locations within the precinct were selected as case study locations, where interventions for the elements could be simulated.
Table 2, Table 3, Table 4 and Table 5 show the different intervention strategies for the four elements within the precinct, ranked according to the composite sustainability score. This ranking reflects a holistic assessment of cost-effectiveness, environmental benefits, and social impact, ensuring a data-driven prioritization of interventions for urban renewal.
For a more detailed analysis, the following table presents the ranking of intervention strategies within the “Road Pavement” precinct element.
During normalization, values were scaled using the formula (X - X_min) / (X_max - X_min), where the minimum value in the dataset was subtracted from each data point and then divided by the range. As a result, if an intervention’s cost equalled the dataset’s minimum value, it was normalized to 0. This is a mathematically valid outcome and does not imply an actual cost of zero. This explains why costs for Plastic Grid Pavers and Reflective Cool Facades appear as zero in the rankings.
The ranking of facade interventions highlights the dominance of Green Facades (Living Walls), which achieve the highest composite score due to their strong performance across carbon sequestration, stormwater management, urban heat reduction, biodiversity, and social benefits. Other strategies, such as Facade with Water Management Systems and Permeable Facades, provide targeted benefits but with lower overall impact. Reflective and photovoltaic facades offer specific advantages, particularly in energy efficiency and heat mitigation, while kinetic and double-skin facades rank lower due to their limited contribution across multiple criteria.
“Free Building Space” strategies, such as Tool Libraries, Swap Shops, and Maker Spaces, primarily contribute to social benefits, resource-sharing, and waste reduction. However, as these interventions do not involve green infrastructure or heat-mitigating materials, they have little to no direct impact on urban heat reduction or biodiversity, resulting in empty columns for these criteria.
Additionally, since specific impacts on Urban Heat Reduction and Biodiversity were not quantified in the dataset, they were excluded from the composite score calculation to ensure fairness and accuracy in ranking.
The “Free Area” strategies generally show zero values for Energy Savings (kWh/unit/year) because their primary focus is on environmental sustainability, biodiversity, and social well-being, rather than direct energy efficiency. Interventions such as Native Vegetation, Rain Gardens, and Urban Forests or Pocket Parks emphasize stormwater management, urban cooling, and ecological restoration. While they may contribute to energy reductions indirectly, their impacts are not readily quantifiable in terms of kilowatt-hour savings. The absence of direct energy-related data in the document accurately reflects the purpose of these interventions, which contrasts with infrastructure projects like Solar-Powered Charging Stations, explicitly designed to enhance energy efficiency and generate renewable energy.
Five intervention options were selected to be displayed on the user interface of the social simulation model. It was revealed in the focus group sessions that providing a large number of interventions would lead to users being overwhelmed and only selecting the options that were presented at the top. The specific five intervention strategies were selected based on the sustainability ranking as well as the findings from the surveys and focus group sessions. Therefore, some interventions that were included in the social simulation model, were lower ranked on the composite score, but were preferred by users. For example although second hand shops and repair cafes did not score well on the composite score they were included in the simulations as there was high demand for such locations in the surveys. This was similar to the building integrated PV, where users wanted to visualise the renewable energy solutions.
The simulation model included a dashboard displaying the financial cost and environmental impacts of each intervention, so that users can make decision on which intervention to use based on different financial and environmental outcomes of the strategy. The different interventions were also given star ratings on three environmental categories: carbon reduction potential, biodiversity and ecosystem services and overall environmental benefits. This star rating was included based on the validation feedback received on the proof of concept. The final intervention strategies included in the social simulation model and the relevant star ratings for each are detailed in the tables below.

Table 6.
Star ratings for road pavement interventions.
| Road Pavement | Cost | Reduction in Carbon | Biodiversity and Ecosystem Services | Overall Environmental Benefits | |
| 1 | Grass/Gravel Pavers (Turf Reinforcement Systems) | $87 to $142 per m² | 2.5 | 5.0 | 4.5 |
| 2 | Pervious Concrete | $142 to $212 per m² | 2.0 | 3.0 | 3.5 |
| 3 | Permeable Interlocking Concrete Pavers (PICP) | $118 to $189 per m² | 2.0 | 3.5 | 3.5 |
| 4 | Porous asphalt | $71 to $126 per m² | 1.0 | 2.5 | 3.0 |
| 5 | Resin-Bound Permeable Pavements | $173 to $283 per m² | 1.5 | 2.5 | 3.0 |
Table 7.
Star ratings for building façade interventions.
| Building Facade | Cost | Reduction in Carbon | Biodiversity & Ecosystem Services | Overall Environmental Benefits | |
| 1 | Green Facade (Living Walls) | $1,000 to $1,800 per m². | 3.5 | 5.0 | 4.5 |
| 2 | Facade with Water Management Systems | $1,000 to $1,600 per m². | 1.0 | 3.0 | 3.0 |
| 3 | Reflective Cool Facade | $150 to $300 per m². | 2.5 | 1.0 | 2.5 |
| 4 | Recycled or Low-Embodied Carbon Materials Facade | $250 to $500 per m². | 3.5 | 2.0 | 3.5 |
| 5 | Photovoltaic (PV) Facade | $600 to $1,100 per m². | 4.5 | 1.5 | 3.5 |
Table 8.
Star ratings for free building area interventions.
| Free Building Space | Reduction in CARBON | Biodiversity & Ecosystem Services | Overall Environmental Benefits | ||
| 1 | Tool Libraries | $20,000 to $75,000 | 2.5 | 1.5 | 3.0 |
| 2 | Urban Materials Banks | $45,000 to $130,000. | 3.5 | 3.5 | 4.0 |
| 3 | Food Rescue and Redistribution Hubs | $70,000 to $140,000 | 4.0 | 3.0 | 4.0 |
| 4 | Repair Café | $20,000 to $55,000 | 2.0 | 1.0 | 2.5 |
| 5 | Op-Shop | $25,000 to $50,000 | 2.5 | 1.5 | 3.0 |
Table 9.
Star ratings for free open area interventions.
| Free Open Area | Reduction in Carbon | Biodiversity & Ecosystem Services | Overall Environmental Benefits | ||
| 1 | Urban Forests or Pocket Parks | $150–$250 per m2 | 5.0 | 5.0 | 5.0 |
| 2 | Public Edible Gardens | $200–$350 per m2 | 2.0 | 4.0 | 3.5 |
| 3 | Composting Area | $200–$400 per m2 | 3.5 | 3.5 | 4.0 |
| 4 | Smart Waste Bins | $1,800–$3,700 per unit | 1.5 | 0.5 | 2.0 |
| 5 | Bicycle Racks and Parking Hubs | $350–$700 per rack for 2 bikes | 1.0 | 1.0 | 2.0 |
Developing Social Simulations
A 3D visualization system was developed using Three.js within a React framework. This increases interactivity and provides the ability to modify urban elements, such as building facades and road pavements. The core environment of the precinct was structured as a 360-degree panoramic sphere, with an equirectangular texture mapped onto a spherical geometry to simulate a realistic scene.
Rather than employing a drag-and-drop interface, the system utilizes a click-based selection method for modifying materials. When a user clicks on an adjustable surface (e.g., a wall or pavement), a sidebar panel is displayed, offering a range of material options. Upon selecting a material, it is dynamically applied to the chosen surface. To ensure seamless application, overlay images are rendered as separate layers of SphereGeometry, thus preserving the integrity of the base panorama.
For navigation, the system integrates OrbitControls, enabling intuitive camera movement while enforcing constraints on azimuth and polar angles. This prevents unnatural motions, such as excessive horizontal panning or downward tilting, and ensures a controlled and realistic viewing experience. Zooming functionality is also provided, with restrictions in place to maintain an optimal field of view.
To ensure accurate interaction, alpha-based texture filtering was implemented, enabling only non-transparent sections of textures (i.e., clickable areas) to respond to user input. Raycasting was used to process mouse click events and determine the validity of interactions. Additionally, a calculation model was integrated for users to visualise the environmental and financial impacts of the different intervention options. These values are dynamically updated and presented in an analytics panel, providing real-time insights.
The proof of concept (POC) of the social simulations were uploaded on an online platform. The social simulations were validated by obtaining feedback on the Proof of Concept from potential end-users. A visual representation and a live link to the PoC was shared with stakeholders at university showcase events to obtain feedback. Detailed feedback was also obtained through a focus group session of internal and external researchers. The live link was accessed by 13 individuals allowing them to provide detailed feedback on the look and feel of the tool. The main improvements incorporated following the validation sessions were: adding a description for each of the elements for it to be understood by non-experts, increasing compatibility with Green Star Communities tool and providing a cost-range instead of an absolute value.
Figure 1 illustrates the user interface where a user can select the different intervention options based on a brief description of it, while Figure 2 illustrates the simulation showing what the intervention would look like in real time on the ground and the relevant cost and environmental implications of it.
6. Discussion and Conclusion
This paper presents the process followed for the design and development of a social simulation model, to identify specific intervention strategies that aim to increase the sustainability of an urban renewal project. Five key built environment elements, where interventions could be adopted, and three locations were identified as cases where the simulations could be modelled. The intervention strategies were identified and prioritised based on previous stakeholder engagement sessions carried out. The model was developed using Three.js system within a React framework, that enables 3D visualization of the precinct. The model included financial and environmental impacts of each intervention strategy allowing for users to make informed decisions on how the selection of strategies impact sustainability outcomes. The model was validated through a focus group session.
A major advantage of the model is the real-life simulation of the how the interventions would look like when adopted. This is similar to previous research, which found that using realistic features rather than abstract features in simulations help better decision making in planning activities (Katoshevski-Cavari et al., 2011). However, the use of realistic visualisations come with cost, which is that only a limited number of locations or interventions could be modelled, due to computational limitations.
A limitation of the model at this stage is the simplifying assumptions that have been used to interpret the environmental and financial impacts of the interventions. The decision-rules available to users of the model have also been simplified, which aid users to select specific strategies without the ability to combine them. Such simplifications were considered a necessity as this model is an initial version that allow for modifications in future versions meant to answer more complicated questions (Gerst et al., 2013).
As the focus of the research was to identify circular and environmentally sustainable interventions, a limitation of this model is the lack of focus on the social dimensions of these interventions. As the lack of consideration of social aspects within social simulations have been identified (Moon, 2017), we strived to incorporate elements which have social impacts in the intervention strategies. However, the evaluation metrics of the strategies did not include a scoring for the social impacts, as quantifying them were challenging. Further research needs to include some level of quantification of the social impacts, so that all three pillars of sustainability are evaluated.
Future research in this area will focus on the use of the model by decision makers to understand their preferences for different sustainability related interventions. The use of the model by relevant stakeholders and modifying the model based on feedback and user data, will not only increase the reliability of the model but will also increase the use of such models for decision-making (Tolk et al., 2022). User data on the model will help researchers and policy makers design and develop more catered solutions for future urban renewal projects.
Acknowledgments
The authors would like to acknowledge the funding provided by RMIT’s Property, Strategy and Impact portfolio through the City North Social Innovation Precinct Activation fund to conduct this research.
References
- AGUIRRE, R. & NYERGES, T. 2014. An agent-based model of public participation in sustainability management. Journal of Artificial Societies and Social Simulation, 17, 7. [CrossRef]
- ANUMOL, T., SGROI, M., PARK, M., ROCCARO, P. & SNYDER, S. A. 2015. Predicting trace organic compound breakthrough in granular activated carbon using fluorescence and UV absorbance as surrogates. Water research, 76, 76-87. [CrossRef]
- BAKOS, N. & SCHIANO-PHAN, R. 2021. Bioclimatic and regenerative design guidelines for a circular university campus in India. Sustainability, 13, 8238. [CrossRef]
- BENYUS, J. 2015. The generous city. Architectural Design, 85, 120-121.
- CRAWFORD, K., JOHNSON, C., DAVIES, F., JOO, S. & BELL, S. 2014. Demolition or Refurbishment of Social Housing? A review of the evidence.
- DE LA POZA, E., MERELLO, P., BARBERÁ, A. & CELANI, A. 2021. Universities’ reporting on SDGs: Using the impact rankings to model and measure their contribution to sustainability. Sustainability, 13, 2038.
- DE OLIVEIRA, F. L. & MAHMOUD, I. 2024. Desirable futures: Human-nature relationships in urban planning and design. Futures, 163, 103444.
- DINESH, L. P., GAJANAYAKE, A. & IYER-RANIGA, U. 2024. An exploration of drivers for small businesses to implement environmental actions in Victoria, Australia. Business Strategy & Development, 7, e361. [CrossRef]
- DOMINGO CALABUIG, D. & LIZONDO SEVILLA, L. UNI-HERITAGE. European Postwar Universities Heritage: A Network for Open Regeneration. Proceedings 5th CARPE Conference: Horizon Europe and beyond, 2019. Editorial Universitat Politècnica de València, 208-215.
- ELLEN MACARTHUR FOUNDATION. 2022. Circular economy introduction [Online]. Available: https://ellenmacarthurfoundation.org/topics/circular-economy-introduction/overview [Accessed 27 May 2022 2022].
- FORTES, S., HIDALGO-TRIANA, N., SÁNCHEZ-LA-CHICA, J.-M., GARCÍA-CEBALLOS, M.-L., CANTIZANI-ESTEPA, J., PÉREZ-LATORRE, A.-V., BAENA, E., PINEDA, A., BARRIOS-CORPA, J. & GARCÍA-MARÍN, A. 2021. Smart tree: An architectural, greening and ICT multidisciplinary approach to smart campus environments. Sensors, 21, 7202. [CrossRef]
- GAJANAYAKE, A., ISLAM, M. T. & IYER-RANIGA, U. 2024. Embedding Circular Economy Principles within an Urban Renewal Project: A Case Study of a University Precinct. Available at SSRN 4917482.
- GAUBE, V. & REMESCH, A. 2013. Impact of urban planning on household’s residential decisions: An agent-based simulation model for Vienna. Environmental Modelling & Software, 45, 92-103. [CrossRef]
- GERST, M. D., WANG, P., ROVENTINI, A., FAGIOLO, G., DOSI, G., HOWARTH, R. B. & BORSUK, M. E. 2013. Agent-based modeling of climate policy: An introduction to the ENGAGE multi-level model framework. Environmental modelling & software, 44, 62-75. [CrossRef]
- HAASE, D., LAUTENBACH, S. & SEPPELT, R. 2010. Modeling and simulating residential mobility in a shrinking city using an agent-based approach. Environmental Modelling & Software, 25, 1225-1240. [CrossRef]
- HAHN, T. & TAMPE, M. 2021. Strategies for regenerative business. Strategic Organization, 19, 456-477.
- KATOSHEVSKI-CAVARI, R., ARENTZE, T. A. & TIMMERMANS, H. J. 2011. Sustainable city-plan based on planning algorithm, planners’ heuristics and transportation aspects. Procedia-Social and Behavioral Sciences, 20, 131-139. [CrossRef]
- KUMANAYAKE, R. P. & LUO, H. 2018. Cradle-to-gate life cycle assessment of energy and carbon of a residential building in Sri Lanka. J. Natl. Sci. Found. Sri Lanka, 46, 355-367. [CrossRef]
- LANE, A. 2023. Examining Human-environment Interactions and Their Impact on Land-cover Change During First Millennia Agriculture in Iberia: An Agent-based Modelling Approach. King’s College London.
- LANGE, A., SCHINDLER, W., WEGENER, M., FOSTIROPOULOS, K. & JANIETZ, S. 2013. Inkjet printed solar cell active layers prepared from chlorine-free solvent systems. Solar energy materials and solar cells, 109, 104-110. [CrossRef]
- MERLI, R., PREZIOSI, M. & ACAMPORA, A. 2018. How do scholars approach the circular economy? A systematic literature review. Journal of cleaner production, 178, 703-722. [CrossRef]
- MOON, Y. B. 2017. Simulation modelling for sustainability: a review of the literature. International Journal of Sustainable Engineering, 10, 2-19. [CrossRef]
- NEUFELDT, H., KISSINGER, G. & ALCAMO, J. 2015. No-till agriculture and climate change mitigation. Nature Climate Change, 5, 488-489. [CrossRef]
- NUNES, B. T., POLLARD, S. J., BURGESS, P. J., ELLIS, G., DE LOS RIOS, I. C. & CHARNLEY, F. 2018. University contributions to the circular economy: Professing the hidden curriculum. Sustainability, 10, 2719. [CrossRef]
- RÄSÄNEN, M., LAJUNEN, T., ALTICAFARBAY, F. & AYDIN, C. 2007. Pedestrian self-reports of factors influencing the use of pedestrian bridges. Accident analysis & prevention, 39, 969-973. [CrossRef]
- SERRANO-BEDIA, A.-M. & PEREZ-PEREZ, M. 2022. Transition towards a circular economy: A review of the role of higher education as a key supporting stakeholder in Web of Science. Sustainable Production and Consumption, 31, 82-96. [CrossRef]
- SHULTS, F. L. & WILDMAN, W. J. 2020. Human simulation and sustainability: Ontological, epistemological, and ethical reflections. Sustainability, 12, 10039. [CrossRef]
- SIRCOVA, A., KARIMI, F., OSIN, E. N., LEE, S., HOLME, P. & STRÖMBOM, D. 2015. Simulating irrational human behavior to prevent resource depletion. PloS one, 10, e0117612. [CrossRef]
- TOLK, A., CLEMEN, T., GILBERT, N. & MACAL, C. M. How can we provide better simulation-based policy support? 2022 Annual Modeling and Simulation Conference (ANNSIM), 2022. IEEE, 188-198.
- VAN LOON-STEENSMA, J. M. & VELLINGA, P. 2013. Trade-offs between biodiversity and flood protection services of coastal salt marshes. Current Opinion in Environmental Sustainability, 5, 320-326.
- VERGANI, F. 2024. Higher education institutions as a microcosm of the circular economy. Journal of Cleaner Production, 140592. [CrossRef]
- WANG, H., ZHAO, Y., GAO, X. & GAO, B. 2021. Collaborative decision-making for urban regeneration: A literature review and bibliometric analysis. Land Use Policy, 107, 105479. [CrossRef]
- ZHELEZNYAK, O. Y. & KORELINA, M. University campus as a model of sustainable city environment. Proceedings of the 5th International Conference on Construction, Architecture and Technosphere Safety: ICCATS 2021, 2022. Springer, 375-385.
Figure 1.
Interface displaying available intervention strategies.
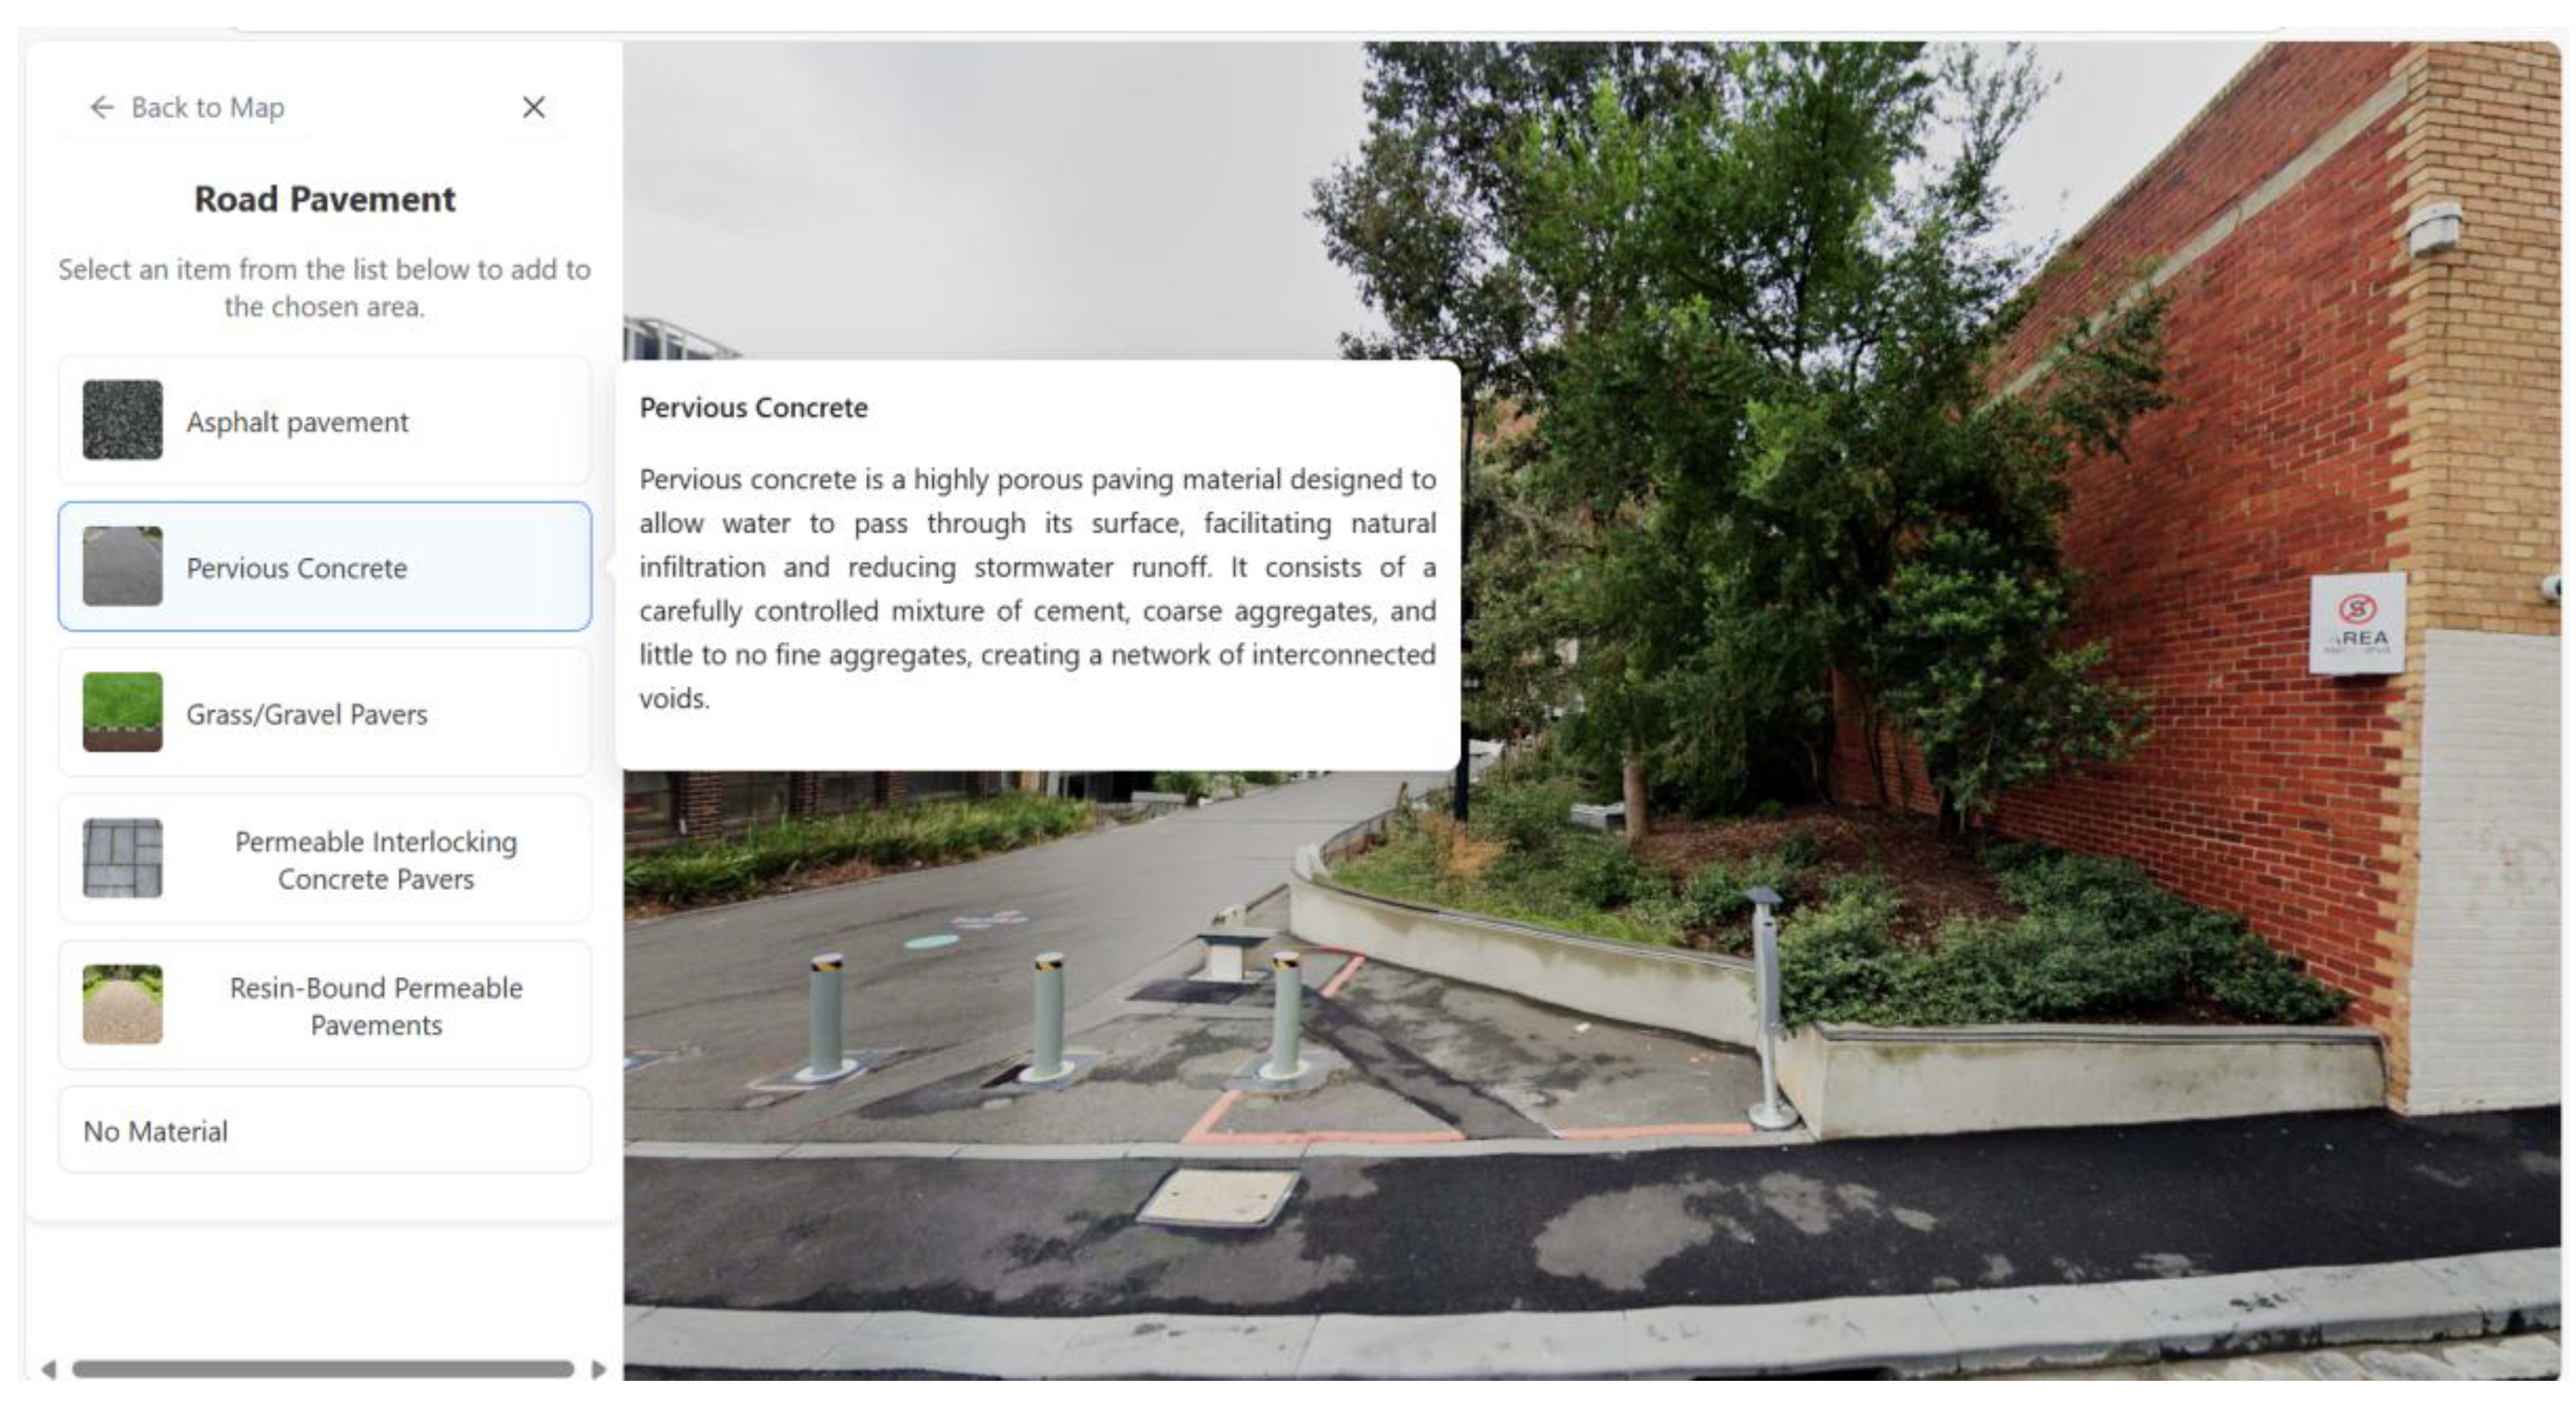
Figure 2.
Interface displaying cost and environmental implications of selected interventions.
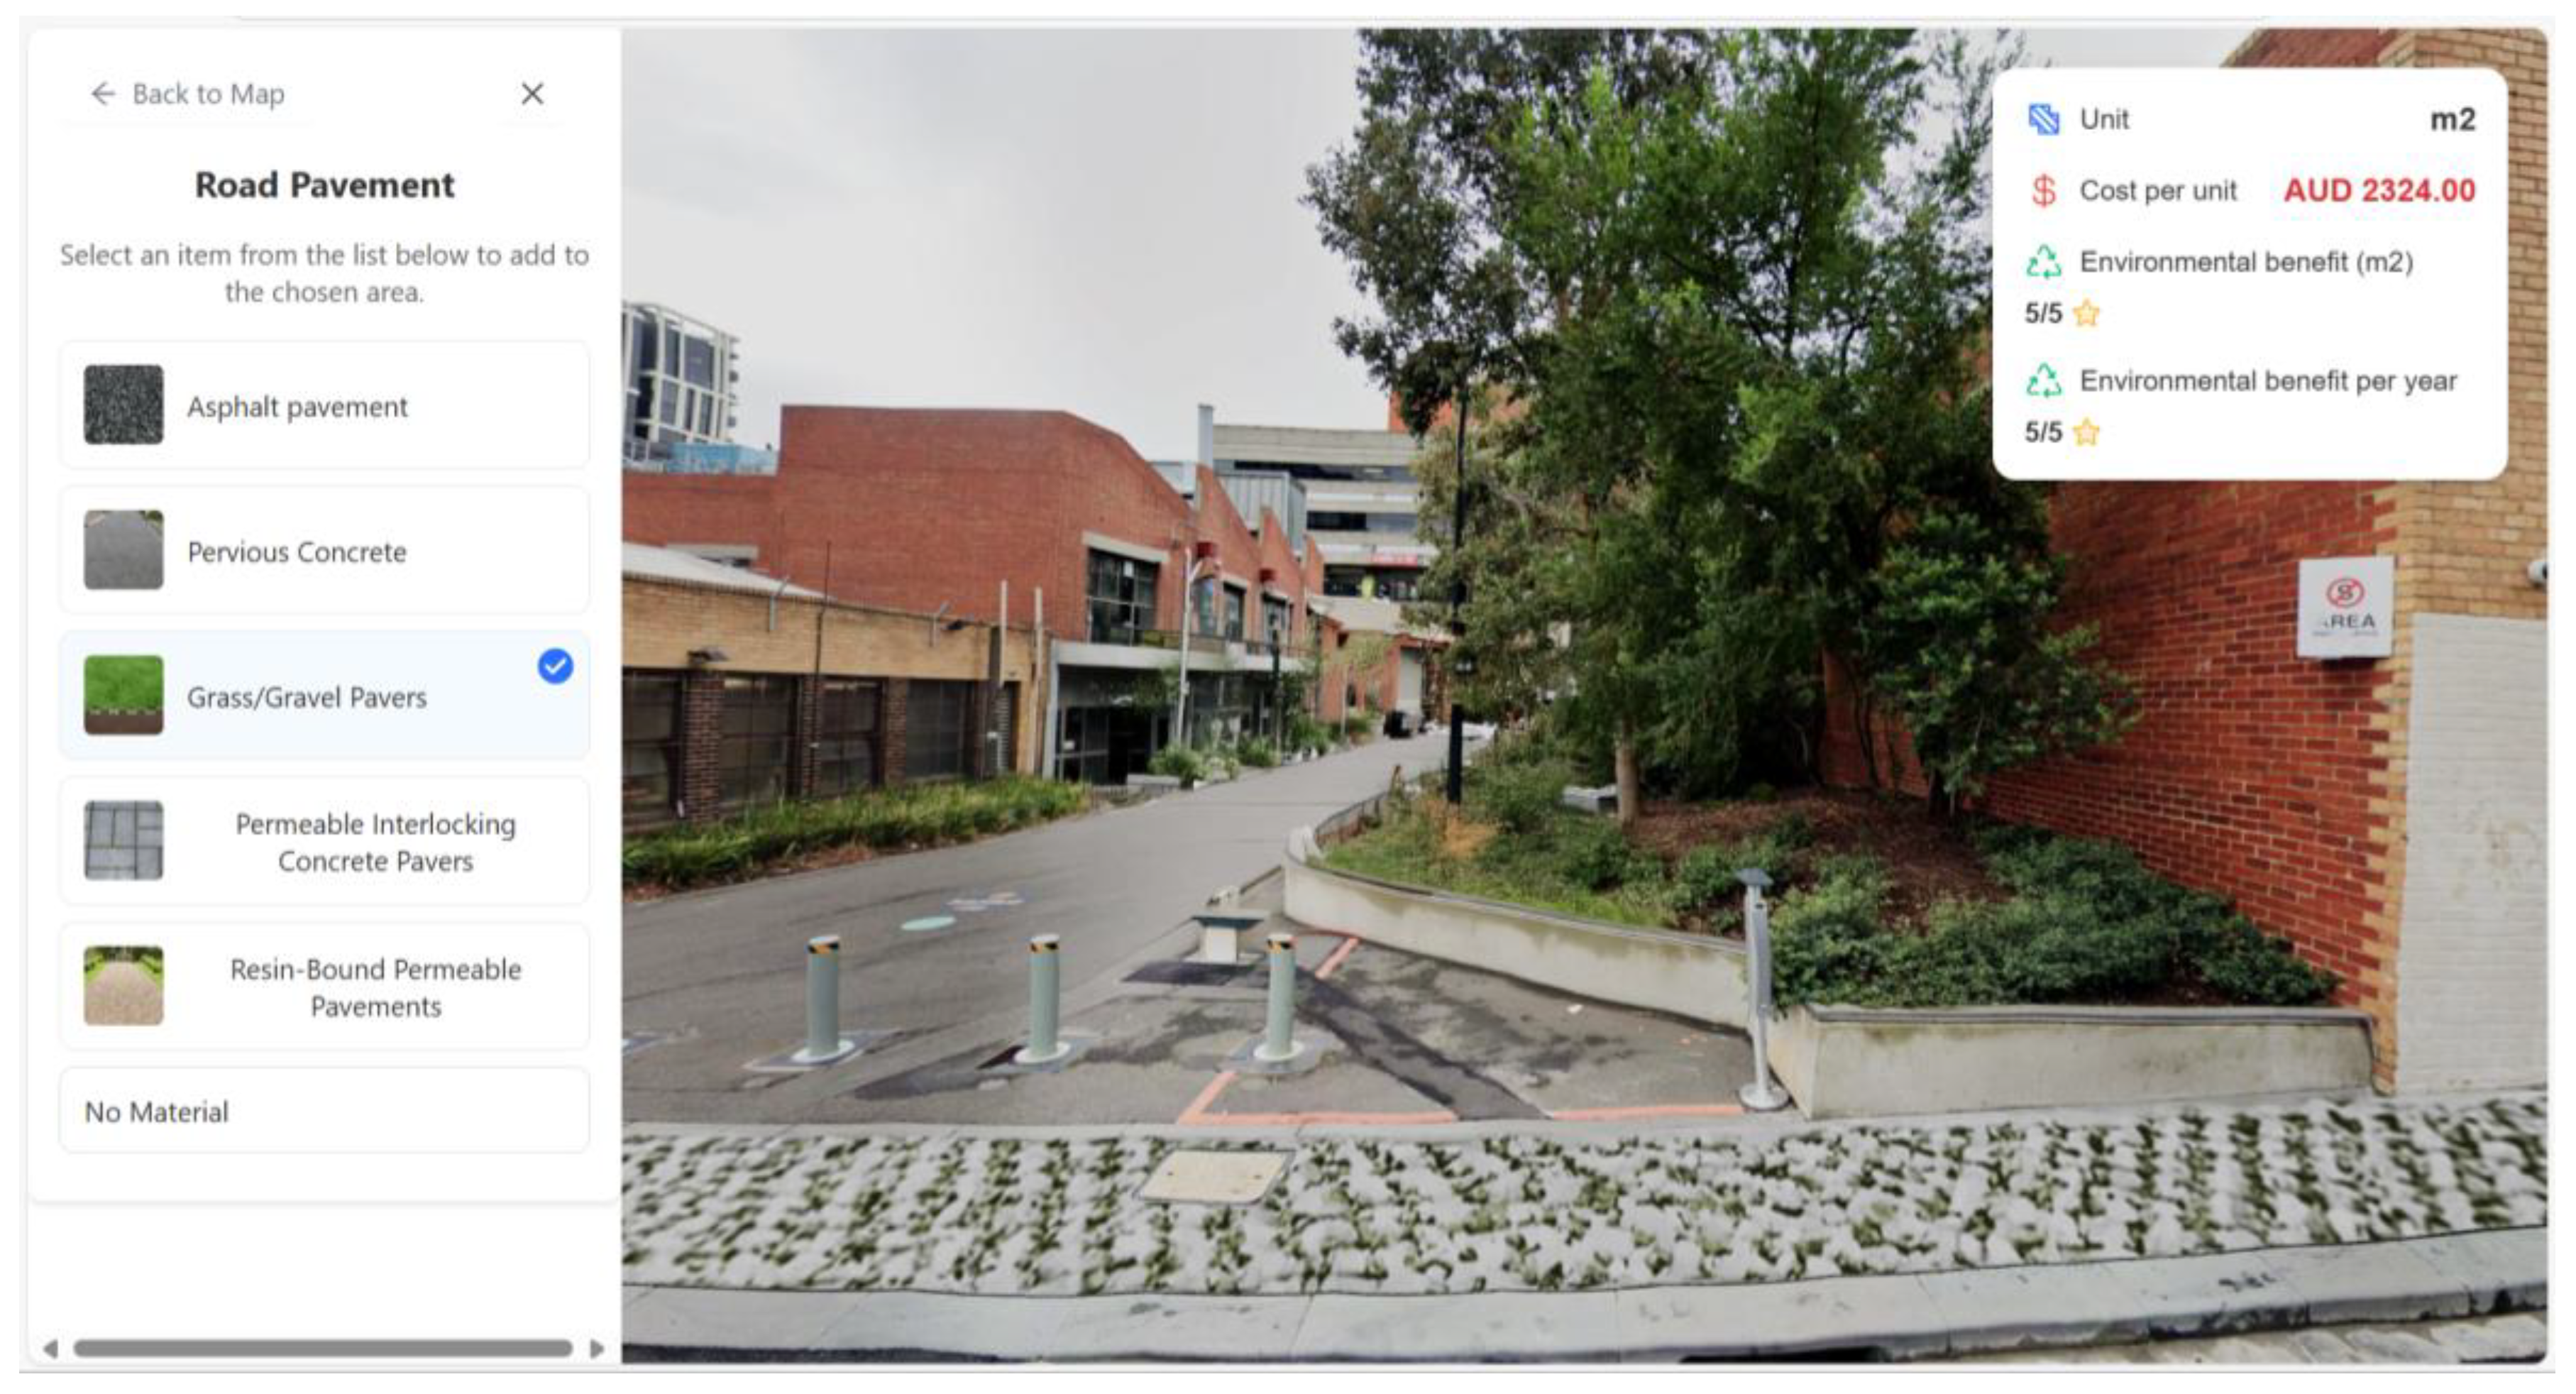
Table 1.
Weights allocated for each criteria.
| Criterion | Weight | Rationale |
| Cost (AUD/m²) | -0.2 | Lower costs are preferred, so a negative weight is used to penalize expensive interventions. |
| Carbon Sequestration (kg CO₂/m²/year) | 0.2 | High priority due to its role in mitigating climate change. |
| Energy Savings (kWh/m²/year) | 0.2 | Reduces operational costs and environmental impact (Lange et al., 2013). |
| Stormwater Management (litres/m²/year) | 0.2 | Helps mitigate urban flooding and infrastructure strain (van Loon-Steensma and Vellinga, 2013). |
| Urban Heat Reduction (°C) | 0.1 | Lowers local temperature and reduces cooling demand. |
| Biodiversity Score | 0.15 | Supports ecosystem health and urban sustainability. |
| Social/Health Benefits | 0.15 | Enhances community well-being and liveability. |
Table 2.
Ranked road pavement intervention strategies.
| Intervention Strategy | Cost (AUD/m²) | Normalized Cost | Carbon Sequestration (kg CO2/m²/year) | Energy Savings (kWh/m²/year) | Normalized Stormwater Management | Urban Heat Reduction (°C) | Biodiversity Score | Social/Health Benefits | Composite Score | Rank |
| Grass/Gravel Pavers (Turf Reinforcement Systems) | 87-142 | 0.895349 | 1 | 1 | 1 | 0.952381 | 1 | 1 | 1 | 1 |
| Pervious Concrete | 173-283 | 0.290698 | 0 | 1 | 0.9 | 0.714286 | 0.7 | 0.7 | 0.72619 | 2 |
| Permeable Interlocking Concrete Pavers (PICP) | 142-212 | 0.55814 | 0 | 0.75 | 0.75 | 1 | 0.7 | 0.9 | 0.642857 | 3 |
| Porous Asphalt | 118-189 | 0.686047 | 0 | 0.5 | 0.9 | 0.47619 | 0.7 | 0.7 | 0.5 | 4 |
| Resin-Bound Permeable Pavements | 63-126 | 1 | 0 | 0.5 | 1 | 0.238095 | 0.7 | 0.7 | 0.428571 | 5 |
| Plastic Grid Pavers | 71-126 | 0.976744 | 0 | 0.5 | 0.6 | 0.809524 | 0.5 | 0.7 | 0.369048 | 6 |
| Pervious Concrete with Titanium Dioxide | Unknown | 0 | 0 | 0 | 0 | 0 | 0 | 0 | 0 | 7 |
Table 3.
Ranked Building Façade Intervention Strategies.
| Intervention Strategy | Cost (AUD/m²) | Carbon Sequestration (kg CO2/m²/year) | Energy Savings (kWh/m²/year) | Stormwater Management (litres/m²/year) | Urban Heat Reduction (°C) | Biodiversity Score | Social/Health Benefits | Composite Score | Rank |
| Green Facade (Living Walls) | 0.566265 | 1 | 0.75 | 0.833333 | 1 | 1 | 1 | 0.803414 | 1 |
| Facade with Water Management Systems | 0.518072 | 0 | 0 | 1 | 0.333333 | 0.25 | 1 | 0.317219 | 2 |
| Permeable (Breathable) Facade | 0.180723 | 0 | 0.25 | 0 | 0.666667 | 0.5 | 1 | 0.305522 | 3 |
| Reflective Cool Facade | 0 | 0 | 0.2 | 0 | 1 | 0 | 1 | 0.29 | 4 |
| Recycled or Low-Embodied Carbon Materials Facade | 0.072289 | 0 | 0.1 | 0 | 0.333333 | 0.25 | 1 | 0.226376 | 5 |
| Photovoltaic (PV) Facade | 0.301205 | 0 | 1 | 0 | 0 | 0.25 | 0 | 0.177259 | 6 |
| Double-Skin Facade | 0.710843 | 0 | 0.5 | 0 | 0.666667 | 0 | 1 | 0.174498 | 7 |
| Kinetic Facade | 1 | 0 | 0.4 | 0 | 0.333333 | 0 | 1 | 0.063333 | 8 |
Table 4.
Ranked Free Building Space Strategies.
| Intervention Strategy | Cost (AUD) | Carbon Sequestration (kg CO2/unit/year) | Energy Savings (kWh/unit/year) | Stormwater Management (litres/unit/year) | Social/Health Benefits | Composite Score | Rank |
| Tool Libraries | 47500 | 0.5 | 0.5 | 0 | 1 | 0.15 | 3 |
| Urban Materials Banks | 87500 | 1 | 1 | 0 | 1 | 0.15 | 3 |
| Library of Things | 50000 | 0.4 | 0.5 | 0 | 1 | 0.15 | 3 |
| Upcycling Studios | 32500 | 0.5 | 0.3 | 0 | 1 | 0.15 | 3 |
| Food Rescue and Redistribution Hubs | 105000 | 1 | 1 | 0 | 1 | 0.15 | 3 |
| Zero-Waste Markets | 110000 | 0.5 | 0.5 | 0 | 1 | 0.15 | 3 |
| Community Fix-it Stations (Repair Shops and Cafes) | 37500 | 0.2 | 0.2 | 0 | 0.5 | 0.075 | 8 |
| Maker Spaces and Fab Labs | 180000 | 0.3 | 0.4 | 0 | 0.5 | 0.075 | 8 |
| E-Waste Repair and Recycling Centres | 115000 | 0.2 | 0.2 | 0 | 0.5 | 0.075 | 8 |
| Swap Shops or Free Stores | 11000 | 0.3 | 0.3 | 0 | 0 | 0 | 10 |
| Op-shop | 37500 | 0.4 | 0.4 | 0 | 0 | 0 | 10 |
Table 5.
Ranked Free Area Strategies.
| Intervention Strategy | Cost (AUD/unit) | Carbon Sequestration (kg CO2/unit/year) | Energy Savings (kWh/unit/year) | Stormwater Management (litres/unit/year) | Urban Heat Reduction (°C) | Biodiversity Score | Social/Health Benefits | Composite Score | Rank |
| Urban Forests or Pocket Parks | 10000 | 10 | 0 | 2000 | 1 | 1 | 1 | 0.4 | 1 |
| Native Vegetation | 5000 | 5 | 0 | 500 | 0.666667 | 0.666667 | 0.705882 | 0.272549 | 2 |
| Urban Wildlife Habitats | 2500 | 3.5 | 0 | 500 | 0.333333 | 0.833333 | 0.705882 | 0.264216 | 3 |
| Green Walls and Vertical Gardens | 1400 | 1 | 0 | 500 | 0.666667 | 0.4 | 0.705882 | 0.232549 | 4 |
| Rain Gardens | 7500 | 3 | 0 | 1000 | 0.5 | 0.5 | 0.529412 | 0.204412 | 5 |
| Public Edible Gardens | 2000 | 2 | 0 | 200 | 0.333333 | 0.333333 | 0.411765 | 0.145098 | 6 |
| Composting Area | 1000 | 1 | 0 | 100 | 0.166667 | 0.266667 | 0.411765 | 0.118431 | 7 |
| Planter Boxes Using Reused Wood | 250 | 0.2 | 0 | 0 | 0.066667 | 0.166667 | 0.294118 | 0.075784 | 8 |
| Planter Boxes Using Recycled Plastic | 300 | 0.2 | 0 | 0 | 0.066667 | 0.166667 | 0.294118 | 0.075784 | 8 |
| Solar-Powered Charging Stations | 5000 | 0 | 1 | 0 | 0 | 0.1 | 0.117647 | 0.032647 | 10 |
| Smart Waste Bins | 1500 | 0 | 0 | 0 | 0 | 0 | 0.117647 | 0.017647 | 11 |
| Bicycle Racks and Parking Hubs | 1500 | 0 | 0 | 0 | 0 | 0.066667 | 0 | 0.01 | 12 |
Disclaimer/Publisher’s Note: The statements, opinions and data contained in all publications are solely those of the individual author(s) and contributor(s) and not of MDPI and/or the editor(s). MDPI and/or the editor(s) disclaim responsibility for any injury to people or property resulting from any ideas, methods, instructions or products referred to in the content. |
© 2025 by the authors. Licensee MDPI, Basel, Switzerland. This article is an open access article distributed under the terms and conditions of the Creative Commons Attribution (CC BY) license (http://creativecommons.org/licenses/by/4.0/).
Copyright: This open access article is published under a Creative Commons CC BY 4.0 license, which permit the free download, distribution, and reuse, provided that the author and preprint are cited in any reuse.


