Submitted:
31 March 2025
Posted:
01 April 2025
You are already at the latest version
Abstract
Silverside fishes in Chile, abundant in marine and freshwater habitats, are classified in two genera: Odontesthes and Basilichthys. Both genera have widespread distributions across southern South America, with marine origins. Despite extensive information on Chilean freshwater silversides and their overlapping distributions along a latitudinal gradient, their taxonomy and diversification remain contentious. This study examines the diversity of Chilean silversides using RADseq genomic data from 78 Odontesthes and 60 Basilichthys individuals, covering most of their range. Phylogenetic and structural analyses of approximately 20,000 SNPs reveal some geographic variation but indicate no differentiation between Odontesthes mauleanum and O. brevianalis. The genus Basilichthys, in contrast, presents a disjunct distribution, with populations in coastal rivers of Peru (B. semotilus) that are separated from Chilean populations by the Atacama Desert. Chilean Basilichthys, traditionally classified as B. microlepidotus and B. australis until 2012 also show no genetic differentiation consistent with species boundaries but exhibit latitudinal differences consistent with isolation by distance. The contrasting patterns of genetic differentiation exhibited by species of these genera may be explained by the more frequent exchange with marine species for Odontesthes that do not occur in Basilichthys, in addition to the recent geological history of glaciations affecting the southern range of their distribution.
Keywords:
RADseq
; Population structure
; latitudinal gradient
1. Introduction
The freshwater fish fauna of Chile, due to its geographical isolation, exhibits notable differences compared to other American regions, characterized by low richness and a high level of endemism. Some species are restricted to two or three river basins [1,2,3]. Over the past 10 million years, the Chilean landscape has undergone significant changes due to geological and climatic processes [4], shaping the topography, ecosystems, and distribution of the vegetation distribution in different regions of the country. The gradual and continuous formation of the Andes Mountain range has been a key factor in this process, leading to the formation of valleys, mountains, and volcanoes in the region. This mountain range has significantly influenced climatic patterns and the distribution of water resources in Chile. In the northern area, the dry and arid climate gave rise to the formation of the Atacama Desert, considered one of the driest deserts in the world. However, there have also been climatic fluctuations and interglacial episodes with wetter periods, allowing for the existence of temporary vegetation and water bodies in the region. In the southern region of Chile, Patagonia has witnessed dramatic changes in the extent of glaciers and vegetation patterns over the last 10 million years. These periods have been marked by glacier advances and retreats, leaving a significant imprint on the landscape, as evidenced by rivers fed by melting ice and the formation of lakes, providing new habitats [5,6]. Glacier-related phenomena directly influence the distribution of genetic diversity through population size reduction (resulting in genetic bottlenecks) and the displacement of entire populations, and indirectly through their effects on landscapes, such as the rearrangement of hydrographic basins [7]. River hydrology and geology may have influenced the evolution of relatively small body size of most native fish species and the ability to ascend streams above 1000 m in altitude, except for those found in systems of the high Andean lands [1].
The Chilean silverside are represented in the region by the family Atherinopsidae, tribe Sorgentinini. Two genera of this family are found in Chile, Odontesthes Evermann & Kendall 1906, which has protractile maxillaries, and Basilichthys Girard 1855 without a protractile mouth, which separates it clearly from the other genus [8]. Both taxa are widely distributed in the region and have been associated with marine origin due to their high salt tolerance. Information on species of these genera is abundant, however, the taxonomy, distribution, evolution and diversification processes in this group are still controversial. Basilichthys is restricted to the western slopes of the Andes Range in Chile and Peru while Odontesthes has marine and freshwater species that inhabit both Pacific and Atlantic slopes and coastal areas. Previous phylogenetic analyses and ancestral habitat inference have suggested that these genera originated in a euryhaline habitat around 22 Ma [9]. In constrast, Hughes et al. [10] suggested that the ancestral distribution area for the same ancestor was the Pacific Ocean. More generally, some studies suggest that marine-to-freshwater habitat transitions might have accelerated evolutionary rates of diversification in many fish lineages [11,12,13], giving rise to the classical theory called “Ecological Opportunity” [14,15]. This theory attempts to explain the high diversity of freshwater fish species existing today based on the idea that habitat changes promote speciation, morphological variation, and resource partitioning, thus giving rise to further diversification or adaptive radiations. Changes in habitat styles and distribution areas seem to play an important role in the evolution of the Sorgentinini tribe [9,10,16,17].
Two freshwater species of the Odontesthes genus live in Chile [18]: Odontesthes mauleanum (Steindachner 1896) is commonly found in Andean lakes and deep rivers from the Maule River basin in the north to Lake Llanquihue in the south [8]. In lakes, this species feeds mainly on zooplankton, while in rivers it usually feeds on benthic macroinvertebrates [19]. Like other Atherinids it has rapid growth, reaching 60-100 mm in the first year of life; growth predictions show a total length of 30 to 40 cm at eight years. The second species that lives in Chile is Odontesthes brevianalis (Günther 1880), a silverside that lives in estuarine and coastal river systems in Chile from La Serena in the north to Chiloé Island in the south [8], eating small mollusks and zooplankton. It has been reported to reach up to 40 cm in total length at four year [18]. Mature specimens have been found in spring, but detailed information on their reproduction is still lacking [20]. Morphological distinction between these two species in the field is problematic—the only diagnostic trait is the presence of scales that are noticeably crenulate along the side of the body (O. mauleanum) or only on the caudal peduncle (O. brevianalis) [8]. An earlier molecular study based on mitochondrial DNA (mtDNA) and RADseq data [10] reported no segregation of mtDNA haplotypes between these two species and some differentiation among populations based on RADseq data but with uncertain support for species boundaries due to limited taxon sampling.
Currently, two species of the genus Basilichthys are recognized in freshwater habitats on the western versant of the Andes in Chile: B. microlepidotus (Jenyns 1841) and B. semotilus (Cope 1874). The distribution of B. semotilus ranges from the Reque River in Perú to the Loa River in Northern Chile, whereas B. microlepidotus is found from Central Chile (Hauasco River) south to Chiloé Isalnd [8]. Previously, a third species was recognized (B. australis Eigenmann 1928) for populations located to the south of the Aconcagua basin, but Veliz et al. [21] showed that this species and B. microlepidotusform a monophyletic group and share the most common mitochondrial haplotypes. Morphologically, these two species also are hard to distinguish based on the presumed diagnostic characters such as the number of scales along the lateral line or the number of rays in the fins. For these reasons, B. microlepidotus is considered the valid species based on priority and B. australis a junior synonym [21]. As with most atherinids, B. microlepidotus grows rapidly, reaching around 12 cm in total length in the first year of life and begins to reproduce in the first year [22,23]. It reaches a maximum total length of 30 cm. Spawning begins in spring when the water temperature reaches 15°C and continues throughout the spring and summer months. Maturation begins at one year of age. It feeds on benthos and is a predator of aquatic macroinvertebrates [24].
The silversides, Odontesthes brevianalis, O. mauleanum, and Basilichthys microlepidotus, are some of Chile’s endemic species currently classified as Vulnerable on the Red List of Threatened Species [25] due to the presence of invasive species and habitat fragmentation [18,26]. However, information on these species remains scarce, and population analyses are still lacking. Hence, the objective of this study is to analyze the diversity within and among species of Chilean silversides using genomic data (RADseq) to better characterize the genetic boundaries between species. Our first aim is to investigate the genetic differentiation between the species O. brevianalis and O. mauleanum, which are very difficult to distinguish morphologically. The second aim is to confirm the lack of differentiation between B. australis and B. microlepidotus. These analyses include assessment of population structure for all species.
2. Materials and Methods
2.1. Study Area and Sample Collection
Samples were collected by seining between 2004 and 2007 with permission from National Authority granted to EMH and immediately killed via an overdose of MS-222, with fin clips preserved in 95% ethanol for DNA extraction. For this study, we analyzed 79 individuals of Odontesthes collected from 11 localities and 60 individuals of Basilichthys from 19 localities spanning their distributional range in Chile (Figure 1, Figure S1, Table S1). Initial assignment of individuals of Odontesthes to species was based on locality: estuarine or coastal fishes were assigned to O. brevianalis, while individuals from lakes and deep rivers to O. mauleanum [8]. Outgroup taxa (O. regia) were obtained from marine coastal sites. For the genus Basilichthys, we assigned individuals into North and South groups based on collection locatily, while intermediate localities in the Aconcagua and Maipo River basins where the distribution of B. microlepidotus “north” and B. microlepidotus“south” overlapped were initially labeled as Basilichthys sp. Outgroup taxa (O. semotilus) were obtained from the Loa River.
2.2. ddRAD Sequences
Genomic DNA was extracted in 96-well plate format on a Gene Prep (Autogen), following manufacturer’s instructions, at the Laboratory of Analytic Biology at the National Museum of Natural History. Genomic libraries were generated following the original ddRAD sequencing protocol [27] at the University of Virginia Sequencing and Genomics Facility, modified to use MseI and PstI restriction enzymes and a 350-550 bp size selection to be compatible with previous ddRADseq data generated for Odontesthes [10]. Paired-end libraries were sequenced on two lanes of an Illumina HiSeq 4000 at the University of Chicago Genomics Facility. Sequences were demultiplexed, quality filtered, and assembled into ddRAD loci using ipyrad v. 0.7.30 [28] using the following settings: Assembly method de novo, 5 as Max low quality base calls, 0.02 as Max # SNPs per locus, 5 as max low-quality base, 0.5 of Max heterozygous sites per locus, 6 of mindepth_majrule, and 0.85 of clust_threshold. We performed four different datasets (Table 1). The first includes two species of Odontesthes: O. brevianalis y O. mauleanum and an outgroup that was composed by O. regia N= 9. The second includes only individuals of O. brevianalis and O. mauleanum. The third dataset includes B. semotilus, B. microlepidotus (north and south) and Basilichthys sp. And the fourth scheme comprised the third datased without B. semotilus (Table 1). We performed additional filtering on datasets 2 and 4 (Table 1) with VCFtools v.0.1.16 [29], adjusting for missing data (–max-missing 0.75 for Odontestshes and 0.98 for Basilichthys) because some analyses are more sensitive to missing data.
2.3. Data Analyses
Phylogenetic reconstructions were run using the datasets 1 and 3: Odontesthes + outgroup and all Basilichthys species.
Concatenated ddRAD loci were analyzed under Maximum Likelihood using IQ-Tree [30]. We selected the best-fitting model with ModelFinder [31] and generated 1000 UFBoot replicates to assess branch support [32]. The ASC option was used to correct for an ascertainment bias in the likelihood calculations, given that SNPs assemblies consist only of variable sites.
All subsequent analyses were carried out on datasets without ougroup for Odontesthes (dataset 2) and without B. semotilus for the genus Basilichthys (dataset 4). A phylogenetic network was estimated using SplitsTree4 v.4.17.1 [33] with the best-fitting model, the Neighbour-Net algorithm, and statistical support for branches were calculated using 1000 replicates.
Additional downstream analyses were conducted in R [34]. To evaluate and identify structures or subgroups within a species or group of species, we performed a Structure analysis using the LEA package [35] with the “snmf” function, which estimates the optimal number of groups based on the criterion of entropy. The cross-entropy criterion is based on the prediction of masked genotypes to evaluate the fit of a model with K populations. This criterion helps to choose the number of ancestral populationsA lower cross entropy value means better performance in terms of predictability. For this analysis, we tested from k = 2 to k = 10 groups.
Principal Component Discriminant Analysis (DAPC) was implemented in the Adegenet v.2.0 package [36]. This method does not make assumptions about population models, but instead defines synthetic variables for which genetic variation is maximized between groups of individuals (K) and minimized within groups. For this analysis, we transformed the genepop file into a genind object with the “genepop_to_genind” function. Then, the “find.clusters” function was used to evaluate K-means ranging from 1 to 10, and the best supported number of clusters was identified with the Bayesian Information Criterion (BIC).
To eliminate potentially atypical SNPs that do not follow the assumption of neutrality in the population structure analyses, we performed a Principal Component Analysis (PCA) with the pcadapt package [37] from the VCF file obtained from IPYRAD. Before performing the PCA, test statistics and p values were calculated based on the correlations between the SNPs and the first K principal components (PCs). Through this study, we analyzed how our individuals were distributed on a plane.
To assess the role of geographical distance on genetic structuration, we used the Mantel test [38] with the ade4 package [39]. For this end, we built a matrix of genetic distance by localities, with hierfstat package [40], and a matrix of geographical distance. This was performed only for the populations of interest, datasets 2 and 4. We also constructed genetic distance matrices considering outgroups, O. regia for Odontesthes and B. semotilus for Basilichthys (datasets 1 and 3), in order to verify how distant these species were.
To explicitly asssess species boundaries, we used Bayes Factors Delimitation (BFD; [41]) implemented in the SNAPP template of BEAST 2 [42]. This approach allows for the simultaneous comparison of models with different numbers of species and varying sample assignments to species. To achieve this, we conducted two separate analyses for each genus. First, we included outgroups (datasets 1 and 3) to validate the correct species delimitation by considering species with no taxonomic uncertainty. The second analysis focused exclusively on the species under study (datasets 2 and 4), where we evaluated several models varying between two and three species. These models were based on: (a) field-identified species, (b) DAPC groupings, and (c) Structure groupings (see below). For each dataset, additional filtering was performed by removing missing data using VCFtools v.0.1.16 [29] (Table 1 “SNPs VCF”). This assembly was converted to NEXUS binary format in PGDSpider v.2.1.1.5 [43]. To estimate the marginal likelihood of each species delimitation model, we conducted five independent path sampling analyses (α = 0.3) using 40 steps with an MCMC length of 300,000 generations and a pre-burnin of 30,000. We ranked the models by their average marginal likelihoods (MLE) and calculated the Bayes Factors as BF = 2 ×(MLE1 - MLE0), where MLE0 corresponds to model A and MLE1 to each alternative model [43]. A positive BF value indicates support in favor of model 1 while a negative BF value indicates support in favor of model 0. The strength of support for a model was obtained through the BF model selection statistic (calculated as 2 × ln (BF)), and assessed in the following manner: 0 ⩽ 2 × ln(BF) ⩽ 2 reflects weak support for model 1; 2 ⩽ 2 × ln(BF) ⩽ 6 reflects positive support; 6 ⩽ 2 × ln(BF) ⩽ 10 reflects strong support; and 2 × ln(BF) ⩾ 10 reflects decisive support [44].
Hughes et al. [10] recorded a recent mitochondrial capture of the common marine haplotypes of O. regia and O. smitti in a freshwater population from Lake Llanquihue of O. mauleanum, suggesting one or more instances of marine invasions or hybridization among species. To test the putative effect of such hybridization on our results based on nuclear genomic signal, we repeat the phylogenetic reconstructions and the network and the structure analyses without this population (Figures S3–S5).
3. Results
3.1. Data Analyses
Table 1 shows the different data sets used for our analyses, with the number of individuals, species, total SNPs, number of loci, missing data, and different parameters taken from IQ-TREE such as: parsimony informative sites, singletons sites and distinct patterns.
The phylogenetic tree for the species O. brevianalis and O. mauleanum was rooted with O. regia. The best nucleotide substitution model that fit the data was TVMe+ASC+R3 according to BIC (Table 1). The reciprocal monophyly of O. brevianalis and O. mauleanum was not supported in our results (Figure 2a) due to a few misplaced samples from localities TOP and HUI. The phylogenetic results for Basilichthys (tree with Odontesthes as outgroup is shown in Figure S2) show that individuals identified as B. microlepidotus ‘north’ and ‘south’ and Basilichthys sp. formed a single clade but following a pattern corresponding with latitude (Figure 2b) that is consistent with the geographical distribution of individuals (Figure 1b and Figure S1b).
To analyze gentic relationships at a finer scale, phylogenetic networks were conducted on the individuals of O. brevianalis and O. mauleanum (Figure 3a), and B. microlepidotus north, B. microlepidotus south, and Basilichthys. sp (Figure 3b). The results are consistent with the phylogenetic analyses (Figure 2), without a well-marked separation by species.
The Structure analysis for O. brevianalis and O. mauleanum (Figure 4a, see also Figure S6a) supported three genetic groups: one cluster was represented by the specimens identified as O. brevianalis from RMAU (Maullin River) that were different from the rest of O. brevianalis; a second cluster was represented by individuals of O.mauleanum from LLA (Llanquihue Lake); a third cluster grouped individuals of O. brevianalis from all other localities. Individuals from LCAL (Calafquen Lake) had mixed ancestry combining the three clusters. The DAPC analysis supported two different clusters, one with the majority of O. mauleanum with the LLA label (Figure 4a), similar to the second cluster supported by Structure mentioned above.
Both the Structure analysis and the DAPC for Basilichthys divided the data set into three clusters (Figure 4b): the first was composed by most of the Basilichthys sp. and half of the B. microlepidotus south (grey color for Structure and white circles in DAPC, see also Figure S6b); the second cluster grouped most of B. microlepidotusnorth individuals and one individual of B. microlepidotus south (pink color in Structure and white squares in DAPC) and finally, a cluster with the remaining B. microlepidotus south, as well as two individuals of Basilichthys sp with NIL label (from the Nilahue River).
PCA results agree with previous analyses (Figure 5). For Basilichthys individuals (Figure 5b), Basilichthys sp. were closer to B. microlepidotus south than to B. microlepidotus north.
The Mantel test resulted in no significant correlation between genetic and geographic distances for the Odontesthes species (p = 0.193). However, a significant result was obtained for Basilichthys (p = 0.003), indicating isolation by distance among pairs of localities. The genetic distances (Table S3) observed between O. regia and all the localities of O. mauleanum and O. brevianalis were FST = 0.8, whereas the average of the genetic distance among all the localities of O. mauleanum and O. brevianalis was around FST = 0.38. For Basilichthys, the genetic distances between B. semotilus and all the localities of B. microlepidotus (both north and south) and Basilichthys sp. were above FST = 0.9, while the average distance among these localities (without B. semotilus) was FST = 0.44.
The results for the BDF* models, for Odontesthes and Basilichthys, are summarized in Table 2. For both Odontesthes and Basilichthys (with and without B. semotilus), the models based on Structure were the best, which considers that the three groups given by the Structure analysis were the top ranked model (highest MLE value).
4. Discussion
In previous studies it has been seen that several species belonging to the genera Odontesthes and Basilichthys are difficult to distinguish both at the morphological and genetic levels [10,21]. That is why in this work we have analyzed these two sister genera throughout Chile using genomic data.
4.1. Odontesthes
Our results indicate that Odontesthes mauleanum and O. brevianalis do not form reciprocal monophyletic clades, which would be expected under traditional species delimitation frameworks. In contrast, a clear differentiation with the marine species O. regia was observed, both in the phylogenetic analysis (Figure 2) and in the BDF test (Table 2) when O. regia was included. Structure and BDF analyses that did not include O. regia supported three clusters for samples of O. mauleanum and O. brevianalis, but these clusters did not coincide with nominal species boundaries (Figure 4a). Therefore, they are considered a signal of population structure. Phylogenetic analyses also distinguished individuals from three localities: RMAU (from the Maullin River), LCAL (from the Calafquen Lake locality), and LLA (from the Llanquihue Lake) (Figure 2a and Figure 3a). The Structure analysis revealed a distinct grouping (Figure 4a), where individuals from LCAL shared genetic affinities with individuals identified as O. brevianalis. Meanwhile, the RMAU and LLA populations formed separate clusters. Not surprisingly, the BDF analysis (Table 2) showed that the grouping obtained through Structure best defines the boundaries of the Odontesthes individuals under study.
DAPC results (Figure 4a) revealed only two clusters, with the main differentiation driven by the majority of LLA individuals. The Mantel test was not significant, primarily due to the high genetic distances (Table S2) observed in the LCAL population despite its small geographic separation. Collectively, these genomic data suggest that the separation between O. brevianalis and O. mauleanum is not supported, highlighting the complex population structure within these putative (nominal) species.
Hughes et al. [10] provided evidence of recent mitochondrial introgression, where marine haplotypes characteristic of O. regia were detected in a freshwater population of O. mauleanum from the Lake Llanquihue (LLA). Their biological data led them to propose that this phenomenon might have been caused by mitochondrial capture after a marine incursion into freshwater environments, resulting in a temporary secondary contact zone between O. mauleanum and O. regia. These marine mitochondrial haplotypes appear to be widespread in Lake Llanquihue, a significant water body in Chile’s Los Lagos District, situated around 22 km north of the Reloncaví Sound. The marine incursion into freshwater environments by O. regia and the temporary secondary contact with the LLA population may result in the genomic differentiation of this population with respect to others (which have not undergone hybridization with O. regia).
Lake Llanquihue has likely experienced glacial coverage by the Llanquihue Glacier on at least three occasions over the past 70,000 years, with the most recent glaciation concluding roughly 14,000 years ago [45,46]. Interestingly, the origins of the introgressed haplotypes may extend further back in time, potentially associated with the end of the colder Patagonian glaciation around 700,000 years ago or the larger Patagonian glaciation approximately 1.2 million years ago [47]. However, there is no concrete geological evidence supporting marine incursions during these glacial periods. Nevertheless, it is possible that some O. regia individuals may have colonized new areas (dispersal) or invaded new ecological regimes (resource abundance) in less saline environments. Silversides have a great adaptability to different salinities. For example, a stable population of O. argentinensis, which is the marine species most widely distributed in the Atlantic Ocean, has been observed living inside the Mar Chiquita Lagoon (where the water is mixo-oligohaline) [48,49,50]. Genomic studies have shown that this population of O. argentinensis is capable of hybridizing with O. bonariensis (a freshwater species) when salinities are suitable for both species. This colonization of less saline bodies of water may also have occurred with O. regia individuals in Lake Llanquihue, thus facilitating secondary contact with the population of O. mauleanum that lives in the LLA.
Perhaps these secondary contacts with other species were more frequent than expected and caused gene mixing more than once. This could explain why the Mantel test was not significant for the populations of the O. mauleanum and O. brevianalis groups and therefore no isolation by distance was observed. Some of the populations (LLA, LCAL, RMAU) are very close geographically but are very different at the genomic level.
Despite these putative secondary contacts, the two closely related parental species (O. regia and O. mauleanum/O. brevianalis) are well differentiated morphologically and all individuals analysed in this study were unambiguously assigned to either group based on genetic data analyses (Figure 2a and Figure S1). The highly supported reciprocal monophyly and a high FST value, suggesting that the hybridization rate between these groups is not sufficient to alter the genomic identity.
4.2. Basilichthys
Based on the results of the species tree for Basilichthys and the calculated FST values, we confirm the clear separation between B. semotilus and B. microlepidotus (Figure 2b and Figure S2). These findings are consistent with previous research based on nuclear and mitochondrial markers [9]. This evidence reinforces the taxonomic distinction between these species and supports the validity of the classification proposed thus far [21]. Unfortunately, the number of B. semotilus specimens analyzed in this study was very low compared to the species’ extensive distribution range. Expanding the sampling to northern basins, including those in Peru, could reveal even greater diversity within the genus. Between the populations of B. semotilus and other Basilichthys species lies the Atacama Desert, a significant barrier to gene flow. The Loa River, where the B. semotilus specimens were collected, was historically considered “empty” of fish [51,52]. However, it is now known to be inhabited by B. semotilus and Trichomycterus punctulatus [2].
The results within B. microlepidotus from the network analysis, Structure, DAPC, and PCA indicate some genetic differentiation among individuals, corresponding to their geographical locations, particularly latitude. The phylogenetic reconstruction (Figure 2b) and network analysis (Figure 3b) show that individuals identified as B. microlepidotus (north) consistently cluster at the opposite end from B. microlepidotus (south), with Basilichthys sp. positioned between them—a pattern consistent with the sampling map (Figure 1b). Thus, the phylogenetic relationships among individuals reflect the geographical proximity of the sampled localities. This result aligns with the significant Mantel test findings (Table S3). Both the Structure and DAPC analyses divide the data into three clusters, almost perfectly matching the field identification (B. microlepidotus north, Basilichthys sp. + some B. microlepidotus south, and the southernmost B. microlepidotus north). Regarding the BDF analysis for Basilichthys, it was also evident that the grouping obtained through Structure best defines the boundaries of the individuals under study. These findings suggest that B. microlepidotus has undergone complex evolutionary and adaptive processes, with migration and dispersal playing critical roles. Despite the significant distances between some sampling sites, which belong to rivers that independently flow into the sea, B. microlepidotus appears to exhibit a stepping-stone distribution. As a freshwater species, it raises the question of how dispersal between basins occurs. Previous studies suggest that individuals may use marine routes for such movements [53].
On the other hand, B. microlepidotus also faces threats from invasive species, such as salmonids, and habitat fragmentation. However, its adaptability and genetic diversity provide some resilience against environmental challenges [54,55]. The species’ ability to thrive in disturbed environments [56,57,58,59,60] may be a key strategy for its future survival. These findings underscore the importance of conserving B. microlepidotus populations, particularly in areas with high genetic diversity and more vulnerable populations.
The role of Glaciations and Geological Events in Shaping Genetic Patterns
Studies on freshwater fish suggest that events during the last 1–3 million years (Ma) have been crucial in shaping the current patterns of genetic diversity within the Patagonian freshwater fauna [6,61]. Campanella et al. [9] and Hughes et al. [10] propose that the divergence of O. brevianalis + O. mauleanum and B. microlepidotus occurred approximately 3 Ma, influenced by the geological and climatic conditions of the region.
During the Quaternary glacial cycles, extensive glaciers covered much of southern Chile, forming a continuous ice sheet from mid-elevations at approximately 38° south latitude [5]. The ice expanded east and west from the Andes, advancing along valleys and covering highland lakes and streams. This cooling period, coupled with increased regional aridity, likely drove aquatic species away from the Andean divide and toward newly exposed continental shelves as sea levels dropped. When the glaciers receded, meltwater rivers and newly formed lakes created habitats that enabled species expansion [47]. East of the Andes, the formation of postglacial lakes and stream systems facilitated connections between drainage systems, especially in large canyons excavated by glaciers over the last 3–4 Ma [45].
For Basilichthys, the marine environment has historically been considered a barrier. However, as shown by Quezada-Romegialli et al. [53], this barrier may not be as impermeable as previously thought and as observed in its sister genus, Odontesthes. Increased glacial coverage during colder periods likely drove populations to progressively transition from marine environments into freshwater systems, particularly in southern basins. This dynamic interplay between glaciation, geological changes, and environmental adaptation highlights the complex processes shaping the genetic diversity of Patagonian freshwater fish. All these changes have probably also played an important role in the plasticity and broad adaptive capacity of these species. Furthermore, they may have led to marine-freshwater habitat transitions accelerating the evolutionary rates of fish in the region as indicated by the “Ecological Opportunity” [14,15].
5. Conclusions
The ichthyofauna of Chile is characterized by having a low richness, compared to other South American regions, this is due to its isolation by the Andes Mountain chain, which also gives it a high degree of endemism. Due to this high endemism, better knowledge at the population level of the species that inhabit this country is necessary to develop effective conservation plans and a new conservation classification status.
We have confirmed the synonymy of B. microlepidotus (valid species) with B. australis, and our results also suggest a possible synonymy between O. brevianalis and O. mauleanum, which further reduces the number of species for this isolated region of the world. This genetic structure of these species is possibly the product of factors such as migration and natural selection. Geographic distribution and distance between populations seem to play an important role in the genetic differentiation of Basilichthys species, but not for Odontesthes where secondary contact with other species was observed.
The results of this work contribute to the knowledge of the evolution and genetic diversity in the genus Basilichthys and the Chilean species of the genus Odontesthes, about which there is little information. In addition, they provide relevant information for the conservation of these species that are in a Vulnerable state of conservation. However, more research is needed to better understand the factors driving genetic differentiation of silverside populations.
Supplementary Materials
The following supporting information can be downloaded at the website of this paper posted on Preprints.org, Figure S1. Map of sampling points with labels of individuals. a) Odontesthes; b) Basilichthys; Figure S2. Maximum Likelihood Basilichthys tree with Odontesthes species as outgroup. Estimated under the HKY+F+R3 model in IQ-Tree, with 1,000 ultrafast bootstrap replicates; Figure S3. Maximum Likelihood Odontesthes tree without LLA (O. mauleanum of Llanquihue in Chile) indivuduals. Estimated under the TVMe+ASC+R2 model in IQ-Tree, with 1,000 ultrafast bootstrap replicates; Figure S4. Phylogenetic network of Odontesthes tree without LLA (O. mauleanum of Llanquihue in Chile) indivuduals; Figure S5. Structure analysis of Odontesthes tree without LLA (O. mauleanum of Llanquihue in Chile) indivuduals; Figure S6. Map of sampling points coloured by Structure groups. a) Odontesthes; b) Basilichthys; Table S1. Table of water bodies under study with geographical and physicochemical characteristics. PPMA: maximum annual rainfall; QMA maximum annual flow. Table S2. Matrix of genetic distances between pairs of localities for Odontesthes. A) Including O. brevianalis, O. mauleanum, and O. regia; B) Including only localities of O. brevianalis and O. mauleanum. The highest values are highlighted in yellow; Table S3. Matrix of genetic distances between pairs of localities for Basilichthys. A) Including localities of B. microlepidotus (north and south), Basilichthys sp., and B. semotilus; B) Including only localities of B. microlepidotus (north and south) and Basilichthys sp. The highest values are highlighted in yellow.
Author Contributions
Conceptualization, all authors.; methodology, Y.B.; Y.P.C. and G.O.; software, Y.B.; Y.P.C. and G.O.; validation, Y.B.; Y.P.C. and G.O.; formal analysis, Y.B.; investigation, all authors; resources, all authors.; data curation, all authors; writing—original draft preparation, Y.B.; Y.P.C. and G.O.; writing—review and editing, all authors; visualization, all authors; supervision, G.O.; project administration, G.O.; funding acquisition, Y.P.C. and G.O. All authors have read and agreed to the published version of the manuscript.
Funding
Fondo para la Investigación Científica y Tecnológica (PICT 2021-GRF-TII-0022); Consejo Nacional de Investigaciones Científicas y Técnicas (PIBBA-0012).
Institutional Review Board Statement
The species sampled are not protected under wildlife conservation laws (local restrictions, IUCN or CITES listed species). No experimental activities were conducted on live specimens in this study. Fish were collected with the permission of the local authorities in Chile.
Data Availability Statement
Raw reads for ddRAD sequences are archived under NCBI BioProject PRJNA1135156.
Acknowledgements
All our colleagues working with us at Universidad nacional de La Plata; Universidad de Concepción; and George Washington University.
Conflicts of Interest
The authors declare no conflicts of interest.
References
- Vila, I.; Fuentes, L.; Contreras, M. Peces Límnicos de Chile. Boletín Mueso Nac. Hist. Nat. Chile 1999, 48, 61–75. [Google Scholar] [CrossRef]
- Dyer, B.S. Revision Sistematica De Los Pejerreyes De Chile (Teleostei, Atheriniforme). Estud. Oceanol. 2000, 19, 99–127. [Google Scholar]
- Habit, E.; Dyer, B.S.; Vila, I. Estado de Conocimiento de Los Peces Dul- Ceacuícolas de Chile. Gayana 2006, 70, 100–112. [Google Scholar]
- Ramos, V. The Birth of Southern South America. Am. Sci. 1989, 77, 444–450. [Google Scholar]
- Hulton, N.R.J.; Purves, R.S.; McCulloch, R.D.; Sugden, D.E.; Bentley, M.J. The Last Glacial Maximum and Deglaciation in Southern South America. Quat. Sci. Rev. 2002, 21, 233–241. [Google Scholar] [CrossRef]
- Ruzzante, D.E.; Walde, S.J.; Cussac, V.E.; Dalebout, M.L.; Seibert, J.; Ortubay, S.; Habit, E. Phylogeography of the Percichthyidae (Pisces) in Patagonia: Roles of Orogeny, Glaciation, and Volcanism. Mol. Ecol. 2006, 15, 2949–2968. [Google Scholar] [CrossRef]
- Zemlak, T.S.; Habit, E.M.; Walde, S.J.; Carrea, C.; Ruzzante, D.E. Surviving Historical Patagonian Landscapes and Climate: Molecular Insights from Galaxias Maculatus. BMC Evol. Biol. 2010, 10, 1–18. [Google Scholar] [CrossRef] [PubMed]
- Dyer H, B.S. Systematic Revision of the South American Silversides (Teleostei, Atheriniformes). Biocell 2006, 30, 69–88. [Google Scholar]
- Campanella, D.; Hughes, L.C.; Unmack, P.J.; Bloom, D.D.; Piller, K.R.; Ortí, G. Multi-Locus Fossil-Calibrated Phylogeny of Atheriniformes (Teleostei, Ovalentaria). Mol. Phylogenet. Evol. 2015, 86, 8–23. [Google Scholar] [CrossRef]
- Hughes, L.C.; Cardoso, Y.P.; Sommer, J.A.; Cifuentes, R.; Cuello, M.; Somoza, G.M.; González-Castro, M.; Malabarba, L.R.; Cussac, V.; Habit, E.M.; et al. Biogeography, Habitat Transitions and Hybridization in a Radiation of South American Silverside Fishes Revealed by Mitochondrial and Genomic RAD Data. Mol. Ecol. 2020, 29, 738–751. [Google Scholar] [CrossRef]
- Betancur-R, R.; Ortí, G.; Stein, A.M.; Marceniuk, A.P.; Alexander Pyron, R. Apparent Signal of Competition Limiting Diversification after Ecological Transitions from Marine to Freshwater Habitats. Ecol. Lett. 2012, 15, 822–830. [Google Scholar] [CrossRef]
- Betancur-R, R.; Ortí, G.; Pyron, R.A. Fossil-Based Comparative Analyses Reveal Ancient Marine Ancestry Erased by Extinction in Ray-Finned Fishes. Ecol. Lett. 2015, 18, 441–450. [Google Scholar] [CrossRef]
- Meier, J.I.; Stelkens, R.B.; Joyce, D.A.; Mwaiko, S.; Phiri, N.; Schliewen, U.K.; Selz, O.M.; Wagner, C.E.; Katongo, C.; Seehausen, O. The Coincidence of Ecological Opportunity with Hybridization Explains Rapid Adaptive Radiation in Lake Mweru Cichlid Fishes. Nat. Commun. 2019, 10. [Google Scholar] [CrossRef]
- Ricklefs, R.E.; Schluter, D. Species Diversity: Regional and Historical Influences. In Species Diversity in Ecological Communities: Historical and Geographical Perspectives; Ricklefs, E.E., Schluter, D., Eds.; The University of Chicago Press: Chicago, IL, USA, 1993; pp. 350–363. [Google Scholar]
- Losos, J.B. Adaptive Radiation, Ecological Opportunity, and Evolutionary Determinism: American Society of Naturalists E. O. Wilson Award Address. Am. Nat. 2010, 175, 623–639. [Google Scholar] [CrossRef]
- Hughes, L.C.; Somoza, G.M.; Nguyen, B.N.; Bernot, J.P.; González-Castro, M.; Díaz de Astarloa, J.M.; Ortí, G. Transcriptomic Differentiation Underlying Marine-to-Freshwater Transitions in the South American Silversides Odontesthes Argentinensis and O. Bonariensis (Atheriniformes). Ecol. Evol. 2017, 7, 5258–5268. [Google Scholar] [CrossRef]
- González-Castro, M.; Cardoso, Y.P.; Hughes, L.C.; Ortí, G. Hybridization Is Strongly Constrained by Salinity during Secondary Contact between Silverside Fishes (Odontesthes, Atheriniformes). Heredity 2022, 129, 233–243. [Google Scholar] [CrossRef]
- Vila, I.; Habit, E. Current Situation of the Fish Fauna in the Mediterranean Region of Andean River Systems in Chile. Fishes Mediterr. Environ. 2015, 2015, 1–19. [Google Scholar] [CrossRef]
- Klink, A.; Eckmann, R. Age and Growth, Feeding Habits, and Reproduction of Cauque Mauleanum (Steindachner 1896) (Pisces: Atherinidae) in Southern Chile. Stud. Neotrop. Fauna Environ. 1985, 20, 239–249. [Google Scholar] [CrossRef]
- Vargas, C.; Contreras, M.; Vila, I. Edad y Crecimiento de Odontesthes Brevianalis (Gunter 1880) En La Laguna Conchalí (31°53′; 71°32′), Chile. Gayana 2002, 66, 199–202. [Google Scholar] [CrossRef]
- Véliz, D.; Catalán, L.; Pardo, R.; Acuña, P.; Díaz, A.; Poulin, E.; Vila, I. The Genus Basilichthys (Teleostei: Atherinopsidae) Revisited along Its Chilean Distribution Range (21° to 40° S) Using Variation in Morphology and MtDNA. Rev. Chil. Hist. Nat. 2012, 85, 49–59. [Google Scholar] [CrossRef]
- Comte, S.; Vila, I. Modalidad Re- Productiva de Basilichthys Microlepi- Dotus (Jenyns) En El Río Choapa. (Pisces: Atherinidae). An. Mus. Hist. Nat. Valparaíso 1987, 18, 85–94. [Google Scholar]
- Comte, S.; Vila, I. Spawning of Basilichthys Microlepidotus (Jenyns). J. Fish Biol. 1992, 41, 971–981. [Google Scholar] [CrossRef]
- Bahamondes, I.; Soto, D.; Vila, I. Hábitos Alimentarios de Las Espe- Cies de Atherinidae Del Embalse Rapel. Medio Ambient. 1979, 4, 3–18. [Google Scholar]
- IUCN. The IUCN Red List of Threatened Species. Version 2024-1 Available online:. Available online: https://www.iucnredlist.org (accessed on 28 June 2024).
- Vila, I.; Veloso, A.; Schlatter, R.; Ramirez, C. Macrófitas y Vertebrados de Los Sistemas Límnicos de Chile; Editorial Universitaria: Santiago, Chile, 2006. [Google Scholar]
- Peterson, B.K.; Weber, J.N.; Kay, E.H.; Fisher, H.S.; Hoekstra, H.E. Double Digest RADseq: An Inexpensive Method for de Novo SNP Discovery and Genotyping in Model and Non-Model Species. PLoS ONE 2012, 7. [Google Scholar] [CrossRef]
- Eaton, D.A.R. PyRAD: Assembly of de Novo RADseq Loci for Phylogenetic Analyses. Bioinformatics 2014, 30, 1844–1849. [Google Scholar] [CrossRef]
- Danecek, P.; Auton, A.; Abecasis, G.; Albers, C.A.; Banks, E.; Depristo, M.A.; Handsaker, R.E.; Lunter, G.; Marth, G.T.; Sherry, S.T.; et al. The Variant Call Format and VCFtools. Bioinformatics 2011, 27, 2156–2158. [Google Scholar] [CrossRef]
- Nguyen, L.T.; Schmidt, H.A.; Von Haeseler, A.; Minh, B.Q. IQ-TREE: A Fast and Effective Stochastic Algorithm for Estimating Maximum-Likelihood Phylogenies. Mol. Biol. Evol. 2015, 32, 268–274. [Google Scholar] [CrossRef]
- Kalyaanamoorthy, S.; Minh, B.Q.; Wong, T.K.F.; Von Haeseler, A.; Jermiin, L.S. ModelFinder: Fast Model Selection for Accurate Phylogenetic Estimates. Nat. Methods 2017, 14, 587–589. [Google Scholar] [CrossRef]
- Hoang, D.T.; Chernomor, O.; Von Haeseler, A.; Minh, B.Q.; Vinh, L.S. UFBoot2: Improving the Ultrafast Bootstrap Approximation. Mol. Biol. Evol. 2018, 35, 518–522. [Google Scholar] [CrossRef]
- Huson, D.H.; Bryant, D. Application of Phylogenetic Networks in Evolutionary Studies. Mol. Biol. Evol. 2006, 23, 254–267. [Google Scholar] [CrossRef]
- R Core Team R: A Language and Environment for Statistical Computing 2023. Available online: https://www.R-project.org/.
- Frichot, E.; François, O. LEA: An R Package for Landscape and Ecological Association Studies. Methods Ecol. Evol. 2015, 6, 925–929. [Google Scholar] [CrossRef]
- Jombart, T. Adegenet: A R Package for the Multivariate Analysis of Genetic Markers. Bioinformatics 2008, 24, 1403–1405. [Google Scholar] [CrossRef]
- Luu, K.; Bazin, E.; Blum, M.G.B. Pcadapt: An R Package to Perform Genome Scans for Selection Based on Principal Component Analysis. Mol. Ecol. Resour. 2017, 17, 67–77. [Google Scholar] [CrossRef] [PubMed]
- Mantel, N. The Detection of Disease Clustering and a Generalized Regression Approach. Cancer Res. 1967, 27, 209–220. [Google Scholar] [CrossRef]
- Dray, S.; Dufour, A.B. The Ade4 Package: Implementing the Duality Diagram for Ecologists. J. Stat. Softw. 2007, 22, 1–20. [Google Scholar] [CrossRef]
- Goudet, J. HIERFSTAT, a Package for R to Compute and Test Hierarchical F-Statistics. Mol. Ecol. Notes 2005, 5, 184–186. [Google Scholar] [CrossRef]
- Leache, A.D.; Fujita, M.K. Bayesian Species Delimitation in West African Forest Geckos (Hemidactylus Fasciatus). Proc. R. Soc. B Biol. Sci. 2010, 277, 3071–3077. [Google Scholar] [CrossRef]
- Bouckaert, R.; Vaughan, T.G.; Barido-Sottani, J.; Duchêne, S.; Fourment, M.; Gavryushkina, A.; Heled, J.; Jones, G.; Kühnert, D.; De Maio, N.; et al. BEAST 2.5: An Advanced Software Platform for Bayesian Evolutionary Analysis. PLoS Comput. Biol. 2019, 15, 1–28. [Google Scholar] [CrossRef]
- Lischer, H.E.L.; Excoffier, L. PGDSpider: An Automated Data Conversion Tool for Connecting Population Genetics and Genomics Programs. Bioinformatics 2012, 28, 298–299. [Google Scholar] [CrossRef]
- Kass, R.; Raftery, A. Bayes Factors. J. Am. Stat. Assoc. 1995, 90, 773–795. [Google Scholar] [CrossRef]
- Clapperton, C.M. The Quaternary Glaciation of Chile: A Review. Rev. Chil. Hist. Nat. 1994, 67, 369–383. [Google Scholar]
- Harrison, S.; Glasser, N.F. The Pleistocene Glaciations of Chile. In Quarternary Glaciations—Extent and Chronology; Ehlers, J., Gibbard, P.L., Hughes, P.D., Eds.; Elsevier: Amsterdam, The Netherlands, 2011; pp. 739–756. [Google Scholar]
- Ruzzante, D.E.; Walde, S.J.; Gosse, J.C.; Cussac, V.E.; Habit, E.; Zemlak, T.S.; Adams, E.D.M. Climate Control on Ancestral Population Dynamics: Insight from Patagonian Fish Phylogeography. Mol. Ecol. 2008, 17, 2234–2244. [Google Scholar] [CrossRef] [PubMed]
- González-Castro, M.; Díaz De Astarloa, J.M.; Cousseau, M.B.; Figueroa, D.E.; Delpiani, S.M.; Bruno, D.O.; Guzzoni, J.M.; Blasina, G.E.; Deli Antoni, M.Y. Fish Composition in a South-Western Atlantic Temperate Coastal Lagoon: Spatialtemporal Variation and Relationships with Environmental Variables. J. Mar. Biol. Assoc. 2009, 89, 593–604. [Google Scholar] [CrossRef]
- González-Castro, M.; Rosso, J.J.; Mabragana, E.; Diaz De Astarloa, J.M. Surfing among Species, Populations and Morphotypes: Inferring Boundaries between Two Species of New World Silversides (Atherinopsidae). Comptes Rendus -Biol. 2016, 339, 10–23. [Google Scholar] [CrossRef] [PubMed]
- González-Castro, M.; Cardoso, Y.P.; Hughes, L.C.; Ortí, G. Hybridization Is Strongly Constrained by Salinity during Secondary Contact between Silverside Fishes (Odontesthes, Atheriniformes). Heredity 2022, 129, 233–243. [Google Scholar] [CrossRef]
- Ringuelet, R.A. Zoogeografía y Ecología de Los Peces de Aguas Continentales de La Argentina y Consideraciones Sobre Las Áreas Ictiológicas de América Del Sur. Ecosur 1975, 2. [Google Scholar]
- Arratia, G.; Peñafort, M.B.; Menu-Marque, S. Peces de La Región Sureste de Los Andes y Sus Probables Relaciones Biogeográficas Actuales. Deserta 1983, 7, 7. [Google Scholar]
- Quezada-Romegialli, C.; Fuentes, M.; Véliz, D. Comparative Population Genetics of Basilichthys Microlepidotus (Atheriniformes: Atherinopsidae) and Trichomycterus Areolatus (Siluriformes: Trichomycteridae) in North Central Chile. Environ. Biol. Fishes 2010, 89, 173–186. [Google Scholar] [CrossRef]
- Habit, E.; Parra, O.; Valdovinos, C. Ictiofauna De Un Sistema Fluvial Receptor De Aguas Servidas: Respuestas a Una Nueva Planta De Tratamiento (Rio Quilque, Chile Central). Gayana 2005, 69, 94–103. [Google Scholar] [CrossRef]
- Pardo, R.; Vila, I.; Capella, J.J. Competitive Interaction between Introduced Rainbow Trout and Native Silverside in a Chilean Stream. Environ. Biol. Fishes 2009, 86, 353–359. [Google Scholar] [CrossRef]
- Cortes-Miranda, J.; Véliz, D.; Flores-Prado, L.; Sallaberry, M.; Vega-Retter, C. Genetic Diversity and Origin of a Fish Population Recently Colonizing a Reservoir: The Case of Basilichthys Microlepidotus, Central Chile. Popul. Ecol. 2022, 64, 227–237. [Google Scholar] [CrossRef]
- Vega-Retter, C.; Rojas-Hernández, N.; Cortés-Miranda, J.; Véliz, D.; Rico, C. Genome Scans Reveal Signals of Selection Associated with Pollution in Fish Populations of Basilichthys Microlepidotus, an Endemic Species of Chile. Sci. Rep. 2024, 14, 1–12. [Google Scholar] [CrossRef]
- Vega-Retter, C.; Vila, I.; Véliz, D. Signatures of Directional and Balancing Selection in the Silverside Basilichthys Microlepidotus (Teleostei: Atherinopsidae) Inhabiting a Polluted River. Evol. Biol. 2015, 42, 156–168. [Google Scholar] [CrossRef]
- Vega-Retter, C.; Rojas-Hernandez, N.; Vila, I.; Espejo, R.; Loyola, D.E.; Copaja, S.; Briones, M.; Nolte, A.W.; Véliz, D. Differential Gene Expression Revealed with RNA-Seq and Parallel Genotype Selection of the Ornithine Decarboxylase Gene in Fish Inhabiting Polluted Areas. Sci. Rep. 2018, 8, 1–13. [Google Scholar] [CrossRef] [PubMed]
- Rojas-Hernandez, N.; Véliz, D.; Vega-Retter, C. Selection of Suitable Reference Genes for Gene Expression Analysis in Gills and Liver of Fish under Field Pollution Conditions. Sci. Rep. 2019, 9, 1–8. [Google Scholar] [CrossRef]
- Zemlak, T.S.; Habit, E.M.; Walde, S.J.; Battini, M.A.; Adams, E.D.M.; Ruzzante, D.E. Across the Southern Andes on Fin: Glacial Refugia, Drainage Reversals and a Secondary Contact Zone Revealed by the Phylogeographical Signal of Galaxias Platei in Patagonia. Mol. Ecol. 2008, 17, 5049–5061. [Google Scholar] [CrossRef]
Figure 1.
Map shows the sample localities of each species in Chile. a) O. brevianalis N = 52, O. mauleanum N = 27. b) B. semotilus N = 4; B. microlepidotus north N = 7; B. sp N = 10; and. B. microlepidotus south N = 39.
Figure 1.
Map shows the sample localities of each species in Chile. a) O. brevianalis N = 52, O. mauleanum N = 27. b) B. semotilus N = 4; B. microlepidotus north N = 7; B. sp N = 10; and. B. microlepidotus south N = 39.
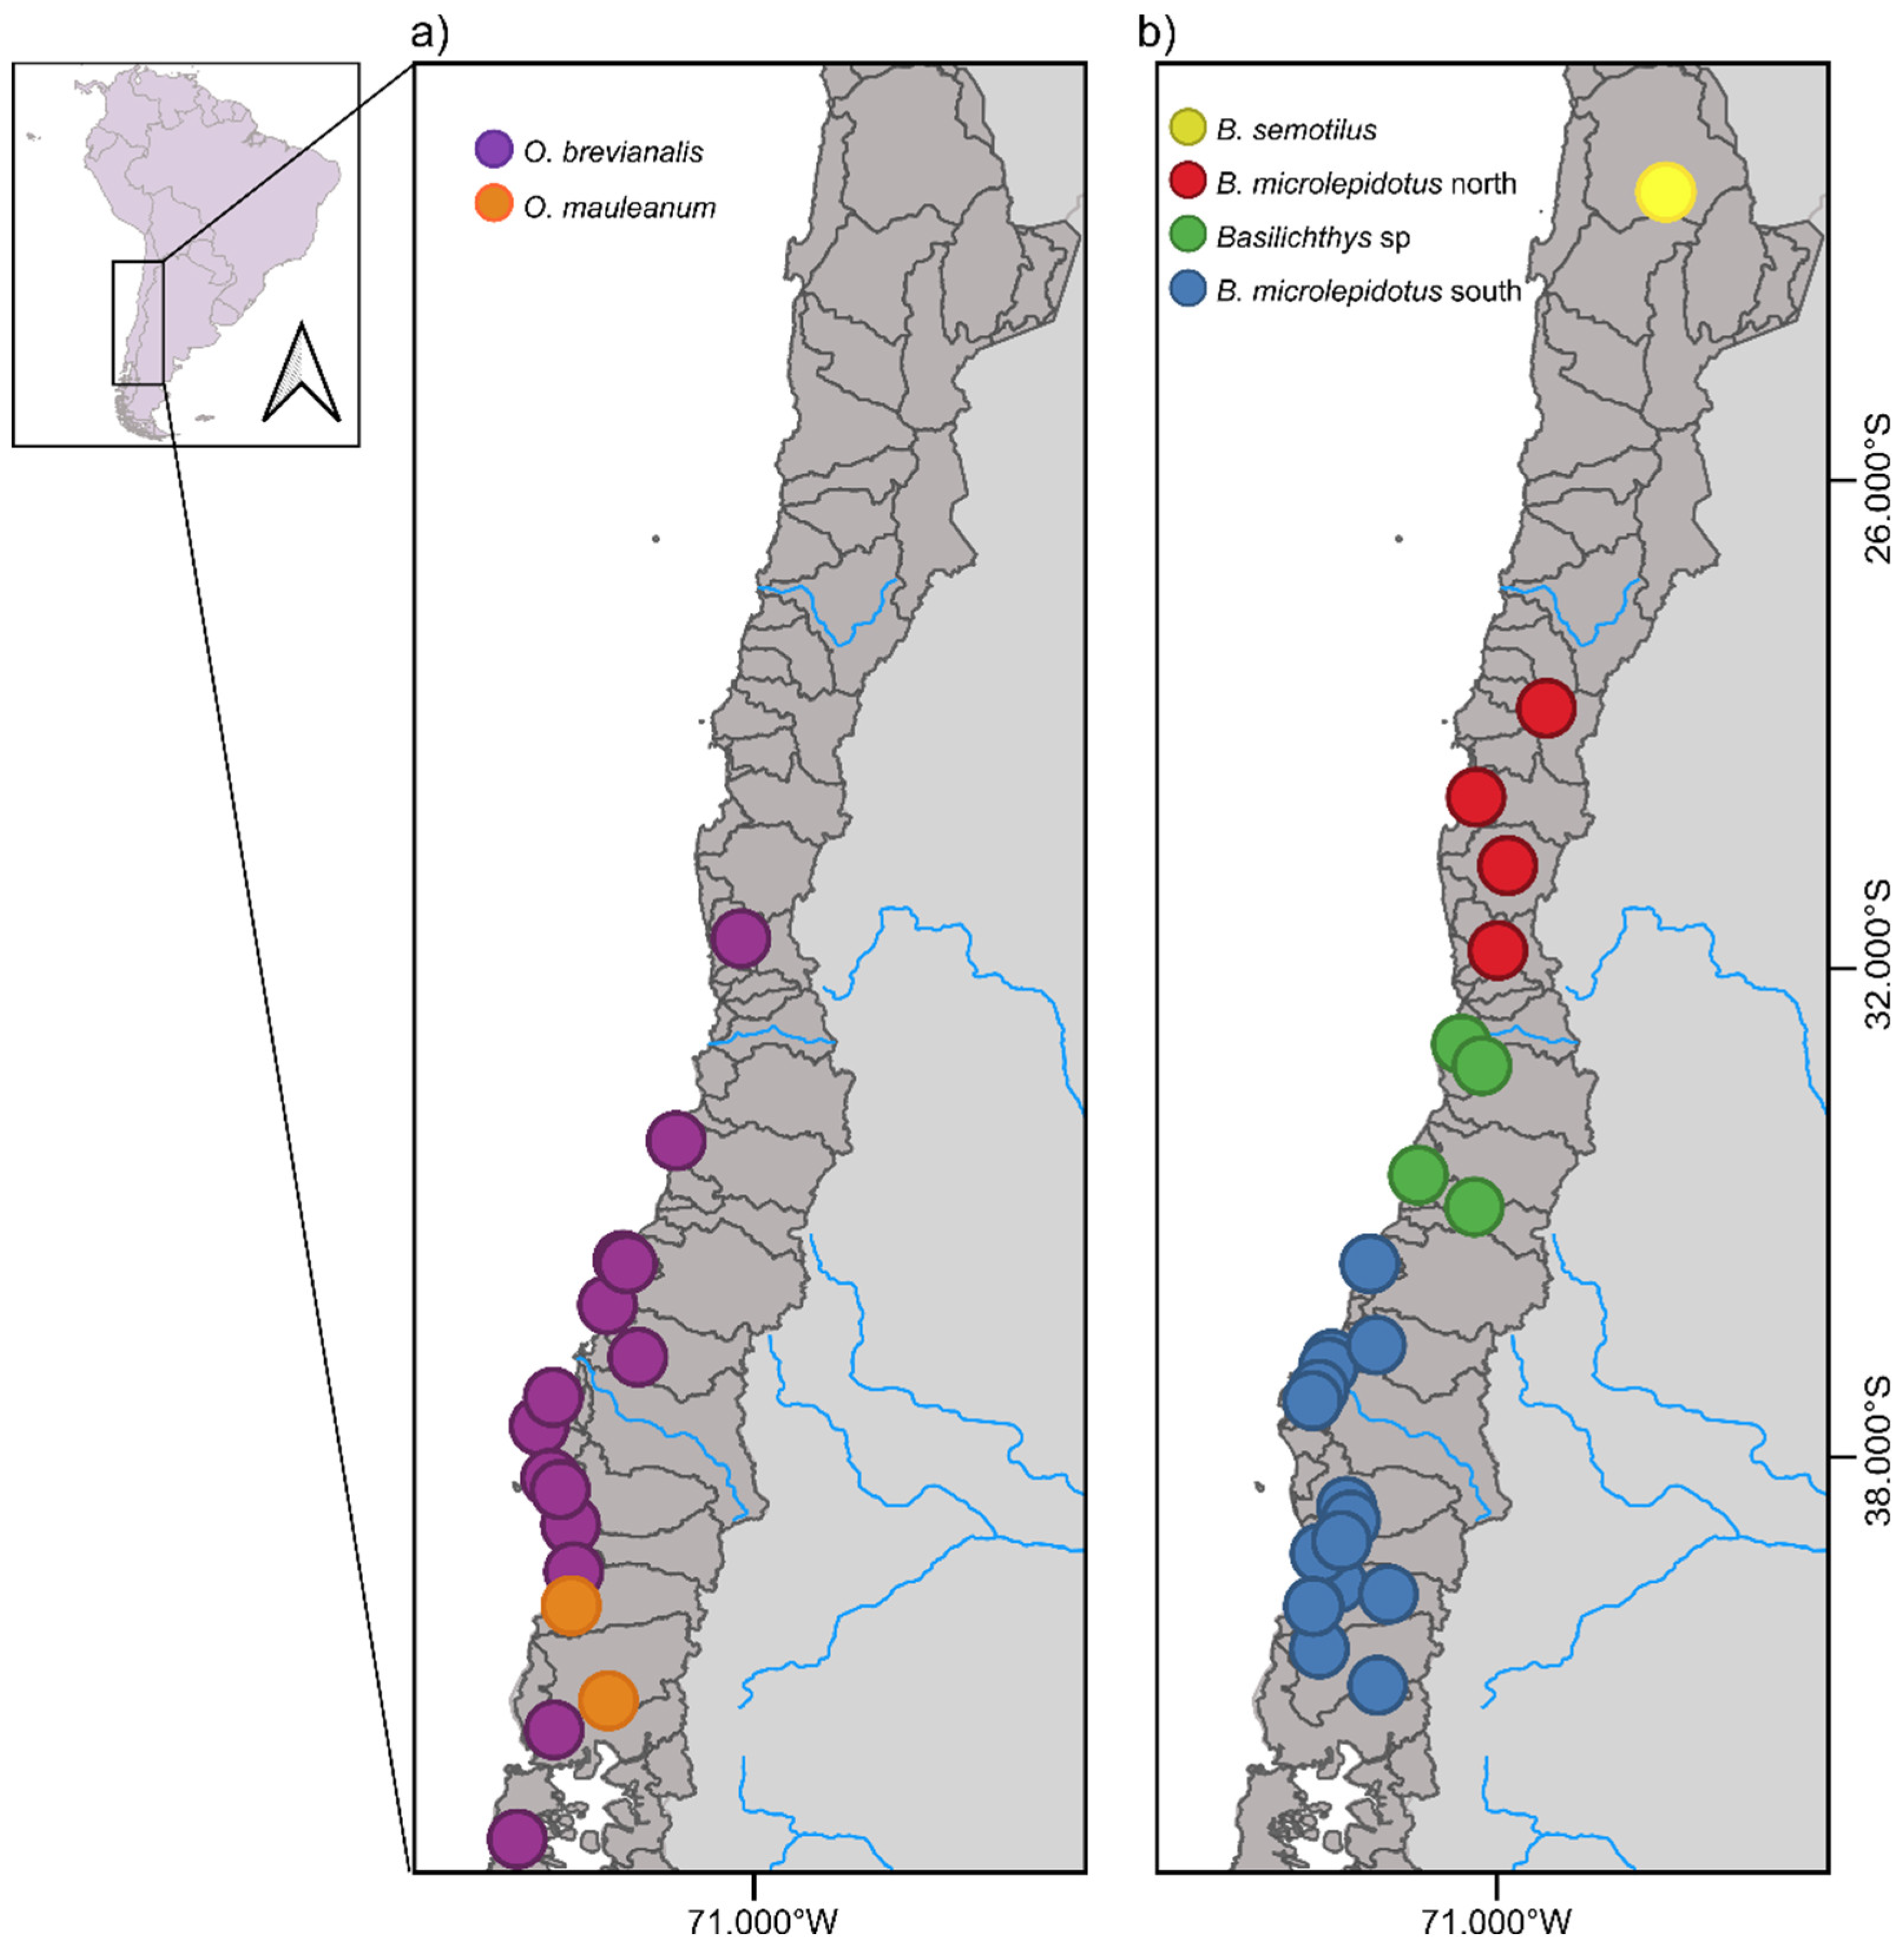
Figure 2.
Maximum likelihood trees: a) for Odontesthes brevianalis and O. mauleanum based on 86 individuals and 26110 SNPs; b) for the genus Basilichthys based on 60 individuals and 16155 SNPs. The UFBoot values are shown in the nodes excluding those less than 60.
Figure 2.
Maximum likelihood trees: a) for Odontesthes brevianalis and O. mauleanum based on 86 individuals and 26110 SNPs; b) for the genus Basilichthys based on 60 individuals and 16155 SNPs. The UFBoot values are shown in the nodes excluding those less than 60.
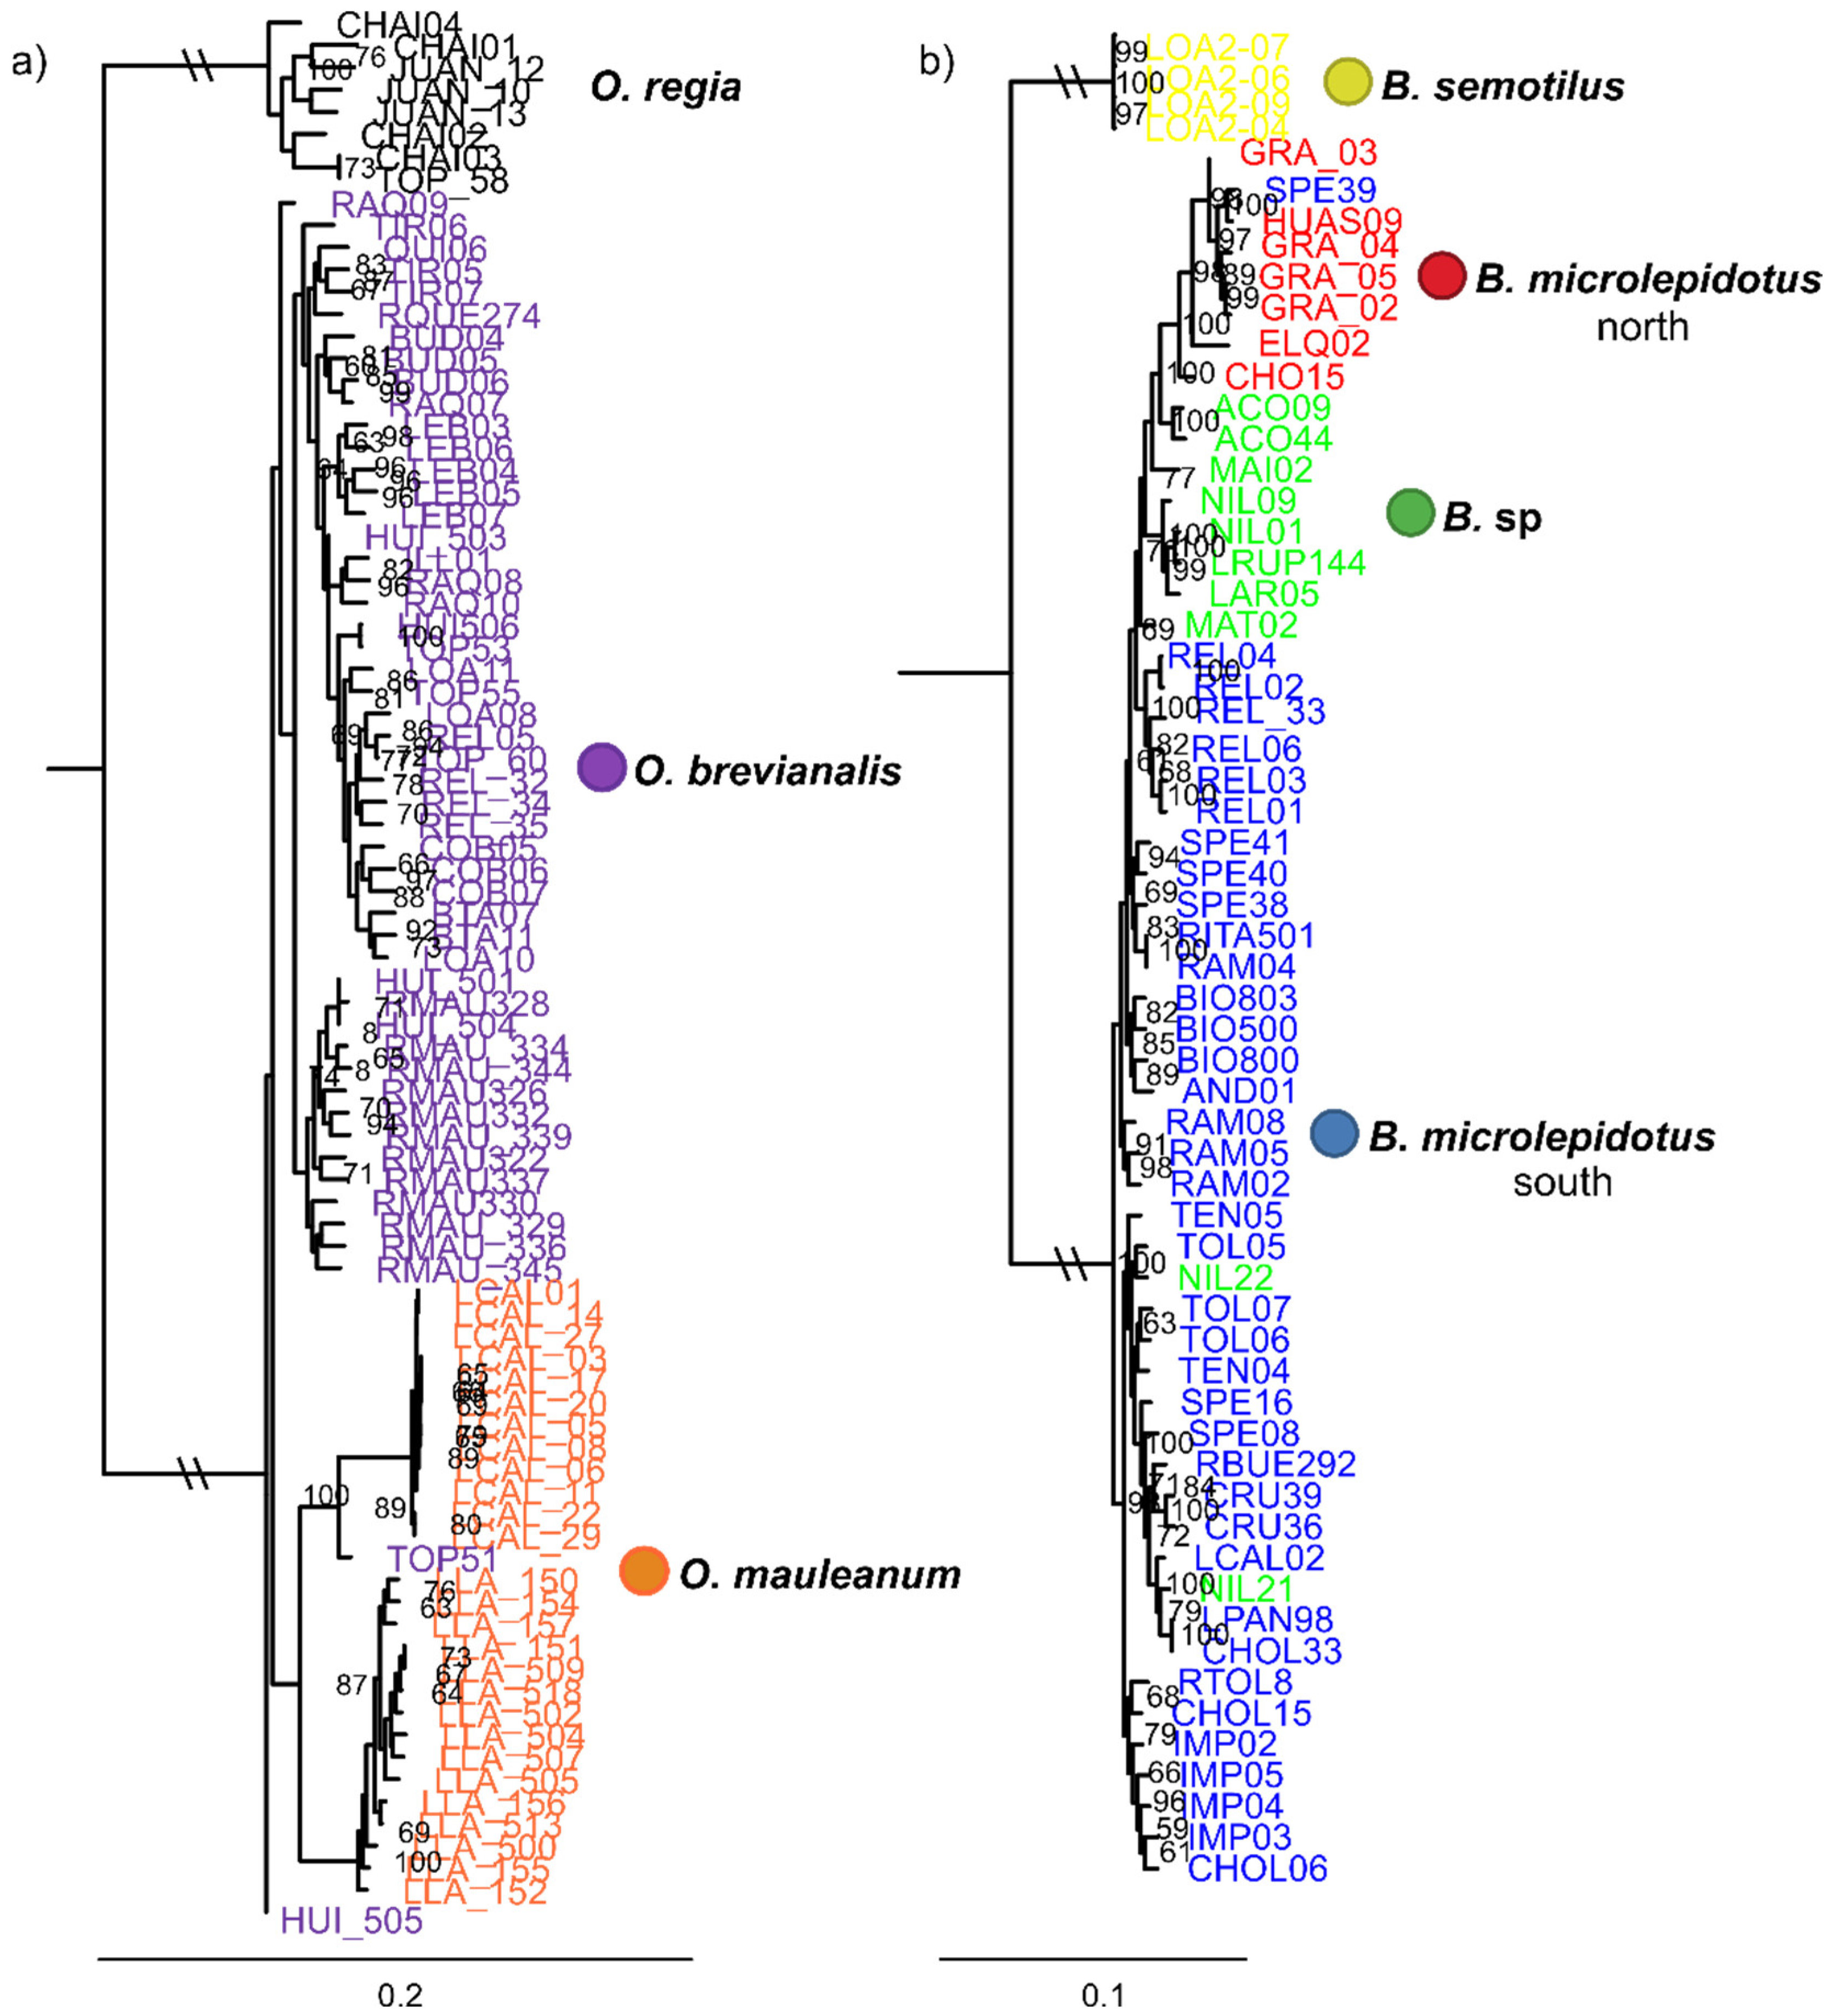
Figure 3.
Phylogenetic networks. a) Odontesthes brevianalis and O. mauleanum; b) Basilichthys microleidotus north, B. microlepidotus south and Basilichthys sp. Arrowheads show the putative root for each network according to the phylogenetic results shown in Figure 2.
Figure 3.
Phylogenetic networks. a) Odontesthes brevianalis and O. mauleanum; b) Basilichthys microleidotus north, B. microlepidotus south and Basilichthys sp. Arrowheads show the putative root for each network according to the phylogenetic results shown in Figure 2.
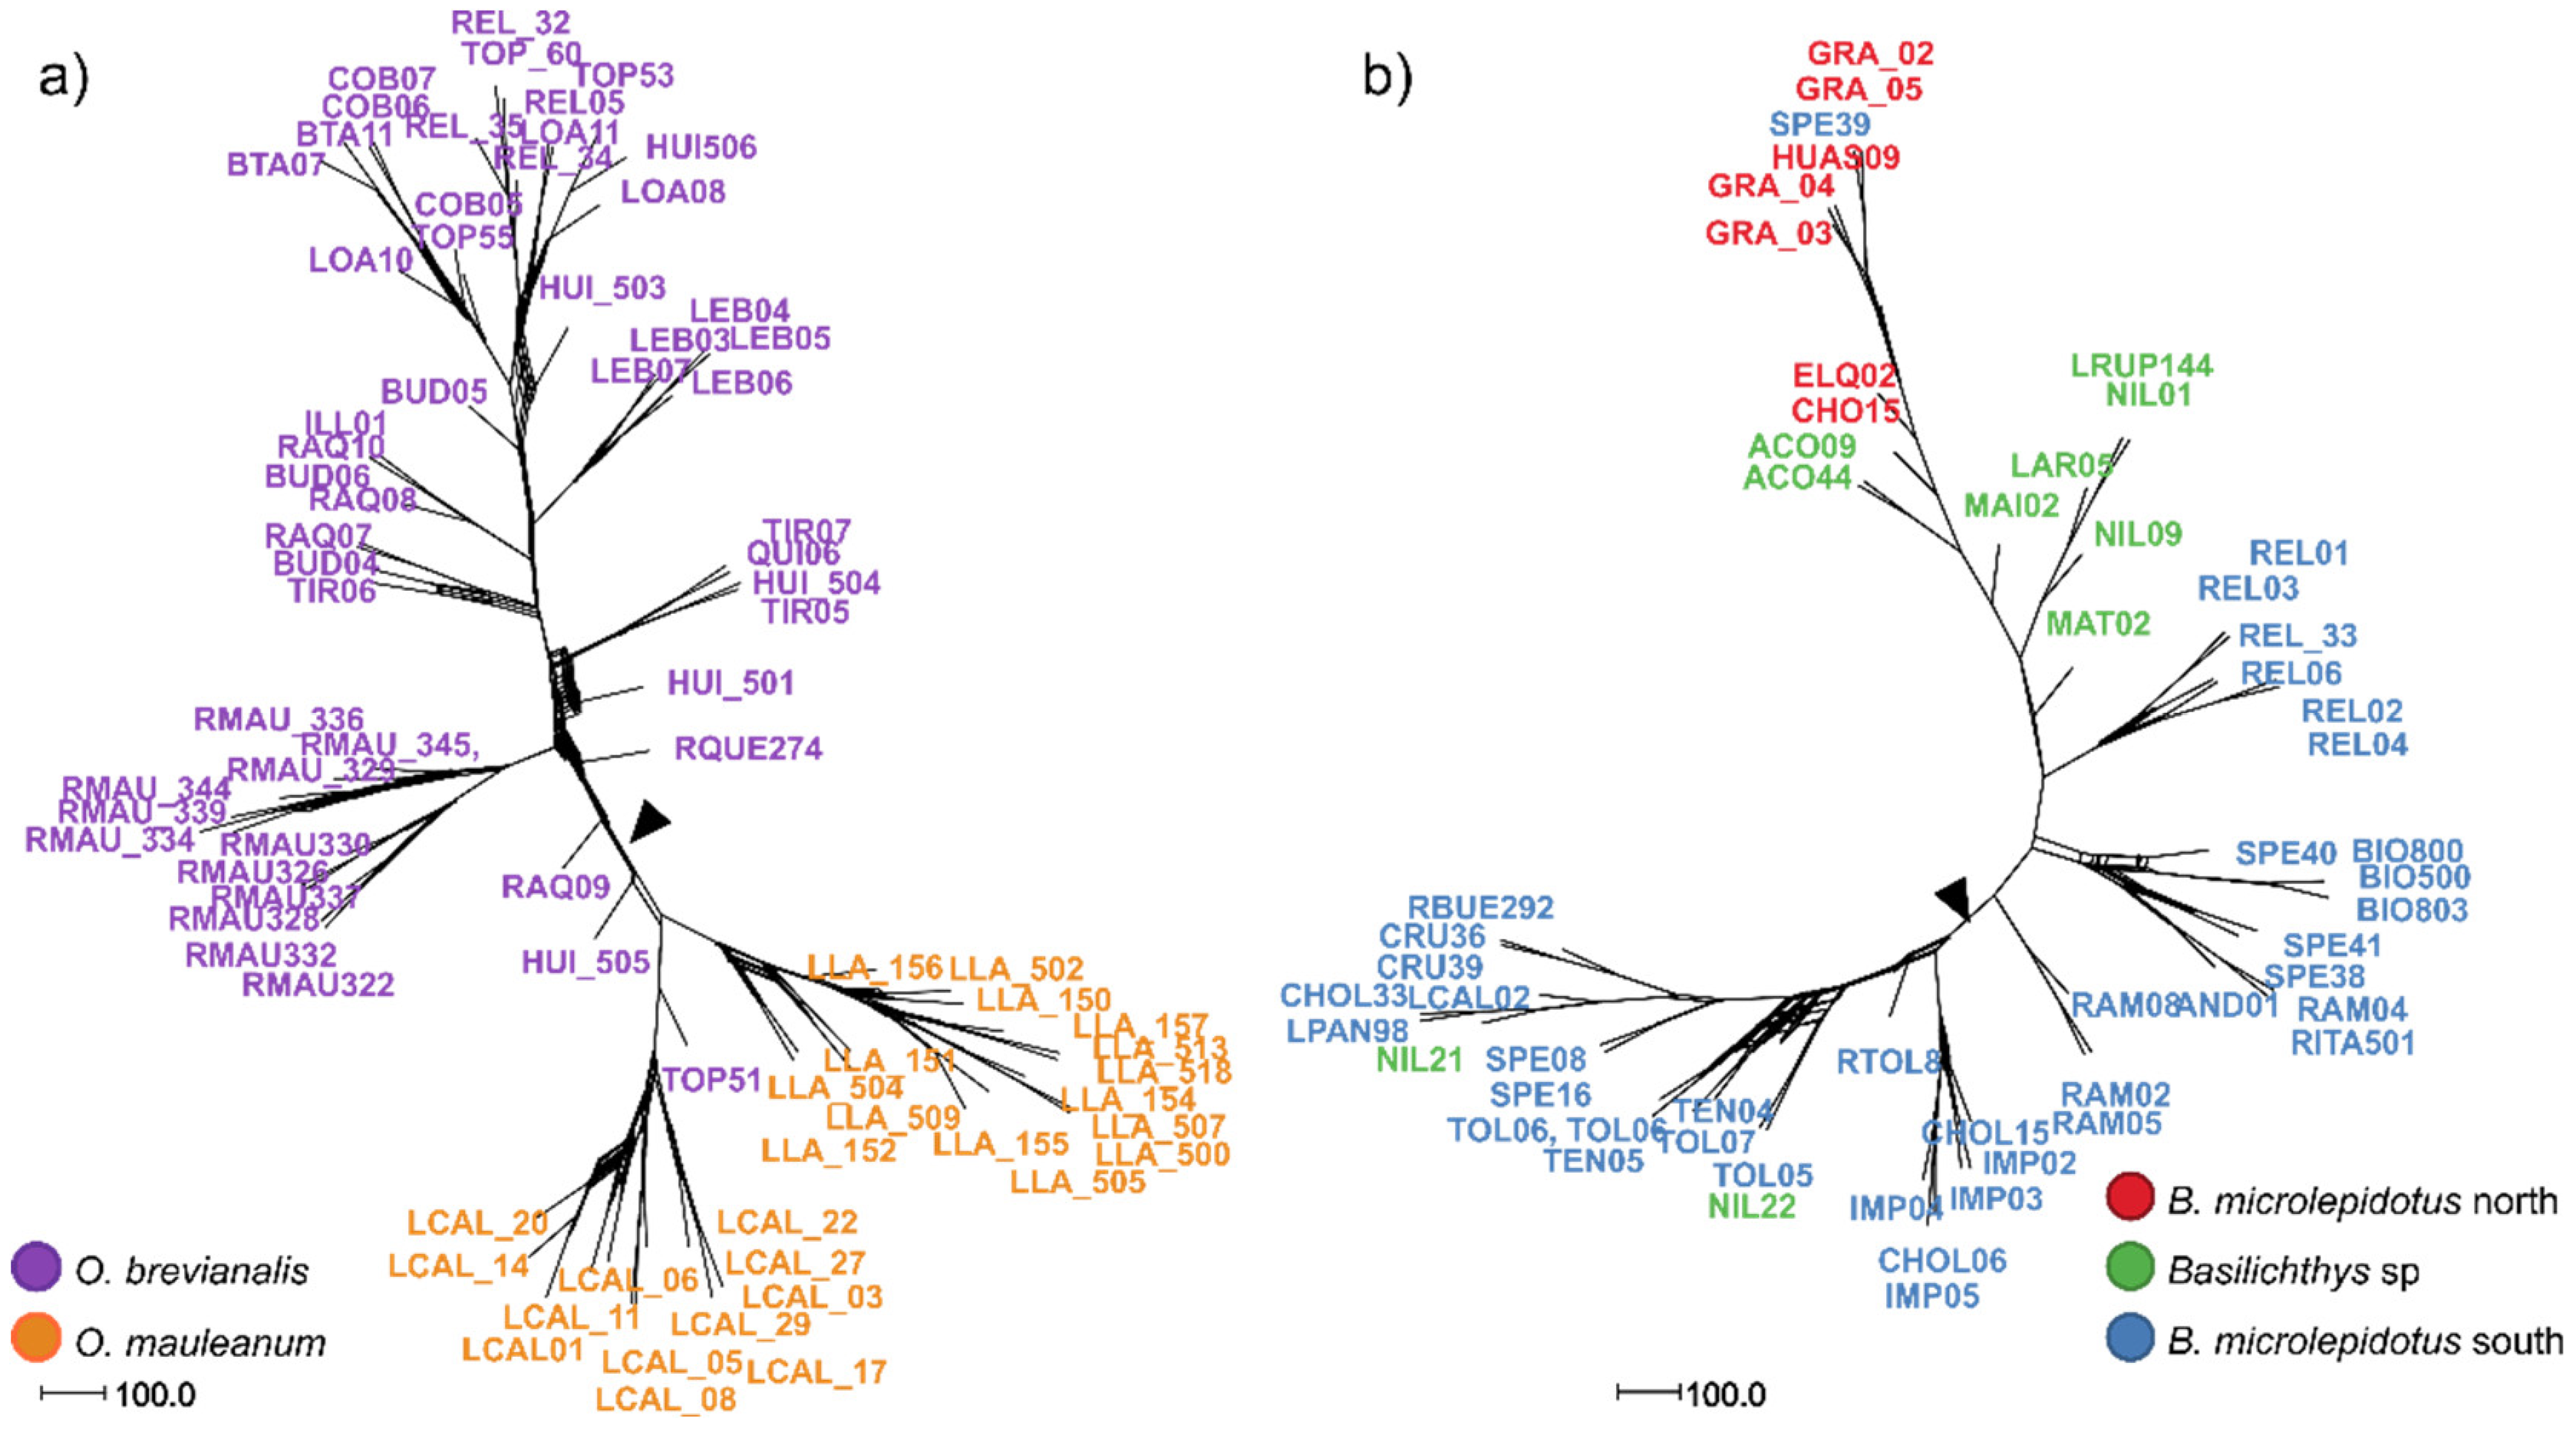
Figure 4.
Structure and DAPC. a) Odontesthes brevianalis and O. mauleanum; b) Basilichthys microlepidotus north, B. microlepidotus south and Basilichthys sp.
Figure 4.
Structure and DAPC. a) Odontesthes brevianalis and O. mauleanum; b) Basilichthys microlepidotus north, B. microlepidotus south and Basilichthys sp.
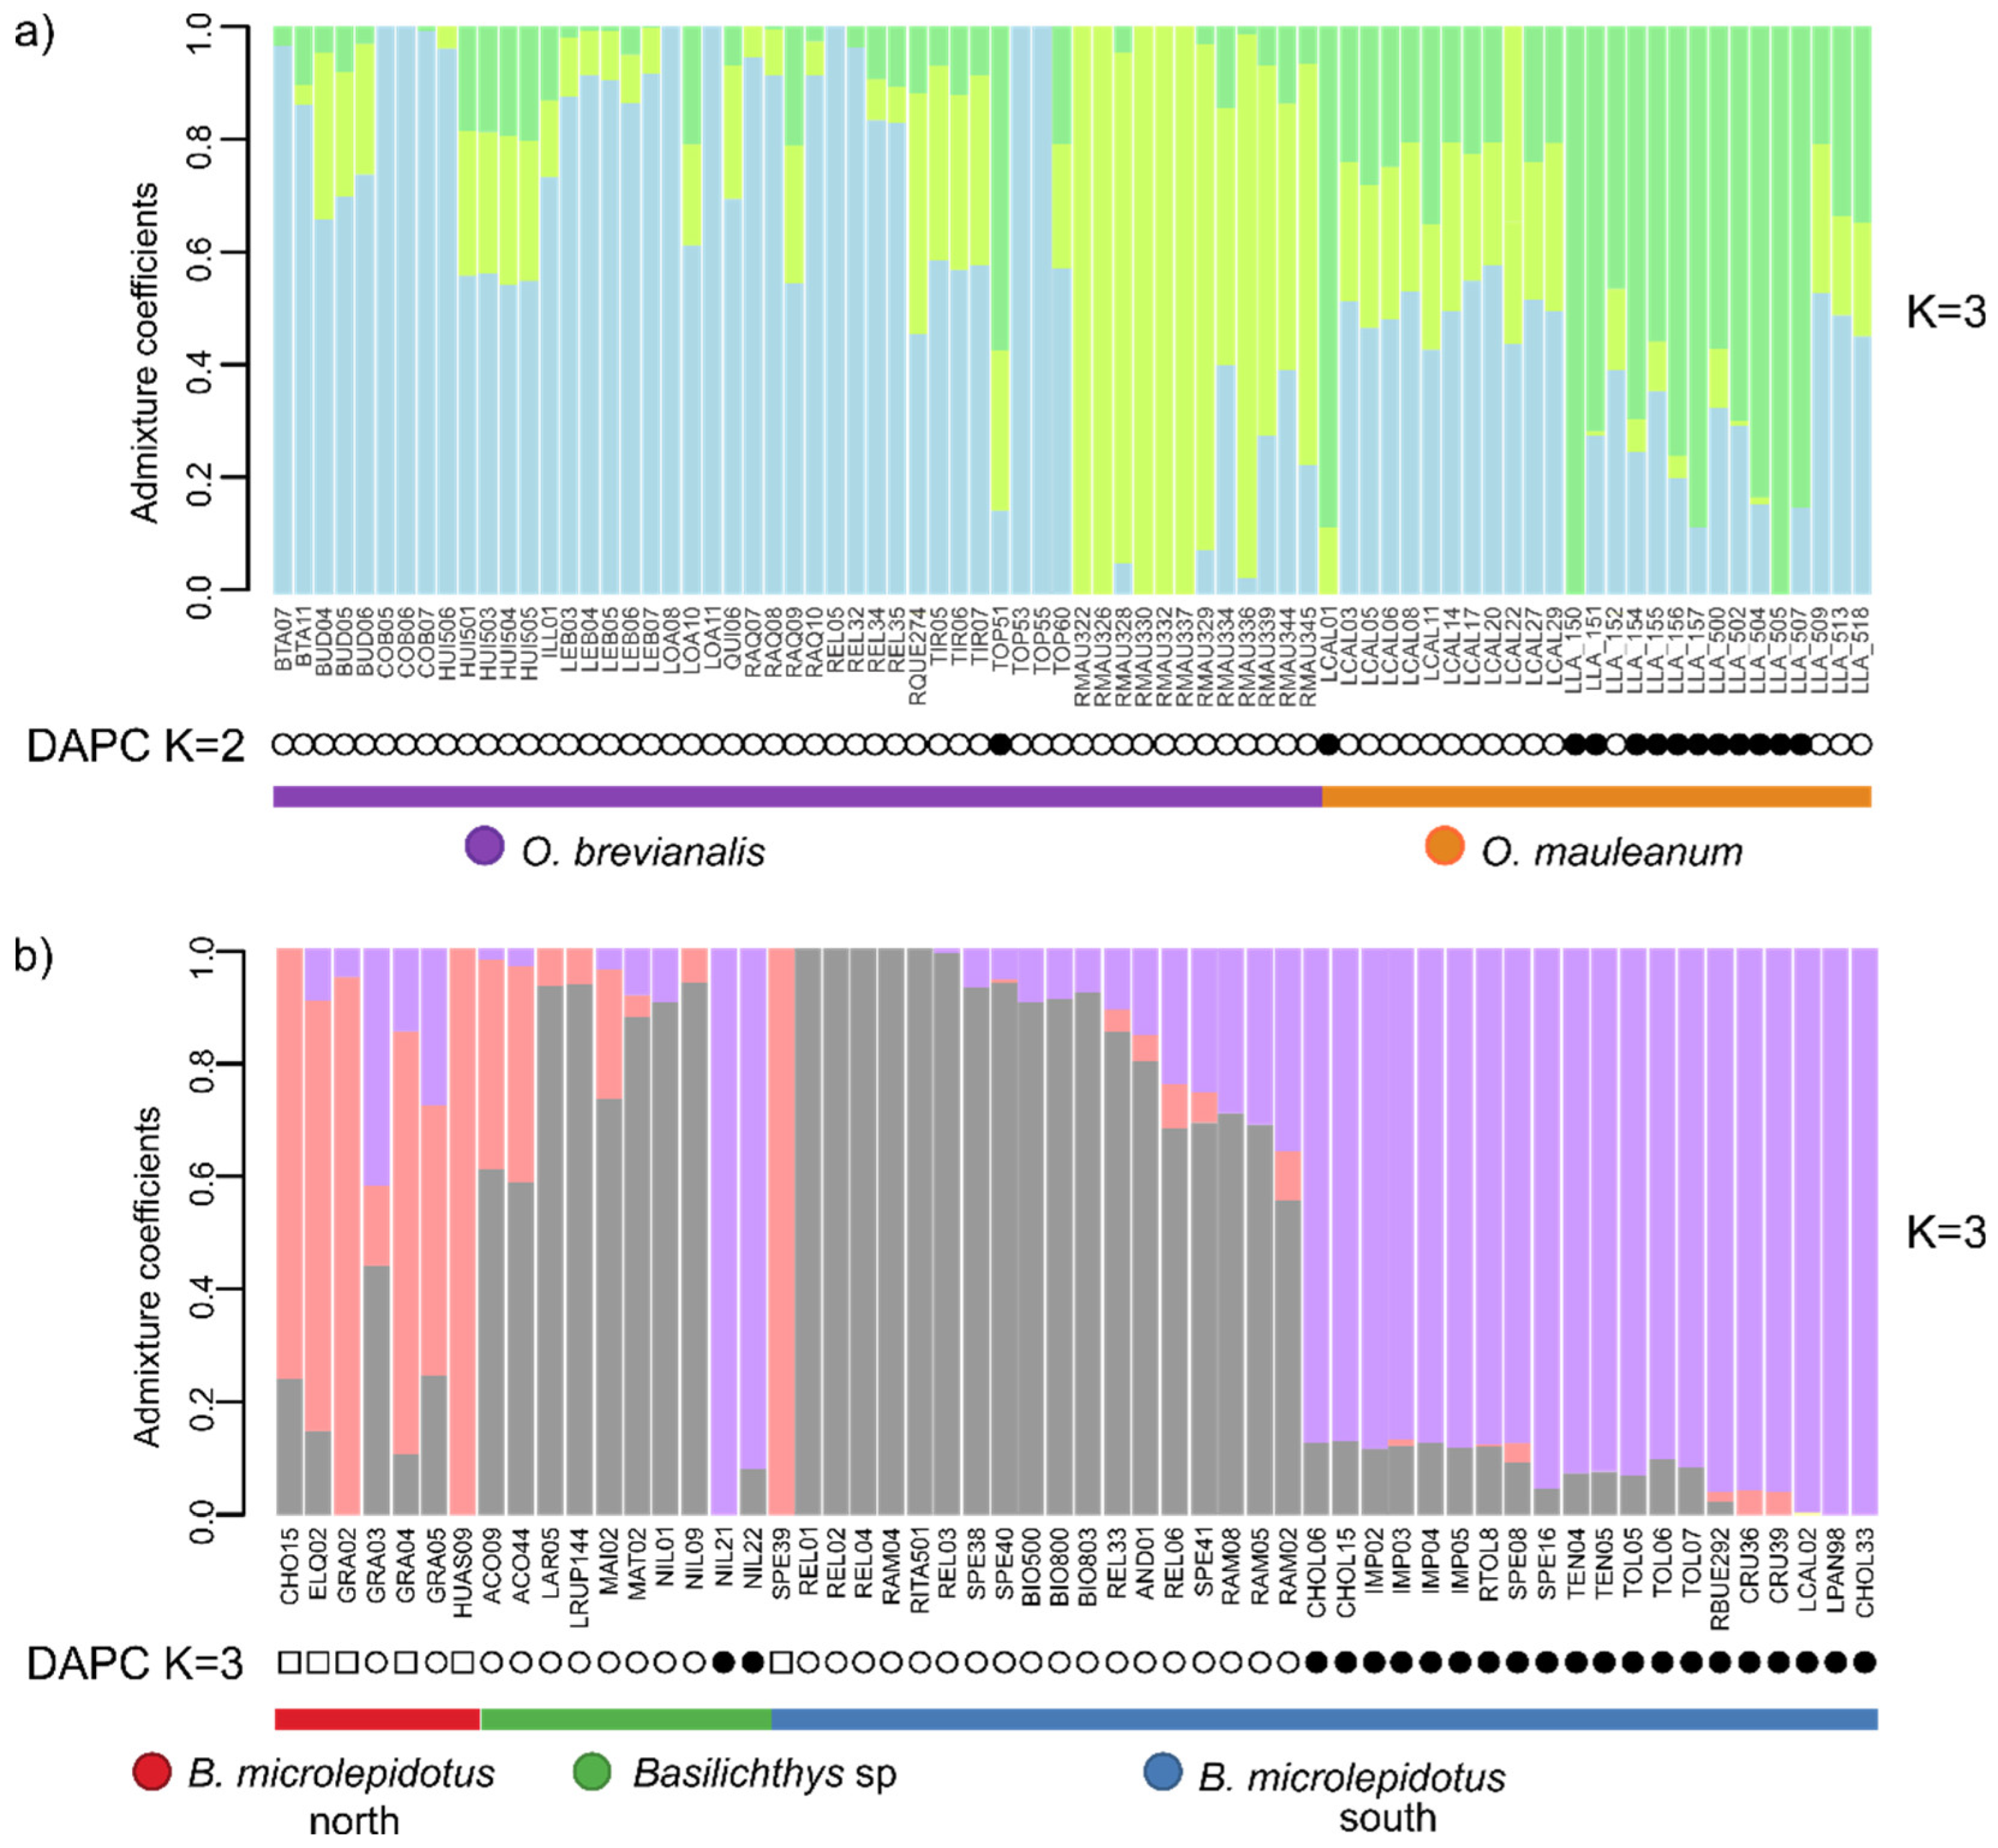
Figure 5.
PCA for species. a) Odontesthes brevianalis and O. mauleanum; b) Basilichthys microlepidotus north, B. microlepidotus south and Basilichthys sp.
Figure 5.
PCA for species. a) Odontesthes brevianalis and O. mauleanum; b) Basilichthys microlepidotus north, B. microlepidotus south and Basilichthys sp.
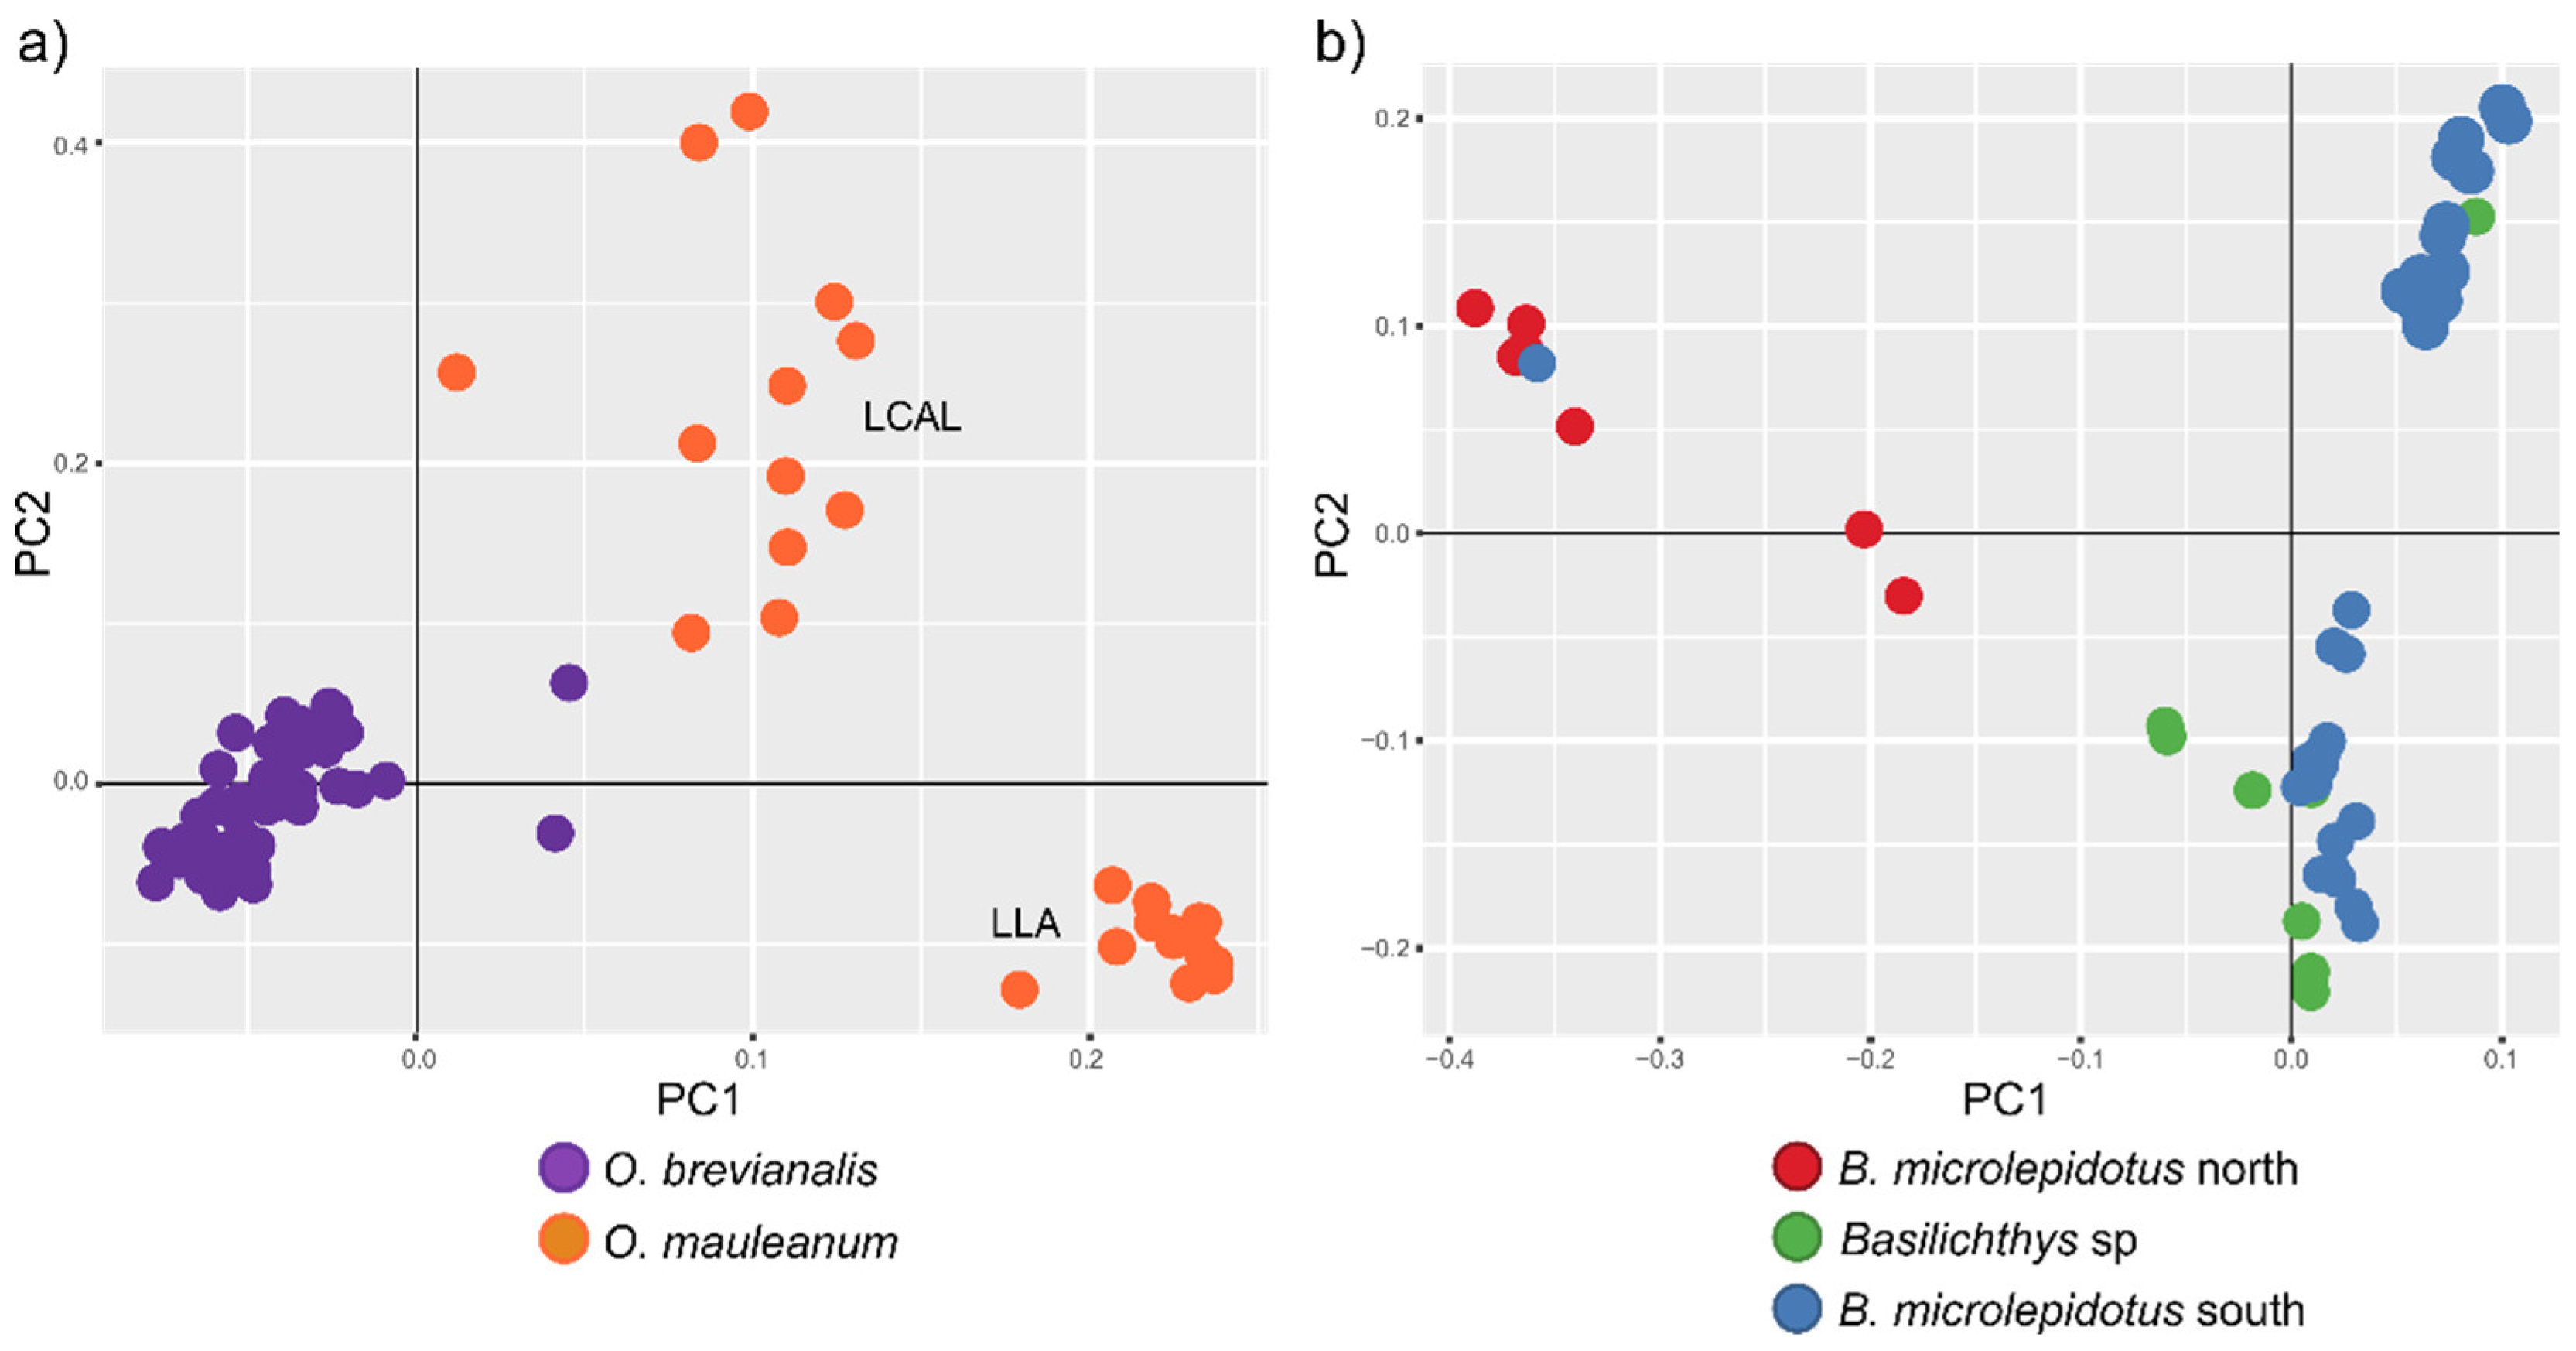

Table 1.
Summary of the RADseq datasets used in the downstream analysis. N: number of individuals; min. samples per loci: minimum number of samples per loci; Par. Inf.: parsimony informative sites; Sing. sites: singletons sites; Dist. patt: Distinct patterns.
Table 1.
Summary of the RADseq datasets used in the downstream analysis. N: number of individuals; min. samples per loci: minimum number of samples per loci; Par. Inf.: parsimony informative sites; Sing. sites: singletons sites; Dist. patt: Distinct patterns.
| Dataset | N (min. samples per loci) | Species (N) | loci | SNPs | Missing sites (%) | Fit model BIC | Par. Inf. | Sing. sites | Dist. Patt. | SNPsVCF | Re-construction |
|---|---|---|---|---|---|---|---|---|---|---|---|
| 1 | 86 (40) | O. brevianalis (52); O. mauleanum (27) + O. regia (7) | 12009 | 26110 | 46.56 | TVMe+ASC+R3 | 8545 | 3766 | 12130 | 610 | IQTree (Figure 2a) |
| 2 | 79 (40) | O. brevianalis (52); O. mauleanum (27) | 14338 | 22025 | 43.28 | TVM+F+ASC+R3 | 4361 | 2635 | 6957 | 227 | SplitsTree (Figure 3a), LEA and DAPC (Figure 4a), PCA (Figure 5a), BFD (Table 2) |
| 3 | 60 (54) | B. semotilus (4);B. microlepidotus north (7); B. microlepidotus south (39); B. sp. (10) | 6843 | 16155 | 7.69 | TVM+F+ASC+R2 | 8417 | 1279 | 6606 | 987 | IQTree (Figure 2b) |
| 4 | 56 (49) | B. microlepidotus north (7); B. microlepidotus south (39); B. sp. (10) | 13680 | 25596 | 9.53 | TVM+F+ASC+R3 | 6793 | 3404 | 10111 | 1198 | SplitsTree (Figure 3b), LEA and DAPC (Figure 4b), PCA (Figure 5b), BFD (Table 2) |
Table 2.
BDF results. Stepping stone sampling results for six species delimitation models. O. brev: Odontesthes brevianalis; O. mau: O. mauleanum; DAPC: Principal Component Discriminant Analysis; K: cluster; STR: Structure Analysis; B. south: Basilichthys microlepidotus south; B. north: B. microlepidotus north; MLE: marginal likelihood estimation; BF: Bayes factor.
| Genus | N indiv | N species |
Model | MLE | BF | 2 × ln (BF) |
Rank |
|---|---|---|---|---|---|---|---|
| Odontesthes | 65 | 2 | O. reg + O.mau/O.brev | -799.19 | 1 | ||
| 3 | O. reg + O. mau + O. brev | -2089.368 | 2580.357 | 15.711 | 2 | ||
| 2 | O. brev + O. mau |
-3755.274 | - | - | 3 | ||
| 79 | 2 |
DAPC: K1 + K2 |
-570.828 | 6368.891 | 17.518 | 2 | |
| 3 |
STR: K1 + K2 + K3 |
-503.57 | 6503.407 | 17.56 | 1 | ||
| Basilichthys | 59 | 2 | B. semo + B. micro/B. Sp | -14164.594 | - | - | 4 |
| 4 | B. semo + B. micro north + B. micro south + B. sp | -13630.528 | 1068.1311 | 13.957 | 3 | ||
| 4 | B. semo + DAPC: K1 + K2 + K3 | -13321.713 | 1685.761 | 14.859 | 2 | ||
| 4 | B. semo + STR: K1+ K2 + K3 | -13104.867 | 2119.453 | 15.318 | 1 | ||
| 56 | 3 | B. north + B. south + B. sp | -24156.608 | - | - | 3 | |
| 3 |
DAPC: K1 + K2 + K3 |
-23440.831 | 1431.553 | 14.533 | 2 | ||
| 3 |
STR: K1 + K2 + K3 |
-23047.263 | 2218.691 | 15.409 | 1 |
Disclaimer/Publisher’s Note: The statements, opinions and data contained in all publications are solely those of the individual author(s) and contributor(s) and not of MDPI and/or the editor(s). MDPI and/or the editor(s) disclaim responsibility for any injury to people or property resulting from any ideas, methods, instructions or products referred to in the content. |
© 2025 by the authors. Licensee MDPI, Basel, Switzerland. This article is an open access article distributed under the terms and conditions of the Creative Commons Attribution (CC BY) license (http://creativecommons.org/licenses/by/4.0/).
Copyright: This open access article is published under a Creative Commons CC BY 4.0 license, which permit the free download, distribution, and reuse, provided that the author and preprint are cited in any reuse.


