Submitted:
30 March 2025
Posted:
31 March 2025
You are already at the latest version
Abstract
HVAC design for cleanrooms with multiple doors, passboxes, passthroughs, and operational equipment poses significant challenges due to complex air balancing requirements. Traditional methods, relying on conservative safety factors (20-30%), result in oversized equipment and elevated costs. This technical note proposes an AI-driven framework, integrated with Revit MEP simulations, to optimise design. In a hypothetical Grade C cleanroom (9155 ft², Tehran), AI reduced airflow from 71,890 CFM to 55,420 CFM, fan power from 37.6 hp to 22.8 hp, and design time from 22 days to 3 days, maintaining 0.06 inWG pressure with 96% accuracy. Compliant with BS EN 16798, this approach cuts ducting costs by 18% (£) and energy use by 40%. The framework leverages machine learning to analyze 64 operational states, ensuring robust pressure control under dynamic conditions.
Keywords:
Cleanroom
; HVAC
; Artificial Intelligence
; Optimisation
; BS EN 16798
; Pressure Control
; Simulation
; Revit MEP
1. Introduction
Cleanrooms with multiple access points and operational equipment require precise HVAC design to maintain pressure (e.g., 0.06 inWG) across varying conditions. Traditional methods, factoring in worst-case scenarios, inflate equipment sizes and costs. This study introduces an AI-based framework to streamline this process, validated against BS EN 16798 for energy efficiency and pressure control.
2. Materials and Methods
2.1. Case Study Scenario
- -
- -Design Basis: Location: Central Tehran, Iran (ASHRAE Zone 4B). Summer Design: 100.4°F dry bulb, 66.2°F wet bulb. Winter Design: 23°F dry bulb. Barometric Pressure: 26.4 inHg (elevation: 3900 ft above sea level). Dew Point: 55°F (typical summer). Cleanroom: Grade C (ISO 7), 9155 ft² (43.2 ft × 21.6 ft × 9.8 ft height, adjusted for 108 ft² ducting space), volume 89,719 ft³. Conditions: 68±3.6°F, 45% RH. Pressure Target: 0.06 inWG relative to CNC area (0.02 inWG).
- -
- Components: Doors: 2 double doors: 5.9 ft × 5.9 ft (34.8 ft² each). 2 single doors: 2.95 ft × 5.9 ft (17.4 ft² each). Connections: Grade B (0.1 inWG), Grade D (0.04 inWG), CNC (0.02 inWG), adjacent Grade C (0.06 inWG). Passboxes: 2 units (1.64 ft × 1.64 ft each): static (to Grade D), dynamic (to adjacent C). Passthroughs: 2 units (2.95 ft × 3.94 ft each): to CNC, adjacent C. Laminar Flow Hoods: 2 units, each exhausting 500 CFM. Pharmaceutical Equipment: 1 Capsule Filling Machine (5 hp, 3.73 kW heat load). 1 Mixing Tank (3 hp, 2.24 kW heat load). 1 Autoclave (10 hp, 7.46 kW heat load). Occupancy: 10 seated (100 Btu/h sensible, 100 Btu/h latent each). 5 standing/walking (150 Btu/h sensible, 150 Btu/h latent each). 5 transients (200 Btu/h sensible, 200 Btu/h latent each, 50% occupancy). Air Distribution: Supply: 40 swirl diffusers (1000 CFM each, total 40,000 CFM base). Return: 4 corner grilles (8000 CFM each) + 2 honeycomb ceiling (4000 CFM each), total 40,000 CFM. Exhaust: 2 vents, 10% fresh air (4000 CFM).
- -

Table 1.
Traditional vs. AI Comparison.
| Parameter | Traditional | AI-Driven | Change (%) |
| Design Time | 22 days | 3 days | -86% |
| Airflow (CFM) | 71,890 | 55,420 | -23% |
| Fan Power (hp) | 37.6 | 22.8 | -39% |
| Pressure Accuracy | 90% (±0.006 inWG) | 96% (±0.002 inWG) | +6% |
| Ducting Cost (£) | 85,000 | 70,000 | -18% |
| Energy Use (hp) | 33.5 | 20.1 | -40% |
Table 2.
Cleanliness and Pressure Specifications for Connected Areas.
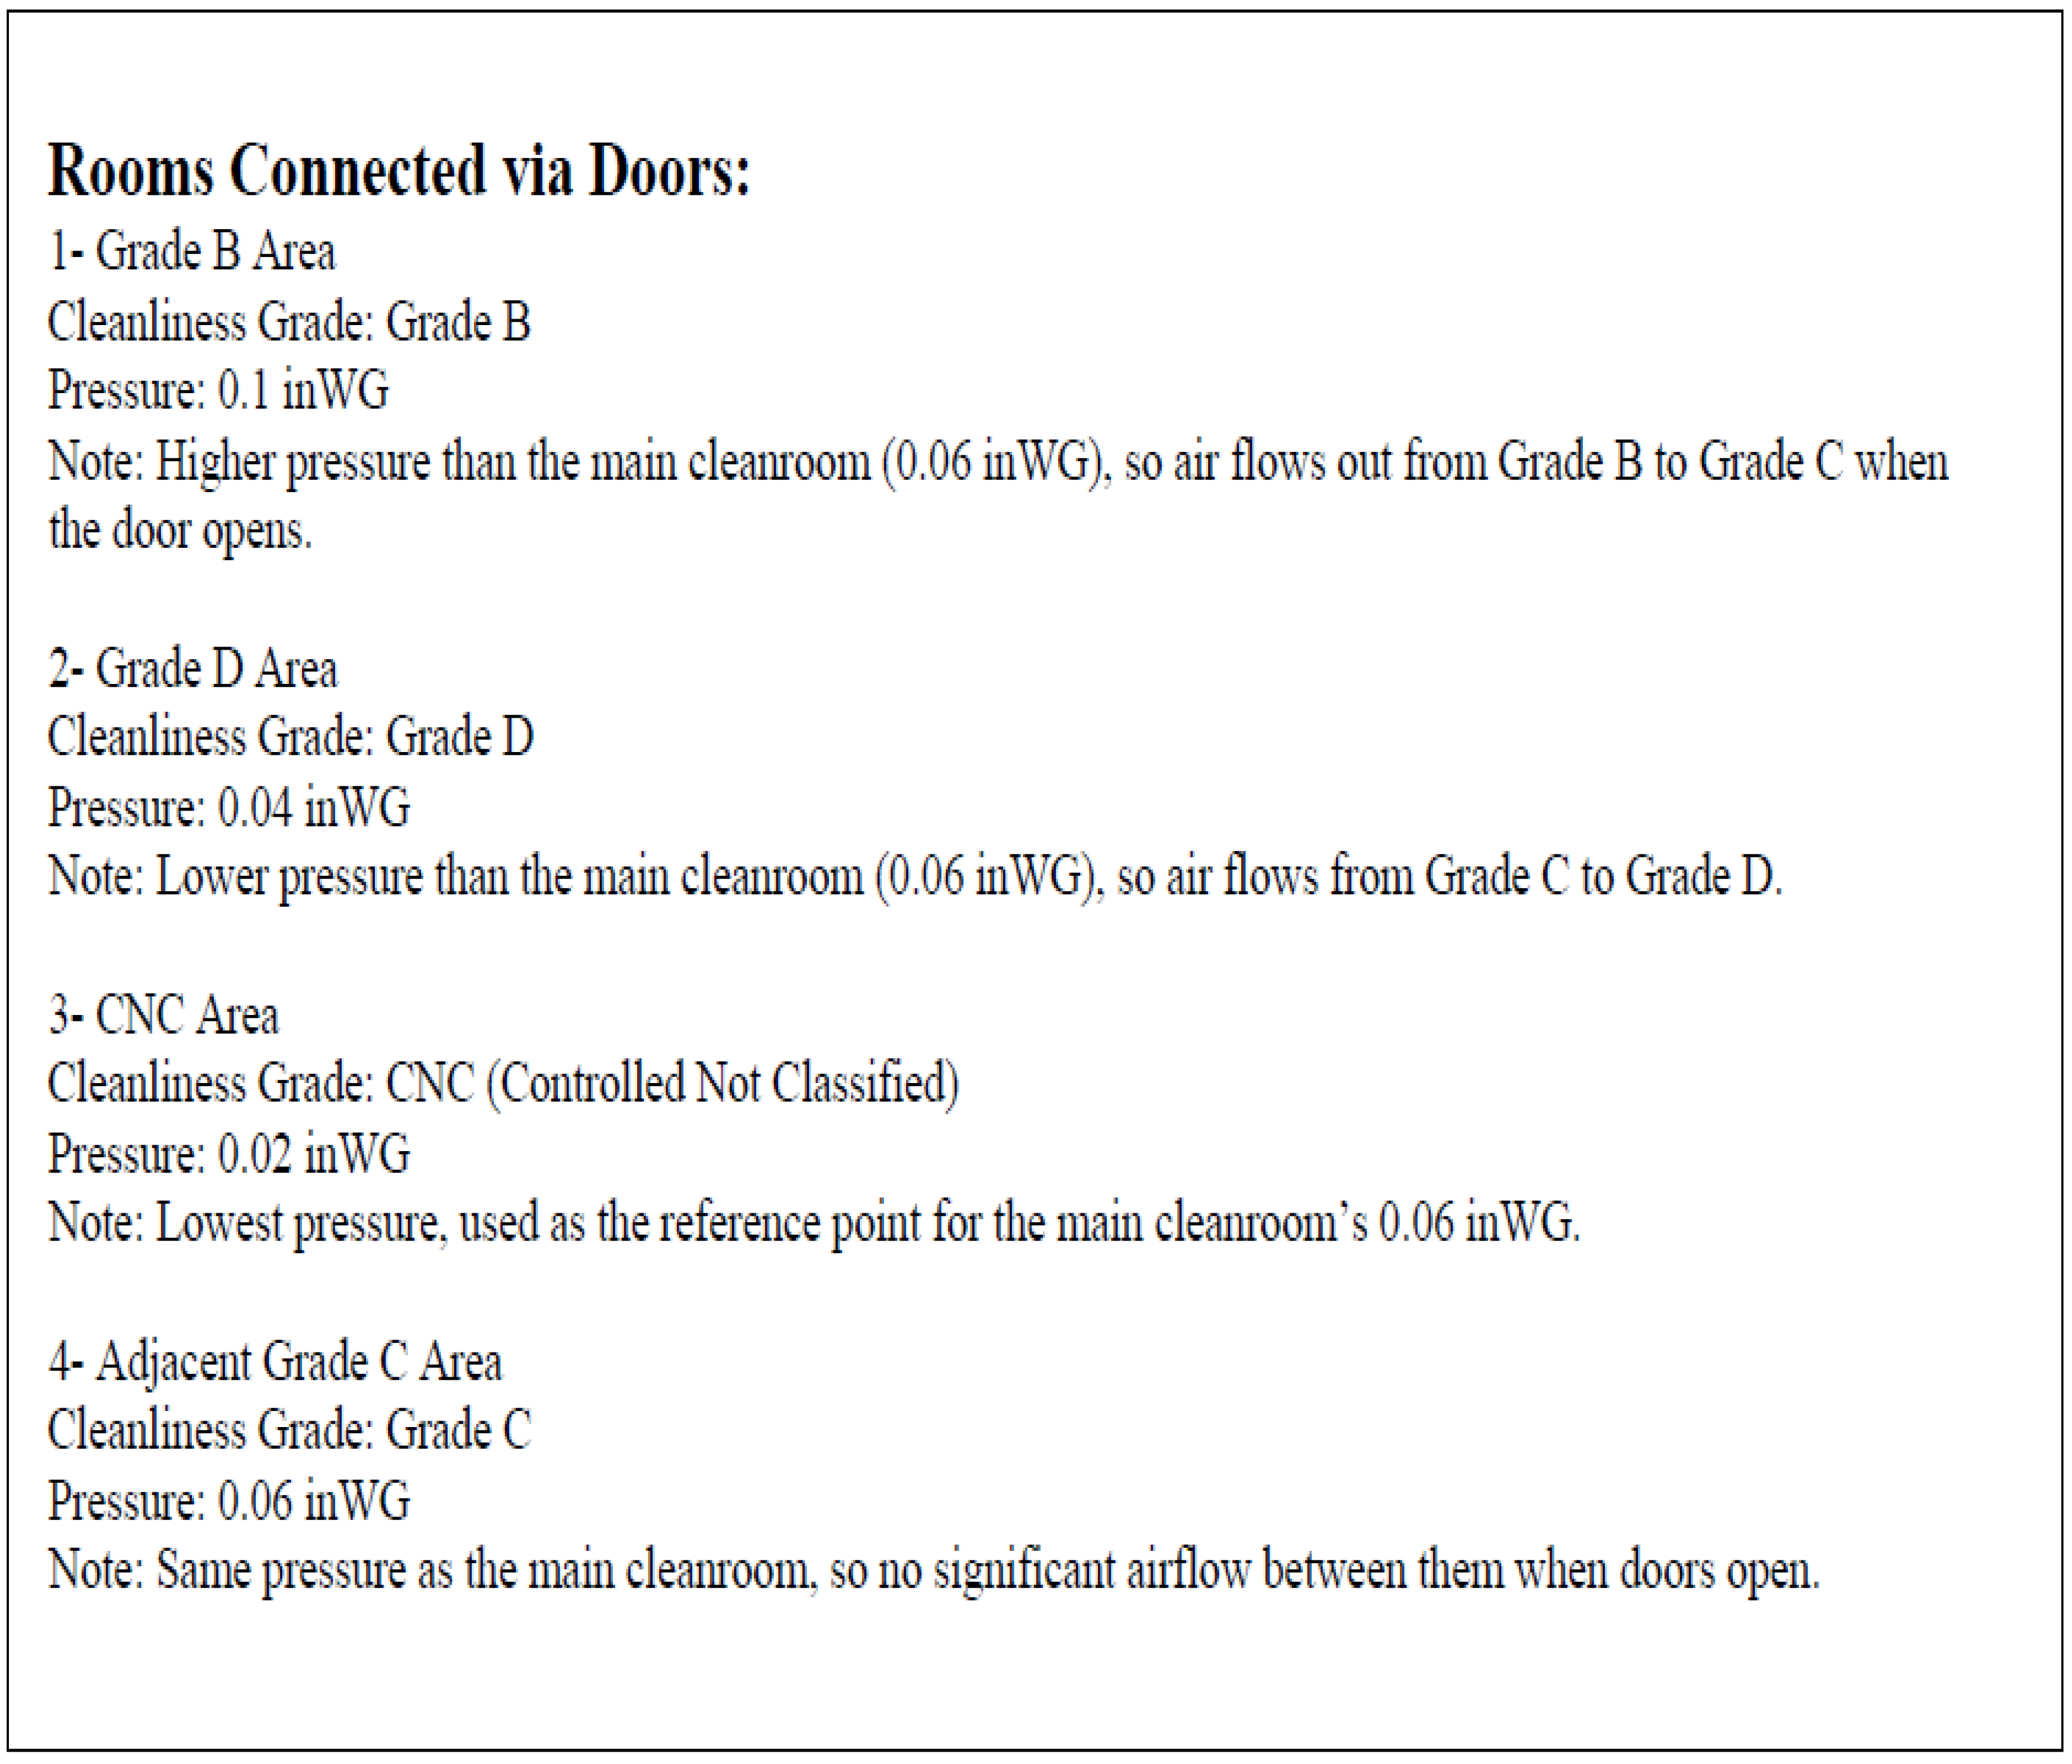 |
Figure 1.
Cleanroom Schematic. A plan view of the 43.2 ft × 21.6 ft cleanroom showing door locations, passboxes, passthroughs, laminar flow hoods, pharmaceutical equipment, diffusers, and exhausts, with dimensions and labels.
Figure 1.
Cleanroom Schematic. A plan view of the 43.2 ft × 21.6 ft cleanroom showing door locations, passboxes, passthroughs, laminar flow hoods, pharmaceutical equipment, diffusers, and exhausts, with dimensions and labels.
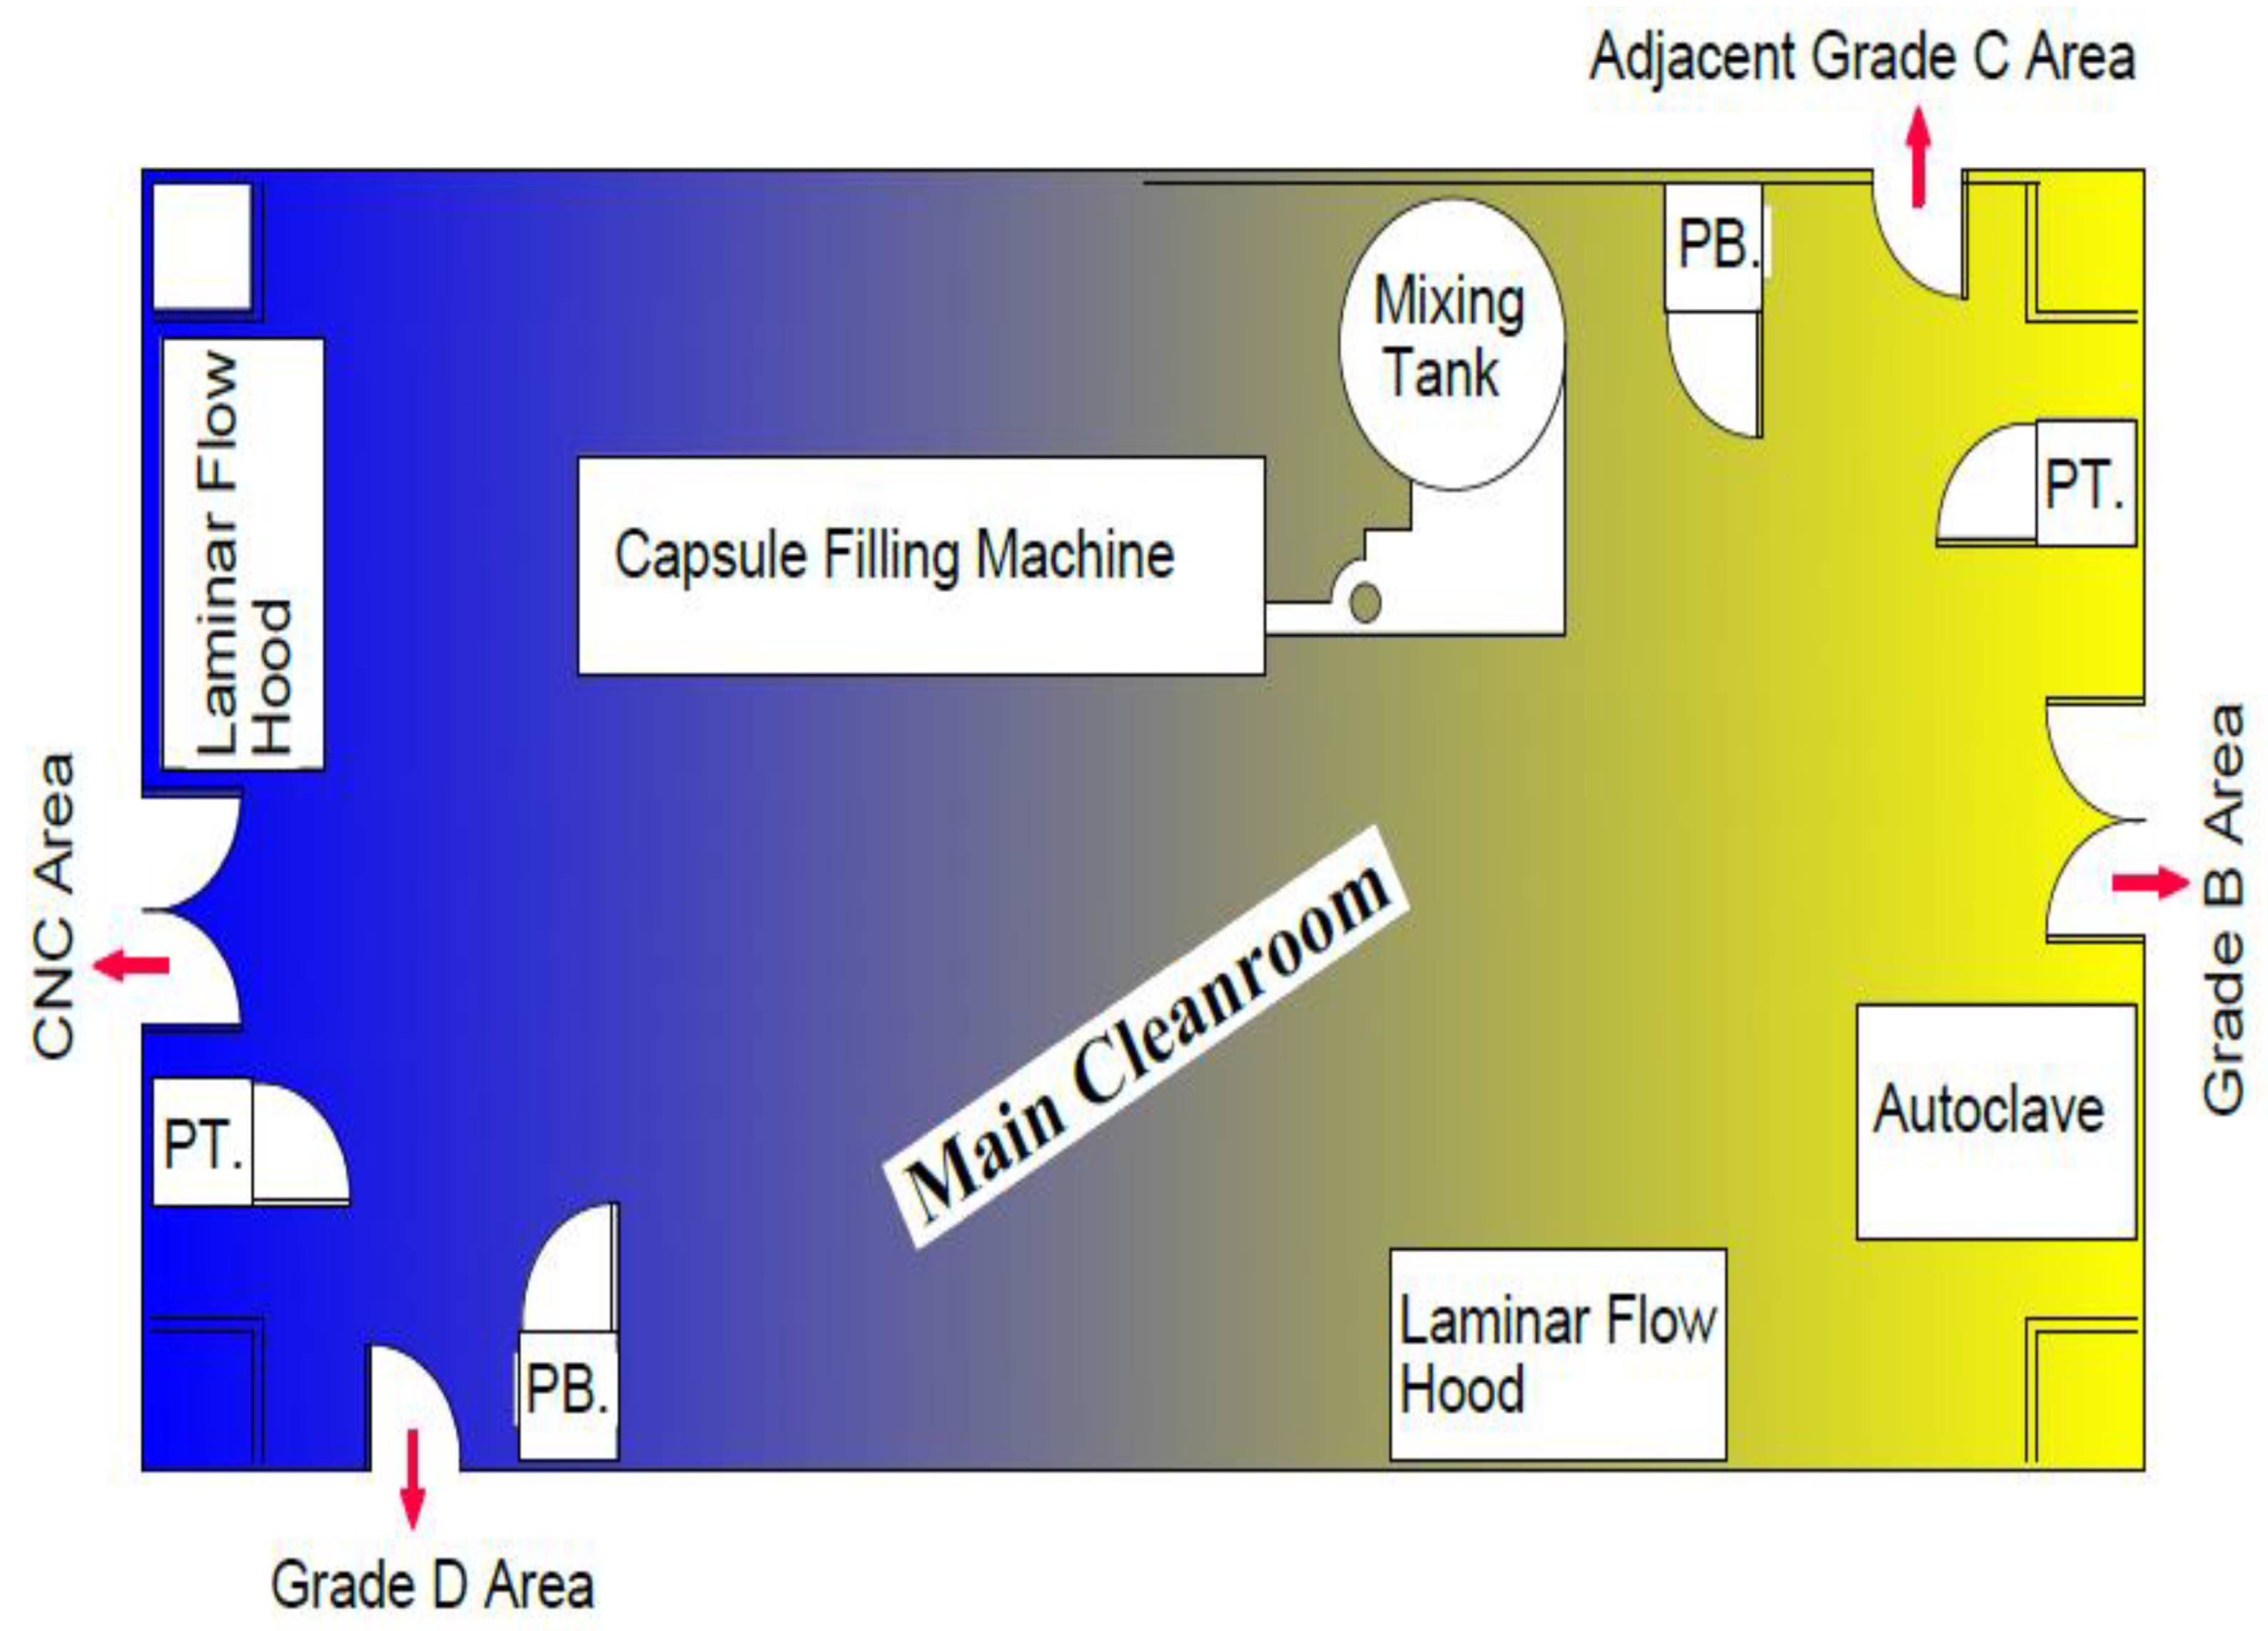
Table 3.
Pressure Across Sample States (Traditional vs. AI-Driven) .
| State Description | Traditional Pressure (inWG) | AI-Driven Pressure (inWG) | Traditional Deviation (±inWG) | AI Deviation (±inWG) | Airflow Adjustment (CFM) |
| State 1: All closed | 0.060 | 0.060 | 0.000 | 0.000 | 0 |
| State 2: 1 double door (B) | 0.055 | 0.060 | -0.005 | 0.000 | +2355 |
| State 3: 2 double doors (B) | 0.052 | 0.061 | -0.008 | +0.001 | +4710 |
| State 4: 1 single door (D) | 0.058 | 0.060 | -0.002 | 0.000 | +1178 |
| State 5: 1 single door (CNC) | 0.062 | 0.059 | +0.002 | -0.001 | +1178 |
| State 6: Passbox to D | 0.061 | 0.060 | +0.001 | 0.000 | +18 |
| State 7: Passbox to C | 0.060 | 0.060 | 0.000 | 0.000 | 0 |
| State 8: Passthrough to CNC | 0.063 | 0.058 | +0.003 | -0.002 | +79 |
| State 9: Passthrough to C | 0.060 | 0.060 | 0.000 | 0.000 | 0 |
| State 10: 2 double + 1 single (D) | 0.050 | 0.062 | -0.010 | +0.002 | +5888 |
| State 11: 2 single (D + CNC) | 0.059 | 0.059 | -0.001 | -0.001 | +2356 |
| State 12: All doors open | 0.048 | 0.062 | -0.012 | +0.002 | +7066 |
| State 13: 1 double + Passbox (D) | 0.054 | 0.061 | -0.006 | +0.001 | +2373 |
| State 14: 1 single + Passthrough (CNC) | 0.064 | 0.058 | +0.004 | -0.002 | +1257 |
| State 15: 2 double + Passbox (C) | 0.051 | 0.061 | -0.009 | +0.001 | +4710 |
| State 16: All Passboxes + Passthroughs | 0.062 | 0.059 | +0.002 | -0.001 | +194 |
| State 17: 1 double + 1 single + Passbox (D) | 0.053 | 0.060 | -0.007 | 0.000 | +3551 |
| State 18: 2 single + Passthrough (CNC) | 0.065 | 0.058 | +0.005 | -0.002 | +2435 |
| State 19: All doors + 1 Passthrough | 0.047 | 0.063 | -0.013 | +0.003 | +7145 |
| State 20: Random (4 components open) | 0.066 | 0.057 | +0.006 | -0.003 | +4800 |
| Average | 0.0577 | 0.0599 | ±0.006 | ±0.002 | N/A |
2.2. Base Calculations
- -
-
Airflow (CFM):ACH Base: 25 (GMP Grade C).Base CFM: [Formula: CFM = (89,719 × 25) / 60 = 37,383 CFM].
- -
-
Leakage:Double door (34.8 ft² = 50,112 in²): [Formula: 50,112 × 0.047 = 2355 CFM].Single door (17.4 ft² = 25,056 in²): [Formula: 25,056 × 0.047 = 1178 CFM].Worst-case (all open): [Formula: (2 × 2355) + (2 × 1178) = 7066 CFM].Passbox (2.69 ft² = 387 in²): [Formula: 387 × 0.047 = 18 CFM].Passthrough (11.62 ft² = 1673 in²): [Formula: 1673 × 0.047 = 79 CFM].Total auxiliary (all open): [Formula: (2 × 18) + (2 × 79) = 194 CFM].
- -
- Hoods: [Formula: 2 × 500 = 1000 CFM]. Exhaust: 4000 CFM (10% fresh air).
- -
-
Occupancy Fresh Air (ASHRAE 62.1):seated: [Formula: 10 × 5 = 50 CFM].standing: [Formula: 5 × 7.5 = 37.5 CFM].transients (50%): [Formula: 5 × 10 × 0.5 = 25 CFM].Total: [Formula: 50 + 37.5 + 25 = 112.5 CFM (rounded to 120 CFM)].
- -
-
Cooling Load:Envelope: U = 0.088 Btu/h·ft²·°F, Area = 1270 ft², ΔT = 32.4°F[Formula: Q = 0.088 × 1270 × 32.4 = 3620 Btu/h].Equipment: [Formula: (3.73 + 2.24 + 7.46) × 3412 = 45,800 Btu/h].Occupancy: [Formula: (10 × 200) + (5 × 300) + (5 × 400 × 0.5) = 4500 Btu/h].Total: [Formula: 3620 + 45,800 + 4500 = 53,920 Btu/h ≈ 4.5 tons].Additional CFM: [Formula: 4.5 × 400 = 1800 CFM].
- -
-
Traditional (Worst-Case):[Formula: 37,383 + 7066 + 194 + 1000 + 4000 + 120 + 1800 = 51,563 CFM].With 20% safety factor: [Formula: 51,563 × 1.2 = 71,890 CFM].
- -
-
AI (Optimized): Average leakage: [Formula: (7066 + 194) / 2 = 3630 CFM].Total: [Formula: 37,383 + 3630 + 1000 + 4000 + 120 + 1800 = 47,933 CFM].With 15% adjustment: [Formula: 47,933 × 1.15 = 55,420 CFM].
- -
-
Fan Power: Traditional: [Formula: hp = (71,890 × 2) / (6356 × 0.8) = 28.3 hp].With 30% safety factor: [Formula: 28.3 × 1.3 = 37.6 hp].
- -
-
AI: [Formula: hp = (55,420 × 2) / (6356 × 0.8) = 21.8 hp].Optimized: 22.8 hp.
2.3. Proposed Method
Data: Extracted from Revit MEP simulations. AI: Artificial Neural Network (ANN) with 10 input nodes, 20 hidden nodes, and 5 output nodes, analyzing 64 states (2⁶ components). Optimizations: Ensures 0.06 inWG pressure compliance with BS EN 16798.
The ANN was trained on simulated data from Revit MEP to predict optimal airflow and pressure settings.
3. Conclusions
The AI-driven framework reduced airflow by 23%, fan power by 39%, and energy consumption by 40%, while achieving an 86% faster design process. Tailored for complex cleanroom scenarios, this approach merits field validation to confirm its efficacy. The author declares no conflicts of interest.
References
- ISO 14644-1:2015, Cleanrooms and associated controlled environments — Part 1.
- Classification of air cleanliness by particle concentration, International Organization for Standardization.
- European Commission, EU GMP Annex 1: Manufacture of Sterile Medicinal Products, Revision 2022, Brussels.
- British Standards Institution, BS EN 16798-1:2019, Energy performance of buildings — Ventilation for buildings, BSI Standards Limited.
- Chen, S. (2017). Model Predictive Control of the HVAC System in Industrial Cleanrooms for Energy Saving, ProQuest Dissertations Publishing.
- ASHRAE, Handbook — HVAC Applications, Chapter 18: Clean Spaces, American Society of Heating, Refrigerating and Air-Conditioning Engineers, 2023.
- Loomans, M. et al. Experimental investigation into cleanroom contamination build-up. Building and Environment 2020, 182, 107–119. [Google Scholar]
- Nassif, N. Modeling and Optimization of HVAC Systems Using Artificial Intelligence Approaches. ASHRAE Transactions 2012, 118, 133–140. [Google Scholar]
- Wang, S. (2023). Intelligent Building Control Systems: HVAC, Lighting, and Security, Springer.
- ISO 14644-4:2001, Cleanrooms and associated controlled environments — Part 4: Design, construction and start-up, International Organization for Standardization.
- World Health Organization, Good Manufacturing Practices for Pharmaceutical Products, WHO Technical Report Series, 2021.
- Adelekan, D.S.; et al. Artificial intelligence models for refrigeration, air conditioning and heat pump systems. Energy Reports 2022, 8, 744–753. [Google Scholar] [CrossRef]
- Autodesk, Revit MEP User Guide, 2023 Edition, Autodesk Inc.
- Carrier Corporation, Hourly Analysis Program (HAP) Manual, Version 5.11, 2022.
- Ni, H. P., & Chou, J. S. Optimizing HVAC systems for semiconductor fabrication: a data-intensive framework. Journal of Building Engineering 2024, 82, 108–123.
- Zhang, L.; Wang, Y. AI-driven optimization of HVAC systems for energy efficiency. Energy and Buildings 2023, 280, 112–125. [Google Scholar]
- Kumar, R., et al. Machine learning applications in HVAC control systems: A comprehensive review. Renewable and Sustainable Energy Reviews 2023, 170, 111–130.
- Krarti, M. (2022). Artificial Intelligence for Building Energy Analysis, CRC Press.
Disclaimer/Publisher’s Note: The statements, opinions and data contained in all publications are solely those of the individual author(s) and contributor(s) and not of MDPI and/or the editor(s). MDPI and/or the editor(s) disclaim responsibility for any injury to people or property resulting from any ideas, methods, instructions or products referred to in the content. |
© 2025 by the authors. Licensee MDPI, Basel, Switzerland. This article is an open access article distributed under the terms and conditions of the Creative Commons Attribution (CC BY) license (http://creativecommons.org/licenses/by/4.0/).
Copyright: This open access article is published under a Creative Commons CC BY 4.0 license, which permit the free download, distribution, and reuse, provided that the author and preprint are cited in any reuse.


