Submitted:
06 April 2025
Posted:
07 April 2025
Read the latest preprint version here
Abstract
Green hydrogen is gaining prominence as a strategic option for decarbonizing sectors that are difficult to electrify, yet its economic potential differs across regions. This study develops a comparative modeling framework enhanced by machine learning to project both the Levelized Cost of Hydrogen (LCOH) and Net Present Value (NPV) for hydrogen projects in Costa Rica and the United Kingdom (UK). By combining geospatial energy resource mapping, techno-economic modeling, and advanced tools such as Random Forest algorithms, SHAP interpretability analysis, and Monte Carlo simulations, the research investigates how hydrogen production costs shift under varying policy and infrastructure scenarios. Findings show that Costa Rica’s LCOH ranges from $3.4 to $5.1 per kilogram, influenced by renewable energy type and system scale, while the UK benefits from financial incentives that help offset its higher baseline costs. Across both countries, the key determinants of cost were electricity pricing, capital expenditure, and electrolysis efficiency. The use of machine learning significantly improved prediction accuracy and allowed for deeper exploration of policy sensitivities. The outcomes not only align with each nation’s hydrogen strategy but also point to actionable avenues for international cooperation, including joint technology development, pilot programs, and hybrid financing models. This approach demonstrates how data-driven analysis can support more equitable and resilient transitions to zero-carbon energy systems, particularly when supported by interpretable artificial intelligence methods.
Keywords:
green hydrogen
; machine learning
; techno-economic modeling
; Levelized Cost of Hydrogen (LCOH)
; Comparative Energy Policy
1. Introduction
Green hydrogen is increasingly recognized as a cornerstone of global decarbonization efforts, with the potential to mitigate up to 80 gigatons of CO₂ emissions by mid-century while supporting energy demand in sectors that are difficult to electrify, such as heavy industry, aviation, and long-duration storage (Hydrogen Council & McKinsey, 2021). Forecasts indicate that the global hydrogen market could exceed 660 million metric tons per year, driven by ambitious policy initiatives and the expansion of renewable energy systems. However, this momentum brings considerable uncertainties, including volatile cost projections, substantial infrastructure requirements, and the challenge of equitable deployment across diverse geopolitical contexts. While industrialized nations such as China, Germany, and Japan are advancing rapidly in hydrogen development, countries in the Global South face systemic barriers to aligning hydrogen deployment with broader goals of socio-economic growth and climate equity (NewClimate Institute, 2023).
The United Kingdom, for instance, envisions hydrogen as a flexible decarbonization tool, targeting 10 GW of low-carbon hydrogen production by 2030 and up to 460 TWh in demand by 2050, underpinned by policies such as the Hydrogen Business Model and Low Carbon Hydrogen Standard (Royal Academy of Engineering, 2022). In contrast, Costa Rica’s hydrogen strategy leverages its nearly 100% renewable electricity mix, exploring hydrogen applications in transport and agriculture, with cost estimates ranging from $3.4–$5.1/kg depending on the renewable source (Stamm et al., 2024). These contrasting trajectories highlight the spectrum of hydrogen development, from industrial-scale export ambitions in the UK to localized, sustainability-oriented models in Costa Rica.
Existing literature provides valuable insights into the technical, policy, and economic aspects of hydrogen systems. Studies by Deloitte (2023) and Taghizadeh-Hesary et al. (2022) use LCOH and NPV modeling to evaluate hydrogen production costs under varying conditions, highlighting the influence of CAPEX, electricity prices, and financing terms. In parallel, research on machine learning (ML) has shown its value in improving forecasting accuracy and operational optimization. For instance, Mukelabai et al. (2024) apply ML to enhance performance forecasting and component modeling for renewable hydrogen systems, while Ukwuoma et al. (2024) demonstrate the benefits of hybrid ensemble models in biomass-based hydrogen production, offering improved prediction and explainability. These contributions underscore the potential of ML to optimize key system parameters, better align with fluctuating renewable inputs, and reduce production costs by fine-tuning LCOH. However, a significant gap remains in comparative ML-based studies that forecast LCOH and NPV across countries with varying resource profiles and infrastructure maturity. Moreover, the limited use of regional datasets in hydrogen economic modeling constrains the generalizability of current frameworks. For example, while solar irradiance models have been used in specific cases such as India, few have been integrated into broader hydrogen production models to address renewable intermittency (Sareen et al., 2024).
Machine learning significantly enhances the optimization of green hydrogen production processes, particularly in Solid Oxide Electrolysis Cells (SOECs). Models like XGBoost, Random Forest, and Deep Neural Networks (DNN) are employed to predict key performance indicators such as hydrogen production rates, current density, and Ohmic resistance. Notably, the XGBoost model has demonstrated high accuracy, achieving R² values exceeding 0.95 for hydrogen production rates and other relevant outputs. By integrating Genetic Algorithms (GA), the model further optimizes input features to maximize hydrogen production while minimizing energy consumption. Additionally, machine learning techniques improve cost-efficiency by fine-tuning parameters that directly affect the Levelized Cost of Hydrogen (LCOH). This ensures that the production process can adapt to dynamic variables like temperature, voltage, and gas flow rate, all of which are crucial when dealing with the fluctuating nature of renewable energy inputs, such as solar and wind (Yang et al., 2025).
In Latin America, the abundance of renewable energy sources—including wind, solar, and hydropower—presents a significant advantage for the production of green hydrogen. Nations such as Chile, Argentina, and Uruguay are particularly well-suited to become major exporters due to their access to affordable clean energy, which enables hydrogen generation via electrolysis. Nevertheless, these countries must navigate a range of barriers, including limited infrastructure, elevated production costs, and fragmented regulatory environments that hinder the expansion of green hydrogen initiatives. To address these obstacles, experts propose enhanced international collaboration, targeted investment in infrastructure, and the creation of transparent certification mechanisms to facilitate market growth (Torma, Németh, & Mendoza, 2024). It is also critical that hydrogen policies in the region incorporate principles of social inclusion and environmental fairness, ensuring that development benefits are distributed equitably and support a just transition (Dorn, 2022). According to Gischler et al. (2023), fostering regional cooperation and promoting partnerships between the public and private sectors will be essential for Latin America to achieve sustainable and socially responsible green hydrogen development, thereby strengthening its potential to emerge as a global leader in this space.
To fill these gaps, this study introduces a comparative, machine learning–driven modeling framework to assess the techno-economic viability of green hydrogen in Costa Rica and the United Kingdom. It forecasts key indicators such as Levelized Cost of Hydrogen (LCOH) and Net Present Value (NPV) under varying scenarios of policy support, resource availability, and technology configuration. The framework leverages models like XGBoost, Random Forest, and SHAP values to improve predictive accuracy and explainability, while Monte Carlo simulations quantify uncertainty across parameters such as electricity cost and infrastructure maturity. This approach offers a robust way to assess the risk–return profiles of hydrogen investments in both developed and emerging markets.
Accordingly, the study addresses three core questions:
(1) What are the most influential factors affecting LCOH and NPV in each country?
(2) How can machine learning improve the forecasting accuracy and interpretability of hydrogen economic models?
(3) What comparative insights can inform investment and policy decisions across different development contexts?
By answering these questions, the study positions green hydrogen not only as a climate mitigation tool, but also as a pathway for equitable, economically resilient energy transitions. The remainder of the paper is organized as follows: Section 2 reviews relevant literature; Section 3 details the methodological framework; Section 4 presents LCOH and NPV findings; Section 5 introduces machine learning models and sensitivity testing; and Section 6 offers a comparative discussion, identifies limitations, and outlines future directions.
2. Literature Review
2.1. The Role of Green Hydrogen in Global Decarbonization
Green hydrogen is a critical tool for decarbonizing hard-to-abate sectors such as heavy transport, industry, and power generation. In Thailand, it could comprise 12.2% of the energy mix by 2050, driven by investments in electrolysis and renewables (Pradhan et al., 2024). Globally, demand may increase fifteenfold by 2050, with the EU alone requiring 1,300 GW of electrolyser capacity (Tarvydas, 2022). Beyond emissions reduction, hydrogen also offers value in renewable energy storage and grid balancing, though deployment remains constrained by high costs and infrastructure needs. The climate effectiveness of hydrogen—particularly blue hydrogen—depends on stringent life-cycle emissions tracking. Concerns around methane leakage and carbon capture performance have triggered calls for global standards like ISO 19870 and mandatory third-party verification (Tatarenko et al., 2024). Additionally, public acceptance plays a critical role, with trust in technology and transparent communication proving more effective than consultation alone (Buchner et al., 2025).
Despite a growing global project pipeline, especially in China, most low-emissions hydrogen initiatives remain unrealized. Achieving large-scale impact will require coordinated progress in policy, infrastructure, and demand, especially across emerging regions like Latin America (International Energy Agency, 2024). Countries such as the UK, EU members, Australia, and Argentina are advancing through comprehensive legislative strategies. Measures like the EU’s hydrogen premium auctions and the U.S. Inflation Reduction Act help close the cost gap with fossil fuels, improving hydrogen’s competitiveness (Bird & Bird LLP et al., 2024). While the UK prioritizes industrial-scale hydrogen production, countries like Costa Rica are pursuing decentralized models tailored to renewable resource strengths and existing infrastructure.
2.2. Overview of Electrolysis Technologies (PEM, Alkaline, AEM, SOEC)
Green hydrogen production relies on various electrolysis technologies, each with unique efficiencies, materials, and operational characteristics. Solid Oxide Electrolysis Cells (SOECs) operate at high temperatures (700–1000 °C), achieving up to 97.6% efficiency (HHV) and low energy use (2.5–3.5 kWh/Nm³), especially when coupled with industrial waste heat or solar thermal energy. However, thermal cycling and degradation currently limit their commercial viability (Norman et al., 2024). Alkaline Electrolysis (AEC) is the most mature and cost-effective technology ($1,080–1,296/kW), operating at 65–100 °C with 60–80% efficiency, though it responds poorly to variable renewable inputs. Proton Exchange Membrane (PEM) systems offer high hydrogen purity (99.999%) and fast response, but rely on expensive, scarce materials like Ir and Pt, pushing costs to $2,009–2,506/kW (El-Shafie, 2023). Anion Exchange Membrane (AEM) electrolysis, a promising low-cost alternative, uses non-precious catalysts and reaches up to 75% efficiency at lower temperatures (50–70 °C). Early deployments by Ionomer and Versogen show potential, although stability under fluctuating loads remains a challenge (Bernat et al., 2024).
For off-grid or decentralized applications, AEM and PEM are favored due to their flexibility, as demonstrated in remote deployments across Europe and Australia, including unitized regenerative fuel cells (URFCs) despite current efficiency limitations (Borm & Harrison, 2021). While SOECs may align with the UK’s industrial-scale ambitions, Costa Rica’s decentralized model benefits more from the adaptable, lower-cost PEM and AEM systems, which integrate efficiently with renewable sources such as wind and hydropower.
Economic Modeling and LCOH Predictions
Economic modeling of Levelized Cost of Hydrogen (LCOH) and Net Present Value (NPV) highlights the trade-offs between high-efficiency technologies like SOEC and more cost-effective options like PEM and AEM. The UK, with large-scale plans and access to offshore wind, might justify the higher costs of SOEC, while Costa Rica’s decentralized hydrogen production strategy, utilizing abundant renewable resources, could benefit from PEM or AEM due to their lower capital costs and adaptability to variable energy sources.
Table 1 summarizes techno-economic assessments for different renewable energy sources and electrolyzer technologies, offering a clearer picture of their economic viability in different contexts.
Economic modeling shows that LCOH depends heavily on electrolyzer type and renewable energy source. SOEC suits large-scale projects with stable inputs like offshore wind, justifying higher CAPEX. In contrast, PEM and AEM are better for decentralized, small-scale systems due to lower costs and compatibility with variable renewables. These results highlight the importance of aligning technology choice with local resources, infrastructure, and economic conditions.
2.3. Key Metrics: LCOH, NPV, Hydrogen Yield, Storage Cost
Evaluating green hydrogen viability hinges on key indicators such as Levelized Cost of Hydrogen (LCOH), Net Present Value (NPV), hydrogen yield, and storage costs. In Brazil, wind-powered alkaline electrolysis for urban buses achieved LCOH values between $25–56/MWh and NPV as high as $21.8 million, with IRR reaching 90%—even when hydrogen was priced at zero—due to revenue from oxygen sales and surplus electricity (Alcantara et al., 2025). A review of 334 European projects found average green hydrogen costs at $5.02/kg, outperforming grid-based “yellow” hydrogen at $6.80/kg. LCOH from onshore wind reached as low as $2.50/kg, and economies of scale led to cost reductions of 0.20% per 1% increase in capacity (Weißensteiner, 2025).
Global trade models identified ammonia as the most cost-effective export vector from Chile to Rotterdam, unless reconversion was required, with delivered hydrogen prices between $3.37–$4.77/kg. Storage in isolated systems could add up to $0.25/kg, emphasizing the need for dynamic, scenario-based planning rather than static LCOH benchmarks (Aldren et al., 2025). In South Africa, a solar-driven system produced 250 kg/day at $2.12/kg LCOH, though storage costs remained high (918 ZAR/kg). Despite this, storage enabled long-duration supply in off-grid contexts, highlighting the importance of integrated system design (Lebepe et al., 2025).
In Indonesia, cost analysis across five cities revealed extreme variation—ranging from $0.48/kg in Ambon to $82/kg in Kupang—driven by disparities in renewable resources and infrastructure. Hybrid systems offered the best trade-off between yield and cost, and a 20% component price increase could raise LCOH by up to 30%, underscoring the importance of efficient electrolyser design and supply chain resilience (Prasetyo et al., 2025).
2.4. Comparative Context: UK and Costa Rica
Renewable Energy Profiles of the UK and Costa Rica
Costa Rica generates 99% of its electricity from renewables—mainly hydro (74%), with geothermal (13%), wind (11%), and solar (1%)—creating a stable year-round supply from flexible, dispatchable sources. Between 2016 and 2021, renewable energy use rose significantly, boosting energy self-sufficiency to 54%. These conditions support green hydrogen production from off-peak hydro and wind, though challenges remain in grid balancing and matching supply with demand across regions (IRENA, 2024).
Meanwhile, the UK reached 50.5% renewable electricity in Q3 2024, led by wind (especially in Scotland), solar, and biomass. Its decarbonizing grid, bolstered by interconnector capacity and reduced fossil generation, offers strong potential for hydrogen production from surplus renewables. Still, scaling hydrogen will require greater offshore wind resilience, energy storage, and agile grid management (DESNZ, 2024a).
2.5. National Hydrogen Strategies and Targets
Costa Rica’s 2023 National Green Hydrogen Strategy targets 18–20 kton/year hydrogen demand by 2030 and 420 kton/year by 2050, with electrolysis capacity of 0.2–1 GW and LCOH as low as $1.24/kg from wind. The strategy prioritizes domestic use due to high electricity costs and limited infrastructure, supported by public-private efforts like Ad Astra Rocket and Cavendish S.A., and donors such as GIZ and IADB. Political instability poses risks to continuity and financing (Stamm et al., 2024). A flagship project, the Ad Astra Hydrogen Transportation Ecosystem, integrates wind and solar with PEM electrolysis, piloting hydrogen mobility and innovative models like leasing and off-take agreements in Guanacaste (Ad Astra, 2024).
The UK’s Hydrogen Strategy, launched in 2021 and updated in 2024, targets 10 GW low-carbon hydrogen by 2030 (split between green and blue), aiming to produce up to 64 TWh annually. It supports sectors like transport, heating, and power through mechanisms like the Net Zero Hydrogen Fund and the Low Carbon Hydrogen Standard. Regional efforts, such as Scotland’s Orkney BIG HIT, contribute to deployment. The sector could generate £7 billion GVA and 64,000 jobs by 2030, though challenges remain in policy coordination and infrastructure scaling, especially for storage and distribution (DESNZ, 2024b; UK Government, 2021).
2.6. Economic Modeling Approaches and Influencing Factors
Green hydrogen project modeling integrates cost, efficiency, and risk analysis to evaluate viability. In Colombia, PEM and AWE electrolysis powered by various renewables yielded LCOH between $7.02–$9.69/kg, with capacity factor, CAPEX, and financing as key cost drivers; offshore wind remained economically unviable (Velasquez-Jaramillo et al., 2024). Spain’s PPA-backed alkaline electrolysis projects showed electricity prices contributed over 70% of LCOH ($3.47–$4.43/kg), with system sizing and grants (≥30%) boosting NPV and IRR (Matute et al., 2023b).
A comparative study found LCOH ranging from $2.94 to $4.11/kg across advanced technologies, with PEM having the lowest CAPEX (~$600/kW), and cost influenced by electricity prices, stack life, and learning curves (Naqvi et al., 2024). In Brazil, a 100 MW hybrid system showed alkaline electrolysis outperformed PEM financially, with IRR near 29% and fast payback under $7/kg pricing (Pinheiro et al., 2025).
Australia’s solar-powered PEM system emphasized the impact of financial structuring—CAPEX comprised 80% of base cost, and LCOH ($6.36/kg) was highly sensitive to capital costs and subsidies (Rezaei et al., 2024). In Finland, flexible PEM systems switching between hydrogen production and grid export reduced LCOH to $2.16–$0.65/kg, with strong NPV/IRR under variable markets (Javanshir et al., 2024).
Hybrid configurations using solar, wind, and ORC tech showed LCOH as low as $3.1/kg in 2023, with projections down to $1.46/kg by 2050 due to tech gains and cost learning (Baral & Šebo, 2024). Overall, regional resource differences (e.g., UK’s offshore wind vs. Costa Rica’s hydro) significantly shape LCOH/NPV, and Monte Carlo simulations are widely used to capture uncertainties in input variables.
2.7. Regression Models for Cost Prediction
Machine learning (ML) has become central to green hydrogen cost modeling, particularly through regression techniques. While not ML-based, IRENA (2021) identified key LCOH drivers—CAPEX, electricity price, efficiency, and deployment scale—laying the foundation for future predictive models. Advanced ML applications by Kabir et al. (2023) used algorithms like KNN and Random Forest to optimize hydrogen production, achieving high accuracy (R² = 0.948) and highlighting predictors like temperature and voltage. Similarly, Kim et al. (2022) applied CART® models to nuclear-powered hydrogen systems, identifying top cost influencers and offering reliable LCOH forecasts (e.g., $2.77/kg).
A broader review by Bassey & Ibegbulam (2023) emphasized the importance of data preprocessing and called for the adoption of explainable AI tools for transparency. Kwon et al. (2024) used neural networks with 71 inputs to forecast hydrogen demand, achieving R² = 0.9936 and guiding investment decisions with an LCOH of $5.63/kg. Allal et al. (2025) confirmed that models like Random Forest and SHAP improve cost forecasting and policy planning by revealing variable importance.
Despite progress, gaps remain—few studies compare multiple ML algorithms under uniform conditions, and limited regional datasets hinder generalizability. Collaborative, open-access ML frameworks are needed to improve model transferability and scalability. Overall, ML-driven planning aligns with national strategies: the UK emphasizes industrial-scale infrastructure, while Costa Rica focuses on decentralized renewables. Tools like Random Forest and XGBoost, combined with SHAP values, offer interpretability and precision in modeling cost dynamics across diverse hydrogen contexts.
3. Methodology
3.1. Spatial Resource Assessment
This study conducts a spatial analysis of wind and solar energy resources in Costa Rica and the United Kingdom by leveraging geospatial raster datasets and administrative boundary shapefiles. Python (v3.11) was used as the primary analytical platform, employing libraries such as rasterio, geopandas, shapely, and numpy. For each country, high-resolution raster layers representing wind speed or global horizontal irradiance (GHI) were clipped using province- or country-specific polygons to isolate regional resource characteristics.
Zonal Statistics Extraction
To assess solar and wind potential, raster datasets were spatially masked and clipped. The 90th percentile value of the dataset, representing the threshold for identifying high-potential zones, was computed using:
 |
- T90: The 90th percentile threshold of the data values.
- X: The vector of valid raster values (e.g., wind speed or solar irradiance) for a given region.
Pixels with values equal to or exceeding T90 were classified as part of the top 10% high-performance zone:
 |
- Xtop10%: Subset of data values representing the top 10%.
- xi: Individual raster values within the dataset X
3.2. Offshore Potential Mapping
To delineate offshore resource zones, a 20 km buffer was generated around each administrative unit (province or country section). Offshore areas were calculated by subtracting the original landmass from its buffered version:
 |
- Aoffshore: The resulting offshore area geometry.
- Aregion: The original land-based administrative area.
- Buffer(Aregion,20km): Geometric expansion by 20 kilometers.
These areas were rasterized and used to isolate marine wind or solar data for offshore analysis.
3.3. Wind Power Density Estimation
Wind energy potential was quantified by converting wind speed into wind power density using the kinetic energy formula:
 |
- P: Wind power density (W/m²).
- ρ: Air density (assumed 1.225 kg/m³ at sea level).
- v: Wind speed (m/s).
This equation reflects the theoretical amount of kinetic energy available per square meter and assumes ideal conditions with no turbine losses.
3.4. Solar Irradiance Analysis
Solar resource potential was assessed using Global Horizontal Irradiance (GHI) datasets. High-performance solar zones were isolated using the 90th percentile method:
 |
- T90solar: The 90th percentile of GHI values in a given region.
- GHI: Global Horizontal Irradiance values (in kWh/m²/day).
The top 10% solar performance zone was similarly defined as:
 |
- GHItop10%: Set of high-performing solar pixels.
- gi: Individual irradiance values in the dataset.
3.5. High-Potential Zone Delineation
A consistent approach was used to extract high-resource areas for both wind and solar datasets. The general form of the percentile-based extraction is:
 |
- Xtop10%: High-performing data subset.
- xi: Individual data value.
- X: Complete dataset for a given spatial zone.
These zones were retained for further modeling of hydrogen production costs and infrastructure suitability.
3.6. Hydrogen LCOH Modeling
This section details the methodology used to estimate the Levelized Cost of Hydrogen (LCOH) for both the UK and Costa Rica. LCOH serves as a critical metric to assess the cost-effectiveness of hydrogen production from renewable sources. The approach integrates annualized capital expenditures (CAPEX), operational expenditures (OPEX), electricity prices, and electrolyzer efficiency, while accounting for country-specific economic and technical conditions.
3.6.1. UK LCOH Model Inputs
For the UK, the Levelized Cost of Hydrogen (LCOH) was calculated using a set of input parameters summarized in Table 2, which reflects current and projected techno-economic conditions in the UK’s hydrogen sector.
The LCOH was estimated based on annualized CAPEX, OPEX, electricity prices, and electrolyzer performance. The formula used is:
where:
 |
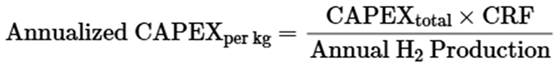 |
The Capital Recovery Factor (CRF) is calculated using:
where:
 |
- r=0.06 (cost of capital)
- n=20 years (plant lifetime)
3.6.2. Costa Rica LCOH Model Inputs
The Levelized Cost of Hydrogen (LCOH) for Costa Rica was estimated using the same modeling approach and formulas described in Section 3.6.1, including the Capital Recovery Factor (CRF). Country-specific inputs, detailed in Table 3, were adapted to reflect Costa Rica’s unique techno-economic context—particularly its lower infrastructure costs, reduced electricity rates, and favorable financing conditions.
3.7. Regional Adjustments for Costa Rica and the UK
For both Costa Rica and the UK, the LCOH is further adjusted based on regional variations in wind and solar resources. These adjustments reflect the varying resource availability across regions within each country, impacting the efficiency and cost of hydrogen production. The adjustments are based on regional wind power densities (for wind energy) and Global Horizontal Irradiance (GHI) values (for solar energy).
Formula for Regional Adjustments
 |
This formula is used to adjust the electricity cost based on both solar and wind energy potential in each region.
- GHI (Global Horizontal Irradiance) is used for solar resources.
- Wind Power Density is calculated using the formula P=0.5×ρ×v3 where ρ=1.225 kg/m³ (air density at sea level) and v is the wind speed (in m/s).
These adjustments help capture the regional differences in resource availability and reflect their impact on the hydrogen production cost integrated in Supplementary Tables 1 and 2.
The final LCOH for each region is calculated by adding the adjusted electricity cost, annualized CAPEX per kg, and fixed OPEX. This provides the estimated cost of producing one kilogram of hydrogen from renewable resources, taking into account both financial and technical factors.
3.8. Economic Calculations
This section applies the previously defined modeling framework to evaluate the economic performance of hydrogen production in Costa Rica and the United Kingdom, focusing on two core indicators: Levelized Cost of Hydrogen (LCOH) and Net Present Value (NPV). LCOH results are directly derived from the methodology described in Section 3.6, with regional comparisons reflecting local cost drivers, renewable energy availability, and policy incentives. These metrics integrate capital expenditures (CAPEX), operational expenditures (OPEX), electricity costs, and hydrogen output over the system’s lifetime. Country-specific modeling assumptions, including fiscal incentives and efficiency degradation, are detailed in Table 4 (UK) and Table 5 (Costa Rica).
Net Present Value (NPV)
The Net Present Value (NPV) assesses the overall profitability of hydrogen projects by discounting future net cash flows—defined as revenues minus costs—over a 20-year project lifetime. It is calculated as:
where:
 |
- Revenuet=H2 Pricet×Annual Production.
- Costt=CAPEXper kg×CRF+OPEXfixed+Electricity Costper kg
- r is the discount rate, and n is the project duration in years.
To capture uncertainty in hydrogen prices, electricity costs, and system efficiency, a Monte Carlo simulation with 1,000 iterations was performed. This probabilistic approach enables a more nuanced understanding of project risk and economic resilience under varying policy and market conditions.
By combining deterministic LCOH modeling with stochastic NPV simulation, this section provides a comprehensive economic perspective on hydrogen viability across diverse geographies and investment environments.
By integrating these formulas and tables, the methodology allows for the calculation of the LCOH and NPV for hydrogen production in both Costa Rica and the UK. These metrics serve as key tools for assessing the economic feasibility and long-term profitability of green hydrogen investments in these countries.
3.9. Machine Learning-Driven Economic Forecasting for Green Hydrogen
Given the limitations of traditional economic modeling in capturing complex interactions under uncertain policy and market conditions, this section explores the application of machine learning (ML) to improve forecasting accuracy and interpretability of green hydrogen production costs.
A Random Forest Regressor was selected for its ability to model nonlinear relationships between input variables and the Levelized Cost of Hydrogen (LCOH). Separate supervised regression models were developed for Costa Rica and the UK, enabling scenario-based analysis under varying techno-economic conditions.
Model Architecture
- Costa Rica model inputs included: CAPEX, electricity price, OPEX, and operating hours
- UK model inputs included all Costa Rican inputs, plus: degradation rate and a binary subsidy indicator
All variables were normalized using StandardScaler, and hyperparameter tuning was performed via GridSearchCV, optimizing tree depth, number of estimators, and minimum samples per split.
Cross-validation was used to assess model stability:
- 2-fold cross-validation for Costa Rica
- 5-fold cross-validation for the UK
To enhance interpretability, the model employed SHAP (SHapley Additive exPlanations) to quantify the relative importance of each feature in driving LCOH predictions.
4. Sensitivity Analysis for Green Hydrogen Economic Models
A two-dimensional sensitivity analysis was conducted to assess how variations in CAPEX, electricity price, and OPEX affect the Levelized Cost of Hydrogen (LCOH) and Net Present Value (NPV) for both Costa Rica and the UK. This analysis was designed to identify the most influential economic drivers and evaluate project feasibility under diverse market and policy conditions.
The modeling approach varied two input parameters at a time while holding the third constant. For Costa Rica, nested loops were implemented to iterate combinations of CAPEX and electricity price, with OPEX held fixed. For the UK model, a modular function enabled a consistent structure for testing parameter ranges and calculating corresponding LCOH and NPV values.
The outputs were used to generate contour plots that visualize the relationship between key variables and economic performance metrics. These visualizations—presented in later sections—support a more detailed understanding of model sensitivity and provide a foundation for identifying effective policy levers and investment strategies.
5. Results
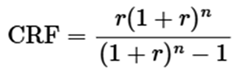
5.1. Wind and Solar Energy Potential in Costa Rica
A spatial analysis of Costa Rica’s wind and solar resources reveals substantial regional variation, underscoring the country’s strong potential for renewable energy generation. As illustrated in Figure 1, Guanacaste emerges as the most promising region for both wind and solar energy. The mean onshore wind speed in Guanacaste is 6.59 m/s, with peaks reaching 19.17 m/s; its top 10% wind zones average 11.21 m/s. By contrast, Limón records the lowest wind speeds, with a mean of 2.40 m/s, indicating limited wind energy potential. Offshore wind speeds are relatively uniform across coastal provinces, averaging 4.57 m/s.
For solar energy, Guanacaste again leads with the highest mean Global Horizontal Irradiance (GHI) at 2005.27 kWh/m²/day, and the top 10% of its solar zones reach 2113.09 kWh/m²/day. Puntarenas follows with a mean GHI of 1885.08 kWh/m²/day, while Cartago and San José display lower solar potential, at 1612.32 and 1747.36 kWh/m²/day, respectively.
In summary, Guanacaste clearly stands out as the leading region for both wind and solar deployment, positioning it as a focal point for renewable energy investment in Costa Rica.
5.2. Solar and Wind Energy Potential Across the United Kingdom and Northern Ireland
The solar irradiance (GHI) values across the four regions of the United Kingdom show regional variations in solar potential. Figure 2 displays the solar potential in England, Wales, Scotland, and Northern Ireland. In England (Figure 2a), the mean GHI is 2.73 kWh/m²/day, with the highest recorded value of 3.17 kWh/m²/day and the lowest at 1.64 kWh/m²/day. The top 10% of solar zones in England have a threshold of 2.91 kWh/m²/day, with a mean of 2.98 kWh/m²/day. In Wales (Figure 2b), the mean GHI is slightly lower at 2.67 kWh/m²/day, with values ranging from 1.57 kWh/m²/day to 3.00 kWh/m²/day. The top 10% solar zones in Wales have a threshold of 2.83 kWh/m²/day and a mean of 2.89 kWh/m²/day. Scotland (Figure 2c) shows a mean GHI of 2.35 kWh/m²/day, with the minimum at 1.18 kWh/m²/day and the maximum at 2.76 kWh/m²/day. The top 10% solar zones in Scotland have a threshold of 2.50 kWh/m²/day and a mean of 2.56 kWh/m²/day. Finally, Northern Ireland (Figure 2d) has a mean GHI of 2.44 kWh/m²/day, ranging from 1.97 kWh/m²/day to 2.66 kWh/m²/day, with the top 10% solar zones having a threshold of 2.50 kWh/m²/day and a mean of 2.56 kWh/m²/day.
In terms of wind speed at 100m height, Figure 3 illustrates the wind potential for the same four regions. For England (Figure 3a), the average wind power density is 456.21 W/m², with a maximum value of 2725.38 W/m² and a minimum of 55.03 W/m². The top 10% wind zones in England have a threshold of 612.94 W/m², with a mean of 655.79 W/m². Wales (Figure 3b) shows onshore wind speeds with a mean of 8.57 m/s and a maximum of 16.32 m/s. The offshore wind speed in Wales is slightly higher, with a mean of 9.20 m/s and a maximum of 13.72 m/s. The top 10% wind zones in Wales have a threshold of 9.90 m/s and a mean of 10.23 m/s. In Scotland (Figure 3c), the onshore wind speed has a mean of 8.66 m/s, with a maximum of 18.78 m/s. Offshore wind speeds in Scotland are higher, with a mean of 9.92 m/s and a maximum of 16.45 m/s, and the top 10% wind zones show a threshold of 10.21 m/s and a mean of 11.20 m/s. For Northern Ireland (Figure 3d), the onshore wind speed is 9.00 m/s on average, with a maximum of 16.45 m/s, while offshore wind speeds have a mean of 9.33 m/s and a maximum of 17.20 m/s. The top 10% wind zones in Northern Ireland show a threshold of 9.78 m/s and a mean of 10.34 m/s.
These results indicate significant variability in both solar and wind potential across the regions. The data highlights that offshore areas (such as those in Wales, Scotland, and Northern Ireland) tend to have stronger wind speeds, which could be ideal for offshore wind energy projects. Similarly, the solar potential across all regions varies slightly, with England and Wales showing the highest solar irradiance values.
5.3. LCOH Estimations for Costa Rica and the United Kingdom
Hydrogen production costs, expressed as the Levelized Cost of Hydrogen (LCOH), were evaluated across multiple locations in Costa Rica and the United Kingdom, incorporating local renewable energy potentials, as well as region-specific CAPEX, OPEX, and electricity pricing. The results indicate marked spatial disparities, with cost variations largely influenced by factors such as solar irradiance, wind resource availability, and the degree of existing infrastructure development.
In Costa Rica, Guanacaste emerged as the most economically favorable region, with the lowest LCOH of $1.03 per kg H₂, attributed to its exceptional wind and solar resource availability. This is followed by Puntarenas at $1.66 and San José at $2.38 per kg H₂. Regions such as Limón ($2.90), Cartago ($3.09), Alajuela ($2.78), and Heredia ($2.84) exhibit comparatively higher LCOH due to less favorable renewable profiles or slightly increased infrastructure and energy costs. Across Costa Rica, solar adjustments showed minimal impact on final LCOH values, indicating the dominance of baseline techno-economic parameters in driving cost outcomes.
In the United Kingdom, Northern Ireland recorded the lowest LCOH at $2.74 per kg H₂, primarily due to strong offshore wind potential. Scotland and Wales followed closely with LCOH estimates of $2.92 and $2.96, respectively. England, by contrast, presented the highest cost, with an LCOH of $3.17 per kg H₂. The influence of offshore wind resources is evident, as regions with greater access to these resources show noticeably lower production costs. Solar adjustments produced marginal reductions across most UK regions, further narrowing the cost gap but without overturning the regional hierarchy in cost competitiveness.
These regional results are visualized in Figure 4, which compares LCOH values across Costa Rica and the UK using color-coded bar charts to highlight spatial cost differences.
These findings reinforce the critical role of local renewable energy potential in shaping hydrogen production costs. While Costa Rica offers lower baseline costs due to abundant resources and lower energy prices, the UK’s offshore wind advantage plays a pivotal role in enhancing its competitiveness. Such spatial cost insights are essential for guiding targeted investment, infrastructure planning, and policy incentives in the global transition to green hydrogen.
5.4. NPV Comparison for Hydrogen Production in Costa Rica and the United Kingdom
The Net Present Value (NPV) estimates for hydrogen production highlight significant contrasts in the economic potential between Costa Rica and the United Kingdom. As shown in Figure 5, Costa Rica achieves a higher NPV of approximately $4.76 million, driven by lower electricity costs and the availability of abundant renewable resources, especially solar and wind. In contrast, the United Kingdom’s NPV is $3.20 million, reflecting the impact of higher electricity prices and greater capital expenditures associated with offshore wind infrastructure.
This comparative result demonstrates that, under a consistent modeling framework and investment scenario, Costa Rica presents a more favorable economic environment for green hydrogen production. The elevated NPV in Costa Rica signals stronger return on investment, largely enabled by efficient energy inputs and reduced operational costs. Meanwhile, the UK’s resource structure and cost profile contribute to tighter margins, though the market remains promising with policy-driven support.
These results underscore the strategic influence of local energy economics and renewable resource availability in shaping hydrogen investment potential. While the UK remains viable, particularly with support for offshore wind, Costa Rica’s cost-efficient, renewables-rich energy landscape positions it as a leading candidate for green hydrogen development under the current assumptions.
5.5. Machine Learning Model Performance Comparison
To assess the predictive performance of the machine learning models used to estimate the Levelized Cost of Hydrogen (LCOH) in Costa Rica and the United Kingdom, three core error metrics were analyzed: Mean Absolute Error (MAE), Mean Squared Error (MSE), and Cross-Validated MSE. These metrics quantify both the accuracy and generalization ability of the trained Random Forest models and are summarized in Figure 6.
Costa Rica’s model exhibited lower errors across all evaluated metrics, with a MAE of 0.301, MSE of 0.091, and a Cross-Validated MSE of -0.076, indicating relatively strong performance despite the limited dataset. However, the R² score could not be defined due to the small number of test samples, highlighting a constraint in evaluating model generalization. In contrast, the UK model achieved a higher MAE of 0.416, MSE of 0.296, and a Cross-Validated MSE of -0.815, but benefited from a more robust dataset, resulting in a high R² score of 0.987. This suggests that while the UK model performs well in explaining variance, it experiences greater variability in prediction error when validated across folds.
These findings emphasize the importance of both dataset size and variability in assessing model reliability. They also demonstrate how different data environments influence predictive performance when applying machine learning to techno-economic modeling in green hydrogen analysis.
5.6. Sensitivity Analysis of Hydrogen Economics in Costa Rica and the United Kingdom
To assess the robustness of hydrogen production economics in response to fluctuating input costs, a detailed sensitivity analysis was conducted for both Costa Rica and the United Kingdom. This analysis explored the impacts of capital expenditure (CAPEX) and electricity price on two critical indicators: the Levelized Cost of Hydrogen (LCOH) and Net Present Value (NPV). The results reveal significant disparities in cost sensitivity between the two countries. In Costa Rica, LCOH remained below $5.00 per kg H₂ across a wide range of CAPEX and electricity prices, demonstrating strong economic resilience. NPV values also maintained positive levels throughout much of the parameter space, indicating attractive investment potential even under adverse cost conditions. In contrast, the UK model showed greater sensitivity to increases in electricity price and CAPEX, with the LCOH exceeding $10.00 per kg H₂ in several regions and a narrower window for achieving positive NPV. The contour plots presented in Figure 7 help visualize these economic trade-offs, with distinct gradients showing how modest adjustments in input parameters can drastically alter project viability. Notably, the UK’s economic feasibility is tightly clustered in a limited range of low CAPEX and electricity prices, suggesting that hydrogen projects in the UK require stricter cost control and stronger policy support to remain viable.
Overall, this comparative sensitivity analysis underscores Costa Rica’s stronger economic fundamentals for hydrogen production and highlights the critical role of input price management in scaling green hydrogen deployment in more cost-sensitive regions.
6. Discussion
This comparative modeling study of green hydrogen development in Costa Rica and the UK reveals several critical insights into how national contexts shape the techno-economic viability of hydrogen production. While both countries aim to expand hydrogen capacity, their respective strengths—Costa Rica’s abundant renewable resources and the UK’s infrastructure and policy maturity—lead to divergent cost drivers, investment risks, and strategic trajectories. In Costa Rica, the sensitivity of Levelized Cost of Hydrogen (LCOH) to electricity prices and system scale underscores the need for targeted incentives and optimization of small-scale, distributed systems. These findings are reinforced by the country’s comprehensive Estrategia Nacional de Hidrógeno Verde 2022–2050, which outlines a phased approach to hydrogen market development, promotes decentralized production hubs, and projects up to 13 million tons of CO₂ abatement and significant job creation by mid-century (MINAE, 2022). In contrast, the UK’s results highlight how policy instruments like subsidies and carbon pricing can buffer high CAPEX scenarios, enabling more ambitious infrastructure expansion and offshore integration. These outcomes align with the national UK Hydrogen Strategy, which advances a twin-track production model, a 5GW hydrogen target by 2030, and a £240 million Net Zero Hydrogen Fund to catalyze private sector investment and deployment (Department for Business, Energy & Industrial Strategy, 2021).
Machine learning techniques—especially Random Forest algorithms paired with SHAP value analysis—proved effective not only in enhancing prediction accuracy but also in revealing the relative influence of key input variables. Across both national models, electricity prices, capital expenditure (CAPEX), and system efficiency consistently surfaced as the most significant drivers of LCOH. Additionally, scenario-based assessments demonstrated that certain system configurations maintain economic viability even amid policy shifts or market volatility. These outcomes highlight the potential of ML-augmented cost models to inform both strategic investment and evidence-based policy development, especially when reinforced by Monte Carlo simulations for uncertainty quantification. This conclusion supports the work of Chen et al. (2023), who argue that machine learning enhances the assessment of green technology innovation by detecting meaningful, policy-relevant patterns in complex energy systems.
This study also extends the foundational work of Navarro Jiménez and Zheng (2024), who modeled hydrogen production costs in Costa Rica using Monte Carlo simulations. Their research provides valuable insights into spatial resource variability and local techno-economic performance but focuses solely on a single national context. By contrast, the current comparative framework incorporates both developed and emerging market perspectives and employs machine learning for cross-scenario cost forecasting and model explainability. This broader approach enhances the applicability of findings for a wider range of stakeholders, including investors and policymakers navigating heterogeneous policy and resource environments.
Moreover, the broader infrastructural and technological challenges emphasized in this research echo those identified by Jayachandran et al. (2024), who highlighted key barriers to green hydrogen adoption, including electrolyzer efficiency limitations, storage safety, and infrastructure immaturity. These systemic constraints underscore the importance of coupling advanced forecasting models with strategic infrastructure planning to bridge the gap between potential and implementation. The U.S. National Clean Hydrogen Strategy and Roadmap reinforces this by advocating co-located Regional Hydrogen Hubs and mobilizing over $9.5 billion in public funding—augmented by tax credits—to reduce delivered costs and strengthen clean energy supply chains (U.S. Department of Energy, 2023). Complementing this infrastructural focus, Mullanu et al. (2024) emphasize how AI—particularly machine learning—can address operational complexities in hydrogen-integrated systems, from supply-demand balancing to optimal energy flow coordination. Together, these perspectives highlight the need for holistic solutions that integrate planning, investment, and intelligent control systems to accelerate hydrogen deployment.
This discussion is further reinforced by the spatial modeling insights from Müller et al. (2023), who used a GIS-based least-cost optimization framework in Kenya to highlight the importance of aligning production, transport, and demand zones. Their work illustrates how geospatial planning—particularly in low- and middle-income countries—can minimize costs and maximize viability, a principle equally relevant to Costa Rica’s decentralized hydrogen strategy.
A notable opportunity emerging from this comparative framework lies in potential bilateral cooperation between Costa Rica and the UK. Their contrasting yet complementary profiles present a compelling case for collaboration in areas such as electrolyser technology transfer, machine learning applications in cost forecasting, and co-development of pilot projects. The UK’s experience with green financing instruments and regulatory standards could support Costa Rica’s hydrogen market maturity, while Costa Rica’s renewable expertise offers insights into sustainable, decentralized hydrogen systems. International partnerships—facilitated through institutions like GIZ, IADB, or the UK Infrastructure Bank—could enable blended financing models that support both technological deployment and social equity goals in emerging markets.
Finally, the study identifies critical areas for future research. These include the development of open, interoperable datasets for hydrogen cost modeling, greater integration of demand-side forecasting, and benchmarking of ML models across geographic and economic contexts. A compelling example of these priorities in action is Colombia’s hydrogen strategy, which combines solar, wind, and biomass pathways to project a production capacity of 9 Mt/a by 2050—surpassing internal demand and capturing 1.2% of global market potential through a combined investment of $244 billion (Rodríguez-Fontalvo et al., 2024). Like Costa Rica, Colombia leverages tropical resource abundance to position itself as a competitive green hydrogen exporter. In contrast, the UK’s trajectory emphasizes offshore integration, carbon pricing, and public-private financing to scale production. Together, these national strategies highlight the importance of aligning hydrogen deployment with geographic, economic, and infrastructural contexts. Such regionally tailored approaches will be essential to advancing reliable, equitable green hydrogen deployment on a global scale.
This study demonstrates the value of integrated techno-economic and ML-based approaches for advancing hydrogen strategies in both emerging and advanced economies.
7. Conclusions
This study offers a comparative, machine learning-driven modeling framework for assessing the techno-economic feasibility of green hydrogen production in Costa Rica and the United Kingdom. By leveraging regional renewable resource data, spatial analysis, and economic modeling integrated with machine learning tools like Random Forest and SHAP values, the research identifies key drivers influencing hydrogen costs across two distinct policy and infrastructure contexts. Costa Rica’s strength in renewable abundance contrasts with the UK’s policy maturity and industrial readiness, resulting in different investment risk profiles and cost sensitivities. The integration of Monte Carlo simulations further enriched the analysis by quantifying uncertainty in Net Present Value (NPV) and Levelized Cost of Hydrogen (LCOH) estimates under varied policy and market conditions.
The findings underscore the value of interpretable AI tools in de-risking hydrogen investments, especially in emerging markets. Importantly, the paper reveals how machine learning enhances not only forecast accuracy but also policy relevance through transparent model explainability. While national strategies such as Costa Rica’s Estrategia Nacional de Hidrógeno Verde and the UK Hydrogen Strategy lay foundational policy blueprints, this research bridges the gap between aspirational planning and cost-grounded implementation. The study also suggests pathways for international collaboration, including technology transfer, joint pilot programs, and blended finance models, which can accelerate hydrogen deployment while aligning with climate and development goals.
Future work should focus on refining regional datasets, expanding cross-country ML benchmarking, and integrating dynamic demand modeling. Doing so will further improve model generalizability and decision-making accuracy across global hydrogen markets. Ultimately, this research contributes to a growing body of evidence that supports green hydrogen as both a decarbonization tool and a vector for inclusive, resilient energy transitions worldwide.
Supplementary Materials
The following supporting information can be downloaded at the website of this paper posted on Preprints.org.
Author Contributions
Andrea Navarro Jiménez developed the research idea, designed the study, gathered and analyzed the data, and prepared the manuscript.
Funding
This study did not receive any particular funding from government, corporate, or charitable sources.
Institutional Review Board Statement
This study did not involve any research on human subjects, human data, human tissue, or animals. Therefore, no ethical approval was required.
Data Availability Statement
The dataset supporting the findings of this study is publicly available via Mendeley Data at: NAVARRO, ANDREA (2025), “Comparative Modeling of Green Hydrogen Development in Costa Rica and the UK: A Machine Learning-Driven Policy and Investment Forecasting Approach”, Mendeley Data, V1, doi: 10.17632/hw4g4xnd32.1.
Conflicts of Interest
The author confirms that no conflicts of interest are associated with the publication of this manuscript.
Declaration of Generative AI and AI-assisted Technologies in the Writing Process
During the preparation of this work, the author(s) used ChatGPT in order to improve grammar and readability.
References
- Ad Astra. (2018).Fase 3 hydrogen production project – Technical specifications and financial model . Available online: https://www.adastra.com/.
- Ad Astra. (2024).Costa Rica Hydrogen Transportation Ecosystem – Case Study Update . Available online: https://www.adastrarocket.com/cr/.
- Alcantara, M. L., Santana, J. C. C., Nascimento, C. A. O., & Ribeiro, C. O. (2025). Application of levelized and environmental cost accounting techniques to demonstrate the feasibility of green hydrogen-powered buses in Brazil. Hydrogen, 6(1), 10. [CrossRef]
- Aldren, C., Shah, N., & Hawkes, A. (2025). Quantifying key economic uncertainties in the cost of trading green hydrogen. Cell Reports Sustainability, 2, 100342. [CrossRef]
- Allal, Z., Noura, H. N., Salman, O., Vernier, F., & Chahine, K. (2025). A review on machine learning applications in hydrogen energy systems. International Journal of Thermofluids, 26, 101119. [CrossRef]
- Baral, S., & Šebo, J. (2024). Techno-economic assessment of green hydrogen production integrated with hybrid and organic Rankine cycle (ORC) systems. Heliyon, 10(2), e25742. [CrossRef]
- Bassey, K. E., & Ibegbulam, C. (2023). Machine learning for green hydrogen production. Computer Science & IT Research Journal, 4(3), 368–385. [CrossRef]
- bold>Bernat, R., Milewski, J., Dybinski, O., Martsinchyk, A., & Shuhayeu, P. (2024). Review of AEM electrolysis research from the perspective of developing a reliable model. Energies, 17(20), 5030. [CrossRef]
- Bird & Bird LLP, Allende & Brea, & Various Contributors. (2024). International Green Hydrogen Report 2024 . Available online: https://allende.com/en/.
- BLP Legal. (2024, November 18). Costa Rica: A strategic destination for green hydrogen development . Available online: https://blplegal.com/.
- Borm, O., & Harrison, S. B. (2021). Reliable off-grid power supply utilizing green hydrogen. Clean Energy, 5(3), 441–446. [CrossRef]
- Buchner, J., Menrad, K., & Decker, T. (2025). Public acceptance of green hydrogen production in Germany. Renewable and Sustainable Energy Reviews, 208, 115057. [CrossRef]
- Chen, W., Zou, W., Zhong, K., & Aliyeva, A. (2023). Machine learning assessment under the development of green technology innovation: A perspective of energy transition. Renewable Energy, 214, 65–73. [CrossRef]
- Department for Business and Trade (DBT). (2024). UK Infrastructure Bank: Financial support for hydrogen projects . Available online: https://www.gov.uk/government/publications/uk-infrastructure-bank-hydrogen-investment.
- Department for Business, Energy & Industrial Strategy. (2021).UK Hydrogen Strategy (CP 475). Her Majesty’s Stationery Office. Available online: https://www.gov.uk/government/publications/uk-hydrogen-strategy.
- Department for Energy Security and Net Zero (DESNZ). (2024a). Economic impact assessment for the hydrogen sector to 2030. UK Government. Available online: https://www.gov.uk/government/publications/economic-impact-assessment-for-the-hydrogen-sector-to-2030.
- Department for Energy Security and Net Zero (DESNZ). (2024b). Energy Trends December 2024 – Statistical release. UK Government. Available online: https://www.gov.uk/government/collections/energy-trends.
- Department for Energy Security and Net Zero (DESNZ). (2024c). Hydrogen Net Zero Investment Roadmap: Leading the way to net zero . Available online: https://www.gov.uk/government/publications/hydrogen-strategy.
- Deloitte. (2023).Green hydrogen: Energizing the path to net zero. Deloitte Economics Institute. Available online: https://www.deloitte.com/global/en/issues/climate/green-hydrogen.html.
- Dorn, F. M. (2022). Green colonialism in Latin America? Towards a new research agenda for the global energy transition. European Review of Latin American and Caribbean Studies, 114, 137–146.
- Gischler, C., Daza, E., Galeano, P., Ramirez, M., Gonzalez, J., Cubillos, F., Hartmann, N., Pradelli, V., Márquez, J. S., Gutiérrez, J. A., Juarez Hermosillo, J. G., Alonso Rodriguez, C., Souilla, L., & Rabinovich, J. (2023). Green hydrogen in Latin America and the Caribbean: Towards a just and sustainable energy transition. Inter-American Development Bank. Available online: https://publications.iadb.org/en.
- GIZ. (2025, March 25).Costa Rica – Green hydrogen. Mitigation Action Facility. Available online: https://mitigation-action.org/.
- Hydrogen Council & McKinsey & Company. (2021). Hydrogen for net-zero: A critical cost-competitive energy vector. Hydrogen Council. Available online: https://www.hydrogencouncil.com/en/hydrogen-for-net-zero/.
- Hydrogen Optimized. (2025).Clean hydrogen at scale . Available online: https://www.hydrogenoptimized.com/.
- International Energy Agency. (2024).Global Hydrogen Review 2024. International Energy Agency. Available online: https://www.iea.org/reports/global-hydrogen-review-2024.
- International Renewable Energy Agency (IRENA). (2021).Making the breakthrough: Green hydrogen policies and technology costs. IRENA. Available online: https://www.irena.org/publications.
- International Renewable Energy Agency (IRENA). (2024).Costa Rica country profile 2024. IRENA. Available online: https://www.irena.org.
- Javanshir, N., Pekkinen, S., Santasalo-Aarnio, A., & Syri, S. (2024). Green hydrogen and wind synergy: Assessing economic benefits and optimal operational strategies. International Journal of Hydrogen Energy, 83, 811-825. [CrossRef]
- Kabir, M. M., Roy, S. K., Alam, F., Nam, S. Y., Im, K. S., Tijing, L., & Shon, H. K. (2023).Machine learning-based prediction and optimization of green hydrogen production technologies from water industries for a circular economy. Desalination. Advance online publication. [CrossRef]
- Kim, J., Rweyemamu, M., & Purevsuren, B. (2022). Machine learning-based approach for hydrogen economic evaluation of small modular reactors. Science and Technology of Nuclear Installations, 2022, Article ID 9297122. [CrossRef]
- Kwon, H., Park, J., Shin, J. E., & Koo, B. (2024). Optimal investment strategy analysis of on-site hydrogen production based on the hydrogen demand prediction using machine learning. International Journal of Energy Research, 2024, Article ID 6313421. [CrossRef]
- Jayachandran, M., Gatla, R. K., Flah, A., Milyani, A. H., Milyani, H. M., Blazek, V., Prokop, L., & Kraiém, H. (2024). Challenges and opportunities in green hydrogen adoption for decarbonizing hard-to-abate industries: A comprehensive review. IEEE Access, 12, 23363–23379. [CrossRef]
- Lebepe, M. C., Oviroh, P. O., & Jen, T.-C. (2025). Techno-economic optimisation modelling of a solar-powered hydrogen production system for green hydrogen generation. Sustainable Energy Research, 12(11). [CrossRef]
- Matute, G., Yusta, J. M., & Naval, N. (2023a). Techno-economic model and feasibility assessment of green hydrogen projects based on electrolysis supplied by photovoltaic PPAs. International Journal of Hydrogen Energy, 48(20), 5053–5068. [CrossRef]
- Matute, M., Velasquez-Jaramillo, M., Gallego, C. A., Pérez, J. M., & Matute, P. (2023b). Techno-economic assessment of green hydrogen production from renewable sources: A case study. International Journal of Hydrogen Energy, 48, 5053–5068. [CrossRef]
- Ministerio de Ambiente y Energía (MINAE). (2019). Plan Nacional de Descarbonización 2018–2050 . Available online: https://wateractionhub.org/.
- MINAE. (2022).Estrategia Nacional de Hidrógeno Verde de Costa Rica 2022–2050. Gobierno de Costa Rica. Available online: http://10.1.0.234:8080/handle/123456789/720.
- Mukelabai, M. D., Barbour, E. R., & Blanchard, R. E. (2024). Modeling and optimization of renewable hydrogen systems: A systematic methodological review and machine learning integration. Energy and AI, 18, 100455. [CrossRef]
- Mullanu, S., Chua, C., Molnar, A., & Yavari, A. (2024). Artificial intelligence for hydrogen-enabled integrated energy systems: A systematic review. International Journal of Hydrogen Energy . [CrossRef]
- Müller, L. A., Leonard, A., Trotter, P. A., & Hirmer, S. (2023). Green hydrogen production and use in low- and middle-income countries: A least-cost geospatial modelling approach applied to Kenya. Applied Energy, 343, 121219. [CrossRef]
- Naqvi, S. R., Kazmi, B., Taqvi, S. A. A., Chen, W.-H., & Juchelková, D. (2024). Techno-economic analysis for advanced methods of green hydrogen production. Current Opinion in Green and Sustainable Chemistry, 48, 100939. [CrossRef]
- Navarro Jiménez, A., & Zheng, H. (2024). Fueling Costa Rica’s green hydrogen future: A financial roadmap for global leadership. Renewable Energy Focus, 51, 100651. [CrossRef]
- National Engineering Policy Centre. (2022).The role of hydrogen in a net zero energy system. Royal Academy of Engineering. Available online: https://raeng.org.uk.
- NewClimate Institute. (2023).The role of green hydrogen in a just, Paris-compatible transition . Available online: https://newclimate.org/resources/publications/the-role-of-green-hydrogen-in-a-just-paris-compatible-transition.
- Norman, E. A., Maestre, V. M., Ortiz, A., & Ortiz, I. (2024). Steam electrolysis for green hydrogen generation. State of the art and research perspective. Renewable and Sustainable Energy Reviews, 202, 114725. [CrossRef]
- El-Shafie, M. (2023). Hydrogen production by water electrolysis technologies: A review. Results in Engineering, 20, 101426. [CrossRef]
- Pinheiro, F. P., Gomes, D. M., Tofoli, F. L., Sampaio, R. F., Melo, L. S., Gregory, R. C. F., Sgrò, D., & Leão, R. P. S. (2024). Techno-economic analysis of green hydrogen generation from combined wind and photovoltaic systems based on hourly temporal correlation. International Journal of Hydrogen Energy, 97(1), 690–707. [CrossRef]
- Pradhan, B. B., Limmeechokchai, B., Chaichaloempreecha, A., & Rajbhandari, S. (2024). Role of green hydrogen in the decarbonization of the energy system in Thailand. Energy Strategy Reviews, 51, 101311. [CrossRef]
- Prasetyo, S. D., Trisnoaji, Y., Arifin, Z., & Mahadi, A. A. (2025). Harnessing unconventional resources for large-scale green hydrogen production: An economic and technological analysis in Indonesia. Unconventional Resources, 6, 100174. [CrossRef]
- Rezaei, M., Akimov, A., & Gray, E. M. (2024). Cost-competitiveness of green hydrogen and its sensitivity to major financial and technical variables. International Journal of Hydrogen Energy, 90, 1365–1377. [CrossRef]
- Rodríguez-Fontalvo, D., Quiroga, E., Cantillo, N. M., Sánchez, N., Figueredo, M., & Cobo, M. (2024). Green hydrogen potential in tropical countries: The Colombian case. International Journal of Hydrogen Energy, 54(2024), 344–360. [CrossRef]
- Sareen, K., Panigrahi, B. K., Shikhola, T., & Nagdeve, R. (2023). Deep learning solar forecasting for green hydrogen production in India: A case study. International Journal of Hydrogen Energy, 48(8), 3300–3312. [CrossRef]
- Stamm, A., Kantel, A., Sagner, L., Dütschke, E., Scherrer, A., Boie, I., Müller, V., et al. (2024).Towards a green H₂ economy: Costa Rica country report (HYPAT Working Paper 02/2024). Fraunhofer ISI. Available online: https://hypat.de/hypat-en/.
- Statista. (2025).Global average wholesale electricity prices (USD/MWh) . Available online: https://www.statista.com/.
- Taghizadeh-Hesary, F., Li, Y., Rasoulinezhad, E., Mortha, A., Long, Y., Lan, Y., Zhang, Z., Li, N., Zhao, X., & Wang, Y. (2022). Green finance and the economic feasibility of hydrogen projects. International Journal of Hydrogen Energy, 47(24), 24511–24522. [CrossRef]
- Tarvydas, D. (2022).The role of hydrogen in energy decarbonisation scenarios: Views on 2030 and 2050 (EUR 31358 EN). Joint Research Centre, European Commission. [CrossRef]
- Tatarenko, O., Janzow, N., & Essa, E. (2024).Weak emissions accounting can undermine hydrogen’s role in global decarbonization. Green Hydrogen Catapult / RMI. Available online: https://greenh2catapult.com/weak-emissions-accounting-can-undermine-hydrogens-role-global-decarbonization.
- Tico Times. (2024, May 28).Brace for impact: Costa Rica’s electricity rates to soar by up to 26.6% . Available online: https://ticotimes.net/2024/05/28/brace-for-impact-costa-ricas-electricity-rates-to-soar-by-up-to-26-6.
- Torma, A., Németh, P., & Mendoza, S. P. M. (2024). Comparison of hydrogen related policies and achievements between Latin America and Europe. Chemical Engineering Transactions, 114, 991–996. [CrossRef]
- UK Government. (2021).UK Hydrogen Strategy (CP 475). Department for Business, Energy & Industrial Strategy. Available online: https://www.gov.uk/government/publications/uk-hydrogen-strategy.
- Ukwuoma, C. C., Cai, D., Jonathan, A. L., Chen, N., Sey, C., Ntia, N. W., Bamisile, O., & Huang, Q. (2024). Enhancing hydrogen production prediction from biomass gasification via data augmentation and explainable AI: A comparative analysis. International Journal of Hydrogen Energy, 68, 755–776. [CrossRef]
- U.S. Department of Energy. (2023).U.S. National Clean Hydrogen Strategy and Roadmap . Available online: https://www.hydrogen.energy.gov/pdfs/clean-hydrogen-strategy-roadmap.pdf.
- Yang, Q., Zhao, L., Xiao, J., Wen, R., Zhang, F., & Zhang, D. (2025). Machine learning-assisted prediction and optimization of solid oxide electrolysis cell for green hydrogen production. Green Chemical Engineering, 6, 154–168. [CrossRef]
Figure 1.
Wind and Solar Maps of Costa Rica. Caption: This figure illustrates the spatial distribution of wind speed (panel a) and solar irradiance (GHI) (panel b) across Costa Rica. Panel (a) shows wind speeds ranging from 2–12 m/s, with Guanacaste exhibiting the strongest values. Panel (b) presents solar irradiance from 1200–2200 kWh/m²/day, again with Guanacaste recording the highest GHI. Both maps include provincial boundaries to support geographical context and aid in identifying priority areas for renewable energy development.
Figure 2.
Solar Potential (GHI) for England, Wales, Scotland, and Northern Ireland. Caption: This figure displays the Global Horizontal Irradiance (GHI) for four regions of the United Kingdom: England, Wales, Scotland, and Northern Ireland. Each region’s solar potential is shown in a separate subplot, labeled (a) for England, (b) for Wales, (c) for Scotland, and (d) for Northern Ireland, with individual colorbars representing the average daily solar irradiance (kWh/m²/day). The plasma colormap is used to visualize varying levels of solar energy intensity, with brighter regions indicating higher irradiance levels. These maps provide valuable insights for assessing the regional solar potential essential for renewable energy planning.
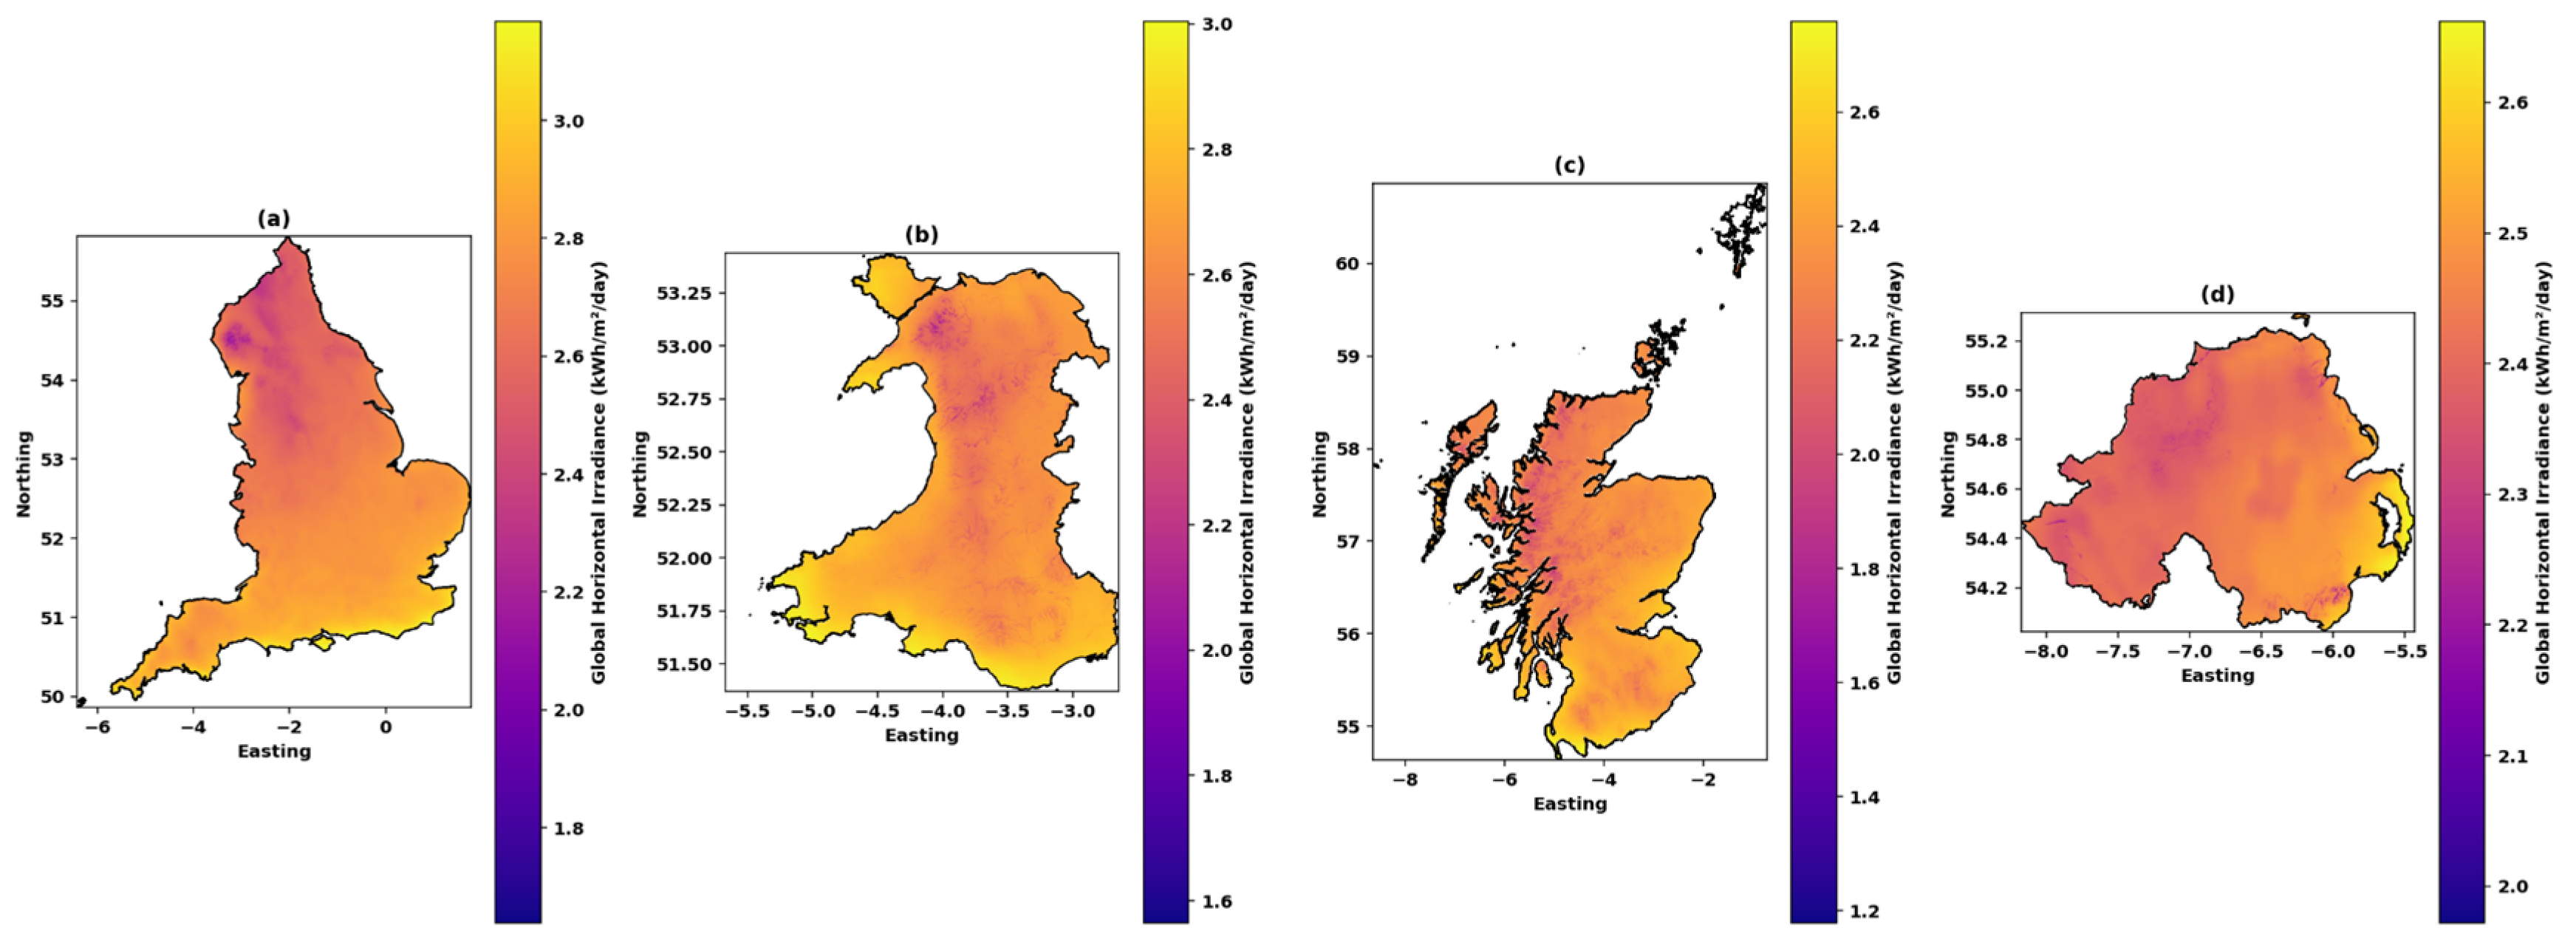
Figure 3.
Wind Speed (100m Height) for England, Wales, Scotland, and Northern Ireland. Caption: Figure 3 presents the wind speed data at 100 meters height across England, Wales, Scotland, and Northern Ireland. Each subplot, labeled (a) for England, (b) for Wales, (c) for Scotland, and (d) for Northern Ireland, shows the wind speed distribution with individual colorbars. The viridis colormap is used to visualize wind speed variations, where brighter areas indicate stronger wind speeds. These maps are essential for evaluating the feasibility of onshore wind energy generation, highlighting regions with higher wind potential.
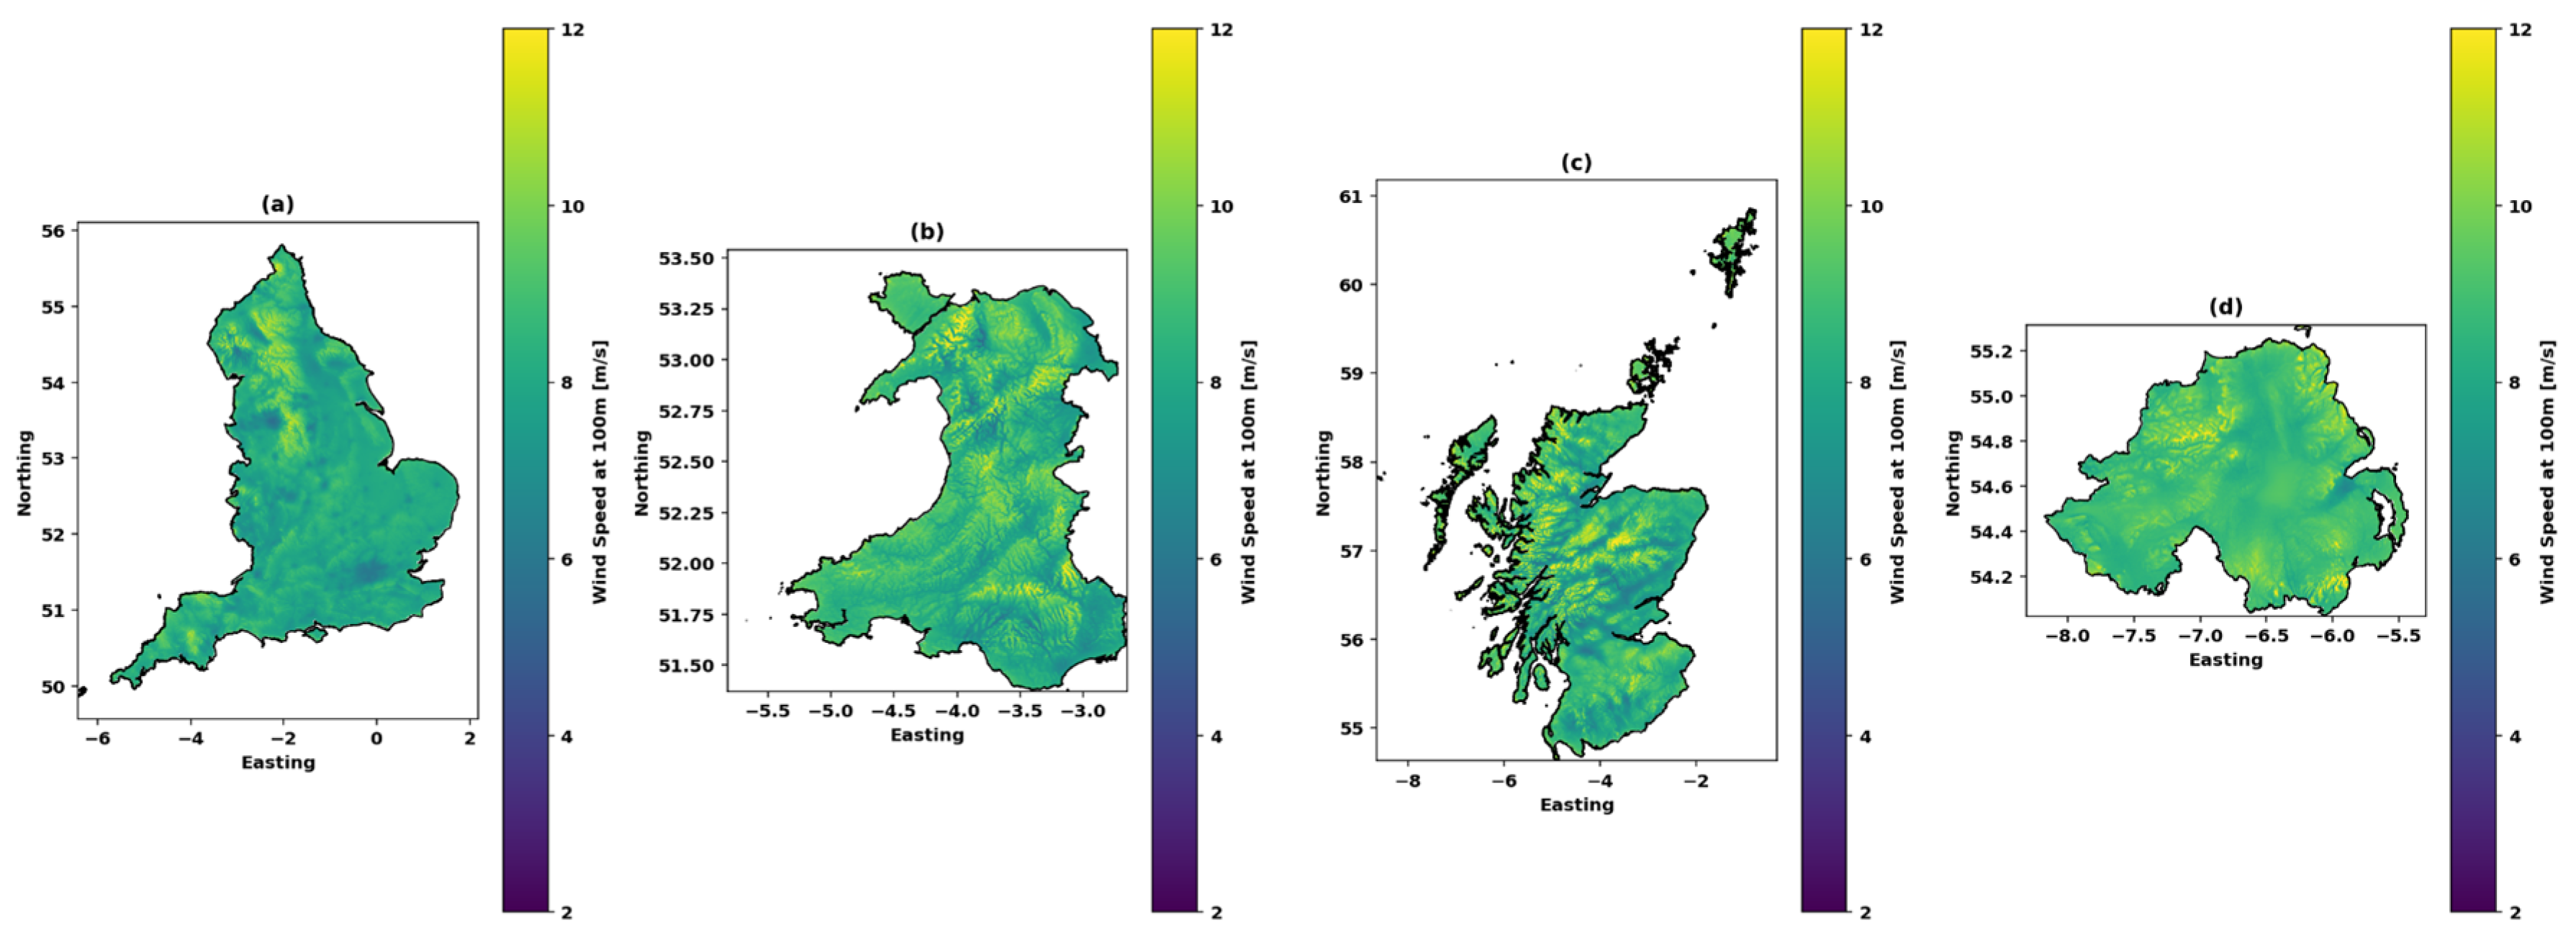
Figure 4.
LCOH Comparison for Costa Rica and the United Kingdom. Caption: Figure 4 presents the Levelized Cost of Hydrogen (LCOH) for various regions in Costa Rica and the United Kingdom. Panel (a) shows the LCOH for Costa Rica, where regions like Guanacaste and Puntarenas exhibit the lowest costs, while panel (b) displays the LCOH for the United Kingdom, with Northern Ireland showing the most favorable economics. The color scale reflects the variations in LCOH across both countries, with brighter colors indicating higher costs. These results provide insight into regional cost differences for hydrogen production, valuable for investment and policy decisions in green hydrogen development.

Figure 5.
Net Present Value (NPV) Comparison between Costa Rica and the United Kingdom. Caption: This heatmap compares the Net Present Value (NPV) of hydrogen production for Costa Rica and the United Kingdom using a consistent economic model. The visualization applies the Viridis colormap, where color intensity reflects the magnitude of the NPV for each country. Costa Rica displays a more intense color, corresponding to its higher NPV ($4.76M), while the United Kingdom appears with a less intense tone, aligned with its lower NPV ($3.20M). The accompanying colorbar contextualizes the differences in value intensity across the two nations.
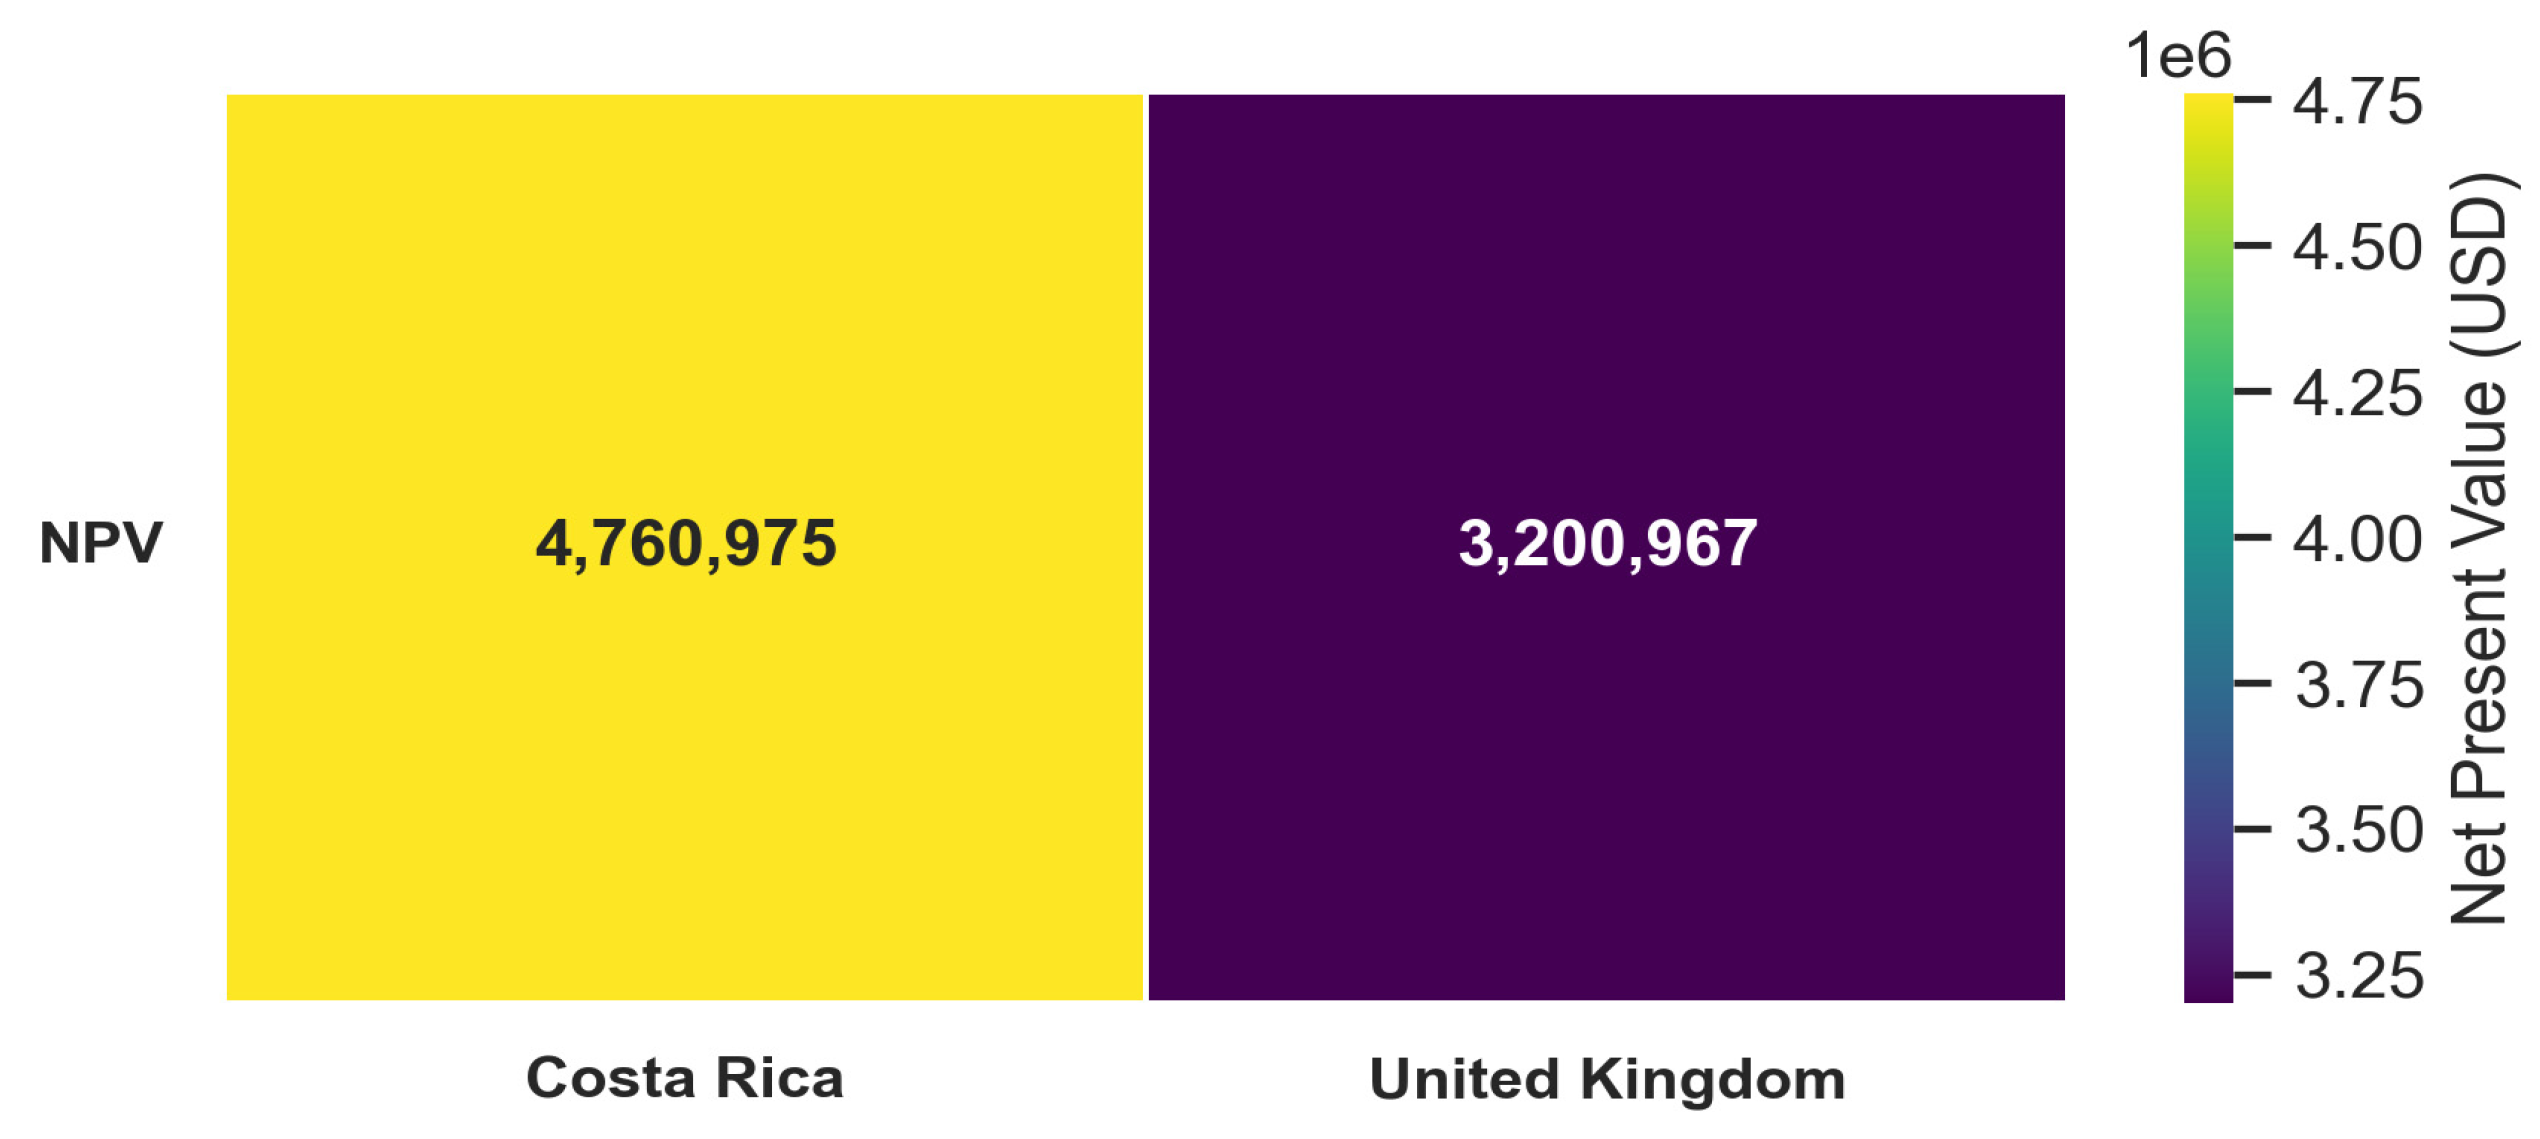
Figure 6.
Machine Learning Error Metrics Comparison for Costa Rica and the United Kingdom. Caption: This figure compares the performance of machine learning models used to predict the Levelized Cost of Hydrogen (LCOH) in Costa Rica and the United Kingdom, using three key error metrics: (a) Mean Absolute Error (MAE), (b) Mean Squared Error (MSE), and (c) Cross-Validated MSE. Each subplot uses an independent Viridis colormap to visualize the magnitude of errors, with higher color intensity indicating greater error values. The Costa Rican model demonstrates lower errors across all metrics, suggesting better fit and lower variability, though its R² score is undefined due to a limited test sample. In contrast, the UK model, while achieving high R², exhibits higher error values, particularly in cross-validation, indicating more variability in prediction performance.
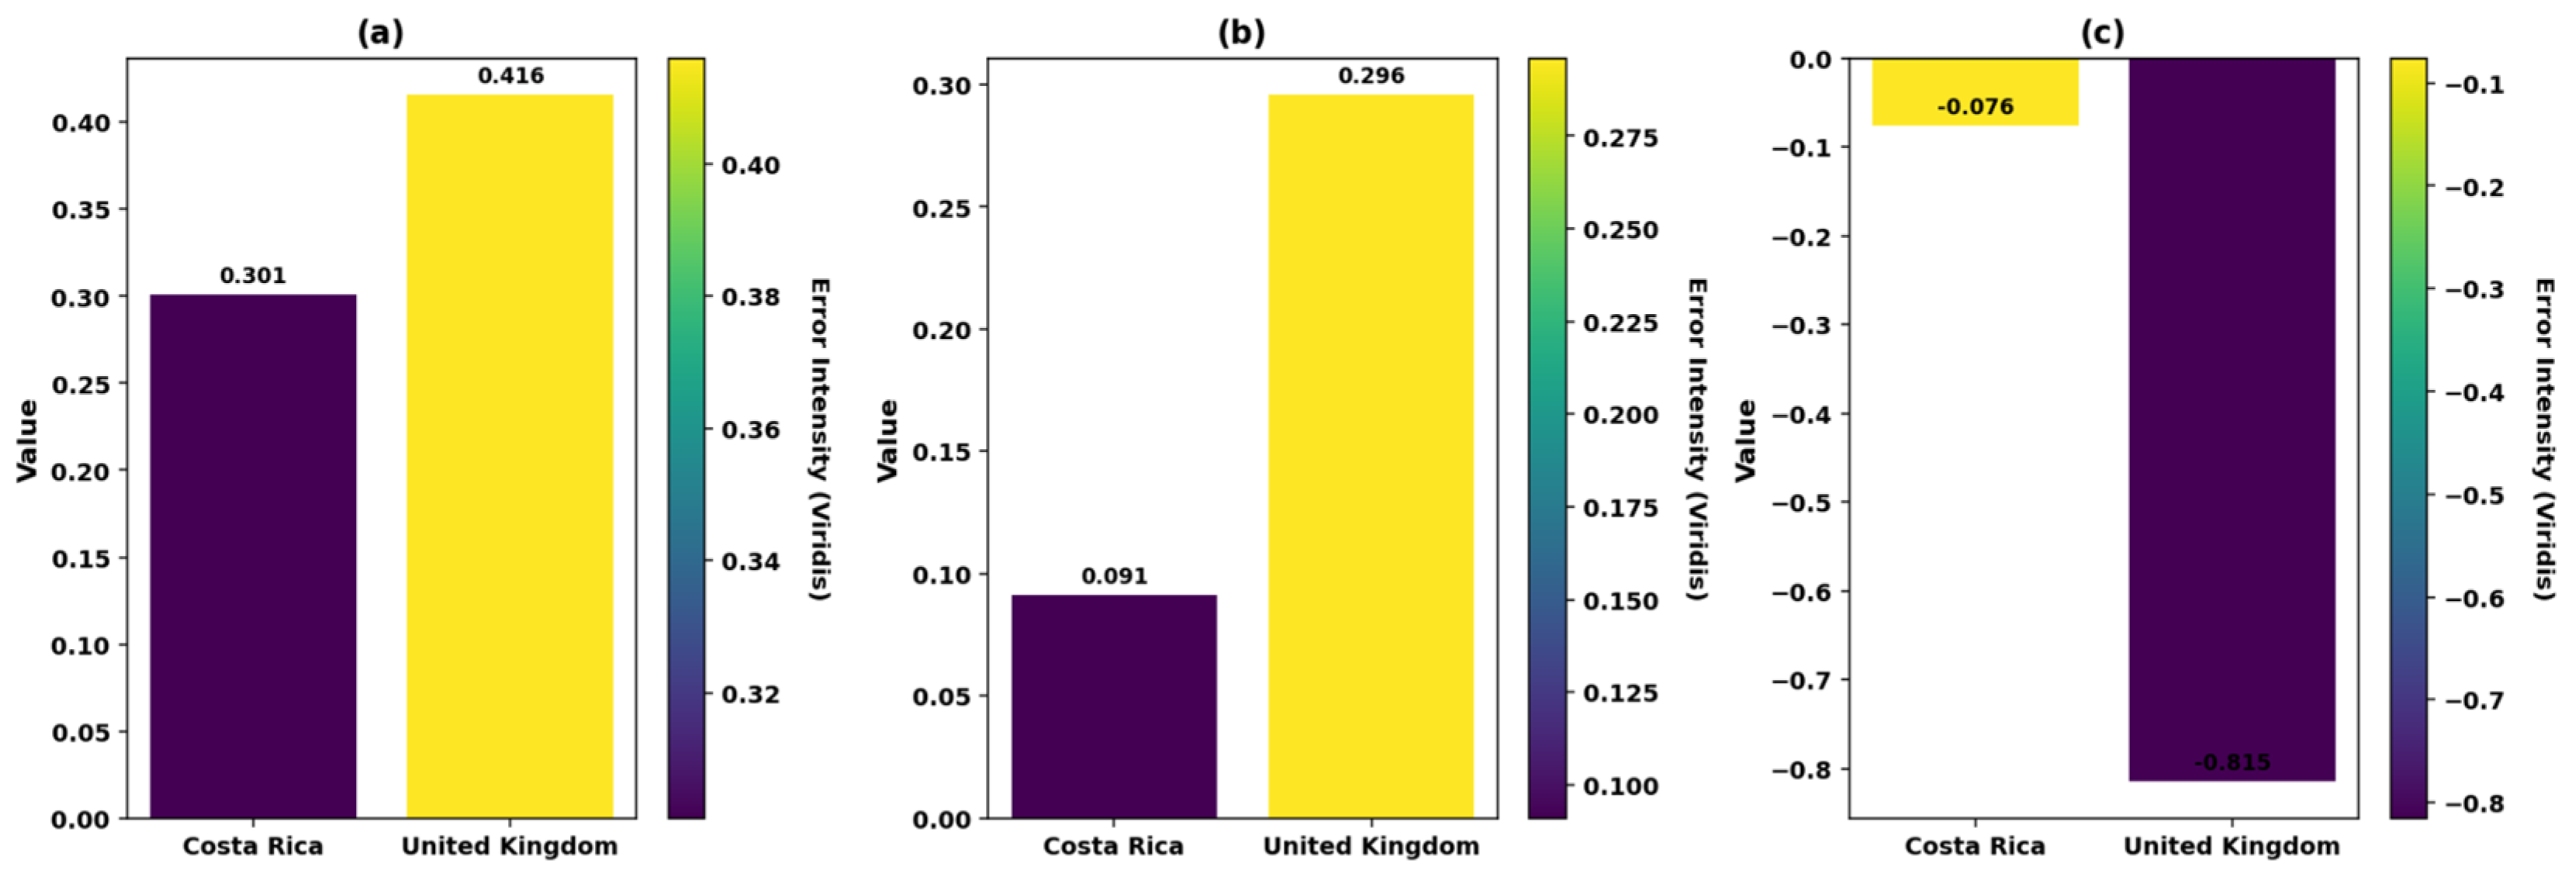
Figure 7.
Sensitivity Analysis of LCOH and NPV for Costa Rica and the United Kingdom. Caption: Figure 7 presents a comparative sensitivity analysis of the Levelized Cost of Hydrogen (LCOH) and Net Present Value (NPV) for Costa Rica and the United Kingdom. Panels (a) and (b) show the sensitivity of LCOH and NPV to variations in CAPEX and electricity price for Costa Rica, while panels (c) and (d) present the corresponding analysis for the United Kingdom. The contour plots use color gradients to represent economic performance, with contour lines highlighting zones of equal values for easier interpretation. Costa Rica demonstrates a broader low-LCOH region and higher NPV resilience compared to the UK, indicating its greater economic advantage under fluctuating cost conditions. These visualizations offer valuable insights into investment robustness and help identify favorable techno-economic configurations in both countries.
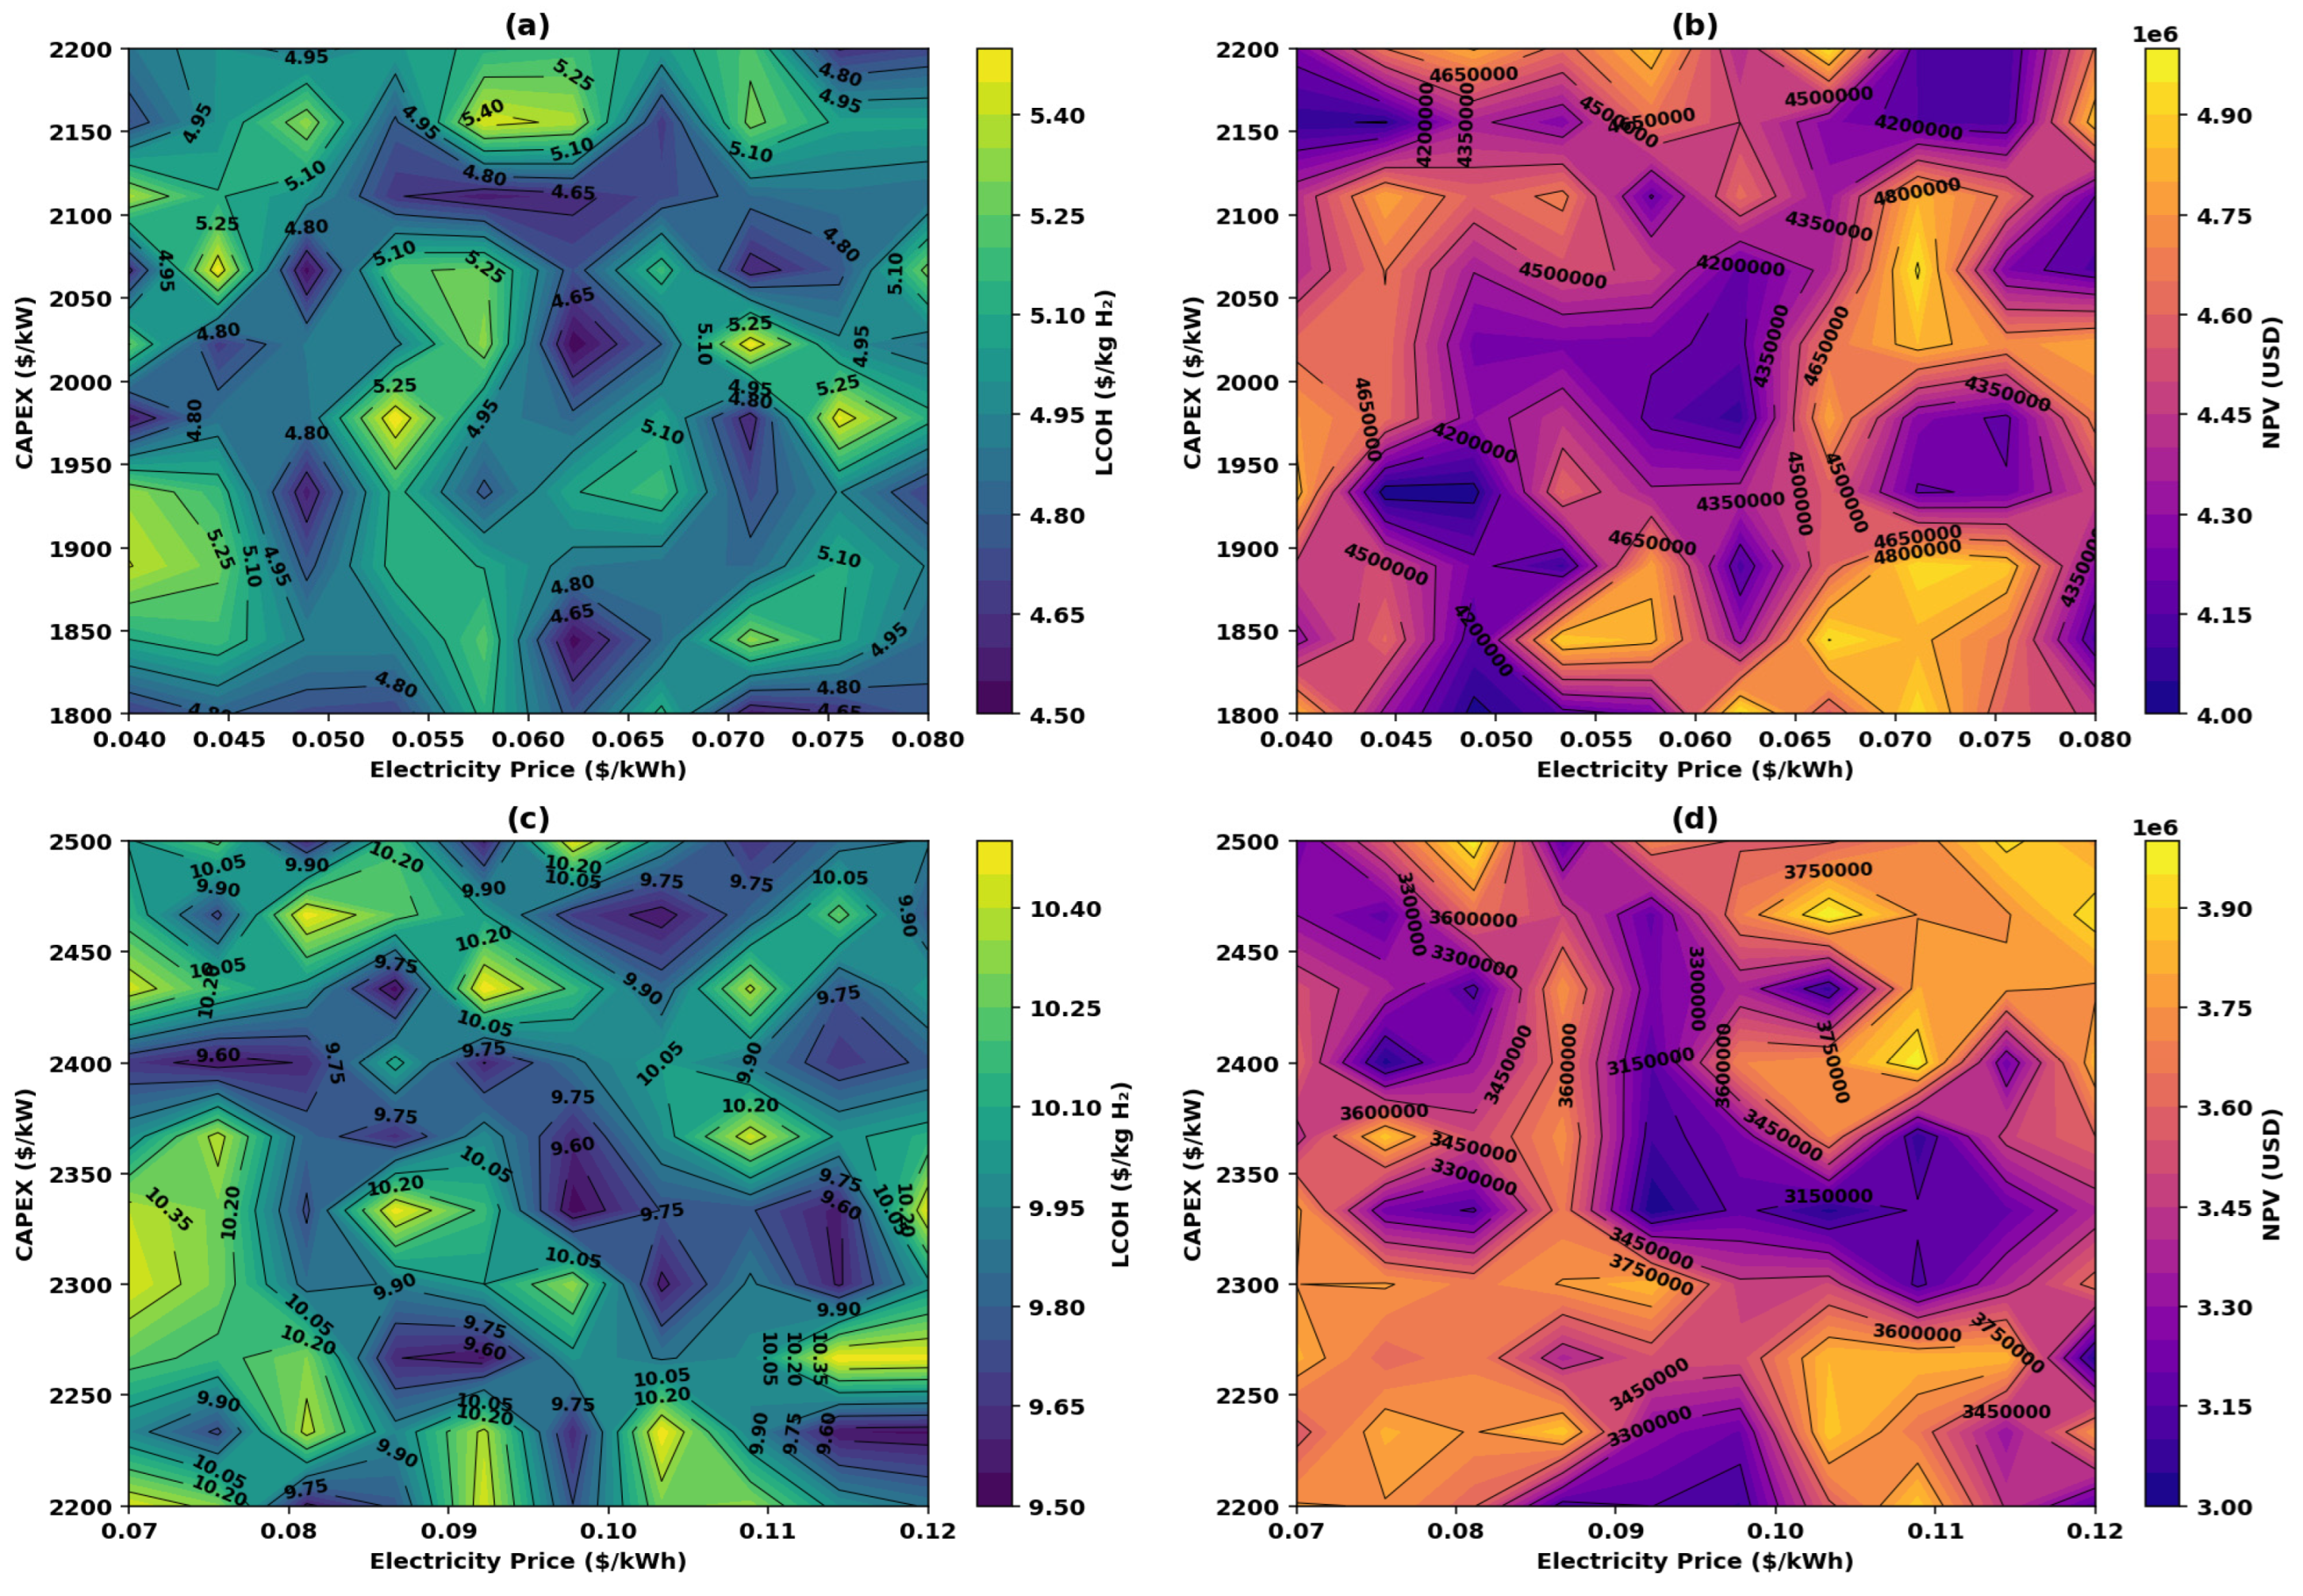

Table 1.
Economic Comparison of Hydrogen Production Systems.
| Electrolyzer Technology | Renewable Energy Source | Region | LCOH (USD/kg) | Key Findings | Reference |
|---|---|---|---|---|---|
| AWE | Onshore Wind | Uribia, Colombia | 7.00 | Lowest LCOH using AWE with onshore wind. Offshore wind has higher LCOH. | Velasquez-Jaramillo, García, & Vasco-Echeverri (2024) |
| AWE | Solar PV | Spain | 3.21 - 4.10 | LCOH varies significantly based on PPA pricing and policy support. | Matute et al. (2023b) |
| PEM | Biomass Gasification | - | 2.94 - 3.32 | PEM electrolysis efficiency improves with better system design. | Naqvi et al. (2024) |
| AWE, PEM | Wind + Solar PV | Brazil | 5.29 (AWE), 5.92 (PEM) | Hybrid renewable system offers significant LCOH reduction potential. | Pinheiro et al. (2024) |
| PEM | Solar | - | 2.0 - 3.0 | Sensitivity to financial and technical variables; higher CAPEX leads to higher LCOH. | Rezaei, Akimov, & Gray (2024) |
| PEM | Wind | Finland | $1.08/kg | Wind integration reduces LCOH under high-price market conditions. | Javanshir et al. (2024) |
| Hybrid (Solar PV, Wind, ORC) | Solar, Wind, Geothermal | - | $3.1/kg | Hybrid renewable systems yield the lowest LCOH; ORC improves efficiency. | Baral & Šebo (2024) |
Table 2.
UK Hydrogen LCOH Modeling Inputs.
| Category | Variable | Value/Description | Notes | Reference |
|---|---|---|---|---|
| CAPEX | Electrolyzer Cost | $2,990/kW | For multi-MW scale systems | EHO, 2025 |
| Electricity Price | Avg Wholesale Electricity Price | $93.83/MWh | Conversion of €86.88 to USD (1 GBP = 1.29 USD) | Statista, 2025 |
| Operating Hours | Operating Hours per Year | 4,000 hours | Based on cost-optimal window selection | EHO, 2025 |
| Cost of Capital | Capital Recovery Factor (CRF) | 6% | Used in NPV/LCOH projections | EHO, 2025 |
| OPEX (Fixed) | Other OPEX | $0.02 per kg H₂ | Includes maintenance, stack replacement | EHO, 2025 |
| Stack Degradation | Stack Performance Decline | 0.0012 (1.2‰/h) | Impacts performance decline over time | EHO, 2025 |
| Stack Durability | Lifetime of Electrolyzer Stack | 80,000 hours | Lifetime of stack under nominal conditions | EHO, 2025 |
| Grid Fees and Taxes | Grid Fees and Taxes | ~€100M (raw total) ($108 million) | Included only when grid-connected (e.g., offshore wind) | EHO, 2025 |
| Investment Strategy | Public-private investment framework | Blended finance, PPPs, and £960M ($1.238 billion USD) Green Industries Growth Accelerator (GIGA) fund | UK DESNZ, 2024 | UK DESNZ, 2024 |
| Funding Volume | Green Hydrogen Project Budget | £960 million ($1,238.4 million) (GIGA Fund) + private capital (£400M ($516 million) in HAR1) | UK DESNZ, 2024 | UK DESNZ, 2024 |
| Project Duration | Green Hydrogen Project | 2024–2030 | UK DESNZ, 2024 | UK DESNZ, 2024 |
| Funding Mechanism | Government support schemes | Net Zero Hydrogen Fund, Hydrogen Allocation Rounds (HAR1, HAR2), R&D tax reliefs | UK DESNZ, 2024 | UK DESNZ, 2024 |
| Climate Impact | CO₂ mitigation (project/lifetime) | 70,000+ tCO₂e (project); 650,000 tCO₂e (lifetime potential) | UK DESNZ, 2024 | UK DESNZ, 2024 |
| Private Sector Investment | Private financial capacity | £18 billion ($23.22 billion USD) from UK Infrastructure Bank (UKIB) for hydrogen, CCUS, storage projects | UK DESNZ, 2024 | UK DESNZ, 2024 |
Table 3.
Costa Rica Hydrogen Cost Modeling Inputs.
| Category | Variable | Value/Description | Notes | Reference |
|---|---|---|---|---|
| CAPEX | Initial Investment (Fase 3) | $2,000,000 | 3 MWe system, 300 kg H₂/day | Ad Astra, 2018 |
| OPEX | Water Cost | $2.88/m³ | Industrial rate | Ad Astra, 2018 |
| OPEX | Electricity Cost | $0.15/kWh | Industrial rate, off-peak rate | (Tico Times, 2024) |
| Revenue | H₂ Selling Price | $3.50/kg H₂ | Projected price for viability | Ad Astra, 2018 |
| Revenue | O₂ Selling Price | $5.01/kg O₂ | 220 cf tank = ¢26,000 CRC | Ad Astra, 2018 |
| Output | H₂ Daily Production | 300 kg/day | Fase 3 projection | Ad Astra, 2018 |
| System Scale | Electrolyzer Capacity | 3 MWe | Includes compression and storage | Ad Astra, 2018 |
| Efficiency | Electrolyzer System (WtT) | 70 kWh/kg H₂ | Based on continuous operation | Ad Astra, 2018 |
| Efficiency | Bus Fuel Efficiency (WtW) | 8.86 km/kg H₂ | Operational demonstration | Ad Astra, 2018 |
| Projected Return | Internal Rate of Return (IRR) | 3.7% | 5-year payback | Ad Astra, 2018 |
| Projected Return | Net Present Value (NPV) | ~ $500 USD | Marginal without support | Ad Astra, 2018 |
| Financing | Interest Rate | 5% | 20-year assumed term | Ad Astra, 2018 |
| Investment Strategy | Public-private investment framework | Blended finance, PPPs, international donors | MINAE, 2019 | GIZ, 2025 |
| Funding Volume | Green Hydrogen Project Budget | EUR 25 million | GIZ, IFC, MINAE, SEPSE, Hidrógeno Verde S.A. | GIZ, 2025 |
| Project Duration | Green Hydrogen Project | 2024–2030 | GIZ, 2025 | GIZ, 2025 |
| Climate Impact | Direct CO₂ mitigation (project/lifetime) | 70,303 tCO₂e (project); 650,000+ tCO₂e (lifetime tech potential) | GIZ, 2025 | GIZ, 2025 |
| Fiscal Incentives | Free Trade Zone Regime | Up to 15 years income tax exemption + VAT/import duty/municipal tax exemptions | BLP Legal, 2024 | BLP Legal, 2024 |
Table 4.
Key Quantitative Data for UK Hydrogen Production, Pricing, and Financial Modeling.
| Data Type | Value or Range | Reference |
|---|---|---|
| Hydrogen Price Range | £112/MWh ($144.48/MWh) (2025) to £71/MWh ($91.59/MWh) (2050) | UK Hydrogen Strategy, 2021 |
| Electrolyzer Efficiency Loss | 0% to 2% | UK Hydrogen Strategy, 2021 |
| Electricity Price Simulation | £0.04 ($0.0516/kWh) to £0.06 ($0.0774/kWh) per kWh | UK Hydrogen Strategy, 2021 |
| CAPEX Reduction | 15% (due to fiscal incentives) | UK Hydrogen Strategy, 2021 |
| Monte Carlo Simulation NPV | 1,000 simulations with varying inputs | UK Hydrogen Strategy, 2021 |
| Revenue Simulation Range | $3.00 to $4.00 per kg of H2 | UK Hydrogen Strategy, 2021 |
Table 5.
Key Quantitative Data for Costa Rica Hydrogen Production, Pricing, and Financial Modeling.
| Category | Variable | Value/Description | Reference |
|---|---|---|---|
| Fiscal Incentives | Adjusted CAPEX (due to incentives) | 15% reduction in CAPEX | MINAE, 2025 |
| Revenue | H₂ Price Simulation | Between $3.00 to $4.00 per kg H₂ | MINAE, 2022 |
| Electricity Price | Electricity Cost Simulation | Between $0.04 to $0.06 per kWh | MINAE, 2022 |
| Electrolyzer Efficiency Loss | Efficiency Decline Over Time | Efficiency degradation over 20 years | Hydrogen Optimized, 2025 |
| NPV Simulation | Monte Carlo Simulation | Simulated over 1000 runs with varying hydrogen and electricity prices | Custom Simulation |
Disclaimer/Publisher’s Note: The statements, opinions and data contained in all publications are solely those of the individual author(s) and contributor(s) and not of MDPI and/or the editor(s). MDPI and/or the editor(s) disclaim responsibility for any injury to people or property resulting from any ideas, methods, instructions or products referred to in the content. |
© 2025 by the author. Licensee MDPI, Basel, Switzerland. This article is an open access article distributed under the terms and conditions of the Creative Commons Attribution (CC BY) license (https://creativecommons.org/licenses/by/4.0/).
Copyright: This open access article is published under a Creative Commons CC BY 4.0 license, which permit the free download, distribution, and reuse, provided that the author and preprint are cited in any reuse.


