
Submitted:
28 March 2025
Posted:
31 March 2025
You are already at the latest version
Abstract
Water resource management is crucial for sustainable agricultural and ecological development, particularly in regions with complex land use patterns and sensitive eco-systems. The Bashang region of Zhangjiakou city, located in the agropastoral ecotone of northern China, is an ecologically fragile area undergoing significant land use and climate changes. Despite the importance of understanding the interplay between land use, climate change, and water conservation, few studies have comprehensively evaluated their combined effects on regional water resources. This study addresses this gap by investigating the spatiotemporal changes in water yield (WY) and water conservation capacity (WCC) under different land use and climate scenarios for the year 2035. The research employs the FLUS model to predict future land use and the InVEST model to estimate WY and WCC under Natural Development Scenario (NDS), Agricultural Production Scenario (APS), Ecological protection Scenario (EPS) and Land Planning Scenario (LPS). The results reveal that WCC is primarily influenced by precipitation, land use, and topography. The study finds that scenarios focusing on ecological protection and land use optimization, such as the EPS and LPS, significantly enhance water conservation capacity. Notably, the LPS scenario, which limits urban expansion and increases ecological land, provides the best balance between water yield and conservation. The findings highlight the need for integrated approaches to land use and water resource management, particularly in agro-pastoral transitional zones. The unique contribution of this research lies in its comprehensive modeling approach, combining land use, climate data, and water resource analysis, which provides valuable insights for sustainable land and water management strategies.
Keywords:
water conservation capacity (WCC)
; land use change scenarios
; water yield (WY)
; sustainable agricultural development
; irrigated land
1. Introduction
Water scarcity has emerged as a major global challenge, profoundly impacting ecosystems, agricultural productivity, and development in society and the economy [1]. As population growth and the demand for freshwater escalate, the consequences of water scarcity become increasingly pervasive, manifesting in various forms, such as diminished agricultural yields and intensified competition for limited resources [2,3]. Land use changes have a profound impact on the spatiotemporal development of water source conservation, directly influencing processes such as water storage, infiltration, evaporation, and replenishment, thereby altering the hydrological cycle and water resource availability [4]. Changes in land use—especially the growth of agricultural zones, urban development, and the rising designation of land for industrial use—are driving a growing disparity between water supply and demand, leading to intricate and shifting patterns in the distribution and use of water resources [5,6,7].This problem is especially pronounced in agro-pastoral ecotone, where land use exhibits obvious transitional and fluctuating characteristics and water resource constraints are further compounded due to the frequent conversion of grasslands, forests, and cultivated land [8]. In this context, a comprehensive investigation into the interrelationship between land use change and water resources is imperative [9,10].
The WCC of an ecosystem refers to its capacity to maintain water volume under specific temporal and spatial conditions. As a core mechanism for sustaining regional ecosystem functions and maintaining hydrological balance, it plays a crucial role in flood retention, peak flow reduction, water purification, and runoff regulation [11,12]. Ecosystems, including natural vegetation, grasslands, and forests, can significantly enhance the storage capacity and utilization efficiency of water resources through processes such as transpiration, soil moisture retention, and groundwater recharge [13]. However, the irrational evolution of the land-use structure has led to a decline in WCC and WY, resulting in increasingly prominent ecological and environmental problems [14,15,16]. Previous studies have shown that LULC significantly impact hydrological and ecological systems, yet their effects vary across regions. For example, in China’s Sanjiangyuan region, land use practices have led to grassland degradation, reducing the area’s capacity to intercept precipitation[17]. In arid regions such as Iran’s Sirvan Basin, despite afforestation efforts, declining precipitation has exacerbated water scarcity. In contrast, in the Yellow River Basin, a substantial reduction in agricultural land, coupled with the large-scale implementation of the “Grain for Green” policy, has notably enhanced WCC [18]. These regional disparities highlight the necessity of assessing the impact of land use change on water conservation in specific policy and governance contexts [19]. However, existing studies that simulate changes in WCC under future land-use scenarios predominantly focus on natural development, ecological protection, and agricultural expansion. They often overlook scenario designs that are tailored to regional land-use planning frameworks and strategic development goals [20,21]. This gap limits the ability to comprehensively assess WCC in response to policy-driven land-use transitions. Given the spatial heterogeneity of land-use patterns and the divergent impacts of policy directives on land-use change, there remains a theoretical gap in understanding how future land-use transformations under policy planning frameworks will influence water resources in China’s northern agro-pastoral ecotone. Therefore, investigating the complex interplay between spatial land-use planning and water resources is essential for formulating effective water resource management policies and promoting regional sustainability.
With the advancement of research and the continuous refinement of remote sensing technologies, numerous quantitative methods for assessing water conservation capacity have been developed. Conventional methods encompass the integrated water storage approach, the water balance technique, the canopy interception method, soil water retention strategies, precipitation storage methods, annual runoff assessments, and subsurface runoff evaluations. Furthermore, a range of modeling approaches have been applied, including the Soil and Water Assessment Tool (SWAT), the Integrated Valuation of Ecosystem Services and Trade-offs (InVEST) model, and the Cellular Automata (CA) model [22,23]. Among these models, the InVEST framework is particularly popular because of its versatile data integration and robust ability to capture spatial variations. Moreover, with the maturation of land use change prediction techniques, numerous predictive models have been developed. Among the most widely applied at present are the Markov model, system dynamics model, cellular automata, SLEUTH model, CLUE-S model, and FLUS model. However, certain limitations persist[24]. The system dynamics and Markov models struggle with spatial information processing and lack the capacity to effectively describe land use spatial patterns. Cellular automata and the SLEUTH model, while useful, fail to account for the influence of socioeconomic factors. The CLUE-S model can simulate multiple LULC change simultaneously but overlooks the possibility of transitions among non-dominant land categories [25]. In contrast, the FLUS model, integrating artificial neural networks (ANN), system dynamics (SD), and cellular automata (CA), introduces adaptive inertia coefficients and a roulette-wheel competition mechanism to address the limitations of traditional linear regression methods in land use classification. This makes it particularly well-suited for complex land use systems [26].
As a representative region of the agro-pastoral ecotone in northern China, the Bashang region of Zhangjiakou city is characterized by an arid and semi-arid climate. Agriculture and animal husbandry serve as the dominant industries, with water consumption in these sectors accounting for over 70% of total water use [27]. In recent years, the region has faced mounting pressure from population growth, economic expansion, and agricultural intensification, exacerbating the imbalance between water supply and demand. Notably, the continuous expansion of cultivated land—an increase of 1,434.99 km² between 1990 and 2020—has led to a surge in irrigation water demand [23,28]. This trend not only constrains the region’s sustainable development but also profoundly alters local hydrological processes and ecosystem service functions [29]. Moreover, climate change and intensified human activities have contributed to a systematic decrease in WCC [30,31]. Therefore, investigating the spatiotemporal evolution of water conservation functions under multiple land use scenarios is essential for formulating scientifically sound water resource management policies and fostering sustainable development.
This research primarily focused on (1) simulate LULC across four different scenarios: the Natural Development Scenario (NDS), Agricultural Production Scenario (APS), Ecological protection Scenario (EPS) and Land Planning Scenario (LPS) based on FLUS model, (2) assess the WCC of the Bashang region in Zhangjiakou city using InVEST model, and (3) examine the potential effects of land use changes on the regional WCC function under various scenarios. By elucidating future trends in water resource dynamics within the agro-pastoral transitional zone, this research offers a solid scientific basis for policymakers to develop effective strategies for water resource management and conservation.
2. Materials and Methods
2.1. Study Area
The Bashang region of Zhangjiakou city is situated at the intersection of the North China Plain and the Inner Mongolia Plateau in the northwestern part of Hebei Province, China, between 113°48′E-116°03′E and 40°43′N-42°10′N (Figure 1). The region comprises four counties—Kangbao, Shangyi, Guyuan, Zhangbei, Saibei Management District and Chabei Management District—and serves as a critical transportation hub connecting northeastern, northern, and northwestern China, encompassing a total area of 13,761.32 km². It acts as a vital ecological barrier in China and represents a strategic area for management of water resources and the environment protection in proximity to the Chinese capital, Beijing. The region experiences a temperate continental monsoon climate, characterized by an average annual rainfall of 447.07 mm, an average annual temperature of 3.05°C, and an elevation range of 848 to 2,167 meters. The land-use pattern in Bashang region is dominated by cropland, forest land, and grassland. However, the recent expansion of cropland has intensified conflicts between land resource supply and demand, reduced the total area of forest and grassland resources, and exacerbated overexploitation of groundwater. These changes in land use significantly affect ecosystem structure, hydrological processes, and their associated functions.
2.2. Data Sources
This study utilized diverse data sources, including land use and land cover (LULC), natural environmental variables, socioeconomic indicators, and accessibility factors (Table 1). LULC data were reclassified into seven categories: rain-fed land, irrigated land, forest, grassland, water, built-up land, and unused land, using ARCGIS 10.5 software (Figure 2). Elevation data with a spatial resolution of 30 meters were sourced from the Geospatial Data Cloud (https://www.gscloud.cn/), and slope and aspect variables were subsequently derived from these elevation data. Climate data, including average monthly precipitation, temperature, and potential evapotranspiration from 1990 to 2020 were sourced from the Tibetan Plateau Data Center (TPDC, http://data.tpdc.ac.cn/). Soil type data from Resources and Environment Science Data Platform (https://www.resdc.cn/). The soil type classifications for the Bashang region of Zhangjiakou are as follows: anthrosols, alfisols, primarosols, semi-hydromophic soli, salinealkali soli, semi-luvisols and pedocal (Figure 3). Soil parameter data were derived from version 1.2 of the Harmonized World Soil Database (HWSD) published by the Food and Agriculture Organization of the United Nations (FAO, https://www.fao.org/) at 1000 m resolution. The HWSD dataset includes soil composition parameters such as percentages of sand, clay, silt and organic carbon. Based on these data, soil saturated hydraulic conductivity and plant-available water capacity were calculated (PAWC). In addition, socio-economic data including 2020 population density and 2020 gross domestic product (GDP) were obtained from the Resources and Environment Science Data Platform (https://www.resdc.cn/). Accessibility factors were obtained from Geospatial data cloud (https://www.gscloud.cn), and the road network data were converted to raster maps using the Euclidean distance analysis function of ArcGIS. All datasets were resampled to 30 m resolution using ArcGIS 10.5 software for input into the FLUS and InVEST models.
2.3. Land Use Change Analysis and Multiscenarios Prediction
2.3.1. Geoinformation Tupu Model Analysis
The geoinformation tupu model is a framework designed for modeling and analyzing complex spatial information while representing multilevel geospatial information through cartographic methods. This model facilitates the integration of temporal evolution and spatial distribution of land-use maps into specialized maps[32]. Based on the evolutionary characteristics of LULC from 1990 to 2005 and 2020, the geoinformation tupu is categorized into five types: early-change type, later-change type, repeated-change type, continuous-change type, and stable type[33]. The mathematical formula for the geoinformation tupu is as follows:
where represents the value of pixel i in the map, represents the land use type in a period of n.
2.3.2. Multi-Scenarios Setting
Taking into account the current LULC status and future LULC development objectives of Bashang region, four development scenarios were identified: Natural Development Scenario (NDS), Agricultural Production Scenario (APS), Ecological protection Scenario (EPS) and Land Planning Scenario (LPS) [34]. The formulation of land transfer rules under each scenario is informed by the research results. The specific design rules for each scenario are as follows:
- NDS (Natural Development Scenario): This scenario excludes the influence of anthropogenic and socio-environmental factors. It forecasts land-use changes for 2035, relying exclusively on the natural trends in land-use transformation observed between 1990 and 2020.
- APS (Agricultural Production Scenario): In this scenario, the study region simulates the maximum extent of arable land expansion under an agricultural development objective. Specifically, the conversion of unutilized land, forest and grassland into arable land is promoted while ensuring that existing arable land (both irrigated and rain-fed land) remains unchanged. Therefore, in the configuration of neighborhood weights, the transition probability for irrigated land and rain-fed land were increased by 30%. Prohibitions were imposed on the conversion of cultivated to other types.
- EPS (Ecological protection Scenario): This scenario incorporates ecological conservation objectives for the study area. The study proposes simulating the maximized expansion of ecological lands, particularly forest and grassland. The framework emphasizes the dual imperatives of protecting and enhancing ecological land resources. Under this configuration: (1) Strict prohibitions were instituted against conversions of forest and grassland to other types and transformations of unutilized land to cultivated areas; (2) Transition from rain-fed land to irrigated land was restricted; (3) Neighborhood weights underwent strategic adjustments—irrigated land weights decreased by 50%, rain-fed land weights reduced by 20%, while grassland and woodland weights increased by 40%.
- LPS (Land Planning Scenario): According to the Zhangjiakou Capital Water Conservation Functional Area and Ecological Environment Support Area Construction Plan (2019-2035), the objectives for 2035 are set as follows: The Bashang region of Zhangjiakou will progressively transition irrigated land to alternative land uses while restoring abandoned land through grass planting. Additionally, as stipulated in the Land Use Master Plan for Four Counties in the Bashang Region of Zhangjiakou (2021-2035), the permanent basic farmland area in Zhangjiakou Bashang is designated as 4,551.26 km². Based on these planning targets, the LPS is defined as follows: (1) Full conversion of irrigated to rain-fed land and strictly prohibit the transformation of other land categories into irrigated land; (2) Reduce the transition probability of irrigated land by 50%, while increasing the transition probability of forestland and grassland by 20% and 40%, respectively; (3) Ensure cultivated land area remains within the protection red line for basic farmland; (4) Strictly prohibit the conversion of forestland and grassland to other categories.
2.3.3. The FLUS Model
The FLUS model, proposed in 2017 by internationally renowned geo-simulation experts Xiaoping Liu and Xia Li, is designed to simulate LULC driven by natural factors and human activities, as well as to predict future LULC scenarios [26]. By improving the traditional cellular automata (CA) approach, the model integrates the combined effects of natural and anthropogenic influences, enabling the simulation and forecasting of diverse land-use changes. To ensure the predictive effectiveness of the FLUS model, its accuracy must be verified against empirical data prior to making future predictions [35]. For this study, the 2005 LULC map was utilized as the baseline spatial model, while the 2020 LULC data was used to represent the demand for simulating the spatial distribution of LULC in 2020. Simulation accuracy was evaluated by comparing the simulated results with actual data, and optimal parameter settings were determined based on this assessment. Before simulating the spatial distribution of LULC for 2035, the Markov model was applied to forecast future trends. Using the 2020 LULC map as the baseline spatial pattern, the projected LULC area as the demand, and incorporating factors such as land development probabilities and additional constraints, the spatial distribution of LULC in 2035 was generated through spatial simulation.
2.4. Water Conservation Assessment
The assessment of WCC functions comprises two key components. First, the InVEST model is applied to quantify spatial and temporal variations in WY across the study area. Based on these results, the model further estimates WCC, analyzing both its spatial distribution and quantitative changes for 2020 and under four LULC scenarios for 2035.
2.4.1. The InVEST Water Yield Model
The InVEST annual water yield model is a water balance-based tool designed to evaluate water resource performance within a specific region [36]. This model aids decision-makers in understanding the impacts of LULC on water availability and plays a critical role in valuing ecosystem services. By simplifying complex hydrological processes, the model estimates the total annual water yield (WY) for each pixel (x) within the watershed. This estimation is calculated by subtracting the actual annual evapotranspiration (AET) from the total annual rainfall (P) within the catchment (Zhang et al., 2004). The final output includes both the total and average water yield.
The WY model utilizes the Budyko curve and average annual precipitation to estimate the annual WY for each pixel within the study area. The calculation is governed by the following formula:
Here, represents the annual actual evapotranspiration of grid unit x, while denotes the annual precipitation of the same unit. For vegetative LULC types, the evapotranspiration component of the water balance, expressed as closely follows the Budyko curve proposed by Zhang et al [37], This curve describes the relationship between potential evapotranspiration and actual evapotranspiration (Equation 3).
In the formula, represents the potential evapotranspiration, is a parameter that characterizes the inherent climate-soil properties of the area. The parameter is empirically determined in the model using the expression proposed by Donohue et al [38], as described by the following equation:
In this formula, Z is a constant, often referred to as the “seasonal factor,” which encapsulates rainfall patterns and other hydrogeological characteristics of the region. Its values typically range from 1 to 30. Based on the findings of Donohue et al [38], can be approximated as 0.2N, where N represents the total number of precipitation events per year. Additionally, denotes the available water content within the plant, expressed in millimeters. This value is estimated as the product of the plant-available water capacity (PAWC), the depth of rooting restriction, and the minimum rooting depth of the vegetation.
Root depth refers to the soil depth where root growth is restricted by physical or chemical barriers. Conversely, the rooting depth of vegetation is typically defined as the depth that contains 95% of the root biomass for a given vegetation type.
Additionally, the model requires a table of biophysical coefficients corresponding to each LULC type, as detailed in Table 2. This table includes information on vegetation characteristics (LULC_veg), plant evapotranspiration coefficients (Kc), and rooting depth specific to each LULC category used in the model.
2.4.2. Calculation Method of Water Conservation
After calculating the water yield using the InVEST model, the results must be adjusted to account for topographic index, flow velocity, and other influencing factors. The correction formulas are presented below:
Retention represents the WCC (mm), denotes the topographic index, Velocity is the velocity coefficient, is the saturated soil hydraulic conductivity (cm/day), and is the WY calculated by the model (mm).
2.4.3. Validation of InVEST Model Accuracy
Based on the WY coefficient data from the Zhangjiakou Bashang region reported in the 2020 Hebei Provincial Water Resources Bulletin, this study conducted iterative validation of the InVEST model’s water yield estimation results. Through continuous adjustment of the Zhang coefficient in the InVEST model for repeated simulations of the 2020 WY in the study area, the results demonstrated that when Z = 1.5, the simulated water yield coefficient aligned precisely with the values documented in the Hebei Provincial Water Resources Bulletin, and the value of WY coefficients is 0.09. This congruence confirms the model’s validation through a rational verification process. Consequently, the InVEST model parameterized with this Z-value demonstrates reliable applicability for simulating WY in regions sharing similar geographical characteristics and hydrogeological conditions.
3. Results
3.1. Geoinformation Tupu of LULC
Conflicting interests among stakeholders regarding the manner and extent of land use often result in land use conflicts. The evolution of LULC can be viewed as the spatial manifestation of these conflicts over time. Analysis of LULC evolution from 1990 to 2020 reveals that land use change is predominantly characterized by stable types, followed by early-change types, while repeated-change types account for the smallest proportion of the area (Figure 4). This indicates that most land use has remained static, though a substantial portion underwent significant transformation during an early phase. Furthermore, it highlights the difficulty of reverting land to its original use once it has changed. In the early-change category, transitions primarily included ‘grassland-rain-fed land-rain-fed land’ (30.18%), ‘rain-fed land-grassland-grassland’ (12.78%), ‘woodland-rain-fed land-rain-fed land’ (11.99%), and ‘woodland-grassland’ (11.60%). For later-change types, notable transitions were ‘woodland-forestland-rain-fed land’ (22.84%), ‘woodland-forestland-grassland’ (18.53%), ‘grassland-grassland-rain-fed land’ (13.08%), and ‘rain-fed land-rain-fed land-forestland’ (9.85%). The Bashang region of Zhangjiakou city, as a region heavily focused on agriculture and animal husbandry, has experienced extensive conversion between cropland (both irrigated and rain-fed land) and forest or grassland since 1990. By 2020, 2,933.99 km² of forest and grassland had been reclaimed for cropland, while 1,478.79 km² of previously cropland land was converted back to forest and grassland. This dynamic has resulted in spatial competition among arable land, forest, and grassland, with the latter two categories ultimately losing ground (Table 3). This phenomenon underscores the growing dichotomy between the imperative for environmental conservation and the continuous expansion of agricultural and animal husbandry activities
This section may be divided by subheadings. It should provide a concise and precise description of the experimental results, their interpretation, as well as the experimental conclusions that can be drawn.
3.2. Multi-Scenario LULC Simulation
The FLUS model was utilized to simulate LULC scenarios by predicting the spatial distribution for 2020 based on historical trends and subsequently validating these predictions against observed changes. With a kappa coefficient of 0.81, the FLUS model demonstrates a high level of reliability in simulating land use patterns in the Bashang region. Using the validated 2020 LULC raster data as inputs, coupled with the Markov module, the FLUS model projected the spatial distribution of land use types under the NPS, APS, EPS, and LPS scenarios for 2035 (Figure 5). The projections indicate that the most substantial changes are anticipated in cultivated land, grassland, and forest areas.
In the NDS, cultivated land—particularly irrigated land—exhibits a trend of expansion, with irrigated land increasing by 203.31 km² by 2035. In contrast, other land use types experience contraction, with forest and grassland areas shrinking by 174.43 km² and 94.99 km², respectively. Spatial distribution analysis reveals that cultivated land expanded primarily outward from its 2020 distribution, notably in the northern and central regions of Guyuan County, the central and eastern parts of Zhangbei County, and the central-southern areas of Kangbao County. This expansion predominantly encroached upon grassland and forest land, driven primarily by socio-economic development and the growing demand for construction land.
In the APS, the goal is to secure food production and sustain farmers’ livelihoods while maximizing the potential for cultivated land expansion. Compared to 2020, this scenario leads to a reduction of 1,703.92 km² in ecological land use types such as forest, grassland, and water bodies, along with a 9.01 km² decrease in unused land. In contrast, the area of irrigated and rain-fed land increases by 1,688.43 km². Spatially, significant expansion of cultivated land, predominantly dry land, occurs in the central and northern parts of Guyuan and Zhangbei County. Furthermore, there is a notable shift from forest and grassland to irrigated land in the northwestern part of Shangyi County and the central-southern areas of Kangbao County.
In the EPS, the focus is on the preservation of ecological land, with a primary emphasis on promoting the expansion of forests, grasslands, and water bodies. Under this scenario, the expansion of cultivated land is effectively curbed. Compared to 2020, all 867.08 km² of irrigated land are reduced, and dry land decreases by 603.77 km², which constitutes 30% of its original area. In contrast, the total area of forest, grassland, and water bodies expands by 1,477.51 km². From a spatial perspective, compared to the NDS, ecological land in the Bashang region of Zhangjiakou city has largely been restored. Grassland recovery is particularly prominent in the southwestern part of Guyuan, the northeastern part of Zhangbei, and the southern part of Shangyi County. Forest restoration is most noticeable in Kangbao County and the northwestern part of Shangyi County.
Under the LPS, cultivated land within the study area undergoes consolidation, with scattered irrigated land gradually transitioning to rain-fed land. Water bodies in the western part of Zhangbei County and the northwestern part of Shangyi County expand outward from their centers. Grasslands are primarily concentrated in the southwestern region of Shangyi, the western part of Zhangbei, and Guyuan County, showing gradual expansion towards the northwest. In Kangbao County, there has been a notable transformation of forest land into grassland, largely due to the sparsely distributed trees and grasses within the forest. The sparse forests in the Bashang region of Zhangjiakou city are unable to thrive in the region’s arid and semi-arid conditions, leading to their gradual transformation into grassland. Overall, this scenario strikes a balance between ecological protection and agricultural development, effectively curbing ecological degradation, optimizing agricultural structures, and playing a crucial role in the ecological construction and sustainable socio-economic development of the Bashang region of Zhangjiakou city.
As illustrated in Figure 6, significant variations in LULC evolution emerge across the four development scenarios for 2035. NDS follows historical land use trends with-out policy constraints. Consequently, irrigated and rain-fed land expand significantly, increasing by 23.45% and 1.29%, respectively, compared to 2020. However, this growth comes at the expense of forest and grassland, which decline by 4.32% and 2.14%, respectively. The continuous expansion of agricultural and residential areas encroaches on ecological zones, including forests, grasslands, and water bodies, thereby threatening long-term ecological security. This pattern highlights risks associated with ecosystem service degradation, which could undermine regional socio-economic and environmental sustainability. Designed to prioritize agricultural expansion, APS enforces strict farmland protection policies, leading to a substantial 34.00% increase in cropland compared to 2020. However, these measures accelerate the conversion of forests and grasslands into agricultural land, exacerbating the competition between agricultural production and ecological conservation. EPS emphasizes forest and grassland restoration, with both land types increasing by 13.01% and 4.87%, respectively, compared to 2020. However, the significant decline in arable land underscores a key limitation of the ecology-first approach—insufficient synergy between ecological conservation and food security, which may challenge sustainable land management. LPS aligns with future development policies by balancing policy objectives with environmental constraints. It promotes the conversion of irrigated land to rain-fed land, which subsequently transitions into forest and grassland. Total cropland remains stable at 4,551.27 km², adhering to the red-line policy for permanent farmland protection. Notably, grassland expands significantly, increasing by 27.00% compared to 2020. By maintaining a balanced distribution of forest, grassland, and cropland, LPS supports both agricultural productivity and ecological sustainability, making it a more pragmatic and resilient land-use strategy for the agro-pastoral transition zone.
3.3. Evaluation of Water Conservation Based on InVEST and Main Driver Analysis
The InVEST model was used to calculate water production for the year 2020, revealing a gradual increase in annual WY from the northwest to the southeast across the study area (Figure 7). A comparison of the average WY and total water production in the sub-basins indicated that the highest WY was observed in Guyuan and the northern part of Zhangbei County. This can be primarily attributed to the region’s high precipitation levels, extensive grassland areas, and the limited interception capacity of grassland, which together enhance surface runoff and, in turn, increase water production. In contrast, water-producing areas in the northwestern parts of Kangbao and Shangyi counties, which are characterized by higher forest vegetation cover and lower proportions of arable land, show different hydrological dynamics. The forest canopy, along with the deciduous layer and soil layer, plays a significant role in intercepting precipitation, reducing surface runoff, and influencing the overall water production levels.
The WCC of the Bashang region was calculated using Equation 6, with the mean value for the entire raster cell ranging from 0 to 82.71 mm. As shown in Figure 8, the overall low WCC in the Bashang region is evident. The spatial variation in this capacity follows the general pattern of water yield distribution, with higher values observed in the southeastern part of the region. Areas exhibiting high WCC are characterized by factors such as high precipitation, low evapotranspiration, shallow soil depths, high altitudes, and high values of saturated hydraulic conductivity. To assess the correlation between water conservation capacity and these driving factors, the Spearman correlation coefficient was calculated (Figure 9). The statistical analysis revealed a significant positive correlation between water conservation capacity and precipitation (0.51), elevation (0.55), and evapotranspiration (0.46). In contrast, negative correlations were observed between water conservation capacity and soil depth (-0.30), evapotranspiration (-0.46), soil permeability (-0.20), and the topographic index (-0.16).
3.4. Multi-Scenario Water Conservation Simulation
This study analyzes WY under different LULC scenarios in 2035 (Figure 10). Using the InVEST model within the 2020 environmental context, we simulated water yield for 2035 under four scenarios: NDS, APS, EPS, and LPS, Spatially, the water yield under different scenarios in 2035 exhibited a pattern of lower values in the northwest and higher values in the southeast, consistent with the spatial distribution trend observed in 2020 (Figure 7). The descending order of water yield was LPS > NDS > APS > EPS (Table 4), with all scenarios exceeding 2020 levels. The mean grid cell water yields were 35.066, 33.362, 32.885, and 32.741 mm/pixel respectively, indicating that spatial land use planning significantly impacts water yield. Under LPS, the complete retirement of irrigated cropland reduced water consumption demand, thereby in-creasing water yield. NDS followed natural development trends of LULC, where di-minished surface interception capacity from reduced forest and grassland coverage, combined with cropland expansion increasing water demand, paradoxically resulted in higher WY compared to 2020. APS showed the most significant cropland expansion, with irrigated and dryland areas increasing by 583.41 km² and 849.52 km² respectively compared to NDS, leading to elevated water demand and consequently lower water yield than both NDS and LPS. Under EPS, enhanced surface infiltration and interception capacities from restored forest and grassland ecosystems resulted in reduced WY.
Based on the projected WY for 2035 under different LULC scenarios, we calculated the WCC for NDS, APS, EPS, and LPS by integrating the topographic index, flow velocity coefficient, and saturated soil hydraulic conductivity (Figure 11). The ranking of WCC across these scenarios was as follows: EPS > LPS > NDS > APS. The mean grid cell water conservation capacities were 3.990, 3.875, 3.801, and 3.418 mm/pixel, corresponding to total water conservation volumes of 28.464 × 10⁶, 27.701 × 10⁶, 26.556 × 10⁶, and 24.031 × 10⁶ m³, respectively. Notably, EPS and LPS exhibited higher WCC than in 2020, whereas NDS and APS showed declines. Despite having the lowest WY, EPS achieved the highest WCC due to the superior rainfall interception capabilities of forests and grasslands compared to other land types. The substantial expansion of forest and grassland in EPS (significantly exceeding that in other scenarios) enhanced its water conservation potential. Conversely, APS exhibited the lowest WCC due to cropland expansion, which not only in-creased water consumption but also encroached upon forests and grasslands, thereby reducing surface interception capacity. While LPS demonstrated higher WCC than NDS and APS, it remained lower than EPS. This pattern resulted from frequent land conversions under LPS, particularly large-scale forest-to-grassland transitions. Given that grasslands have weaker interception capacity than forests, LPS yielded the highest WY but failed to surpass EPS in WCC.
Overall, NDS, following natural development trends, would gradually degrade WCC, posing risks to regional ecological security. APS, prioritizing agricultural production, severely compromises water conservation functions and disrupts ecological balance. While EPS maximizes water conservation capacity, it overlooks future food security needs under national spatial planning and socioeconomic development, potentially jeopardizing long-term stability. LPS, constrained by policy-driven spatial planning, maintains a relative equilibrium between cropland and ecological land (forest/grassland), enhancing both water yield and conservation capacity. This balance makes LPS a viable reference for future spatial planning and water resource protection. However, its suboptimal water conservation capacity compared to EPS underscores the critical impact of forest-grassland conversion dynamics. Therefore, future land use planning should strategically regulate transitions between forests and grasslands to optimize ecosystem services.
4. Discussion
4.1. Effects of LULC on Water Conservation Function
This study employed the FLUS model to forecast future LULC trends in the Bashang of Zhangjiakou city for 2035, taking into account four different scenarios. The analysis revealed significant variations in the projected distribution of cultivated land, forest areas, and grasslands across these scenarios [39]. Subsequently, the InVEST model was employed to calculate WY and estimate WCC. The findings suggest that land use changes exert complex and multifaceted effects on water retention, particularly in ecologically sensitive agro-pastoral transition zones. A comparison of water retention capacities across different land types showed the following order: forest > grassland > dryland > irrigated land > built-up areas > unused land > water bodies (Figure 12). Changes in LULC, such as cropland expansion, urbanization, deforestation, and grassland restoration, directly influence the runoff, retention, and recharge capacities of water resources [40,41,42]. Alterations in vegetation types affect water interception and soil moisture retention, with reductions in forests and grasslands leading to decreased retention capacity and increased runoff [43,44]. Urbanization further impacts soil permeability, with an increase in impervious surfaces reducing groundwater recharge [45]. The spatial and temporal distribution of water resources is significantly influenced by LULC. For instance, the expansion of agricultural activities has been shown to increase seasonal water demands, exacerbating flood risks and reducing watershed water storage [46].
4.2. Climate Impacts on WCC
A comparative analysis of spatial distributions between water conservation capacity and precipitation patterns across 2020 and the four 2035 scenarios (Figure 7 and Figure 10) reveals strong spatial consistency, indicating a close correlation between climate evolution and water conservation capacity. Previous studies have demonstrated that precipitation serves as the primary driver of WCC functions, directly governing the supply and regulation of water resources. Moderate and evenly distributed rainfall facilitates soil absorption and groundwater recharge, thereby enhancing water conservation capacity. In contrast, heavy rainfall can increase runoff, reduce infiltration, and potentially lead to flooding and soil erosion, thereby weakening water conservation functions [47]. The temporal and spatial distribution of rainfall significantly impacts water resource availability across different seasons and regions, with vegetation playing a key role in moisture retention through the absorption and regulation of rainfall [39,48]. Although ecosystem models simplify complex processes, their uncertainties can affect the accuracy of simulation results. Future research will prioritize optimizing ecohydrological process representations in the model through experimental and field-based observations, aiming to enhance simulation accuracy and reduce uncertainties. Concurrently, this work will integrate future scenario datasets to simulate water resource dynamics under varying climatic scenarios, thereby improving predictive capabilities for sustainable water management under global change pressures.
4.3. Limitations and Future Works
The FLUS model was used in this study to forecast future LULC patterns and evaluate changes in water conservation across different scenarios. Although valuable conclusions were reached, the study has several uncertainties and limitations. In simulating future land use scenarios, the study primarily focused on current trends in land use and climate change factors, without fully accounting for potential changes in future socio-economic conditions and their impacts on land use. Factors such as population growth, economic development, and policy adjustments could significantly influence land use patterns, yet they were not included in this analysis. Furthermore, the study concentrated on the spatiotemporal evolution of WCC under different scenarios, without examining the potential effects of water conservation changes on future ecosystem services and environmental quality [49]. The ability to conserve water is essential for the sustainable management of regional water resources and plays a crucial role in preserving ecosystem stability and biodiversity [50]. Therefore, integrating regional water resource management with the flow of ecosystem services and quantitatively evaluating the effectiveness of various mitigation strategies would enhance the comprehensiveness and applicability of the research [51,52]. Future research should include a broader array of socio-economic and climate change scenarios to assess their impacts on land use, as well as their joint effects on water conservation and ecosystem services. The integration of spatial simulation with ecosystem service function evaluation would facilitate the quantification and comparison of different mitigation strategies, providing policymakers with a more scientifically grounded basis for promoting sustainable agricultural growth and long-term ecological conservation.
5. Conclusions
This study examines LULC evolution in the Zhangjiakou Bashang region from 1990 to 2020, revealing frequent transitions. Between 1990 and 2005, land use changes accounted for 27.83% of the total area, whereas from 2005 to 2020, this figure declined to 11.83%. Using the InVEST model, the study estimates the WY and WCC for 2020 at 446.063 × 10⁶ m³ and 27.027 × 10⁶ m³, respectively. Furthermore, by integrating the FLUS and InVEST models, the study simulates spatial land use dynamics and water conservation variations under four future development scenarios for 2035.The results indicate significant differences in LULC changes across scenarios. In the NDS, irrigated and rain-fed farmland expand substantially by 23.45% and 1.29%, respectively, compared to 2020, while forest and grassland decline by 4.32% and 2.14%. The APS exhibits a pronounced expansion of cropland, increasing by 1,688.43 km² (34%) relative to 2020. In contrast, the EPS prioritizes forest and grassland restoration, leading to increases of 13.01% and 4.87%, respectively. The Land Planning Scenario (LPS) maintains cropland at 4,551.27 km², adhering to the red-line policy for permanent basic farmland, while grassland expands significantly by 27.00%. Projected changes in water yield and conservation capacity vary across the four scenarios. In terms of WY, the ranking follows LPS > NDS > APS > EPS, whereas for WCC, the order is EPS > LPS > NDS > APS. Although EPS exhibits the lowest water yield, it achieves the highest water conservation capacity due to the large-scale conversion of irrigated and rain-fed farmland into forest and grassland, which reduces water consumption while enhancing surface water retention and infiltration. Consequently, EPS surpasses LPS in water conservation. However, EPS does not fully align with regional development policies, particularly regarding the balance between cultivated and ecological land, potentially posing challenges for future urban expansion and food security. In comparison, the LPS scenario offers a more balanced land use strategy, aligning with policy objectives for 2035. It achieves the highest water yield while maintaining a relatively high WCC, second only to EPS. Thus, LPS serves as a viable reference for future land use planning in agro-pastoral transition zones. However, further land use adjustments are needed to align with local development policies and ensure a sustainable balance between ecological conservation and water resource management.
Author Contributions
Conceptualization, R.Z. and W.Z.; Formal analysis, R.Z. and Z.P.; Funding acquisition, W.Z.; Investigation, R.Z., H.K., H.X. and Z.P.; Methodology, W.Z.; Supervision, H.K., H.X, C.C., G.Z., Z.P. and W.Z.; Validation, R.Z., C.C. and G.Z.; Writing – original draft, R.Z. and W.Z.; Writing – review & editing, R.Z. and W.Z., All authors have read and agreed to the published version of the manuscript.
Funding
This research was funded by Special Project on Hi-Tech Innovation Capacity of Beijing Academy of Agriculture and Forestry Sciences, grant number (JCX20230406) and (KJCX20230305). This research was supported by Beijing Natural Science Foundation, grant number (8232028).
Data Availability Statement
The data presented in this study are available on request from the corresponding author.
Acknowledgments
We are deeply grateful to the experts at the Institute of Grassland, Flowers, and Ecology, Beijing Academy of Agriculture and Forestry Sciences, and the professors at China University of Geosciences, Beijing, for their valuable contributions.
Conflicts of Interest
The authors declare no conflicts of interest.
Abbreviations
The following abbreviations are used in this manuscript:
| WY | Water Yield |
| WCC | Water Conservation Capacity |
| LULC | Land Use / Land Cover |
References
- He, C.; Liu, Z.; Wu, J.; Pan, X.; Fang, Z.; Li, J.; Bryan, B.A. Future global urban water scarcity and potential solutions. Nature communications 2021, 12, 4667–4667. [Google Scholar] [CrossRef] [PubMed]
- Boretti, A.; Rosa, L. Reassessing the projections of the World Water Development Report. npj Clean Water 2019, 2, 1–6. [Google Scholar] [CrossRef]
- Rosa, L.; Chiarelli, D.D.; Rulli, M.C.; Dell’Angelo, J.; D’Odorico, P. Global agricultural economic water scarcity. Science Advances 2020, 6, eaaz6031. [Google Scholar] [CrossRef]
- Winkler, K.; Fuchs, R.; Rounsevell, M.; Herold, M. Global land use changes are four times greater than previously estimated. Nature Communications 2021, 12, 10. [Google Scholar] [CrossRef]
- Guo, Q.; Yu, C.; Xu, Z.; Yang, Y.; Wang, X. Impacts of climate and land-use changes on water yields: Similarities and differences among typical watersheds distributed throughout China. Journal of Hydrology: Regional Studies 2023, 45. [Google Scholar] [CrossRef]
- Liu, X.; Liu, Y.; Wang, Y.; Liu, Z. Evaluating potential impacts of land use changes on water supply–demand under multiple development scenarios in dryland region. Journal of Hydrology 2022, 610. [Google Scholar] [CrossRef]
- Qiao, J.; He, J.; Li, Y.; Yang, X.; Peng, Y.; Wang, H.; Yu, F.; Wu, J.; Gong, S.; Che, H.; et al. Analysis of the spatiotemporal changes in global land cover from 2001 to 2020. Science of the total environment 2023, 908, 168354–168354. [Google Scholar] [CrossRef]
- Fernando, M.; Néstor, M.; Ximena, Q.; María, J.; Paúl, C. What Do We Know about Water Scarcity in Semi-Arid Zones? A Global Analysis and Research Trends. Water 2022, 14, 2685–2685. [Google Scholar] [CrossRef]
- Zhao, L.; Shen, Y.J.; Liu, M.; Wang, Y.; Li, Y.; Pei, H. The Impacts of Land Use Changes on Water Yield and Water Conservation Services in Zhangjiakou, Beijing’s Upstream Watershed, China. Sustainability 2023, 15. [Google Scholar] [CrossRef]
- Measho, S.; Chen, B.; Pellikka, P.; Trisurat, Y.; Guo, L.; Sun, S.; Zhang, H. Land Use/Land Cover Changes and Associated Impacts on Water Yield Availability and Variations in the Mereb-Gash River Basin in the Horn of Africa. Journal of Geophysical Research: Biogeosciences 2020, 125, n/a–n/a. [Google Scholar] [CrossRef]
- Li, M.Y.; Liang, D.; Xia, J.; Song, J.X.; Cheng, D.D.; Wu, J.T.; Cao, Y.L.; Sun, H.T.; Li, Q. Evaluation of water conservation function of Danjiang River Basin in Qinling Mountains, China based on InVEST model. Journal of Environmental Management 2021, 286, 12. [Google Scholar] [CrossRef] [PubMed]
- Woldesenbet, T.A.; Elagib, N.A.; Ribbe, L.; Heinrich, J. Hydrological responses to land use/cover changes in the source region of the Upper Blue Nile Basin, Ethiopia. Science of the Total Environment 2017, 575, 724–741. [Google Scholar] [CrossRef] [PubMed]
- Pan, T.; Zuo, L.; Zhang, Z.; Zhao, X.; Sun, F.; Zhu, Z.; Liu, Y. Impact of Land Use Change on Water Conservation: A Case Study of Zhangjiakou in Yongding River. Sustainability 2020, 13, 22–22. [Google Scholar] [CrossRef]
- Gao, J.; Li, F.; Gao, H.; Zhou, C.; Zhang, X. The impact of land-use change on water-related ecosystem services: a study of the Guishui River Basin, Beijing, China. Journal of Cleaner Production 2016, 163, 148–155. [Google Scholar] [CrossRef]
- Daneshi, A.; Brouwer, R.; Najafinejad, A.; Panahi, M.; Zarandian, A.; Maghsood, F.F. Modelling the impacts of climate and land use change on water security in a semi-arid forested watershed using InVEST. Journal of Hydrology 2021, 593, 18. [Google Scholar] [CrossRef]
- Wang, G.Q.; Yang, H.C.; Wang, L.J.; Xu, Z.X.; Xue, B.L. Using the SWAT model to assess impacts of land use changes on runoff generation in headwaters. Hydrological Processes 2014, 28, 1032–1042. [Google Scholar] [CrossRef]
- Li, M.; Di, Z.; Yao, Y.; Ma, Q. Variations in water conservation function and attributions in the Three-River Source Region of the Qinghai-Tibet Plateau based on the SWAT model. Agricultural and Forest Meteorology 2024, 349. [Google Scholar] [CrossRef]
- Zuo, D.; Chen, G.; Wang, G.; Xu, Z.; Han, Y.; Peng, D.; Pang, B.; Abbaspour, K.C.; Yang, H. Assessment of changes in water conservation capacity under land degradation neutrality effects in a typical watershed of Yellow River Basin, China. Ecological Indicators 2023, 148. [Google Scholar] [CrossRef]
- Balist, J.; Malekmohammadi, B.; Jafari, H.R.; Nohegar, A.; Geneletti, D. Detecting land use and climate impacts on water yield ecosystem service in arid and semi-arid areas. A study in Sirvan River Basin-Iran. Applied Water Science 2022, 12. [Google Scholar] [CrossRef]
- Kayitesi, N.M.; Guzha, A.C.; Tonini, M.; Mariethoz, G. Land use land cover change in the African Great Lakes Region: a spatial-temporal analysis and future predictions. Environmental Monitoring and Assessment 2024, 196. [Google Scholar] [CrossRef]
- Radeloff, V.C.; Nelson, E.; Plantinga, A.J.; Lewis, D.J.; Helmers, D.; Lawler, J.J.; Withey, J.C.; Beaudry, F.; Martinuzzi, S.; Butsic, V.; et al. Economic-based projections of future land use in the conterminous United States under alternative policy scenarios. Ecological Applications 2012, 22, 1036–1049. [Google Scholar] [CrossRef] [PubMed]
- Liu, Y.C.; Jing, Y.D.; Han, S.M. Multi-scenario simulation of land use/land cover change and water yield evaluation coupled with the GMOP-PLUS-InVEST model: A case study of the Nansi Lake Basin in China. Ecological Indicators 2023, 155, 11. [Google Scholar] [CrossRef]
- Weichao, L.; Jianhua, W.; Fei, X.; Dawei, M.; Pengbin, Z. Modeling the effects of land use/land cover changes on river runoff using SWAT models: A case study of the Danjiang River source area, China. Environmental research 2023, 242, 117810–117810. [Google Scholar] [CrossRef]
- Matlhodi, B.; K. , K.P.; P., P.B.; G., M.J. Analysis of the Future Land Use Land Cover Changes in the Gaborone Dam Catchment Using CA-Markov Model: Implications on Water Resources. Remote Sensing 2021, 13, 2427–2427. [Google Scholar] [CrossRef]
- Wang, Q.; Guan, Q.; Sun, Y.; Du, Q.; Xiao, X.; Luo, H.; Zhang, J.; Mi, J. Simulation of future land use/cover change (LUCC) in typical watersheds of arid regions under multiple scenarios. Journal of environmental management 2023, 335, 117543–117543. [Google Scholar] [CrossRef] [PubMed]
- Liu, X.P.; Liang, X.; Li, X.; Xu, X.C.; Ou, J.P.; Chen, Y.M.; Li, S.Y.; Wang, S.J.; Pei, F.S. A future land use simulation model (FLUS) for simulating multiple land use scenarios by coupling human and natural effects. Landscape and Urban Planning 2017, 168, 94–116. [Google Scholar] [CrossRef]
- Qi, X.; Feng, K.; Sun, L.; Zhao, D.; Huang, X.; Zhang, D.; Liu, Z.; Baiocchi, G. Rising agricultural water scarcity in China is driven by expansion of irrigated cropland in water scarce regions. One Earth 2022, 5, 1139–1152. [Google Scholar] [CrossRef]
- Schmitt, R.; Rosa, L.; Daily, G. Global expansion of sustainable irrigation limited by water storage. Proceedings of the National Academy of Sciences of the United States of America 2022, 119, e2214291119–e2214291119. [Google Scholar] [CrossRef]
- Song, C.; Yan, J.; Sha, J.; He, G.; Lin, X.; Ma, Y. Dynamic modeling application for simulating optimal policies on water conservation in Zhangjiakou City, China. Journal of Cleaner Production 2018, 201, 111–122. [Google Scholar] [CrossRef]
- Yang, D.; Yang, Y.; Jun, X. Hydrological cycle and water resources in a changing world: A review. Geography and Sustainability 2021, 2, 115–122. [Google Scholar] [CrossRef]
- Cao, X.X.; Wang, H.J.; Zhang, B.; Liu, J.L.; Yang, J. Sustainable management of land use patterns and water allocation for coordinated multidimensional development. Journal of Cleaner Production 2024, 457, 14. [Google Scholar] [CrossRef]
- Wei, L.Y.; Mao, M.J.; Zhao, Y.X.; Wu, G.H.; Wang, H.B.; Li, M.H.; Liu, T.D.; Wei, Y.H.; Huang, S.R.; Huang, L.Y.; et al. Spatio-temporal characteristics and multi-scenario simulation analysis of ecosystem service value in coastal wetland: A case study of the coastal zone of Hainan Island, China. Journal of Environmental Management 2024, 368, 18. [Google Scholar] [CrossRef]
- Yang, A.; Zhu, L.; Chen, S.; Jin, H.; Xia, X. Geo-informatic spectrum analysis of land use change in the Manas River Basin, China during 1975-2015. The Journal of Applied Ecology 2019, 30, 3863–3874. [Google Scholar] [CrossRef]
- Zhang, H.; Xu, E.; Zhu, H. An ecological-living-industrial land classification system and its spatial distribution in China. Resources Science 2015, 37, 1332–1338. [Google Scholar] [CrossRef]
- Jiang, X.T.; Zhai, S.Y.; Liu, H.; Chen, J.; Zhu, Y.Y.; Wang, Z. Multi-scenario simulation of production-living-ecological space and ecological effects based on shared socioeconomic pathways in Zhengzhou, China. Ecological Indicators 2022, 137, 16. [Google Scholar] [CrossRef]
- Cong, W.C.; Sun, X.Y.; Guo, H.; Shan, R.F. Comparison of the SWAT and InVEST models to determine hydrological ecosystem service spatial patterns, priorities and trade-offs in a complex basin. Ecological Indicators 2020, 112, 13. [Google Scholar] [CrossRef]
- Zhang, L.; Hickel, K.; Dawes, W.R.; Chiew, F.H.S.; Western, A.W.; Briggs, P.R. A rational function approach for estimating mean annual evapotranspiration. Water Resour. Res. 2004, 40, 14. [Google Scholar] [CrossRef]
- Donohue, R.J.; Roderick, M.L.; McVicar, T.R. Roots, storms and soil pores: Incorporating key ecohydrological processes into Budyko’s hydrological model. Journal of Hydrology 2012, 436, 35–50. [Google Scholar] [CrossRef]
- Xue, J.; Li, Z.X.; Feng, Q.; Gui, J.; Zhang, B.J. Spatiotemporal variations of water conservation and its influencing factors in ecological barrier region, Qinghai-Tibet Plateau. J. Hydrol.-Reg. Stud. 2022, 42, 17. [Google Scholar] [CrossRef]
- Sun, F.X.; Lyu, Y.H.; Fu, B.J.; Hu, J. Hydrological services by mountain ecosystems in Qilian Mountain of China: A review. Chin. Geogr. Sci. 2016, 26, 174–187. [Google Scholar] [CrossRef]
- Yan, X.; Cao, G.C.; Cao, S.K.; Yuan, J.; Zhao, M.L.; Tong, S.; Li, H.D. Spatiotemporal variations of water conservation and its influencing factors in the Qinghai Plateau, China. Ecological Indicators 2023, 155, 13. [Google Scholar] [CrossRef]
- Hu, W.M.; Li, G.; Li, Z.N. Spatial and temporal evolution characteristics of the water conservation function and its driving factors in regional lake wetlands-Two types of homogeneous lakes as examples. Ecological Indicators 2021, 130, 14. [Google Scholar] [CrossRef]
- Bastos, M.I.; Roebeling, P.C.; Alves, F.L.; Villasante, S.; Magalhaes, L. High risk water pollution hazards affecting Aveiro coastal lagoon (Portugal)-A habitat risk assessment using InVEST. EcologicalInformatics 2023, 76, 19. [Google Scholar] [CrossRef]
- Guo, W.X.; Yang, H.; Zhou, H.T.; Wang, H.X. Synergistic changes in river-lake runoff systems in the Yangtze River basin and their driving force differences. Ecol. Inform. 2023, 75, 14. [Google Scholar] [CrossRef]
- Yang, J.; Shu, Z.; Yang, F.; Fu, D.; Ma, L.; Zhang, L.; Xue, Y. Temporal and spatial variation characteristics of water conservationfunction of Upper Danjiang River Basin in Qinling Mountains and itsinfluencing factors. Coal Geology & Exploration 2023, 51, 133–145. [Google Scholar] [CrossRef]
- Bryan, B.A.; Gao, L.; Ye, Y.Q.; Sun, X.F.; Connor, J.D.; Crossman, N.D.; Stafford-Smith, M.; Wu, J.G.; He, C.Y.; Yu, D.Y.; et al. China’s response to a national land-system sustainability emergency. Nature 2018, 559, 193–204. [Google Scholar] [CrossRef]
Figure 1.
Geographical location of the Bashang region in Zhangjiakou city.
Figure 2.
Distribution of land use in Zhangjiakou Bashang region in 1990, 2005 and 2020.
Figure 3.
Distribution of soil types in Zhangjiakou Bashang region.
Figure 4.
Distribution of transfers by land use type, 1990-2020.
Figure 5.
2035 land use change for the four scenarios of Bashang region.
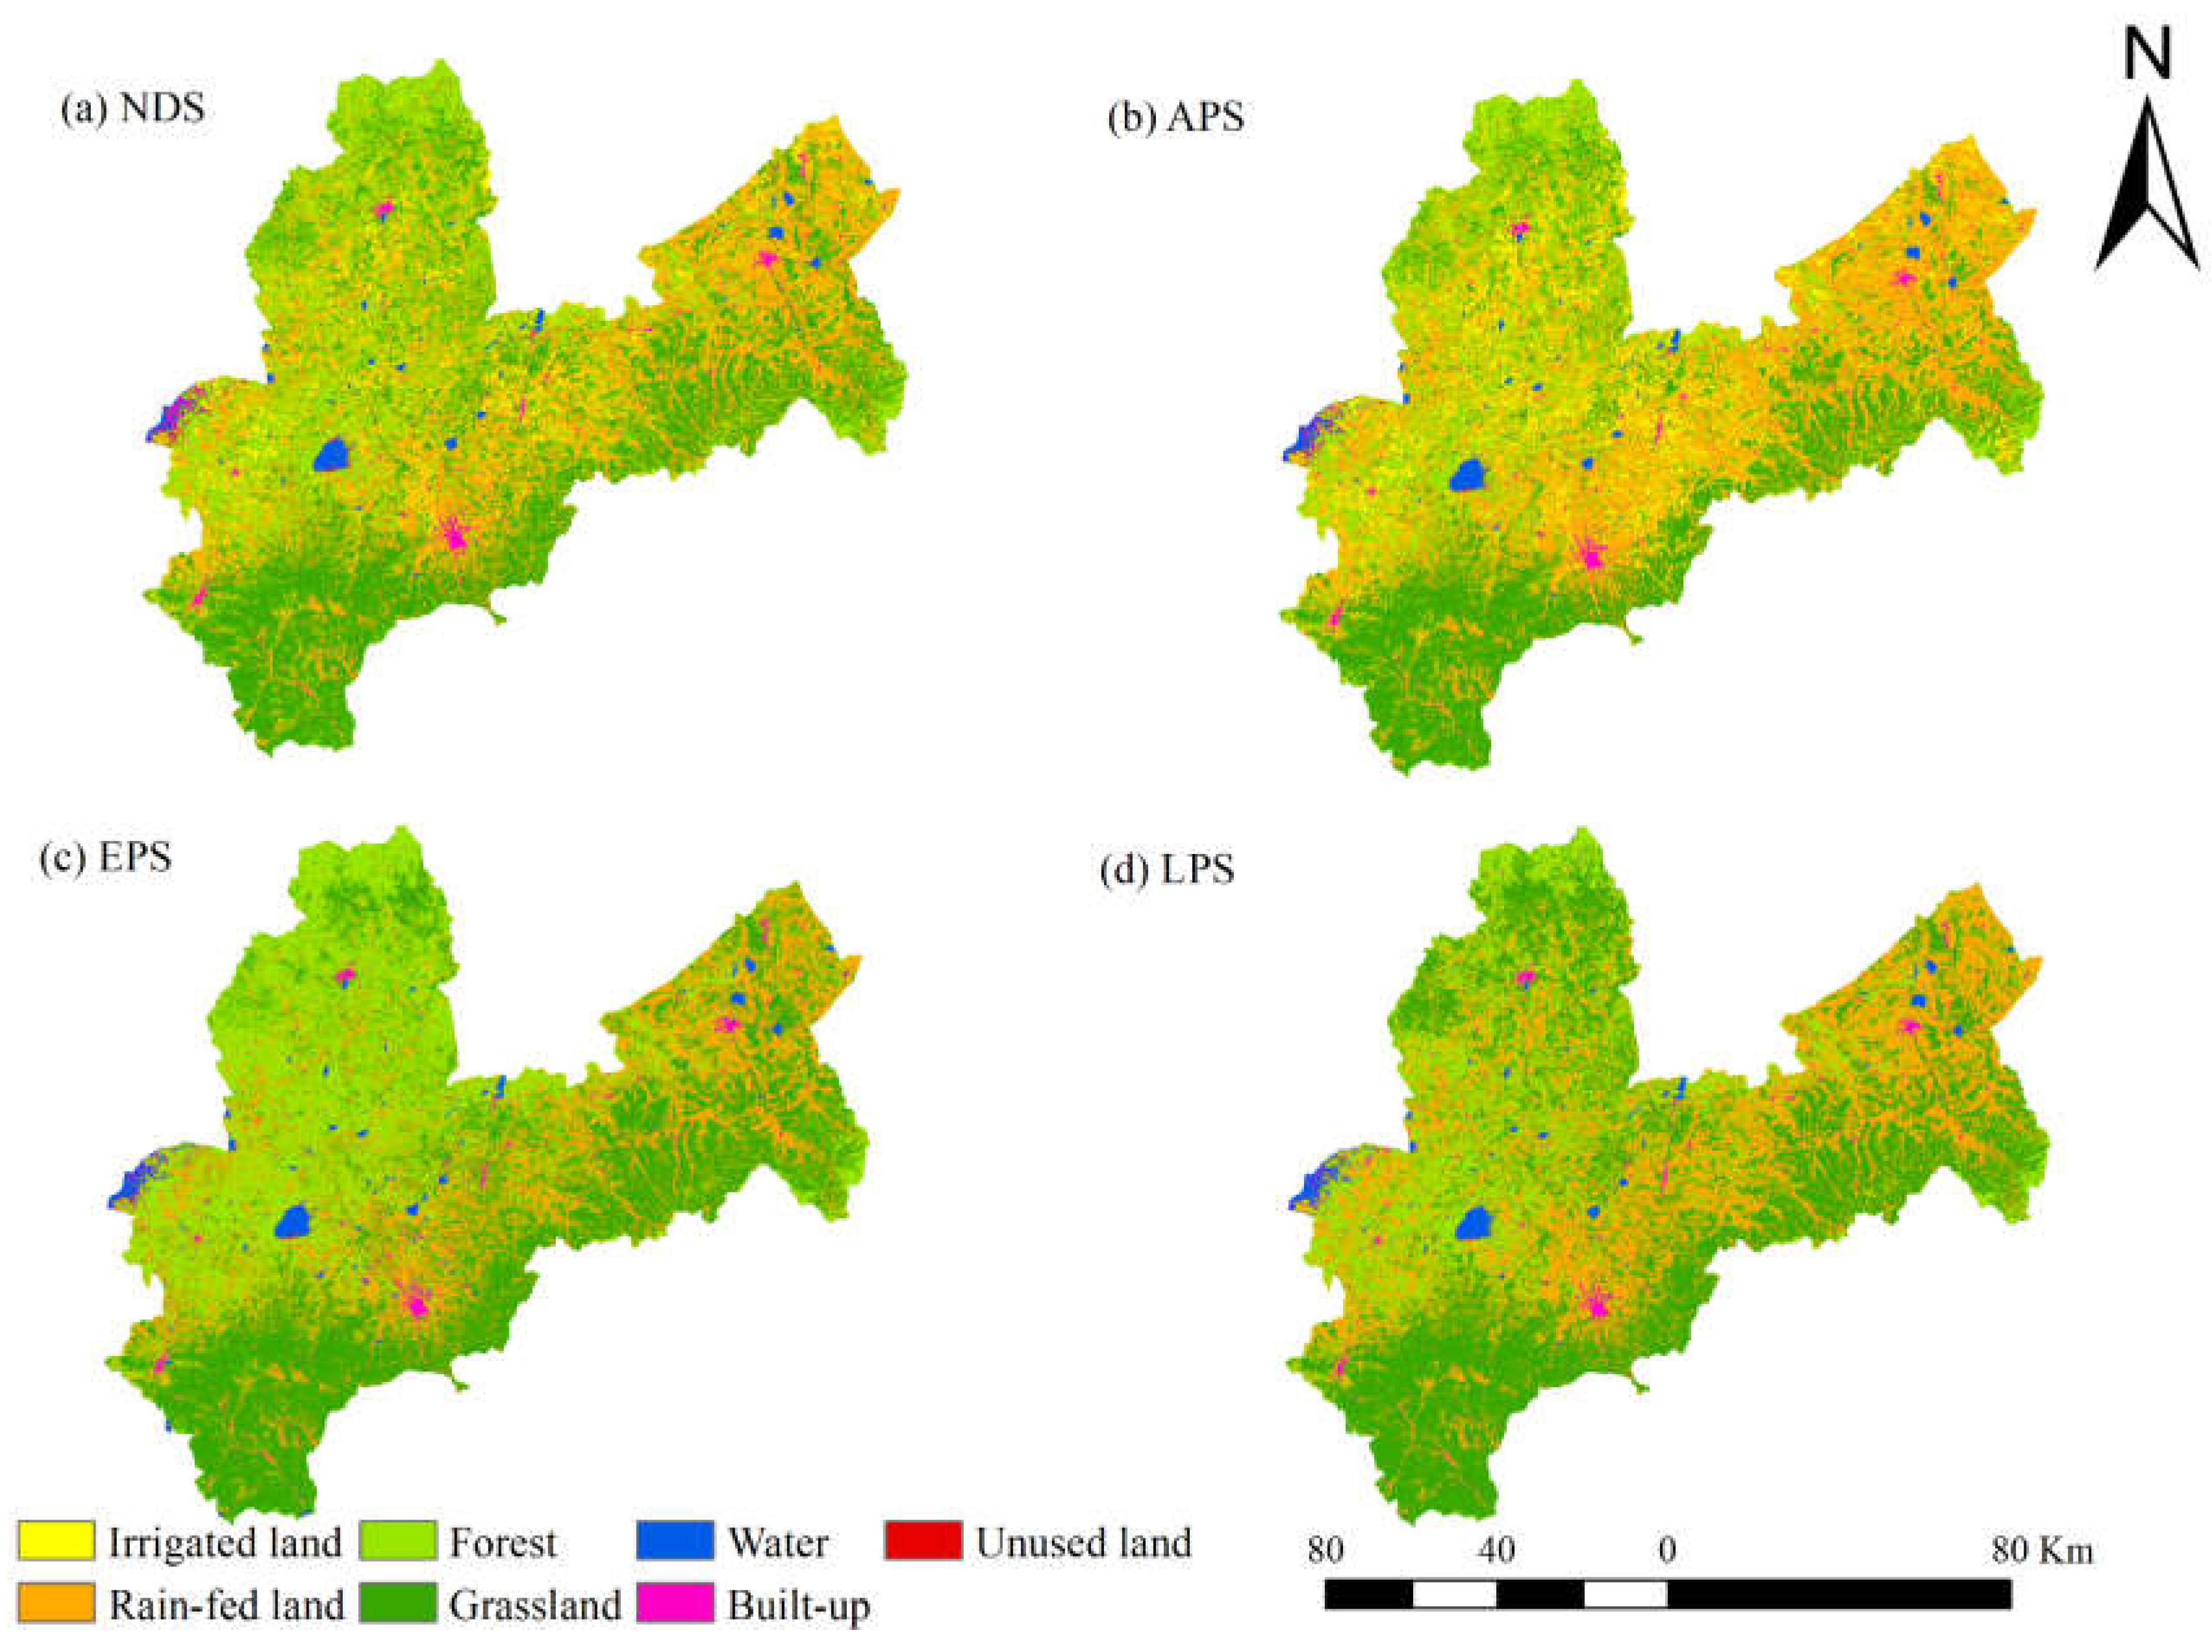
Figure 6.
Percentage of different scenarios of LULC in 2020 and 2035.
Figure 7.
Status of water yield and LULC in the sub-basin in 2020.
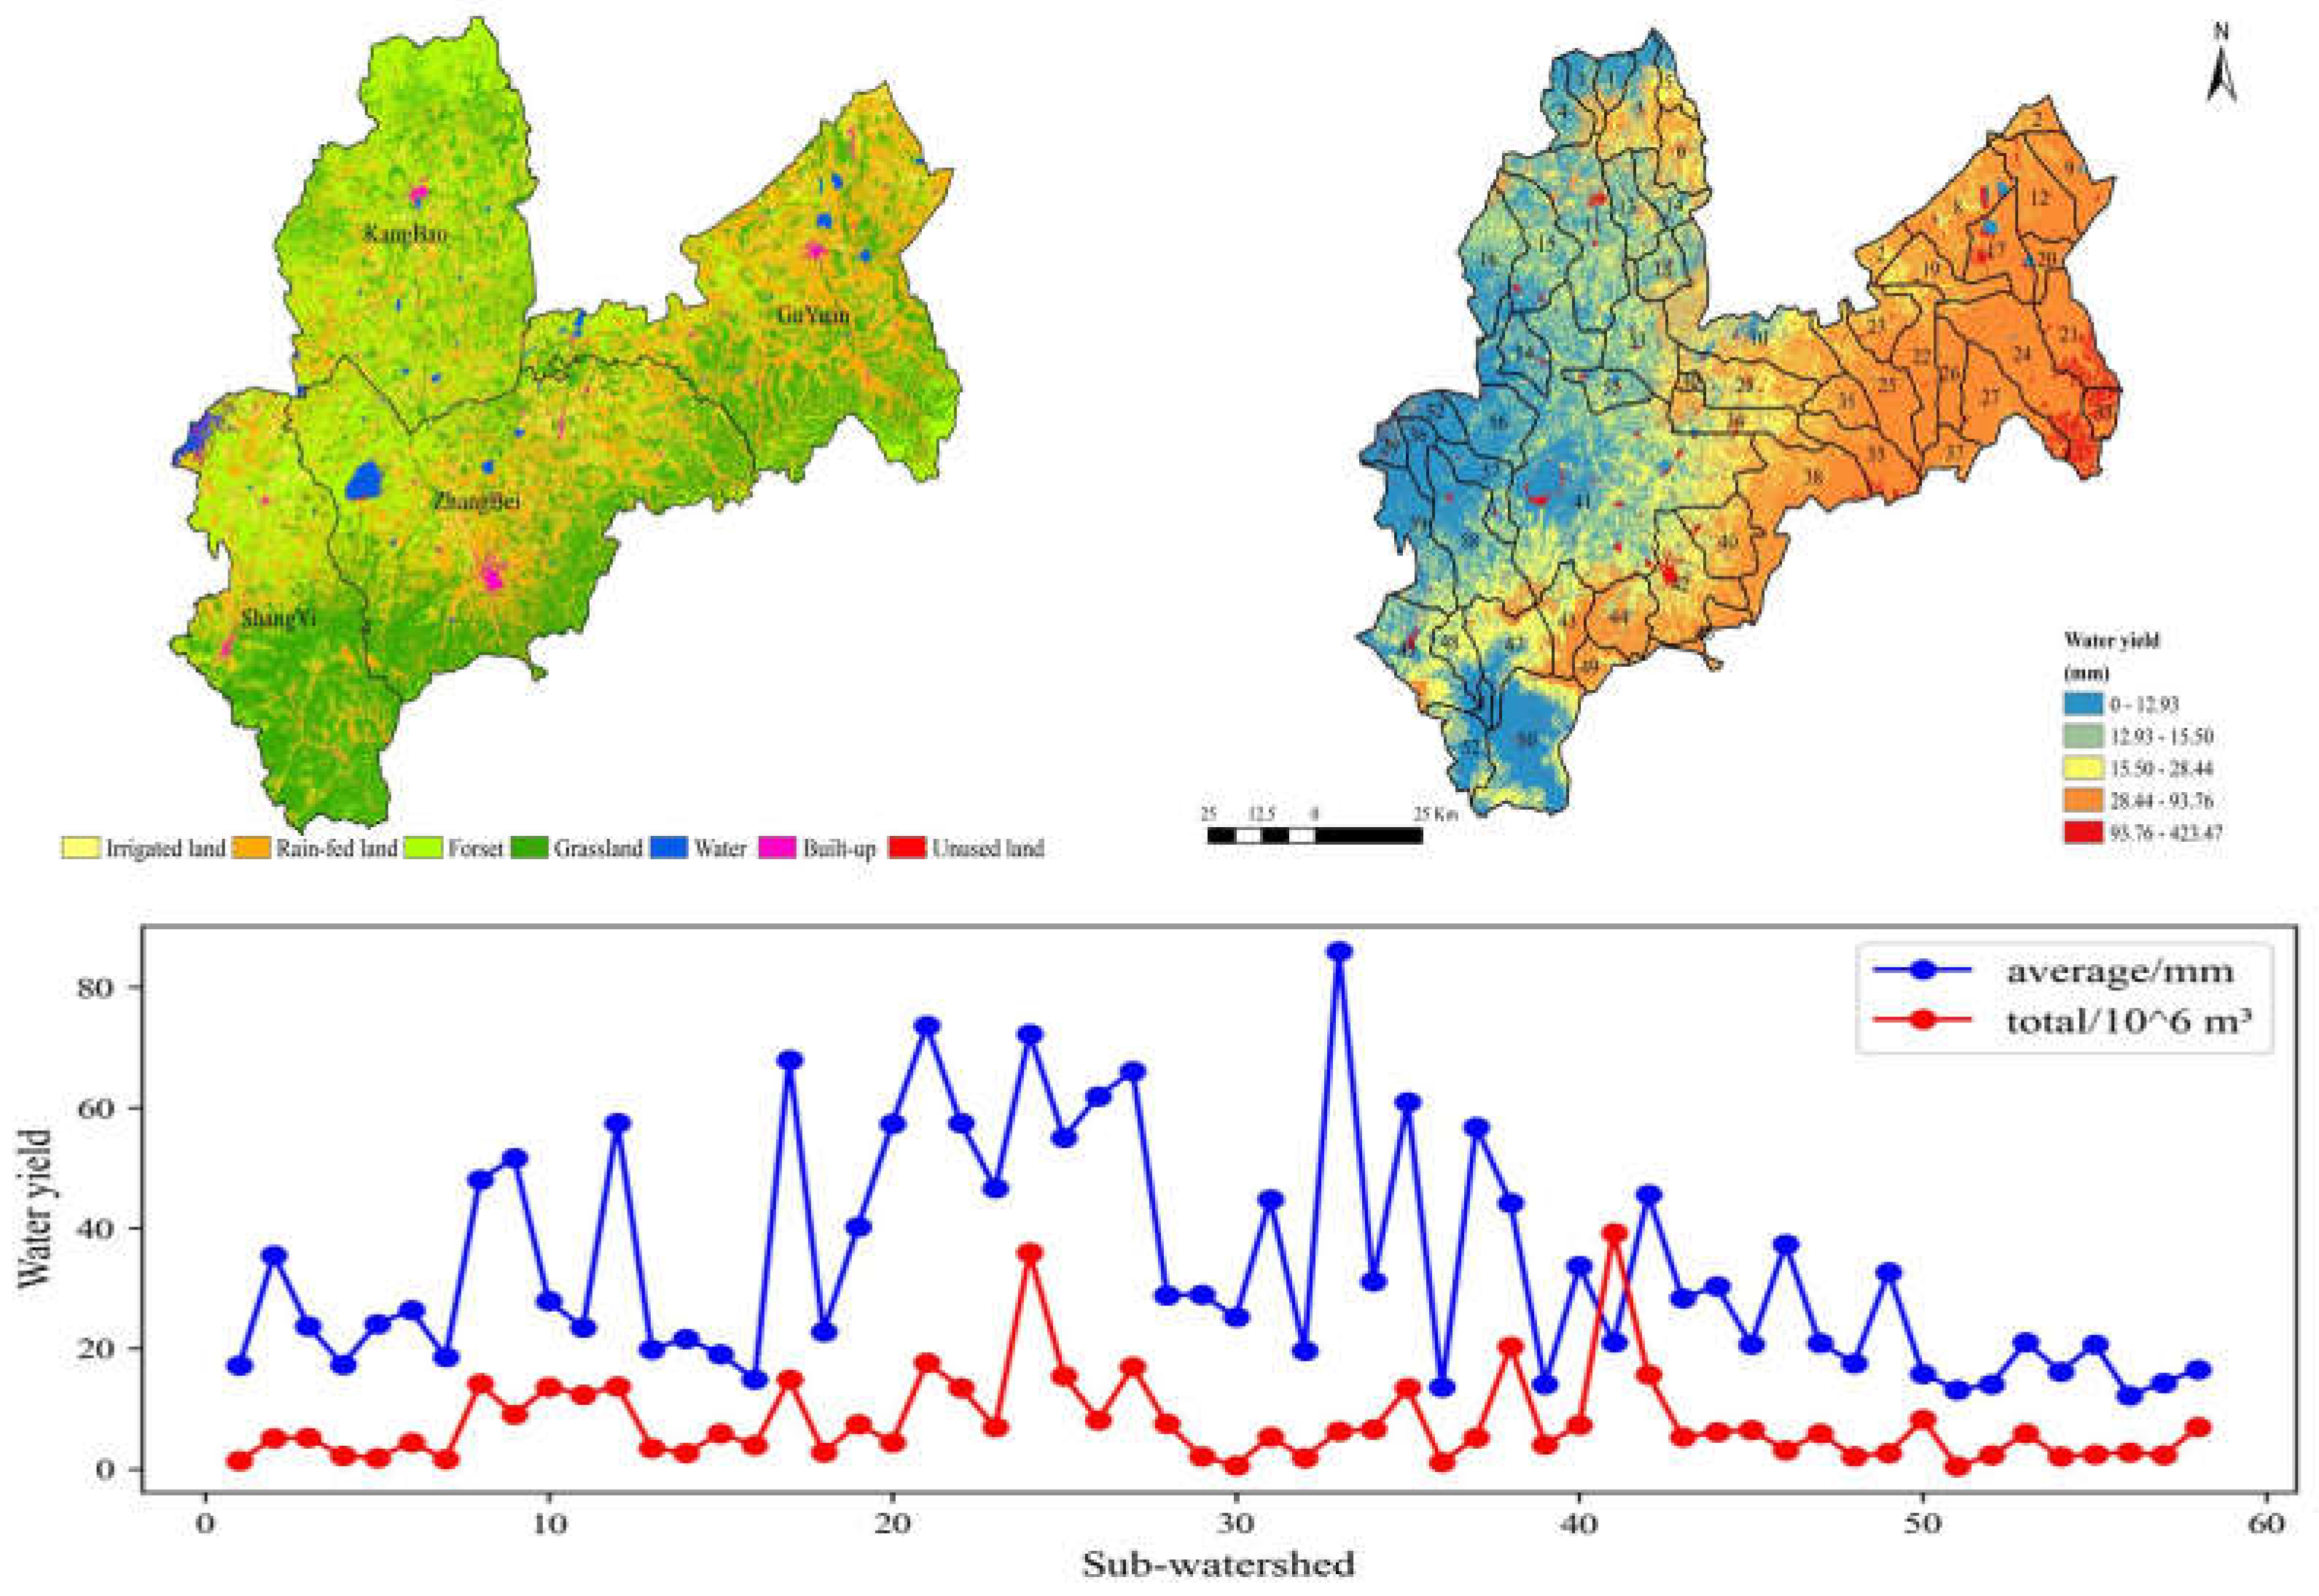
Figure 8.
Current spatial distribution of water conservation capacity and drivers in 2020.
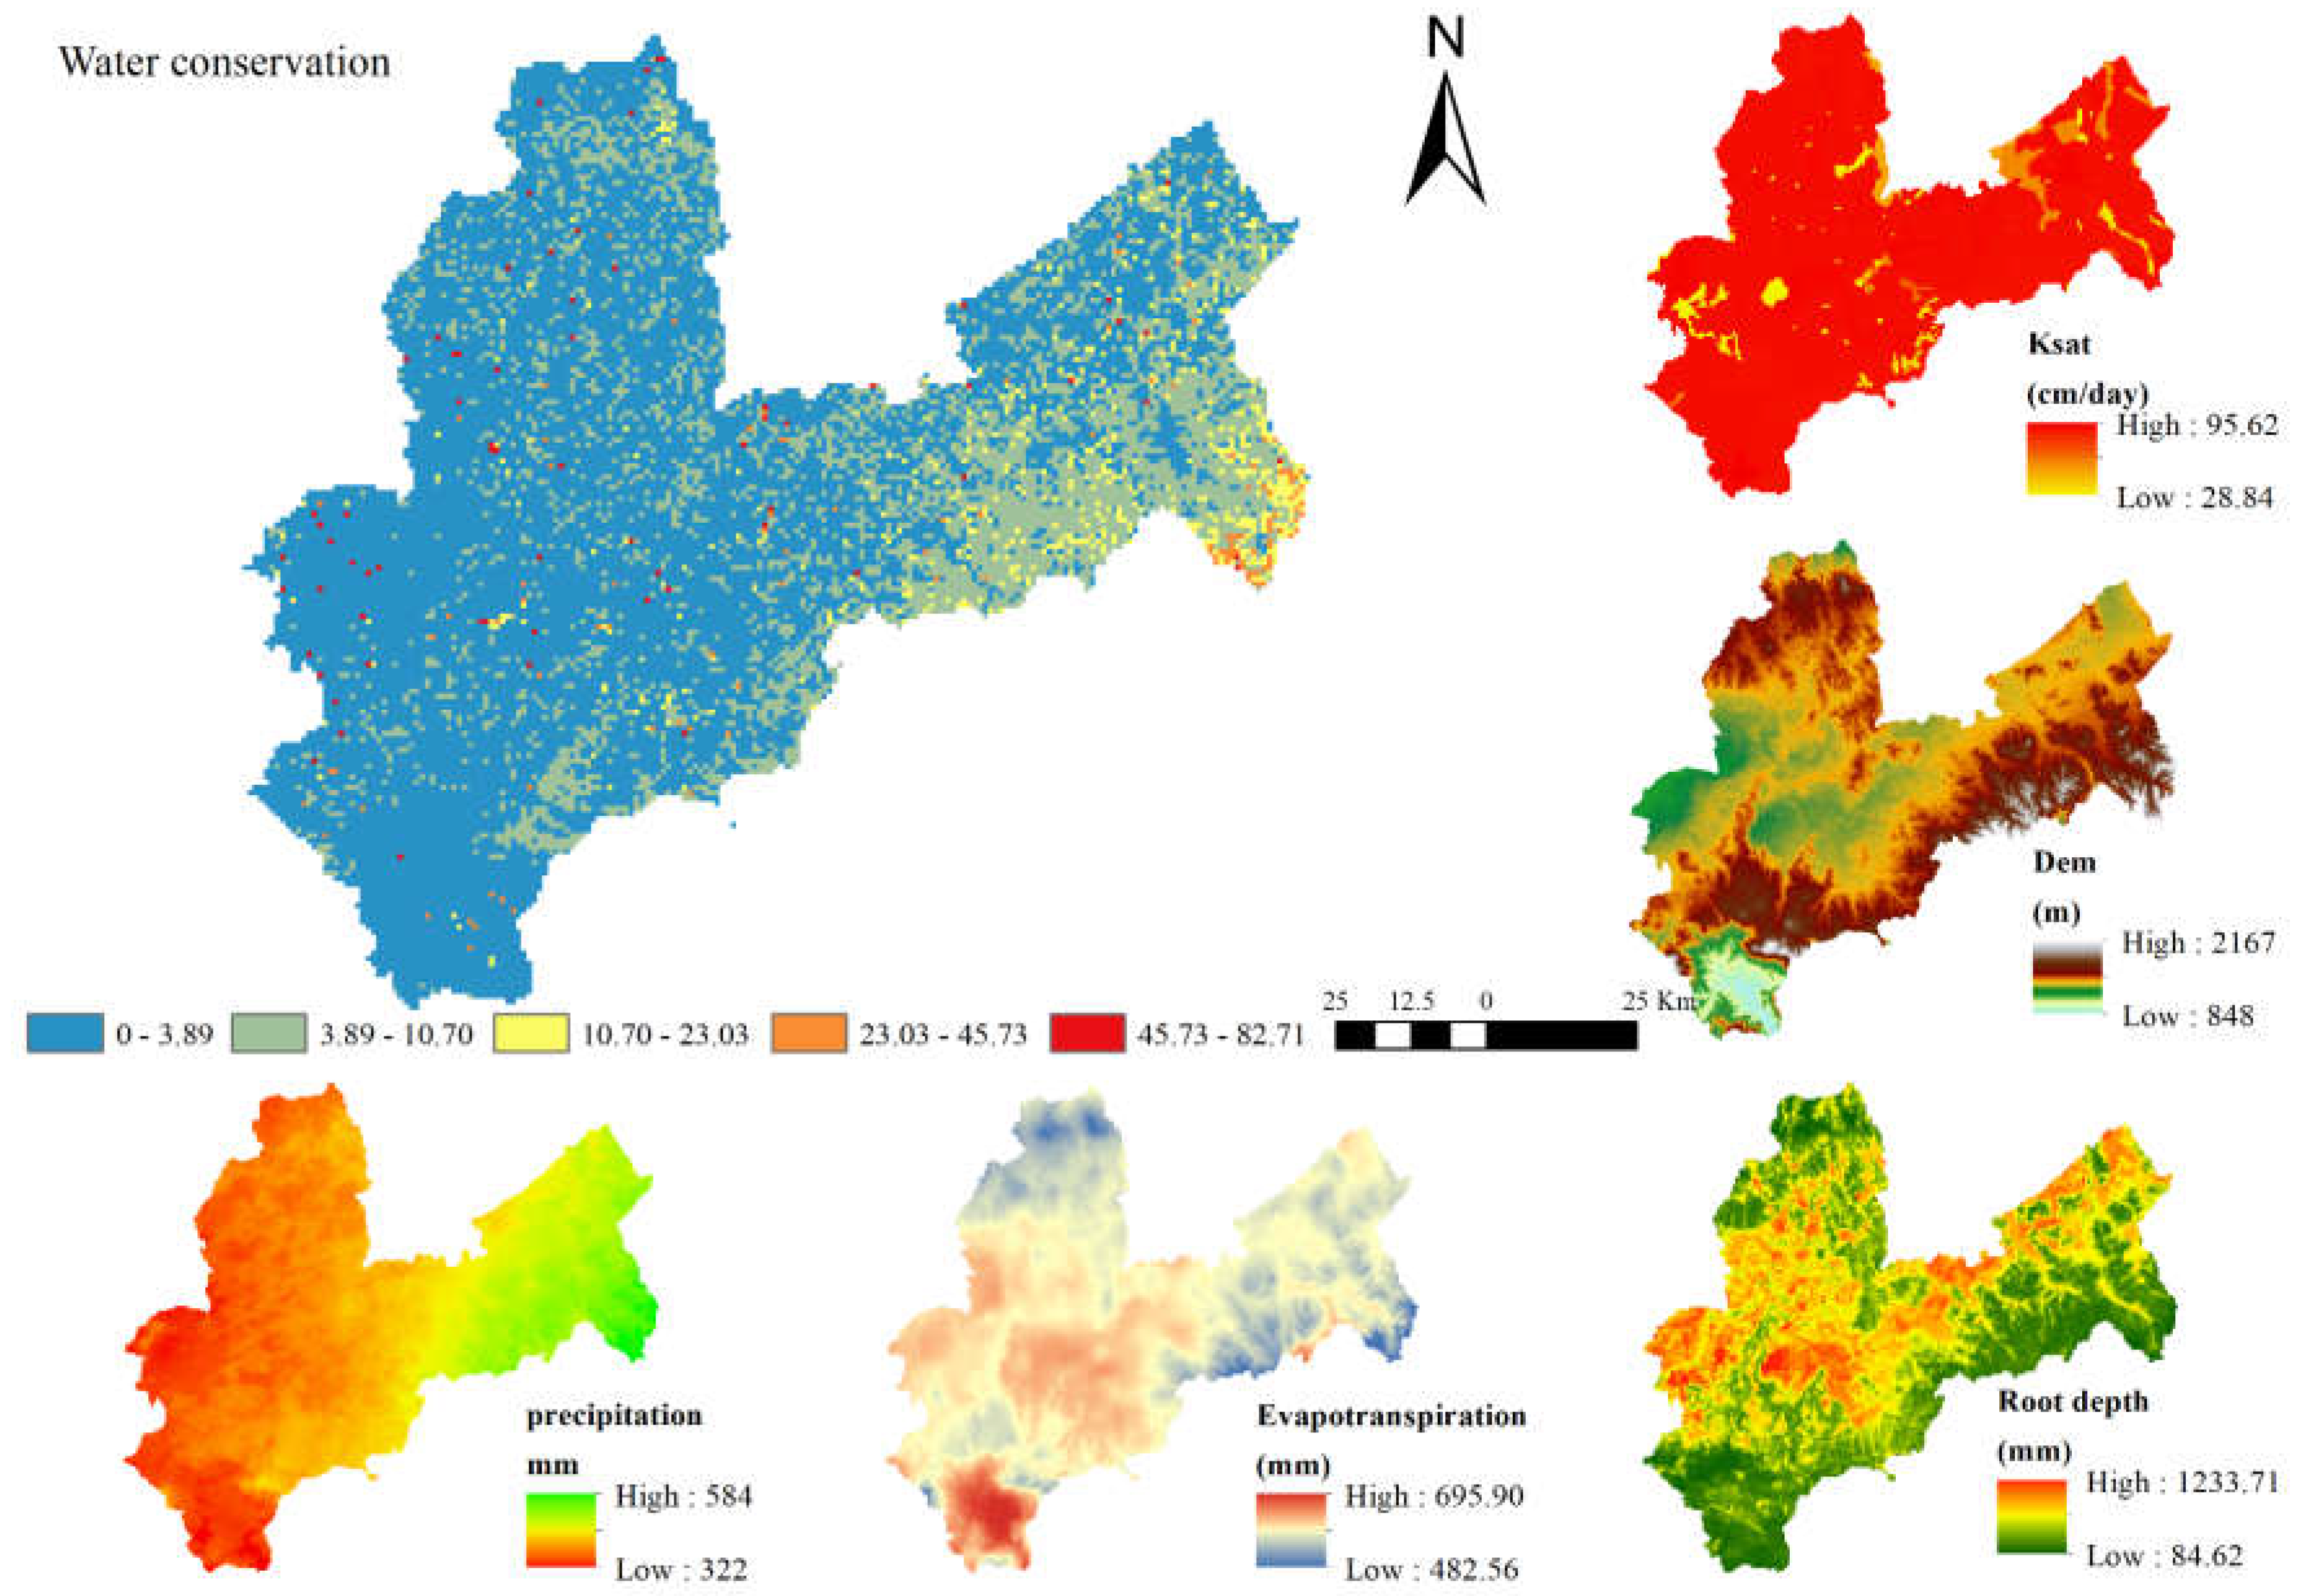
Figure 9.
Correlation analysis of drivers of water conservation capacity.
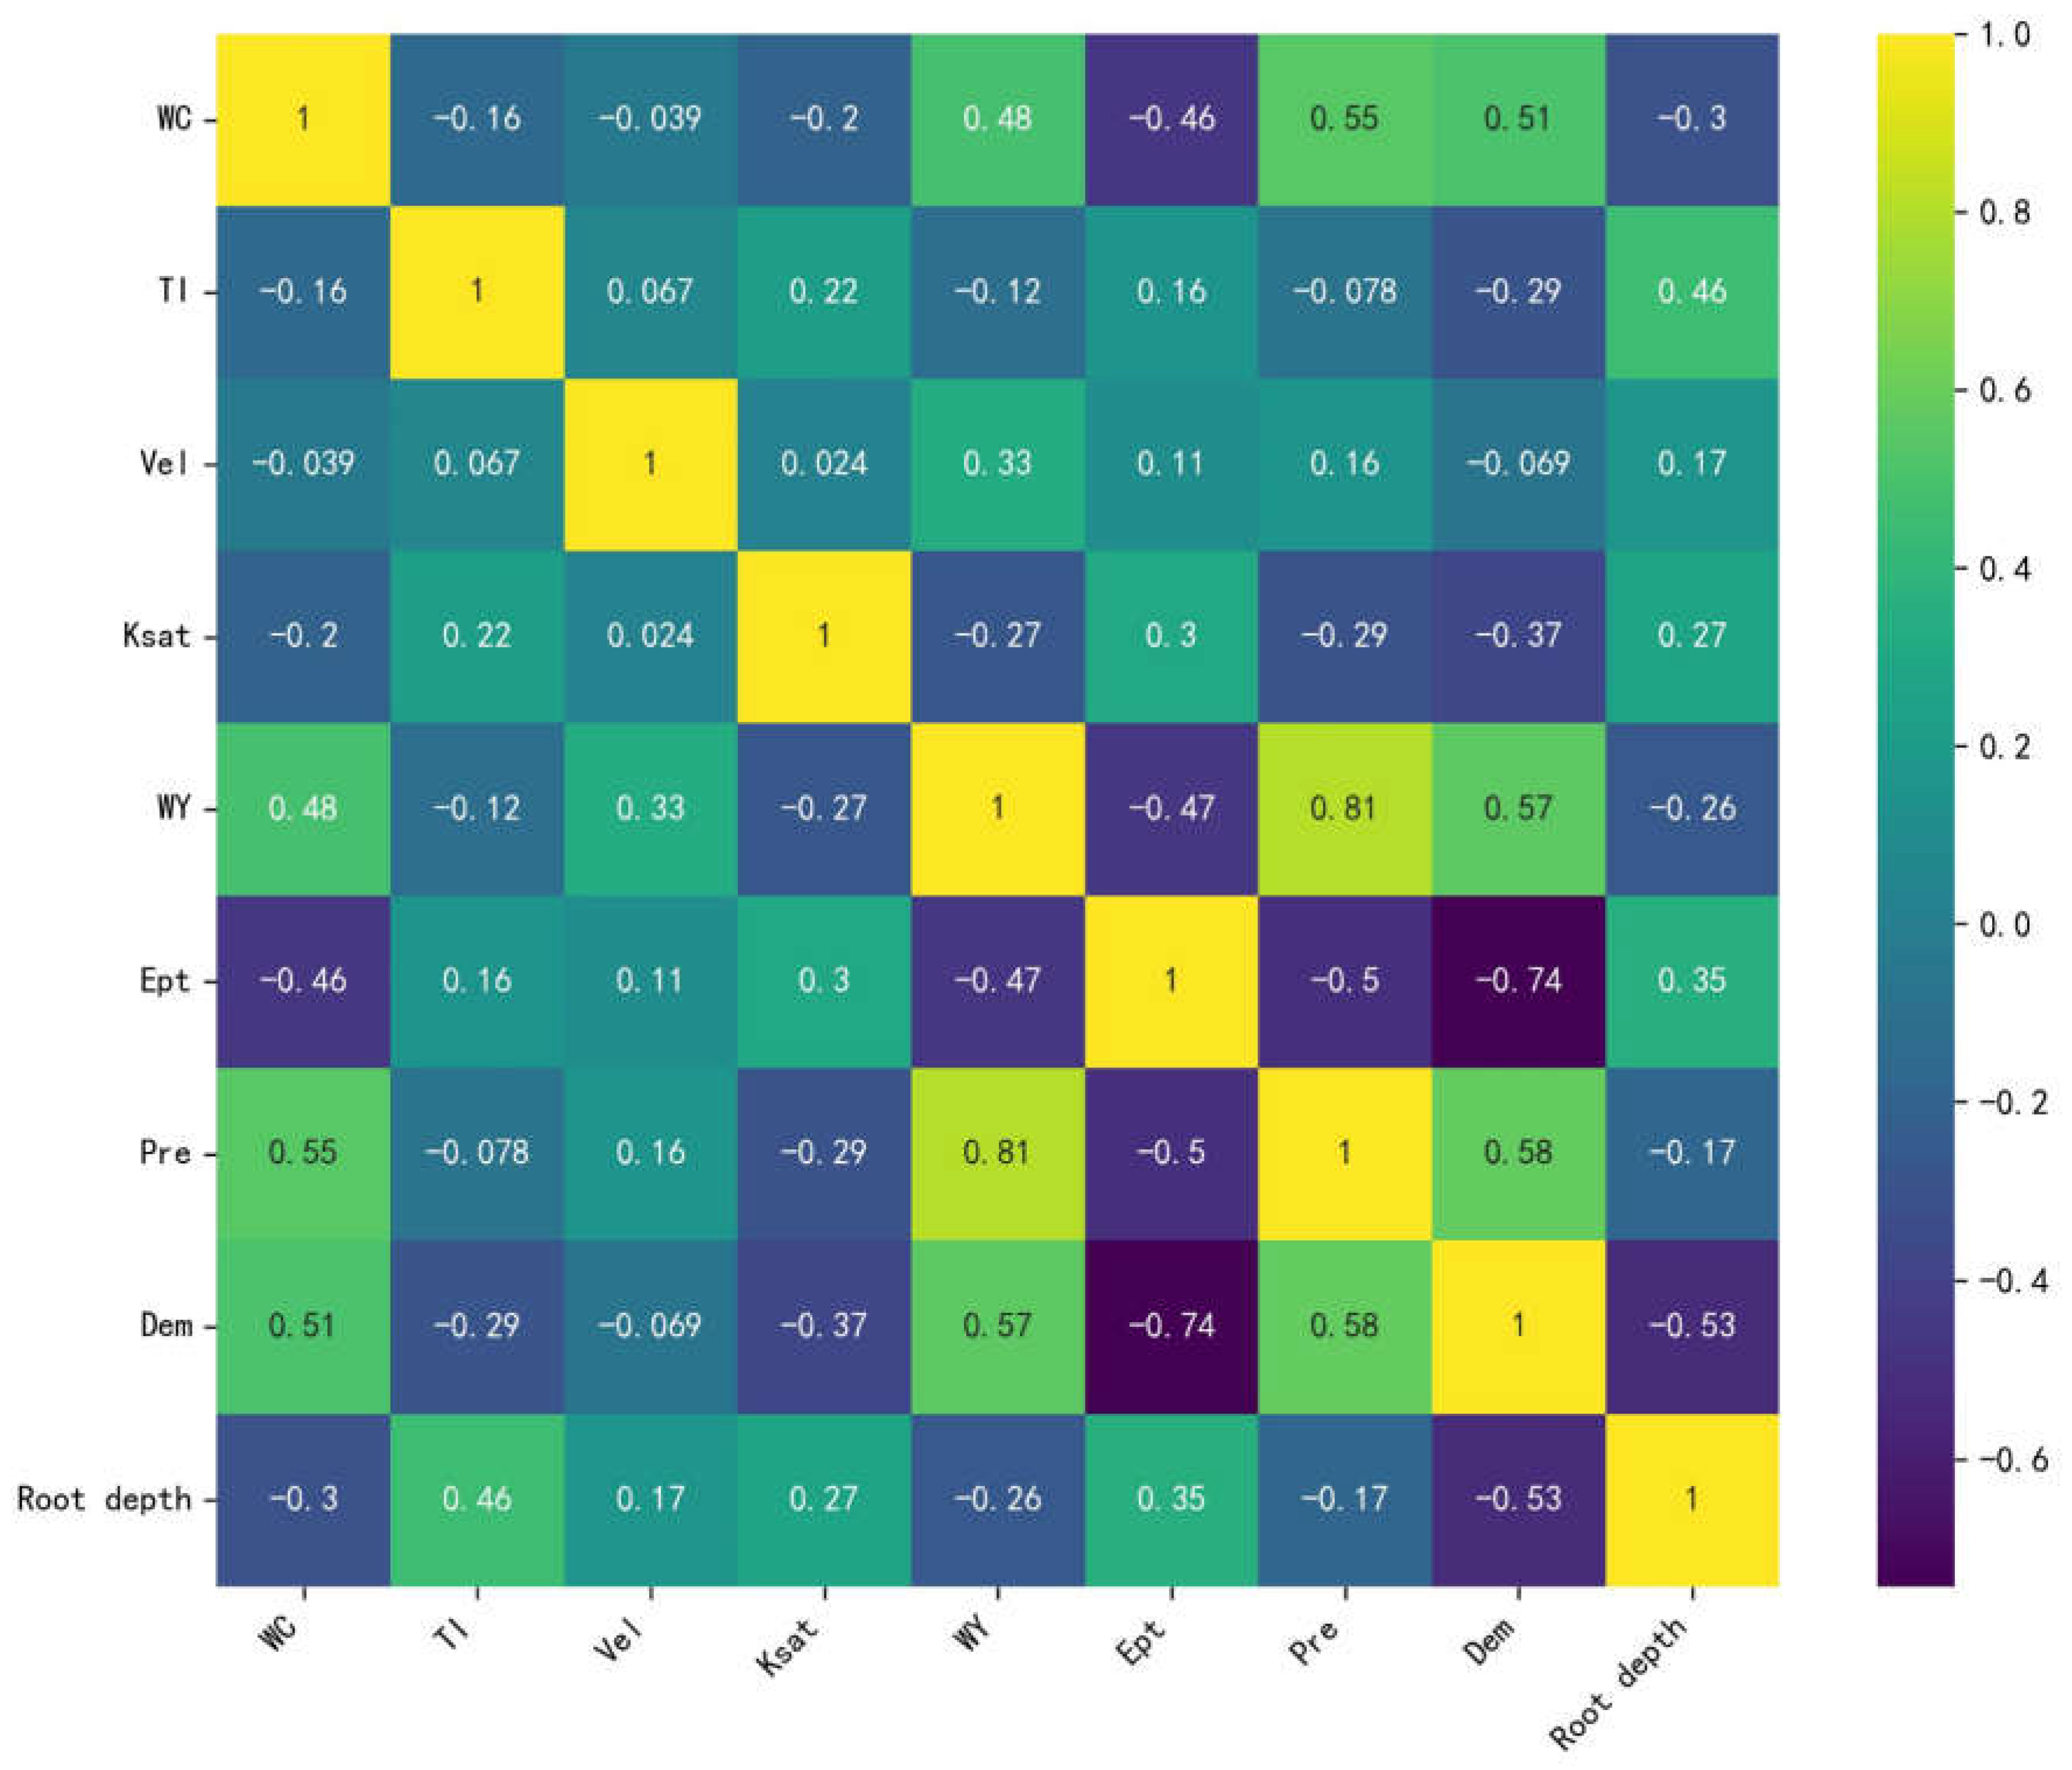
Figure 10.
Spatial variation of WY across the four scenarios in 2035.
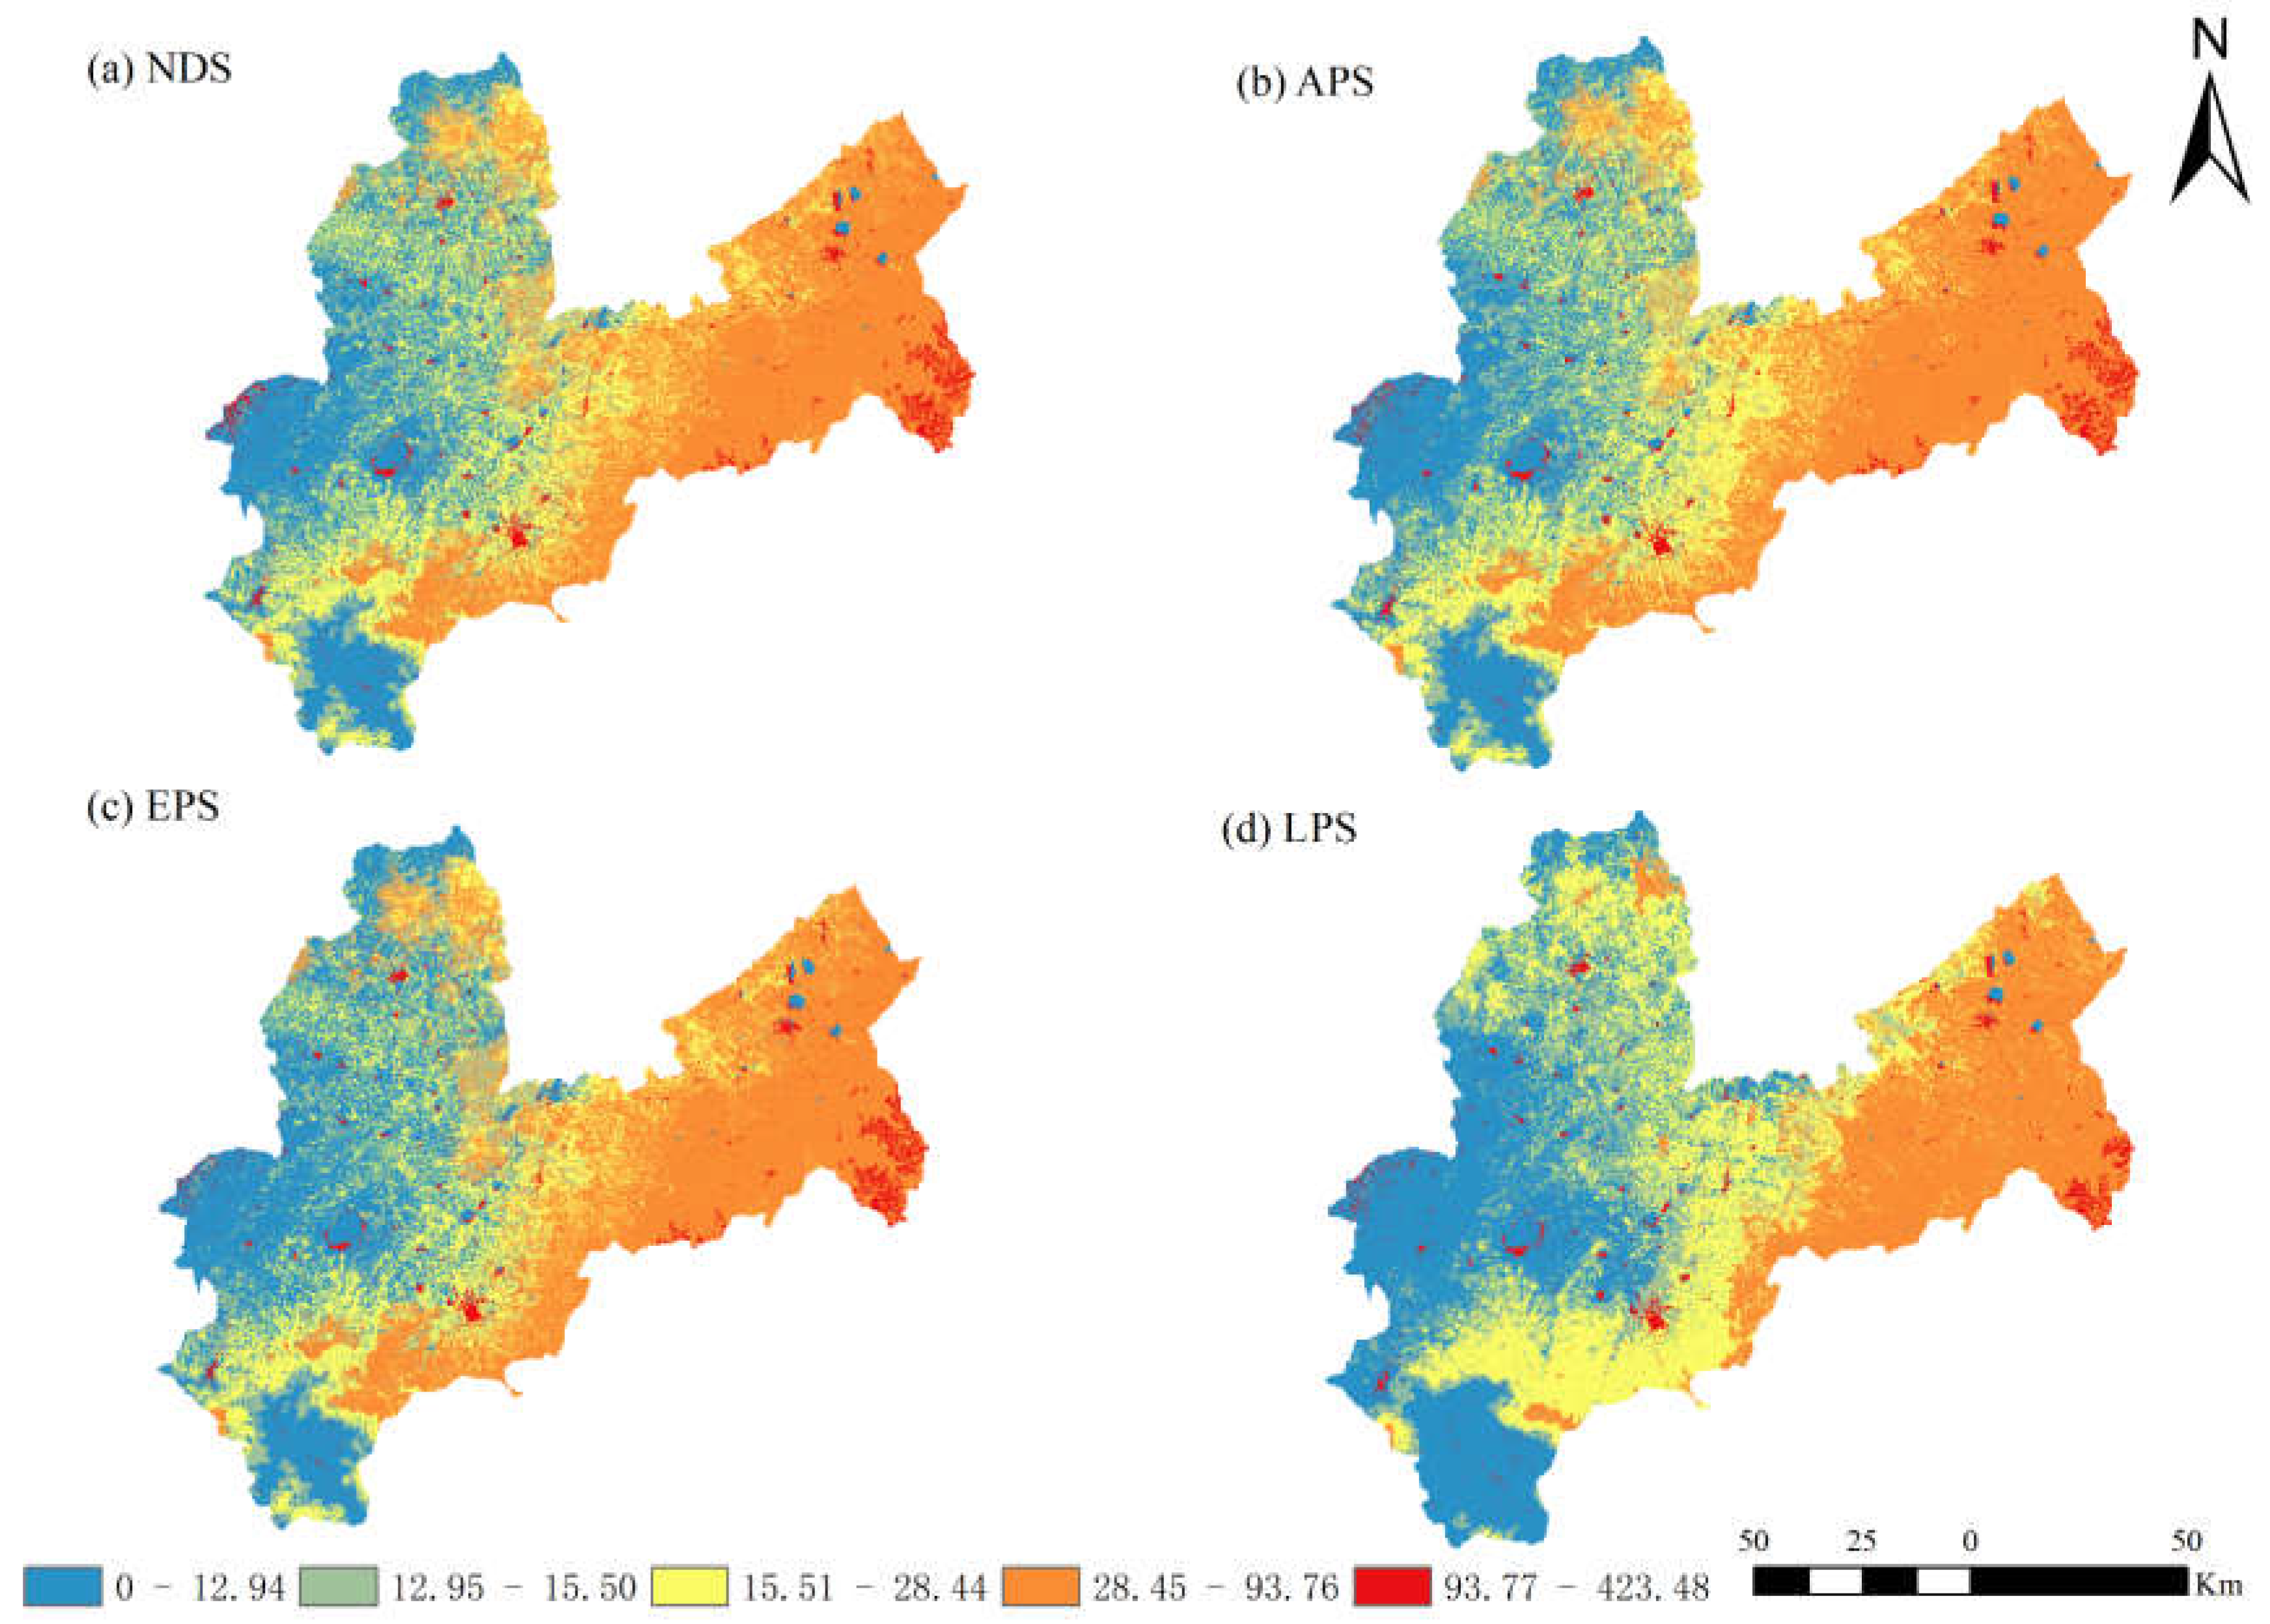
Figure 9.
Spatial distribution of WCC for the different scenarios in 2035.
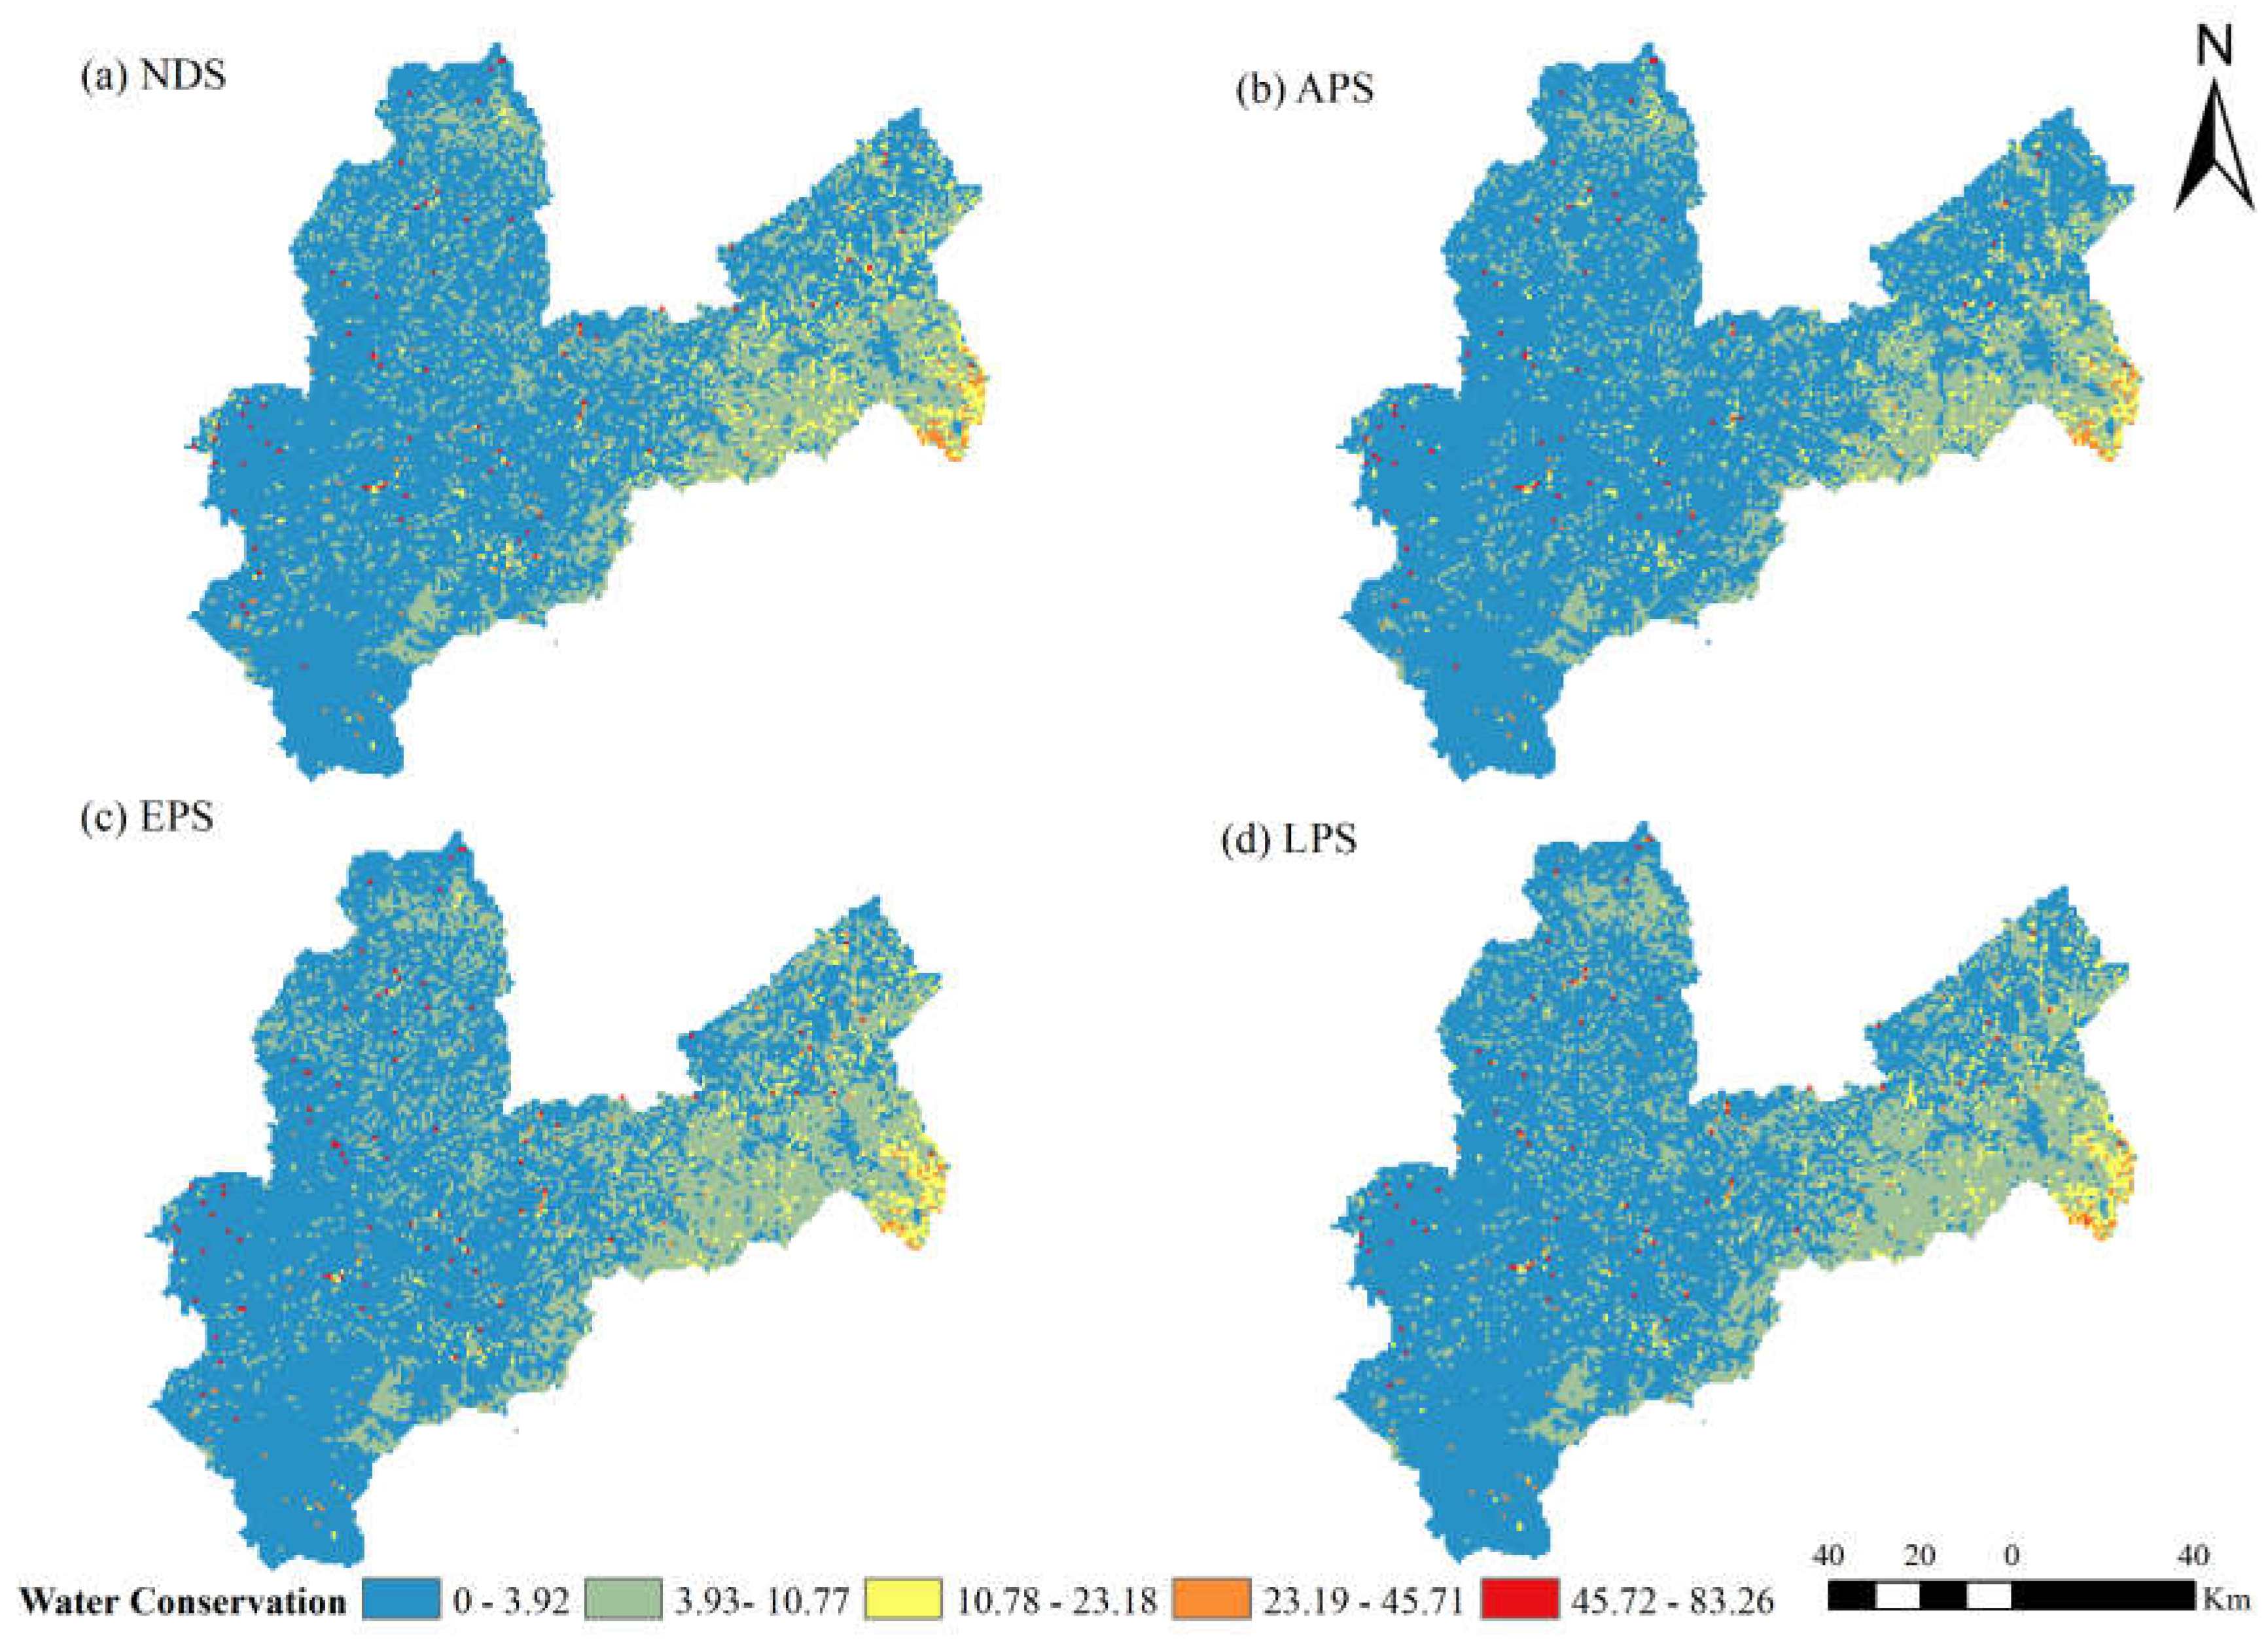
Figure 10.
The average WCC across different land-use types for the different scenarios in 2035.
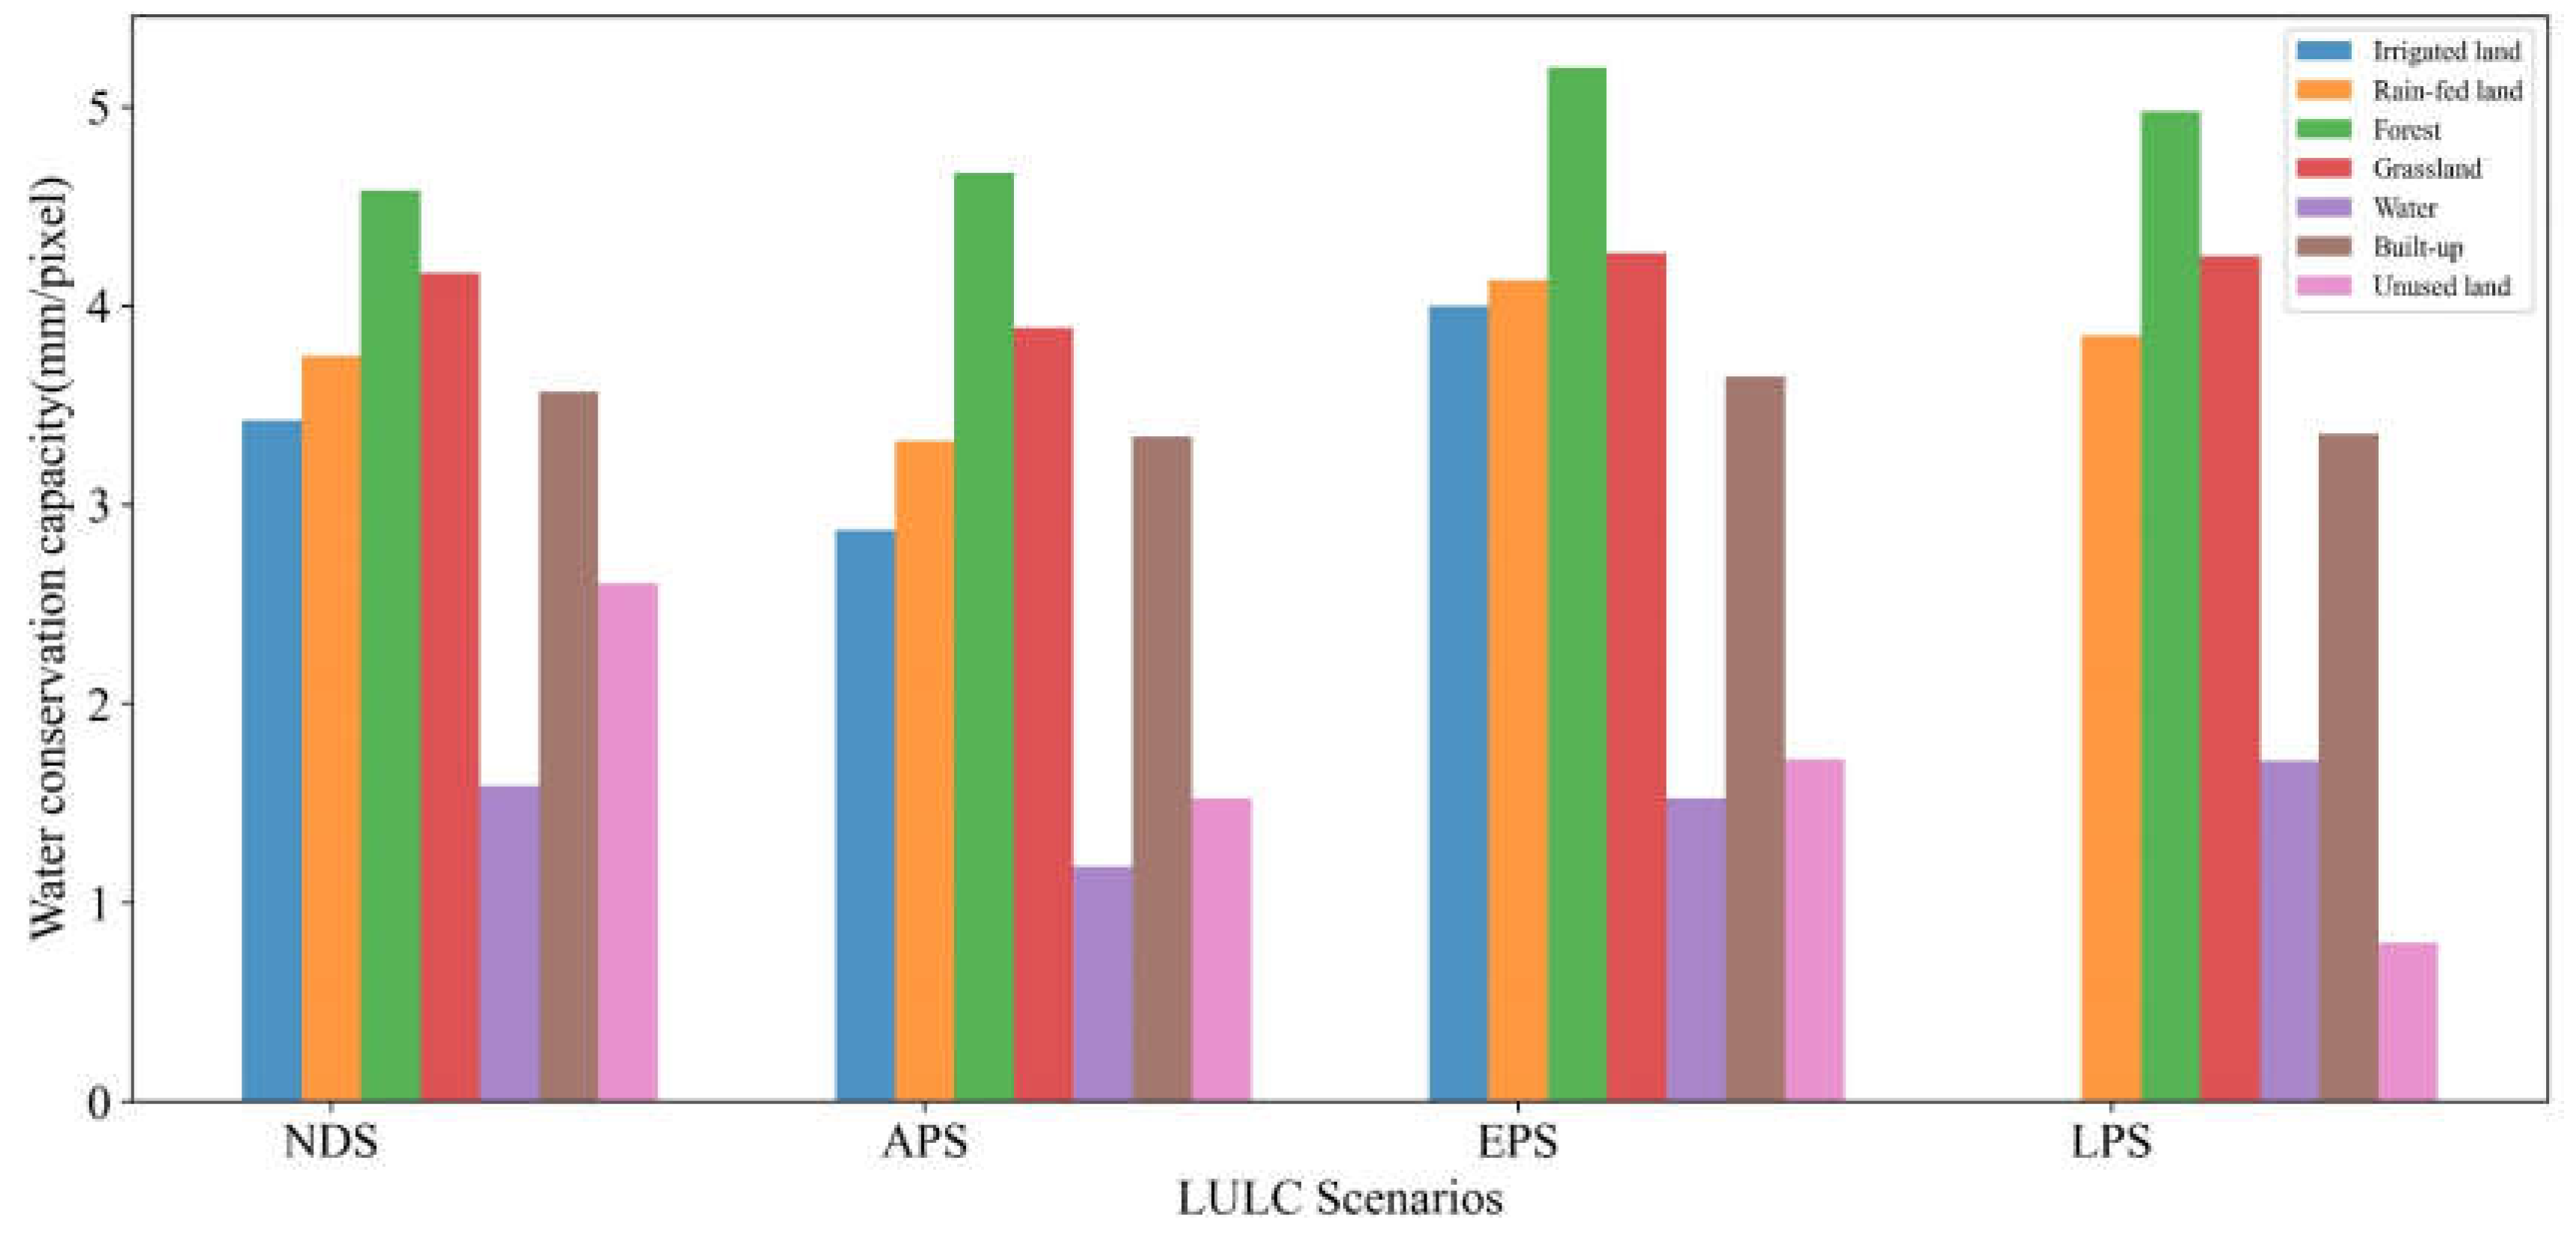

Table 1.
Sources of data acquisition.
| Data Type | Data Name | Data Source |
| LULC data | LULC from 1990 to 2020 | Resources and environment science data platform https://www.resdc.cn/ |
| Natural environment | Elevation | Geospatial data cloud (https://www.gscloud.cn) |
| Slope | Extraction from elevation | |
| Aspect | ||
| Average monthly temperature | National Tibetan Plateau Data Center | |
| Average monthly precipitation | ||
| Potential evapotranspiration | ||
| Percentages of sand, clay, silt and organic carbon | Food and Agriculture Organization of the United Nations (FAO, https://www.fao.org/) | |
| Soil Type | Resources and environment science data platform (https://www.resdc.cn/) | |
| Accessibility factors | Distance from main | Geospatial data cloud (https://www.gscloud.cn) |
| road, distance from | ||
| main railway | ||
| Socioeconomic | Population density, | Resources and environment science data platform (https://www.resdc.cn/) |
| gross domestic product | ||
| (GDP) |
Table 2.
Physiological coefficients for different land use types.
| LULC | LULC_veg | Root_depth | Kc |
| Irrigated land | 1 | 300 | 0.954 |
| Rain-fed land | 1 | 300 | 0.865 |
| Forest | 1 | 3500 | 1.009 |
| Grassland | 1 | 500 | 0.8 |
| Water area | 0 | 0 | 1.05 |
| Built-up land | 0 | 1 | 0.2 |
| Unused land | 0 | 0 | 0.6 |
Table 3.
Land-use transfers as a percentage, 1990 – 2020.
| Geoinformation Tupu Type | Area/Km² | Proportion | Characteristics |
| The stable type | 6023.9727 | 43.78% | The LULC remained unchanged from 1990-2020 |
| The continuous-change type | 1334.3436 | 9.70% | The LULC changed in 1990-2005/2005-2020 without repeated types |
| The repeated-change type | 943.029 | 6.85% | The LULC changed in the early stages as opposed to the later stages |
| The later-change type | 1628.1585 | 11.83% | The LULC changed in the period of 2005-2020 |
| The early-change type | 3828.9078 | 27.83% | The LULC changed from 1990 to 2005 but did not change from 2005 to 2020 |
Table 4.
Total water yield, average water yield and water conservation capacity for different scenarios in 2035.
Table 4.
Total water yield, average water yield and water conservation capacity for different scenarios in 2035.
| Scenario | Water Yield | Water Conservation Capacity | ||
| Mean(mm/pixel) | Total(106 m3) | Mean(mm/pixel) | Total(106 m3) | |
| 2020 | 32.720 | 446.063 | 3.820 | 27.027 |
| 2035 NDS | 33.362 | 454.808 | 3.801 | 26.556 |
| 2035 APS | 32.885 | 448.317 | 3.418 | 24.031 |
| 2035 EPS | 32.714 | 446.328 | 3.875 | 28.464 |
| 2035 LPS | 35.066 | 478.092 | 3.990 | 27.701 |
Disclaimer/Publisher’s Note: The statements, opinions and data contained in all publications are solely those of the individual author(s) and contributor(s) and not of MDPI and/or the editor(s). MDPI and/or the editor(s) disclaim responsibility for any injury to people or property resulting from any ideas, methods, instructions or products referred to in the content. |
© 2025 by the authors. Licensee MDPI, Basel, Switzerland. This article is an open access article distributed under the terms and conditions of the Creative Commons Attribution (CC BY) license (http://creativecommons.org/licenses/by/4.0/).
Copyright: This open access article is published under a Creative Commons CC BY 4.0 license, which permit the free download, distribution, and reuse, provided that the author and preprint are cited in any reuse.


