
Submitted:
18 July 2024
Posted:
18 July 2024
You are already at the latest version
Abstract
Understanding the interrelationships between land use, climate change, and regional water yield is critical for effective water resource management and ecosystem protection. However, comprehensive insights into how water yield evolves under different land use scenarios and climate change remain elusive. This study employs the Integrated Valuation of Ecosystem Services and Trade-offs (InVEST) models, Patch-generating Land Use Simulation (PLUS) model, and Geodetector within a unified framework to evaluate the dynamics of land use, water yield, and their relationships with various factors (meteorological, social, economic, etc.). To forecast the Land Use/Cover Change (LUCC) pattern of the Yellow River Basin by 2030, three scenarios were considered: economic development priority (Scenario1), ecological development priority(Scenario2), and cropland development priority(Scenario3). Climate change scenarios were constructed using CMIP6 data, representing low stress (SSP119), medium stress (SSP245), and high stress (SSP585) conditions. The results show the following: (1) From 2000 to 2020, cropland was predominant in the Yellow River Basin, Henan Province, with significant land conversion to impervious land (construction land) and forest land; (2) Water yield changes during this period were primarily influenced by meteorological factors, with land use changes having negligible impact; (3) By 2030, the water yield of Scenario1 is highest among different land use scenarios, marginally surpassing ecological development priority by 0.5%; (4) Climate scenarios reveal significant disparities, with SSP126 yielding 67% higher water production than SSP245, driven predominantly by precipitation; (5) Geodetector analysis identifies precipitation as the most influential single factor, with significant interactions among meteorological and socio-economic factors. These findings offer valuable insights for policymakers and researchers in formulating land use and water resource management strategies.
Keywords:
PLUS model
; InVEST model
; water yield
; land use/land cover
; geodetector
1. Introduction
Ecosystem services refer to the benefits that humans derive from ecosystems[1,2]. Rapid economic and social development has led to increased human intervention and encroachment on ecosystems, putting immense pressure on the natural environment. This is evidenced by the sharp decrease in crop areas, water shortages, land desertification, grassland degradation, mining activities, and threats to biodiversity. Currently, about 60% of the ecosystem services provided by natural ecosystems—such as wetlands, forests, grasslands, rivers, and coasts—are degraded or used unsustainably[3].
Water is a key component of ecosystems, providing habitat and material circulation for plants and animals[4,5]. It also produces water-related ecosystem services[6,7,8], which are crucial for maintaining ecosystem functions, ensuring water supply, promoting agricultural production, and regulating arid climates[9,10,11]. Water yield, an important aspect of ecosystem services, estimates freshwater inputs, such as rain, snow, and snowmelt, flowing into streams and rivers. Factors affecting water yield include precipitation, evapotranspiration, basin size and location, and the primary source of water (rainfall or snowmelt). Consequently, water yield is essential for the healthy development of society and ecosystems.
The evolution of human societies has influenced water volume dynamics in numerous ways. As society transitioned from hunter-gatherer communities to industrial societies, water demand increased exponentially, resulting in extensive irrigation practices and engineered waterways[12]. This shift altered natural water yield patterns. Water yield services describe water availability in a basin[13,14]. Evapotranspiration and precipitation primarily affect a basin's water yield service, which is essentially the difference between precipitation and evapotranspiration[15,16]. Climate and land use significantly impact water yield. Currently, global warming and rapid urban expansion are causing shifts in evapotranspiration and precipitation, potentially decreasing total water volume [17,18,19,20]. Quantifying and distinguishing the effects of climate and land use changes on water yield is crucial for protecting and allocating water resources within and between regions[21,22,23,24,25]. Yin et al.[26] found that water consumption variability was strongly related to irrigation expansion and ecological restoration, which dominated high water yield variability in the midstream Yellow River basin (95.73% ± 0.5%). Intensive land use changes, such as deforestation, agricultural expansion, and urban sprawl, have drastically altered the natural landscape, directly affecting local and regional water cycles and water yield[27,28]. These activities reduce water volumes by decreasing infiltration and increasing evapotranspiration. Additionally, climate change, a consequence of social progress, complicates the issue further. Rising temperatures and altered precipitation patterns dramatically change the timing and magnitude of water yield, exacerbating water shortages during dry periods and increasing flood risks during wet periods[29]. Therefore, evaluating the impact of land use and climate change on water yield and analyzing its core driving forces are crucial for understanding the changes and mechanisms in ecosystem water yield under human development.
Ecological protection and high-quality development of the Yellow River Basin are major strategies in China[30]. The regional water resources-economic-ecosystem is a crucial complex system, where the development and utilization of water resources are based on ecological and economic principles[31,32]. Rapid socioeconomic development in Henan Province has led to increasingly prominent problems of unbalanced and inadequate development, particularly conflicts among water resources, economic development, and the ecological environment[33,34]. The Yellow River Basin in Henan Province includes both mountainous and plain areas, with abundant forests and farmlands. It is one of China's most important grain-producing and mineral resource areas. In recent years, rapid economic development and continuous urban expansion have led to frequent land use changes. Meanwhile, influenced by global climate change, extreme weather events, such as the exceptionally heavy rainstorm on July 20, 2021, occur from time to time. Under the dual impacts of economic development and climate change, studying the spatiotemporal evolution patterns of water yield in the Yellow River Basin of Henan Province and analyzing the main driving factors are crucial. This research is essential for strengthening water resources management, implementing new development concepts, and achieving unity between ecological and economic benefits.
Many scholars have studied the evolution patterns and driving factors of water yield. Some focus on land use types or meteorological conditions, which have certain limitations in analysis. Therefore, this paper focuses on the Yellow River Basin in Henan Province. It couples the PLUS model and InVEST model using CMIP6 data to analyze different land use development scenarios and meteorological forecast data. By using the geodetector method to identify the driving forces, this study analyzes and clarifies the main driving mechanisms of land use changes and water yield changes. This research provides a theoretical basis for the intensive use of resources, water resources management, and high-quality, green, and coordinated development in the Yellow River Basin of Henan Province.
2. Study Area and Data Source
2.1. Study Area Overview
The Yellow River Basin in Henan Province is situated between 33°40′ and 36°07′ north latitude and 36°07′ and 116°07′ east longitude. The study area extends approximately 540 km in length and 167 km in width, covering a total area of 36,574 km² (Figure 1). It is primarily located in the northwestern and north-central regions of Henan Province. The westernmost part marks the junction of the middle and lower reaches of the Yellow River, predominantly in the lower reaches. The study area includes nine prefecture-level cities and one provincial county: Zhengzhou, Kaifeng, Luoyang, Xinxiang, Sanmenxia, Hebi, Anyang, Puyang, and Jiyuan. By the end of 2021, the resident population of these areas was 47,790,700, with an urbanization rate of 57.07%, making it one of the most densely populated regions in the Yellow River Basin.
The terrain is higher in the west and lower in the east. The Taihang and Funiu Mountains in the west delineate the boundary between the second and third echelons of China, while the cities in the middle and east lie within the Huang-Huai-Hai Plain. Henan Province, China's largest province in terms of agriculture and resources, holds particular significance in the Yellow River Basin. The western region is rich in mineral resources, including the Luanchuan Lengshui-Chitudian Molybdenum Mine, the world's largest molybdenum mine, located in Luoyang. The eastern plain area boasts extensive farmland and irrigation systems, crucial for ensuring China's food security.
2.2. Data
The data used in this study are categorized into three main types: land use/land cover (LULC) data, meteorological data, and socio-economic data. The meteorological data include historical records and datasets derived from CMIP6 inversion. These data primarily drive the PLUS model and the InVEST model, serving as critical factors for subsequent subsurface probe analysis. The datasets are predominantly sourced from established databases, with some data collected independently. Figure 2 illustrates the data, and Table 1 details the data sources.
2.2.1. Land Use Data
Land use data forms the foundation of this study and is essential for the PLUS model. Land use data from the years 2000, 2010, and 2020 were utilized in this research. The data is sourced from the annual China Land Cover Dataset (CLCD), which is derived from 300,000 Landsat images, incorporating both automatic stabilization samples and visual interpretation samples of existing products[35]. The dataset has a resolution of 30 meters. It is based on 5,463 independent reference samples, with an overall accuracy of 79.31%. The dataset reflects China's rapid urbanization and various ecological projects, illustrating the impact of human activities on regional surface coverage amid climate change. The land use data in this study area are divided into seven categories, including cropland, forest land, grassland, impervious land, water, shrubland, and barren land. And impervious land belongs to construction land. This paper follows the naming method in CLCD data.
2.3.2. Meteorological Data
Meteorological data primarily includes potential evapotranspiration (PET) and precipitation (PRE), with both datasets sourced from the National Tibetan Plateau/Third Pole Environment Data Center (https://data.tpdc.ac.cn/). The PET dataset, published by Prof. Peng Shouzhang's team, was calculated using the Hargreaves model with monthly mean, maximum, and minimum temperatures, and a spatial resolution of 1 km, generated by the Delta downscaling method and a General Circulation Model (GCMs) with four representative concentration pathways (RCP) scenarios[36]. The PRE dataset, published by Prof. Miao Chiyuan's team, is based on daily precipitation observations from 2,839 stations in and around China since 1961. This study applies a monthly precipitation constraint and topographic correction to the traditional dataset construction of the "precipitation background field precipitation ratio field." The accuracy was evaluated using daily precipitation interpolation data from about 40,000 high-density stations in China from 2015 to 2019 [37]. Both datasets are in NetCDF format with a resolution of 1 km. PET and PRE at a resolution of 30 m were obtained through addition and resampling in ArcGIS.

Table 1.
Data set of key drivers of land use change in the Yellow River Basin, Henan Province.
| Data Type | Name | Data resolution/m | Source of Data |
|---|---|---|---|
| Land Use Data | Land Use | 30 | Pixel Information Expert Engine(https://engine.piesat.cn/), [35] |
| Meteorological data | Potential evapotranspiration (PET) | 1000(Resampling to 30m) | National Tibetan Plateau Data Center/ / Third Pole Environment Data Center (https://data.tpdc.ac.cn/home), [38] |
| Precipitation (PRE) | 1000 | National Tibetan Plateau Data Center/ / Third Pole Environment Data Center (https://data.tpdc.ac.cn/home), [39] | |
| Topographic data | DEM Elevation (DEM) | 30 | Aster GDEM v3(https://asterweb.jpl.nasa.gov/gdem) |
| Slope (SLP) | 30 | Calculated by DEM using ArcGIS to obtain | |
| Socio-economic data | GDP | 1000(Resampling to 30m) | Pixel Information Expert Engine(https://engine.piesat.cn/), [40] |
| Population (POP) | 1000(Resampling to 30m) | WorldPop(https://www.worldpop.org/) | |
| Distance to government (DG) | 30(Euclidean distance) | National Catalogue Service For Geographic Information(https://www.webmap.cn/) | |
| Distance to rivers (DRI) | 30(Euclidean distance) | ||
| Distance to first and second-order streams (DFSS) | 30(Euclidean distance) | ||
| Distance to residents (DRE) | 30(Euclidean distance) | ||
| Distance to expressway (DH) | 30(Euclidean distance) | ||
| Distance to First-order roads (DFR) | 30(Euclidean distance) | ||
| Distance to second-order roads (DSR) | 30(Euclidean distance) | ||
| Distance to third-order roads (DTR) | 30(Euclidean distance) | ||
| Distance to rial roads (DRR) | 30(Euclidean distance) | ||
| Distance to tailings pond(DTP) | 30(Euclidean distance) | Local environmental protection department |
At the same time, this study also collected PRE and PET datasets for different future climate change scenarios, sourced from the National Tibetan Plateau/Third Pole Environment Data Center and provided by Professor Peng Shouzhang's team[36]. The dataset includes future projections of precipitation and potential evapotranspiration for low stress scenarios (SSP119), medium stress scenarios (SSP245), and high stress scenarios (SSP585). The rainfall data is based on the global >100 km climate model dataset released by the Coupled Model Intercomparison Project Phase 6 (CMIP6) and the global high-resolution climate dataset released by WorldClim. It is generated in China using the Delta spatial downscaling scheme. Potential evapotranspiration data were obtained using the Hargreaves formula.
2.3.3. Topographic Data
The topographic data is based on Aster GDEM v3, released by Nasa, with a resolution of 30m(https://asterweb.jpl.nasa.gov/gdem). By obtaining DEM data, slope data can be calculated in ArcGIS.
2.3.4. Socio-Economic Data
The socio-economic data reflect various aspects of socio-economic development, including population size and density, economic development level, degree of urbanization, and infrastructure construction. By comprehensively analyzing the relationship between these factors and land use change, we can better understand the driving mechanisms and trends of land use change. Apart from GDP and population, the remaining data are point or line data, with Euclidean distance used to calculate the distance from the object.
3. Research Methodology
3.1. Methodology
This study adopted a research framework consisting of three main components, as shown in Figure 3. Firstly, the LEAS and CARS modules in the Markov chain and PLUS model were used to quantitatively simulate land use/land cover change demand under two different scenarios. Secondly, the water yield module of the InVEST model was employed to forecast various land use scenarios and different meteorological scenario. Finally, Geodetector was utilized to analyze the influence of each driving factor on water yield and the interaction between these factors.
3.2. Simulation and Calibration of water yield based on InVEST model
3.2.1. Water Yield Simulation based on InVEST Model
In this study, the Water Yield module of the InVEST model was utilized to evaluate the water yield of the Yellow River Basin in Henan Province. Numerous prior studies have employed this model to assess water yield. The InVEST model, being free, open-source, and widely used, is capable of evaluating a variety of ecosystem services, including water yield, water purification, and sediment production services, among others [41,42].
The Water Yield module of the InVEST model estimates water yield based on the water balance. Specifically, the model calculates the total amount of water produced per pixel by subtracting the amount of water lost through evapotranspiration from precipitation[43]. The model does not differentiate between surface and groundwater; it treats the basin as a catchment area and assumes that all pixels within the basin contribute water to the basin's outlet. The model algorithm is as follows:
where, is the water yield of the first year of the image; is the actual evapotranspiration in the first year of the image. is the precipitation in the first year of the image.
The Water Yield module of the InVEST model relates the actual evapotranspiration of a pixel (AET(x)) to the potential evapotranspiration (PET), which is inherently easier to model. This approach utilizes the Budyko curve [44] to calculate actual evapotranspiration (AET), a method later adopted by Fu (1981) and Zhang et al. (2004) )[44,45], as shown in Equation 2:
where ω is a non-physical parameter that characterizes natural climate-soil properties, defined by the expression[46]:
where represents the effective water content of plants (mm), and Z is an empirical constant that reflects local precipitation and hydrogeochemical characteristics, with values ranging from 1 to 30. According to the studies by Donohue et al. (2012) and Redhead et al. (2016) [46,47], the Z value can be estimated as 0.2*N, where N is the number of rainfall events per year.
The potential evapotranspiration can be calculated using the product of the estimated evapotranspiration ET_0 and the crop coefficient K_c as the following:
where, is the reference evapotranspiration of x pixel determined by the modified Hargreaves equation [49]; is the plant evapotranspiration coefficient related to land use type on x pixel. adjusts the value according to the crop or vegetation type of each pixel in the land use map. For a more detailed description of the model, see the InVEST User Guide.
3.2.2. Model Calibration
Based on the annual water resources data of Yellow River Basin in Henan Water Resources Bulletin (2020), the current regional average water yield modulus is 247,000 m3/km2. According to this, the parameter “z” of InVEST model water yield module is adjusted to carry out model calibration.
3.3. PLUS Model
The PLUS model is a new patch-level refined land use prediction model developed on the basis of the FLUS model that can consider the role of spatial policy driving [48]. This model has significant advantages in mining the drivers of land use change and simulating the evolution of land use in different scenarios, which makes up for the current land use prediction model There is a lack of simulation problem on different patch scales. The model integrates two modules: LEAS (Land expansion analysis strategy) and CARS (CA based on multiple random seeds):
3.3.1. LEAS (Land Expansion Analysis Strategy)
LEAS module can randomly extract transformation samples of land use expansion area for training, mine land transformation rules based on random forest algorithm, and obtain development probability and contribution of driving factors of various types of land use. The calculation formula is shown in equation (5):
where, x represents the vector composed of multiple driving factors; d is a binary variable with the value of 1 or 0. If the value is 1, it means that other land use types are converted to land use type k. If the value is 0, it means that other conversion methods exist. represents the prediction type of the x-vector decision tree; is an indicator function representing the set of decision numbers; M is the total number of decision trees.
3.3.2. CARS (CA based on Multiple Random Seeds)
CARS module combined with random seed generation and threshold decline mechanism to simulate the automatic evolution of various land use patches under the constraint of development probability. The calculation formula is as follows:
where represents the growth probability of land class k at unit i; is the future impact on class k, which depends on the gap between the number of units in iteration t and the target demand of class k in the region. And represents the neighborhood effect of pixel i, that is, the proportion of class k in the neighborhood.
3.3.3. PLUS Simulation Strategy and Scenarios Setting
In this study, based on the PLUS model, the LEAS module was used to calculate the development probability of various land types in the Yellow River Basin of Henan Province from 2000 to 2010 and the contribution rate of driving factors to the conversion of each land type during this period. The land demand for 2020 was then obtained through the Markov chain calculation. Subsequently, the transfer cost matrix and neighborhood weights were adjusted according to the land use changes in research area from 2000 to 2020 and relevant policies and regulations. The CARS module was then used to simulate and predict the land use changes in the Yellow River Basin of Henan Province in 2020. By comparing and validating the 2020 predictions, the Figure of Merit (Fom) was determined to assess the model's rationality. If the model validation proved reasonable, the same parameters were used to estimate land use in 2030.
To explore the land use changes in the Yangtze River Basin under different development goals, this paper set up scenarios based on previous studies[49]: economic development priority (Scenario 1), ecological protection priority (Scenario 2), and farmland protection priority (Scenario 3) to predict the land use spatial pattern in the Yellow River Basin of Henan Province in 2030. Under the farmland protection scenario, the conversion of farmland to other land types was restricted. Under the ecological priority scenario, the conversion of forest land and water areas to other land types was restricted. The cost settings for each scenario are shown in Table 2.
*: a-cropland; b-forest; c-shrub; d-grassland; e-water; f-barren; g-impervious land.
3.4. Geodetector
The simulation results of the InVEST model can only visually display water yield and its spatiotemporal changes, but cannot explain the attribution of significant spatial heterogeneity in the simulation results. Therefore, to further analyze the influencing factors of water yield, it is necessary to use the mature Geodetector model to explore the causes of spatial heterogeneity. Geodetector is a statistical method for detecting spatial differentiation and revealing the spatial differentiation of various elements. It was proposed by Wang Jingfeng and others, and consists of modules such as differentiation and factor detection, interaction detection, ecological detection, and risk detection, which study the spatial differentiation of elements from different perspectives for different detection contents[50].
This paper takes the water yield in the Qinghai Lake Basin as the dependent variable and uses Geodetector to determine its influencing factors in different regions. The influencing factors include topography, climate, and land use (Table 1). In the water yield factors, meteorological factors include potential evapotranspiration (PET) and Precipitation (PRE); topographic factors include DEM and slope (SLP); socio-economic factors include distance to rivers (DRI), distance to first and second-order streams (DFSS) et al. Refer to Table 1 for specific factors. For the construction of the mesh linking factors, this paper generated a total of 396,163 points at 300m×300m intervals to conduct multi-factor spatial correlation analysis.
4. Results
4.1. The change of land use
4.1.1. Subsubsection
Land use changes during each period were analyzed and are presented in Figure 4. The distribution of land use in the Yellow River Basin of Henan Province was described for the periods 2000-2010 and 2010-2020. Land use types included cropland, impervious land (construction land), forest land, grassland, water, shrubland, and barren land. From 2000 to 2010, significant changes in land use occurred, particularly in the conversion of cropland, which amounted to 2,592.73 km². Approximately 50.01% of this transferred cropland was converted to impervious land, 28.29% to forest land, and only 0.34 km² to barren land (Figure 4(a)). During the period 2010-2020, the conversion of cropland remained significant, totaling 2,293.34 km². During this period, impervious land had the highest conversion rate, accounting for approximately 56.30% of the total conversion (Figure 4(b)).
To further understand the directional and structural characteristics of land use change in the Yellow River Basin of Henan Province, this study constructed a land use transfer matrix (Table 3) and a new land use distribution map (Figure 5). The data indicate that cropland and forest land are the primary land use types, comprising approximately 84% of the total land area. From 2000 to 2020, the area of construction land increased by 1,381.0 km², raising its proportion of the total land area from 8.1% to 12.0%. This increase is mainly due to rapid urbanization and economic growth, which significantly expanded the construction land area, leading to the conversion of considerable amounts of arable land into construction land. The new construction land primarily originates from cultivated land, with changes occurring mainly in marginal areas as existing construction land expands outward. Consequently, the area of cultivated land decreased by 1,662.1 km², reducing its proportion from 62.1% to 57.5%. The primary conversions of cultivated land were to construction land, forest land, and grassland, accounting for 56.30%, 32.96%, and 7.00% of the total reduction, respectively. The conversion of cultivated land to forest and grassland is mainly concentrated in areas targeted by farmland-to-forest and wetland restoration projects. In contrast, the conversion to construction land is more prominent in economically developed areas of the Yellow River Basin, such as Luoyang and Xinxiang.
4.1.2. Driving Factor Contribution Degree
The Land Expansion Analysis Strategy (LEAS) of the PLUS model evaluates the contribution of driving factors, as shown in Figure 6. Simulation results of 16 driving factors indicate that the most significant for cropland, forest land, and impervious land are population (POP), Digital Elevation Model (DEM), and potential evapotranspiration (PET), with average contributions of 0.127, 0.133, and 0.162, respectively.
Population (POP) accounted for a high proportion of contributions across all land use types. Additionally, potential evapotranspiration (PET) from meteorological data significantly contributed to different land uses, particularly forest land. The analysis of contributions indicates that land use change in the Yellow River Basin of Henan Province is greatly influenced by human activities. Frequent human activities significantly affect land types and natural conditions.
4.1.3. Land Use Forecasting
Using land use data from 2000 and 2010, the PLUS model predicted the land use distribution for 2020. Actual land use data from 2020 was input into the verification module, yielding a Kappa coefficient of 0.75. This indicates high accuracy and consistency in the PLUS model's predictions. The Fom coefficient indicates the correlation between predicted and actual land use development trends. A higher coefficient suggests greater consistency with the actual trend. Generally, a Fom coefficient greater than 0.15 indicates a reliable prediction. In this study, the Fom coefficient is 0.29, indicating good agreement between the predicted and actual trends, confirming the model's reliability. Similarly, the same parameters were used to forecast land use in 2030 based on 2010 and 2020 data. The results are shown in Figure 7.
In the predicted 2030 land use (Table 4), the trend continues: Cropland and grassland areas shrink, while forest land and impervious land areas increase. The reduced cropland area, which decreased by 497.41 km², was largely converted into impervious land, which increased by 447.37 km². Shrubland had the highest rate of decline among all land types, decreasing by 29.03% (barren land is not part of this analysis).
In Scenario 1 (economic development priority), the impervious area was preserved and increased due to the emphasis on economic growth. The impervious land increased by 208.90 km² compared to the predicted 2030 result. The impervious area in Scenario 1 is the largest among the three scenarios, with a 3.79% increase over Scenario 2 and a 14.97% increase over Scenario 3. The increase in impervious area is most significant at the urban boundary of Luoyang. However, both cropland and forest land exhibited a declining trend. Most of the decline in impervious land is concentrated at the edges of Luoyang city (Figure 7(d)). This is because Luoyang, as the second largest economy in Henan Province, prioritizes urban expansion and implements better urban development measures.
In Scenario 2 (ecological development priority), compared to the predicted 2030 result, forest land increased by 270.00 km² and water bodies by 6.32 km². However, shrubland and grassland experienced declines of varying degrees. This may be due to forest land having a greater priority in the land conversion process. Among all scenarios, Scenario 2 had the highest forest area and the lowest cropland area. The impervious land area remains largely consistent with other scenarios. Compared to the cropland development priority scenario (Scenario 3), cropland area decreased by 5.1%, while forest land area increased by 5.4%. The increased forest land area is mainly concentrated on the south side of the Taihang Mountains and the east side of the Funiu Mountains, near farming areas, and is mostly converted from cropland (Figure 7(e)).
I In Scenario 3 (cropland development priority), the cropland area is the highest among all scenarios, while the areas of forest land, grassland, water bodies, and impervious land are the smallest. The cropland area increased by 783.18 km² compared to the predicted 2030 result and by 1053.18 km² compared to Scenario 2. Most of this increase comes from the conversion of impervious land and forest land (Figure 7(f)). With China's emphasis on food security, cropland has been protected in recent years. The retention and slight increase of cropland is likely to continue over the next decade.
4.2. The Change of Water Yield
4.2.1. Interannual Variation of Water Yield
From 2000 to 2020, the water yield in the Yellow River Basin in Henan Province ranged from 0.00 mm to 716.73 mm (Figure 8). The average water yield in 2000, 2010, and 2020 was 296.22 mm, 248.91 mm, and 263.77 mm, respectively, corresponding to 10.56 billion m³, 8.88 billion m³, and 9.41 billion m³. The average water yield in 2000, 2010, and 2020 was 296.22 mm, 248.91 mm, and 263.77 mm, respectively, corresponding to 10.56 billion m³, 8.88 billion m³, and 9.41 billion m³. The highest average water yield was in 2016 at 320.39 mm, while the lowest was in 2012 at 109.75 mm. Compared to 2000, the average water yield in 2020 decreased by 32.47 mm (1.158 billion m³). Compared to 2010, the average water yield in 2020 increased by 14.86 mm (530 million m³). Overall, the inter-annual variation of water yield in the Yellow River Basin in Henan Province shows no significant trend, but there are considerable differences between years. As shown in Figure 8, water yield is highly correlated with precipitation changes, showing significant differences between dry and wet years. Additionally, the numerical distribution of water yield aligns with precipitation, indicating that precipitation plays a decisive role in the water yield of the study area.
Figure 9(a), (b), and (c) illustrate the spatial patterns of water yield in the Yellow River Basin, Henan Province, for the years 2000, 2010, and 2020 under actual scenarios. From a spatial perspective, the water yield depth remained relatively consistent across the years, with low yields in the northwest and high yields in the southwest. In 2000, high water yield areas included the upper Yiluo River Basin, the southern Funiu Mountain range, the central Songshan Mountain range, and Luoyang's urban area. This pattern correlates strongly with precipitation, potential evapotranspiration, and land use types. Areas experiencing high precipitation and low evapotranspiration, such as construction sites, grasslands, and forests, demonstrated robust water yield. Conversely, regions with low precipitation and high evapotranspiration, including cultivated lands and water bodies, exhibited weaker water yield.
Figure 9(d), (e), and (f) illustrate the spatial patterns of change in the Yellow River Basin in Henan Province for the periods 2000-2010, 2010-2020, and 2000-2020 under the actual scenario. From 2000 to 2010, water yield decreased in most areas of the basin, affecting 88.9% of the study area. The most significant changes occurred in the Yellow River area following the completion of the Xiaolangdi Reservoir, with a decreased water yield in the southeast of the basin. From 2010 to 2020, water yield mainly increased, with 82.4% of the study area experiencing an increase. The increase was widespread across the region, including construction land expansion areas, while sporadic declines were observed in parts of the western mountains.
Overall, the inter-annual variation of water yield in the Yellow River Basin in Henan Province shows no significant trend, but there are substantial differences across different years. Figure 8 shows a high correlation between water yield and precipitation changes. Water yield differs significantly between dry and wet years, with its distribution consistent with precipitation. This indicates that precipitation plays a decisive role in water yield in the study area. From a spatial perspective, two main factors cause changes in precipitation. First, annual variation in precipitation leads to significant regional changes in water yield. Second, changes in land use types cause variations in water yield in small patches.
4.2.2. Water Yield under Different Scenarios
From the data structure (Figure 10), the water yield in 2030 varies significantly under different CMIP6 scenarios. Using the land use data from Scenario 1 for simulated 2030 as an example, the water yield under ssp119, ssp245, and ssp585 is 172.73×10⁸ m³, 117.78×10⁸ m³, and 121.32×10⁸ m³, respectively. Compared to ssp119, the water yield in the other two scenarios is lower. Compared to the 2020 water yield data, the water yield in 2030 decreases by 78.68×10⁸ m³, 23.73×10⁸ m³, and 27.27×10⁸ m³ over 20 years. Under different land use scenarios, the water yield in Scenario 1, Scenario 2, and Scenario 3 for 2030 is 172.73×10⁸ m³, 171.12×10⁸ m³, and 172.40×10⁸ m³, respectively. Using Scenario 1 as the baseline, the water yield in Scenario 2 and Scenario 3 decreases by 61.13×10⁶ m³ and 33.26×10⁶ m³, respectively. Overall, the difference in water yield under different meteorological scenarios is significantly greater than that under land use scenarios. Thus, the impact of climate change on water yield in the Yellow River Basin in Henan Province will be more significant in the future.
As shown in Figure 11, all scenarios exhibit a spatial trend of higher water yield in the south and lower yield in the north, with decreasing yields towards mountainous areas. This pattern is similar to previous distributions. Overall, changes in water yield under different land use scenarios are minimal. The contribution of different land use types to the total regional water yield follows this order: cropland, forest land, construction land, grassland, shrubland, water bodies, and barren land. The contribution to total water yield generally aligns with the area of each land use type. Cropland contributes approximately 54.8% of the water yield, occupying about 55.6% of the study region. The three simulated scenarios exhibit overall spatial consistency. However, closer examination of small patches (Figure 10(d), (e), (f)) reveals subtle differences under different land development conditions. In Scenario 1, more construction land results in a larger area with higher water yield. In Scenario 2, larger forest land patches result in a relatively larger area with lower water yield.
4.2.3. Geo-Detection of Water Yield
Understanding the interaction between water yield and various factors is crucial for rational water resource management. The factor detector shows the individual impact degree of each factor on water yield. As shown in Figure 12(b), the factor detector results indicate that the single-factor q-values for precipitation (PRE), distance to government (DG), distance to railroads (DRR), and DEM are relatively high, being 0.37, 0.24, 0.2, 0.23, and 0.13, respectively. These variables exhibit higher q-values among all factors, indicating a more significant impact on water yield in the study area than other parameters. In addition to natural meteorological factors such as PRE, DEM, and PET, socio-economic factors like GDP, DG, and DRR also substantially impact water yield, reflecting social development. In contrast, factors reflecting social scale, such as DRE and POP, and distance indicators for various road levels exhibit lower q-values.
Figure 12(a) illustrates the interaction of different factors on water yield in the study area. The interaction detector results indicate that interactions between any two factors are enhanced and nonlinear. Among them, the q-value for the interaction between precipitation (PRE) and DEM is the highest at 0.65, followed by the interaction between precipitation (PRE) and potential evapotranspiration (PET) at 0.60. Notably, the single-factor q-value of potential evapotranspiration (PET) is only 0.085, but under the interaction of PRE and PET, it exhibits a strong effect. This indicates that PET does not significantly determine water yield changes alone; instead, water yield is jointly determined by PET and PRE, aligning with the Invest model's calculation rules. These results suggest that the interaction between precipitation (PRE) and other factors is key to water yield in the study area, with q-values for interactions between PRE and other factors all above or close to 0.4. Additionally, besides the high q-values of PRE with natural factors (PET, DEM, and SLP), the q-values with socio-economic factors (GDP, POP, GD) are also high, implying that regional water yield is driven by both natural and socio-economic factors.
5. Discussion
5.1. Temporal and Spatial Transformation of Land Use
Water yield is a highly complex system, and studying the changes in land use function and value is a method to understand the entire water yield system and its functional patterns [51]. Based on the land use change conversion matrix in section 3.1.1 for the years 2000-2020, we found that the area of arable land was 22,105.7 km² in 2000, which decreased to 20,443.6 km² by 2020, with a total reduction of 7.5%. The change in arable land was the largest among all types of land use. The reduction in arable land was mostly converted into construction land and forested areas, mainly due to the recent intensification of urbanization and the implementation of policies to convert farmland back to forest in China[52]. For the years 2000-2020, which were the fastest growing for both China and Henan Province, the conversion of arable land to construction land was the main trend, with construction land increasing by 47.9% over 20 years. According to previous studies and the results of this research, the water yield from construction land is significantly higher than from other land use types, and thus is certain to have an impact on water yield. For the years 2000-2020, which were the fastest growing for both China and Henan Province, the conversion of arable land to construction land was the main trend, with construction land increasing by 47.9% over 20 years. According to previous studies and the results of this research[53], the water yield from construction land is significantly higher than from other land use types, and thus is certain to have an impact on water yield. On a regional scale, the quantity of land use change over the past twenty years was 12.2%, and the average regional water balance change due to land use alteration does not exceed 3%, suggesting that changes in land use may not significantly affect regional water yield. However, on a smaller scale, these changes in land use are quite significant, as demonstrated in this study by the notable expansions of the urban areas of Luoyang and Sanmenxia.
For future scenarios and the results of scenario simulations under different strategies, compared to the forecasts for 2030, the differences in forecast results across scenarios are not significant, with only some patches showing trends of expansion and contraction. In fact, regarding future land use development in Henan Province, the forecast results for 2030 may not conform to the land use development patterns of the study area, as existing research indicates that land use in Henan Province has stabilized regionally. With the slowing of China's economic development and the delineation of China's agricultural land redline, Henan Province, as one of China's most important agricultural provinces, has seen increasing national emphasis on the protection of arable land; thus, the arable land in the Yellow River basin of Henan Province will certainly not continue to decrease as per previous trends. In scenario 3 of this study, the simulated arable land area slightly expanded, while other types of land use remained essentially the same as in 2020, which actually corresponds more closely to the realistic future land use change scenario. For scientific research and land management, more attention should be paid to the impact of the survival and expansion of cultivated land area on the ecosystem and water resources management in Henan Province.
5.2. Temporal and Spatial Transformation of Water Yield
From 2000 to 2030, the water yield in the Yellow River Basin of Henan Province shows no significant temporal trend. The variations in water yield across different years are closely related to precipitation. Spatially, the trend is characterized by higher water yield in the south and west, and lower yield in the north and east, with the water yield decreasing from the Funiu Mountain foothills towards the east and north. In terms of land use types, cropland contributes the most to water yield, followed by forest land, which is related to the distribution of land use types. The average water yield depth for cropland is 213.56 mm, for forest land it is 207.88 mm, and for impervious land it is 248.48 mm. Compared to other land use/cover types, construction land has the highest water yield depth due to the lack of vegetation interception and lower evapotranspiration, consistent with previous studies[53].In terms of total water yield, cropland and forest land are the most important water-producing areas in the region. The total water yield for cropland is 5.12×10¹⁰ m3, and for forest land, it is 2.29×10¹⁰ m3, making them more significant than other land types in the study area.
The water yield in the study area is primarily controlled by precipitation, consistent with the calculation method of the InVEST model and the inherent meaning of water yield. The magnitude of water yield is directly influenced by precipitation, evapotranspiration, and their balance. The results of this study also confirm this conclusion, showing that water yield in the study area is controlled by annual precipitation. The differences in water yield caused by different CMIP6 data are much greater than those caused by different land use development scenarios. Within a limited time scale, the water yield in this region is mainly controlled by driving factors such as precipitation and evapotranspiration. Lang et al. [54]quantified the impact of climate change and land use/cover on water yield and found that the contribution rate of annual precipitation to annual water yield change is as high as 97.44%, similar to the results shown in this study. However, according to subsequent geo-detector analysis, besides precipitation (PRE) as the dominant indicator, natural factors and social factors (such as GDP, population (POP), etc.) show a strong correlation. This indicates that water yield in the study area is determined by a combination of climatic natural conditions and intrinsic social and economic factors (citation), with social and economic factors directly influencing land use types. Previous studies have demonstrated the critical impact of land use types on water yield. Changes in land use/cover types directly or indirectly affect water yield by altering the structure and type of the underlying surface. Additionally, soil porosity, soil texture, and structure have an indirect impact on water yield [28,55,56].In this study, the differences under different land use development scenarios are not significant, mainly because the Yellow River Basin in Henan Province, as one of China's most important grain-producing areas and one of the most densely populated regions, has stabilized in terms of land use development. From a regional scale, the land use changes in different scenarios are minimal, and water yield is unlikely to be affected by different scenarios. However, on a longer time scale, significant differences in scale may have some impact on water yield, especially on a local small scale. Therefore, in future water resource management, the Yellow River Basin in Henan Province should pay more attention to the impacts of climate change and the potential changes in water yield caused by land use changes on small scales (such as county and city levels).
6. Conclusions
We utilized the PLUS and InVEST models to simulate and analyze the land use changes and climate changes from 2000 to 2030 in the Yellow River Basin of Henan Province and their impact on the ecosystem. The results indicate that water yield in the study area has a stronger correlation with climate conditions such as precipitation, and only local patches are affected under different land use change scenarios. In different land use scenarios, Scenario 1 (economic development priority) exhibits a relatively significant expansion of construction land, particularly around urban areas; Scenario 2 (ecological development priority) shows forest land expansion with significant restrictions on cropland; Scenario 3 (cropland development priority) demonstrates significant cropland expansion, especially with some impervious land converted to cropland. The water yield in Scenario 1 is relatively high, with an increase of 61.13×10⁶ m³ and 33.26×10⁶ m³ compared to Scenarios 2 and 3, respectively. Overall, the change does not exceed 0.5%, with only some noticeable changes in small-scale patches. Under different CMIP6 future meteorological data scenarios, the differences in water yield results are significant. The ssp126 (low-stress scenario) shows the highest water yield, with a total value 67% higher than the lowest yield scenario ssp245 (medium-stress scenario). The spatial distribution of data under different scenarios is primarily influenced by precipitation. Finally, through Geodetector analysis of the driving factors of water yield, the single-factor detection results indicate that water yield in the Yellow River Basin of Henan Province is determined by meteorological factors (precipitation, potential evapotranspiration). The interaction detection results show that the interaction between meteorological factors (precipitation, potential evapotranspiration) and social factors (such as precipitation and population) also has a high driving force, indicating that meteorological factors are the most critical for water yield in the study area, while the combined effect of meteorological and social factors is key to regional water yield. Our study accurately identifies the changes in land use types in the Yellow River Basin of Henan Province and their impact on water yield, providing valuable insights for relevant water resource management policies and urban development planning.
Author Contributions
Conceptualization, X.M., S.L., and L.G.; Data curation, X.M, M.F. and C.F.; Methodology, L.G.; Methodology, X.M.; Software, X.M.; Formal analysis, X.M.; Writing—original draft preparation, X.M.; Writing—review and editing, X.M. and S.L.; Visualization and J.Z. and Y.L.; Supervision, L.G.; Project administration, L.G. All authors have read and agreed to the published version of the manuscript.
Funding
This research was funded by the Natural Resources Research Project of Henan Province (Grant No. 2023-382-1); Natural Resources Research Project of Henan Province (Grant No. 2021-178-9) and Henan Academy of Geology Management Research Project (Grant No. 2023-901-XM001-KT01).
Institutional Review Board Statement
Not applicable.
Informed Consent Statement
Not applicable.
Data Availability Statement
The data presented in this study are available through the respective sources.
Conflicts of Interest
The authors declare no conflict of interest.
References
- MEA. Millennium Ecosystem Assessment: Current State & Trends Assessment. Island Press Washington DC: 2005.
- Shan, Y.; Dai, X.; Li, W.; Yang, Z.; Wang, Y.; Qu, G.; Liu, W.; Ren, J.; Li, C.; Liang, S. Detecting spatial-temporal changes of urban environment quality by remote sensing-based ecological indices: A case study in Panzhihua city, Sichuan Province, China. Remote Sensing 2022, 14, 4137. [Google Scholar] [CrossRef]
- Duraiappah, A.K.; Naeem, S.; Agardy, T.; Ash, N.J.; Cooper, D.; Díaz, S.; Faith, D.P.; Mace, G.; McNeely, J.A.; Mooney, H.A. Ecosystems and human well-being: Biodiversity synthesis. 2005.
- Guo, C.; Xu, H. Use of functional distinctness of periphytic ciliates for monitoring water quality in coastal ecosystems. Ecological Indicators 2019, 96, 213–218. [Google Scholar] [CrossRef]
- Han, Z.; Li, B.; Han, Z.; Wang, S.; Peng, W.; Liu, X.; Benson, D. Dynamic Simulation of Land Use and Habitat Quality Assessment in Baiyangdian Basin Using the SD-PLUS Coupled Model. Water 2024, 16, 678. [Google Scholar] [CrossRef]
- Aznar-Sánchez, J.A.; Velasco-Muñoz, J.F.; Belmonte-Ureña, L.J.; Manzano-Agugliaro, F. The worldwide research trends on water ecosystem services. Ecological indicators 2019, 99, 310–323. [Google Scholar] [CrossRef]
- Díaz, M.E.; Figueroa, R.; Alonso, M.L.S.; Vidal-Abarca, M.R. Exploring the complex relations between water resources and social indicators: The Biobío Basin (Chile). Ecosystem Services 2018, 31, 84–92. [Google Scholar] [CrossRef]
- Costanza, R.; d'Arge, R.; De Groot, R.; Farber, S.; Grasso, M.; Hannon, B.; Limburg, K.; Naeem, S.; O'neill, R.V.; Paruelo, J. The value of the world's ecosystem services and natural capital. nature 1997, 387, 253–260. [Google Scholar] [CrossRef]
- Chen, Y.; Xu, X.; Zhang, X.; Singh, V.P.; Li, M. Weather-driven synergistic water-economy-environment regulation of farmland ecosystems. Science of The Total Environment 2023, 880, 163342. [Google Scholar] [CrossRef] [PubMed]
- Ragab, R.; Prudhomme, C. Sw—Soil and Water: Climate change and water resources management in arid and semi-arid regions: Prospective and challenges for the 21st century. Biosystems engineering 2002, 81, 3–34. [Google Scholar] [CrossRef]
- Bandyopadhyay, J. Water, ecosystems and society: A confluence of disciplines. SAGE Publications India: 2009.
- Pimentel, D.; Berger, B.; Filiberto, D.; Newton, M.; Wolfe, B.; Karabinakis, E.; Clark, S.; Poon, E.; Abbett, E.; Nandagopal, S. Water resources: Agricultural and environmental issues. BioScience 2004, 54, 909–918. [Google Scholar] [CrossRef]
- Chanapathi, T.; Thatikonda, S.; Raghavan, S. Analysis of rainfall extremes and water yield of Krishna river basin under future climate scenarios. Journal of Hydrology Regional Studies 2018, 19, 287–306. [Google Scholar] [CrossRef]
- Belete, M.; Deng, J.; Wang, K.; Zhou, M.; Zhu, E.; Shifaw, E.; Bayissa, Y. Evaluation of satellite rainfall products for modeling water yield over the source region of Blue Nile Basin. Science of the Total Environment 2020, 708, 134834. [Google Scholar] [CrossRef]
- Stednick, J.D. Monitoring the effects of timber harvest on annual water yield. Journal of hydrology 1996, 176, 79–95. [Google Scholar] [CrossRef]
- Yifru, B.A.; Chung, I.-M.; Kim, M.-G.; Chang, S.W. Assessing the effect of land/use land cover and climate change on water yield and groundwater recharge in East African Rift Valley using integrated model. Journal of Hydrology Regional Studies 2021, 37, 100926. [Google Scholar] [CrossRef]
- Caldwell, P.V.; Miniat, C.F.; Elliott, K.J.; Swank, W.T.; Brantley, S.T.; Laseter, S.H. Declining water yield from forested mountain watersheds in response to climate change and forest mesophication. Global Change Biology 2016, 22, 2997–3012. [Google Scholar] [CrossRef] [PubMed]
- Natalia, P.; Silvia, F.; Silvina, S.; Miguel, P. Climate change in northern Patagonia: Critical decrease in water resources. Theoretical and Applied Climatology 2020, 140, 807–822. [Google Scholar] [CrossRef]
- Hu, J.; Wu, Y.; Wang, L.; Sun, P.; Zhao, F.; Jin, Z.; Wang, Y.; Qiu, L.; Lian, Y. Impacts of land-use conversions on the water cycle in a typical watershed in the southern Chinese Loess Plateau. Journal of Hydrology 2021, 593, 125741. [Google Scholar] [CrossRef]
- Ye, L.; Cheng, L.; Liu, P.; Liu, D.; Zhang, L.; Qin, S.; Xia, J. Management of vegetative land for more water yield under future climate conditions in the over-utilized water resources regions: A case study in the Xiong’an New area. Journal of Hydrology 2021, 600, 126563. [Google Scholar] [CrossRef]
- Ercan, M.B.; Maghami, I.; Bowes, B.D.; Morsy, M.M.; Goodall, J.L. Estimating potential climate change effects on the upper neuse watershed water balance using the SWAT model. JAWRA Journal of the American Water Resources Association 2020, 56, 53–67. [Google Scholar] [CrossRef]
- Ndhlovu, G.; Woyessa, Y. Modelling impact of climate change on catchment water balance, Kabompo River in Zambezi River Basin. Journal of Hydrology Regional Studies 2020, 27, 100650. [Google Scholar] [CrossRef]
- Gomes, L.; Bianchi, F.; Cardoso, I.; Schulte, R.; Fernandes, R.; Fernandes-Filho, E. Disentangling the historic and future impacts of land use changes and climate variability on the hydrology of a mountain region in Brazil. Journal of Hydrology 2021, 594, 125650. [Google Scholar] [CrossRef]
- Wang, Q.; Cheng, L.; Zhang, L.; Liu, P.; Qin, S.; Liu, L.; Jing, Z. Quantifying the impacts of land-cover changes on global evapotranspiration based on the continuous remote sensing observations during 1982–2016. Journal of Hydrology 2021, 598, 126231. [Google Scholar] [CrossRef]
- Li, M.; Li, S.; Liu, H.; Zhang, J. Balancing Water Ecosystem Services: Assessing Water Yield and Purification in Shanxi. Water 2023, 15, 3261. [Google Scholar] [CrossRef]
- Yin, L.; Feng, X.; Fu, B.; Wang, S.; Wang, X.; Chen, Y.; Tao, F.; Hu, J. A coupled human-natural system analysis of water yield in the Yellow River basin, China. Science of The Total Environment 2021, 762, 143141. [Google Scholar] [CrossRef]
- Abbott, B.W.; Bishop, K.; Zarnetske, J.P.; Minaudo, C.; Chapin III, F.S.; Krause, S.; Hannah, D.M.; Conner, L.; Ellison, D.; Godsey, S.E. Human domination of the global water cycle absent from depictions and perceptions. Nature Geoscience 2019, 12, 533–540. [Google Scholar] [CrossRef]
- Reheman, R.; Kasimu, A.; Duolaiti, X.; Wei, B.; Zhao, Y. Research on the Change in Prediction of Water Production in Urban Agglomerations on the Northern Slopes of the Tianshan Mountains Based on the InVEST–PLUS Model. Water 2023, 15, 776. [Google Scholar] [CrossRef]
- Meijer, K.S.; Schasfoort, F.; Bennema, M. Quantitative Modeling of Human Responses to Changes in Water Resources Availability: A Review of Methods and Theories. Sustainability 2021, 13, 8675. [Google Scholar] [CrossRef]
- Xiangzheng, D.; Kaizhong, Y.; Qingqing, S.; Suocheng, D.; Wenge, Z.; Rongxing, G.; Minghong, T.; Pengjun, Z.; Yu, L.; Changhong, M. Urban agglomeration and industrial transformationand development in the Yellow River Basin (in Chinese). Journal of Natural Resources 2021, 36, 273–289. [Google Scholar] [CrossRef]
- Tong, L.; Wenxiu, H. Chaos Control of Ec-R-Ev System Based on Coordination (in Chinese). Systems Engineering —Theory & Practice 2002, 22, 8–12. [Google Scholar]
- Cuimei, L.; Zening, W. Emergy analysis for sustainable development assessment ofregional water ecological-economics system (in Chinese). Systems Engineering Theory & Practice 2010, 1293–1298. [Google Scholar]
- Changshuo, H.; Leihua, G.; Bing, Y.; Jinyu, B.; Yuting, Z. Dynamic prediction and regulation of water resource carrying capacity:a case study on the elow River basin. Advances in Water Science 2021, 32. [Google Scholar] [CrossRef]
- Yuyu, G.; Siyue, L.; Rui, L.; Jing, Z. Relationship between landscape pattern and water quality of the multi-scale effects in theYellow River Basin (in Chinese). Journal of Lake Sciences 2021, 33, 737–748. [Google Scholar] [CrossRef]
- Yang, J.; Huang, X. The 30 m annual land cover dataset and its dynamics in China from 1990 to 2019. Earth System Science Data 2021, 13, 3907–3925. [Google Scholar] [CrossRef]
- Peng, S.; Ding, Y.; Wen, Z.; Chen, Y.; Cao, Y.; Ren, J. Spatiotemporal change and trend analysis of potential evapotranspiration over the Loess Plateau of China during 2011–2100. Agricultural and forest meteorology 2017, 233, 183–194. [Google Scholar] [CrossRef]
- Han, J.; Miao, C.; Gou, J.; Zheng, H.; Zhang, Q.; Guo, X. A new daily gridded precipitation dataset based on gauge observations across mainland China. Earth System Science Data Discussions 2022, 2022, 1–33. [Google Scholar] [CrossRef]
- Peng, S. 1 km monthly potential evapotranspiration dataset in China (1901-2022). National Tibetan Plateau / Third Pole Environment Data Center 2022.
- Miao, C.; Han, J.; Gou, J. A daily gridded precipitation dataset based on gauge observations across mainland China (1961-2022). National Tibetan Plateau / Third Pole Environment Data Center 2023.
- Aarnoudse, E.; Bluemling, B.; Qu, W.; Herzfeld, T. Groundwater regulation in case of overdraft: National groundwater policy implementation in north-west China. International Journal of Water Resources Development 2019, 35, 264–282. [Google Scholar] [CrossRef]
- Tao, P.; Shaohong, W.; Erfu, D.; Yujie, L. Spatiotemporal variation of water source supply service in Three Rivers Source Area of China based on InVEST model (in Chinese). Chinese Journal of Applied Ecology 2013, 24, 183r–189r. [Google Scholar]
- Yuanyuan, Y.; Erfu, D.; Hua, F. The Assessment Framework of Ecosystem Service ValueBased on InVEST Model (in Chinese). Journal of Capital Normal University(Natural Science Edition) 2012, 33, 41–47. [Google Scholar]
- Yang, H.; Cao, J. Analysis of Basin Morphologic Characteristics and Their Influence on the Water Yield of Mountain Watersheds Upstream of the Xiongan New Area, North China. Water 2021, 13, 2903. [Google Scholar] [CrossRef]
- Fu, B. On the calculation of the evaporation from land surface. Scientia Atmospherica Sinica 1981, 5, 23. [Google Scholar]
- Zhang, L.; Hickel, K.; Dawes, W.; Chiew, F.H.; Western, A.; Briggs, P. A rational function approach for estimating mean annual evapotranspiration. Water resources research 2004, 40. [Google Scholar] [CrossRef]
- Donohue, R.J.; Roderick, M.L.; McVicar, T.R. Roots, storms and soil pores: Incorporating key ecohydrological processes into Budyko’s hydrological model. Journal of Hydrology 2012, 436, 35–50. [Google Scholar] [CrossRef]
- Redhead, J.; Stratford, C.; Sharps, K.; Jones, L.; Ziv, G.; Clarke, D.; Oliver, T.; Bullock, J. Empirical validation of the InVEST water yield ecosystem service model at a national scale. Science of the Total Environment 2016, 569, 1418–1426. [Google Scholar] [CrossRef]
- Liang, X.; Guan, Q.; Clarke, K.C.; Liu, S.; Wang, B.; Yao, Y. Understanding the drivers of sustainable land expansion using a patch-generating land use simulation (PLUS) model: A case study in Wuhan, China. Computers, Environment and Urban Systems 2021, 85, 101569. [Google Scholar] [CrossRef]
- Meimei, W.; Zizhen, J.; Tengbiao, L.; Yongchun, Y.; Zhuo, J. Analysis on absolute conflict and relative conflict of land use in Xining metropolitan area under different scenarios in 2030 by PLUS and PFCI. Cities 2023, 137, 104314. [Google Scholar] [CrossRef]
- Wang, J.F.; Li, X.H.; Christakos, G.; Liao, Y.L.; Zhang, T.; Gu, X.; Zheng, X.Y. Geographical detectors-based health risk assessment and its application in the neural tube defects study of the Heshun Region, China. International Journal of Geographical Information Science 2010, 24, 107–127. [Google Scholar] [CrossRef]
- Ennaanay, D. Impacts of land use changes on the hydrologic regime in the Minnesota River basin. University of Minnesota: 2006.
- Liu, Y.; Wu, K.; Cao, H. Land-use change and its driving factors in Henan province from 1995 to 2015. Arabian Journal of Geosciences 2022, 15, 247. [Google Scholar] [CrossRef]
- Jian, Z.; Gang, L.; Lianghua, Q. Temporal and Spatial Dynamics and Scenario Simulation of Water Yield inDaniiangkou Reservoir Area (in Chinese). Scientia Silvae Sinicae 2020, 56, 9. [Google Scholar]
- Lang, Y.; Song, W.; Zhang, Y. Responses of the water-yield ecosystem service to climate and land use change in Sancha River Basin, China. Physics and Chemistry of the Earth, Parts A/B/C 2017, 101, 102–111. [Google Scholar] [CrossRef]
- Anand, J.; Gosain, A.K.; Khosa, R. Prediction of land use changes based on Land Change Modeler and attribution of changes in the water balance of Ganga basin to land use change using the SWAT model. Science of the total environment 2018, 644, 503–519. [Google Scholar] [CrossRef]
- Pamukcu, P.; Erdem, N.; Serengil, Y.; Randhir, T.O. Ecohydrologic modelling of water resources and land use for watershed conservation. Ecological Informatics 2016, 36, 31–41. [Google Scholar] [CrossRef]
Figure 1.
The location of Yellow River Basin in Henan province and corresponding river systems.
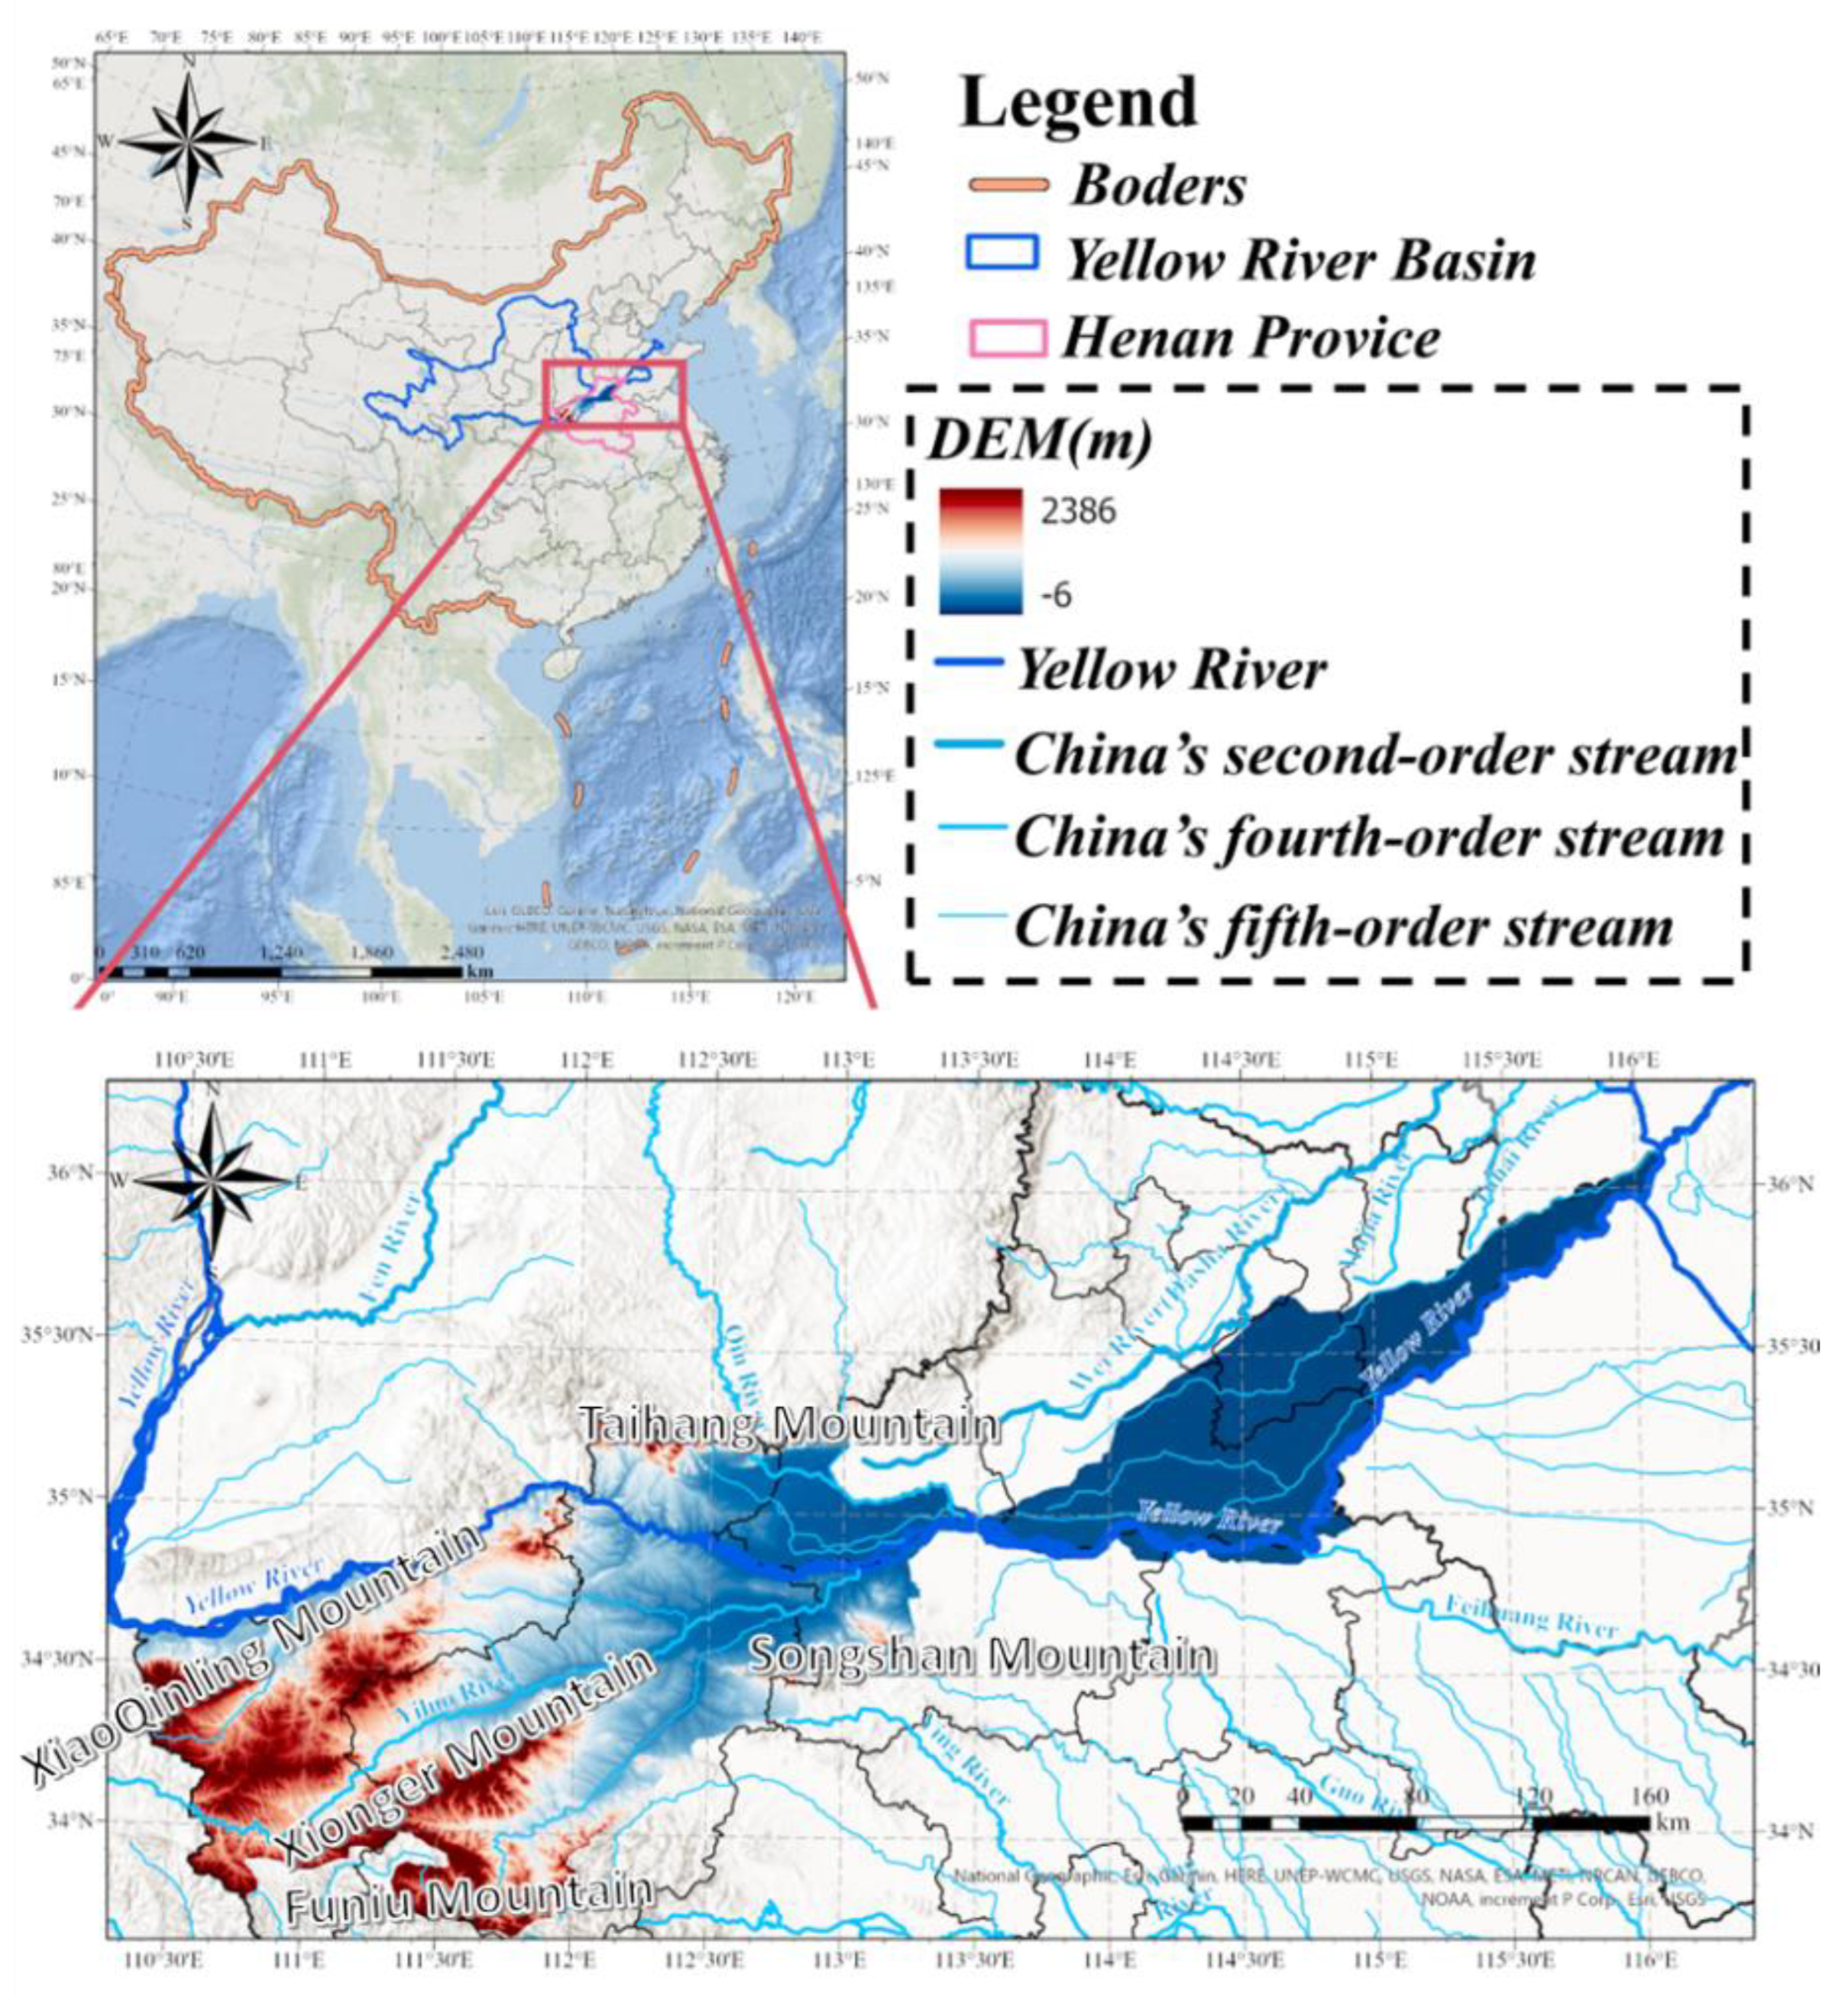
Figure 2.
Different data presentation.
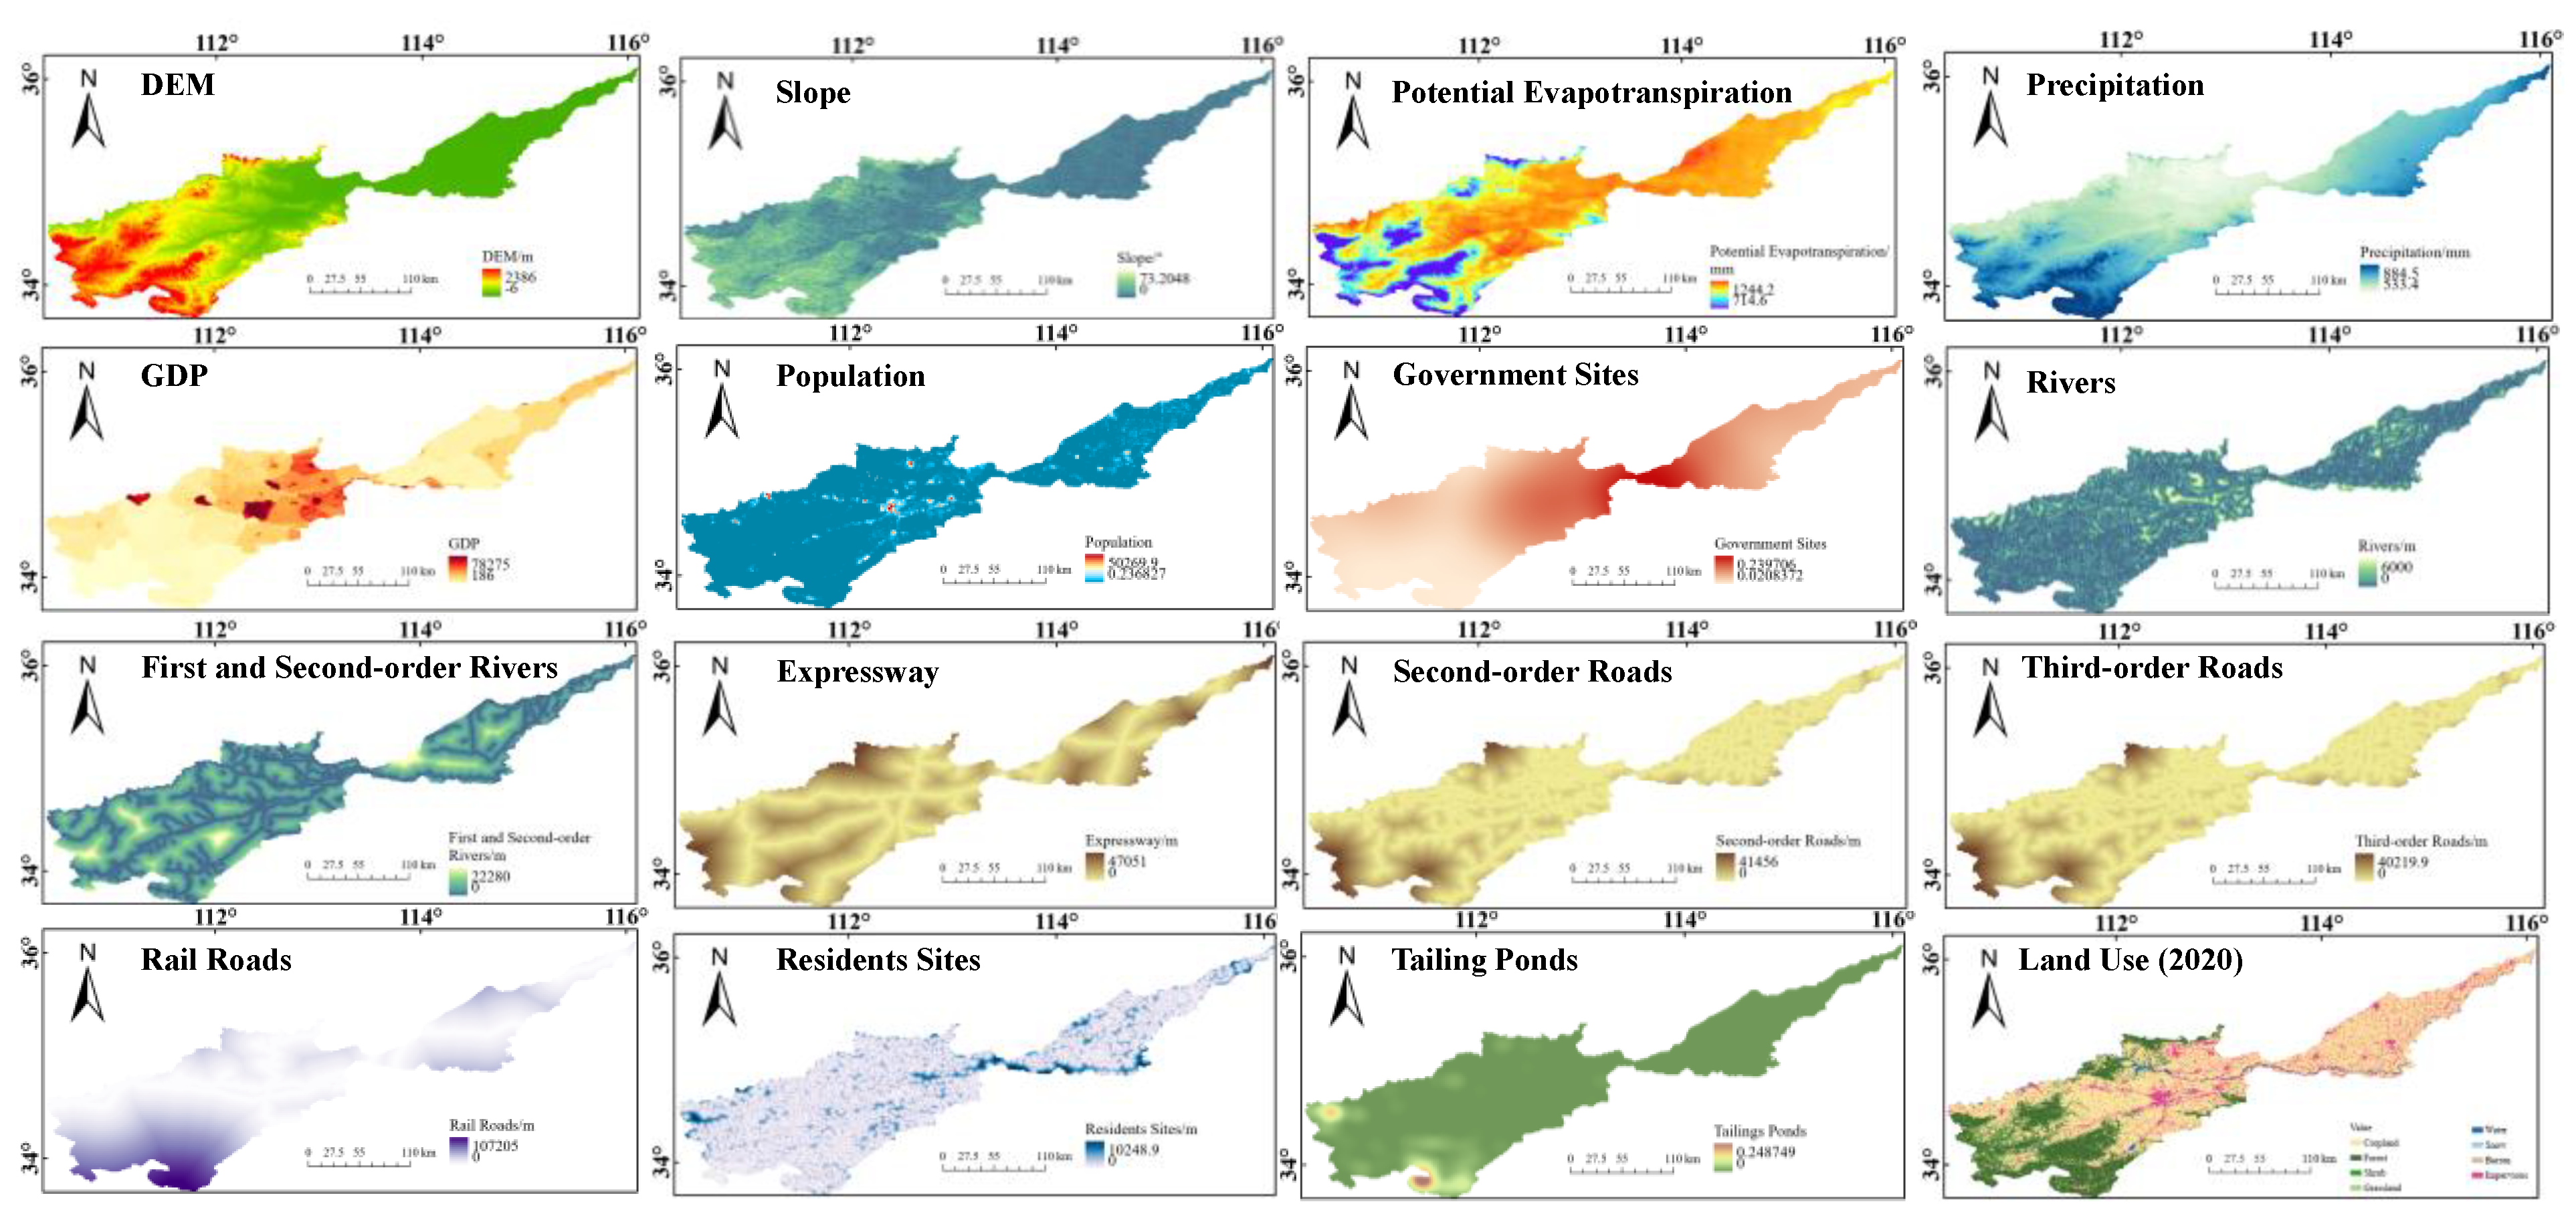
Figure 3.
Research framework of this study.
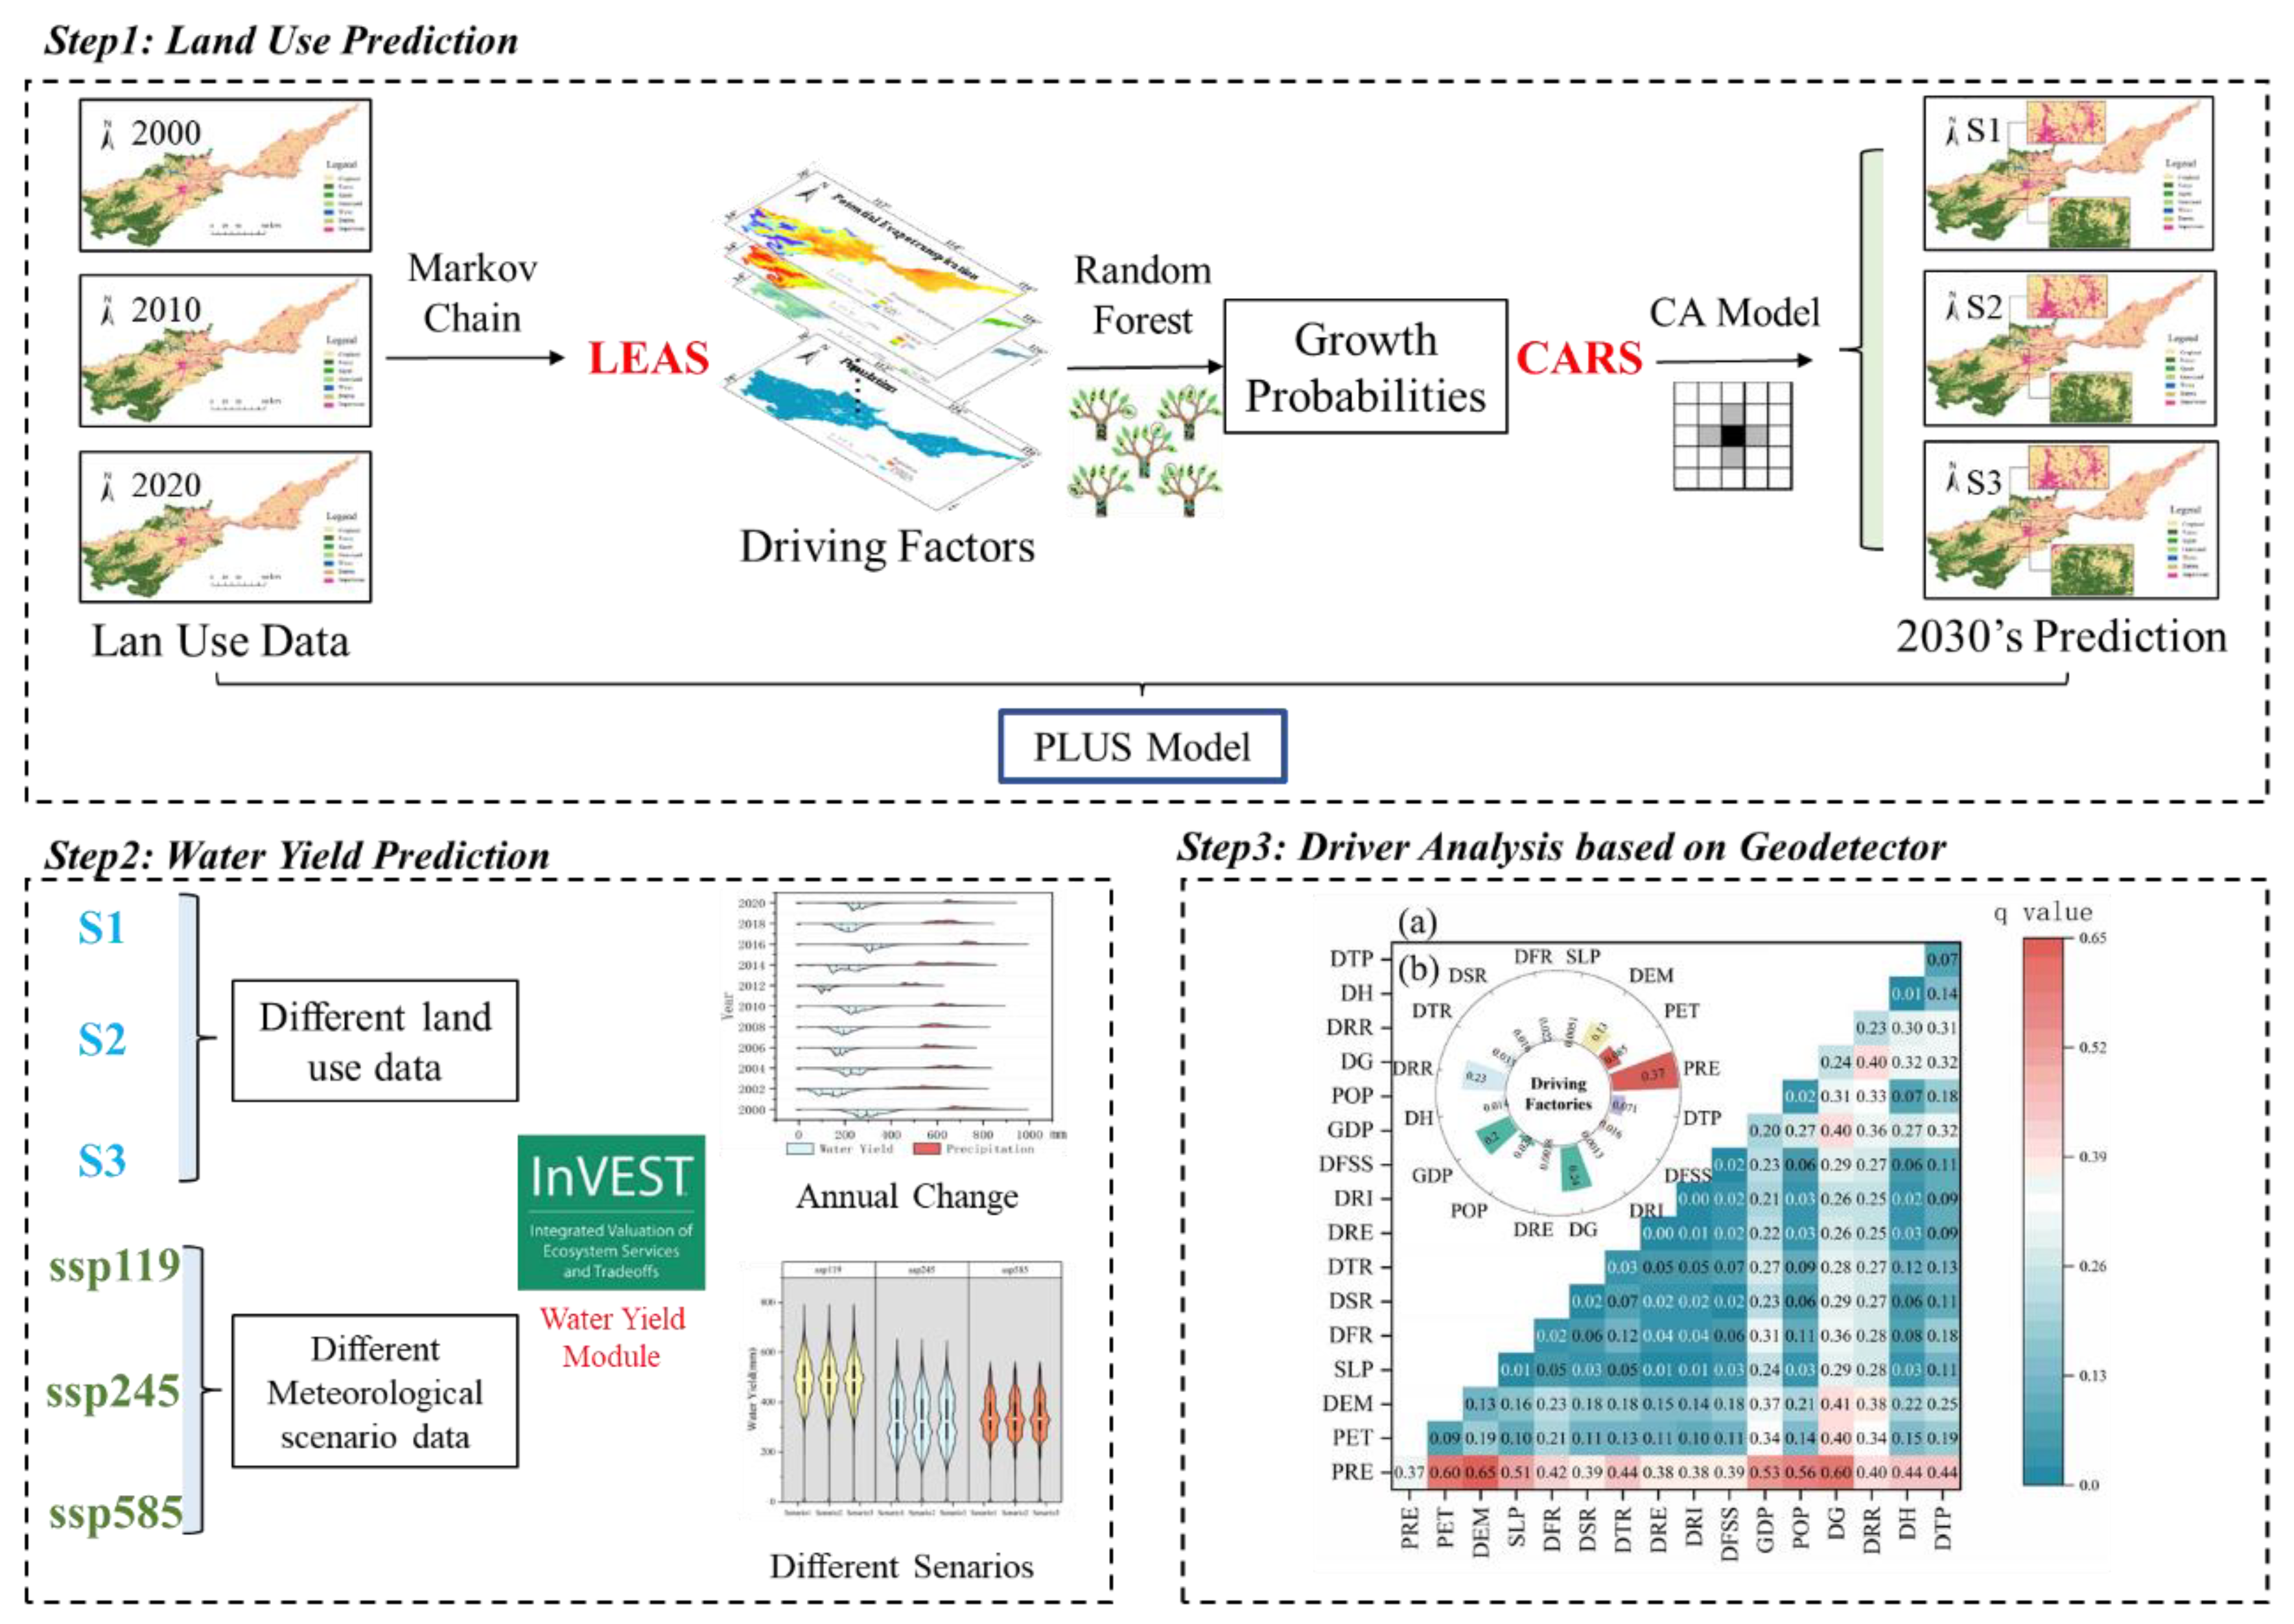
Figure 4.
The visualization of land use transfer matrix: (a) land use transformation, 2000-2010; (b) land use transformation, 2000-2010.
Figure 4.
The visualization of land use transfer matrix: (a) land use transformation, 2000-2010; (b) land use transformation, 2000-2010.
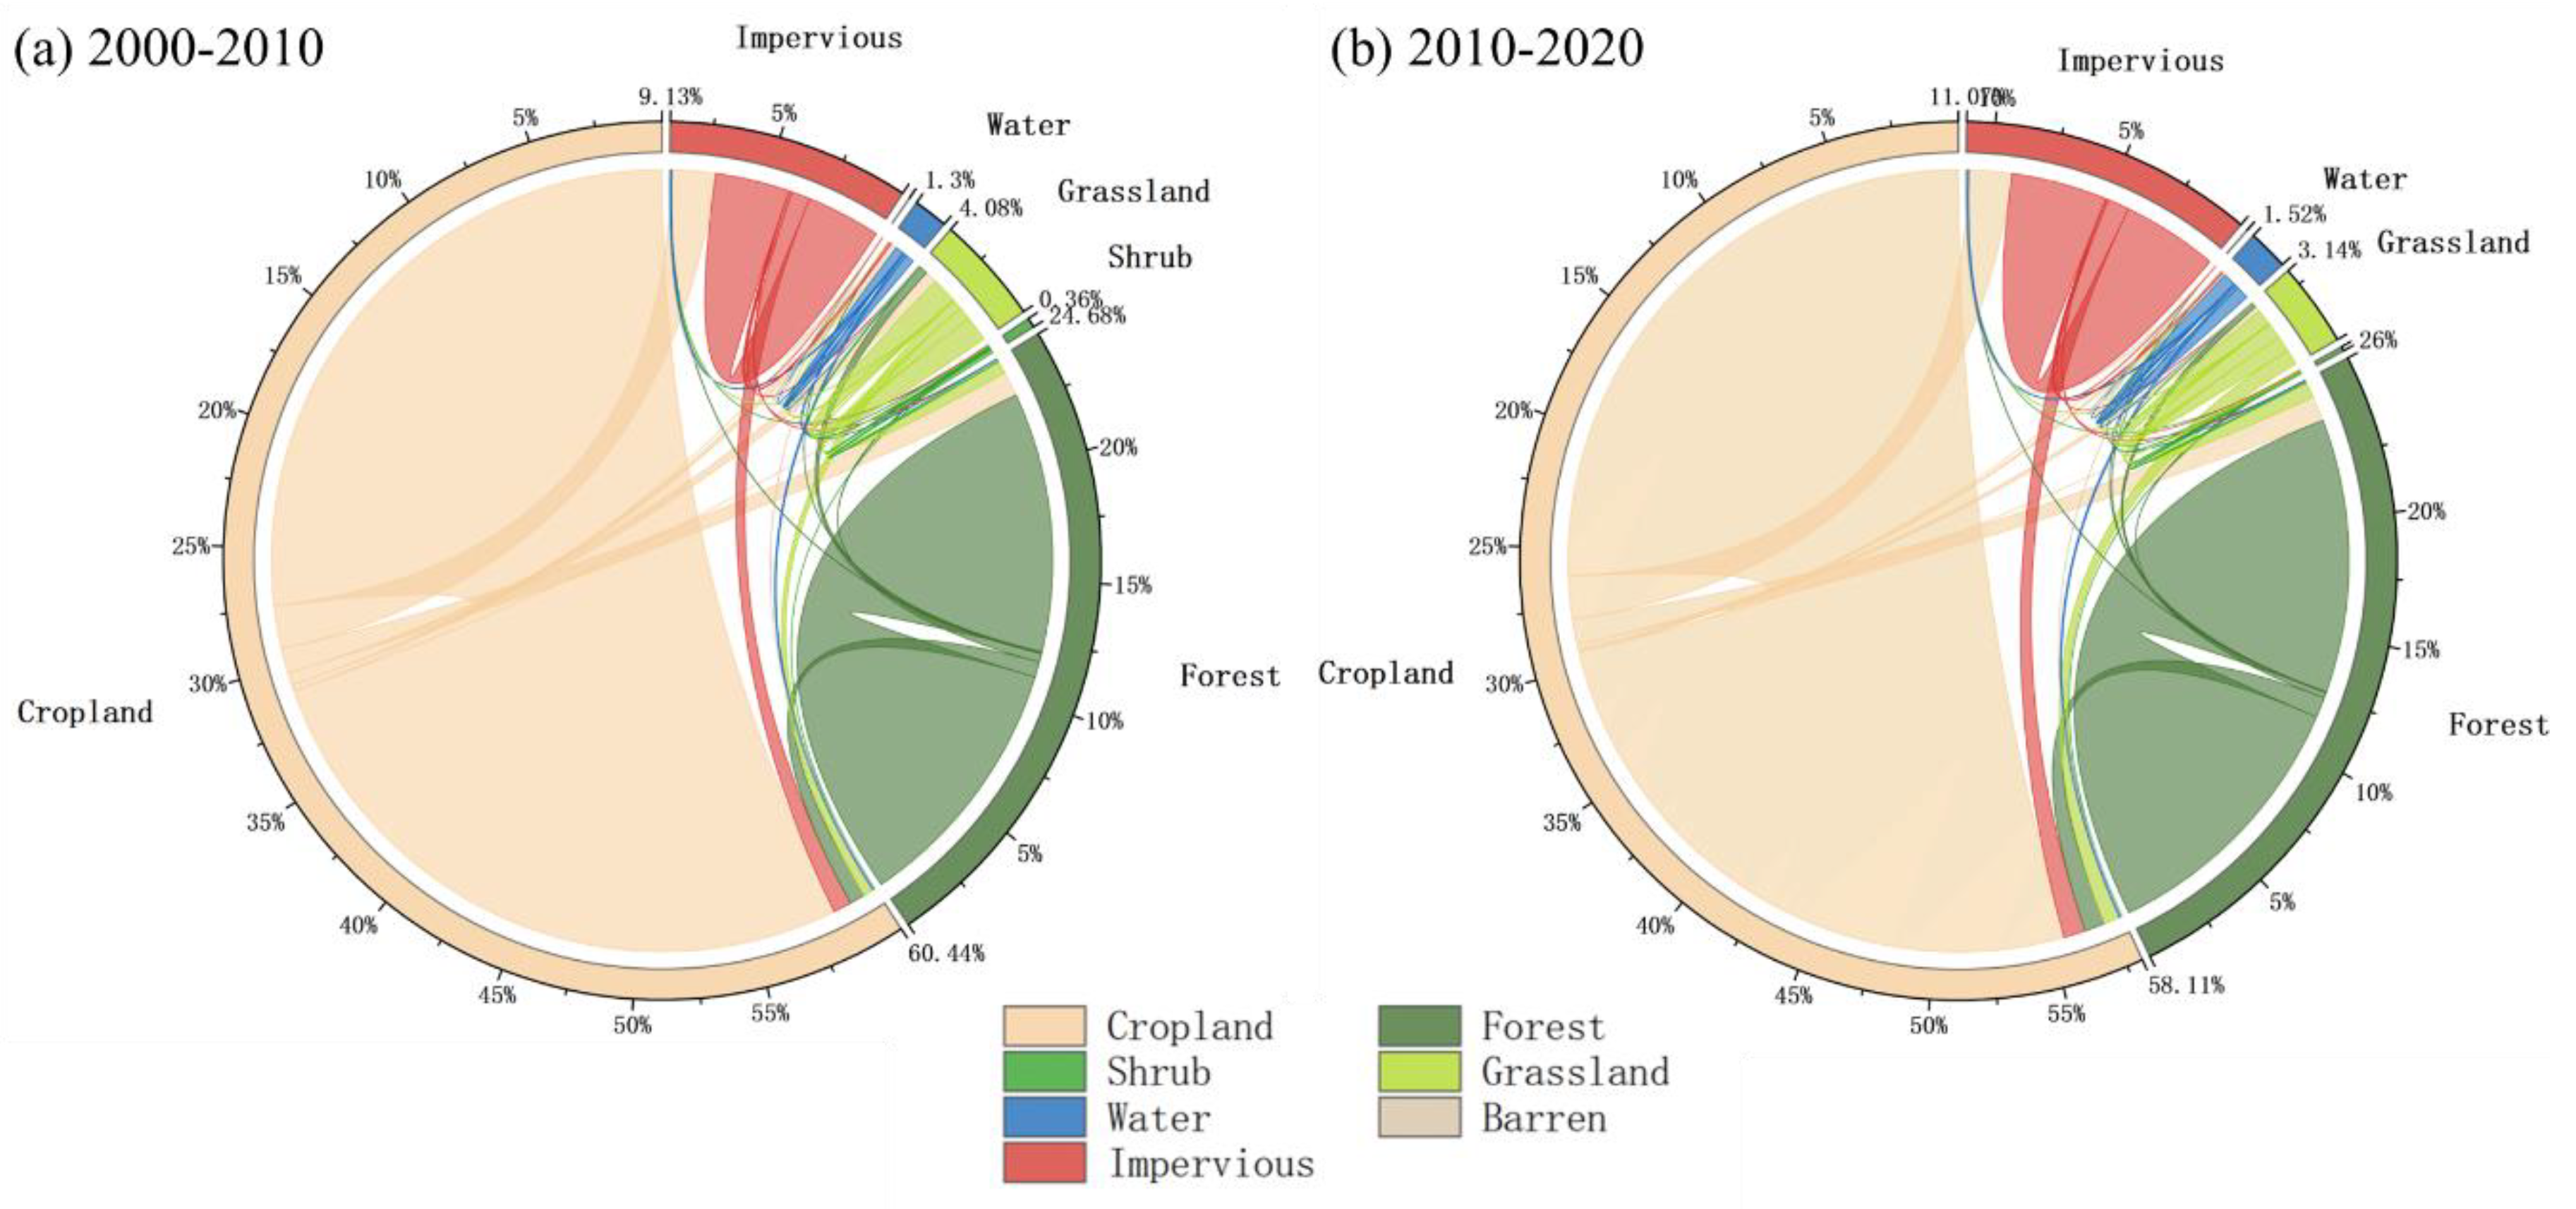
Figure 5.
Land use expansion: (a)2000-2010; (b)2010-2020.
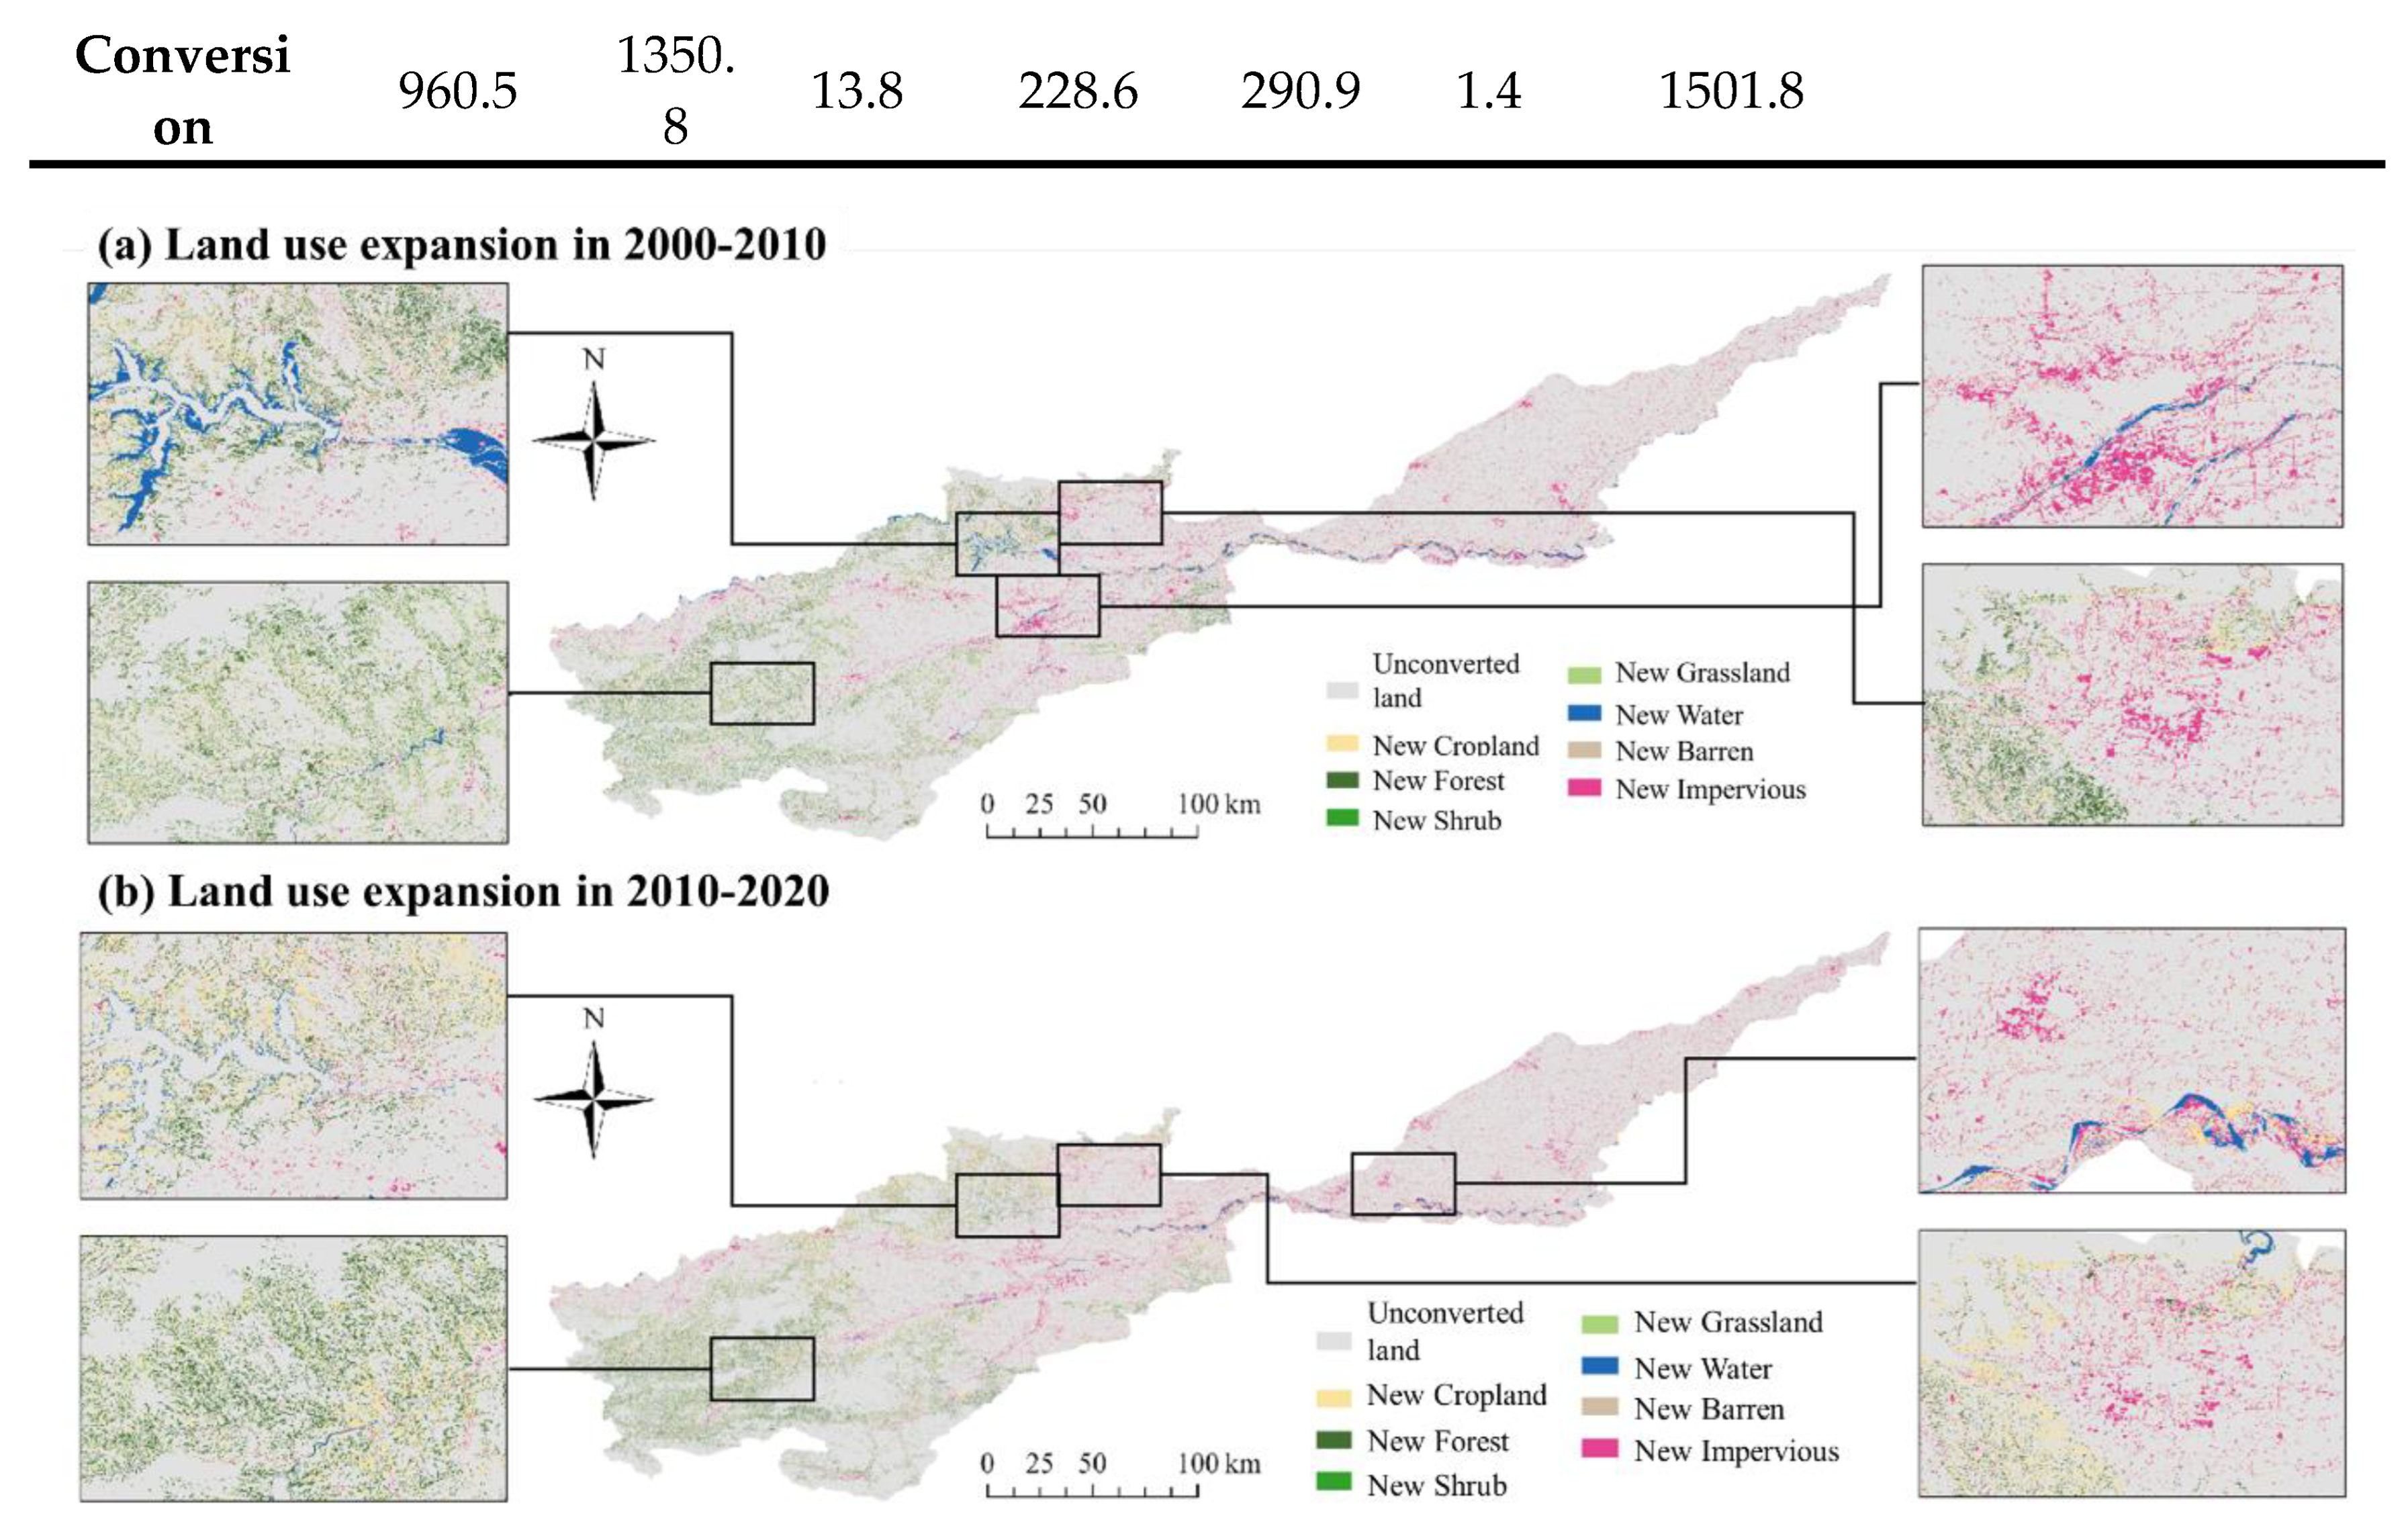
Figure 6.
The contribution of driving factors to land use.
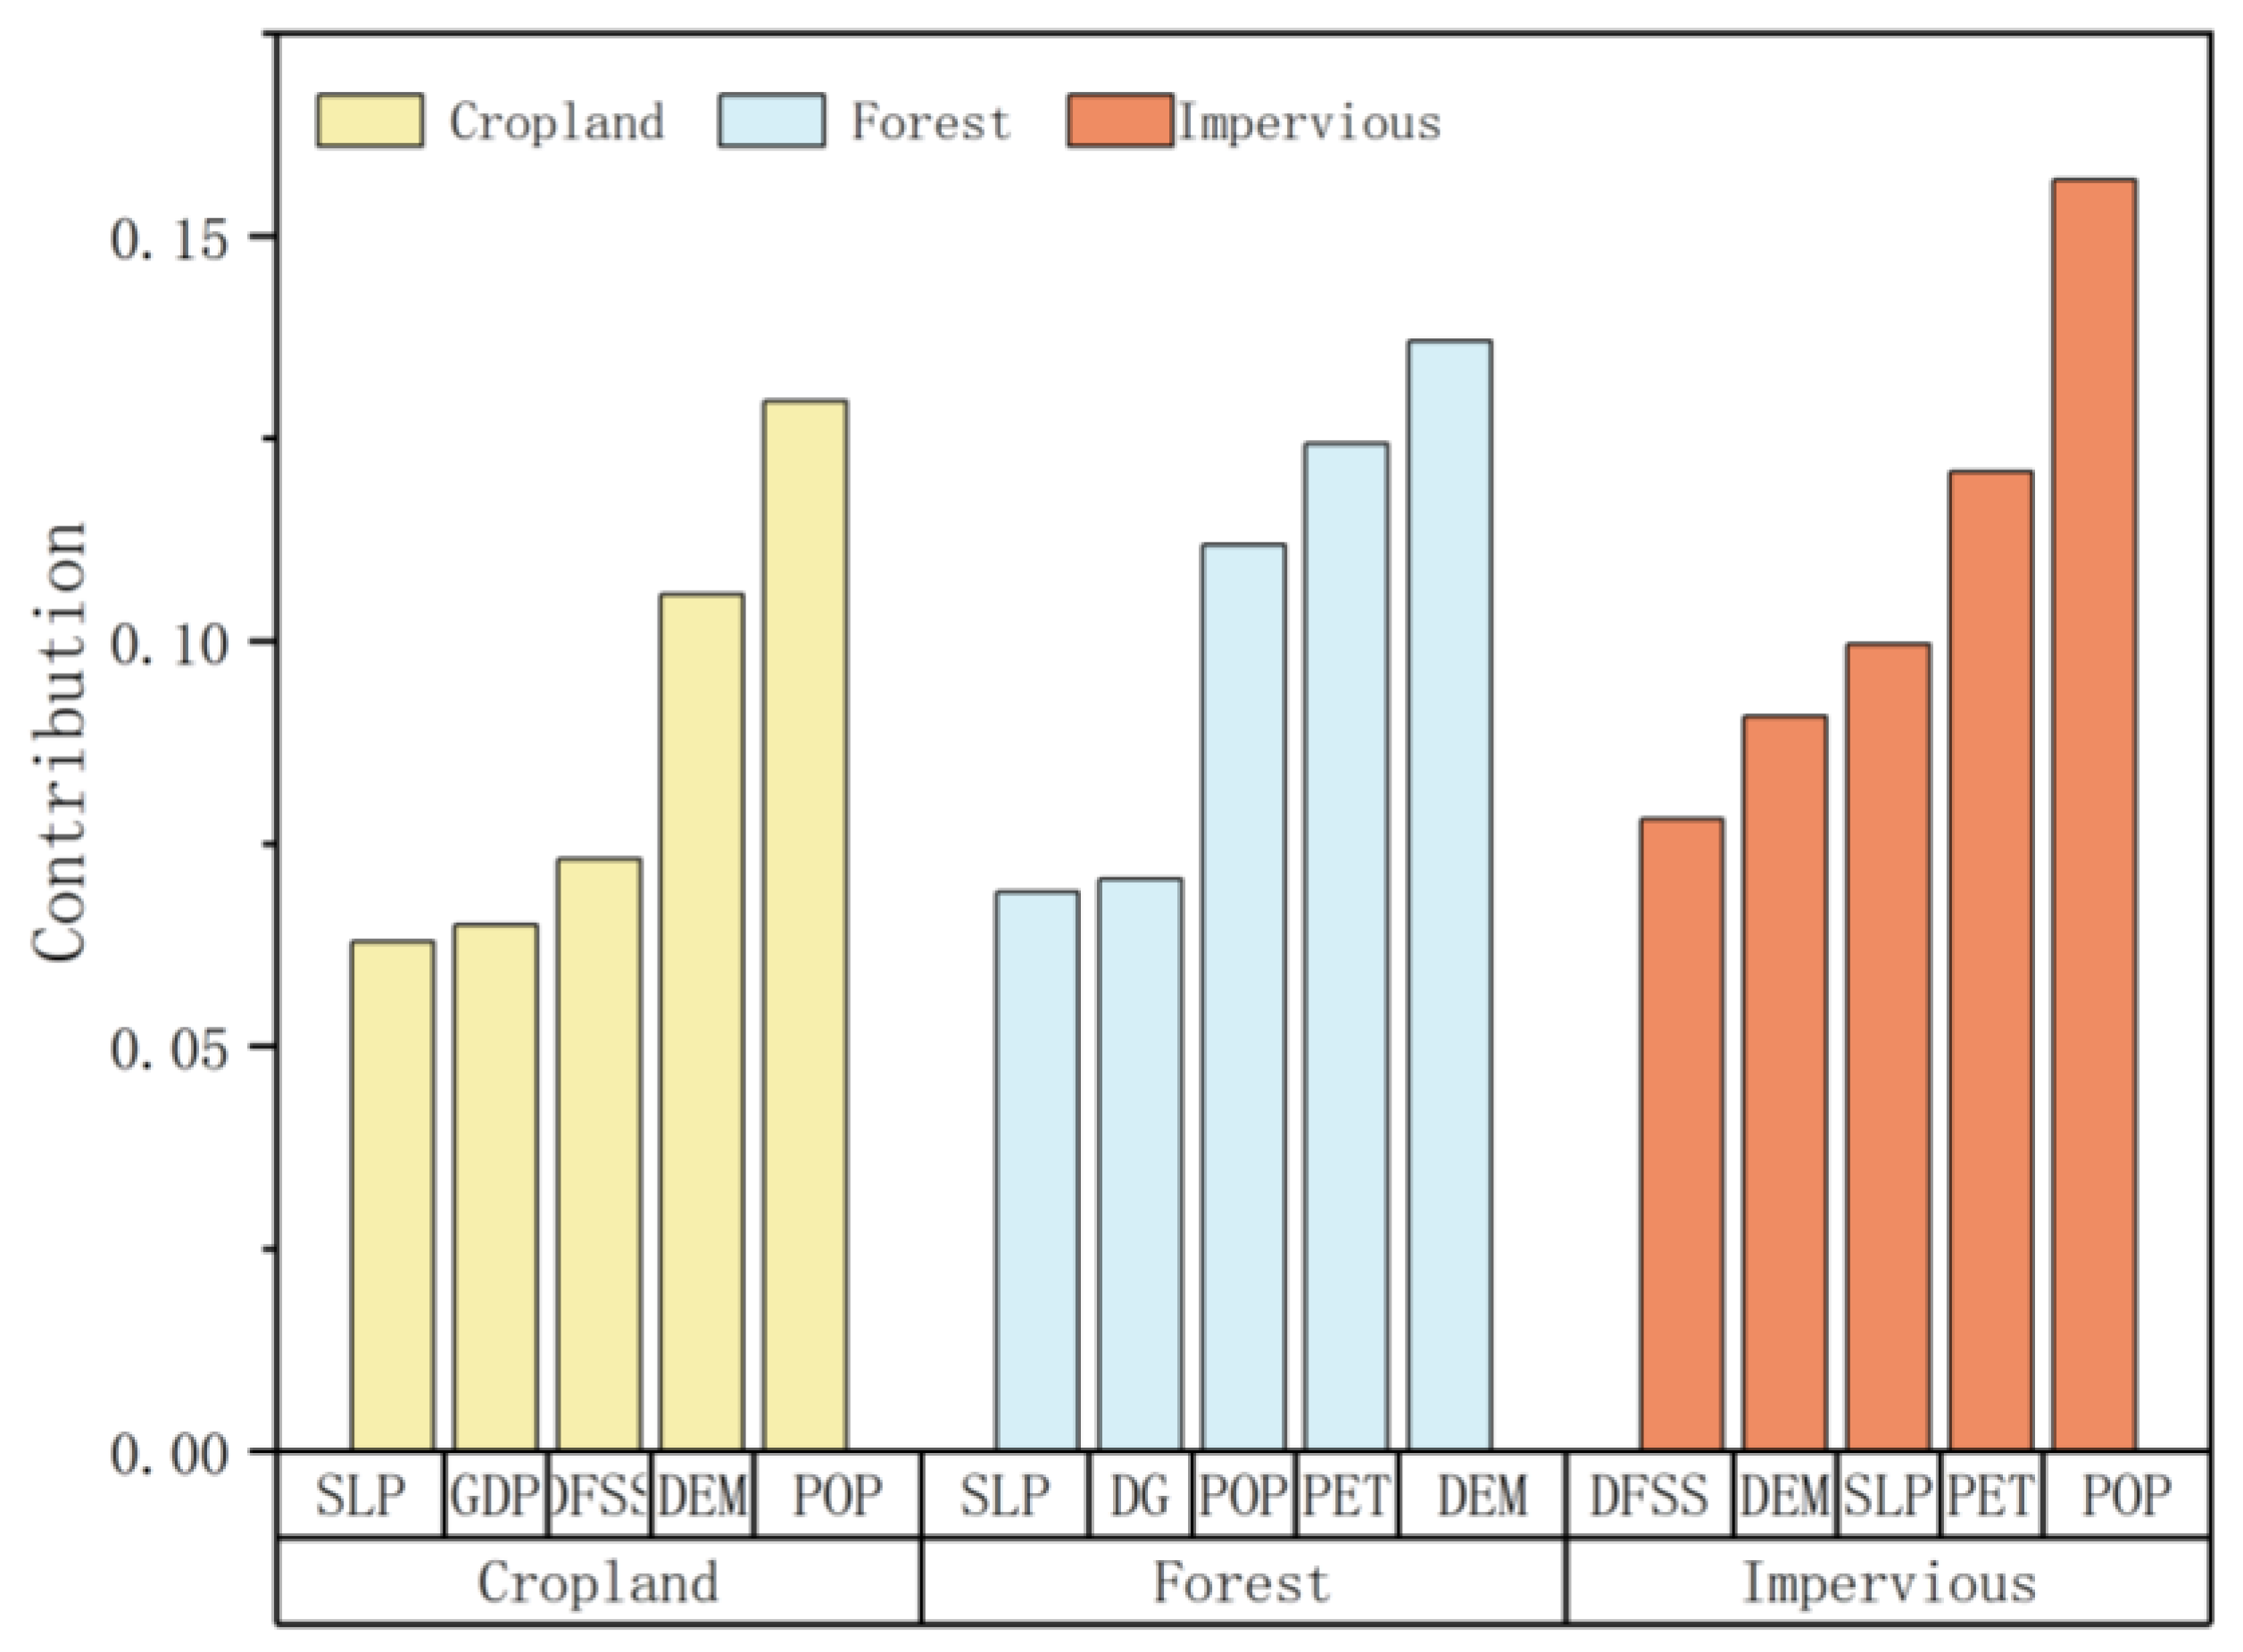
Figure 7.
Spatial distribution of land use predicted by PLUS model: (a) actual 2020’s land use; (b) predicted 2020’s land use; (c) predicted 2030’s land use; (d) predicted Senario1’s land use of 2030(economic development priority scenario); (e)predicted Senario2’s land use of 2030(ecological development priority scenario); (f)predicted Senario3’s land use of 2030(cropland development priority scenario).
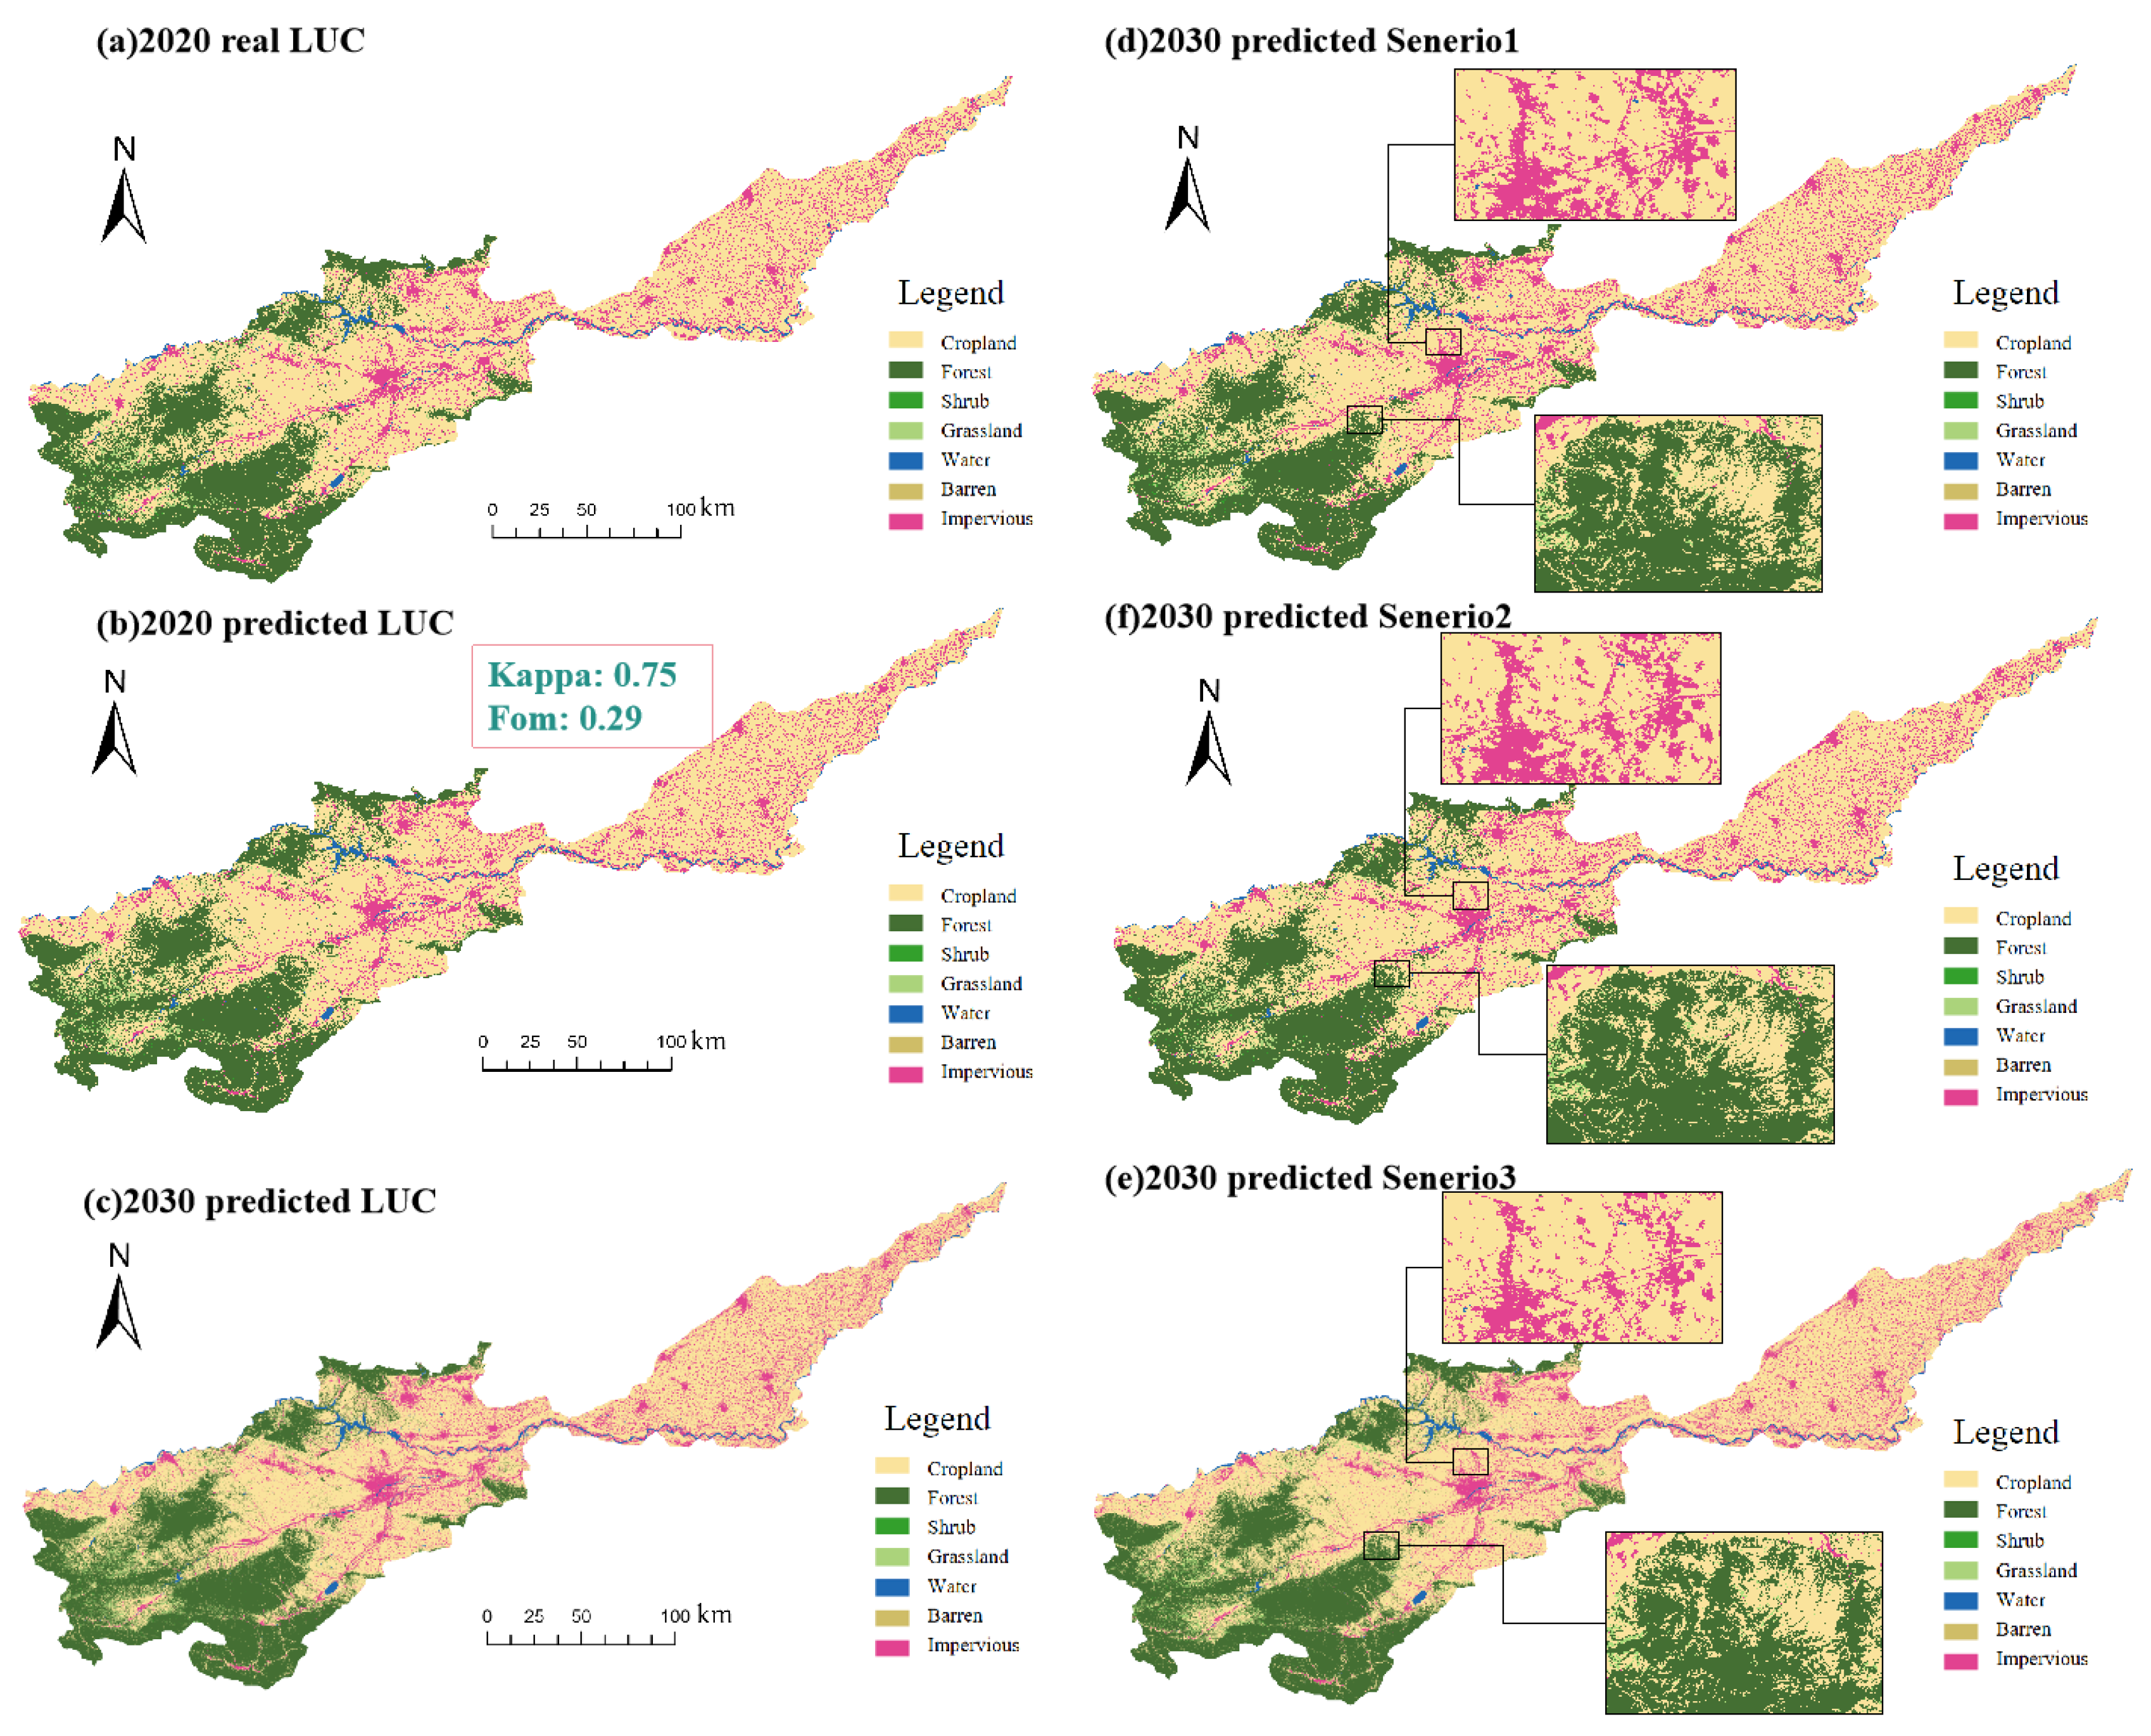
Figure 8.
Comparison of data distribution of water yield and precipitation in different years.
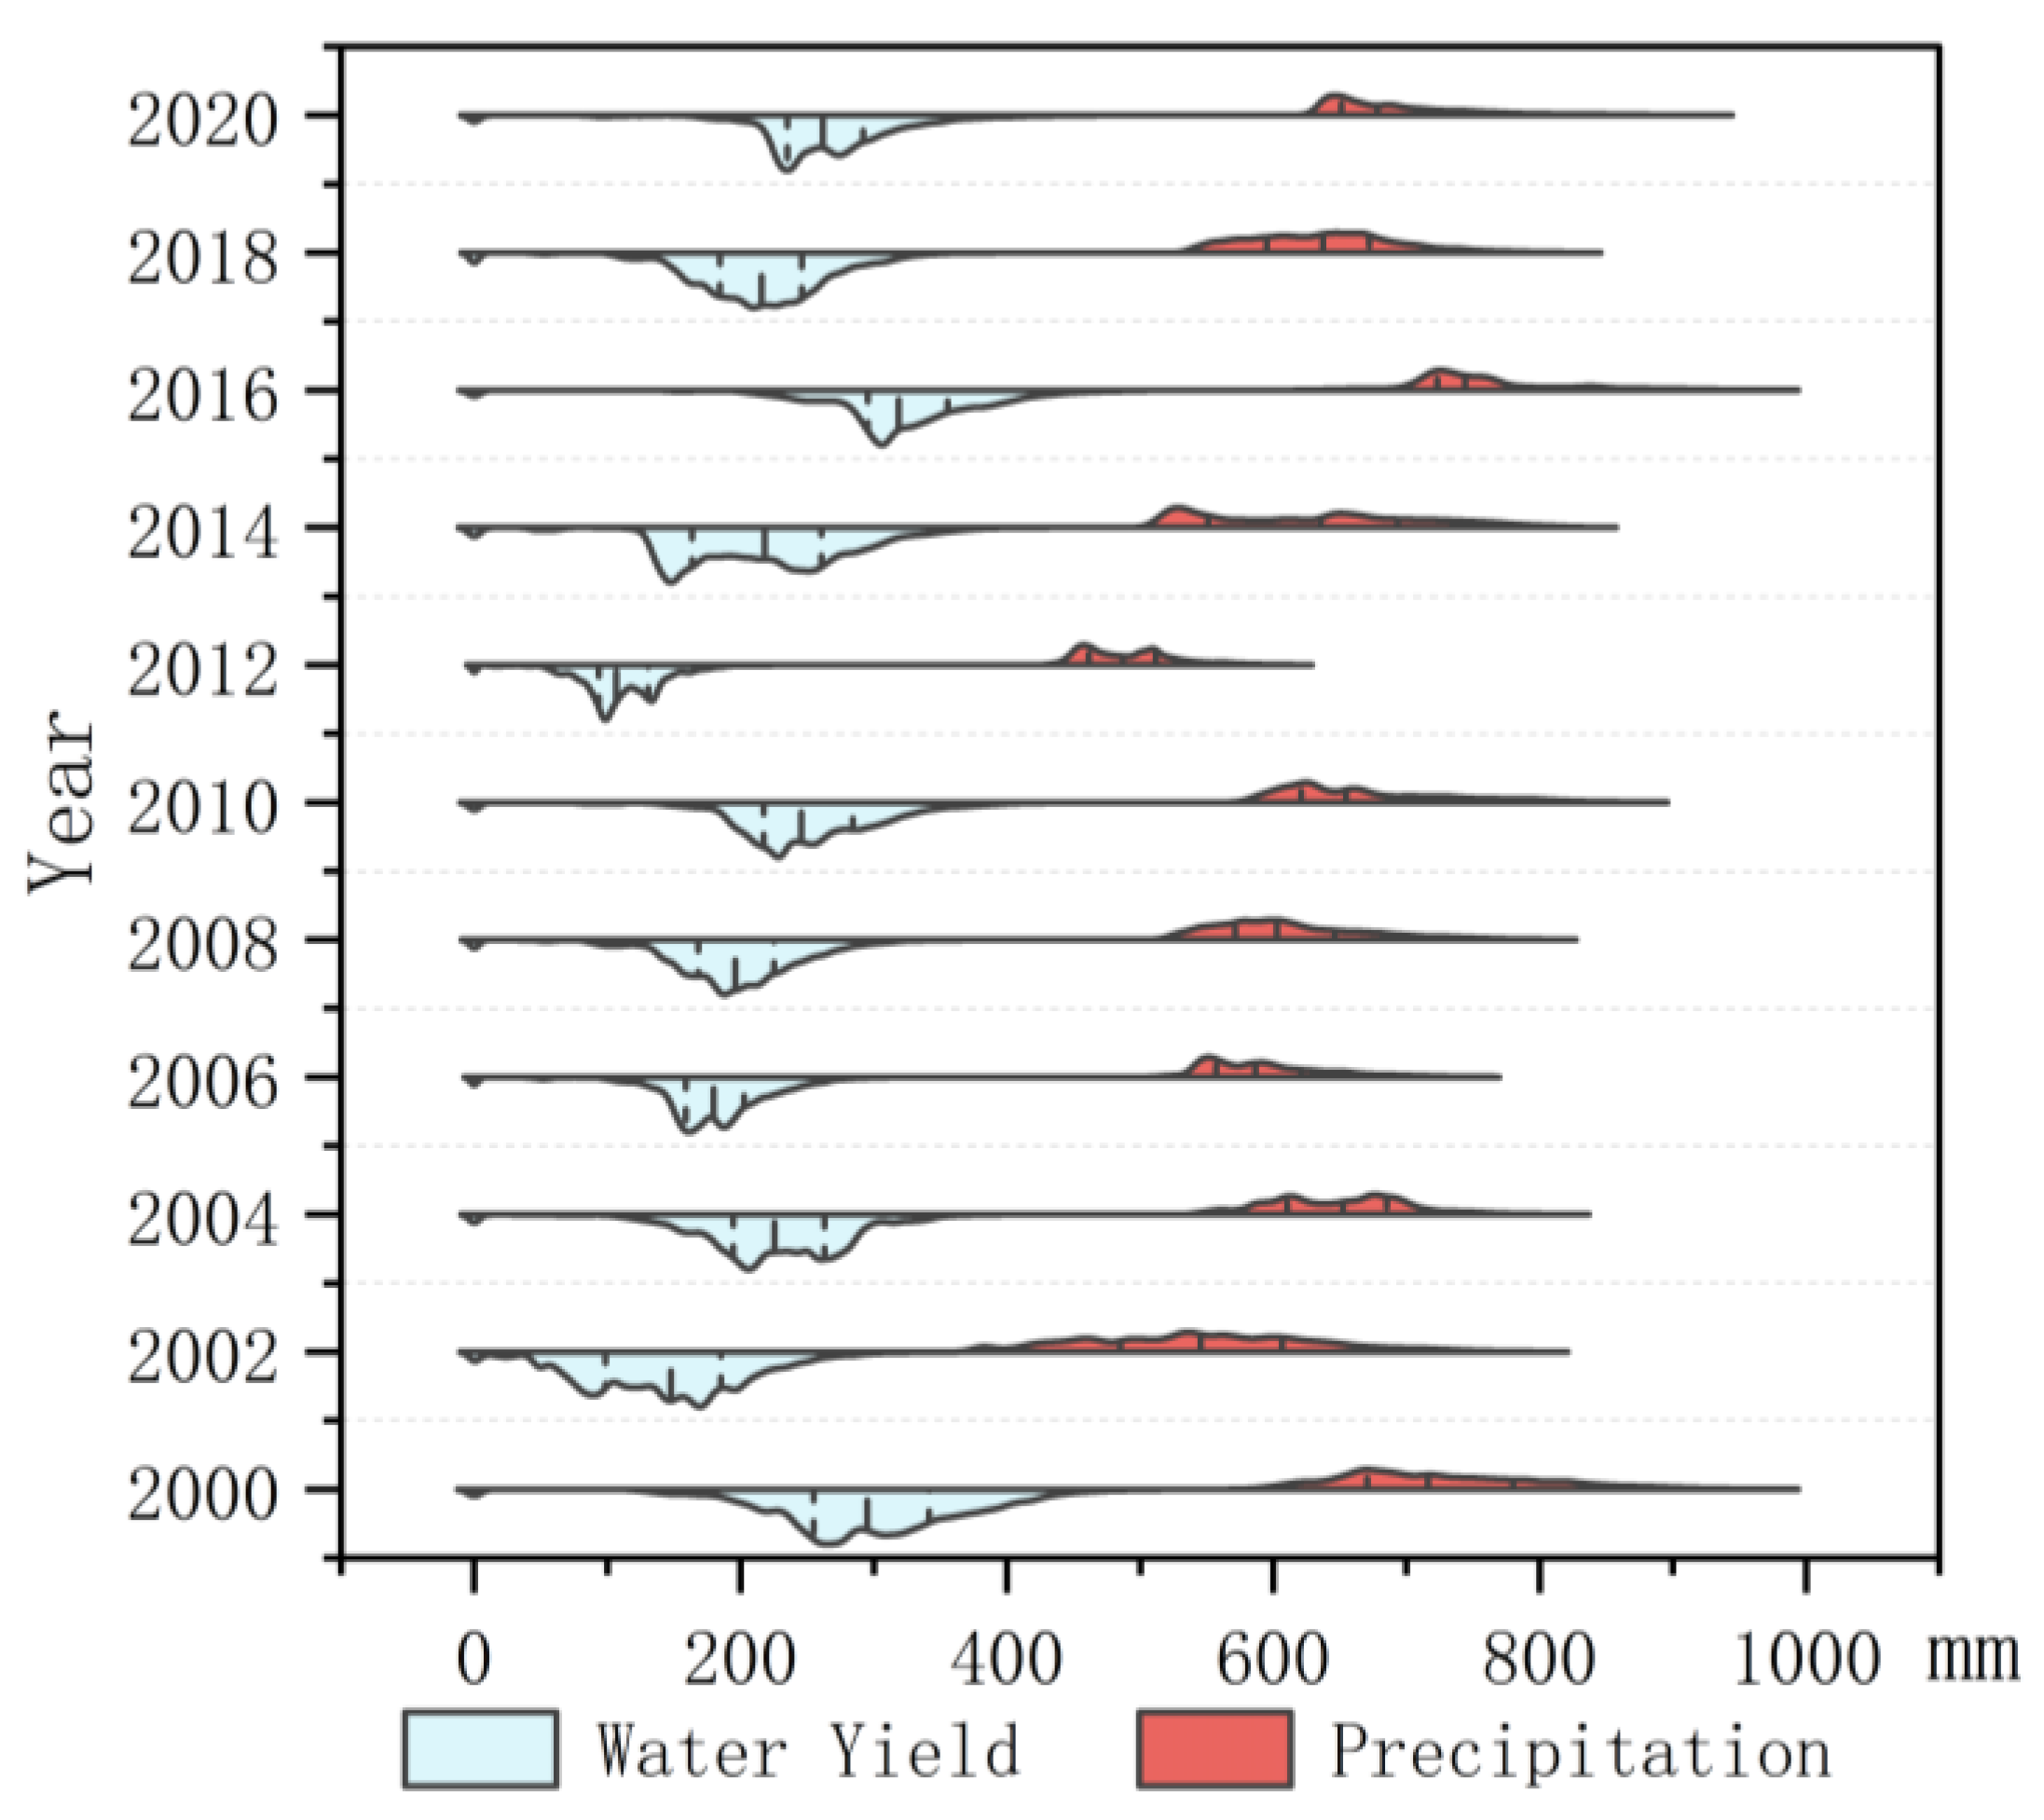
Figure 9.
Spatial distribution of historical water yield: (a)2000; (b)2010; (c)2020; (d)changes from 2000 to 2010; (e)changes from 2010 to 2020; (f)changes from 2000 to 2020.
Figure 9.
Spatial distribution of historical water yield: (a)2000; (b)2010; (c)2020; (d)changes from 2000 to 2010; (e)changes from 2010 to 2020; (f)changes from 2000 to 2020.
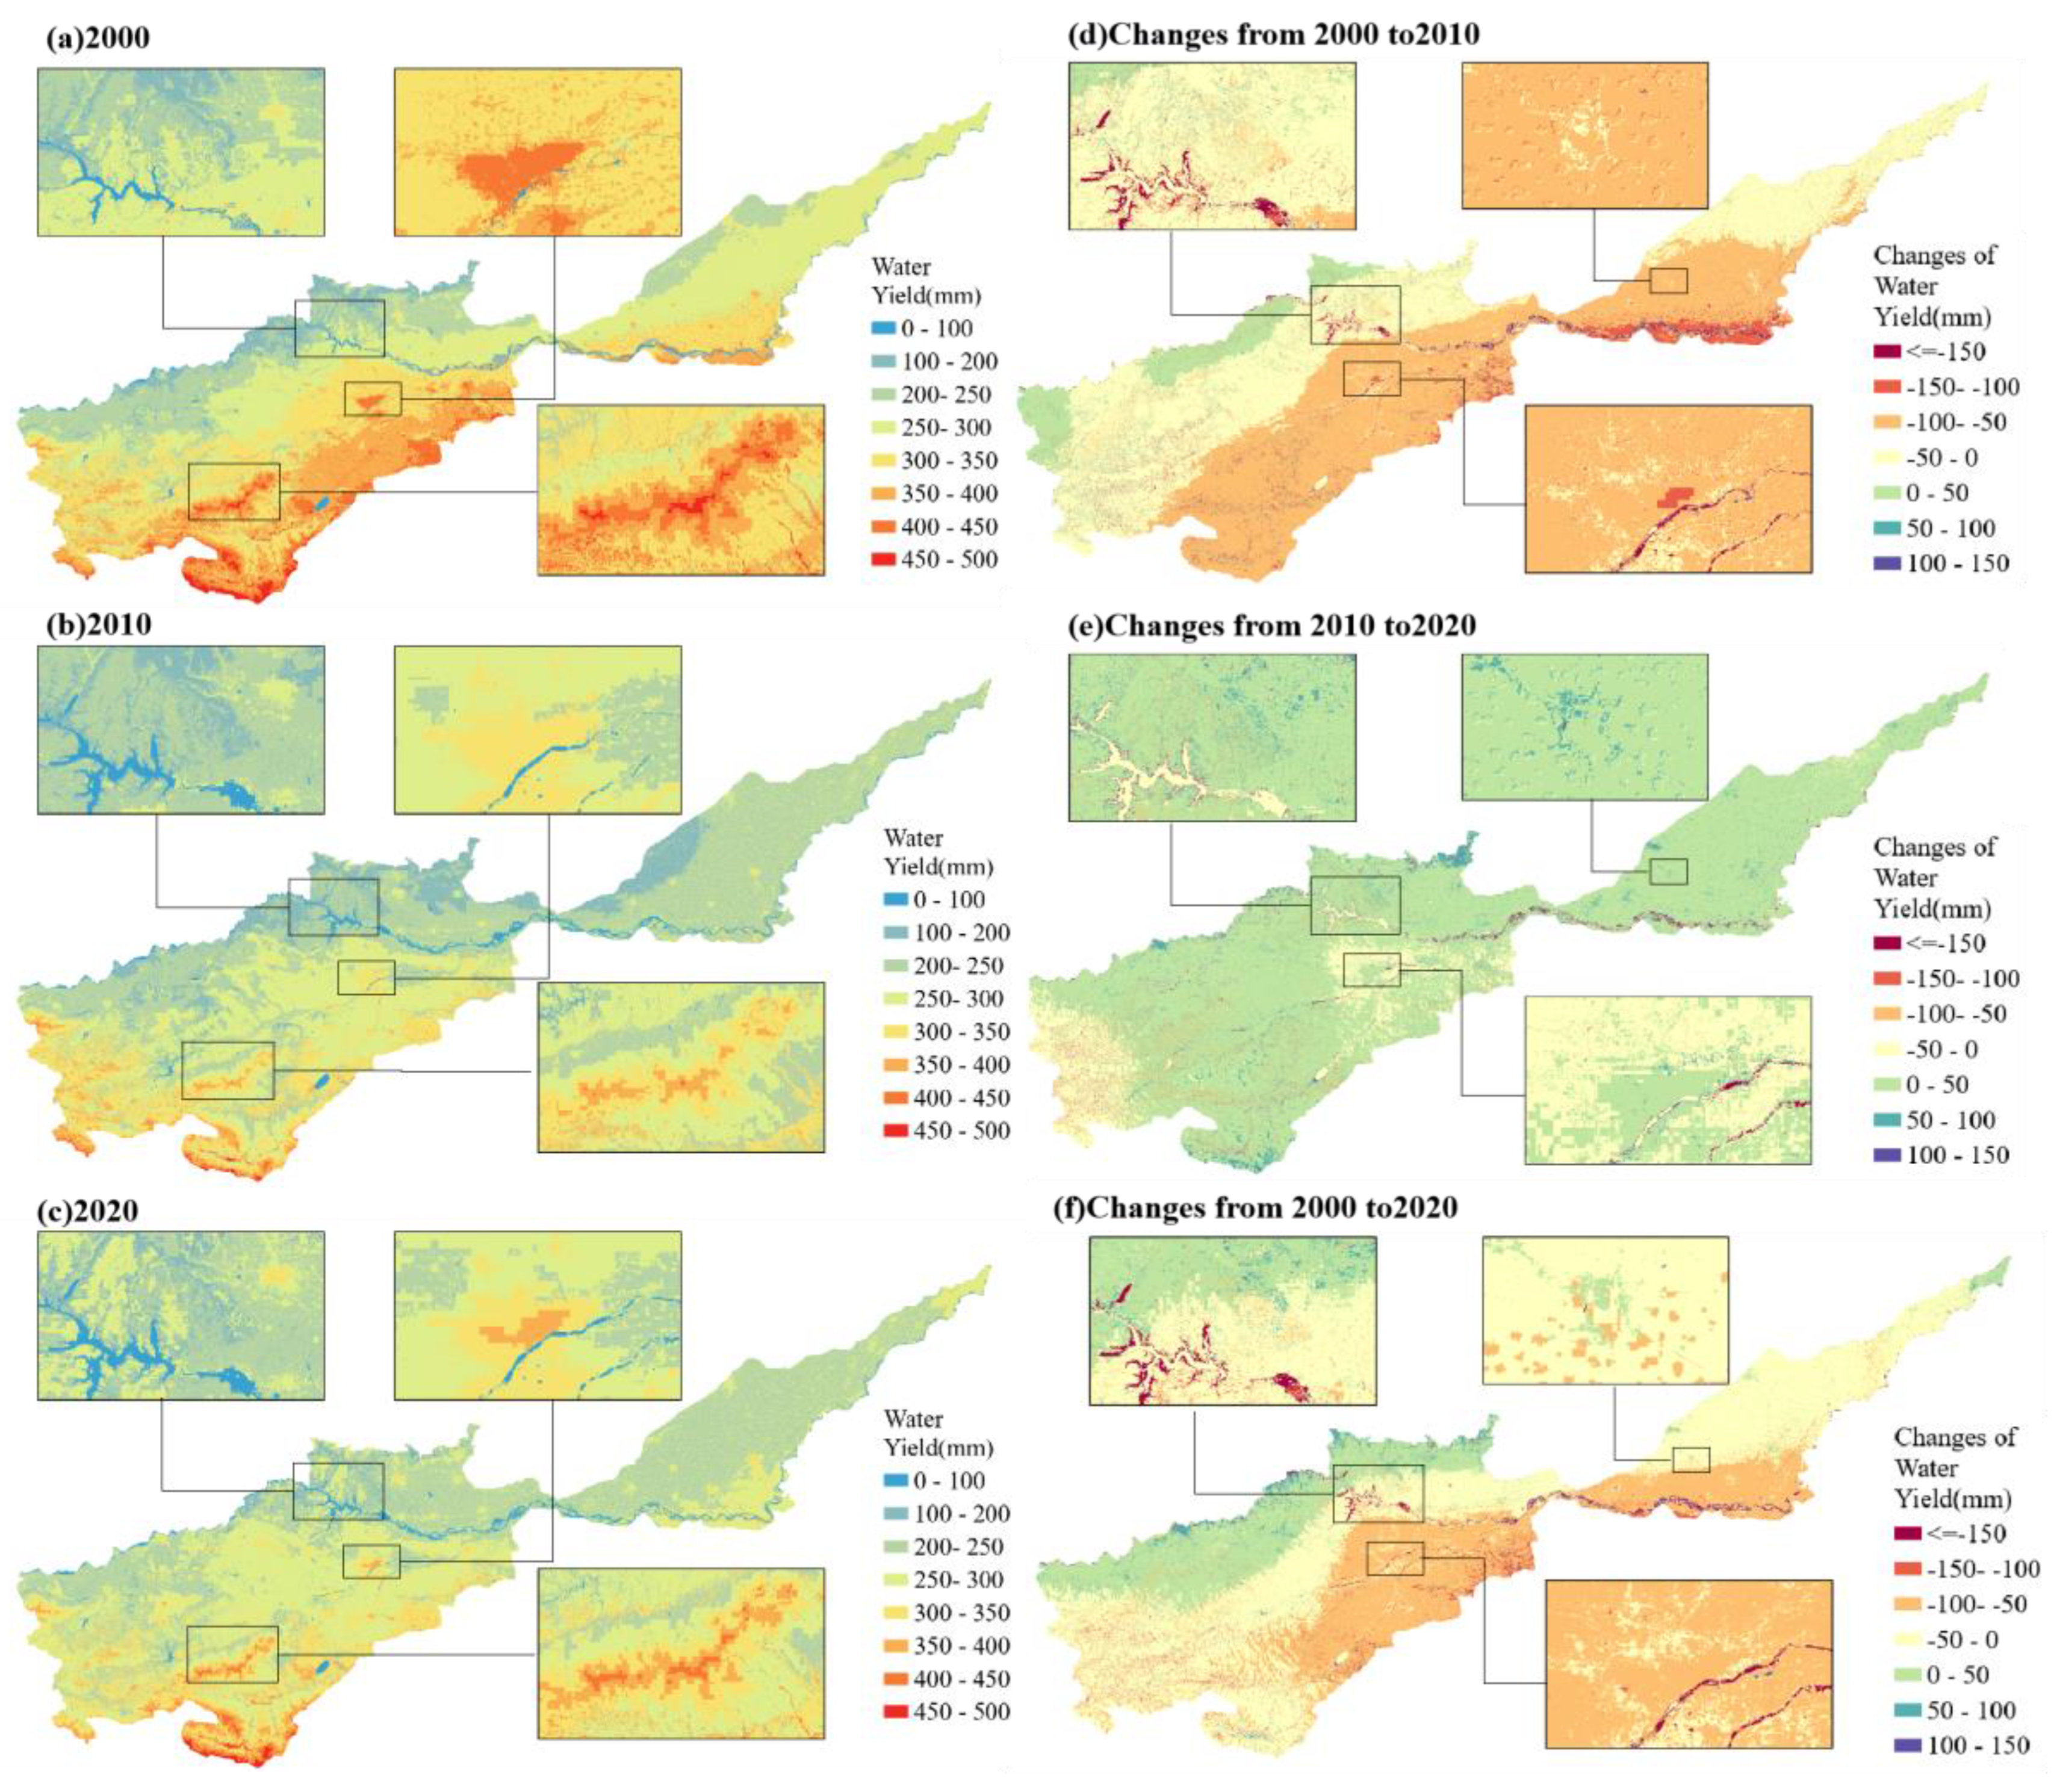
Figure 10.
Data distribution of water yield under different scenarios.
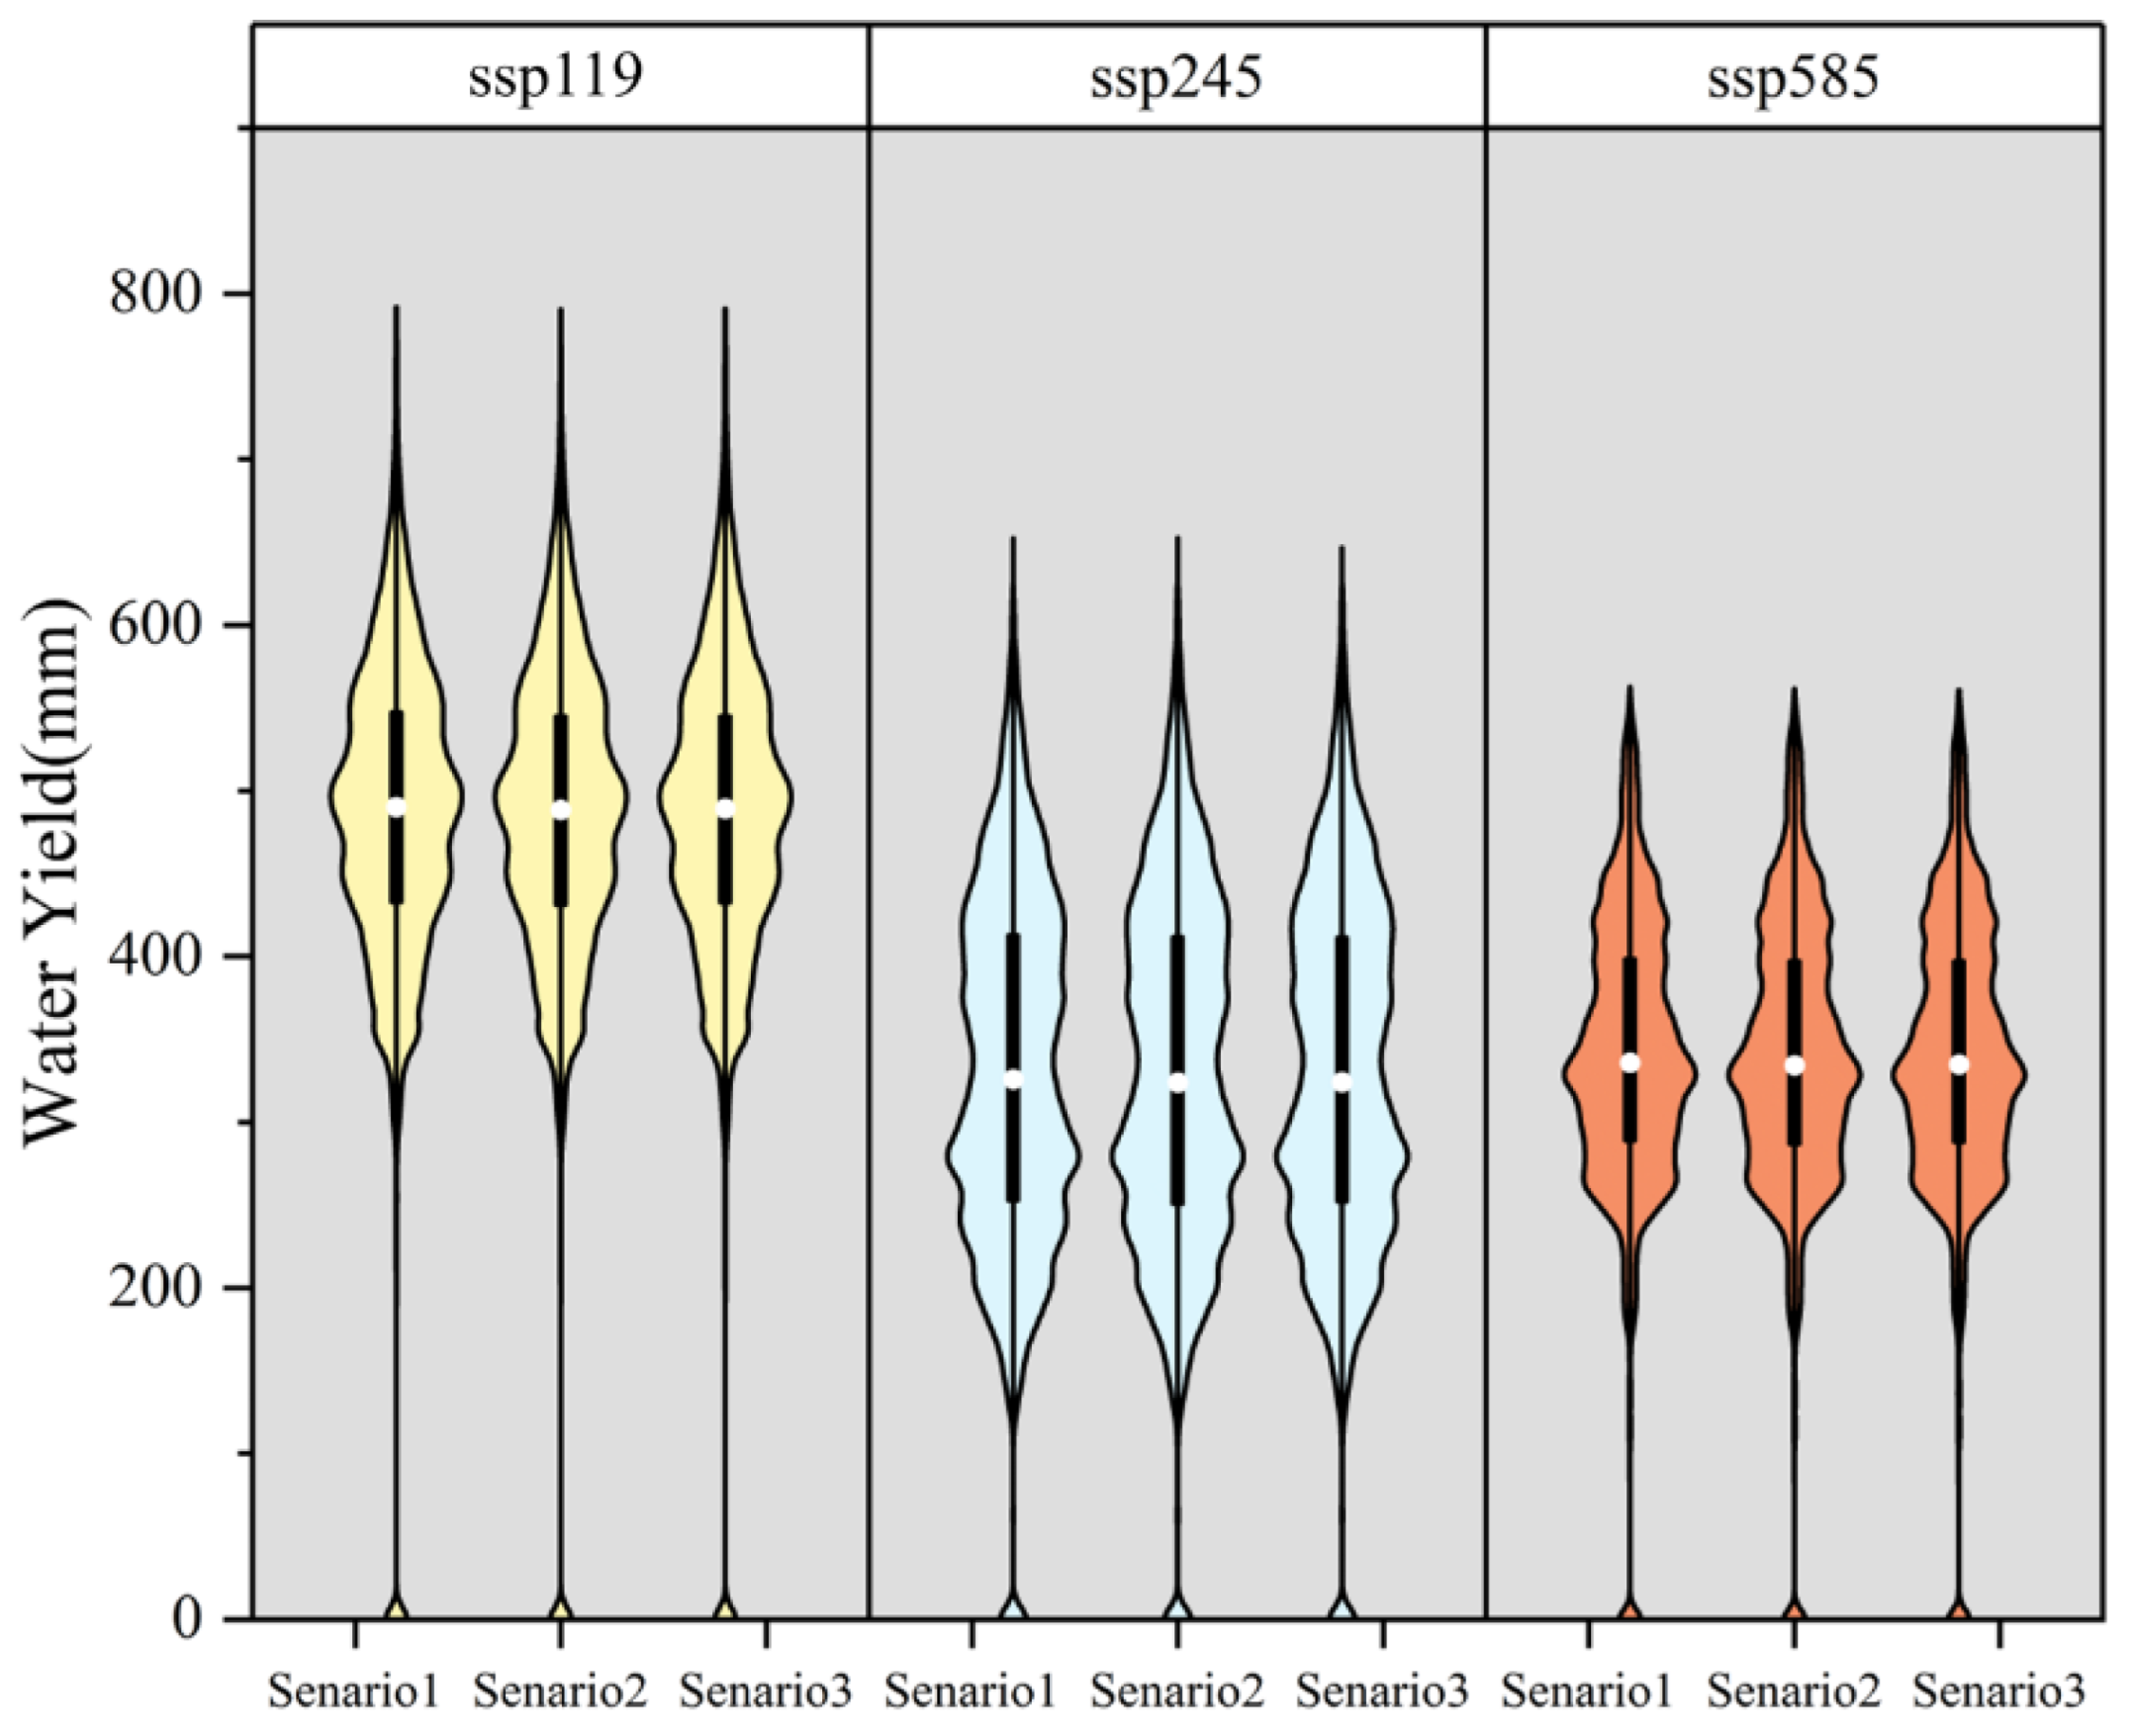
Figure 11.
The water yield spatial different of different meteorological scenarios and different land use development scenarios in 2030: (a) ssp119’s water yield; (b) ssp245’s water yield; (c) ssp585’s water yield; (d) Scenario 1’s water yield; (e) Scenario 2’s water yield; (f) Scenario 3’s water yield. Where (d), (e), (f) are local water yield maps, corresponding to Luoyang urban area and Funiu Mountain district.
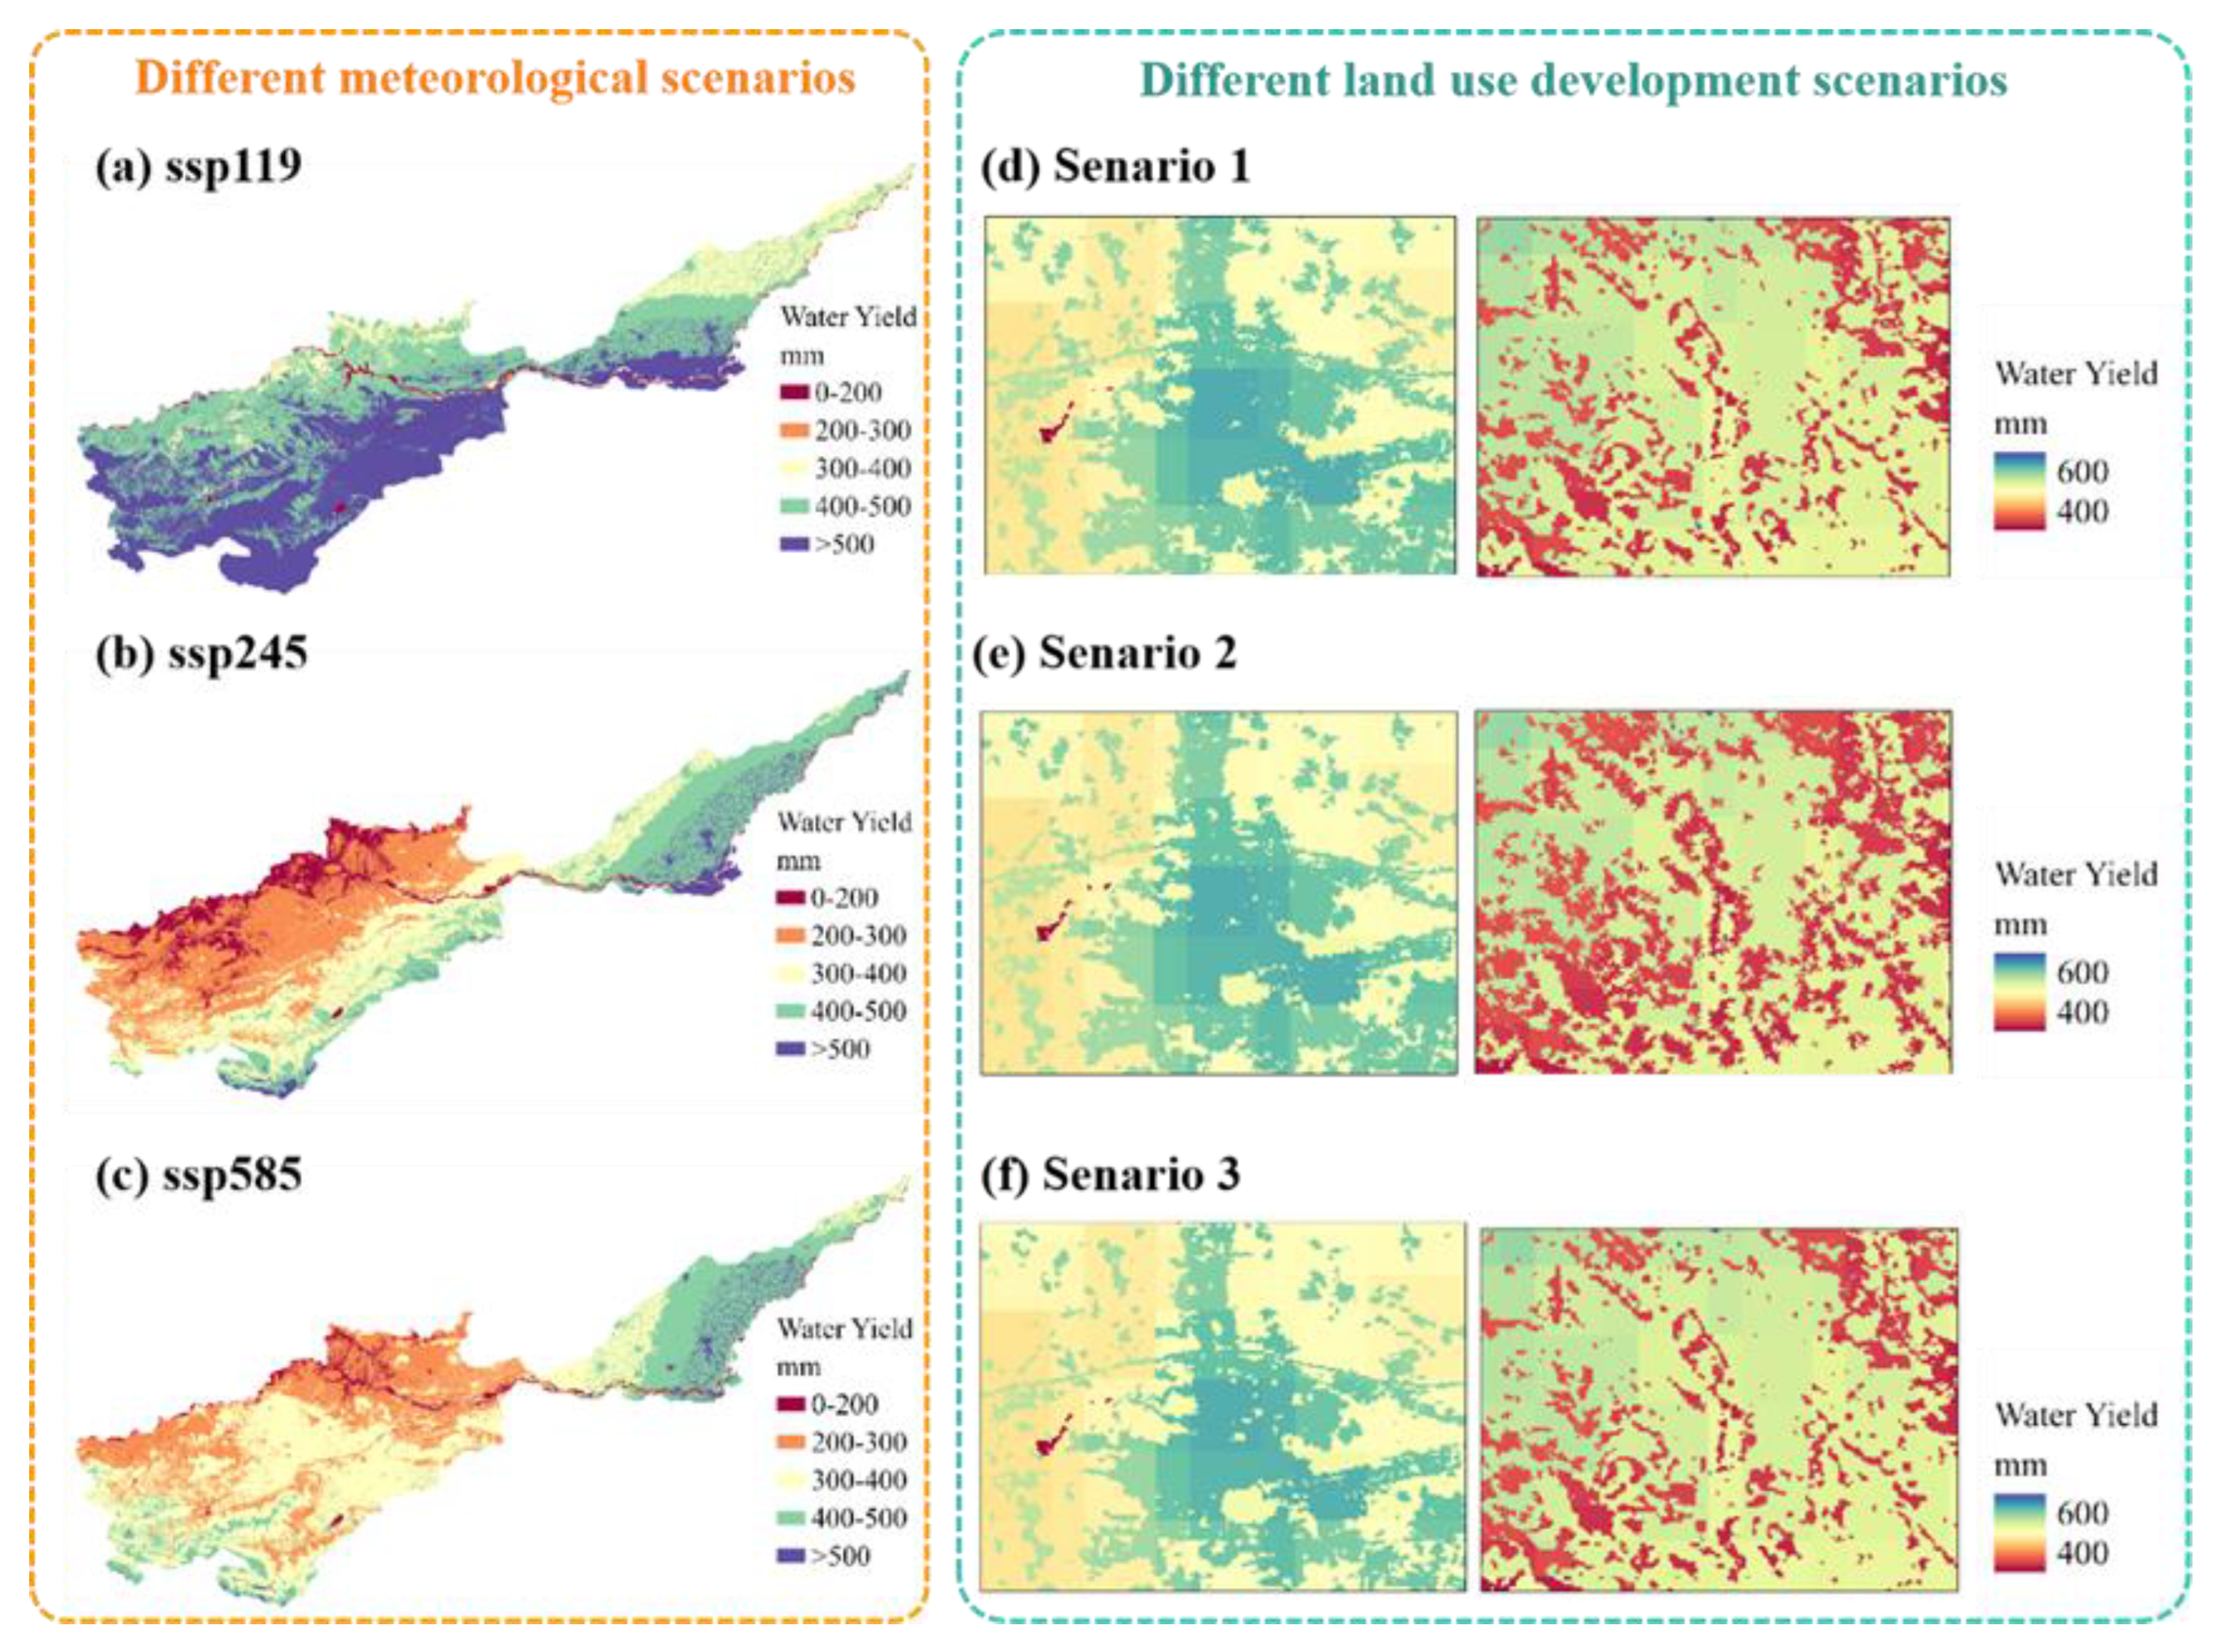
Figure 12.
Driving factors detection results: (a) the interactive detection results of each driving factor; (b) factor detection results of each driving factor.
Figure 12.
Driving factors detection results: (a) the interactive detection results of each driving factor; (b) factor detection results of each driving factor.
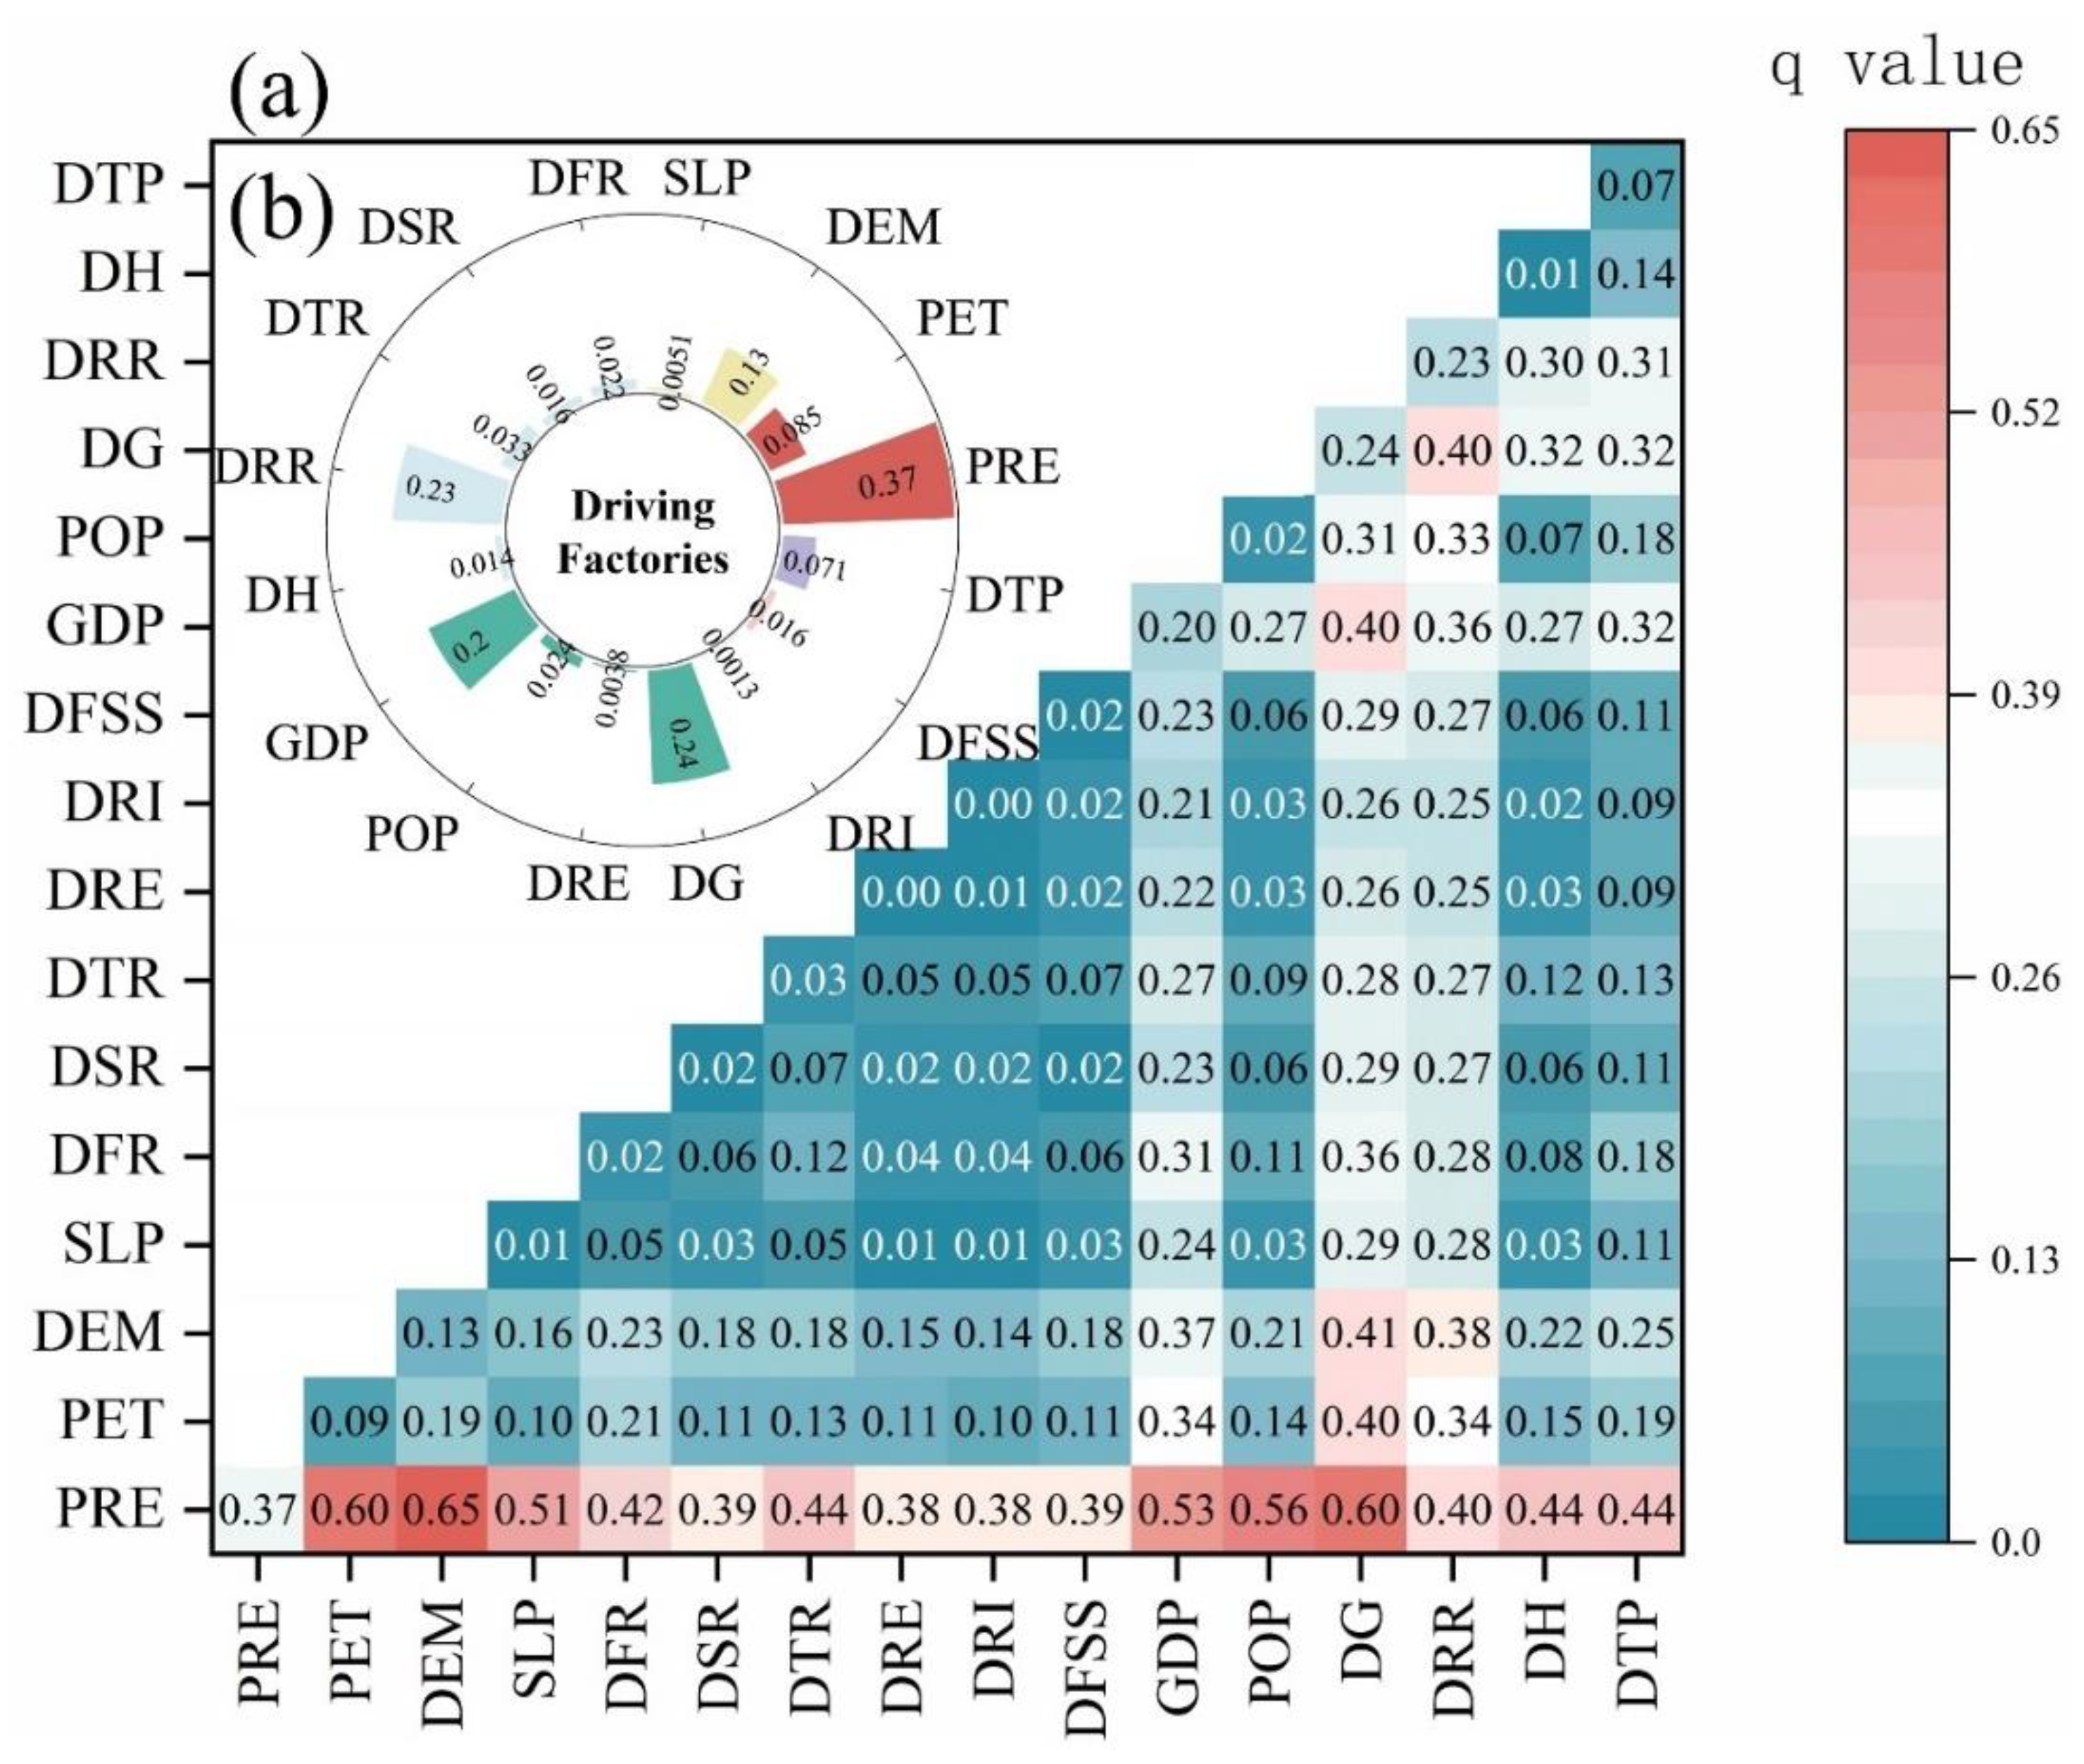
Table 2.
The rule matrix of LUC conversion in three scenarios*.
| Scenario 1 (economic development priority) |
Scenario 2 (ecological development priority) |
Scenario 3 (cropland development priority) |
|||||||||||||||||||
|---|---|---|---|---|---|---|---|---|---|---|---|---|---|---|---|---|---|---|---|---|---|
| a | b | c | d | e | f | g | a | b | c | d | e | f | g | a | b | c | d | e | f | g | |
| a | 1 | 1 | 0 | 1 | 0 | 0 | 1 | 1 | 1 | 0 | 1 | 0 | 0 | 1 | 1 | 0 | 0 | 0 | 0 | 0 | 0 |
| b | 1 | 1 | 0 | 0 | 0 | 0 | 1 | 0 | 1 | 0 | 0 | 0 | 0 | 0 | 1 | 1 | 0 | 0 | 0 | 0 | 0 |
| c | 0 | 1 | 1 | 1 | 0 | 0 | 1 | 0 | 1 | 1 | 1 | 0 | 0 | 0 | 1 | 1 | 1 | 1 | 0 | 0 | 0 |
| d | 0 | 1 | 1 | 1 | 0 | 0 | 1 | 0 | 1 | 1 | 1 | 0 | 0 | 0 | 1 | 1 | 1 | 1 | 0 | 0 | 0 |
| e | 0 | 0 | 0 | 0 | 1 | 0 | 1 | 0 | 0 | 0 | 0 | 1 | 0 | 1 | 1 | 0 | 0 | 0 | 1 | 0 | 1 |
| f | 0 | 0 | 0 | 1 | 1 | 1 | 1 | 1 | 1 | 0 | 1 | 1 | 1 | 1 | 1 | 0 | 0 | 1 | 1 | 1 | 1 |
| g | 0 | 0 | 0 | 0 | 0 | 0 | 1 | 0 | 0 | 0 | 0 | 0 | 0 | 1 | 0 | 0 | 0 | 0 | 0 | 0 | 1 |
*: a-cropland; b-forest; c-shrub; d-grassland; e-water; f-barren; g-impervious land.
Table 3.
Transfer matrix of land use during 2000-2020 (km2).
| 2000 | 2020 | ||||||||
| Cropland | Forest | Shrub | Grassland | Water | Barren | Impervious | Total | Conversion | |
| Cropland | 19483.1 | 821.0 | 0.5 | 177.1 | 198.0 | 0.7 | 1425.3 | 22105.7 | 2622.6 |
| Forest | 373.7 | 8147.9 | 3.1 | 23.1 | 0.4 | 0.0 | 13.1 | 8561.4 | 413.4 |
| Shrub | 6.4 | 120.8 | 20.4 | 27.3 | 0.0 | 0.0 | 0.1 | 175.0 | 154.6 |
| Grassland | 460.6 | 408.3 | 10.2 | 572.9 | 5.3 | 0.0 | 12.6 | 1469.9 | 897.0 |
| Water | 87.5 | 0.6 | 0.0 | 0.3 | 245.8 | 0.3 | 50.6 | 385.1 | 139.3 |
| Barren | 0.0 | 0.0 | 0.0 | 0.0 | 0.0 | 0.0 | 0.1 | 0.1 | 0.1 |
| Impervious | 32.2 | 0.0 | 0.0 | 0.8 | 87.3 | 0.5 | 2761.0 | 2881.8 | 120.7 |
| Total | 20443.6 | 9498.7 | 34.2 | 801.5 | 536.7 | 1.5 | 4262.8 | ||
| Conversion | 960.5 | 1350.8 | 13.8 | 228.6 | 290.9 | 1.4 | 1501.8 | ||
Table 4.
Area of different land use under different development scenarios (km2).
| Cropland | Forest | Shub | Grassland | Water | Barren | Impervious | |
|---|---|---|---|---|---|---|---|
| 2020 | 20470.70 | 9519.27 | 34.24 | 802.02 | 557.29 | 1.45 | 4270.42 |
| Predicted 2030 | 19973.29 | 9698.21 | 24.30 | 701.39 | 540.32 | 0.11 | 4717.79 |
| Scenario 1 | 19829.85 | 9518.90 | 34.23 | 800.58 | 544.06 | 1.09 | 4926.69 |
| Scenario 2 | 19703.29 | 9968.21 | 24.08 | 665.36 | 546.64 | 1.14 | 4746.69 |
| Scenario 3 | 20756.47 | 9454.37 | 24.08 | 594.34 | 540.32 | 0.69 | 4285.14 |
Disclaimer/Publisher’s Note: The statements, opinions and data contained in all publications are solely those of the individual author(s) and contributor(s) and not of MDPI and/or the editor(s). MDPI and/or the editor(s) disclaim responsibility for any injury to people or property resulting from any ideas, methods, instructions or products referred to in the content. |
© 2024 by the authors. Licensee MDPI, Basel, Switzerland. This article is an open access article distributed under the terms and conditions of the Creative Commons Attribution (CC BY) license (http://creativecommons.org/licenses/by/4.0/).
Copyright: This open access article is published under a Creative Commons CC BY 4.0 license, which permit the free download, distribution, and reuse, provided that the author and preprint are cited in any reuse.


