
Submitted:
30 March 2025
Posted:
31 March 2025
You are already at the latest version
Abstract
Port activities such as loading and unloading goods are reported to cause negative impacts on the aquatic environment. In this context, aquatic biodiversity is greatly impacted due to routine operational activities. This is because ports carry out sustainable management to protect the environment (ecoport) by minimizing damage to water biodiversity. Environmental DNA (eDNA) metabarcoding is a complementary or alternative method of conventional sampling used to improve the detection of elusive and cryptobenthic fish species missed by traditional surveys. Therefore, this research aimed to determine the conservation value using environmental DNA metabarcoding mapping at Tanjungpura Port, Mempawah, East Kalimantan. Sampling was carried out in the marine conservation area of Tanjungpura Port, Mempawah, West Kalimantan. The results showed that biodiversity analysis was performed using metabarcoding method through molecular markers 18S rRNA and C Oxidase Subunit 1 (COI). The taxonomic annotation of COI gene produced 24 taxa groups at the phylum level. The identities of OTUs or DNA seqs (reads) groups could not be determined, namely X_Unclassified_Eukaryota and X_Unclassified. The taxonomic annotation of OTUs gen 18S using the SILVA release 138 databases led to 54 phyla, including uncultured, unclassified, and unassigned groups. The biodiversity of the animal group consisted of the phylum Annelida, Arthropoda, Chordata, Cnidaria, Echinodermata, Mollusca, Nemertea, and Porifera. Meanwhile, algae/microalgae comprised Bacillariophyta, Chlorophyta, Chrysophyceae, Dinophyceae, Haptophyta, Phaeophyta, Rhodophyta, and Schizocladia. This showed the potential use of eDNA as an efficient tool for mapping and monitoring biodiversity in Mempawah Port environment.
Keywords:
eDNA
; metabarcoding
; Next Generation Sequencing
; Biotechnology
1. Introduction
Port is a place consisting of land and sea with certain boundaries used for government and economic activities. In this context, the existence of port activities such as loading and unloading goods can cause negative impacts on the aquatic environment. Aquatic biodiversity is an impact greatly influenced due to routine operational activities. Furthermore, port is required to carry out sustainable management to protect the environment by minimizing damage to water biodiversity. The management is carried out by prioritizing the existence of a sterile lane area without vessels to form marine conservation areas (MPAs), which are key to biodiversity conservation [1]. This area has an impact on the abundance of fish species from the natural habitat [2], supporting the nursery function [3,4]. According to [5], MPAs host different types of fish from the natural habitats. However, the biodiversity of the fish is unknown due to limited design and sampling methods. Conventional sampling (visual surveys, scientific fishing) and technology (long-range underwater vehicles, acoustic surveys) have inherent biases and environmentally dependent applications.
According to [6], environmental DNA (eDNA) metabarcoding is a complementary or alternative method to conventional sampling. This improves the detection of elusive and rare, and cryptobenthic fish species missed by traditional surveys [7]. eDNA is extracted directly from samples [8]. Furthermore, eDNA metabarcoding combines the sampling by sequencing high-throughput amplicons [9]. eDNA metabarcoding is an efficient method for aquatic ecosystems [10]. The detection of eDNA is used to test the effects of port infrastructure on fish biodiversity, which has a level equivalent to natural habitats under various human stresses and strands. Metabarcoding is only related to a few ports (> 3) in Europe [11,12] while no ports in Indonesia have applied eDNA method to detect biodiversity. Based on the description, this research aimed to determine the conservation value using environmental DNA metabarcoding mapping at Tanjungpura Port, Mempawah, West Kalimantan.
2. Materials and Methods
2.1. Environmental DNA (eDNA) Sampling
This research is centered on the marine conservation area of Tanjungpura Port, Mempawah, West Kalimantan. A total of 2 liters water samples were taken from the area determined according to the plot on the map (Figure 1). Water sampling did not approach docking vessels (<50 m) to avoid the risk of false positive results due to eDNA released from routine operations. Meanwhile, seawater 1 m below sea level is collected using sterile threaded tubes and filtered with a 0.5 μm filter membrane. eDNA is stored in a DNA/RNA shield solution (Zymo research) in a sterile threaded tube, labeled, and stored in a coolbox with an ice pack.
2.2. eDNA Sample Extraction
DNA extraction was performed with ZymoBIOMICS DNA Miniprep Kit (Zymo Research, 2021). eDNA sample was inserted into ZR BashingBead™ Lysis Tube, containing beads of 0.1 & 0.5 mm and 750 μl of BashingBead™ Buffer was added to the tube. The bead beater process for the lysis uses Micro smash MS100 (TOMY) for 5 minutes and 5000 rpm. A 2 ml tube was centrifuged at 10,000 x g for 1 minute. A total of 400 μL of supernatant was transferred to the Zymo-Spin™ III-F Filter in a collection tube and centrifuged at 8000 x g for 1 min usingTOMY MX-301. Meanwhile, 1,200 μl of ZymoBIOMICS™ DNA Binding Buffer was added to the filtrate collected in the collection tube (bottom of the filter). The above 800 μl of the mixture was transferred to Zymo-Spin™ IICR Column with a new collection tube and centrifuge at 10,000 x g for 1 min. The supernatant was discarded and the process was repeated for the rest of the filtrate. In addition, 400 μl of ZymoBIMIC™ DNA Wash Buffer 1 was added to Zymo-Spin™ IICR and centrifuged at 10,000 x g for 1 min to discard the supernatant in the collection tube. A total of 700 μl ZymoBIOMICS™ DNA Wash Buffer 2 was also added and centrifuged at 10,000 x g for 1 min, discarding the supernatant. The previous stage was repeated by adding 200 μl of ZymoBIOMICS™ DNA Wash Buffer 2 and centrifuging at 10,000 x g for 1 min, discarding the supernatant. Zymo-Spin™ IICR Column was added to a new 1.5 ml tube with 50 μl of DNA Elution Buffer in the middle of the column membrane and centrifuged at 10,000 x g for 30 seconds. The Zymo-Spin™ III-HRC Filter was prepared on a new Collection Tube before adding 600 μl of Prep Solution, and centrifuging at 8,000 x g for 3 min. The lysified DNA with elution buffer was transferred to Zymo-Spin™ III-HRC Filter placed on a new 1.5 ml microtube, and centrifuged at 16,000 x g for 3 mins.
2.3. Determination of eDNA Quality Before NGS-Based Sequencing
The quality of the extracted eDNA is determined based on the concentration and purity values using a special spectrophotometer (Varioskan Lux with μDrop adapter (Thermo Scientific). In principle, DNA concentrations are measured based on absorption at wavelengths of 260 nm and 280 nm. The absorbance results are used to calculate the concentration of DNA. In addition, a ratio of 260:280 is also used to estimate the purity of DNA.
2.4. Library Preparation and Sequencing Process
The samples are subjected to preparation before entering sequencing stage. This process requires PCR amplification with primers designed to target the 12S gene and Cytochrome C Oxidase Subunit 1 (COI), re-assessment of DNA concentrations using a Qubit fluorometer (Thermo Scientific), installation of sequencing adapters, and purification of samples using magnetic beads. Typically, this procedure is performed using an Illumina sequencing kit (source: https://www.illumina.com/techniques/sequencing/ngs-library-prep.html).
2.5. Sequencing Process
Sequencing process based on NGS (next-generation sequencing) is carried out through vendor sequencing services at PT Geneticsa Science Indonesia. Before sequencing, each sample must pass quality control (QC) checks through PCR and electrophoresis by the vendor. NGS is carried out with MGI platform and DNBSEQ G-400 sequencing machine after meeting QC. This is targeted to obtain sequences from COI mitochondrial gene used as encoding/markers for eukaryotic organisms, such as microorganisms, microalgae, phytoplankton, plants (flora), and animals (fauna) (Stoeck et al., 2010; Wang et al. 2023). Sequence analysis was carried out in 2 directions (paired-end) with an output length of ~200 bp (COI) and ~350-450 bp (18S). The process takes 1.5-2 months and the resulting NGS data is sent by PT Geneticsa Science Indonesia through the Cloud Service link service. At this stage, the entire process is carried out separately by an external vendor (PT Geneticsa Science).
2.6. Initial Analysis of NGS Data
After NGS process is completed, the vendor conducts initial processing and analysis of the raw data (reads merging, filtering, denoising, annotation, and data reporting) before sending the generated link through the Cloud Service for download. The link is active for 1 month before being automatically deleted from the server. Generally, NGS raw data contains parts that must be cleaned and filtered from the main DNA sequence data. These parts include adapters, primers, low-quality sequences, undetected bases (N bases), and chimer-indicated sequences. For data processing in advanced analysis, the low-quality adapters and sequences are filtered to obtain clean tags/sequences. This filtered data is also included by the vendor with the raw data merged or separated. This process is carried out using several tools, including FastQC, cutadapt, DADA2, and QIIME2 (Bolyen et al., 2019). The results of the taxonomic annotation from NGS data were combined with feature tables and visualized using R-studio software (R version 4.2.3).
3. Results
3.1. eDNA Extraction Results
Research on biodiversity in marine protected areas uses conventional and technological methods, namely visual surveys, scientific fishing, long-distance underwater vehicles, and acoustic surveys. However, the method has many obstacles impacting the results without covering the entire existing diversity and limited exploration capabilities. The development of a new method using eDNA metabarcoding has a great opportunity to obtain the overall biodiversity of the mapped conservation area. New methods for implementing conservation area monitoring have resulted in a lack of reference sources used as a basis for optimization.
There were 22 samples used to target COI gene consisting of samples from the Pelindo Coastal area (PP; n=10 samples) and Pelindo Laut (PL; n=12 samples) (Table 4). Meanwhile, 10 composite samples were used to target 18S gene (MP; n= 5 samples and ML; n= 5 samples). The sample serving as a composite has a name code ending in ’k’, which is a merger obtained from adjacent locations and expected to represent the biodiversity conditions in the combined area.
The concentration of DNA in each sample had a value of > 10 ng/μL in coastal and marine areas. This shows that DNA concentration has met the minimum standards for NGS analysis in accordance with the standard sample reference from sequencing service laboratory. DNA concentrations for COI gene markers from PP samples ranged from 10.38-37.7 ng/μL with purity of 1.92-2.18 (Table 1). Meanwhile, PL sample had DNA concentration between 11.37-28.43 ng/μL with a purity of 1.87-2.06 (Table 1). For 18S gene sample, the concentration of MP composite sample ranged from 12.31-24.49 ng/μL with 1.93-2.06 (Table 1). ML composite sample had a concentration ranging from 14.62-26.90 ng/μL with a purity of 1.93-2.01 (Table 1).
3.2. Quality Control of eDNA Samples
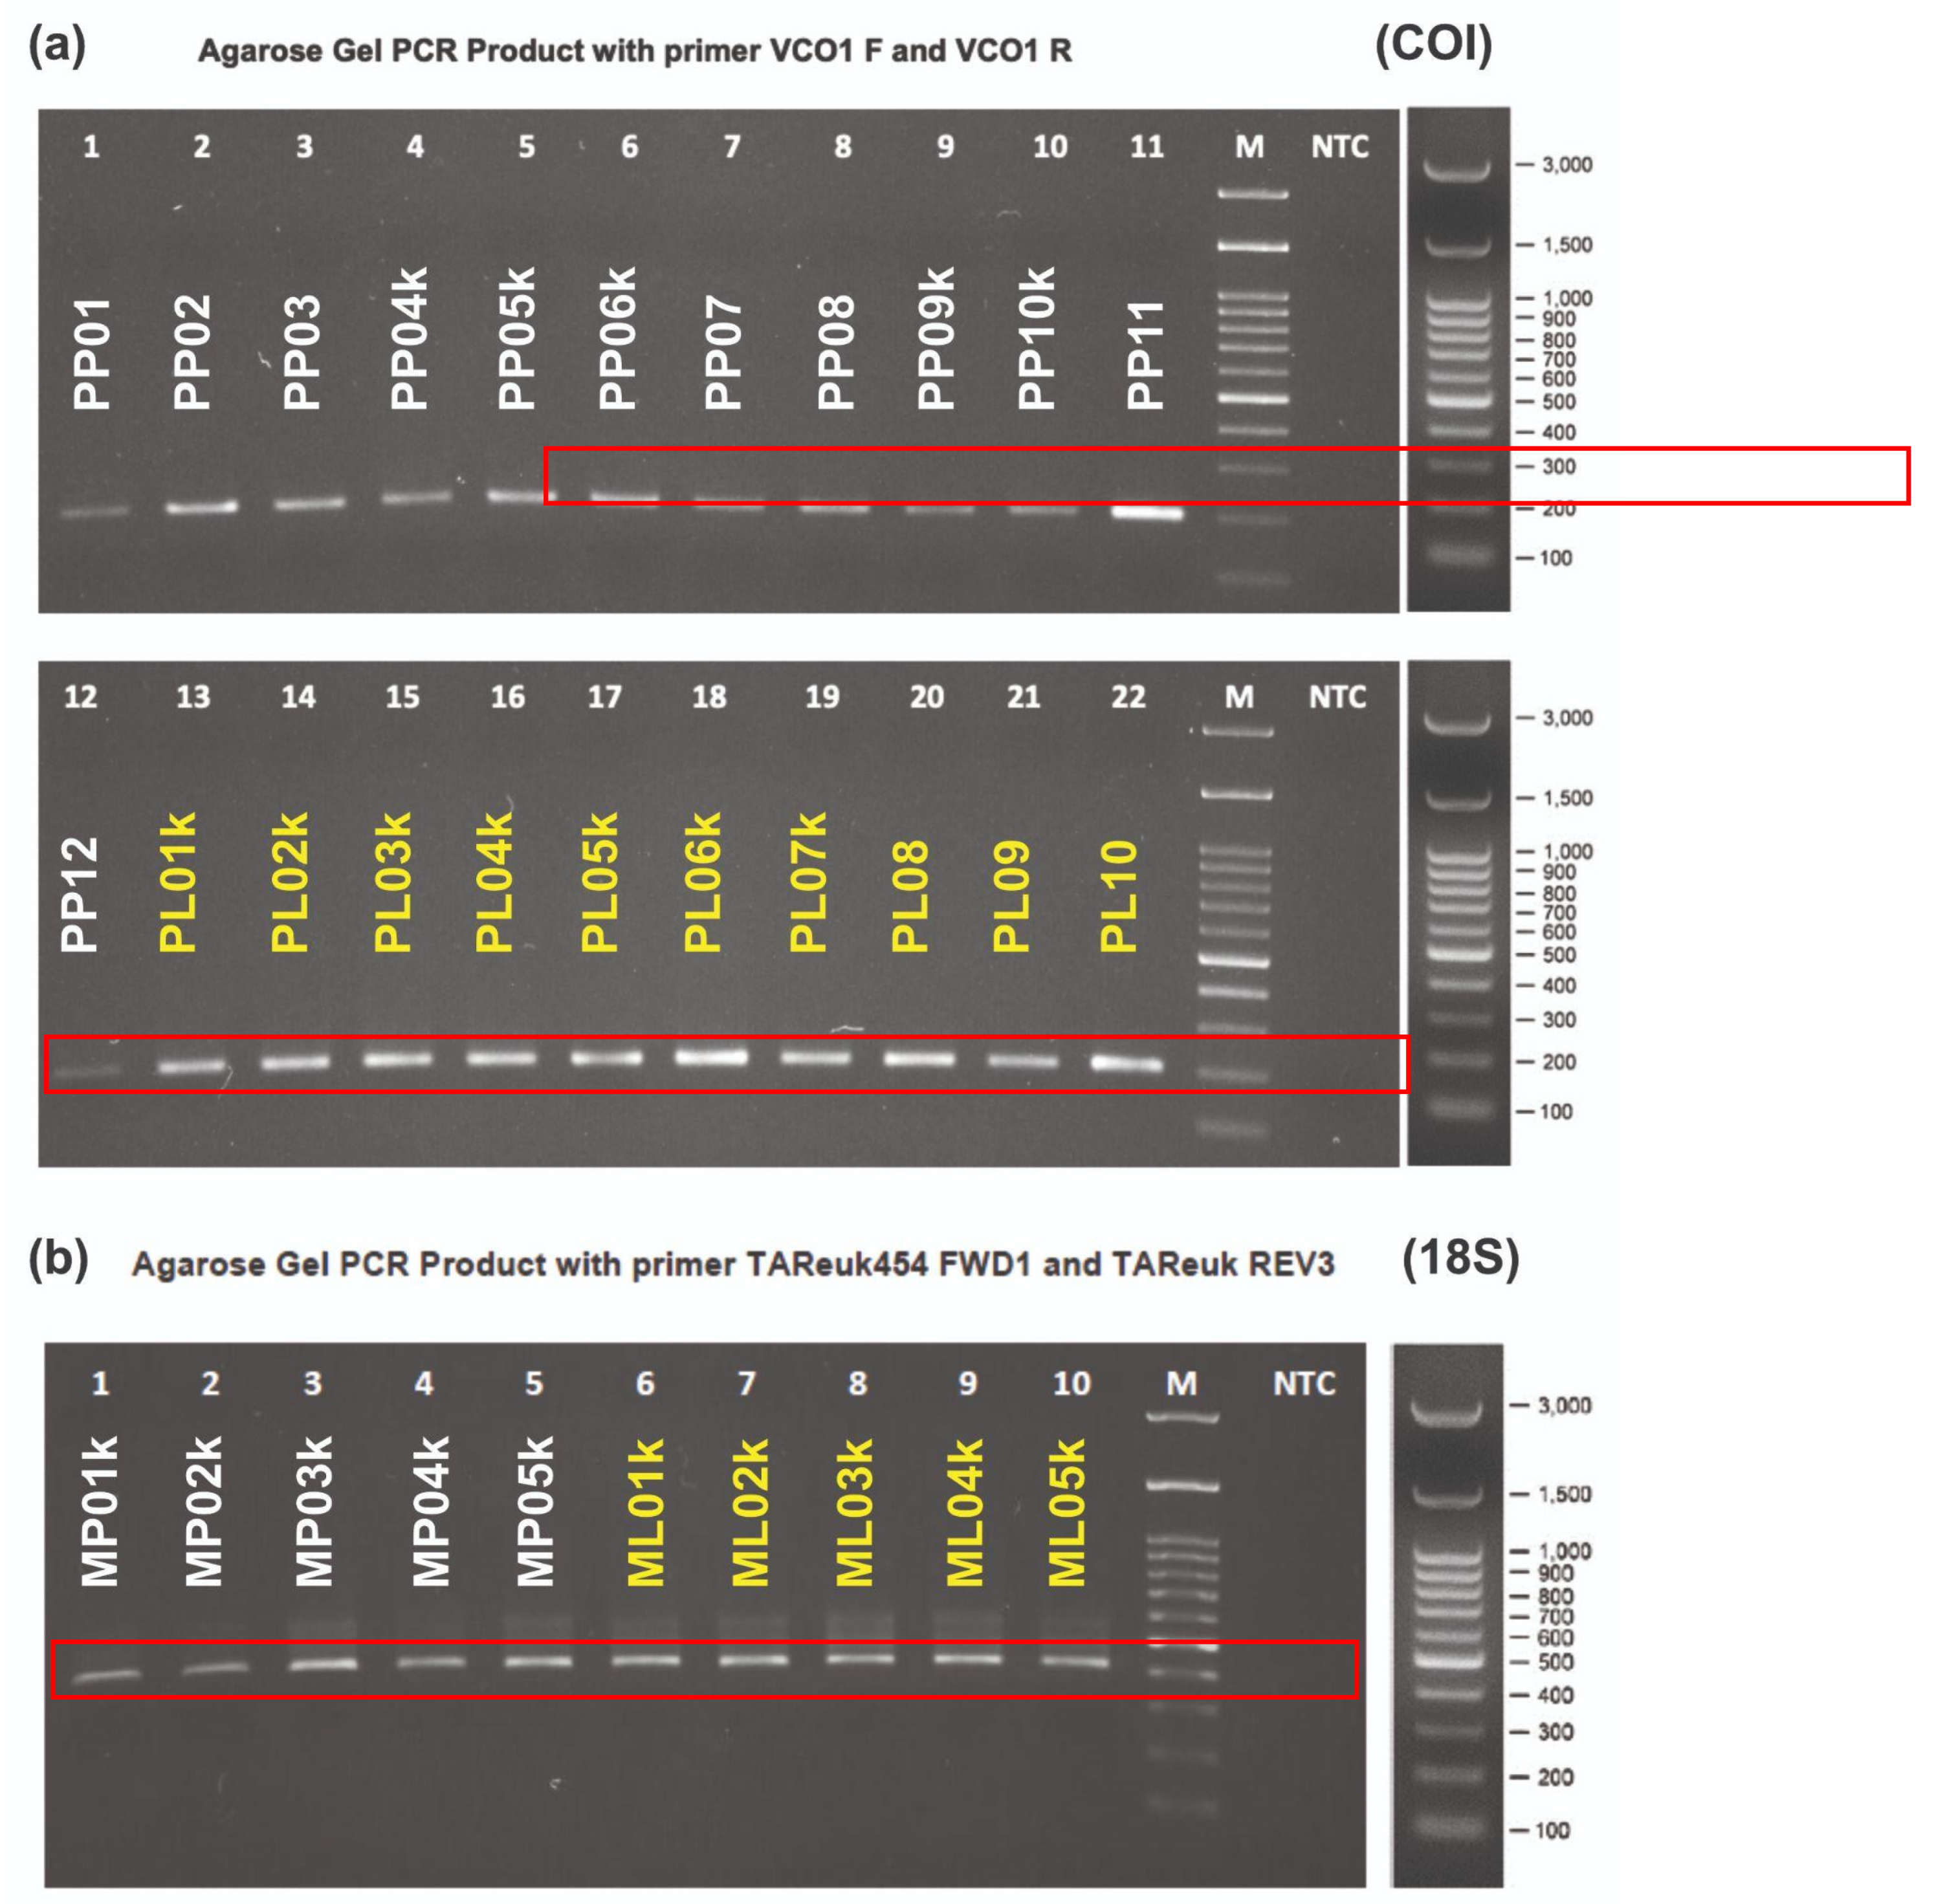
Quality testing of eDNA sample is performed to confirm that the target gene required for sequencing stage have been met. This research uses COI and 18S primers for bioinformatics analysis with a size of ~300 and ~200 bp, respectively. The thickness of the band visualized in the image shows high and low concentrations of target gene from the two primers successfully obtained from PCR process. The results of 18S gene electrophoresis at all stations are of the same thickness. The band has dust used to describe the purity and specificity of 18S gene.
Figure 2.
The results of the quality test (QC) through PCR process and electrophoresis for eDNA samples from Pelindo Coastal area (white) and Pelindo Laut (yellow) for COI (a) and 18S (b) gene.
Figure 2.
The results of the quality test (QC) through PCR process and electrophoresis for eDNA samples from Pelindo Coastal area (white) and Pelindo Laut (yellow) for COI (a) and 18S (b) gene.
3.3. Bioinformatics Data from eDNA Samples
From the 22 PP and PL (COI) samples, 2,195,245 raw seqs. were successfully obtained from NGS process of COI gene (Figure 4). The raw seqs obtained from each PP sample (n=10) ranged from 99,725 to 99,930. For each PL sample (n=12), the range of raw seqs obtained is 99,165 - 99,955 seqs. Most of NGS data was filtered out through the bioinformatics process to obtain total final seqs of 153,507 and 176,925 for PP and PL. The length of COI seqs contained in the final data ranges from 146 to 235 bp at an average of ~210 bp.
The final seqs were successfully clustered into 2,342 OTUs with 3 OTUs being detected in PP and PL (shared OTUs) areas. Meanwhile, 1,071 and 1,268 OTUs were found in PP and PL areas, respectively. The resulting OTUs are annotated based on the MIDORI2 database for COI and SILVA138 for 18S to obtain the taxonomic identity.
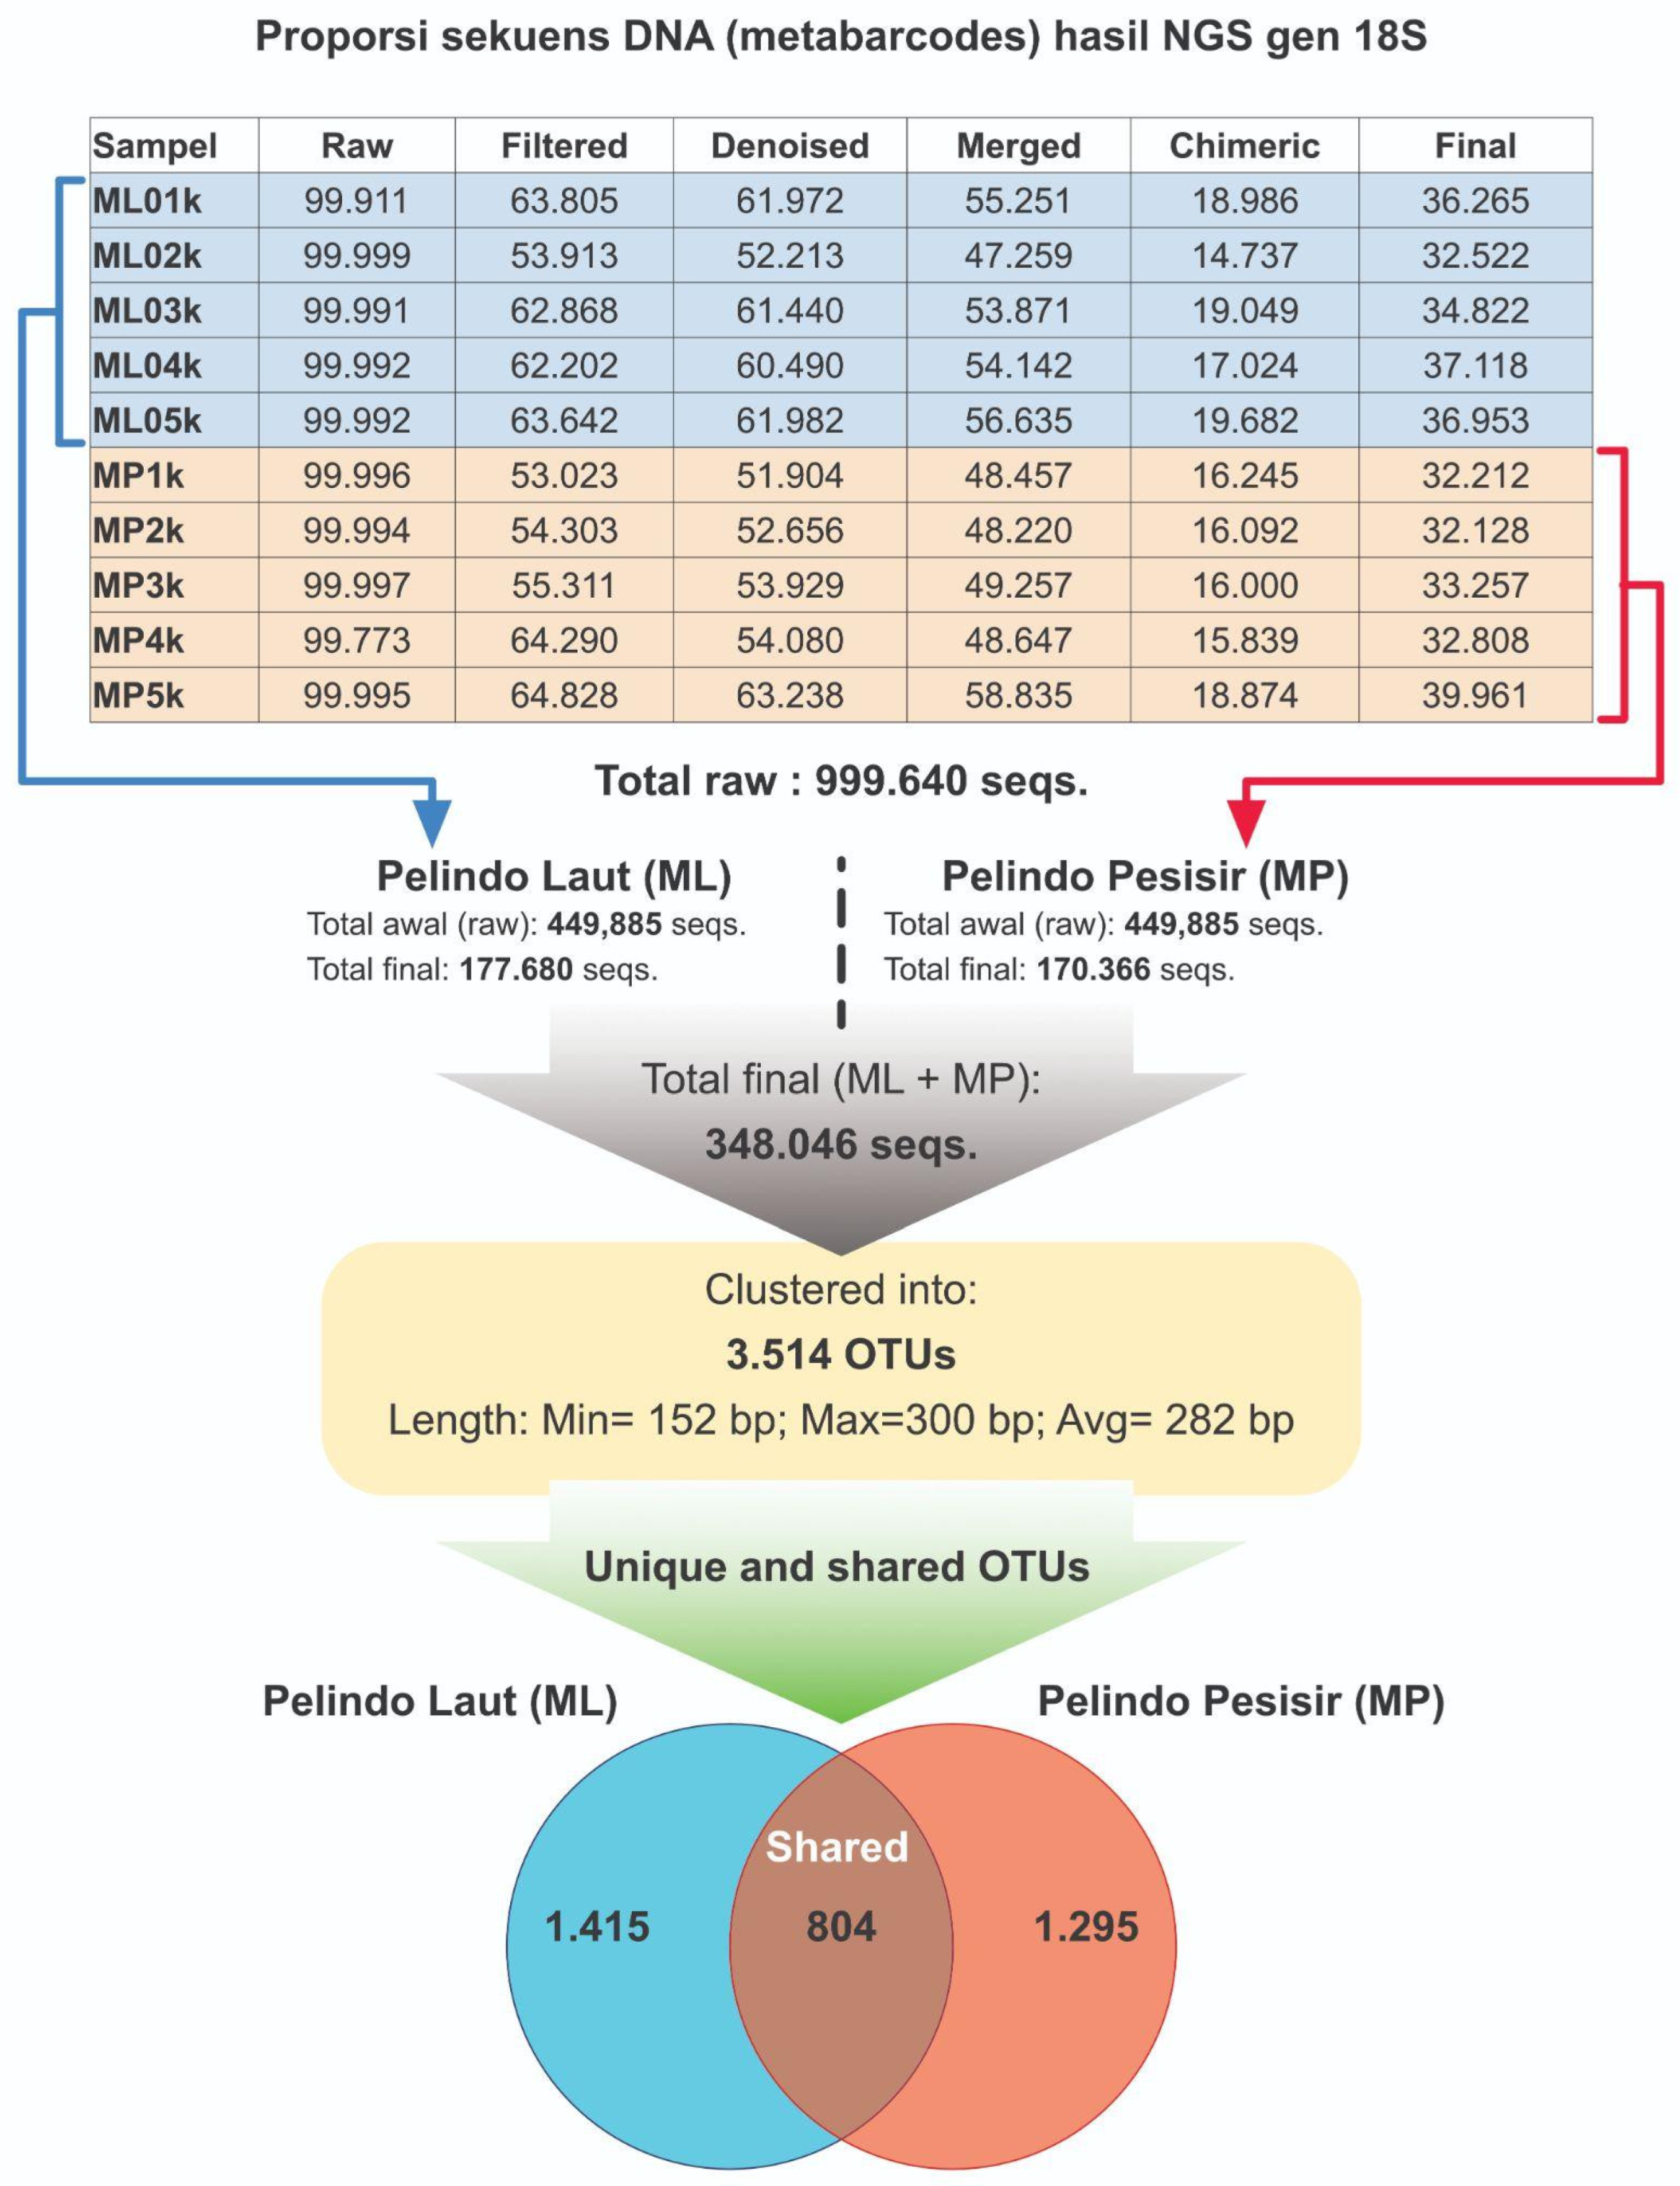
Based on 18S gene (n=10 samples), 999,640 raw seqs were generated from NGS process MP and ML. MP and ML samples have raw seqs range of 99,911 to 99,999 and 99,973 to 99,997, respectively. After going through the filtering, denoising, and chimera removal process, 177,680 and 170,366 final seqs were produced for MP and ML samples, respectively. The length of the final sequence ranges between 152 bp and 300 bp with an average of 282 bp, as reported in Figure 4.
From the final seqs, 3,514 OTUs were produced through the clustering stage. The Venn diagram of the distribution in the two regions of MP and ML showed that 1,415 and 1,295 OTUs were detected exclusively in ML and MP area, respectively. In the context of COI gene marker, 804 OTUs were detected by 18S gene in the two regions of MP and ML. Therefore, 18S gene marker could detect more molecular signals or OTUs from eDNA samples than COI gene.
Figure 3.
Composition and proportion of seqs DNA from NGS eDNA metabarcoding CO1 gene. The number of final seqs DNA passing QC stage is marked in green. Other colors show the proportion of DNA seqs filtered out or removed from the analysis (Chimeric, Unmerged, Denoised, and Filtered seqs).
Figure 3.
Composition and proportion of seqs DNA from NGS eDNA metabarcoding CO1 gene. The number of final seqs DNA passing QC stage is marked in green. Other colors show the proportion of DNA seqs filtered out or removed from the analysis (Chimeric, Unmerged, Denoised, and Filtered seqs).
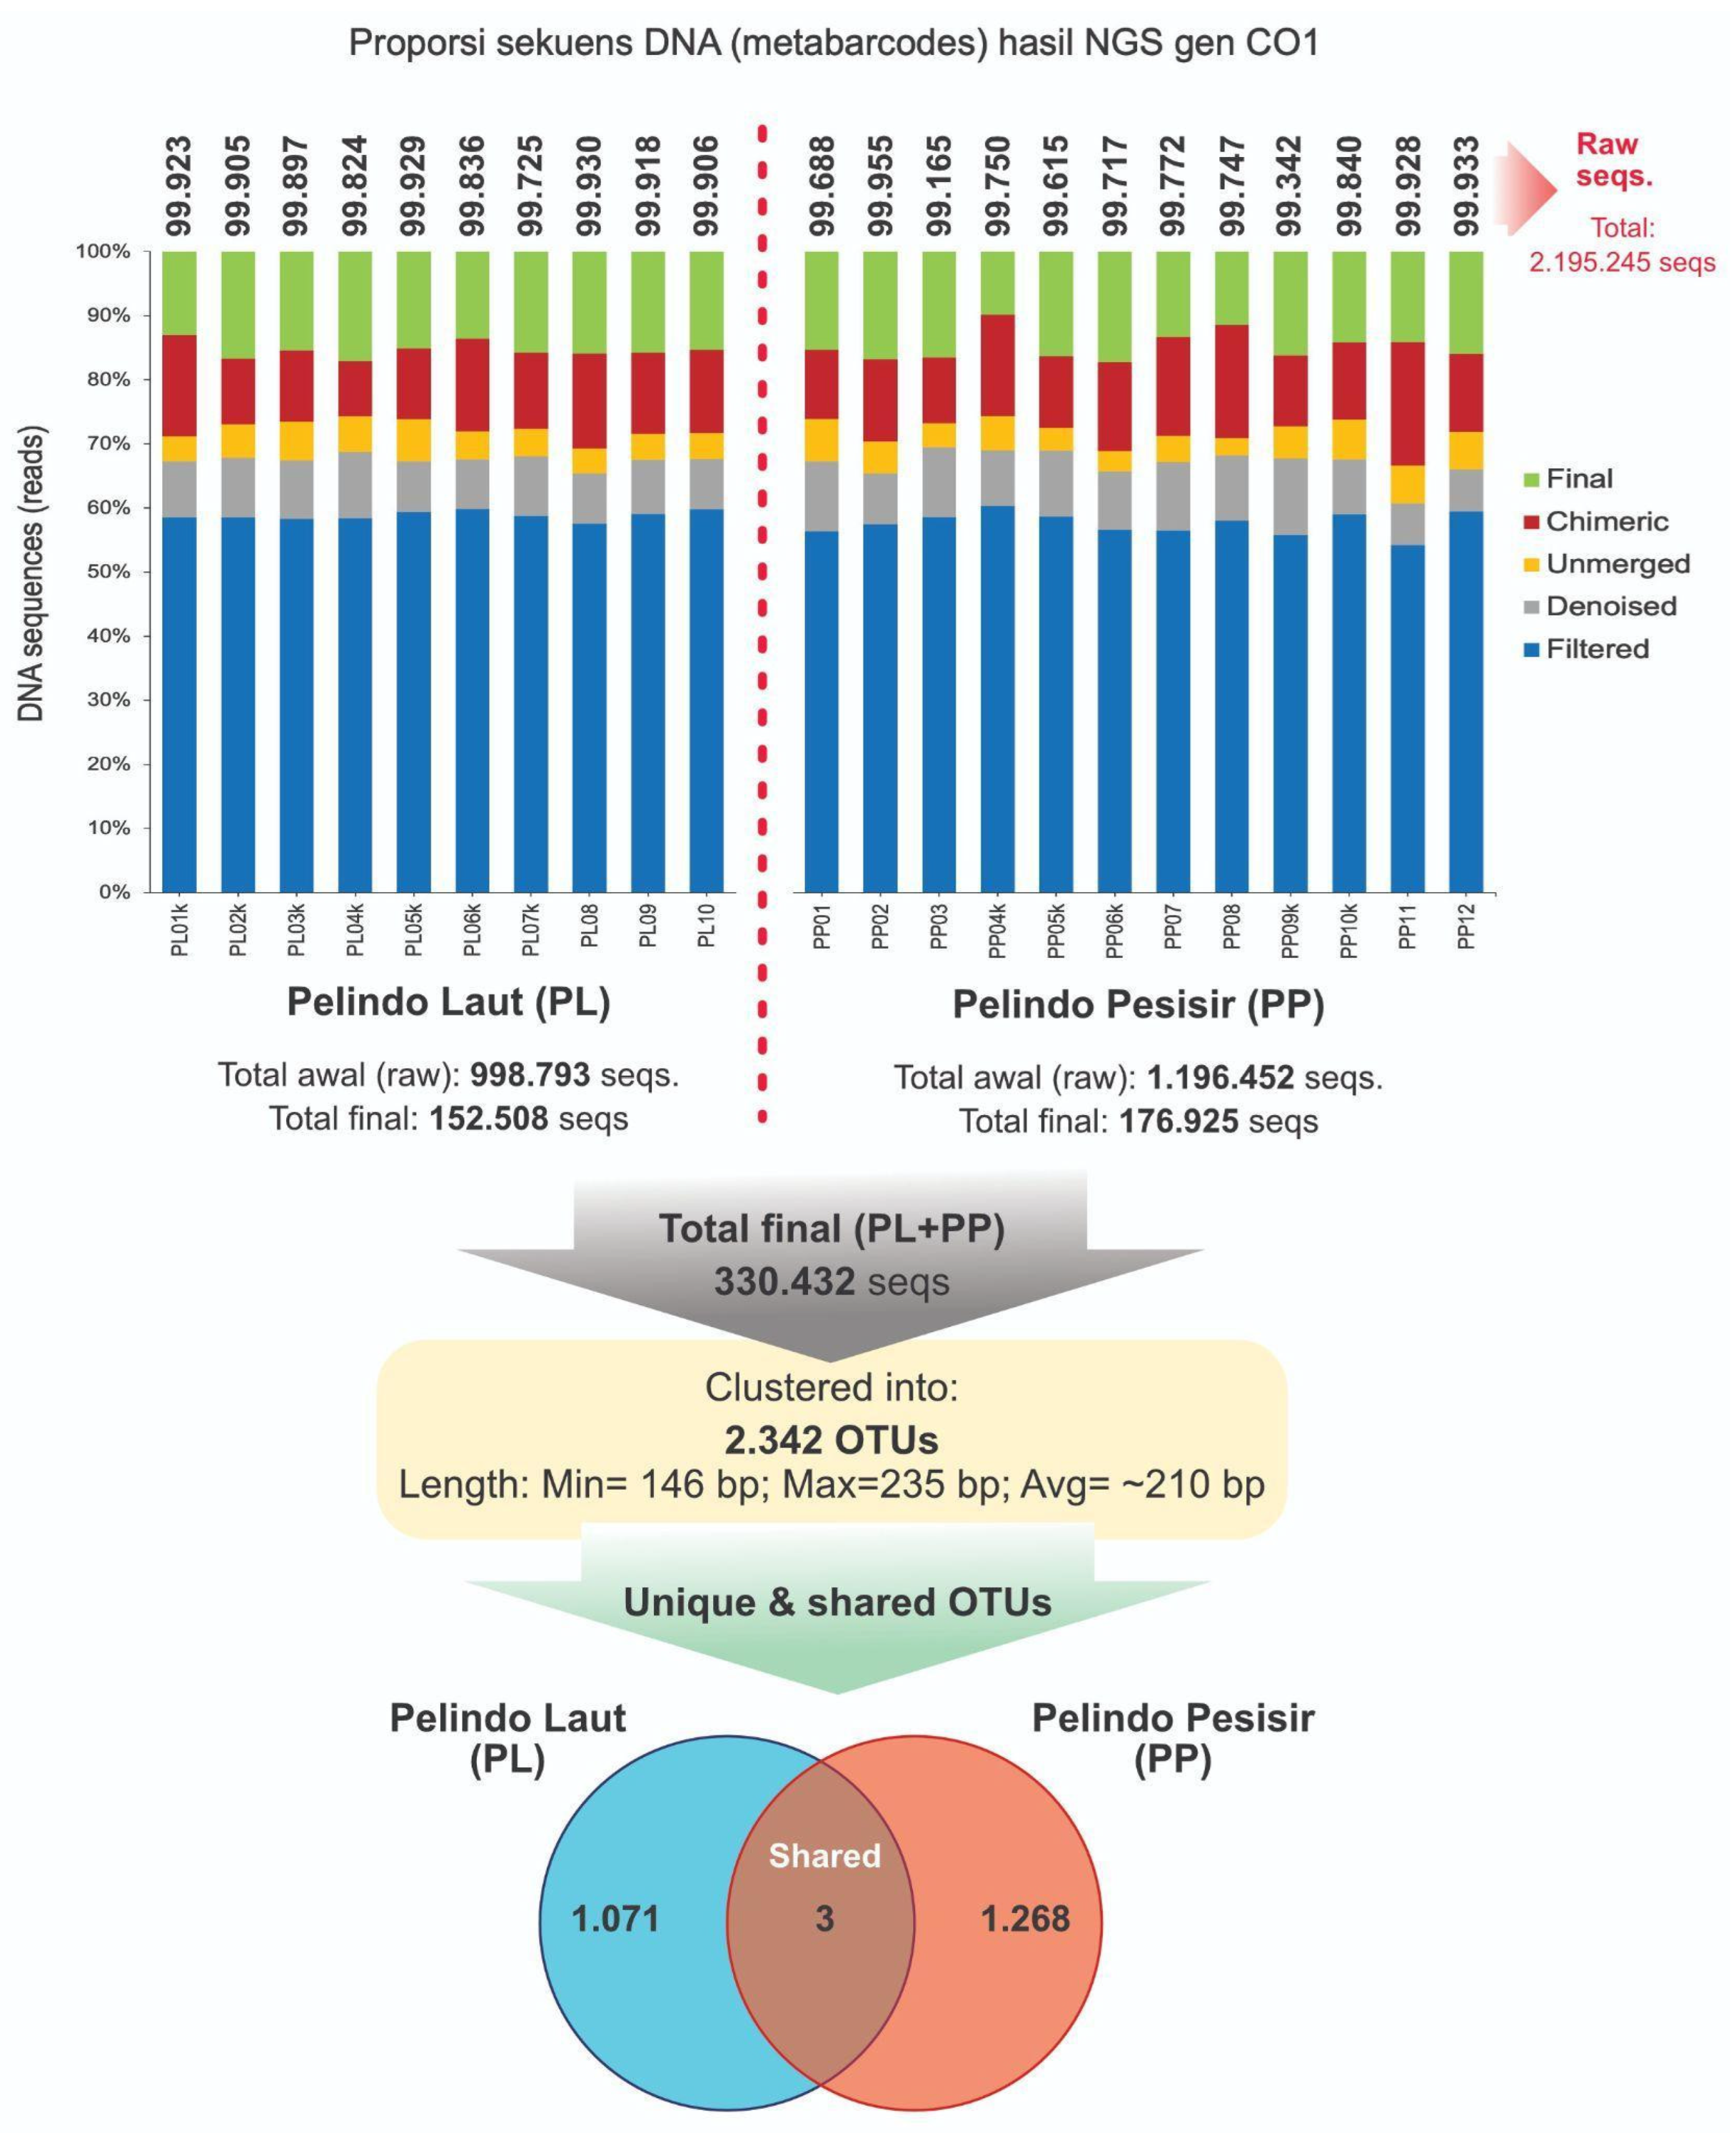
Figure 4.
The composition and proportion of seqs DNA from NGS eDNA metabarcoding gene 18S with OTUs produced and distributed in two sampling regions (ML and MP).
Figure 4.
The composition and proportion of seqs DNA from NGS eDNA metabarcoding gene 18S with OTUs produced and distributed in two sampling regions (ML and MP).
3.4. Alpha Biodiversity Indexes Based on COI and 18S Gene
Alpha biodiversity indexes show the level of diversity in taxa composition depending on the level in a sample or location. Biodiversity index at OTUs level for NGS samples of COI gene obtained from PL and PP regions based on COI gene is presented in Table 2 and Table 3. Meanwhile, 18S gene for MP and ML regions is presented in Table 4 and Table 5.
In PL (COI) region, the highest and lowest OTUs of 122 and 96 were detected in PL04k and PL06k composite samples, respectively. The same is also represented by the diversity index based on the Chao1, Shannon, and Simpson indexes (Table 2). In PP (COI) region, the highest and lowest alpha diversity indexes of 124 and 83 were in PP08 and PP04k composite samples, respectively. The same pattern was followed on other diversity indexes (Chao1, Shannon, Simpson (Table 3)).
For ML (18S) region, the highest and lowest numbers of 790 and 730 OTUs were detected in ML04k and ML03k composite samples. In MP (18S) region, the the highest and lowest numbers of 1106 and 449 OTUs were detected in MP04k and MP01k composite samples, respectively. This pattern is also shown in other alpha diversity indexes, namely Shannon, Simpson, and InvSimpson.
3.5. Taxonomic Annotation Results Based on COI and 18S Gene Data
3.5.1. Taxonomic Composition of eDNA Data in PL and PP Region (COI)
From the 2,342 OTUs successfully clustered in the previous stage, 9,864 – 17,223 DNA seqs could be obtained. In PL region, the highest and lowest number of 17,068 and 12,999 seqs were shown by PL04k and PL01k samples, respectively. Meanwhile, in PP area, the highest and lowest number of 17,223 and 9,864 seqs were shown by PP09k and PP07 samples, respectively.
Taxonomic annotation produced 24 taxa groups at the phylum level. In this context, taxonomic identities of OTUs or DNA seqs were not determined, namely X_Unclassified_Eukaryota and X_Unclassified (Figure 5). A total of 8 groups were grouped into animals (fauna) and 8 others into the algae or microalgae category. The remaining groups are included in the category of fungi (fungi) or other protist, as reported in Figure 5. The animal group consists of phylum Annelida, Arthropoda, Chordata, Cnidaria, Echinodermata, Mollusca, Nemertea, and Porifera. The algae/microalgae group consists of Bacillariophyta, Chlorophyta, Chrysophyceae, Dinophyceae, Haptophyta, Phaeophyta, Rhodophyta, and Schizocladia (Figure 5).
Arthropods dominated the most composition in all samples with 94,429 seqs, followed by the phylum Bacilariophyta, Oomycota, Cnidaria, and Mollusca at 60,494, 36,563, 14,040, and 12,088 seqs, respectively. The phylum with the lowest amount of DNA seqs of 31 is Chrysophyceae, as reported in Figure 5. X_Unclassified_Eukaryota and X_Unclassified groups containing 40,651 and 36,343 seqs cannot be taxonomically annotated.
In total, 136 taxa have been successfully detected in PP and PL areas. Only 66 were successfully identified at the species (n=39) or genus (n=27) level, while the remaining 70 were identified at the higher taxonomic level of family (n=19), order (25), class (n=19), or phylum (n=7). A total of 47, 20, 14, 11, 10, 5, 4, 3, 2, and 1 taxa were members of the phylum Arthropoda, Mollusca, Cnidaria, Rhodophyta, Phaeophyceae, Nemertea, Haptophyta, Chlorophyta, Chordata and Annelida, respectively. Meanwhile, 45 taxa belong to the algae group and 27 are identified up to the genus or species level. The remaining 91 are taxa from the animal group and 39 are identified up to the genus and species level.
3.5.2. Taxonomic Composition of eDNA Data in ML and MP Regions (18S)
For 18S gene, out of a total of 3,514 OTUs successfully clustered, 32,128-39,961 seqs were obtained for each sample in ML and MP areas. In ML region, the highest and lowest amount of 37.118 and 32.522 seqs was reported by ML04k and ML02k composite samples, respectively. Meanwhile, in MP area, the highest and lowest amount of 39,961 and 32,128 seqs were shown by MP05k and MP02k composite samples, respectively. Taxonomic annotation of OTUs generated from 18S rRNA sequencing identified 54 phylum-level groups, including uncultured, unclassified, and unassigned taxa. Arthropods dominated taxonomic composition of all 18S samples in line with the detection results using COI gene marker. At the genus level, 286 taxa were successfully detected using 18S gene marker, which was more than the 136 obtained through COI gene marker.
From the 54 phylum groups detected with 18S gene marker, 21 were categorized as algae/microalgae. The remaining include groups of animals, fungi, plants, protists, and a small ungrouped number. The phylum groups of algae and microalgae are Diatomea, Dinoflagellata, Labyrinthulomycetes, Cryptophyceae, Prymnesiophyceae, Ochrophyta, Chlorophyta, MAST-1, MAST-2, MAST-3, MAST-4, MAST-6, MAST-7, MAST-8, MAST-9, MAST-11, MAST-12, Porphyridiophyceae, SA1-3C06, Stramenopiles, and Rhodellophyceae. Phylum Dinoflagellata has the highest number of seqs with a total of 35,096, as reported in Table L2. Furthermore, 114 and 26 taxa at the genus and other levels were groups of algae and microalgae identified at a higher taxonomy.
From the detected algae and microalgae genera, Gyrodinium occupies the highest position with 5,058 seqs. Meanwhile, Unclassified Ochromonadales and Cythriodinium have the lowest number of seqs, which is only 1 seqs.
Figure 6.
Taxonomic composition of DNA seqs of gene 18S at phylum level in ML and MP areas. DNA associated with algae and microalgae is marked with a green circle. Other groups belong to fauna, fungi, and protists.
Figure 6.
Taxonomic composition of DNA seqs of gene 18S at phylum level in ML and MP areas. DNA associated with algae and microalgae is marked with a green circle. Other groups belong to fauna, fungi, and protists.

3.5.3. Taxa Distribution Based on eDNA Gene COI and 18S Data
A total of 45 and 40 taxa are detected in PL and 40 PP groups. Meanwhile, 51 taxa can be found in both PL and PP areas. For the distribution of taxa based on COI gene eDNA data per sample, the following number of seqs are reported in Table L1. Only 5 taxa had distribution records covering PP and PL regions from the total 136 species detected and identified. Meanwhile, 60 taxa only had 1 detection record in the sampling areas.
For the distribution at the genus level based on 18S gene, 49 and 62 taxa are detected in ML and MP areas, respectively. However, a total of 204 taxa are also detected in both regions, as reported in Figure 8b. Table L2 shows the distribution of taxa based on eDNA data of 18S gene per sample, including the amount of seqs DNA.
The species with the lowest amount of DNA seqs is Lithophyllum stictiforme (6 seqs) which belongs to the group of red algae. Meanwhile, taxa with the highest DNA seqs from the Unidentified Bacillariophyta belongs to phylum Bacillariophyta. In PL region, Unidentified Bacillariophyta and Unclassified Chironomidae of the phylum Arthropoda occupy the top position with 17,274 and 17 seqs, respectively. In PP region, Unclassified Calanoida and Rhodophyta of 20,334 and 2 seqs were in the highest and lowest position, respectively.
Figure 7.
The proportion of unique and shared taxa found in PL and PP regions is based on COI (a) and 18S gene (b).
Figure 7.
The proportion of unique and shared taxa found in PL and PP regions is based on COI (a) and 18S gene (b).
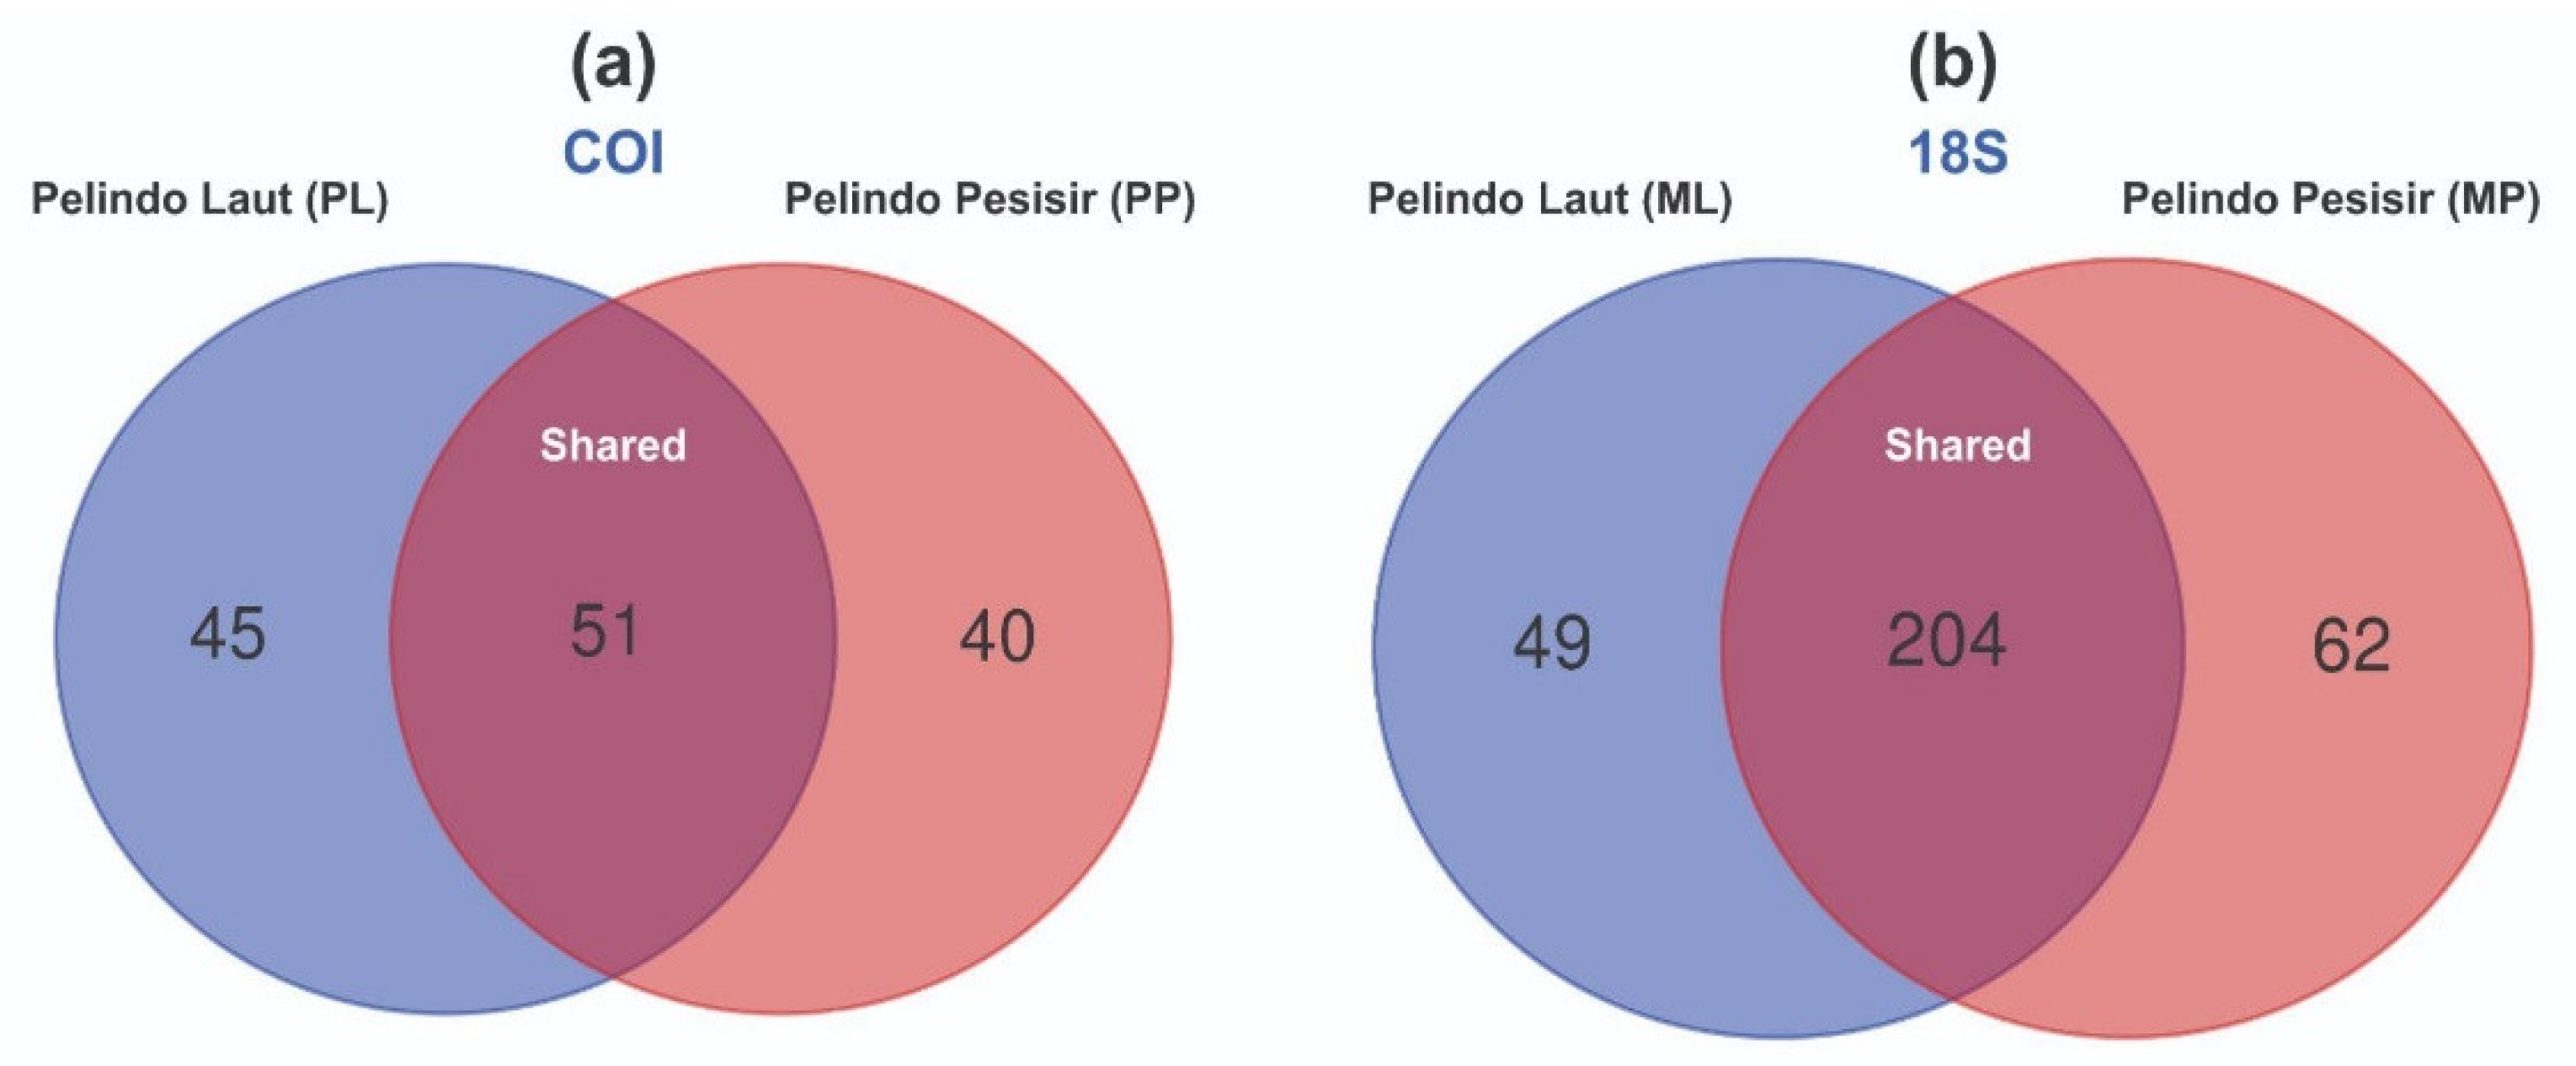
Figure 8.
The proportion of taxa distribution that can be detected using COI and 18S gene markers.
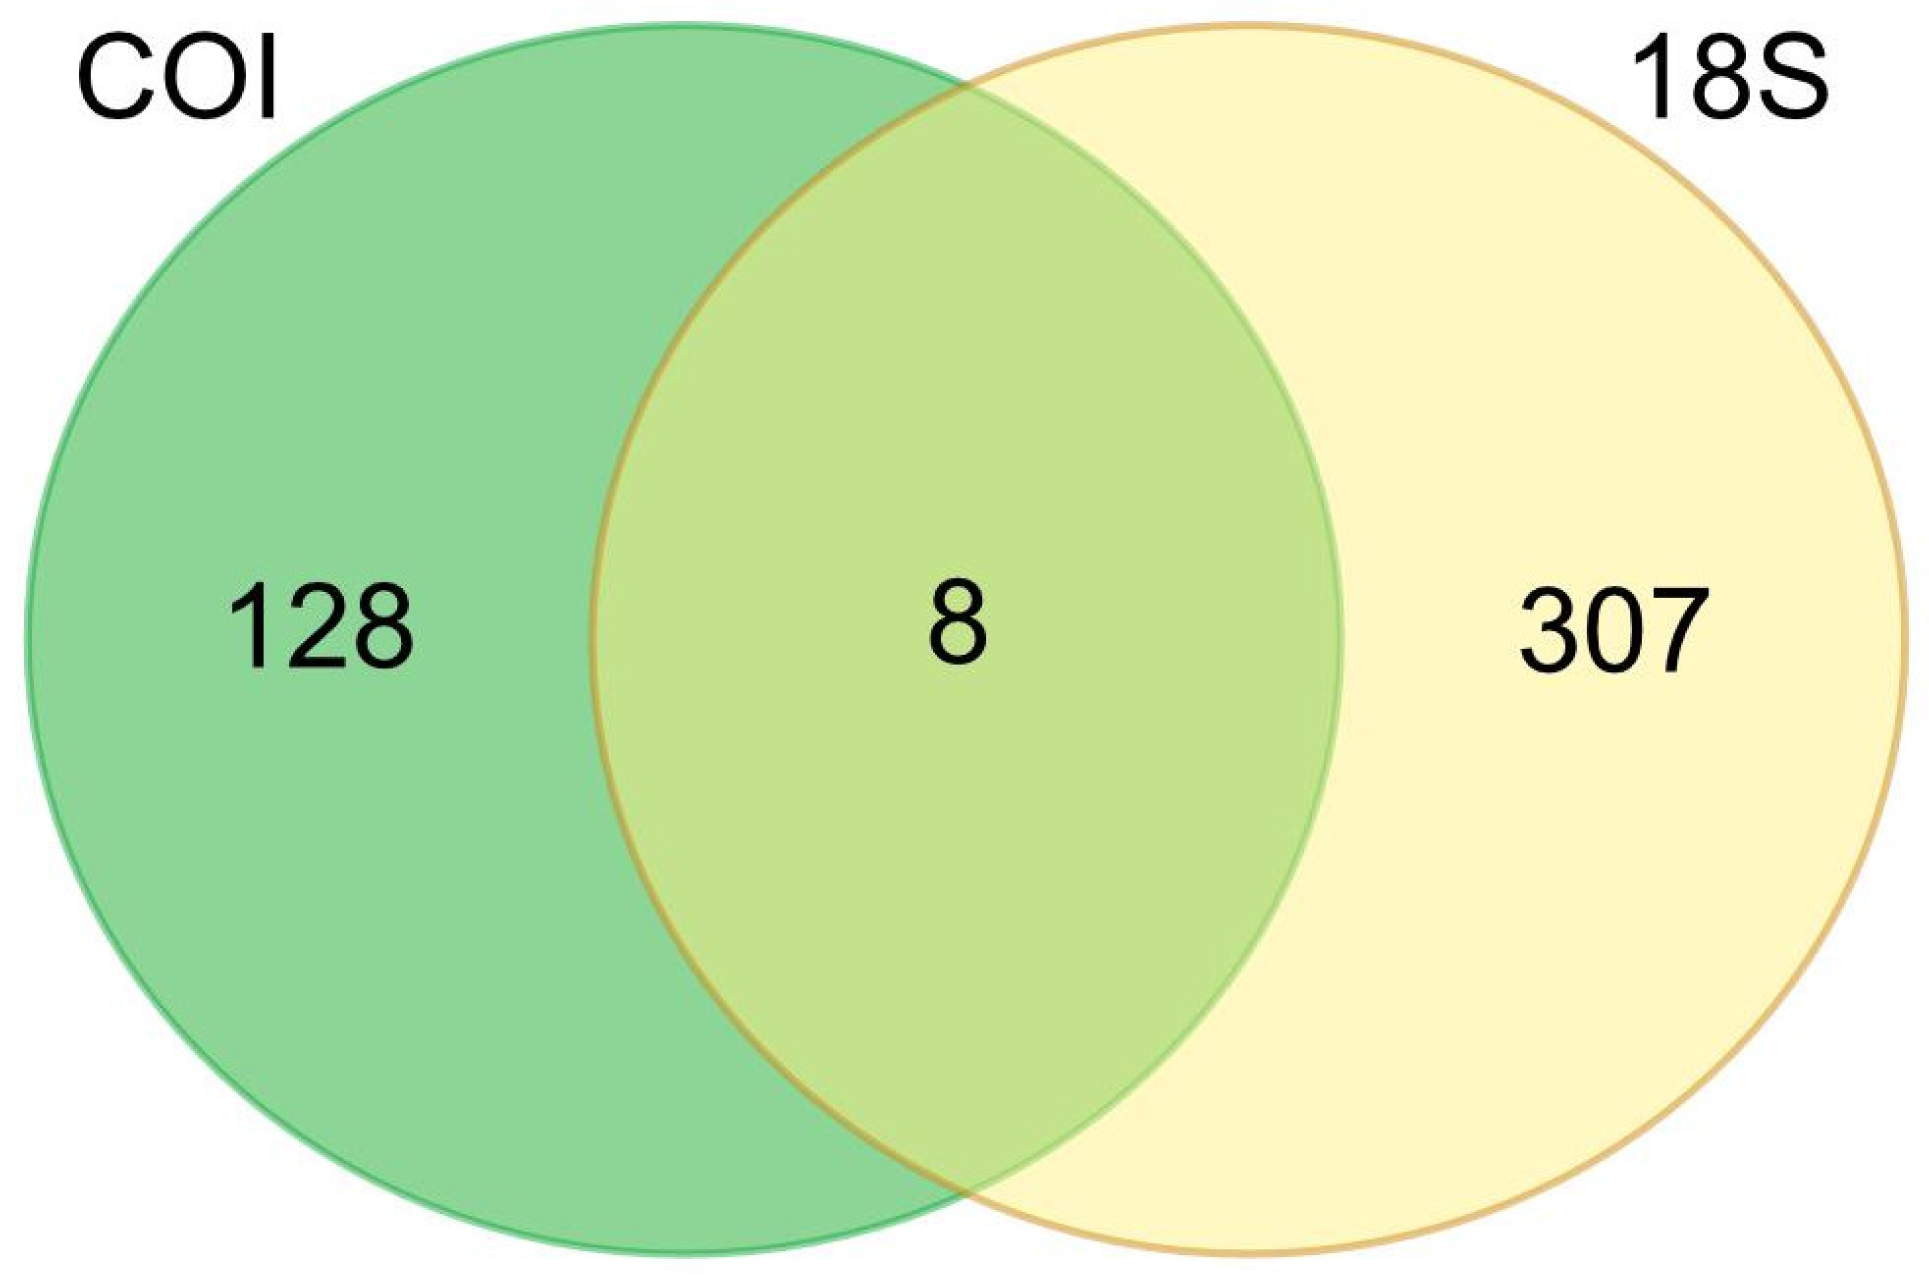
The results of organism detection using eDNA metabarcoding method showed that the two markers had specific detection sensitivity (Figure 9). At the genus level, 128 and 307 taxa were detected by COI and 18S markers, respectively. Additionally, there were only 8 species detected by COI and 18S markers. The 8 taxas comprised Ditylum, Skeletonema, Chaetoceros, Chrysochromulina, Phaeocystis, Prorocentrum, Pseudo-nitzschia, and Unclassified_Bacillariophyceae. These taxa belong to the group of diatoms and dinoflagellates microalgae, as reported in Table L1 and Table L2, respectively.
3.5.5. Beta Biodiversity Based on COI and 18S Gene
Beta biodiversity shows the ratio between the area and the level of biota diversity present in each sample. Beta biodiversity can be used to determine the pattern of sample distribution in the area serving as the focus of the research such as Pelindo Coastal (PP/MP) and Pelindo Laut (PL/ML).
COI gene data shows that the taxa biodiversity in PP area sample has a similar composition to PL, as reported in Figure 10. In comparison to PP area, samples from PL have more uniqueness in the taxa composition. There are 8 PP samples with different taxa compositions, namely PL01k, PL02k, PL03k, PL04k, PL05k, PL06k, PL07k and PL08. Therefore, PL region is unique compared to PP in terms of taxa composition and the amount of seqs DNA recorded. The similarity of biodiversity composition between PP and OT zones is seen in several samples with overlap in one plot (Figure 10).
For 18S gene data, most of the taxa in ML can be found in MP, specifically in MP01k. Meanwhile, the other 4 composite samples in the coastal area, namely MP02k, MP03k, MP04k, and MP05k, have relatively different compositions compared to samples from the marine area. Table L1 and Table L2 show a more detailed composition of COI and 18S gene markers-based taxa.
4. Discussion
The use of eDNA method in detecting species in marine protected areas shows higher detection capabilities and cost-effectiveness compared to conventional methods [16,17]. eDNA method uses short extracellular DNA fragments to obtain biodiversity in a conservation area [18]. Additionally, metabarcoding eDNA has a complex workflow and the absence of a single accepted standard method with varied results [19]. The collection of eDNA in the area environment is due to residues from feces, saliva, urine, and skin cells of animals inhabiting or visiting the area for hydration. Biodiversity in conservation areas is affected by the quantity and quality of eDNA samples collected. A greater quantity and higher quality of data enhance the comprehensiveness of biodiversity assessments in the region. Various factors affect the quality of eDNA, including the preferred primer, filter material, pore size, water volume, number of replications, DNA extraction methods, library preparation protocols, sequencing depth, and bioinformatics pipes [20,21].
The concentration and purity results of 12 and 10 samples of Pelindo Coast and Pelindo Laut, as well as 5 samples of coastal and marine composite were >10 ng/μL with a purity of 1.87 – 2.18. Therefore, the purity level of eDNA obtained is in the value range of 1.8 to 2.0 in A260/280 absorption measurement [22]. The ratio of A260/280 value shows that the concentration of DNA read with other impurities such as proteins at wavelength 280 can be continued to the subsequent stage of NGS.
In this research, 2,342 OTUs were found with 3 being detected in PP and PL areas, while 1,071 and 1,268 others could only be found separately. OTUs and seqs in the unidentified groups are from species or taxa whose DNA sequence data is not in reference databases, such as NCBI GenBank. The dominance of fauna groups from the phylum Arthropods in taxonomic annotations is natural, containing the largest number of taxa with high distribution and abundance [23].
eDNA-based method is progressively used to measure biodiversity in freshwater and marine ecosystems [24,25]. According to [26,27], the selection of markers in eDNA metabarcoding is important. The selection is specific to the target taxonomic group and validation is necessary before the application of metabarcoding analysis in situ [27]. COI and 18S markers are universal markers commonly used in eDNA metabarcoding analysis. In addition, 18S marker is considered better at detecting the proportion of eukaryotic organisms, including algae, than COI which tends to amplify metazoan species [28]. COI mark on the marine Pelindo and coastal Pelindo samples showed the highest Arthopod results, while 18S mark reported the diatom members.
In Indonesia, eDNA-based biodiversity research is widely carried out in coastal and ocean areas to show the composition of reef fish [29], types of coral reefs, endosymbiotic microalgae, detection of shark and ray species, and other fauna [30]. Generally, the primers target various mitochondrial gene and others use the marker 12S, namely Cytb (Cytochrome B encoder) or ITS region [7].
eDNA-based biodiversity analysis and the selection of gene targets or markers can affect the composition of the acquired taxa. This is because the specificity and sensitivity of DNA markers used to target the gene region vary. Some previous research have used hypervariable region 18S rRNA such as V1-V2 [31], V4, and V8 to show the composition of eukaryotic organisms [32]. The 18S rRNA gene has a disadvantage in terms of relatively low coverage for the detection and identification of metazoan groups (fauna). Therefore, COI was selected as the target gene to overcome the weakness of animal detection. The gene is commonly used to target fauna but the genetic marker also detects other eukaryotic organisms [33,34]. The use of COI in biodiversity analysis showed that Arthropoda had the highest level of detection followed by Craniata (Chordata), Echinodermta, Annelida, Cnidaria, and Mollusca. Arthropods are the phylum with the highest number of abundance [35] due to the number of species [23].
Marine microalgae are simple unicellular or multicellular microorganisms that can meet energy needs independently by photosynthesis. Ecologically, the organisms form the basis of the food web in the ocean and contribute 30% in CO2 fixation with a great impact on the global biogeochemical cycle. Economically, a variety of marine microalgae have the potential to be used as nutraceuticals, drug production, cosmetics [36], bioremediation, and biofuels [37,38]. The Labyrinthuloides, Porphyridium, Tetraselmis, and Xanthophyceae groups have the potential for biotechnological utilization. For example, the red microalgae species Porphyridium serves as a source of fatty acids, pigments, and polysaccharides as well as materials for the development of biofuels and pharmaceutical products. Therefore, there is an increase in the number of OTUs groups such as Chlorophyta, Dinoflagellata, Streptophyta, and Bacillariophyta. The increase in microalgae biodiversity in Mempawah Port, West Kalimantan, shows that the establishment of protected areas has provided benefits for the marine environment. An increase in diatomic taxa occurs after the formation of protected areas. The establishment of protected areas and the improvement of the local environment in the port increase local biodiversity [39]. The use of COI and 18S gene markers to detect algae in marine environments was also adopted by previous research to monitor potentially harmful algae species [34,40].
5. Conclusions
In conclusion, diversity analysis based on eDNA COI and 18S markers showed a fairly high level of biodiversity and abundance in Mempawah Port environment, West Kalimantan. The diversity included fauna, algae, and other groups of organisms. This reported the potential use of eDNA as an efficient tool for mapping and monitoring biodiversity in Mempawah Port environment. Based on the molecular markers of COI, various types of high-level and low-level fauna could be identified. Meanwhile, the molecular markers of COI and 18S showed that various types of beneficial and potentially harmful algae were found. This could be a concern in the sustainable management of Tanjungpura Port to maximize and minimize the potential for beneficial and harmful algae, respectively.
References
- Edgar, G.; Barrett, N.; Crane, K.; Bancroft, K. Ecosystem Monitoring of Subtidal Reefs in Different Management Zones of the Jurien Bay Marine Park 1999– 2007. TAFI Internal Report 2009, 57. [Google Scholar]
- Ido, S.; Shimrit, P.F. Blue is the new green – Ecological enhancement of concrete based coastal and marine infrastructure. Ecological Engineering 2015, 84, 260–272. [Google Scholar] [CrossRef]
- Bouchoucha, M.; Darnaude, A.; Gudefin, A.; Neveu, R.; VerdoitJarraya, M.; Boissery, P.; Lenfant, P. Potential use of marinas as nursery grounds by rocky fishes: Insights from four Diplodus species in the Mediterranean. Marine Ecology Progress Series 2016, 547, 193–209. [Google Scholar] [CrossRef]
- Macura, B.; Byström, P.; Airoldi, L.; Eriksson, B.K.; Rudstam, L.; Støttrup, J.G. Impact of structural habitat modifications in coastal temperate systems on fish recruitment: A systematic review. Environmental Evidence 2019, 8, 14. [Google Scholar] [CrossRef]
- Todd, P.A.; Heery, E.C.; Loke, L.H. L.; Thurstan, R.H.; Kotze, D.J.; Swan, C. Towards an urban marine ecology: Characterizing the drivers, patterns and processes of marine ecosystems in coastal cities. Oikos 2019, 128, 1215–1242. [Google Scholar] [CrossRef]
- Polanco, F.A.; Marques, V.; Fopp, F.; et al. Comparing environmental DNA metabarcoding and underwater visual census to monitor tropical reef fishes. Environmental DNA 2021, 3, 142–156. [Google Scholar] [CrossRef]
- Mathon, L.; et al. Cross-ocean patterns and processes in fishbiodiversity on coral reefs through the lens ofeDNA metabarcoding. Proc. R. Soc. B 2022, 289, 20220162. [Google Scholar] [CrossRef]
- Rodriguez-Ezpeleta, N.; Morissette, O.; Bean, C.W.; Manu, S.; Banerjee, P.; Lacoursière-Roussel, A.; Beng, K.C.; Alter, S.E.; Roger, F.; Holman, L.E.; Stewart, K.A.; Monaghan, M.T.; Mauvisseau, Q.; Mirimin, L.; Wangensteen, O.S.; Antognazza, C.M.; Helyar, S.J.; de Boer, H.; Monchamp, M.-E.; Nijland, R.; Abbott, C.L.; Doi, H.; Barnes, M.A.; Leray, M.; Hablützel, P.I.; Deiner, K. Trade-offs between reducing complex terminology and producing accurate interpretations from environmental DNA: Comment on “Environmental DNA: What’s behind the term?” by Pawlowski et al., (2020). Mol Ecol 2021, 30, 4601–4605. [Google Scholar] [CrossRef]
- Ji, Y.; Ashton, L.; Pedley, S.M.; Edwards, D.P.; Tang, Y.; Nakamura, A.; Kitching, R.; et al. Reliable, verifiable and efficient monitoring of biodiversity via metabarcoding. Ecology Letters 2013, 16, 1245–1257. [Google Scholar] [CrossRef]
- Valentini, A.; Taberlet, P.; Miaud, C.; Civade, R.; Herder, J.; Thomsen, P.F.; Dejean, T. Next-generation monitoring of aquatic biodiversity using environmental DNA metabarcoding. Molecular ecology 2016, 25, 929–942. [Google Scholar] [CrossRef]
- Lacoursière-Roussel, A.; Howland, K.; Normandeau, E.; Grey, E.K.; Archambault, P.; Deiner, K.; Bernatchez, L. eDNA metabarcoding as a new surveillance approach for coastal Arctic biodiversity. Ecology and Evolution 2018. [Google Scholar] [CrossRef] [PubMed]
- Rey, A.; Corell, J.; Rodriguez-Ezpeleta, N. Metabarcoding to study zooplankton diversity. Zooplankton Ecology 2020, 252–263. [Google Scholar]
- Stoeck, T.; Bass, D.; Nebel, M.; Christen, R.; Jones, M.D.; Breiner, H.W.; Richards, T.A. Multiple marker parallel tag environmental DNA sequencing reveals a highly complex eukaryotic community in marine anoxic water. Molecular ecology 2010, 19, 21–31. [Google Scholar] [CrossRef]
- Wang, Z.; Liu, X.; Liang, D.; Wang, Q.; Zhang, L.; Zhang, P. VertU: Universal multilocus primer sets for eDNA metabarcoding of vertebrate diversity, evaluated by both artificial and natural cases. Frontiers in Ecology and Evolution 2023, 11, 1164206. [Google Scholar] [CrossRef]
- Bolyen, E.; Rideout, J.R.; Dillon, M.R.; Bokulich, N.A.; Abnet, C.C.; Al-Ghalith, G.A.; Alexander, H.; Alm, E.J.; Arumugam, M.; Asnicar, F.; Bai, Y.; Bisanz, J.E.; Bittinger, K.; Brejnrod, A.; Brislawn, C.J.; Brown, C.T.; Callahan, B.J.; Caraballo-Rodríguez, A.M.; Chase, J.; Caporaso, J.G. Reproducible, interactive, scalable and extensible microbiome data science using QIIME 2. Nature Biotechnology 2019, 37, 852–857. [Google Scholar] [CrossRef]
- Darling, J.A.; Mahon, A.R. From molecules to management: Adopting DNA-based methods for monitoring biological invasions in aquatic environments. Environmental Research 2011, 111, 978–988. [Google Scholar] [CrossRef]
- Dejean, T.; Valentini, A.; Miquel, C.; Taberlet, P.; Bellemain, E.; Miaud, C. Improved detection of an alien invasive species through environmental DNA barcoding: The example of the American bullfrog Lithobates catesbeianus. Journal of Applied Ecology 2012, 49, 953–959. [Google Scholar] [CrossRef]
- Goldberg, C.S.; Turner, C.R.; Deiner, K.; Klymus, K.E.; Thomsen, P.F.; Murphy, M.A.; Taberlet, P. Critical considerations for the application of environmental DNA methods to detect aquatic species. Methods in ecology and evolution 2016, 7, 1299–1307. [Google Scholar] [CrossRef]
- Burian, A.; Mauvisseau, Q.; Bulling, M.; Domisch, S.; Qian, S.; Sweet, M. Improving the reliability of eDNA data interpretation. Mol Ecol Resour 2021, 21, 1422–1433. [Google Scholar] [CrossRef]
- Deiner, K.; Bik, H.M.; Mächler, E.; et al. Environmental DNA metabarcoding: Transforming how we survey animal and plant communities. Mol Ecol. 2017, 26, 5872–5895. [Google Scholar] [CrossRef]
- Bailet, B.; Apothéloz-Perret-Gentil, L.; Baričević, A.; Chonova, T.; Franc, A.; Frigerio, J.M.; Kahlert, M. Diatom DNA metabarcoding for ecological assessment: Comparison among bioinformatics pipelines used in six European countries reveals the need for standardization. Science of the Total Environment 2020, 745, 140948. [Google Scholar] [CrossRef]
- Sambrook, J.; Russell, D.W. Detection of DNA in Agarose Gels. Molecular Cloning, A Laboratory Manual; 3rd, *!!! REPLACE !!!*, Ed.; Cold Spring Harbor Laboratory Press: New York, 2001; pp. 5–14. [Google Scholar]
- Stork, N.E. How many species of insects and other terrestrial arthropods are there on earth? Annual review of entomology 2018, 63, 31–45. [Google Scholar] [CrossRef] [PubMed]
- Civade, R.; Dejean, T.; Valentini, A.; Roset, N.; Raymond, J.-C.; Bonin, A.; Pont, D. Spatial representativeness of environmental DNA metabarcoding signal for fish biodiversity assessment in a natural freshwater system. PLoS ONE 2016, 11, e0157366. [Google Scholar] [CrossRef]
- Andruszkiewicz, E.A.; Starks, H.A.; Chavez, F.P.; Sassoubre, L.M.; Block, B.A.; Boehm, A.B. Biomonitoring of marine vertebrates in monterey bay using eDNA metabarcoding. PLoS ONE 2017, 12(4), e0176343. [Google Scholar] [CrossRef] [PubMed]
- Coissac, e.; Riaz, t.; Puillandre, N. Bioinformatic challenges for DNA metabarcoding of plants and animals. Molecular Ecology 2012, 21, 1834–1847. [Google Scholar] [CrossRef] [PubMed]
- Deagle, B.E.; Jarman, S.N.; Coissac, E.; Pompanon, F.; Taberlet, P. DNAmetabarcoding and the cytochrome c oxidasesubunit I marker: Not a perfect match. Biol.Lett 2014, 10, 20140562. [Google Scholar] [CrossRef]
- Laroche, O.; Wood, S.A.; Tremblay, L.A.; Ellis, J.I.; Lear, G.; Pochon, X. A cross-taxa study using environmental DNA/RNA metabarcoding to measure biological impacts of offshore oil and gas drilling and production operations. Marine Pollution Bulletin 2018, 127, 97–107. [Google Scholar] [CrossRef]
- Marwayana, O.N.; Gold, Z.; Meyer, C.P.; Barber, P.H. Environmental DNA in a global biodiversity hotspot: Lessons from coral reef fish diversity across the Indonesian archipelago. Environmental DNA 2022, 4, 222–238. [Google Scholar] [CrossRef]
- Madduppa, H.; Cahyani, N.K.D.; Anggoro, A.W.; et al. eDNA metabarcoding illuminates species diversity and composition of three phyla (chordata, mollusca and echinodermata) across Indonesian coral reefs. Biodivers Conserv 2021, 30, 3087–3114. [Google Scholar] [CrossRef]
- Mohrbeck, I.; Raupach, M.J.; Martínez Arbizu, P.; Knebelsberger, T.; Laakmann, S. High-throughput sequencing—The key to rapid biodiversity assessment of marine metazoa? . PLoS ONE 2015, 10, e0140342. [Google Scholar] [CrossRef]
- Guardiola, M.; Uriz, M.J.; Taberlet, P.; Coissac, E.; Wangensteen, O.S.; Turon, X. Deep-sea, deep-sequencing: Metabarcoding extracellular dna from sediments of marine canyons. PLoS ONE 2015, 10, e0139633. [Google Scholar] [CrossRef] [PubMed]
- Leray, M.; Yang, J.Y.; Meyer, C.P.; et al. A new versatile primer set targeting a short fragment of the mitochondrial COI region for metabarcoding metazoan diversity: Application for characterizing coral reef fish gut contents. Front Zool 2013, 10, 34. [Google Scholar] [CrossRef]
- Jacobs-Palmer, E.; Gallego, R.; Cribari, K.; Keller, A.G.; Kelly, R.P. Environmental DNA metabarcoding for simultaneous monitoring and ecological assessment of many harmful algae. Frontiers in Ecology and Evolution 2021, 9, 612107. [Google Scholar] [CrossRef]
- Günther, B.; Knebelsberger, T.; Neumann, H.; Laakmann, S.; Arbizu, P.M. Metabarcoding of marine environmental DNA based on mitochondrial and nuclear gene. Scientific reports 2018, 8, 14822. [Google Scholar] [CrossRef] [PubMed]
- Borowitzka, M.A. Microalgae as sources of pharmaceuticals and other biologically active compounds. J Appl Phycol 1995, 7, 3–15. [Google Scholar] [CrossRef]
- Cardinale, B.J.; Matulich, K.L.; Hooper, D.U.; Byrnes, J.E.; Duffy, E.; Gamfeldt, L.; Balvanera, P.; O’Connor, M.I.; Gonzalez, A. The functional role of producer diversity in ecosystems†. American Journal of Botany 2011, 98, 572–592. [Google Scholar] [CrossRef]
- El-Sheekh, M.M.; Khairy, H.M.; El-Shenody, R. Algal production of extra and intra-cellular polysaccharides as an adaptive response to the toxin crude extract of Microcystis aeruginosa. J Environ Health Sci Engineer 2012, 9, 10. [Google Scholar] [CrossRef]
- Li, S.; Ji, L.; Shi, Q.; Wu, H.; Fan, J. Advances in the production of bioactive substances from marine unicellular microalgae Porphyridium spp. Bioresource Technology 2019, 122048. [Google Scholar] [CrossRef]
- Gaonkar, C.C.; Campbell, L. A full-length 18S ribosomal DNA metabarcoding approach for determining protist community diversity using nanopore sequencing. Ecology and Evolution 2024, 14, e11232. [Google Scholar] [CrossRef]
Figure 1.
Sampling locations in Pelindo Laut (PL) and Pelindo Pesisir (PP) areas for analysis used COI and 18S gene markers.
Figure 1.
Sampling locations in Pelindo Laut (PL) and Pelindo Pesisir (PP) areas for analysis used COI and 18S gene markers.
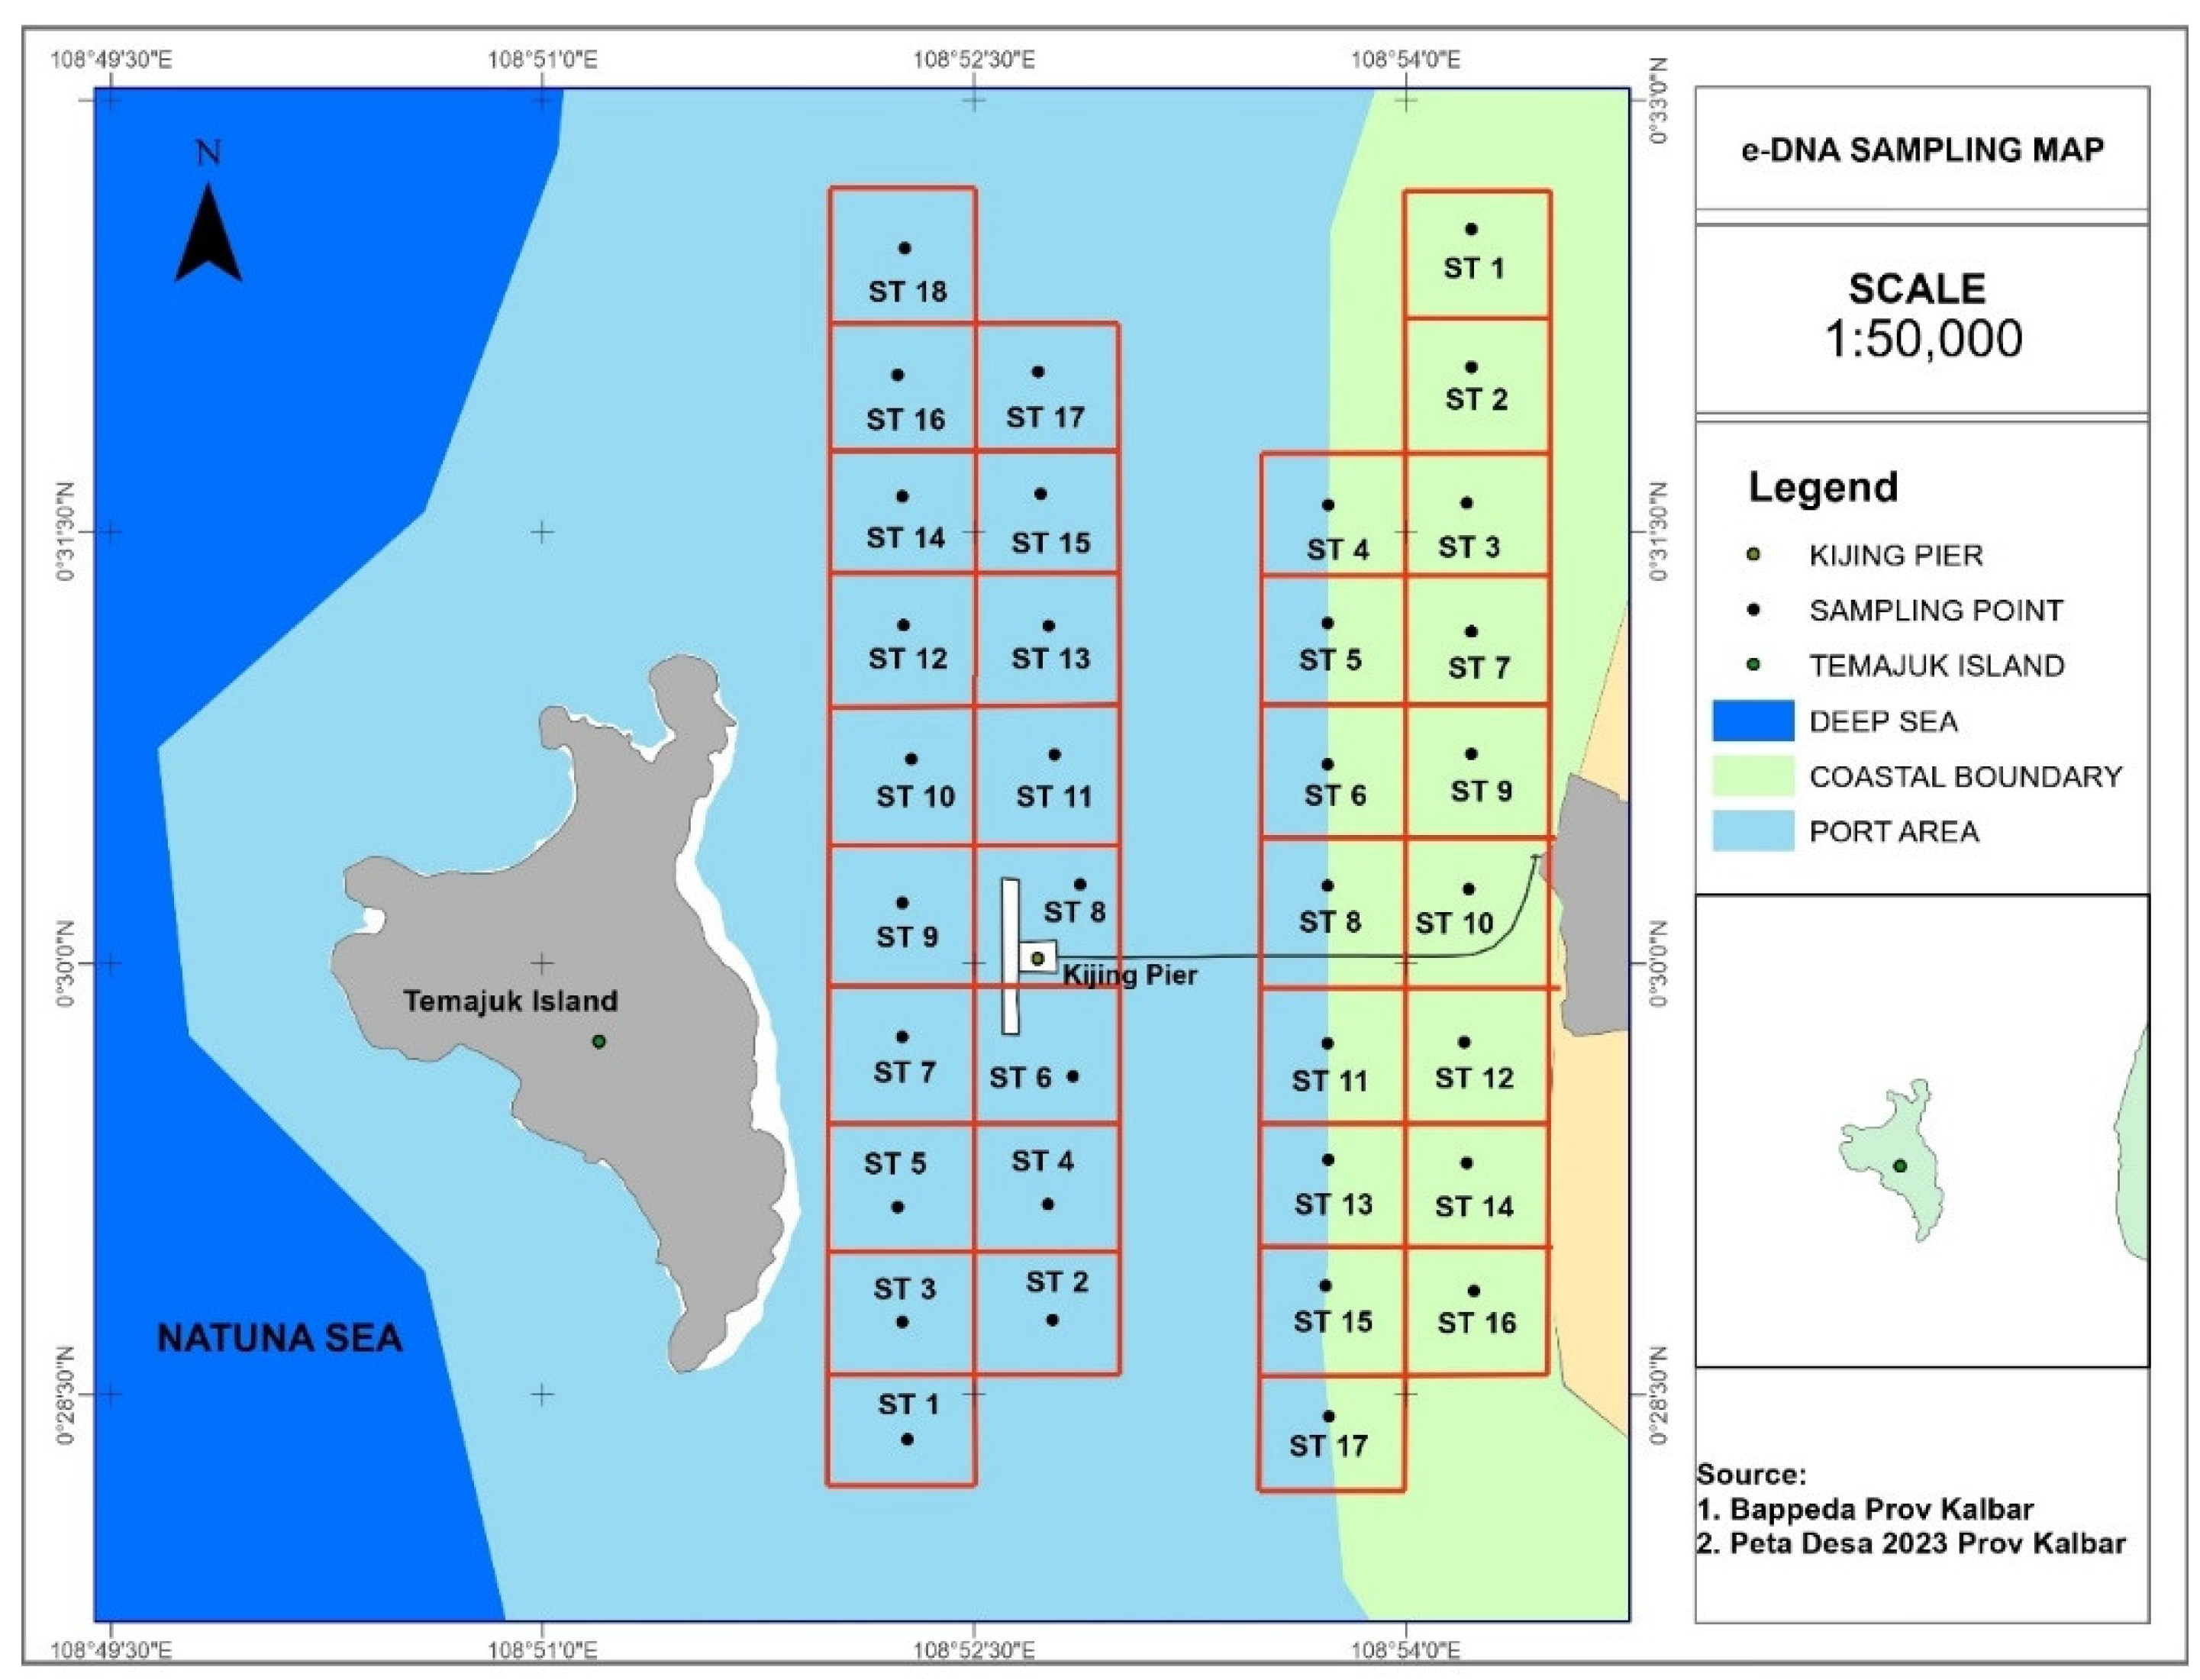
Figure 5.
Taxonomic composition of DNA seqs (reads) of COI gene at phylum level in marine (PL) and coastal (PP) areas. DNA associated with animals/fauna and algae/microalgae are marked with a red circle of green squares. Other groups are classified as fungi and protists.
Figure 5.
Taxonomic composition of DNA seqs (reads) of COI gene at phylum level in marine (PL) and coastal (PP) areas. DNA associated with animals/fauna and algae/microalgae are marked with a red circle of green squares. Other groups are classified as fungi and protists.

Figure 9.
Beta diversity analysis of NGS COI data based on NMDS (Jensen-Shannon divergence) plots. The red and blue dots represent PP and PL, respectively. Some of the overlapping samples are shown by inscriptions and black circles.
Figure 9.
Beta diversity analysis of NGS COI data based on NMDS (Jensen-Shannon divergence) plots. The red and blue dots represent PP and PL, respectively. Some of the overlapping samples are shown by inscriptions and black circles.

Figure 10.
Beta diversity analysis of NGS 18S data based on NMDS (Jensen-Shannon divergence) plots. The red and blue dots represent MP and ML, respectively.
Figure 10.
Beta diversity analysis of NGS 18S data based on NMDS (Jensen-Shannon divergence) plots. The red and blue dots represent MP and ML, respectively.


Table 1.
Concentration and purity of eDNA samples extracted from Pelindo Sisir (PP), and Pelindo Laut (PL) areas for metabarcoding analysis based on COI and 18S markers.
Table 1.
Concentration and purity of eDNA samples extracted from Pelindo Sisir (PP), and Pelindo Laut (PL) areas for metabarcoding analysis based on COI and 18S markers.
| No | Area | COI | 18S | ||||
| Sample code | Concentration* (ng/μL) | Purity | Sample code | Concentration* (ng/μL) | Purity | ||
| 1 | Laut | PL01k | 18.79 | 1.96 | ML01k | 26.26 | 1.93 |
| 2 | PL02k | 11.09 | 2.13 | ML02k | 17.92 | 1.97 | |
| 3 | PL03k | 12.62 | 2.02 | ML03k | 26.90 | 1.97 | |
| 4 | PL04k | 12.14 | 2.07 | ML04k | 21.08 | 1.96 | |
| 5 | PL05k | 16.18 | 2.05 | ML05k | 14.62 | 2.01 | |
| 6 | PL06k | 26.93 | 1.93 | ||||
| 7 | PL07k | 11.66 | 2.14 | ||||
| 8 | PL08 | 11.02 | 2.18 | ||||
| 9 | PL09 | 10.89 | 2,04 | ||||
| 10 | PL10 | 37.70 | 1.92 | ||||
| 11 | Pesisir | PP01 | 30.75 | 1.94 | MP01k | 12.31 | 2.01 |
| 12 | PP10k | 10.38 | 2.07 | MP02k | 15.95 | 2.06 | |
| 13 | PP11 | 27.69 | 1.93 | MP03k | 20.68 | 1.93 | |
| 14 | PP12 | 21.05 | 1.96 | MP04k | 12.44 | 2.06 | |
| 15 | PP02 | 18.15 | 1.99 | MP05k | 24.49 | 1.96 | |
| 16 | PP03 | 16.15 | 1.96 | ||||
| 17 | PP04k | 28.03 | 1.87 | ||||
| 18 | PP05k | 28.43 | 1.91 | ||||
| 19 | PP06k | 11.37 | 2.06 | ||||
| 20 | PP07 | 21.06 | 1.94 | ||||
| 21 | PP08 | 12.43 | 2.03 | ||||
| 22 | PP09k | 18.16 | 1.97 | ||||
*) The concentration and purity of eDNA were measured with 4 replicate reading.
Table 2.
Alpha biodiversity indexes of NGS data of PL area samples based on COI gene.
| No. | Sample | Observed (#OTUs) | Chao1 | Shannon | Simpson |
| 1 | PL01k | 105 | 106.5 ± 2.59 | 4.33 | 0.9839 |
| 2 | PL02k | 106 | 106 ± 0.49 | 4.43 | 0.9860 |
| 3 | PL03k | 106 | 106 | 4.34 | 0.9838 |
| 4 | PL04k | 122 | 122 ± 0.24 | 4.50 | 0.9863 |
| 5 | PL05k | 114 | 114 | 4.38 | 0.9840 |
| 6 | PL06k | 96 | 96.333 ± 0.93 | 4.15 | 0.9787 |
| 7 | PL07k | 108 | 108 | 4.33 | 0.9831 |
| 8 | PL08 | 112 | 112 ± 0.25 | 4.38 | 0.9838 |
| 9 | PL09 | 110 | 110 ± 0.25 | 4.38 | 0.9843 |
| 10 | PL10 | 103 | 103 | 4.34 | 0.9839 |
Table 3.
Alpha biodiversity indexes of NGS data for PP area samples based on COI gene.
| No. | Sample | Observed (#OTUs) | Chao1 | Shannon | Simpson |
| 1 | PP01 | 95 | 96 ± 2.34 | 4.26 | 0.9819 |
| 2 | PP02 | 114 | 114 | 4.47 | 0.9858 |
| 3 | PP03 | 101 | 101 | 4.36 | 0.9843 |
| 4 | PP04k | 83 | 83 | 4.10 | 0.9801 |
| 5 | PP05k | 106 | 107 ± 2.34 | 4.33 | 0.9836 |
| 6 | PP06k | 116 | 116 ± 0.25 | 4.49 | 0.9866 |
| 7 | PP07 | 94 | 94.5 ± 1.29 | 4.19 | 0.9804 |
| 8 | PP08 | 124 | 124 | 4.22 | 0.9811 |
| 9 | PP09k | 114 | 115.2 ± 1.84 | 4.35 | 0.9826 |
| 10 | PP10k | 104 | 104.25 ± 0.74 | 4.32 | 0.9836 |
| 21 | PP11 | 114 | 114 ± 0.49 | 4.26 | 0.9801 |
| 22 | PP12 | 110 | 111 ± 2.34 | 4.42 | 0.9853 |
Table 4.
Alpha biodiversity indexes of NGS data for ML region samples based on18S gene.
| No. | Sample | Observed (# OTUs) | Shannon | Simpson | InvSimpson |
| 1 | ML01k | 759 | 5.18116045 | 0.98206565 | 55.7589194 |
| 2 | ML02k | 745 | 5.15552475 | 0.9782008 | 45.8732439 |
| 3 | ML03k | 730 | 5.09918498 | 0.9779652 | 45.3827591 |
| 4 | ML04k | 790 | 5.02045456 | 0.97021388 | 33.5726886 |
| 5 | ML05k | 745 | 5.08774115 | 0.9756816 | 41.1211275 |
Table 5.
Alpha biodiversity indexes of NGS data for PP area samples based on 18S gene.
| No. | Sample | Observed (# OTUs) | Shannon | Simpson | InvSimpson |
| 1 | MP01k | 449 | 4.22568004 | 0.94156153 | 17.1120151 |
| 2 | MP02k | 646 | 5.19277849 | 0.98267021 | 57.7041184 |
| 3 | MP03k | 612 | 4.86041789 | 0.96659691 | 29.9373545 |
| 4 | MP04k | 1106 | 5.40223288 | 0.98385162 | 61.9257123 |
| 5 | MP05k | 759 | 5.06866917 | 0.97828421 | 46.0494478 |
Disclaimer/Publisher’s Note: The statements, opinions and data contained in all publications are solely those of the individual author(s) and contributor(s) and not of MDPI and/or the editor(s). MDPI and/or the editor(s) disclaim responsibility for any injury to people or property resulting from any ideas, methods, instructions or products referred to in the content. |
© 2025 by the authors. Licensee MDPI, Basel, Switzerland. This article is an open access article distributed under the terms and conditions of the Creative Commons Attribution (CC BY) license (http://creativecommons.org/licenses/by/4.0/).
Copyright: This open access article is published under a Creative Commons CC BY 4.0 license, which permit the free download, distribution, and reuse, provided that the author and preprint are cited in any reuse.


