Submitted:
26 March 2025
Posted:
28 March 2025
You are already at the latest version
Abstract
In this study, CdWO4/CdMoO4 heterostructures were synthesized using the microwave-assisted hydrothermal method, characterized, and evaluated for their photocatalytic properties. The samples were analyzed using X-ray diffraction (XRD), Raman and ultraviolet-visible (UV-Vis) spectroscopy, field-emission scanning electron microscopy (FESEM), and photoluminescence (PL). The photocatalytic performance was assessed using methylene blue as a model pollutant. XRD patterns and Raman spectra confirmed the formation of heterostructures containing the Wolframite phase of CdWO4 and the Scheelite phase of CdMoO4. FESEM micrographs revealed that the CdWO4 phase exhibits a plate-like morphology, while the CdMoO4 phase consists of irregular nanoparticles. Photocatalytic tests demonstrated that the 20Mo sample exhibited the best performance, degrading 96% of the dye after 2 h of reaction. The findings of this study indicate that CdWO4/CdMoO4 heterostructures hold significant potential for photocatalytic applications in the degradation of cationic dyes.
Keywords:
MAH method
; CdWO4/CdMoO4 heterostructures
; photocatalysis
1. Introduction
In recent years, semiconductor materials based on tungstates and molybdates have been extensively studied due to their remarkable optical, electronic, and photocatalytic properties [1,2,3,4]. Among them, cadmium tungstate (CdWO4) and cadmium molybdate (CdMoO4) stand out for their crystal structures, which favor light absorption and charge transport, making them promising materials for applications in sensors, optoelectronic devices, and heterogeneous photocatalysis [5,6].
CdWO4 crystallizes in a monoclinic Wolframite-type structure, characterized by edge-sharing WO6 octahedral chains, with Cd2+ cations occupying distorted coordination sites [7]. This configuration results in efficient scintillation properties, with blue-white light emission under X-ray or γ-ray excitation, making it widely used in radiation detectors. In contrast, CdMoO4 typically adopts a tetragonal Scheelite-type structure, where Mo6+ ions occupy tetrahedral coordination sites surrounded by oxygen atoms [8]. This structure enhances its photoluminescent properties and allows for structural modifications through doping, enabling the development of optimized materials for various applications.
The combination of these materials in the form of CdWO4/CdMoO4 heterostructures is an attractive strategy for optimizing their properties. These structures enhance charge carrier separation, reduce electron-hole recombination, and expand spectral response, contributing to improved efficiency in technological applications [9]. The integration of CdWO4 and CdMoO4 in heterostructures leverages their complementary properties, particularly in photocatalysis and optoelectronic devices. The interface between these compounds facilitates the formation of a heterojunction that optimizes charge separation and transport, thereby increasing efficiency in technological applications [10]. The synthesis of these heterostructures can be achieved through various techniques, including solvothermal methods, atomic layer deposition (ALD), and microwave-assisted techniques [11,12,13,14,15]. The choice of synthesis method directly influences the morphology and final properties of the material, making it a crucial factor in the development of optimized applications.
In this study, we will investigate the optoelectronic properties of CdWO4 and CdWO4/CdMoO4 heterostructures, where the CdMoO4 content will vary by 10, 20, and 30 mol% relative to CdWO4. The synthesized materials will be characterized using X-ray diffraction (XRD), Raman and ultraviolet-visible (UV-Vis) spectroscopy, field-emission scanning electron microscopy (FESEM), and photoluminescence (PL). The photocatalytic properties will be evaluated through the degradation of methylene blue dye.
2. Materials and Methods
The experimental procedure was performed using Cd(NO3)2.4(H2O) (Êxodo, P.A.), Na2WO4.2(H2O) (Alfa Aesar, 95%), Na2MoO4.2(H2O) (Alfa Aesar, 98%), NH4OH (Cia Vicco, P.A.), and deionized water como precursores.
Initially, Cd(NO3)2.4(H2O) e Na2WO4.2(H2O) were added in a 1:1 ratio to a beaker containing deionized water and kept under constant stirring. After complete dissolution, ammonium hydroxide was added until the solution reached pH 8. The solution was then transferred to a Teflon-lined autoclave and irradiated with microwaves for 1 h at 140 °C under an internal pressure of 2 bar. At the end of this process, the supernatant was washed, separated by centrifugation, and dried in an oven at 100 °C. Similar procedures were performed, varying only the amount of Na2WO4.2(H2O) replaced by Na2MoO4.2(H2O) at molar ratios of 10, 20, and 30%. Finally, the samples were named according to the amount of Na2MoO4.2(H2O) added during synthesis, as follows: 0Mo, 10Mo, 20Mo, and 30Mo.
X-ray diffraction was used to identify the crystalline phases. The analysis was performed using a Shimadzu XRD-7000 diffractometer with CuKα radiation (1.5418 Å), scanning angles from 10° to 120°, a step size of 0.02°, and a scanning speed of 1°/min. Raman spectroscopy was conducted in the 100–1200 cm-1 range using a 532 nm laser with a power of 1 mW. Measurements were taken with a 15 s acquisition time on a LabRam HR Evolution confocal microscope from HORIBA Scientific. Ultraviolet-visible (UV-Vis) spectroscopy was performed using a Shimadzu UV-2600 spectrophotometer in diffuse reflectance mode, with a wavelength range of 200–900 nm. The reflectance data were converted into absorption using the Kubelka-Munk function [16], and the Wood and Tauc equation [17] was applied to estimate the bandgap (Egap) of the synthesized powders. The morphology of the synthesized samples was analyzed using field emission scanning electron microscopy (FESEM) on a Carl Zeiss Supra 35 – VP microscope. Photoluminescence (PL) measurements were carried out using a Cobolt/Zouk laser with an excitation wavelength of 335 nm. The sample power was set to 100 µW, and the detection system comprised a 19.3 cm spectrometer equipped with a silicon CCD detector (Andor – Kymera/Idus).
The photocatalytic activity of the samples was evaluated using methylene blue (MB) dye at pH 5 and a concentration of 10-5 mol.L-1 under UV-Visible radiation. For this, 0.05 g of the samples was added to 50 mL of MB solution and kept under constant stirring. After 20 min of stirring, a 2 mL aliquot was collected and compared to the initial dye absorption to assess the adsorptive capacity of the samples. Following this initial measurement, the six UVC lamps (TUV Philips, 15 W) in the reactor were switched on, and additional aliquots were collected every 20 min to evaluate the photocatalytic performance.
The absorbance of the collected aliquots was measured using a Shimadzu UV-2600 spectrophotometer. The points of greatest intensity in the absorbance curves were used and the C/Co curves were plotted.
3. Results and Discussion
Figure 1a shows the diffraction patterns obtained for the pure sample and the CdWO4/CdMoO4 heterostructures. The 0Mo sample exhibits all the peaks corresponding to CdWO4, which has a Wolframite structure and belongs to the P2/c space group, as characterized by ICSD card 84454. Figure 1b presents a magnified section of the diffraction pattern from Figure 1a, highlighting the main peaks of the Wolframite phase. From Figure 1b, it can be observed that as the molybdenum content in the solution increases, peaks associated with CdMoO4 appear. CdMoO4 has a Scheelite structure and belongs to the I41/a space group, as characterized by ICSD card 84455. These results indicate that the microwave-assisted hydrothermal method is effective in obtaining CdWO4/CdMoO4 heterostructures easily and simultaneously, without the formation of secondary phases.
Other information about the synthesized materials was obtained through Raman spectroscopy. Figure 2 presents the Raman spectra of the samples synthesized in this study. As previously discussed, CdWO4 has a monoclinic Wolframite structure. The main vibrational mode (Ag*) of this phase is located near 901 cm-1 and corresponds to the internal vibration of the WO6 octahedron, which can be attributed to the symmetric stretching mode [7]. Around 311 cm-1, here is the Bg symmetric stretching of the CdO6 octahedron. The Ag* vibrational bands near 393 cm-1 are associated with weak modes of the [MoO4] tetrahedron, while the Ag* vibrational bands near 550 cm-1 are associated with the mode resulting from the W-O-W symmetric stretching mode [18]. The Bg* vibrational bands around 773 cm-1 correspond to the symmetric stretching mode in relation to the center of symmetry. The Ag bands between 182 and 235 cm-1 are the translational and rotational modes associated with the [MoO4]-2 tetrahedra and the Cd-O motion [19]. As seen in Figure 2, at a molybdenum proportion of 10%, the appearance of the Ag vibrational band around 870 cm-1 is observed. This band is attributed to the symmetric stretching of the [MoO4]-2 tetrahedral clusters [20].
Spectroscopic analysis in the ultraviolet-visible region was performed using diffuse reflectance, and the data were converted to absorption based on the theory proposed by Kubelka and Munk [16], as shown in Figure 3a. The effect of this extended absorption range on the band gap energy (Egap) of the materials was analyzed using the methodology proposed by Wood and Tauc [17], based on the direct transition, which is presented below in Equation 1:
where h is the Planck constant, ν is the photon’s frequency, Eg is the band gap energy, and B is a constant. The γ factor depends on the nature of the electron transition and is equal to 1/2 or 2 for the direct and indirect transition band gaps, respectively. Thus, aiming at the analysis using the direct transition, in this work γ = 1/2 was used.
As observed, the pure CdWO4 sample exhibits low absorption compared to the heterostructures, with its maximum absorption bands around 261 and 292 nm. On the other hand, the formation of heterostructures not only increases the intensity but also extends the absorption spectrum to longer wavelengths. However, it is noted that even the heterostructures still exhibit absorption in the ultraviolet region. According to Figure 3b–e, a decrease in Egap is observed as the amount of CdMoO4 in the heterostructure increases, reducing from 4.02 eV to 3.77 eV, from the 0Mo sample to the 30Mo sample. The formation of a heterojunction with two or more distinct phases can induce the emergence of new intermediate electronic states within the bands of the compound, facilitating electronic transitions and consequently reducing the band gap (Egap) of the heterostructure [21].
The CdWO4 samples and heterostructures were morphologically characterized using field emission scanning electron microscopy (FESEM), and the obtained micrographs are presented in Figure 4. The micrograph of the 0Mo sample reveals that the CdWO4 phase exhibits a plate-like morphology with a rectangular appearance, where the plate length shows some variation. The micrographs of the other samples (Figure 4b–d) indicate that as the amount of CdMoO4 increases in the synthesis, the CdWO4 plates become wider. This morphological change in the CdWO4 phase is further confirmed in Figure 5, which presents the width distribution histogram of these plates. The measurements were performed using the ImageJ software, considering at least 120 measurements from images acquired at different scales for quantification. It is worth noting that the plate morphology is characterized by two well-defined dimensions: the longer one, referred to as the length, and the shorter one, referred to as the width. As observed in Figure 5, the average plate width increases from 70.4 nm in the 0Mo sample to 172.1 nm in the 30Mo sample. Additionally, an increase in standard deviation is also observed, indicating greater size variation as the CdMoO4 content increases in the synthesis. Figure 4d further highlights the presence of CdMoO4 particles, which exhibit an irregular spherical morphology. In the 10Mo and 20Mo samples, similar particles can also be observed, albeit more sparsely distributed among the CdWO4 plates. The average size of the CdMoO4 nanoparticles was estimated by measuring diameters in two perpendicular directions. The results indicate that the CdMoO4 nanoparticles have an average diameter of 68.3 nm with a standard deviation of 12.3 nm.
The photocatalytic properties of CdWO4 and your heterostructures were evaluated using methylene blue (MB) as the target dye. For this purpose, absorbance curves (Figure 6a) were analyzed for aliquots collected at 20 min intervals. Initially, an aliquot of the dye solution was collected before contact with the samples, referred to as C0. Subsequent aliquots were labeled as C, and the concentration variation curves (C/C0) were plotted, as shown in Figure 6b. The analysis of the C/C0 curves confirms that all tested samples exhibit photocatalytic activity, accelerating the degradation of the dye under light irradiation. This effect is particularly evident when comparing the concentration variation of the samples to photolysis alone. Additionally, Figure 6b indicates that the 0Mo sample exhibits the highest adsorption capacity among all studied samples. This result is consistent with FESEM images, which revealed that this sample has the smallest particle size, leading to a larger contact area with the surrounding medium. On the other hand, despite its high adsorption capacity, the 0Mo sample demonstrated the lowest photocatalytic activity. The three heterostructures studied exhibited similar photocatalytic efficiency, with the 20Mo sample achieving the best performance by degrading 96% of the MB dye after 2 h of testing. The 10Mo and 30Mo samples followed, degrading 94% and 92% of the dye, respectively.
The evaluation of the photocatalytic efficiency of semiconductor materials can be more accurately assessed based on kinetic constants. In this context, photocatalytic processes in semiconductor materials are typically modeled using a first-order kinetic constant, as described by the equation presented in Equation 2 [22]:
where C is absorbance of methylene blue at time t; C0 is initial absorbance; t is irradiation time; k is kinetic constant.
The kinetic constants calculated using Equation 02 are presented in Table 1. As observed, the 20Mo sample exhibits the highest kinetic constant, indicating the fastest reaction rate. The R2 values demonstrate good reliability of the results, confirming that the first-order kinetic model provides a good fit to the experimental data. This model is applicable in processes where pollutant adsorption onto the samples is low and the radiation intensity remains constant, ensuring that photocatalysis proceeds in an approximately linear manner [23].
To gain further insights into charge carrier dynamics in the synthesized samples, photoluminescence (PL) measurements were performed. Figure 7 presents the PL spectra obtained under 335 nm laser excitation. As shown in Figure 7, the CdWO4 sample exhibits the lowest photoluminescence intensity, with an emission band centered around 545 nm. In contrast, the heterostructures display higher photoluminescence intensity compared to the pure phase, along with a redshift of the emission band to 624 nm. This shift is attributed to the simultaneous presence of CdWO4 and CdMoO4 phases and an increase in intrinsic defects, such as oxygen vacancies, which promote emission towards the red region [24]. The enhanced photoluminescence intensity observed in the heterostructures compared to the pure sample suggests a Type-I heterostructure, where electrons (e-) and holes (h+) accumulate in the same region of the material, facilitating e-/h+ recombination [25]. Additionally, an increase in CdMoO4 content within the heterostructure correlates with higher PL intensity, indicating a greater number of e-/h+ recombination events. These findings align with the photocatalytic results, where the 20Mo sample demonstrated the highest degradation efficiency for methylene blue.
4. Conclusions
The microwave-assisted hydrothermal method proved to be an efficient approach for synthesizing CdWO4/CdMoO4 heterostructures in a single step, forming the Wolframite and Scheelite structures for each respective phase. FESEM images reveal that the particle growth kinetics are influenced by the increasing concentration of CdMoO4 in the medium, leading to enhanced growth of CdWO4 particles. Photocatalytic tests using methylene blue as a model pollutant demonstrated that the defects introduced by heterostructure formation enhance photocatalytic activity. Additionally, photoluminescence analysis indicated that heterostructure formation increases photoluminescence intensity and shifts the emission towards longer wavelengths.
Author Contributions
Conceptualization, N. F. Andrade Neto, O.B.M. Ramalho, M.R.D. Bomio and F.V. Motta.; methodology, N. F. Andrade Neto, O.B.M. Ramalho, M.R.D. Bomio and F.V. Motta.; software, N. F. Andrade Neto and O.B.M. Ramalho.; validation, N. F. Andrade Neto, O.B.M. Ramalho, M.R.D. Bomio and F.V. Motta.; formal analysis, N. F. Andrade Neto and O.B.M. Ramalho.; investigation, N. F. Andrade Neto and O.B.M. Ramalho; resources, N. F. Andrade Neto and O.B.M. Ramalho.; data curation, N. F. Andrade Neto and O.B.M. Ramalho.; writing—original draft preparation, N. F. Andrade Neto.; writing—review and editing, N. F. Andrade Neto and F.V. Motta.; visualization, M.R.D. Bomio and F.V. Motta.; supervision, M.R.D. Bomio and F.V. Motta.; project administration, M.R.D. Bomio and F.V. Motta.; funding acquisition, M.R.D. Bomio and F.V. Motta. All authors have read and agreed to the published version of the manuscript.
Funding
This research received no external funding.
Institutional Review Board Statement
Not applicable.
Informed Consent Statement
Not applicable.
Data Availability Statement
Dataset available on request from the authors.
Acknowledgments
The authors thank the following Brazilian research financing institutions for financial support: the National Council for Scientific and Technological Development (CNPq) - Finance Code (309679/2021-4); the Coordination for the Improvement of Higher Education Personnel (CAPES) - Brazil with Finance Code 001, (88887.006147/2024-00); the Graduate Program in Materials Science and Engineering (PPGCEM/UFRN); the Brazilian Nanotechonology, São Paulo Research Foundation – FAPESP (Finance Code 2022/10340-2).
Conflicts of Interest
The authors declare no conflicts of interest.
Abbreviations
The following abbreviations are used in this manuscript:
| MAH | microwave-assisted hydrothermal |
| XRD | X-ray diffraction |
| UV-Vis | ultraviolet-visible spectroscopy |
| FESEM | field-emission scanning electron microscopy |
References
- S.P. Keerthana, R. Yuvakkumar, G. Ravi, A. Arun, S. Arunmetha, A novel photocatalyst: Gd2MoO6 nanoparticles with carbon composites for wastewater treatment, Ceramics International, 50 (2024) 40932-40942. [CrossRef]
- P.P. Neethu, B. Kunjumon, P. Aswin, N.J. Venkatesha, A. Sakthivel, Hexanol conversion over mixed metal oxides derived from hydrotalcite: Influence of molybdate species on catalytic activity, Molecular Catalysis, 558 (2024) 114000. [CrossRef]
- D. Komatireddy, S. Andem, P.P. Gotipamul, V.V. Rajankumar, S. Chidambaram, Harnessing the potential of transition metal tungstates (MWO4, M = Ni, Co, Cu, and Zn) for high-performance asymmetric supercapacitors, Journal of Energy Storage, 100 (2024) 113557. [CrossRef]
- R.S. Mostafa, A.M. Elseman, A.G. Al-Gamal, M.M.H. Khalil, M.M. Rashad, Metal tungstate as an electron transport layer: Diverse preparation methods and photovoltaic applications, Solar Energy, 283 (2024) 113007. [CrossRef]
- Z. Lahootifar, A. Habibi-Yangjeh, A. Khataee, One-pot decoration of CdS and CdMoO4 nanoparticles on g-C3N4 nanoplates: Boosted photocatalytic degradation of tetracycline, Journal of Alloys and Compounds, 969 (2023) 172481. [CrossRef]
- M. Chu, H. Ma, Z. Liu, X. Jiang, N. Kang, X. Liu, G. Xie, Template-synthesized CdWO4/Cd0.5Zn0.5S hollow microsphere photocatalyst for high-efficient hydrogen evolution under visible light, International Journal of Hydrogen Energy, 90 (2024) 874-884. [CrossRef]
- N.F.A. Neto, O.B.M. Ramalho, J.M.P. Silva, M.D. Teodoro, M.R.D. Bomio, F.V. Motta, Influence of Solvent on the Synthesis of CdW(1−x)Mo(x)O4 by a Microwave-Assisted Hydrothermal/Solvothermal Method and Its Photocatalytic Properties, Journal of Electronic Materials, 54 (2025) 2870-2884. [CrossRef]
- S. Yuan, J. Wang, C. Zhao, L. Yue, X. Ren, Z. Zeng, X. Hu, Y. Wu, Y. He, S-scheme Bi2O3/CdMoO4 hybrid with highly efficient charge separation for photocatalytic N2 fixation and tetracycline Degradation: Fabrication, catalytic Optimization, physicochemical studies, Separation and Purification Technology, 325 (2023) 124665. [CrossRef]
- Y. Wang, J. Wang, L. Geng, H. Wang, J. Cao, S. Chen, Successful synthesis of single scheelite-structured CdW1-xMoxO4 continuous solid-solution and its composition-dependent optoelectronic properties, Journal of Solid State Chemistry, 266 (2018) 74-82. [CrossRef]
- I. Ahmad, Y. Zhang, S.A. AlFaify, G. Li, I.M. Ashraf, Recent advances in Cd-based heterojunctions: From synthesis strategies to photocatalytic performance, Journal of Alloys and Compounds, 1010 (2025) 178309. [CrossRef]
- Z. Chen, T. Ma, Z. Li, W. Zhu, L. Li, Enhanced photocatalytic performance of S-scheme CdMoO4/CdO nanosphere photocatalyst, Journal of Materials Science & Technology, 179 (2024) 198-207. [CrossRef]
- M. Eghbali-Arani, S. Pourmasoud, F. Ahmadi, M. Rahimi-Nasrabadi, V. Ameri, A. Sobhani-Nasab, Optimization and detailed stability study on coupling of CdMoO4 into BaWO4 for enhanced photodegradation and removal of organic contaminant, Arabian Journal of Chemistry, 13 (2020) 2425-2438. [CrossRef]
- J. He, L. Zhang, N. Li, X. Li, W. Ran, W. Li, T. Yan, Regulation of the carrier migration path from type II to S-scheme over CdS-loaded CdWO4 polymorphs to boost photocatalytic H2 evolution, Journal of Catalysis, 430 (2024) 115318. [CrossRef]
- M. Li, B. Chen, C. Zhang, X. Wang, F. Wu, R. Zhao, Crystallization and up-/down-conversion luminescence of size-dependent CdWO4:Yb3+,RE3+ (RE=Ho and Er), Optical Materials, 142 (2023) 113995. [CrossRef]
- A. Vasanth Rao, K. Narsimha, G. Swarupa, N. Anuradha, B. Kranthi Kumar, D. Ravinder Reddy, G. Upender, B. Vijaya Kumar, Sn doped CdWO4 nanorods for augmented photodegradation of methyl orange, Materials Letters, 353 (2023) 135304. [CrossRef]
- L. Tolvaj, K. Mitsui, D. Varga, Validity limits of Kubelka–Munk theory for DRIFT spectra of photodegraded solid wood, Wood Science and Technology, 45 (2011) 135-146. [CrossRef]
- D.L. Wood, J. Tauc, Weak Absorption Tails in Amorphous Semiconductors, Physical Review B, 5 (1972) 3144-3151. [CrossRef]
- H. Harshan, K.P. Priyanka, A. Sreedevi, A. Jose, T. Varghese, Structural, optical and magnetic properties of nanophase NiWO4 for potential applications, The European Physical Journal B, 91 (2018) 287. [CrossRef]
- R. Shanmugam, K. Alagumalai, S.-M. Chen, T. Ganesan, Electrochemical evaluation of organic pollutant estradiol in industrial effluents, Journal of Environmental Chemical Engineering, 9 (2021) 105723. [CrossRef]
- P. Madhusudan, J. Zhang, J. Yu, B. Cheng, D. Xu, J. Zhang, One-pot template-free synthesis of porous CdMoO4 microspheres and their enhanced photocatalytic activity, Applied Surface Science, 387 (2016) 202-213. [CrossRef]
- G. Li, C. Yang, Q. He, J. Liu, Ag-based photocatalytic heterostructures: Construction and photocatalytic energy conversion application, Journal of Environmental Chemical Engineering, 10 (2022) 107374. [CrossRef]
- L. Ai, X. Zhang, C. Tan, M. Zha, Y. Li, N. Guo, D. Jia, L. Wang, Engineering CQDs/Bi2WO6 heterostructure for efficient photocatalytic CO2 reduction and degradation dye via S-scheme charge transfer, Journal of Molecular Liquids, 425 (2025) 127233. [CrossRef]
- Y. Wang, J. Li, X. Chen, W. Zhu, X. Guo, F. Zhao, Automated kinetics measurement for homogeneous photocatalytic reactions in continuous microflow, Artificial Intelligence Chemistry, 2 (2024) 100066. [CrossRef]
- N.F.A. Neto, B.P. Dias, R.L. Tranquilin, E. Longo, M. Li, M.R.D. Bomio, F.V. Motta, Synthesis and characterization of Ag+ and Zn2+ co-doped CaWO4 nanoparticles by a fast and facile sonochemical method, Journal of Alloys and Compounds, 823 (2020) 153617. [CrossRef]
- L. Zhang, X. Zhang, G. Lu, Band alignment in two-dimensional halide perovskite heterostructures: Type I or type II?, The journal of physical chemistry letters, 11 (2020) 2910-2916. [CrossRef]
Figure 1.
(a) XRD patterns for the synthesized samples and (b) highlited XRD patterns.
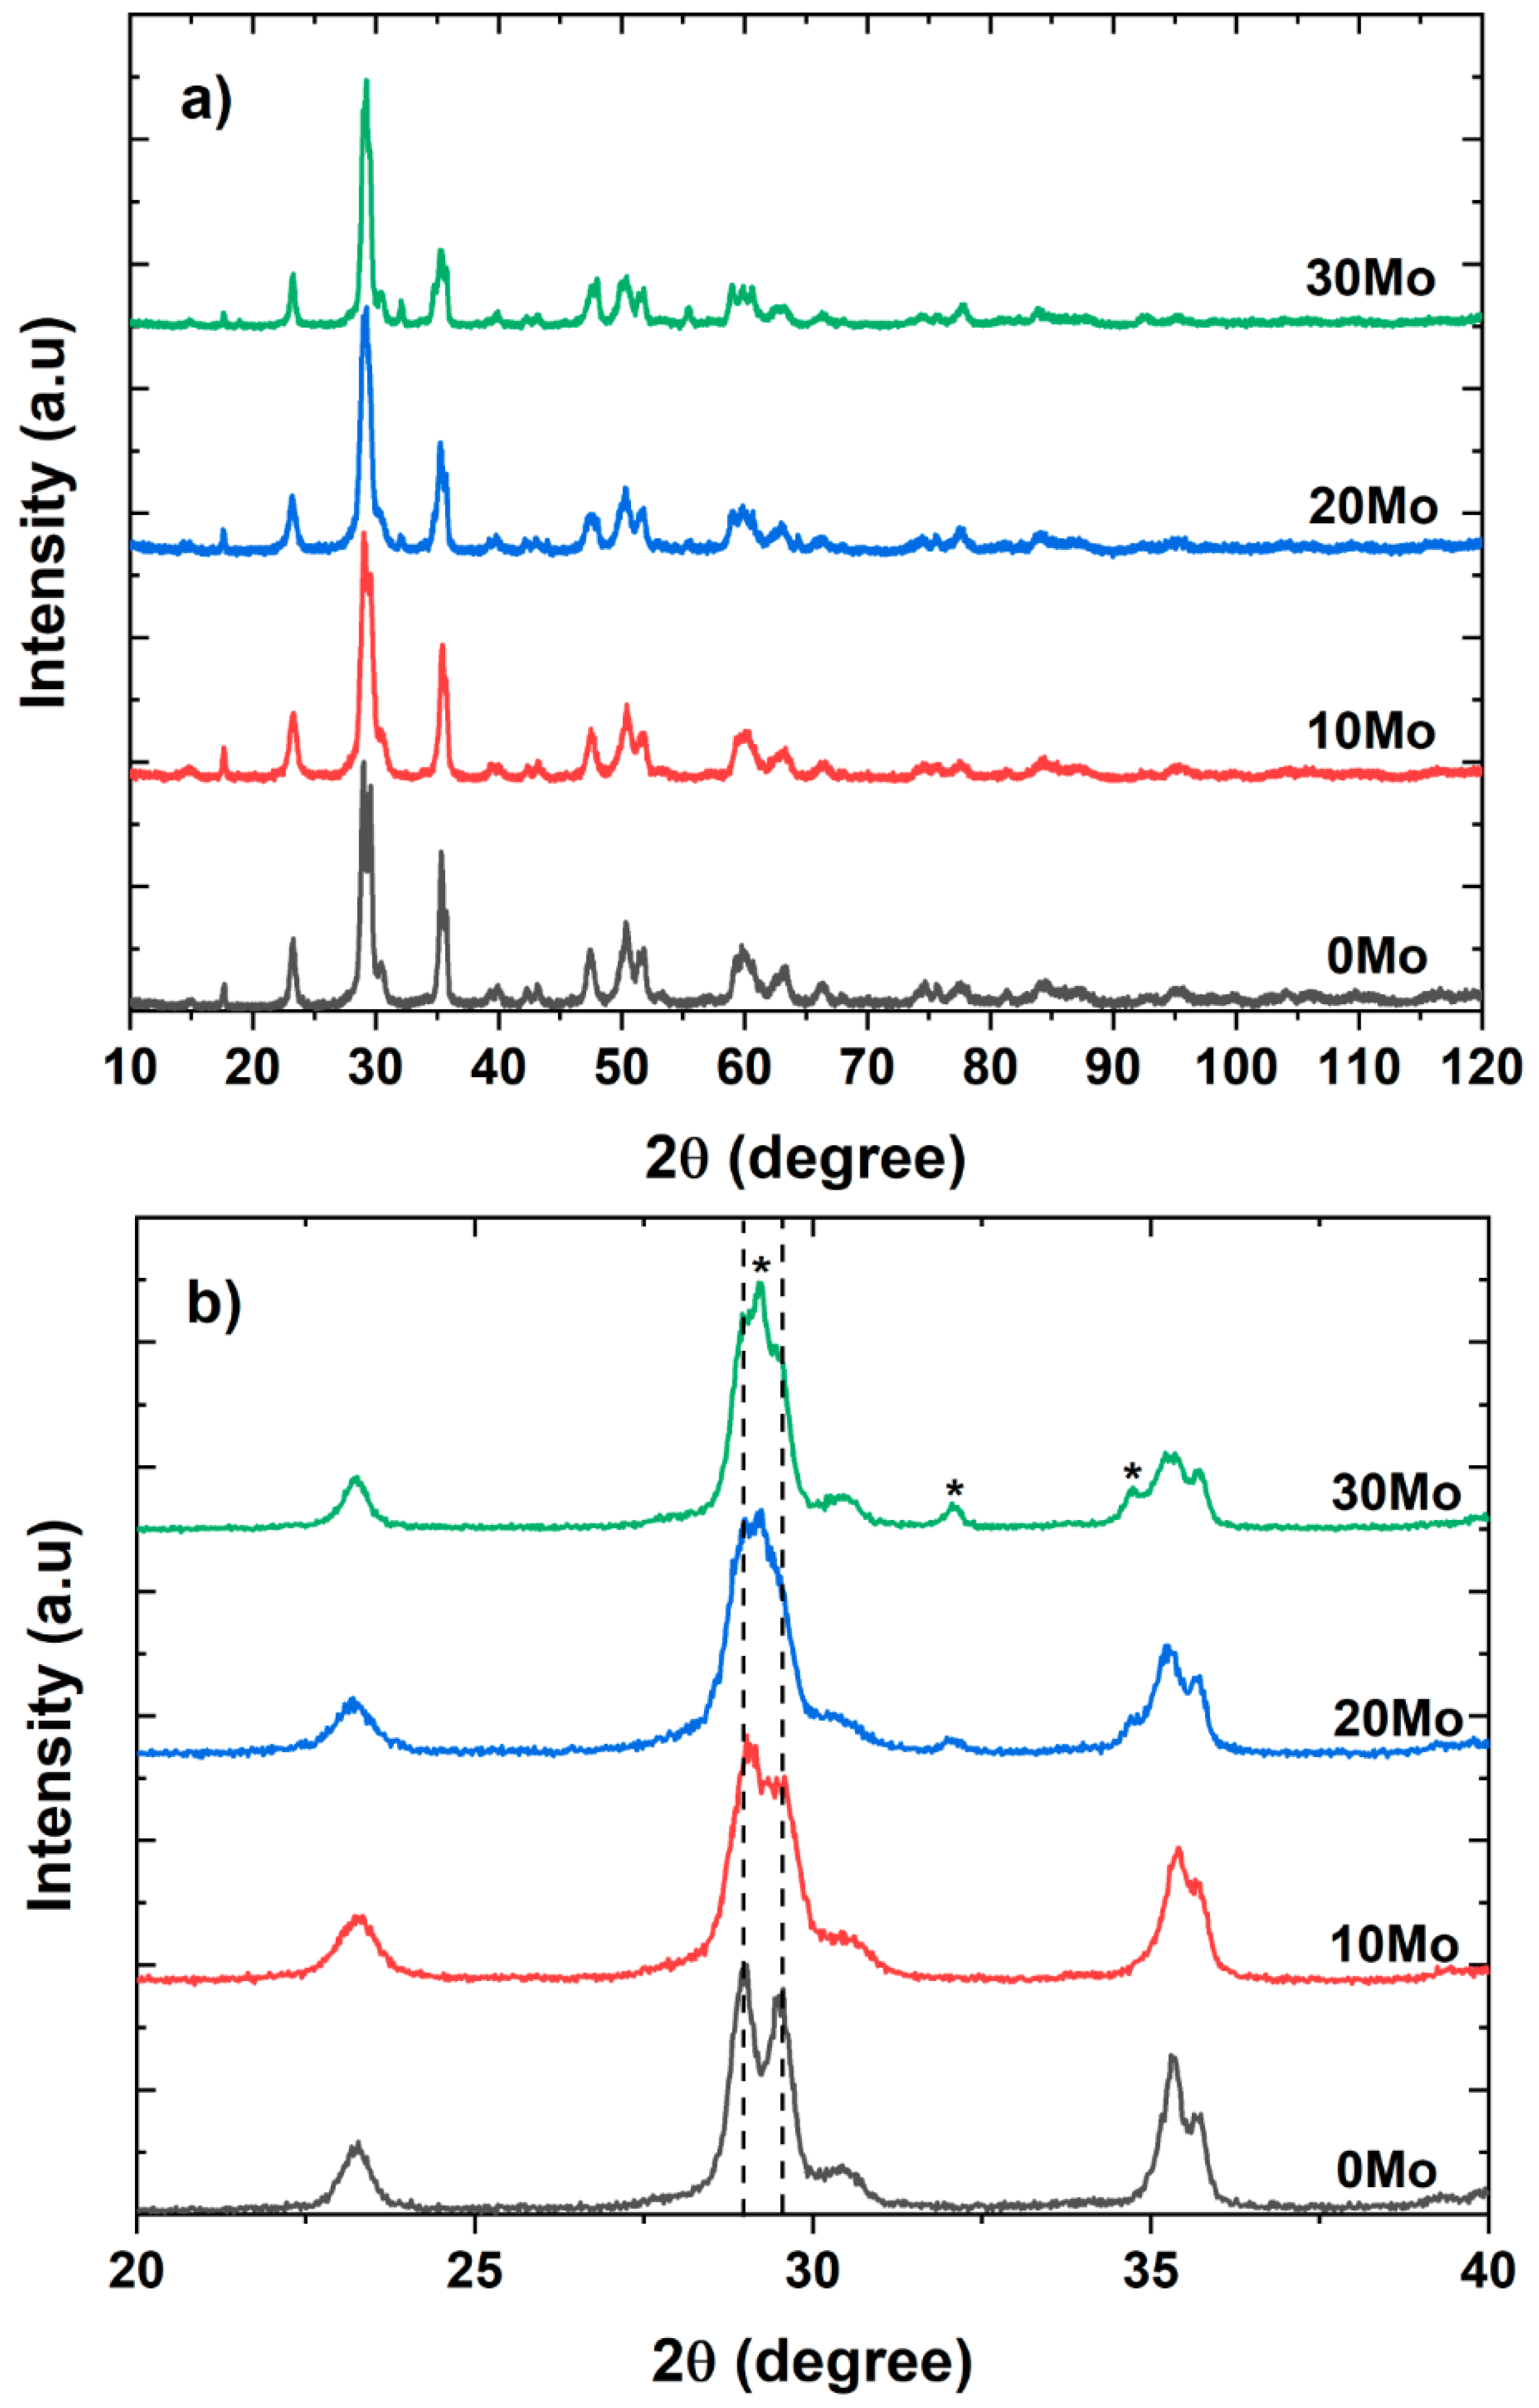
Figure 2.
Raman spectra for the samples obtained by a microwave-assisted hydrothermal method.
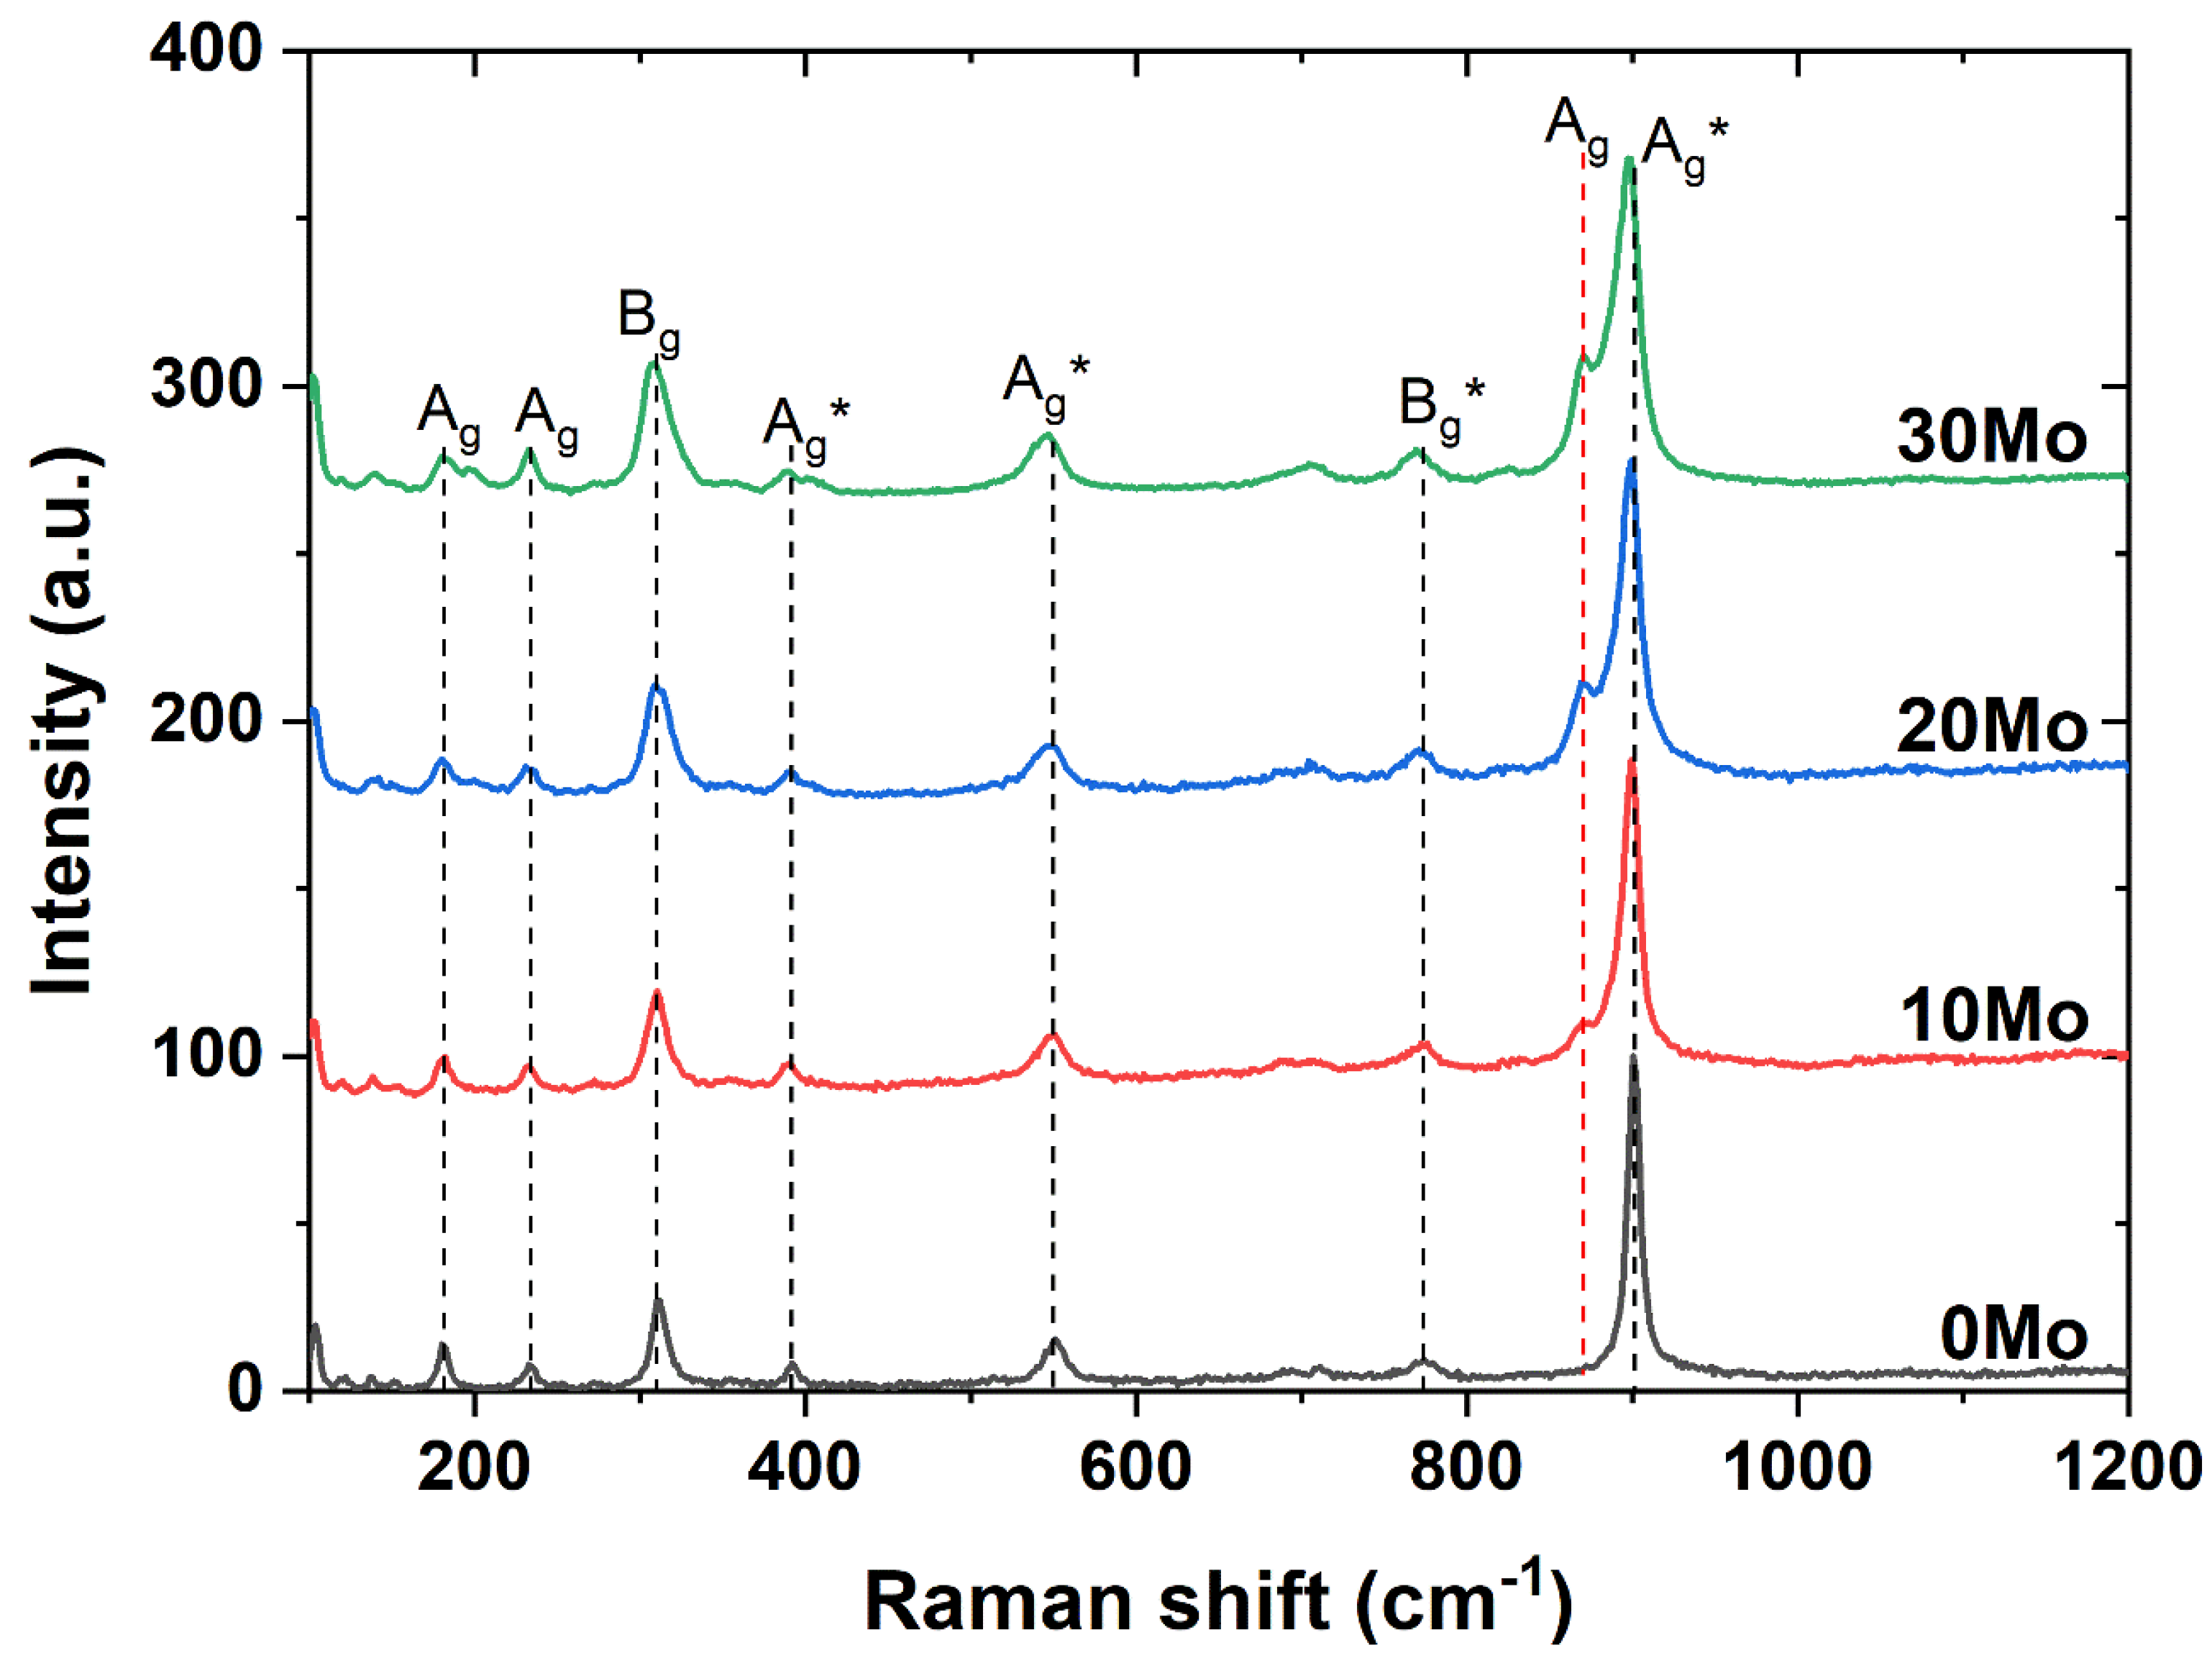
Figure 3.
(a) Absorbance curves for all samples and Extrapolation of linear section for the (b) 0Mo, (c) 10Mo, (d) 20Mo and (e) 30Mo samples.
Figure 3.
(a) Absorbance curves for all samples and Extrapolation of linear section for the (b) 0Mo, (c) 10Mo, (d) 20Mo and (e) 30Mo samples.
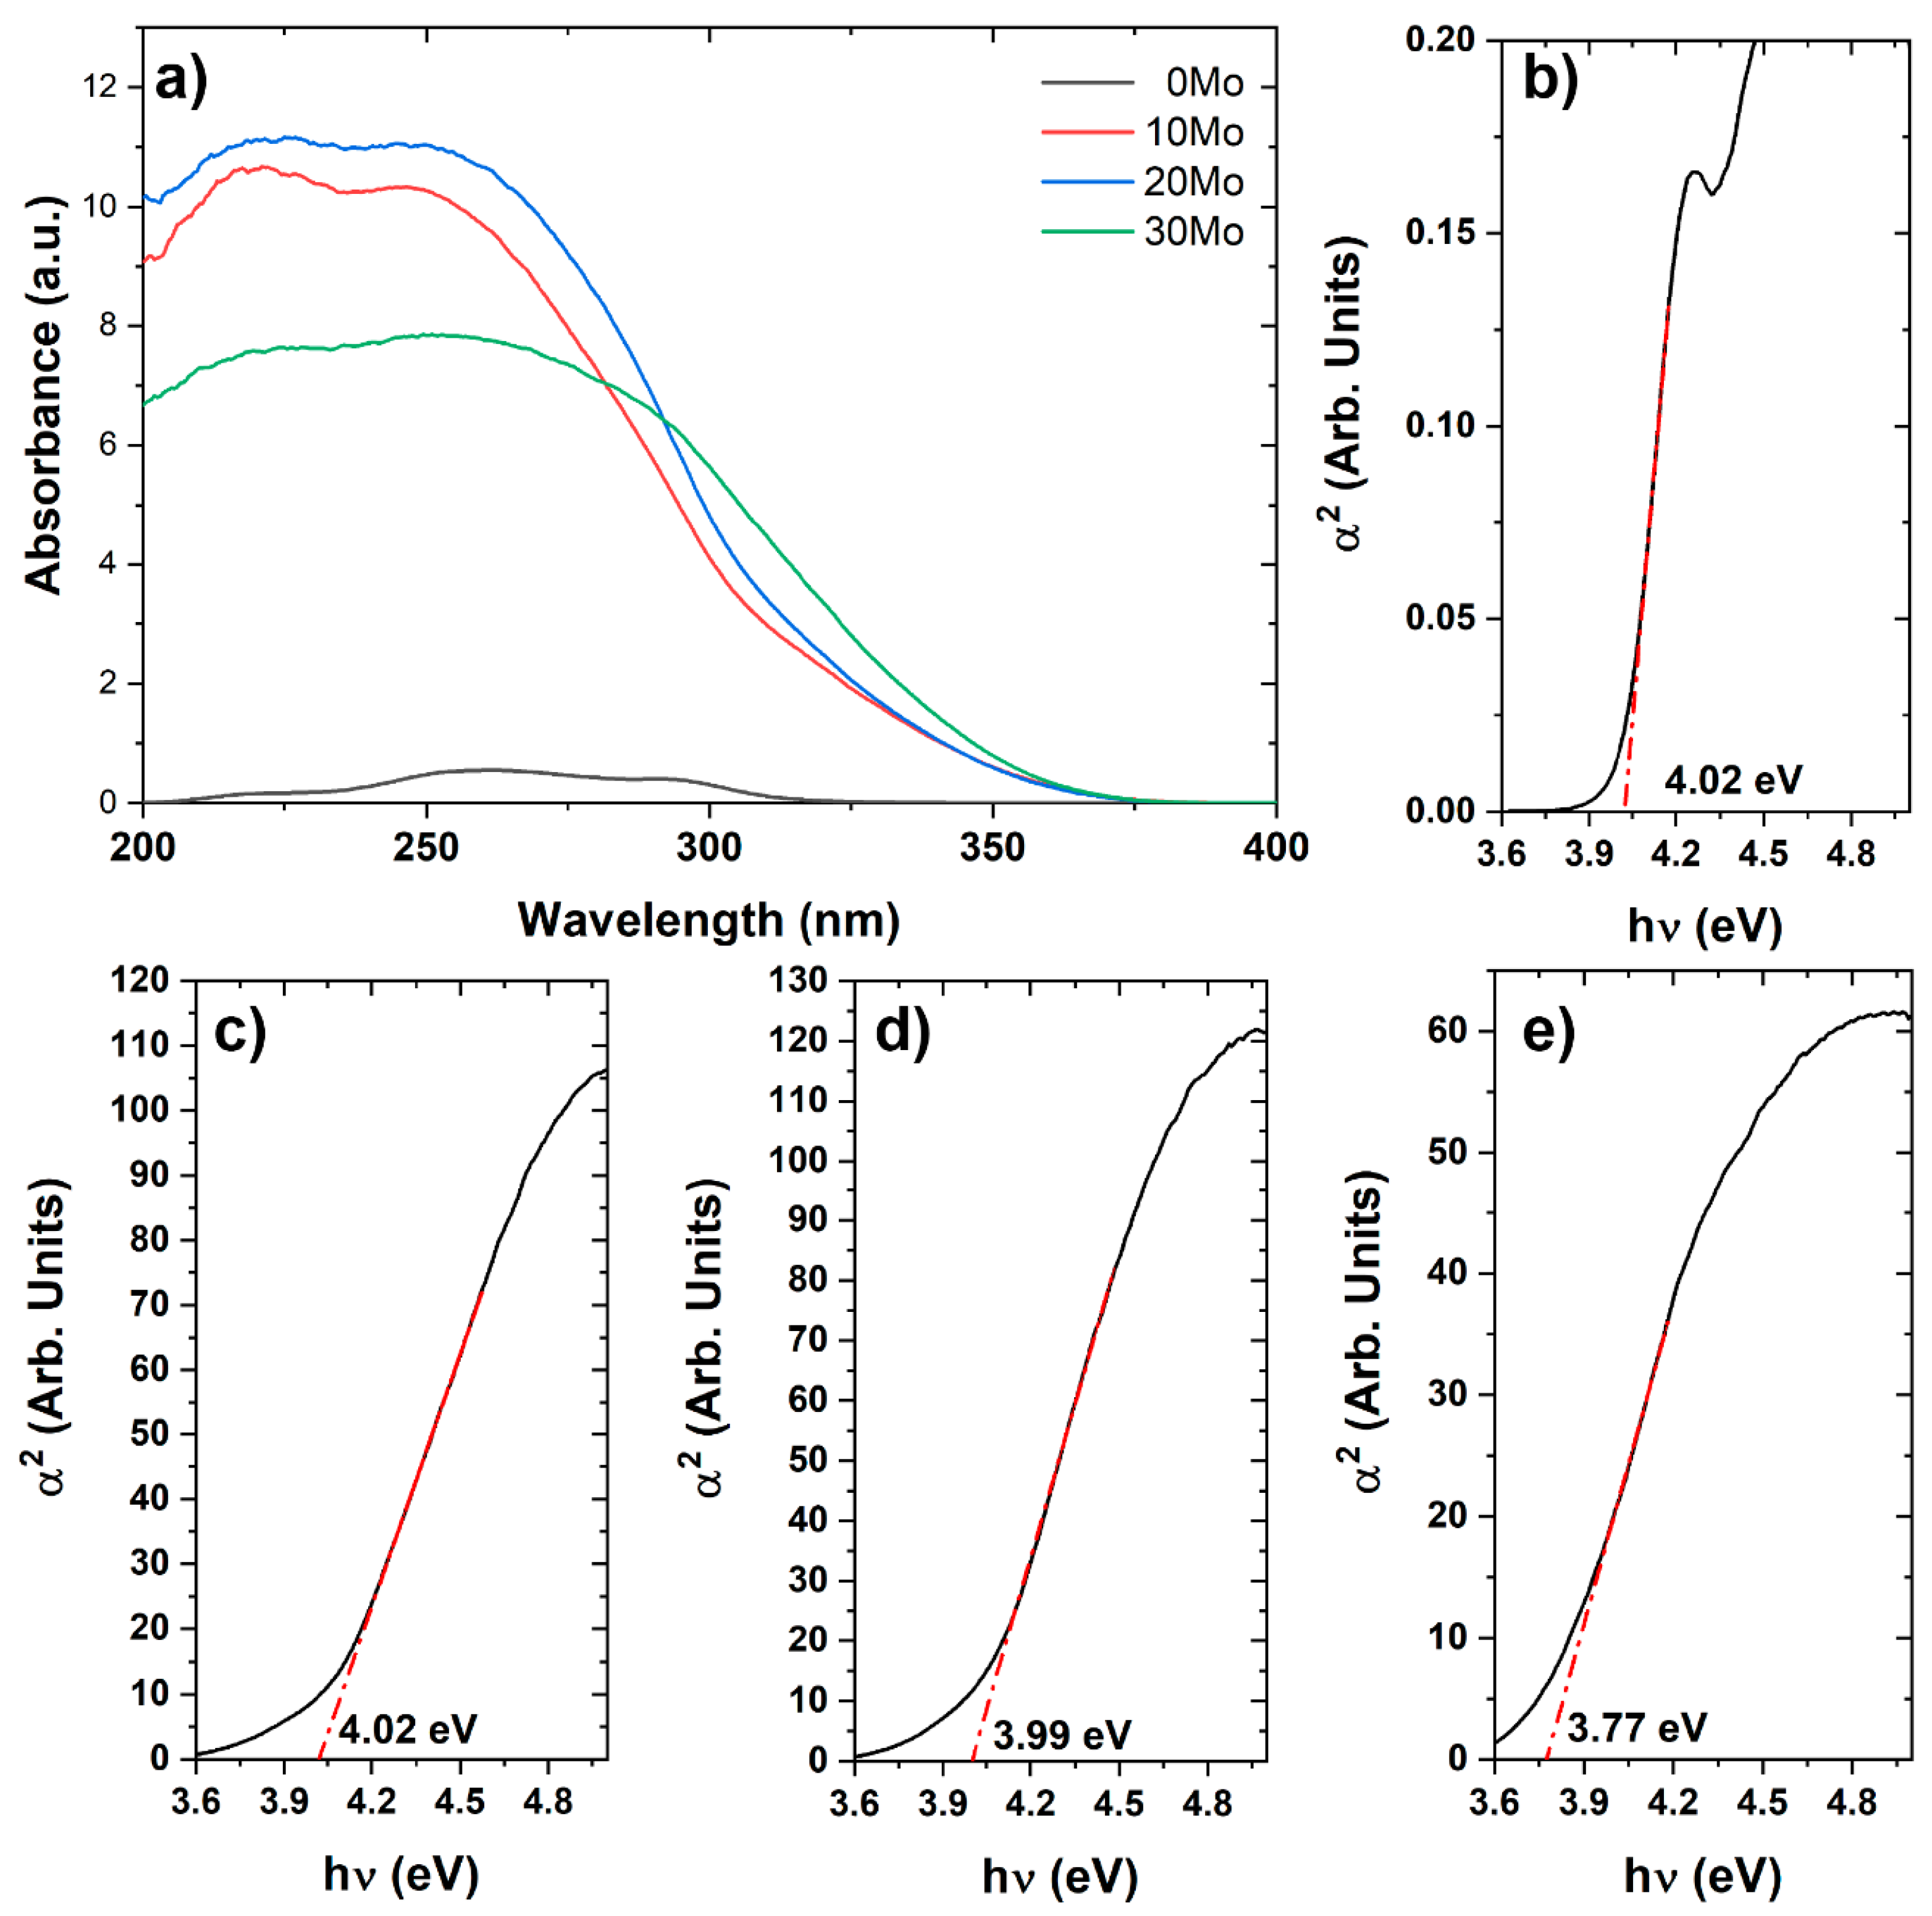
Figure 4.
SEM microfraphs for the (a) 0Mo, (b) 10Mo, (c) 20Mo and (d) 30Mo samples.
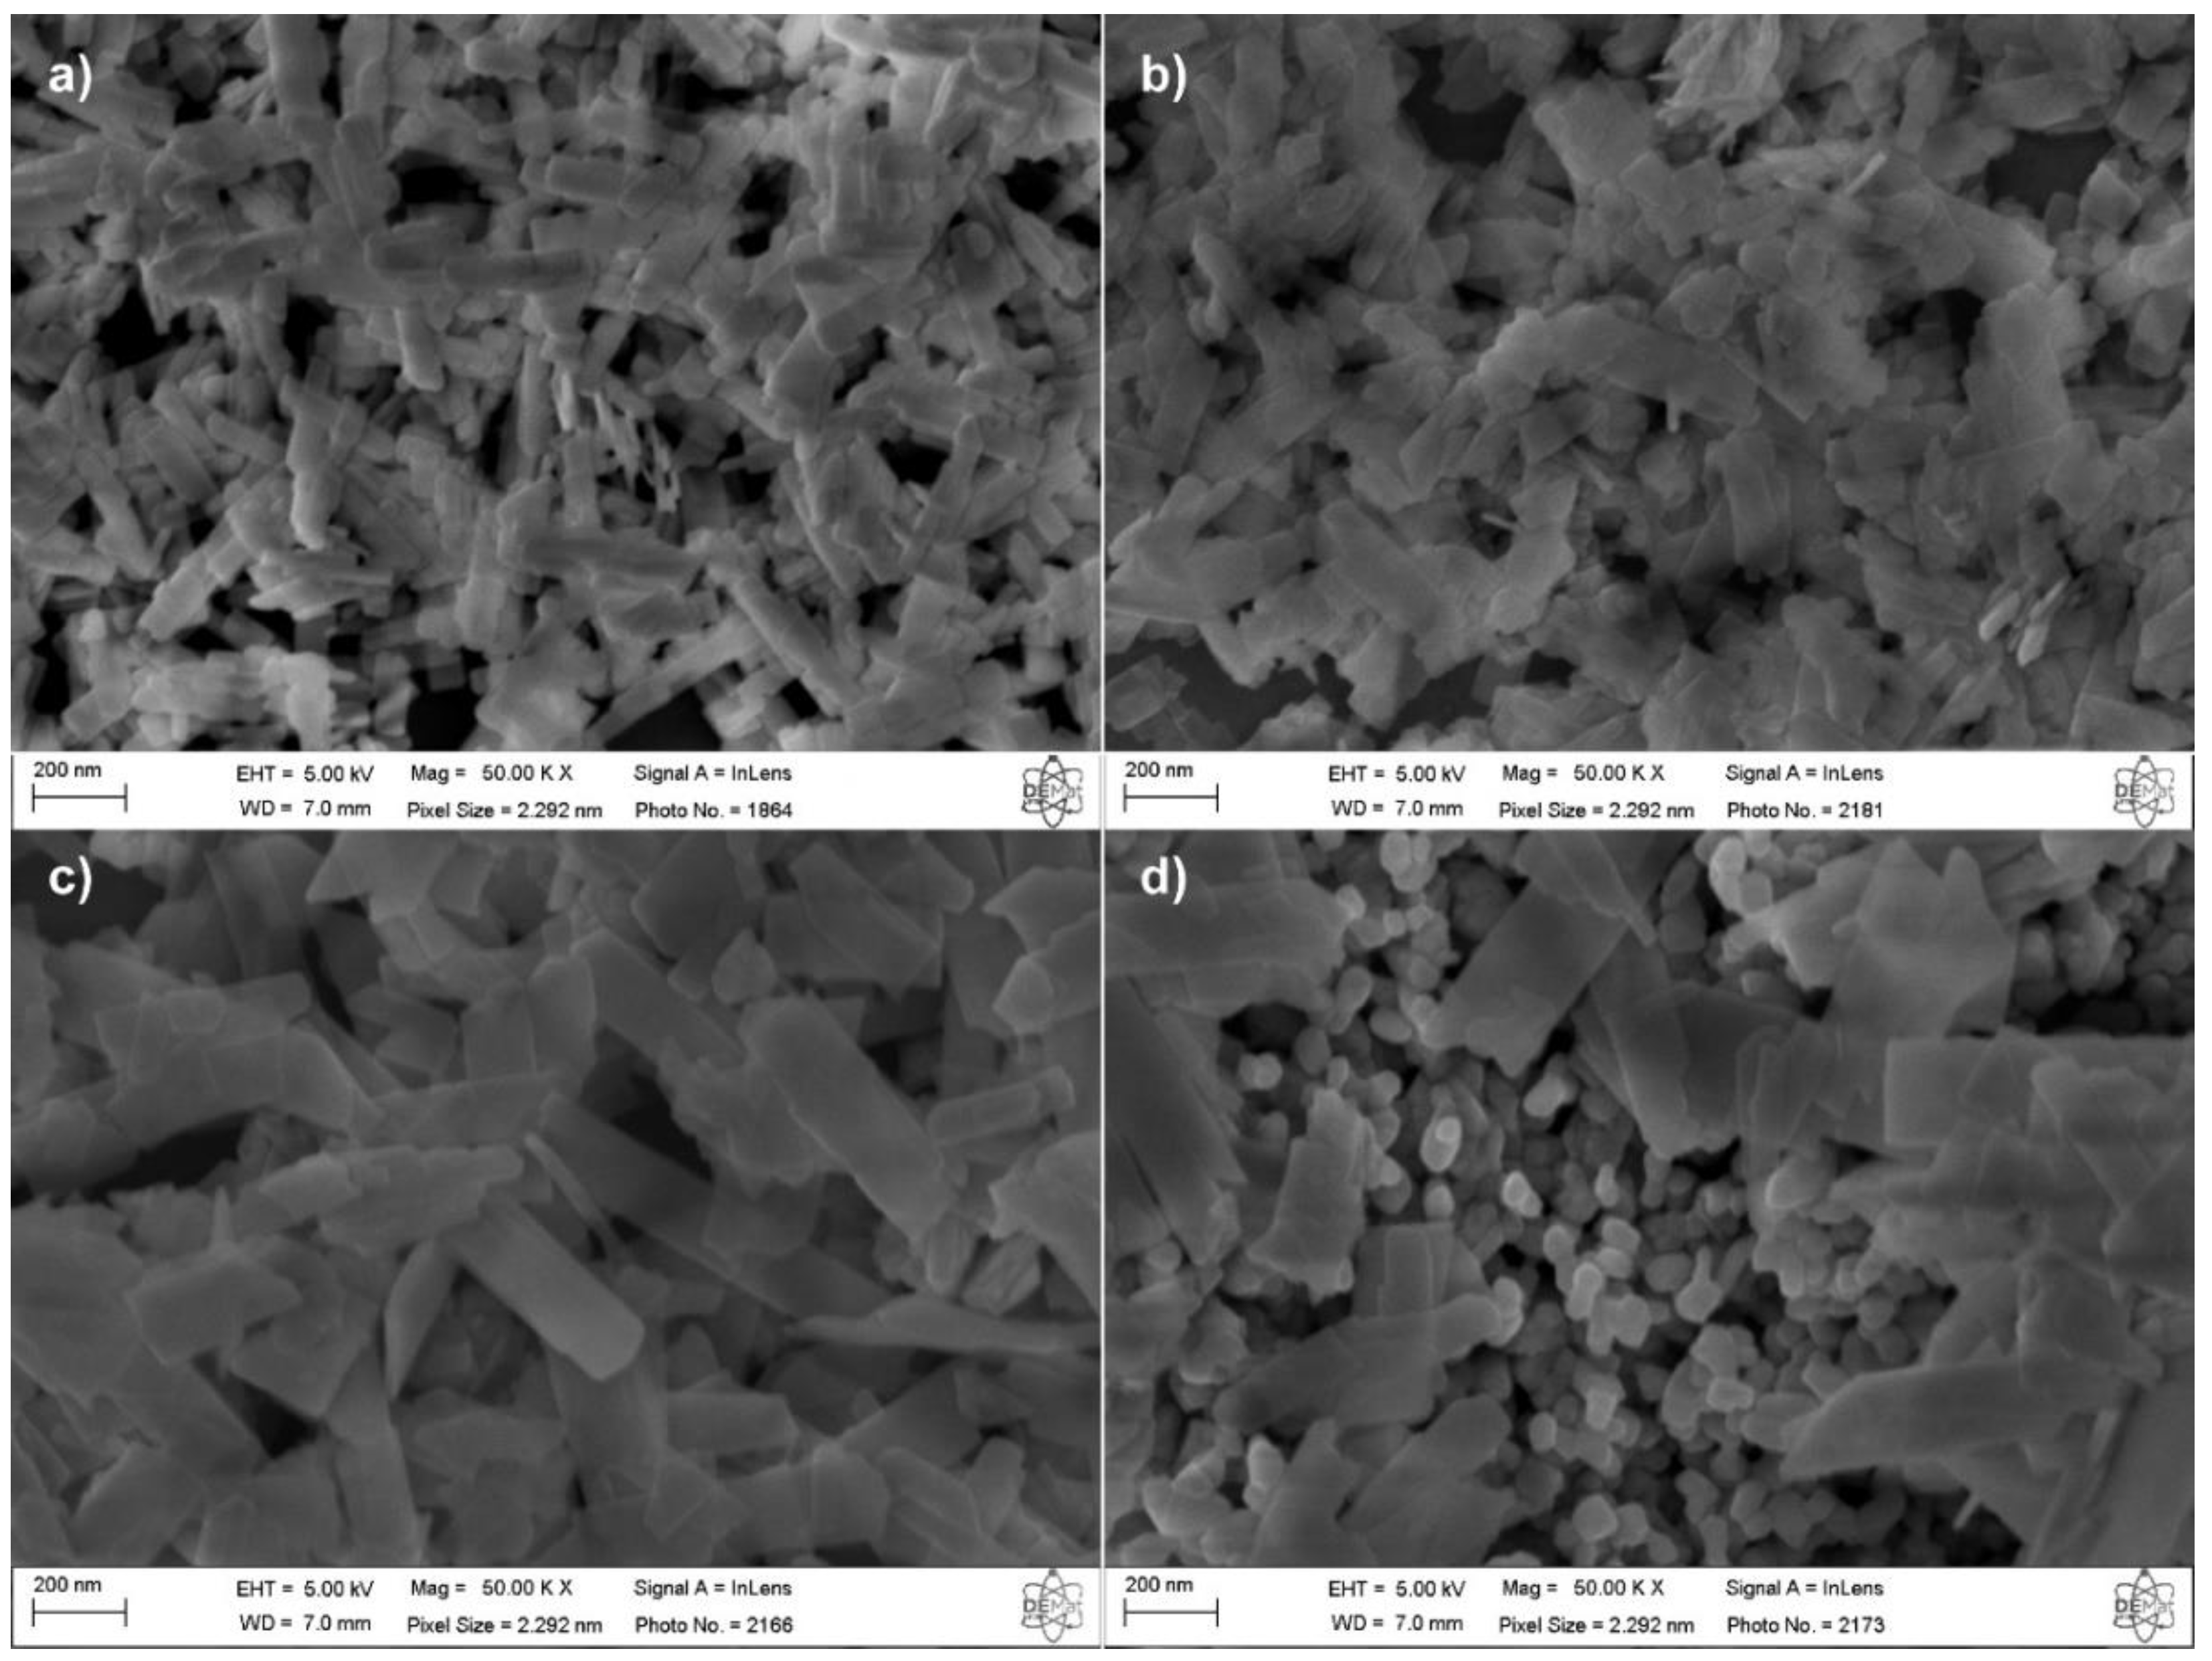
Figure 5.
CdWO4 Particle distribution histogram for the (a) 0Mo, (b) 10Mo, (c) 20Mo and (d) 30Mo samples.
Figure 5.
CdWO4 Particle distribution histogram for the (a) 0Mo, (b) 10Mo, (c) 20Mo and (d) 30Mo samples.
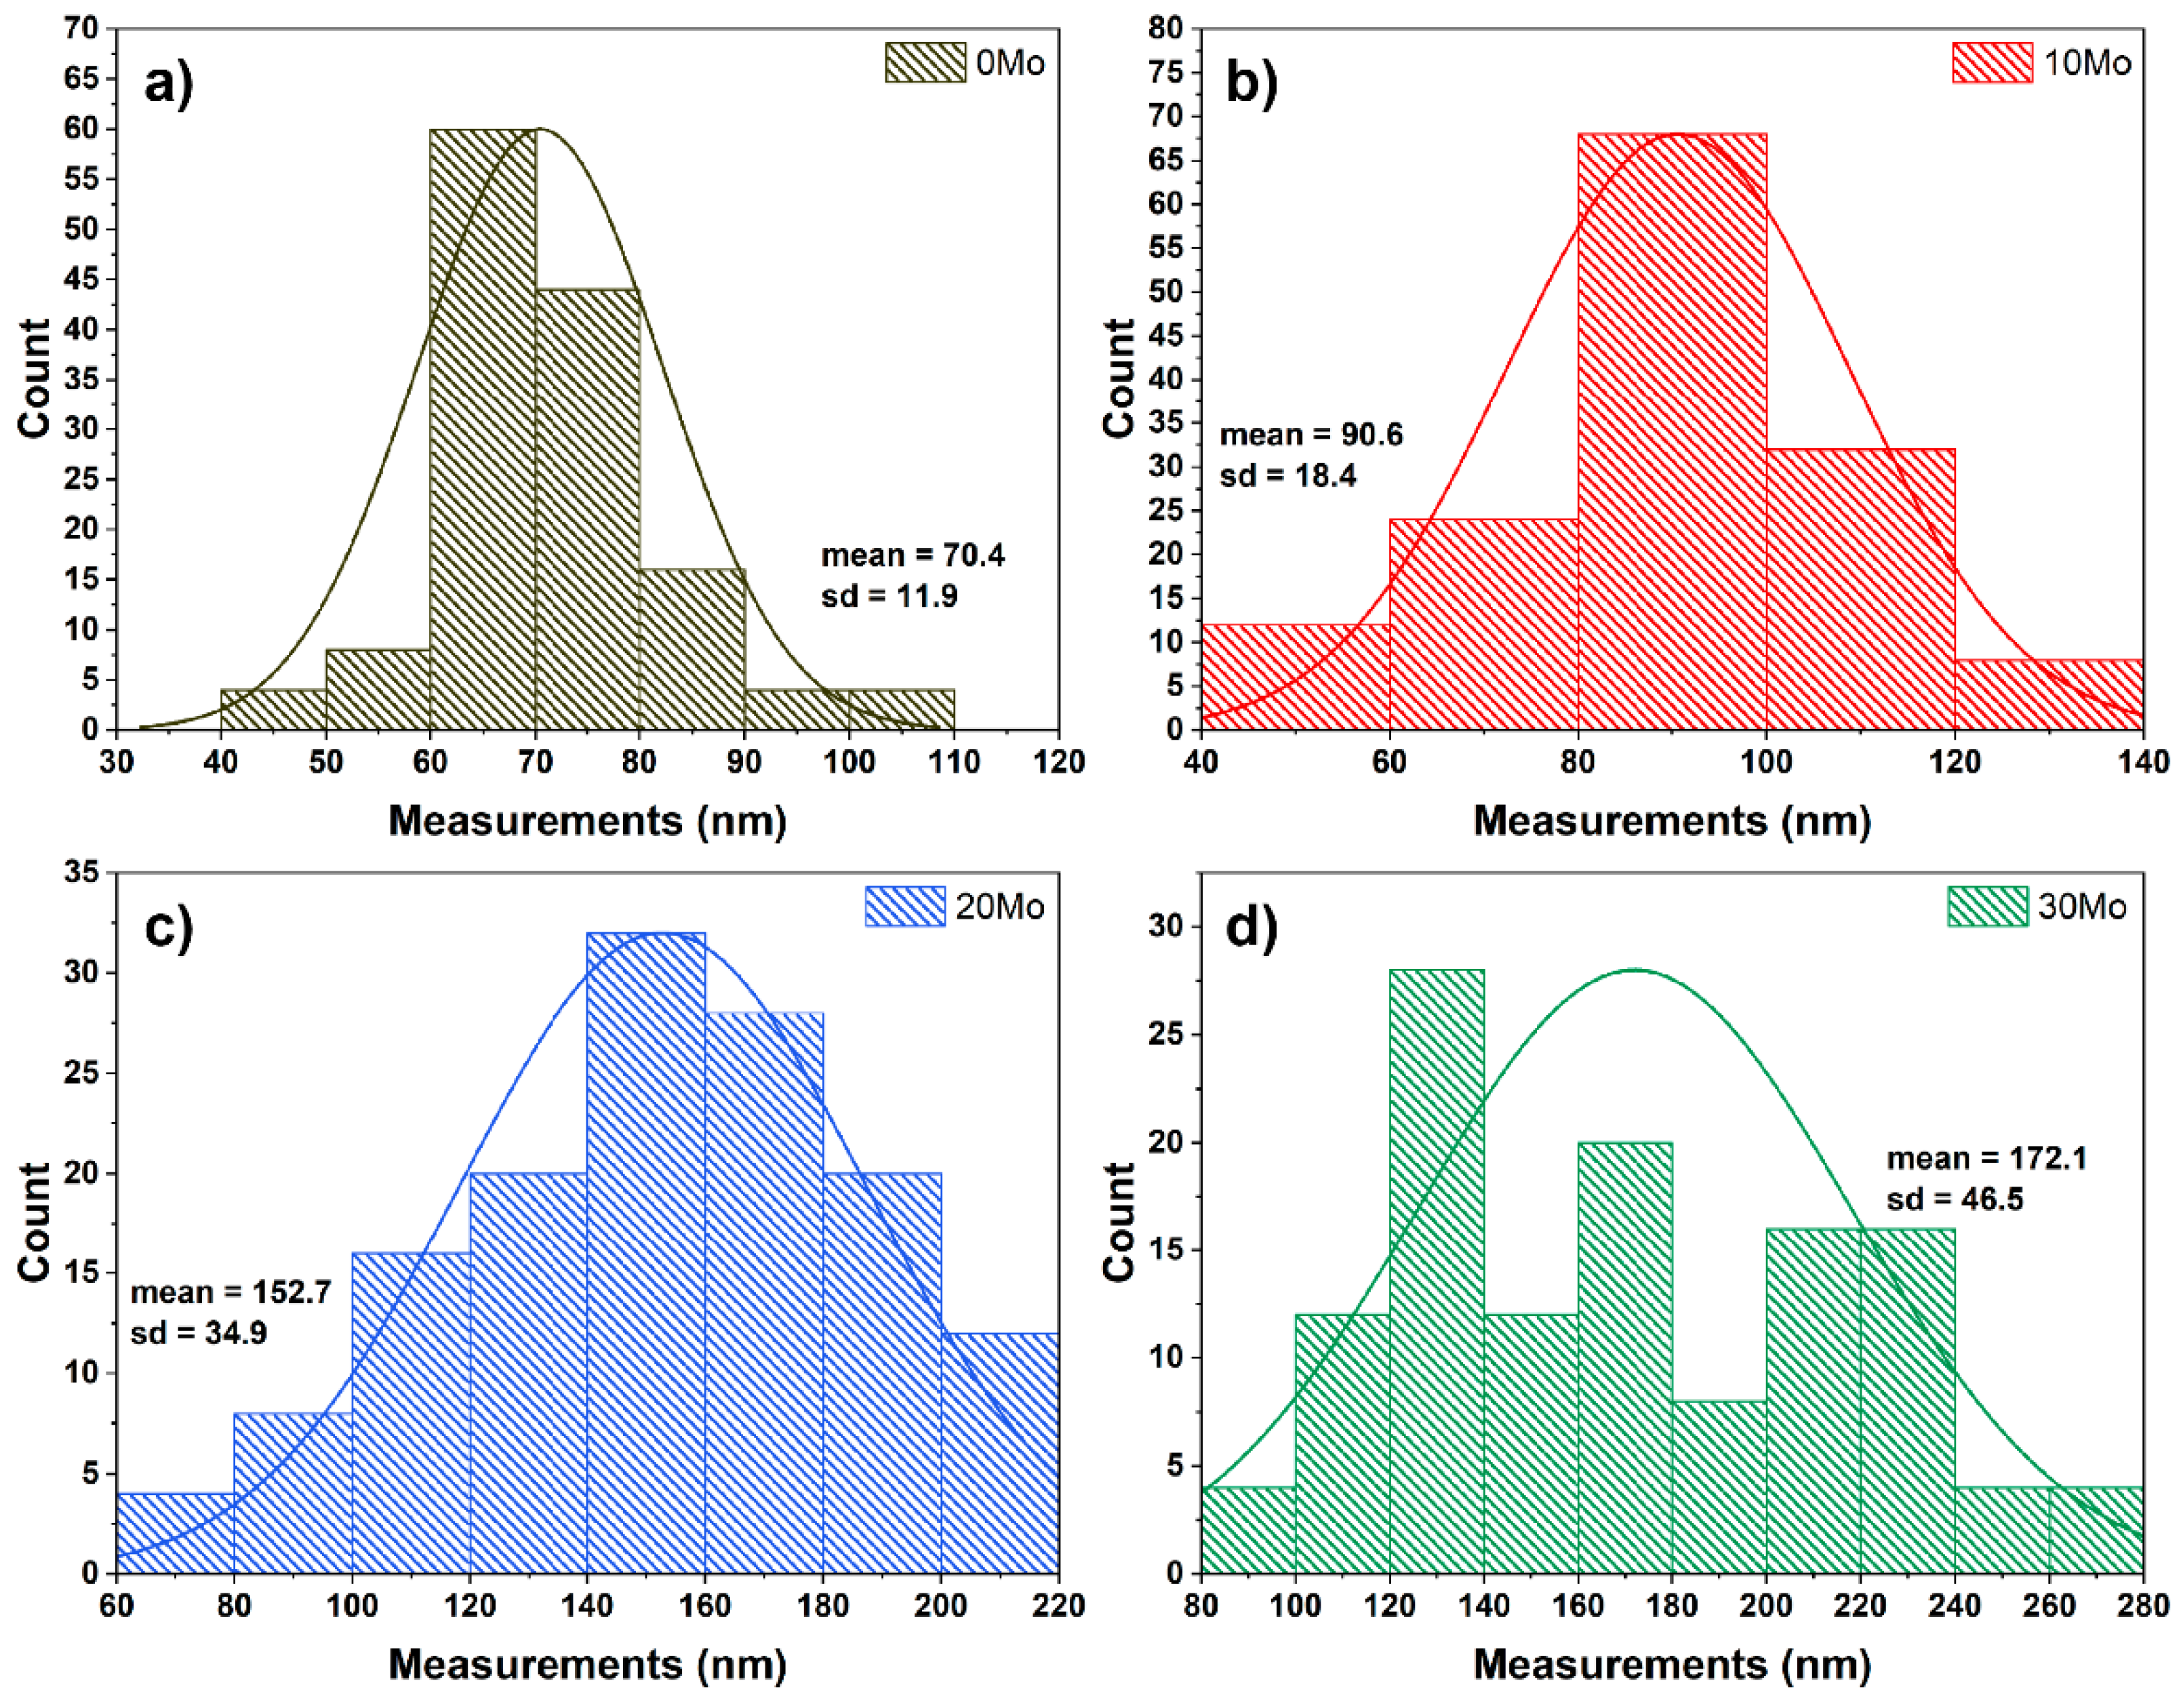
Figure 6.
(a) Absorbance curves for 20Mo samples and (b) C/Co curves for all samples.
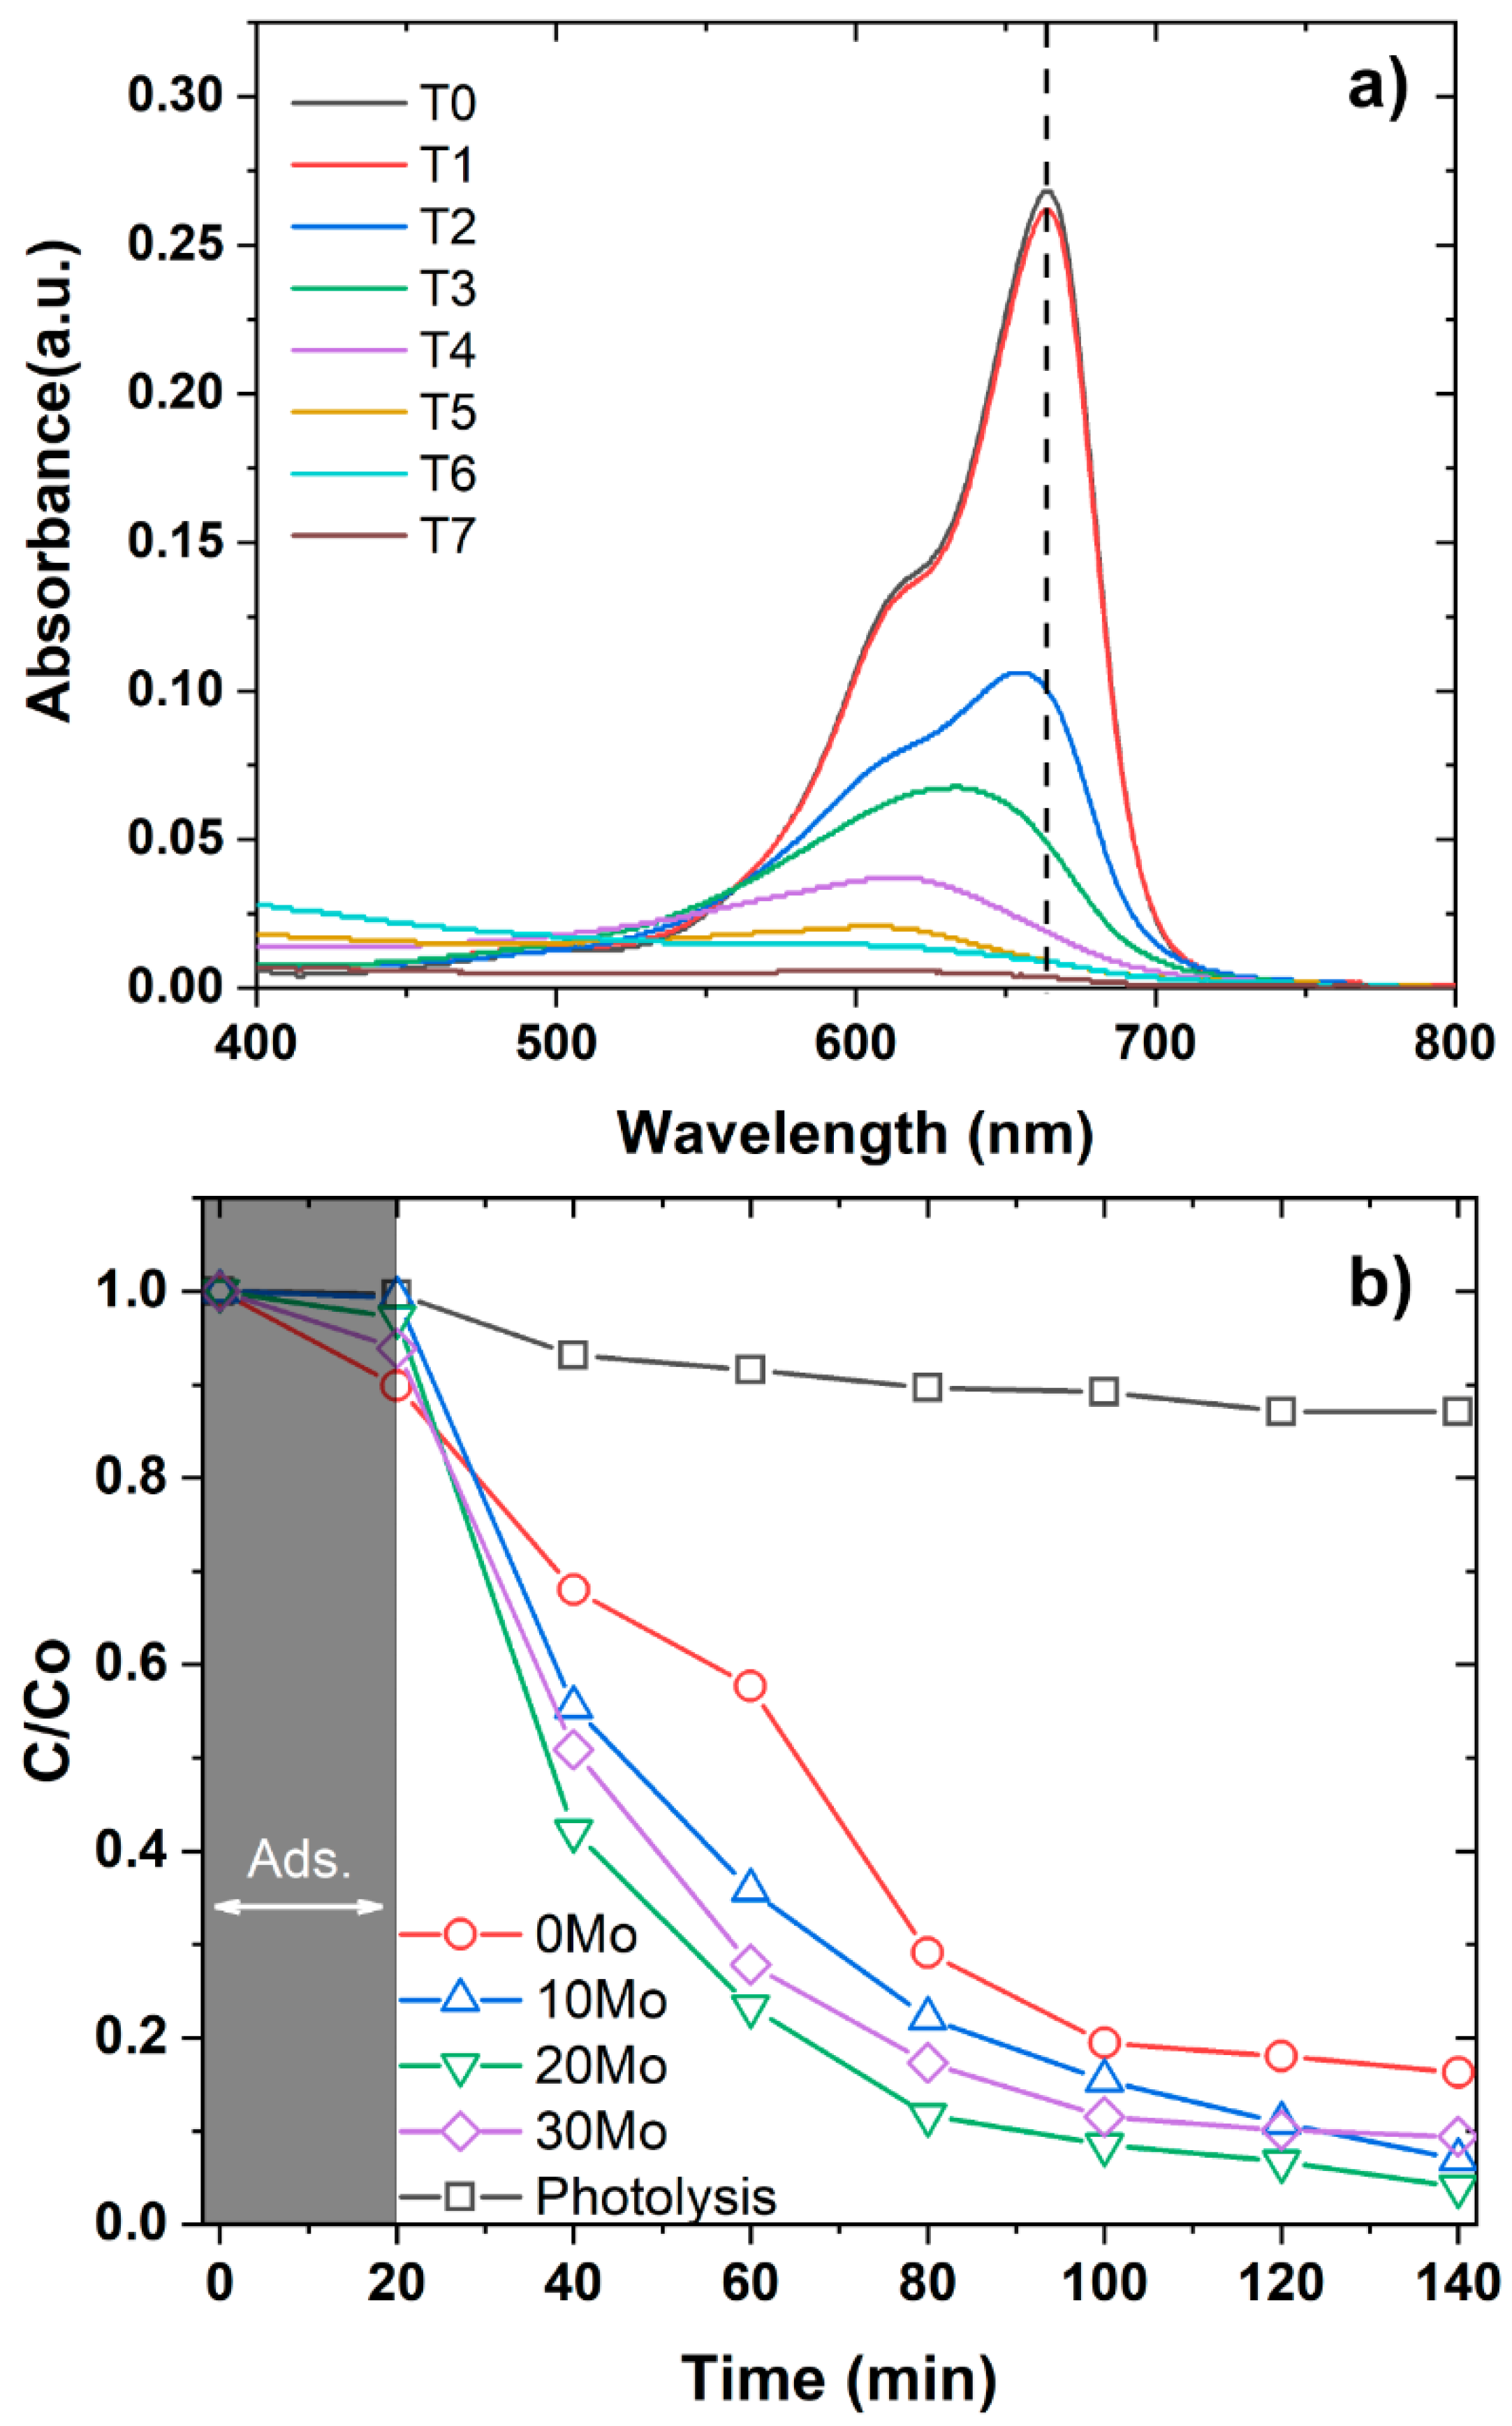
Figure 7.
Photoluminescence curves for CdWO4 and the CdWO4/CdMoO4 heterostructures.
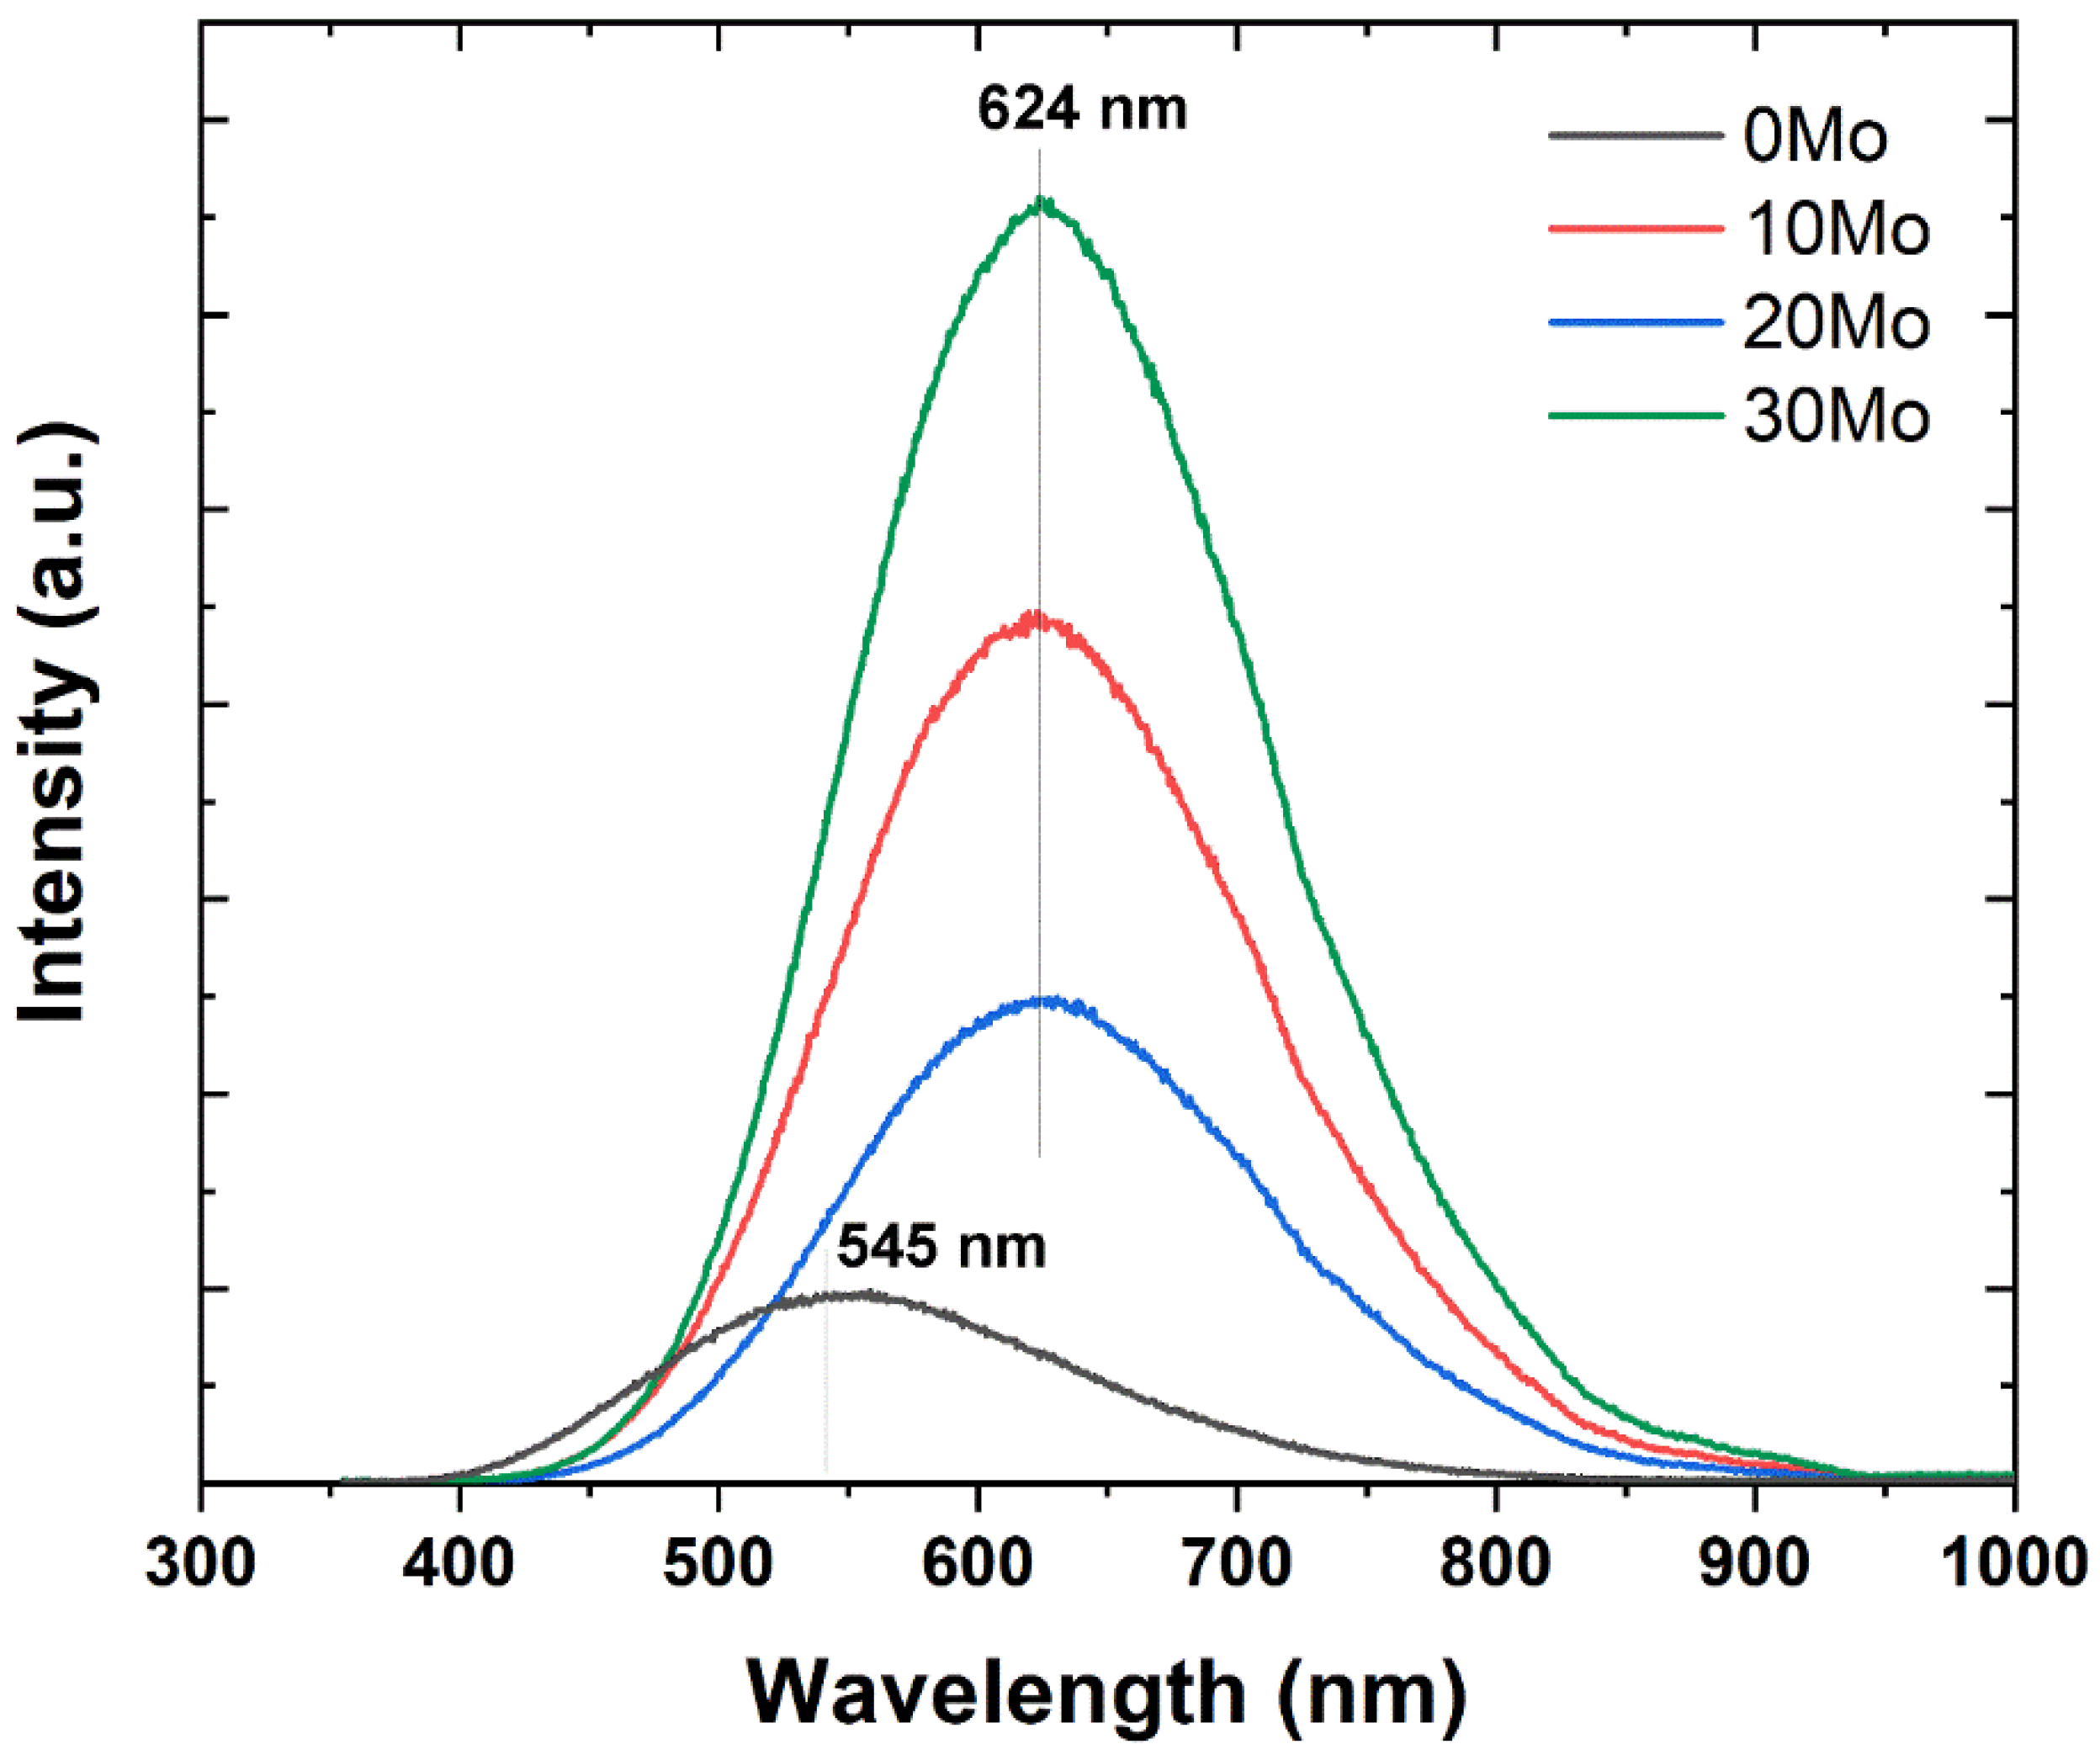

Table 1.
First-order photocatalytic kinetic constants.
| Sample | Kinetic Constant (k) x10-2 | R2 |
|---|---|---|
| Photolysis | 0.11 | 0.855 |
| 0Mo | 1.19 | 0.941 |
| 10Mo | 1.73 | 0.994 |
| 20Mo | 2.06 | 0.996 |
| 30Mo | 1.53 | 0.929 |
Disclaimer/Publisher’s Note: The statements, opinions and data contained in all publications are solely those of the individual author(s) and contributor(s) and not of MDPI and/or the editor(s). MDPI and/or the editor(s) disclaim responsibility for any injury to people or property resulting from any ideas, methods, instructions or products referred to in the content. |
© 2025 by the authors. Licensee MDPI, Basel, Switzerland. This article is an open access article distributed under the terms and conditions of the Creative Commons Attribution (CC BY) license (http://creativecommons.org/licenses/by/4.0/).
Copyright: This open access article is published under a Creative Commons CC BY 4.0 license, which permit the free download, distribution, and reuse, provided that the author and preprint are cited in any reuse.


