
Submitted:
27 March 2025
Posted:
28 March 2025
You are already at the latest version
Abstract
Dipalmitoylphosphatidylcholine (DPPC), is one of the key bilayer membranes of the phosphatidylcholine (PC) family which constitutes 40-50% of total cellular phospholipids in mammal cells. In this study, we investigate the behaviour of DPPC subjected to lateral pressures ranging from -200 to 150 bar at 323 K using microseconds-long simulations. We identify, with very high precision and through the employment of diverse metrics, the pressure range for the occurrence of critical phenomena, mainly buckling and rupture. Notably, under compression, the membrane initially thickens, leading to a structural phase transition from a uniformly thick state to an undulated phase between 40 and 50 bar, as gauged by sharp changes in area per lipid and headgroup dispersion. Stretching induces systematic membrane thinning, with rupture becoming probable at -170 bar and certain at -200 bar. Instant application of high pressure, corresponding to high loading, requires longer equilibration times than gradual pressure increments (low loading) and leads to slightly higher rupture probability during stretching. The reverse compression cycle shows pressure hysteresis with a 10-bar shift, while the reverse stretching cycle retraces the pathway. System size has a minimal impact on the trends. Under extreme mechanical stress, particularly near critical phenomena, systems may require up simulation times on the order of microsecond to accurately capture phase behaviour and structural alterations. This work could provide important insights to understand membrane behaviour under extreme conditions, of relevance to numerous biological and technological applications.
Keywords:
molecular dynamics
; phospholipid bilayer
; biophysics
; pressure
; membrane rupture
; atomistic simulation
; DPPC
; nematic order
; compression
; stretching
; computational biophysics
; membrane dynamics
1. Introduction
Cell membrane, primarily consisting of lipids and proteins, is a vital biological system that maintains the homeostatic environment inside the cell [1]. Lipids induce curvature essential for endo- and exocytosis, while cholesterol maintains membrane elasticity and others directly contribute to signaling, collectively driving biomembrane structure and cellular function [2]. The physical, structural and mechanical properties of membranes like fluidity and thickness, indirectly regulate protein binding, enzymatic activity, gene expression, efficacy of drug delivery, and performance of the ion channels [3,4,5,6,7,8]. Many recent works, involving biological membranes such as electroporation of membrane [9], interaction of amphiphiles with lipid membranes [10], complex dynamics of ions near membrane surface [11], elastic parameters in pure and mixed membranes [12], highlight the role of membranes in biology. In the field of medicine, mechanical perturbation, such as magnetic nanoparticles shear stress, near the cell membrane, is shown to induce magnetic fluid hyperthermia which could be an effective cancer treatment [13]. Nanoscale stress and mechanoporation damage in POPC (1-palmitoyl-2-oleoyl-sn-glycero-3-phosphocholidonene) membrane during traumatic brain injury was studied by Murphy et al. [14]. A thorough comprehension of how lipid membrane structure, particularly curvature and curvature stress, influences cellular processes, alongside the disruption of structural integrity caused by rigid inclusions within the membrane, underscores the challenge of regulating these factors, potentially paving the way for biomechanically driven pharmacological therapies [15,16]. In many studies, cell membrane is proven to be the origin of conversion of mechanochemical signal [17,18,19]. Mechanical stresses on biological cell membranes are known to be converted into chemical or electrical signals that regulate various cellular functions like cell growth, signal transduction, and transport [20]. Interfacial electric fields play a key role in regulating membrane protein activity and ion movement across membranes, offering a basis for understanding how electrostatic interactions influence cellular processes [21]. Any mechanical disorder affects the membrane static and dynamic properties like thickness [22,23], structural order [24,25], polarity [26], viscosity [27], and fluidity [28]. Thus, it is essential to study the structural and mechanical changes of a cell membrane as a response to external stimuli such as temperature, pressure, surface tension and nano inclusions, among other factors.
The recent developments in the field of molecular simulation have enabled it to complement theoretical and experimental attempts to tackle various complex scientific challenges [29]. Molecular Dynamics (MD) is one of the most widely used simulation tools to solve many-body physical problems at the atomistic level. In the field of biophysics, MD has been widely used in understanding various physical phenomena such as, structural properties of lipid bilayers [30,31], protein-ligand binding [32,33,34]protein function [35] and design [36,37], binding of proteins to membranes [38,39] and drug membrane interactions [40,41,42].
There have been past experimental and simulation studies which have elucidated the structural, mechanical, and dynamical modifications of different lipid bilayers as a function of temperature and pressure. A recent study investigated the mechanical and dynamic properties of POPC lipid membrane under cylindrical shedding light on the nature of membrane fluidity and its significance for understanding processes related to membrane deformation [43]. Experimental studies as well as MD simulations reported changes in dipole potential of DOPC (1,2-Dioleoyl-sn-glycero-3-phosphocholine) membrane as a function of membrane tension [44]. Surface tension-induced phase transition of a DPPC (Dipalmitoylphosphatidylcholine) bilayer at 305K was studied by Kong et al. using MD simulations and coarse-grained model [45]. They reported that the change in surface tension and/or temperature could induce the transition between the liquid crystal and gel phases for pure DPPC bilayer and protein embedded DPPC bilayer. Reddy et al. studied the effect of membrane tension on the physical properties of pure DOPC lipid bilayer far from its lysis tension [46] . Muddana et al., using NPzAT simulation, studied DiI-labeled 128 DPPC lipid bilayers at seven different area-per-lipid values ranging from 0.635 to 0.750 nm2, corresponding to surface tensions in the interval from -2.6 to 15.9 mN/m [47]. A molecular dynamics study by López Cascales et al. [48] at 330K on a 72-DPPC system showed a phase transition from liquid crystalline to gel phase when the surface tension approached 40 mN/m. Formation of hydrophilic water pores, which eventually led to rupture of the DPPC membrane at a tension of around -200 bar (~90 mN/m), was reported by Leontiadou et al. [49]. MD simulations by Xie et al. observed rupture of the DPPC membrane at −200 bar lateral stretching, regardless the pressure loading rate or the membrane size [50]. Buckling of the membrane at 200 bar compression was also reported in the same study. Previous modelling studies suggested that the systems under high compression may show very slow relaxation, requiring very long simulation time to attain equilibration [45,51,52]. Also, the loading rate at which the pressure is applied is shown to play a crucial role in determining the extent of conformational changes [50].
Hence, considering the slow relaxation and the effect of loading rates, the membrane behaviour under extreme tension and compression is an attractive research topic especially to identify the critical conditions of significant structural alterations and in particular buckling and rupture. However, besides the extended body of works the structural and dynamical changes in a membrane during compression-induced buckling remain a topic which is not explored in sufficient detail. Here, we gauge, with an unprecedented accuracy, the critical phenomena that occur in the phase behavior of the DPPC membrane and the corresponding critical pressures. This includes a refined analysis of the uniform-to-undulated phase transition through distinct metrics. Phosphatidylcholine (PC) is the most prevalent phospholipid in mammalian cells, accounting for 40–50% of the total phospholipids in a cell [53]. Dipalmitoylphosphatidylcholine (DPPC), being prominent among the PC family of membranes and regarded as the hydrogen atom of lipids [54], is selected for the current study. It is a zwitterionic lipid that mimics the primary lipid component of eukaryotic membranes and from a biological standpoint, is regarded as a representative model for mammalian cell membranes [55].
Through microsecond-long atomistic MD simulations, exceeding by one order of magnitude any previous reported studies, we gauge systematically the effect of low and high loading rates, under lateral compression and stretching, on the structural characteristics and dynamical behaviour of pure DPPC membrane. This allows us further to identify, with unprecedented precision of 10 bar, the critical pressure conditions for buckling and rupture. The hysteresis behaviour of the membrane was additionally studied by reducing the lateral compression and stretching respectively from an undulated and a stretched state down to 1 bar. Additionally, we explore systematically the effect of system size and the reproducibility of the present findings. The paper is organized as follows: section 3 presents the methodology, section 4 hosts the results and section 5 conclude with a summary of the main findings.
2. Methodology
All MD simulations are performed with the open-source software suite Gromacs-v2021.4 [56]. For all visualizations we use the Visual Molecular Dynamics (VMD) software [57]. The primary simulated system corresponds to 256 DPPC molecules with 30 water molecules per DPPC ensuring full hydration [58]. The initial configuration is created by replicating the original box from an initial structure of 64 DPPC [59]. Additional simulations are conducted on a 128-DPPC system to identify the effect of system size on the membrane behavior. Critical phenomena, like membrane rupture, are investigated by simulating four independent MD trajectories to check the reproducibility of the observed trends.
In all simulations we use the united-atom force-field force field for DPPC derived by Berger, Edholm, and Jähnig [52].The simple point charge (SPC) model is used for water [60]. All bonds are constrained to their equilibrium lengths with the linear constraint solver (LINCS) algorithm [61]. Periodic boundary conditions are applied along all the three axes: x, y and z. A cut-off distance of 1.2 nm is implemented for the Lennard–Jones interactions and the real space part of electrostatic ones. The particle-mesh Ewald (PME) method [62] is used to compute long-range electrostatic interactions. For energy minimization, the steepest descent algorithm is implemented. All production MD simulations are performed in the isothermal-isobaric (NPT) ensemble with the Nose-Hoover thermostat [63,64,65]; Constant lateral pressure (along the x-y plane) is maintained using the semi-isotropic Parrinello–Rahman pressure coupling algorithm [66,67]. The integration time step is set to 2.0 fs and frames (system configurations) are saved every 100 ps. Depending on the conditions discussed in detail later, the simulation time required to track effectively the critical phenomena reaches or even exceeds 1.5 µs, with multiple independent simulations performed to assess the reproducibility of the observed trends, totaling approximately 50 microseconds of simulations in the present study. Given that the computational cost of all-atom models is typically three to four times higher than that of the united-atom model, making it impractical to achieve results on similar time scales, the united-atom model was selected for this study. Additionally, preliminary simulations on selected systems with the Berger united-atom and the CHARMM [68] explicit-atom force fields revealed no significant differences in the structural behaviour when tested at 1 bar and 323 K. The area per lipid calculated using both force fields is very similar, averaging around 61 and 60.9 nm² for LB and CHARMM, respectively. The average bilayer thicknesses for LB and CHARMM are found to be 3.8 and 4.1 nm, respectively, whereas the experimentally reported value is 3.9 nm [69]. The deuterium order parameter shows close agreements between these two forcefields. Additionally, the choice of the current potential (Lipid Berger united-atom), which has been used in numerous studies over the years, including recent ones [9,12,70,71], shows very good to excellent agreement with available experimental data as will be explained in the continuation in the Results section.
To study the change in the structural and mechanical properties of the membrane against lateral compression and stretching, pressure is varied in the range from +150 to -200 bar in a fine resolution of ΔP = 10 bar. For all the pressure values, the simulation temperature is fixed at 323 K. The pressure along bilayer normal i.e., along the z axis, is fixed to 1 bar. It should be noted that negative pressure means practically tension. The target pressure is achieved through two different implementations, namely high loading (HL) and low loading (LL). For high loading, the target pressure is applied instantaneously to the final equilibrated configuration at P = 1 bar. For low loading, the target pressure is achieved progressively by ramping through intermediate steps of 10 and -10 bar, for compression and tension, respectively, starting again from the same configuration (P = 1 bar). For LL at each intermediate step, a short NVT simulation of 1 ns is performed, followed by an NPT simulation of 30 ns, and the final configuration is used in the succeeding ramping step. Past studies [48] carried out the compression for just five surface tension couplings 0.6, 1, 6, 60, and 225 atm. Lateral tension study done by [50] observed the behaviour of DPPC membrane for both high and low loading at 50, 100 and 200 bar.
Initially, the system (256 DPPC and 7712 water molecules) is equilibrated for 200 ns at 1 bar and 323 K. A typical system configuration at the end of the simulation is shown in Figure 1. Below 50 bar compression, the simulation time is 400 and 600 ns, for low and high loading, respectively. Whereas systems above 50 bar compression, are simulated for at least 1µs or even longer to achieve equilibration in HL compression. For stretching, the simulations for both high and low loading cases are carried out for 400 ns. In all cases, the simulation time is determined by the requirement to capture the possible structural transitions (undulation, nematic ordering) and critical phenomena (rupture). The main text focuses on results obtained for low loading. The comparison between HL and LL is added in supplementary information as Figure S5.
3. Results and Discussion
To determine the time a system requires to reach equilibration, we study the time evolution of the area per lipid (APL), as shown in Figure 2. APL is defined as the average area occupied by a lipid molecule in the plane of the membrane (xy plane in the present case). In other words, it is effectively the inverse of the areal number density of the lipids. As it can be seen from Figure 2 at a pressure range at and above 50 bar, at least 500 ns are required for the system to reach the equilibrium state; hence all corresponding simulations (bar) ae extended for up to 1 µs or even beyond that time. We analyse the behaviour of the last, equilibrated part of the simulation trajectory (t > 500 ns). The systems at lower pressures i.e. up to 40 bar, equilibrate within 30 ns. Their total simulation time (bar) is 400 ns, out of which the last 350 ns are considered for the analysis.
3.1. COMPRESSION
To illustrate the structural changes in the DPPC lipid bilayer with lateral compression, the mass density profile of lipid headgroups along the bilayer normal (z-axis) is plotted in Figure 3(a), for various pressures. The density profiles for up to 40 bar show two distinct peaks which correspond to two well defined positions of the lipid headgroups in x-y planes, in top and bottom leaflets.
The separation between the peaks increases slightly with lateral pressure, which is due to the expansion of membrane along the z-axis. It can be observed that the mass distribution of the headgroup remains very similar between 1 and 40 bar, except for a slight but regular increment in the separation. This essentially means that the DPPC membrane retains its planar symmetry for up to 40 bar of a lateral pressure. This can also be confirmed by visual inspection of the snapshots in Figure 4(a-c).
At 50 bar, an abrupt broadening of the peaks, accompanied by some irregularities, can be seen, a trend which evidently increases with pressure. The irregular broadening of the peaks can be attributed to the undulation of the membrane along the z-axis, as shown in the snapshots in Figure 4(d-f). This means that the membrane can withstand a lateral pressure up to 40 bar, without disrupting its planar arrangement, and gets undulated beyond that limit. The maximum lateral pressure applied to the system was 120 bar. For higher pressures, the membrane becomes laterally fused which leads to termination of the corresponding simulations. However, in a previous work López Cascales et al. [48] performed 20ns long MD simulations using GROMOS force field, to examine the behavior of 72 DPPC molecules by under lateral compression of 0.6, 1, 6, 60 and 225 bar. They observed a phase transition from liquid crystalline to gel at 225 bar, at 330K but did not report the uniform to undulated phase transition as observed in our study. Their system withstood a lateral pressure of 225 bar, which differs significantly from our results; our system, subjected to +100 bar lateral pressure, was destroyed within 160 ns in HL simulations. While they used a different force field and a smaller system, the short simulation time of 20 ns appears to be a key factor in explaining these differences. Our study indicates that systems under high compression require simulations longer than 400 ns to reach equilibrium, as shown by the variation in area per lipid (APL) in Figure 2. This requirement of sufficiently long simulations also extends to gauge structural transitions and critical phenomena.
The importance of sufficiently long simulation times for systems under compression can also be demonstrated from the time evolution of the mass density profile headgroups at 50 bar (Figure 5). The undulation is initiated at 40-50 ns and the shape of curves changes significantly until 400ns, after which remains rather stable. It should also be noted that 400 ns is the minimum time required to equilibrate the highly compressed system as already shown by the data in Figure 2. In Figure 3(c), the average APL is plotted against lateral pressure. As a reference, the average APL at 1 bar is found to be 61.03 ± 0.8 Å2, which agrees very well with the previous experimental report of 62 ± 2 Å2 [72] as well as past simulation studies of 61.8 ± 0.3 Å2 [73]. APL shows linear decrement up to 40 bar followed by a steep descend from 0.54 nm2 to 0.45 nm2 at 50 bar, and gradually decreases further at higher pressures. The initial systematic reduction is due to the gradual thickening of the membrane whereas, the sudden decrement between 40 to 50 bar can be attributed to the transition of the membrane form uniform to undulated phase. The APL is usually defined for a planar membrane. In the present case, the sudden reduction APL is due to the loss of planar arrangement (xy plane) of the membrane surface to undulated quasi-3D type surface, as the xy-planar projection of the surface area decreases in an undulated membrane.
In one of the previous studies using coarse grained model, application of pressure in both lateral and perpendicular directions led to a critical APL near the phase transition boundary being 0.57 nm2 [74]. The APL in gel phase of DPPC was estimated at 0.465 nm2 and 0.46 nm2 using (coarse-grained) CG simulations [52] and experimental analysis [58], respectively. These available data are quite close to the values we find in the uniform and undulated phase, respectively. To characterize the membrane undulation, we measure the variance in the z-coordinate of the head groups, denoted as σZ, for both the top and bottom leaflets. σZ is then averaged across multiple configurations. As depicted in Figure 3(c), the relationship between σZ and lateral pressure initially exhibits a linear increase up to 40 bar, followed by a pronounced sharp rise between 40 and 50 bar. This abrupt increase is attributed to significant membrane deformation, as illustrated in the snapshots in Figure 4. Additionally, it is noteworthy that the sharp change in σZ closely mirrors the trends observed in the density plot of the head groups and the variation in the area per lipid (APL), as shown in Figure 3(a, c), respectively. This correspondence reinforces the association of the phase transition with enhanced membrane deformation. To quantify the effect of lateral pressure on the alignment of the lipid acyl chains, we further calculate the nematic order parameter for the acyl chain vectors for both leaflets, and then average these to obtain the mean nematic order parameter, S. For the calculation of the nematic, long-range order parameter we follow the approach of [75,76,77]. First, we consider the vectors that correspond to the two acyl chains of DPPC molecule and connect the P atom of the headgroup with the terminal carbon atoms of each acyl chains as illustrated in Figure 1(b) (and in more detail in the sketch of Figure S2). Based on this, we also calculate the global nematic vectors for the “top” and “bottom” leaflets, as illustrated in inset in Figure 6(a), a sketch like the one already reported in [78].
Given these two global vectors we further calculate the corresponding angular separation between them. A value of angular separation close to zero indicates parallel alignment between the nematic directors of the two leaflets, suggesting a disordered or tilt phase. Nonzero, large angular separation indicates two different orientations of the nematic directors, hence corresponding to a cross-tilt phase. This allows to differentiate between the tilt and cross-tilt phases as reported previously in [78].
The results on the global nematic order parameter and the angular separation of the nematic vectors corresponding to each leaflet are shown in Figure 6(a). S increases almost linearly from 1 to 40 bar, indicating increase in the lipid chain ordering due to lateral compression, and exhibits a sharp jump between 40 to 50 bar, which corresponds to the phase transition. Beyond 50 bar, it reaches a plateau value in the undulated phase where no further increase is observed. This plateau behaviour is due to the combined effect of the presence of high ordered local domains and the slight loss of global ordering due to undulation. In parallel, the angular separation between the leaflet nematic vectors fluctuates randomly between 2 and 5o for the entire range, exhibiting the lowest value at 1 bar. Since the variation is very small and the angle of the vector orientation between the leaflets adopts very small values, very close to zero, we can conclude that a cross-tilted phase is absent for the whole pressure range.
To elucidate the structural and dynamical changes in the acyl chain segments, vectors connecting alternate carbons of the acyl chains are defined, and their tilt angles relative to the plane perpendicular to the xy-plane are analysed (see the corresponding sketch in Figure S2(e) of supplementary information), like in the study done by Leekumjorn and Sum [78]. The tilt angle distribution across a pressure range of 1 to 40 bar demonstrates a broad spectrum, reflecting the high flexibility of the alternate carbon segments. The peak of the tilt angle distribution for 1 bar system is in close agreement with the previous simulation studies [79,80]. As pressure increases, this distribution narrows progressively, and the peak shifts towards smaller tilt angles, indicating a tendency for these segments to align more closely with the bilayer normal. Notably, between 40 and 50 bar, the tilt angle distribution exhibits a distinct transformation: it reveals a sharp maximum at approximately 10 degrees and a secondary, less pronounced peak near 45 degrees. At pressures exceeding 50 bar, the primary peak gets narrower, and the secondary one becomes more pronounced, signifying an enhanced structural order and a shift in the dynamics of the acyl chain segments under higher pressure conditions. The small plateau around 45 degrees in the tilt angle distribution in the undulated phases indicates possible presence of the smaller disordered domains, as shown in the Figure S2(d) in the supplementary information. These system conformations, characterized by predominantly ordered structure with some disordered domains, are referred to as the ripple phase, which is observed in the gel phase, as documented in [81]. Snapshots allowing for a visual inspection of the ripple phase are provided in Figure S3.
The orientational segmental dynamics of the acyl chains is investigated by studying the autocorrelation function (ACF) of the vector between the alternate carbon atoms, as defined in the previous section. The autocorrelation function, f is defined as,
where, and , represent the unit vectors along alternating carbon atoms corresponding at time and , respectively. The autocorrelation function, ACF, is averaged over all the alternate carbon vectors and multiple time origins. In Figure 6(c), ACF is plotted against time for various lateral pressures (compression). As it can be seen, in the range from 1 to +40 bar, the drop rate becomes slower and the plateau shifts up, gradually with the increase in lateral pressure, which indicates reduced orientational mobility and restricted motion because of the higher density of the system. Again, and consistently with our previous measurements, an abrupt change in the evolution of ACF can be observed as the lateral pressure increases from 40 to 50 bar, demonstrating much slower dynamics in the undulated phase compared to the uniform one. As pressure increases further, relaxation becomes progressively slower. This indicates that the lateral pressure also induces a dynamic phase transition, where the orientational mobility of the DPPC molecules suffers a significant drop. Similar kind of study was previously done in [52], which showed that the rotational autocorrelation function of the glycerol backbone vector relaxes noticeably slower at the fluid-gel phase transition. A video of DPPC membrane at 50 bar, provided as a supplementary information, illustrates the phase transition from a dynamic and uniform phase to a significantly less mobile undulated phase. Conformationally, this latter phase corresponds to straight and orientationally aligned acyl chains, as further verified by the trends of the global nematic order parameter and tilt angle distributions, as presented earlier.
In Figure S5 (supplementary information) we compare HL and LL simulations. For both, the variation of the APL for the entire pressure range remains very similar, and consequently the uniform-to-undulated phase transition occurs at the same pressure range. It is necessary to mention here that, for HL, the systems near the transition take longer time (more than 600 ns) to reach equilibration compared to LL. Also shown in Figure S5 are the APL trends and the density profiles for HL and LL under compression.
3.2. Stretching
The effect of stretching on the membrane is also studied between -10 and -200 bar, again in a step of -10 bar, to identify as accurately as possible the pressure range where critical phenomena occur. The systems under stretching reach equilibration in roughly 30-50 ns.
In systems where the stretching is too high for the membrane to remain stable (-180 to -200 bar), rupture may occur in a time scale between 50 and 500 ns, which will be discussed in detail later. Hence, the simulations for each value of stretching, are carried out for 500 ns, and the properties are calculated as averages from the system configurations of the last 350 ns. To directly compare the membrane behaviour under stretching and compression in the continuation we present the corresponding figures side-by-side (mass density profile, area per lipid and orientational autocorrelation function) or we combine them in the same figure panel (nematic order parameter and carbon tilt angle distribution). Thus, the mass density profile of the lipid headgroup is plotted in Figure 3(b), which shows that the separation between the peaks decreases gradually with stretching, indicating membrane thinning which leads to a higher area per lipid. The gradual membrane thinning trend can be also identified visually by the snapshots in Figure 7(a-e). For -180 bar stretching, the membrane ruptures, as clearly seen in the snapshots of the panels f and g. Figure 7f represents the snapshot at 104 ns, where few water molecules can be seen to penetrate into the hydrophobic part of the membrane (omitted for clarity to demonstrate the presence of the water molecules), which corresponds to the onset of the membrane rupture. The presence of water column inside the hydrophobic part, indicating full rupture of the membrane, is evident in the snapshot of Figure 7(g) corresponding to t = 106 ns. In parallel, the increment of APL against the stretching is linear, as confirmed by the best fit shown in Figure 3(d), suggesting linear areal expansion of the membrane. As illustrated in Figure 3(d), the variance of head group, σZ exhibits a linear decrease with increasing stretching, indicating a more confined planar distribution of the headgroups. Notably, the increment of σZ is linear with increasing pressure for both stretching and compression, though with different rates, across the entire range of -160 to +40 bar, where the membrane maintains a uniform planar distribution. This implies that an increase in lateral pressure results in a more dispersed planar distribution. Furthermore, it is important to highlight that the slope of σZ changes distinctly for compressive stresses exceeding 40 bar, at which point the membrane undergoes undulation. Accordingly, σZ serves as a potential parameter for detecting the transition from a uniform distribution to an undulated state.
Mass density profiles of water molecules along the bilayer normal for various stretching values and at different times are provided, as supplementary information, in Figure S1, which shows the gradual reduction in the width of the hydrophobic region as the stretching increases, due to the thinning of the membrane. Eventually at -180 bar, as also confirmed by the density profile, the water molecules percolate between the two layers due to membrane rupture, as further evidenced visually from the snapshot in Figure 7(g).
The nematic order parameter S decreases almost linearly with stretching as shown in Figure 6(a), since dilution due to stretching, leads to more orientational freedom to the acyl chains and consequently loss of long-range orientational ordering. The alternate carbon tilt angle distribution gradually broadens with stretching, pointing towards more flexibility in the acyl chains as shown in Figure 6(b). The autocorrelation function ACF is plotted for various negative pressures in Figure 6(d). Faster decay for ACF could be observed gradually for higher stretching values because of the higher degree of orientational mobility. In all the cases, ACF reaches a plateau region, which shifts towards a lower value as stretching increases. This shift indicates a larger free volume available to the lipid chains increasing local mobility. It should be noted that the ACF behaviour for the entire range of stretching is very similar to the compression value till +40 bar, where the latter suffers a phase change, and the rotational dynamics becomes slower and eventually freezes. The variation of APL, order parameter and the ACF with stretching is systematic until -170 bar, in contrast to compression where a discontinuity is seen between 40 to 50 bar, corresponding to uniform-to-undulated phase transition. As mentioned earlier, the membrane ruptures at -180 bar, a pressure value which is slightly lower than -200 bar, as reported in the previous MD simulation study by Xie et. al. [50] on DPPC membrane using lipid-Berger [82] potential parameters. In that study, stretching was varied in increments of 50 bar, primarily focusing on the investigation of water pore formation in the membrane, its stability, and rupture of the membrane, which typically occurs at elevated stretching levels. The present study employs a finer increment of 10 bar, allowing for a more precise analysis of systematic structural changes and the identification of the critical stretching strength associated with rupture. In another simulation study by Leontiadou et al. [42], which focused on the study of the pore formation and its structural analysis, the stretching was applied instantly (referred to as high loading (HL) in the present manuscript), and rupture occurred at -200 bar. Tomasini et al. [22] investigated the rupture of the membrane by increasing the surface tension and reported that the rupture of the membrane occurs for surface tension values between 80-90 mN/m, which is equivalent to lateral stretching from -150 to -200 bar. Because of the small difference at the critical strength of the stretching for rupture of the membrane with the aforementioned works, four independent simulations have been additionally performed at each pressure of -170, -180, -190 and -200 bar, to check the statistical ambiguity of rupture in the vicinity of the critical value. In each of the four independent simulations, the same initial configuration is used, but different initial velocities are assigned to atoms. For all independent simulations the total simulation time is set to 500 ns, unless the membrane ruptures earlier. As can be seen in Table 1, at -170 bar, none of the systems shows rupture, at -180 bar, three of the four systems show rupture, whereas for -190 and -200 bar, all simulations lead to membrane rupture. Accordingly, -170 bar is considered the highest limit of structural stability for the membrane and thus no independent simulations were conducted at lower pressures. In parallel, our present data suggest that the rupture is certain at -200 bar which agrees with earlier reports. Furthermore, the present study clearly demonstrates that the membrane becomes vulnerable to rupture already from -180 bar onwards, which overlaps with the predicted range by Tomasini et al. [22].
Also, it should be noticed that the time of rupture of the membrane is highly unpredictable, as can be seen for the cases of -180, -190 and -200 bar, where it varies in a broad range from 50 up to almost 500ns. A movie showing the rupture of the membrane at -180 bar is provided in the supplementary information. Furthermore, the comparison of loading rate effect for stretching showed no significant difference as verified by the data in Table S1 of supplementary information.
4. Pressure Hysteresis
The thermal hysteresis associated with the heating and cooling of DPPC has been extensively studied in prior research [81,83]. In the current study, we investigate the hysteresis response of the membrane under pressure. The membrane, initially compressed at 120 bar, is progressively decompressed in a step of 10 bar. Similarly, the membrane that has been stretched to -170 bar, which is the highest negative pressure that guarantees structural stability, is relaxed in 10-bar steps. The stability of the area per lipid (APL) for each system is assessed to confirm the equilibration. As illustrated in Figure 8(a), the APL during the decompression cycle exhibits sharp increment between 30 to 40 bar, representing an undulated-to-uniform phase transition, which is confirmed by studying the snapshots as given in Figure S6 (supplementary information). The overall variation of APL in decompression aligns closely with compression cycle, except that the critical transition pressure is slightly lowered by 10 bar, i.e. between 30 and 40 bar, underscoring the reversible nature of the phase transition. Accordingly, the small hysteresis is observed in the interval between 40 and 50 bar. Conversely, during the stretching cycle, the APL decreases gradually, retracing the path of the stretching cycle, further indicating the reversibility of the process and the absence of hysteresis. The snapshots of the change from the undulated to the uniform state for the membrane during the reversible cycle of compression (LL) are shown in Figure S6 (supplementary information).
One important question is how the system size could affect the phase transitions and the critical phenomena (buckling and rupture). To address this, we conduct additional simulations on a smaller system composed of 128 DPPC molecules, as also stated in the methodology section. To illustrate the system size effect, for both compression and stretching the APL and mass density plot of headgroups are analysed. The phase transition for 128 DPPC during compression is found to be at 30-40 bar, slightly lower than the 40-50 bar range for the larger 256-DPPC system. In parallel, the trends observed for stretching appear identical between the two system sizes. For stretching, APL shows excellent agreement in the lower values (< -80 bar) and a slight drift for the higher stretching. Rupture of the membrane occurs at -170 bar compared to -180 bar for the larger system size of 256 DPPC. All the above results are included in Figure S4 in the supplementary information. The system size analysis is performed only for high loading case. Based on them we can safely conclude that system size has a minimal effect on the observed trends for the membrane behaviour under stretching and compression.
6. Conclusions
This study investigates the structural and dynamic behaviours of DPPC bilayers under varying lateral pressures for low and high loading rates, through atomistic MD simulations, some exceeding 1.5 microseconds in duration surpassing any previously published studies by an order of magnitude. We thus identify with high precision a transition from the uniform to the undulated phase occuring at +50 bar. An in-depth analysis of this transition using various noble metrics, such as the autocorrelation function, nematic order parameter, and headgroup variance along the bilayer normal, presents a lucid depiction of the membrane during compression and stretching.
This structural phase change is associated with a sharp decrease in the area per lipid, increase in the variance of the headgroups and significant reduction of rotational mobility of the lipid chains. The nematic order parameters confirm the absence of cross tilt configurations of the acyl chains. The tilt angle distribution not only shows the gradually ordering of the acyl chains with compression but also reveals the presence of a ripple phase at higher pressures.
Compression shows a slight hysteresis on reversing the pressure and is thus found to be a reversible process. The systems simulated below the phase transition (up to 40 bar) reach equilibrium within a simulation time of 30-50 ns, whereas, above the transition the equilibration requires significantly longer time of 400-600 ns. This essentially means that, an appreciably longer simulation time is required to study DPPC bilayers under high compression, which could explain why the observed phase transition has not been reported in the past.
The effect of loading rate is not profound, except near the transition pressure. For stretching, the effect of pressure is much more systematic in terms variation of APL, variance, ACF etc. The rotational mobility of the lipid chains also increases with stretching. The tolerance of the membrane against the rupture is also examined in this work with very high precision and through multiple independent simulations. It is observed that, independent of the pressure loading pattern, the membrane can withstand a stretching strength up to -170 bar maintaining its structural integrity, and there is some probability of membrane rupture from -180 bar onwards. The membrane rupture becomes certain at -200 bar. Typically, systems equilibrate under stretching within 50 ns. However, under extreme stretching conditions, particularly when the membrane is susceptible to rupture (between -180 to -200 bar), the rupture may take 400-500 ns to occur, emphasizing the necessity of extended simulation times. The effect of loading rates is found to be minimal for the case of stretching, except that the rupture at -200 bar occurs at earlier times for high loading. The system size effect is found to be minimal in the observed phase transition during compression and the same can be stated for the structural behaviour and dynamical response of the DPPC bilayer. These findings are crucial because fluctuations in local membrane pressure can significantly impact membrane function. From the modelling perspective, it is established that critical phenomena and transitions can be observed only through sufficiently long simulation times. Furthermore, this study is expected to stimulate further research including the localization and dynamic properties of drugs as well as interaction of small molecules with the membrane as carried out in many recent works [84,85,86,87,88]. Understanding these aspects is critical for elucidating processes like drug-receptor binding and drug translocation across membranes, which are vital in pharmacological research and drug development.
Supplementary Materials
The following supporting information can be downloaded at the website of this paper posted on Preprints.org.
Author Contributions
Conceptualization, S.R. ; methodology, S.D., N.C.K. and S. R.; software, S. D.; validation, S.D., NC.K., and S.R.; formal analysis, S.D., N.C.K. and S.R.; investigation, S.D., N. C. K. and S.R. data curation, S.D.; writing—original draft preparation, S.D.; writing—review and editing, S.D., N.C.K. and S.R.; supervision, S.R.; All authors have read and agreed to the published version of the manuscript.
Funding
This research was funded by the projects “PID2021-127533NB-I00” of MICINN/FEDER (Ministerio de Ciencia e Innovación, Fondo Europeo de Desarrollo Regional) and “Seeds Project-VRISEM25NK” of UPM (Universidad Politécnica de Madrid).
Data Availability Statement
All raw data from the simulations reported here are available upon request.
Acknowledgments
Support through projects “PID2021-127533NB-I00” of MICINN/FEDER (Ministerio de Ciencia e Innovación, Fondo Europeo de Desarrollo Regional) and “Seeds Project-VRISEM25NK” of UPM (Universidad Politécnica de Madrid) is deeply appreciated. NCK gratefully acknowledges the Universidad Politécnica de Madrid (www.upm.es) for providing computing resources on Magerit Supercomputer.
Conflicts of Interest
The authors declare no conflict of interest.
References
- D. Lopes, S. Jakobtorweihen, C. Nunes, B. Sarmento, and S. Reis, “Shedding light on the puzzle of drug-membrane interactions: Experimental techniques and molecular dynamics simulations,” Prog Lipid Res, vol. 65, pp. 24–44, 2017. [CrossRef]
- T. Sych, C. O. Gurdap, L. Wedemann, and E. Sezgin, “How does liquid-liquid phase separation in model membranes reflect cell membrane heterogeneity?,” Membranes (Basel), vol. 11, no. 5, May 2021. [CrossRef]
- S. Gupta, J. Soni, A. Kumar, and T. Mandal, “Origin of the nonlinear structural and mechanical properties in oppositely curved lipid mixtures,” Journal of Chemical Physics, vol. 159, no. 16, Oct. 2023. [CrossRef]
- D. A. Los and N. Murata, “Membrane fluidity and its roles in the perception of environmental signals,” Biochimica et Biophysica Acta (BBA) - Biomembranes, vol. 1666, no. 1–2, pp. 142–157, Nov. 2004. [CrossRef]
- C. Peetla, A. Stine, and V. Labhasetwar, “reviews Biophysical Interactions with Model Lipid Membranes : Applications in Drug Discovery and Drug Delivery,” no. 4, pp. 8053–8058, 2009.
- E. J. McMurchie and J. K. Raison, “Membrane lipid fluidity and its effect on the activation energy of membrane-associated enzymes,” BBA - Biomembranes, vol. 554, no. 2, pp. 364–374, Jul. 1979. [CrossRef]
- P. S. Niemelä et al., “Membrane proteins diffuse as dynamic complexes with lipids,” J Am Chem Soc, vol. 132, no. 22, pp. 7574–7575, Jun. 2010. [CrossRef]
- M. L. Garavaglia et al., “Membrane thickness changes ion-selectivity of channel-proteins,” Cellular Physiology and Biochemistry, vol. 14, no. 4–6, pp. 231–240, 2004. [CrossRef]
- G. Kasparyan and J. S. Hub, “Molecular Simulations Reveal the Free Energy Landscape and Transition State of Membrane Electroporation,” Phys Rev Lett, vol. 132, no. 14, Apr. 2024. [CrossRef]
- H. A. L. Filipe, R. M. S. Cardoso, L. M. S. Loura, and M. J. Moreno, “Interaction of Amphiphilic Molecules with Lipid Bilayers: Kinetics of Insertion, Desorption and Translocation,” in Membrane Organization and Dynamics, vol. 20, Springer International Publishing, 2017, pp. 49–89.
- S. Mallick and N. Agmon, “Lateral diffusion of ions near membrane surface,” Physical Chemistry Chemical Physics, vol. 26, no. 28, pp. 19433–19449, Jun. 2024. [CrossRef]
- M. A. Kalutskii, T. R. Galimzyanov, and K. V. Pinigin, “Determination of elastic parameters of lipid membranes from simulation under varied external pressure,” Phys Rev E, vol. 107, no. 2, Feb. 2023. [CrossRef]
- M. D. Tomasini, C. Rinaldi, and M. S. Tomassone, “Molecular dynamics simulations of rupture in lipid bilayers,” Exp Biol Med, vol. 235, no. 2, pp. 181–188, Feb. 2010. [CrossRef]
- M. A. Murphy et al., “Molecular dynamics simulations showing 1-palmitoyl-2-oleoyl-phosphatidylcholine (POPC) membrane mechanoporation damage under different strain paths,” J Biomol Struct Dyn, vol. 37, no. 5, pp. 1346–1359, Mar. 2019. [CrossRef]
- L. Zhang et al., “Molecular dynamics simulations of heterogeneous cell membranes in response to uniaxial membrane stretches at high loading rates,” Sci Rep, vol. 7, no. 1, Dec. 2017. [CrossRef]
- M. L. Fanani and E. E. Ambroggio, “Phospholipases and Membrane Curvature: What Is Happening at the Surface?,” Feb. 01, 2023, MDPI. [CrossRef]
- H. L. Knudsen and J. A. Frangos, “Role of cytoskeleton in shear stress-induced endothelial nitric oxide production,” https://doi.org/10.1152/ajpheart.1997.273.1.H347, vol. 273, no. 1 42-1, 1997. [CrossRef]
- S. Gudi, J. P. Nolan, and J. A. Frangos, “Modulation of GTPase activity of G proteins by fluid shear stress and phospholipid composition,” Proc Natl Acad Sci U S A, vol. 95, no. 5, pp. 2515–2519, Mar. 1998. [CrossRef]
- S. I. Sukharev, P. Blount, B. Martinac, F. R. Blattner, and K. Kung, “A large-conductance mechanosensitive channel in E.coli encoded by mscL alone,” Nature, pp. 265–268, Mar. 1994. [CrossRef]
- T. Shigematsu, K. Koshiyama, and S. Wada, “Effects of Stretching Speed on Mechanical Rupture of Phospholipid/Cholesterol Bilayers: Molecular Dynamics Simulation,” Scientific Reports 2015 5:1, vol. 5, no. 1, pp. 1–10, Oct. 2015. [CrossRef]
- Y. A. Ermakov, “Electric Fields at the Lipid Membrane Interface,” Nov. 01, 2023, Multidisciplinary Digital Publishing Institute (MDPI). [CrossRef]
- P. Hamill and B. Martinac, “Molecular basis of mechanotransduction in living cells,” Physiol Rev, vol. 81, no. 2, pp. 685–740, 2001. [CrossRef]
- B. Martinac and O. P. Hamill, “Gramicidin A channels switch between stretch activation and stretch inactivation depending on bilayer thickness,” Proc Natl Acad Sci U S A, vol. 99, no. 7, pp. 4308–4312, Apr. 2002. [CrossRef]
- P. D. Blood, G. S. Ayton, and G. A. Voth, “Probing the molecular-scale lipid bilayer response to shear flow using nonequilibrium molecular dynamics,” Journal of Physical Chemistry B, vol. 109, no. 39, pp. 18673–18679, Oct. 2005. [CrossRef]
- J. Gullingsrud and K. Schulten, “Lipid Bilayer pressure profiles and mechanosensitive channel gating,” Biophys J, vol. 86, no. 6, pp. 3496–3509, 2004. [CrossRef]
- Y. L. Zhang, J. A. Frangos, and M. Chachisvilis, “Laurdan fluorescence senses mechanical strain in the lipid bilayer membrane,” Biochem Biophys Res Commun, vol. 347, no. 3, pp. 838–841, Sep. 2006. [CrossRef]
- M. A. Haidekker, T. Ling, M. Anglo, H. Y. Stevens, J. A. Frangos, and E. A. Theodorakis, “New fluorescent probes for the measurement of cell membrane viscosity,” Chem Biol, vol. 8, no. 2, pp. 123–131, Feb. 2001. [CrossRef]
- P. J. Butler, G. Norwich, S. Weinbaum, and S. Chien, “Shear stress induces a time- and position-dependent increase in endothelial cell membrane fluidity,” Am J Physiol Cell Physiol, vol. 280, no. 4, 2001. [CrossRef]
- M. P. Allen and D. J. Tildesley, Computer simulation of liquids. Oxford University Press, 2017.
- S. Moradi, A. Nowroozi, and M. Shahlaei, “Shedding light on the structural properties of lipid bilayers using molecular dynamics simulation: a review study,” RSC Adv, vol. 9, no. 8, pp. 4644–4658, Jan. 2019. [CrossRef]
- S. E. Feller, “Molecular dynamics simulations of lipid bilayers,” Curr Opin Colloid Interface Sci, vol. 5, no. 3–4, pp. 217–223, Jul. 2000. [CrossRef]
- H. Fu et al., “Accurate determination of protein:ligand standard binding free energies from molecular dynamics simulations,” Apr. 01, 2022, Nature Research. [CrossRef]
- K. Liu, E. Watanabe, and H. Kokubo, “Exploring the stability of ligand binding modes to proteins by molecular dynamics simulations,” J Comput Aided Mol Des, vol. 31, no. 2, pp. 201–211, Feb. 2017. [CrossRef]
- H. Guterres and W. Im, “Improving Protein-Ligand Docking Results with High-Throughput Molecular Dynamics Simulations,” J Chem Inf Model, vol. 60, no. 4, pp. 2189–2198, Apr. 2020. [CrossRef]
- M. Karplus and J. Kuriyan, “Molecular dynamics and protein function,” Proc Natl Acad Sci U S A, vol. 102, no. 19, pp. 6679–6685, May 2005. [CrossRef]
- M. C. Childers and V. Daggett, “Insights from molecular dynamics simulations for computational protein design,” Feb. 01, 2017, Royal Society of Chemistry. [CrossRef]
- M. G. Pikkemaat, A. B. M. Linssen, H. J. C. Berendsen, and D. B. Janssen, “Molecular dynamics simulations as a tool for improving protein stability,” Protein Eng, vol. 15, no. 3, pp. 185–192, 2002.
- Z. Cao et al., “Bias-exchange metadynamics simulation of membrane permeation of 20 amino acids,” Int J Mol Sci, vol. 19, no. 3, Mar. 2018. [CrossRef]
- N. Kruszewska, K. Domino, R. Drelich, W. Urbaniak, and A. D. Petelska, “Interactions between beta-2-glycoprotein-1 and phospholipid bilayer—a molecular dynamic study,” Membranes (Basel), vol. 10, no. 12, pp. 1–19, Dec. 2020. [CrossRef]
- W. Kopec̈, J. Telenius, and H. Khandelia, “Molecular dynamics simulations of the interactions of medicinal plant extracts and drugs with lipid bilayer membranes,” FEBS J, vol. 280, no. 12, pp. 2785–2805, Jun. 2013. [CrossRef]
- J. Ortiz, J. A. Teruel, F. J. Aranda, and A. Ortiz, “On the Mechanism of Membrane Permeabilization by Tamoxifen and 4-Hydroxytamoxifen,” Membranes (Basel), vol. 13, no. 3, Mar. 2023. [CrossRef]
- F. S. S. Magalhães, E. D. Vieira, M. R. B. Batista, A. J. Costa-Filho, and L. G. M. Basso, “Effects of Nicotine on the Thermodynamics and Phase Coexistence of Pulmonary Surfactant Model Membranes,” Membranes (Basel), vol. 14, no. 12, p. 267, Dec. 2024. [CrossRef]
- K. V. Pinigin, “Local Stress in Cylindrically Curved Lipid Membrane: Insights into Local Versus Global Lateral Fluidity Models,” Biomolecules, vol. 14, no. 11, Nov. 2024. [CrossRef]
- D. T. Warshaviak, M. J. Muellner, and M. Chachisvilis, “Effect of membrane tension on the electric field and dipole potential of lipid bilayer membrane,” Biochim Biophys Acta Biomembr, vol. 1808, no. 10, pp. 2608–2617, Oct. 2011. [CrossRef]
- X. Kong, S. Qin, D. Lu, and Z. Liu, “Surface tension effects on the phase transition of a DPPC bilayer with and without protein: A molecular dynamics simulation,” Physical Chemistry Chemical Physics, vol. 16, no. 18, pp. 8434–8440, May 2014. [CrossRef]
- S. Reddy, D. T. Warshaviak, and M. Chachisvilis, “Effect of membrane tension on the physical properties of DOPC lipid bilayer membrane,” Biochim Biophys Acta Biomembr, vol. 1818, no. 9, pp. 2271–2281, Sep. 2012. [CrossRef]
- H. S. Muddana, R. R. Gullapalli, E. Manias, and P. J. Butler, “Atomistic simulation of lipid and DiI dynamics in membrane bilayers under tension,” Physical Chemistry Chemical Physics, vol. 13, no. 4, pp. 1368–1378, Jan. 2011. [CrossRef]
- J. J. López Cascales, T. F. Otero, A. J. Fernández Romero, and L. Camacho, “Phase transition of a DPPC bilayer induced by an external surface pressure: From bilayer to monolayer behavior. A molecular dynamics simulation study,” Langmuir, vol. 22, no. 13, pp. 5818–5824, Jun. 2006. [CrossRef]
- H. Leontiadou, A. E. Mark, and S. J. Marrink, “Molecular Dynamics Simulations of Hydrophilic Pores in Lipid Bilayers,” Biophys J, vol. 86, no. 4, p. 2156, 2004. [CrossRef]
- J. Y. Xie, G. H. Ding, and M. Karttunen, “Molecular dynamics simulations of lipid membranes with lateral force: Rupture and dynamic properties,” Biochim Biophys Acta Biomembr, vol. 1838, no. 3, pp. 994–1002, Mar. 2014. [CrossRef]
- P. Khakbaz and J. B. Klauda, “Investigation of phase transitions of saturated phosphocholine lipid bilayers via molecular dynamics simulations,” Biochim Biophys Acta Biomembr, vol. 1860, no. 8, pp. 1489–1501, Aug. 2018. [CrossRef]
- S. J. Marrink, J. Risselada, and A. E. Mark, “Simulation of gel phase formation and melting in lipid bilayers using a coarse grained model,” Chem Phys Lipids, vol. 135, no. 2, pp. 223–244, Jun. 2005. [CrossRef]
- J. N. van der Veen, J. P. Kennelly, S. Wan, J. E. Vance, D. E. Vance, and R. L. Jacobs, “The critical role of phosphatidylcholine and phosphatidylethanolamine metabolism in health and disease,” Biochimica et Biophysica Acta (BBA) - Biomembranes, vol. 1859, no. 9, pp. 1558–1572, Sep. 2017. [CrossRef]
- N. Kučerka, S. Tristram-Nagle, and J. F. Nagle, “Closer look at structure of fully hydrated fluid phase DPPC bilayers,” Biophys J, vol. 90, no. 11, 2006. [CrossRef]
- G. Rossos, S. K. Hadjikakou, and N. Kourkoumelis, “Molecular dynamics simulation of 2-benzimidazolyl-urea with dppc lipid membrane and comparison with a copper(Ii) complex derivative,” Membranes (Basel), vol. 11, no. 10, Oct. 2021. [CrossRef]
- Lindahl, Abraham, Hess, and van der Spoel, “GROMACS 2021.4 Source code”. [CrossRef]
- W. Humphrey, A. Dalke, and K. Schulten, “VMD - Visual Molecular Dynamics,” 1996, J. Molec. Graphics.
- J. F. Nagle and S. Tristram-Nagle, “Structure of lipid bilayers,” Biochim Biophys Acta, vol. 1469, no. 3, p. 159, Nov. 2000. [CrossRef]
- S. J. Marrink, O. Berger, P. Tieleman, and F. Jähnig, “Adhesion forces of lipids in a phospholipid membrane studied by molecular dynamics simulations.,” Biophys J, vol. 74, no. 2 Pt 1, p. 931, 1998. [CrossRef]
- H. J. C. Berendsen, J. P. M. Postma, W. F. van Gunsteren, and J. Hermans, “Interaction Models for Water in Relation to Protein Hydration,” pp. 331–342, 1981. [CrossRef]
- B. Hess, H. Bekker, H. J. C. Berendsen, and J. G. E. M. Fraaije, “LINCS: A linear constraint solver for molecular simulations,” J Comput Chem, vol. 18, no. 12, pp. 1463–1472, 1997.
- T. Darden, D. York, and L. Pedersen, “Particle mesh Ewald: An N·log(N) method for Ewald sums in large systems,” J Chem Phys, vol. 98, no. 12, pp. 10089–10092, 1993. [CrossRef]
- S. Nosé, “A unified formulation of the constant temperature molecular dynamics methods,” J Chem Phys, vol. 81, no. 1, pp. 511–519, 1984. [CrossRef]
- S. Nosé, “A molecular dynamics method for simulations in the canonical ensemble,” Mol Phys, vol. 52, no. 2, pp. 255–268, 1984. [CrossRef]
- W. G. Hoover, “Canonical dynamics: Equilibrium phase-space distributions,” Phys Rev A (Coll Park), vol. 31, no. 3, p. 1695, Mar. 1985. [CrossRef]
- S. Nosé and M. L. Klein, “Constant pressure molecular dynamics for molecular systems,” Mol Phys, vol. 50, no. 5, pp. 1055–1076, 1983. [CrossRef]
- M. Parrinello and A. Rahman, “Polymorphic transitions in single crystals: A new molecular dynamics method,” J Appl Phys, vol. 52, no. 12, pp. 7182–7190, 1981. [CrossRef]
- B. R. Brooks et al., “CHARMM: The biomolecular simulation program,” J Comput Chem, vol. 30, no. 10, pp. 1545–1614, Jul. 2009. [CrossRef]
- N. Kučerka, M. P. Nieh, and J. Katsaras, “Fluid phase lipid areas and bilayer thicknesses of commonly used phosphatidylcholines as a function of temperature,” Biochim Biophys Acta Biomembr, vol. 1808, no. 11, pp. 2761–2771, Nov. 2011. [CrossRef]
- H. A. L. Filipe, L. M. S. Loura, and M. J. Moreno, “Permeation of a Homologous Series of NBD-Labeled Fatty Amines through Lipid Bilayers: A Molecular Dynamics Study,” Membranes (Basel), vol. 13, no. 6, Jun. 2023. [CrossRef]
- J. Li, Z. Xia, S. Cai, S. Xia, and X. Zhang, “The non-thermal influences of ultrasound on cell membrane: A molecular dynamics study,” J Mol Struct, vol. 1299, Mar. 2024. [CrossRef]
- J. F. Nagle, “Area/lipid of bilayers from NMR.,” Biophys J, vol. 64, no. 5, p. 1476, 1993. [CrossRef]
- X. Zhuang, J. R. Makover, W. Im, and J. B. Klauda, “A systematic molecular dynamics simulation study of temperature dependent bilayer structural properties,” Biochim Biophys Acta Biomembr, vol. 1838, no. 10, pp. 2520–2529, 2014. [CrossRef]
- K. Lai, B. Wang, Y. Zhang, and Y. Zhang, “High pressure effect on phase transition behavior of lipid bilayers,” Physical Chemistry Chemical Physics, vol. 14, no. 16, pp. 5744–5752, Apr. 2012. [CrossRef]
- D. Andrienko, “Introduction to liquid crystals,” J Mol Liq, vol. 267, pp. 520–541, Oct. 2018. [CrossRef]
- D. Martínez-Fernández, M. Herranz, K. Foteinopoulou, N. C. Karayiannis, and M. Laso, “Local and Global Order in Dense Packings of Semi-Flexible Polymers of Hard Spheres,” Polymers (Basel), vol. 15, no. 3, Feb. 2023. [CrossRef]
- D. Martínez-Fernández, C. Pedrosa, M. Herranz, K. Foteinopoulou, N. C. Karayiannis, and M. Laso, “Random close packing of semi-flexible polymers in two dimensions: Emergence of local and global order,” Journal of Chemical Physics, vol. 161, no. 3, Jul. 2024. [CrossRef]
- S. Leekumjorn and A. K. Sum, “Molecular studies of the gel to liquid-crystalline phase transition for fully hydrated DPPC and DPPE bilayers,” Biochimica et Biophysica Acta (BBA) - Biomembranes, vol. 1768, no. 2, pp. 354–365, Feb. 2007. [CrossRef]
- C. Hofsäß, E. Lindahl, and O. Edholm, “Molecular Dynamics Simulations of Phospholipid Bilayers with Cholesterol,” Biophys J, vol. 84, no. 4, p. 2192, Apr. 2003. [CrossRef]
- W. Kulig et al., “How well does cholesteryl hemisuccinate mimic cholesterol in saturated phospholipid bilayers?,” J Mol Model, vol. 20, no. 2, pp. 1–9, Feb. 2014. [CrossRef]
- S. S. Qin, Z. W. Yu, and Y. X. Yu, “Structural characterization on the gel to liquid-crystal phase transition of fully hydrated DSPC and DSPE bilayers,” J Phys Chem B, vol. 113, no. 23, pp. 8114–8123, Jun. 2009. [CrossRef]
- Berger, O. Edholm, and F. Jähnig, “Molecular dynamics simulations of a fluid bilayer of dipalmitoylphosphatidylcholine at full hydration, constant pressure, and constant temperature,” Biophys J, vol. 72, no. 5, pp. 2002–2013, 1997. [CrossRef]
- L. Sun and R. A. Böckmann, “Membrane phase transition during heating and cooling: molecular insight into reversible melting,” European Biophysics Journal, vol. 47, no. 2, pp. 151–164, Mar. 2018. [CrossRef]
- D. Meleleo, “Study of resveratrol’s interaction with planar lipid models: Insights into its location in lipid bilayers,” Membranes (Basel), vol. 11, no. 2, pp. 1–17, Feb. 2021. [CrossRef]
- X. Y. Guo, C. Peschel, T. Watermann, G. F. von Rudorff, and D. Sebastiani, “Cluster formation of polyphilic molecules solvated in a DPPC bilayer,” Polymers (Basel), vol. 9, no. 10, Oct. 2017. [CrossRef]
- S. Neupane, G. Cordoyiannis, F. U. Renner, and P. Losada-Pérez, “Real-Time monitoring of interactions between solid-supported lipid vesicle layers and shortand medium-chain length alcohols: Ethanol and 1-pentanol,” Biomimetics, vol. 4, no. 1, Mar. 2019. [CrossRef]
- Y. Dai, Z. Xie, and L. Liang, “Pore Formation Mechanism of A-Beta Peptide on the Fluid Membrane: A Combined Coarse-Grained and All-Atomic Model,” Molecules, vol. 27, no. 12, Jun. 2022. [CrossRef]
- Q. Yin, X. Shi, H. Ding, X. Dai, G. Wan, and Y. Qiao, “Interactions of borneol with DPPC phospholipid membranes: A molecular dynamics simulation study,” Int J Mol Sci, vol. 15, no. 11, pp. 20365–20381, Sep. 2014. [CrossRef]
Figure 1.
Final configuration at the end of the NPT MD simulation of 200 ns on a system of 256 DPPC and 7712 water molecules at 1 bar. The red and yellow spheres represent the headgroup P and N atoms, respectively. The blue and cyan colours represent the solvent (water) and the acyl chain, respectively. (b) A single DPPC molecule in united-atom representation. Green colour corresponds to methylene units. The nematic directors the two vectors, connecting atom P with the terminal carbon atoms of the two dangling acyl chains are shown by blue dashed lines.
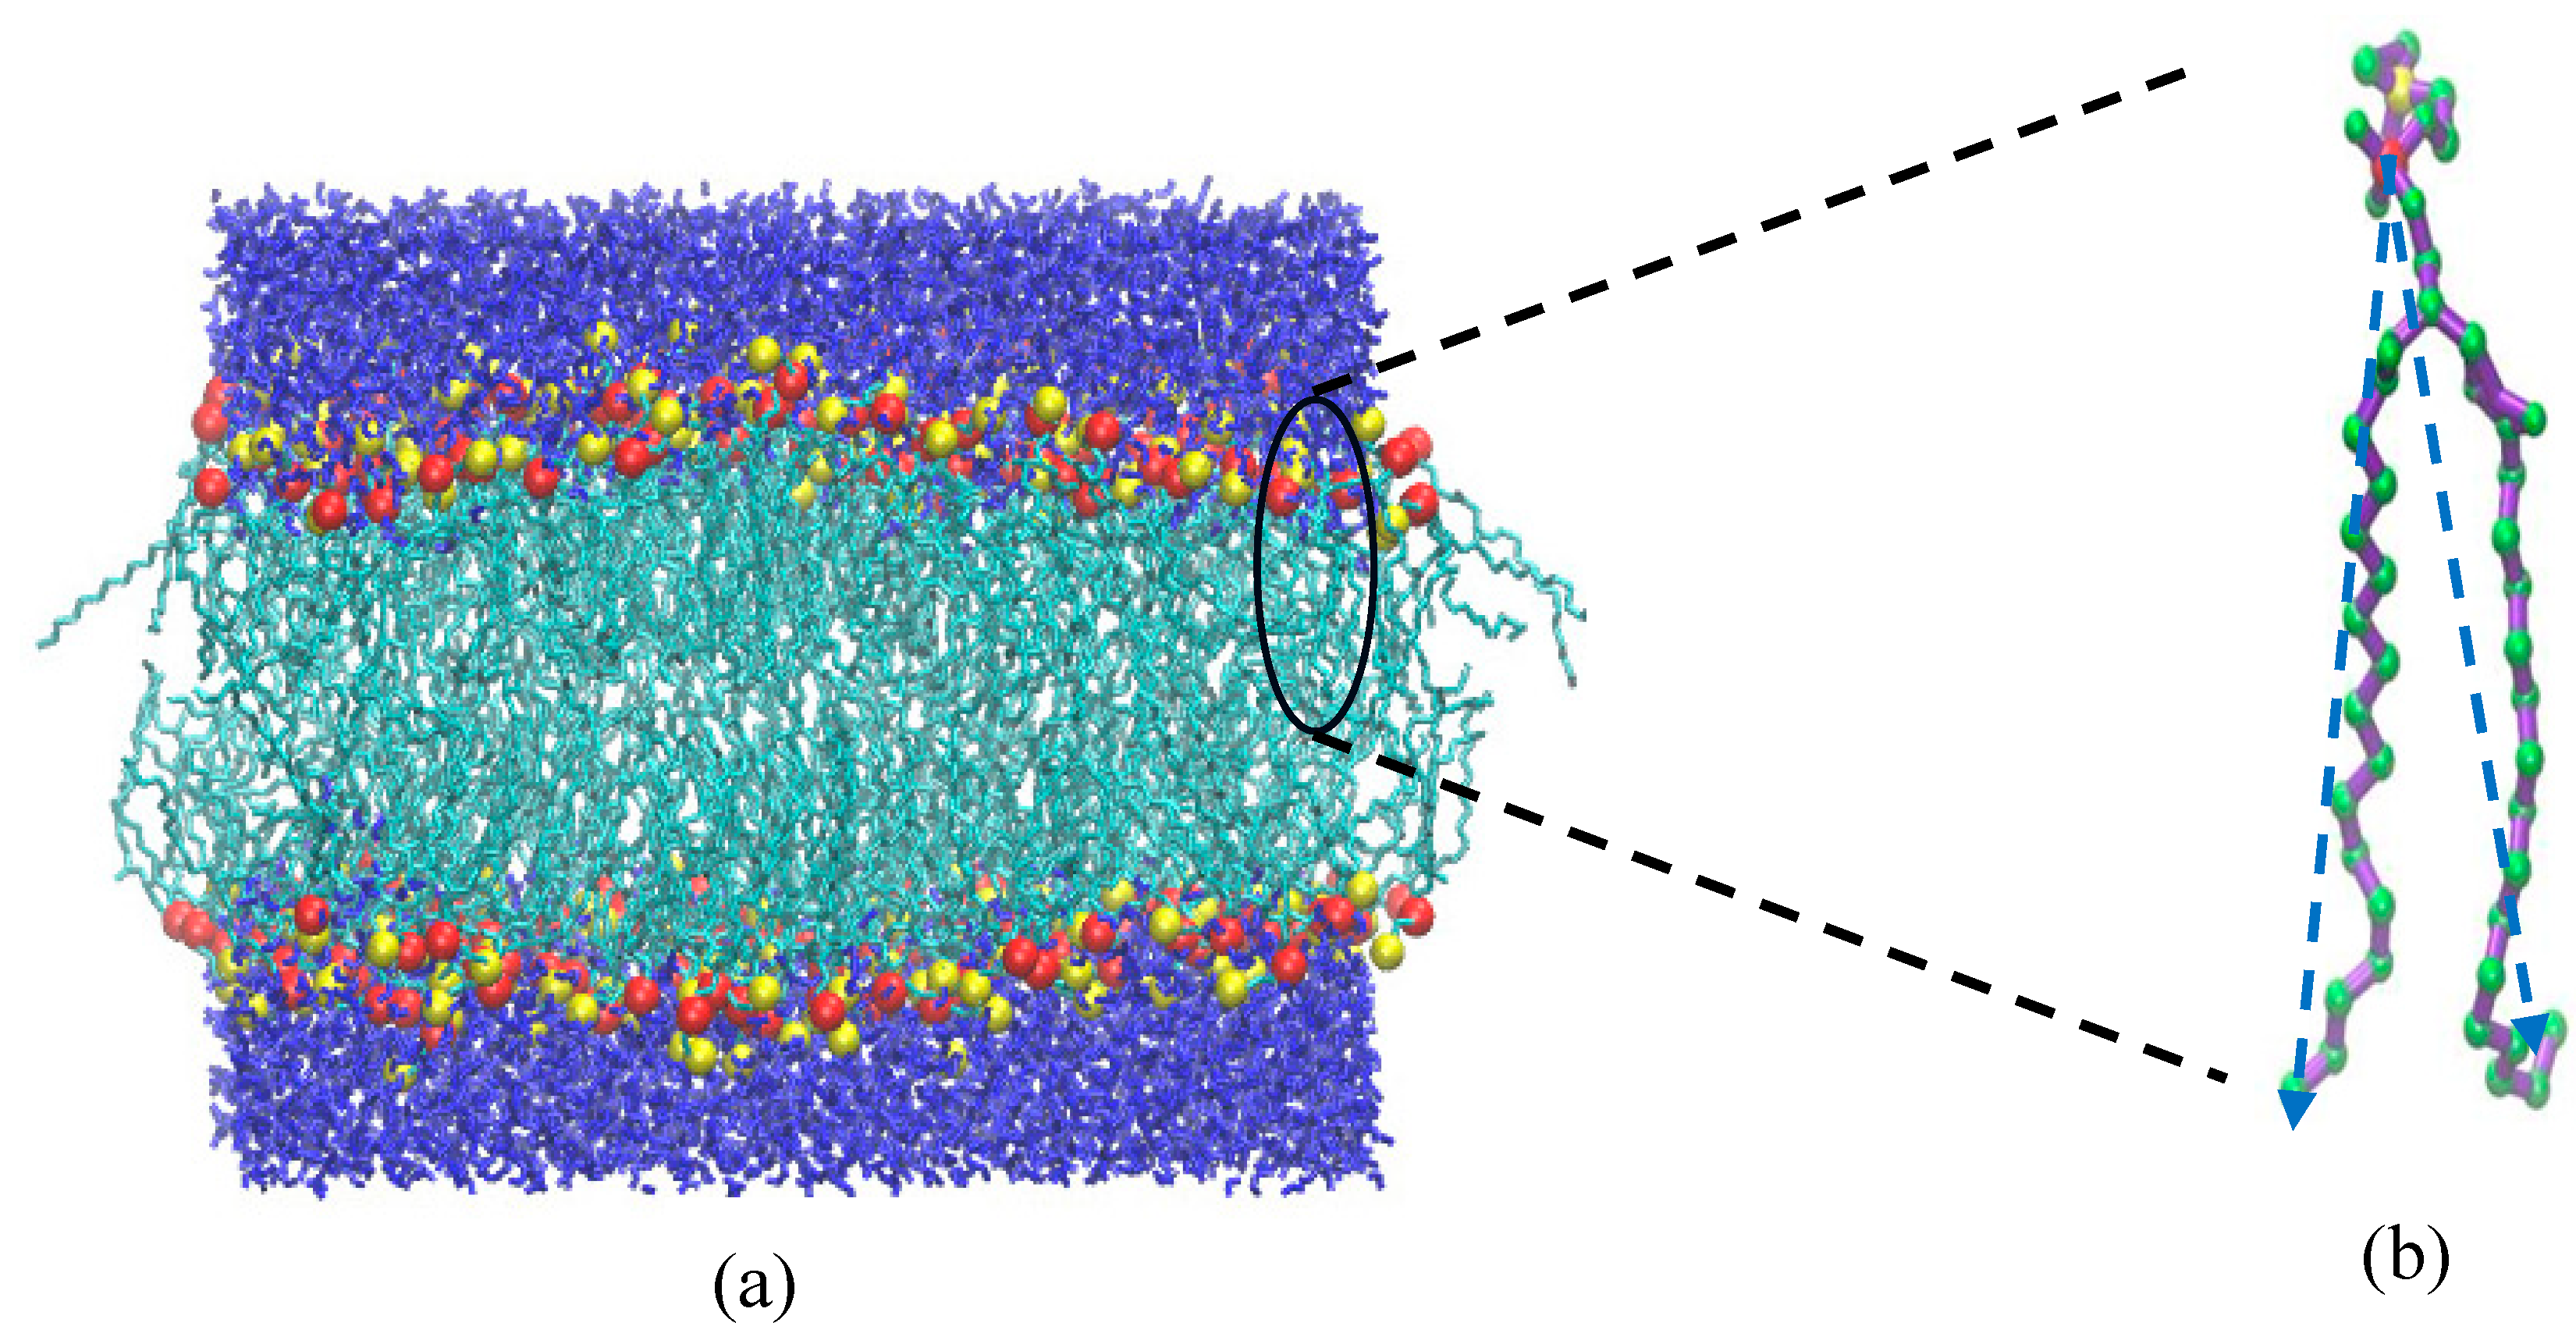
Figure 2.
Area per lipid (APL) versus time for simulations corresponding to compression. Pressure, here and in the rest of the figures, is reported in bar.
Figure 2.
Area per lipid (APL) versus time for simulations corresponding to compression. Pressure, here and in the rest of the figures, is reported in bar.
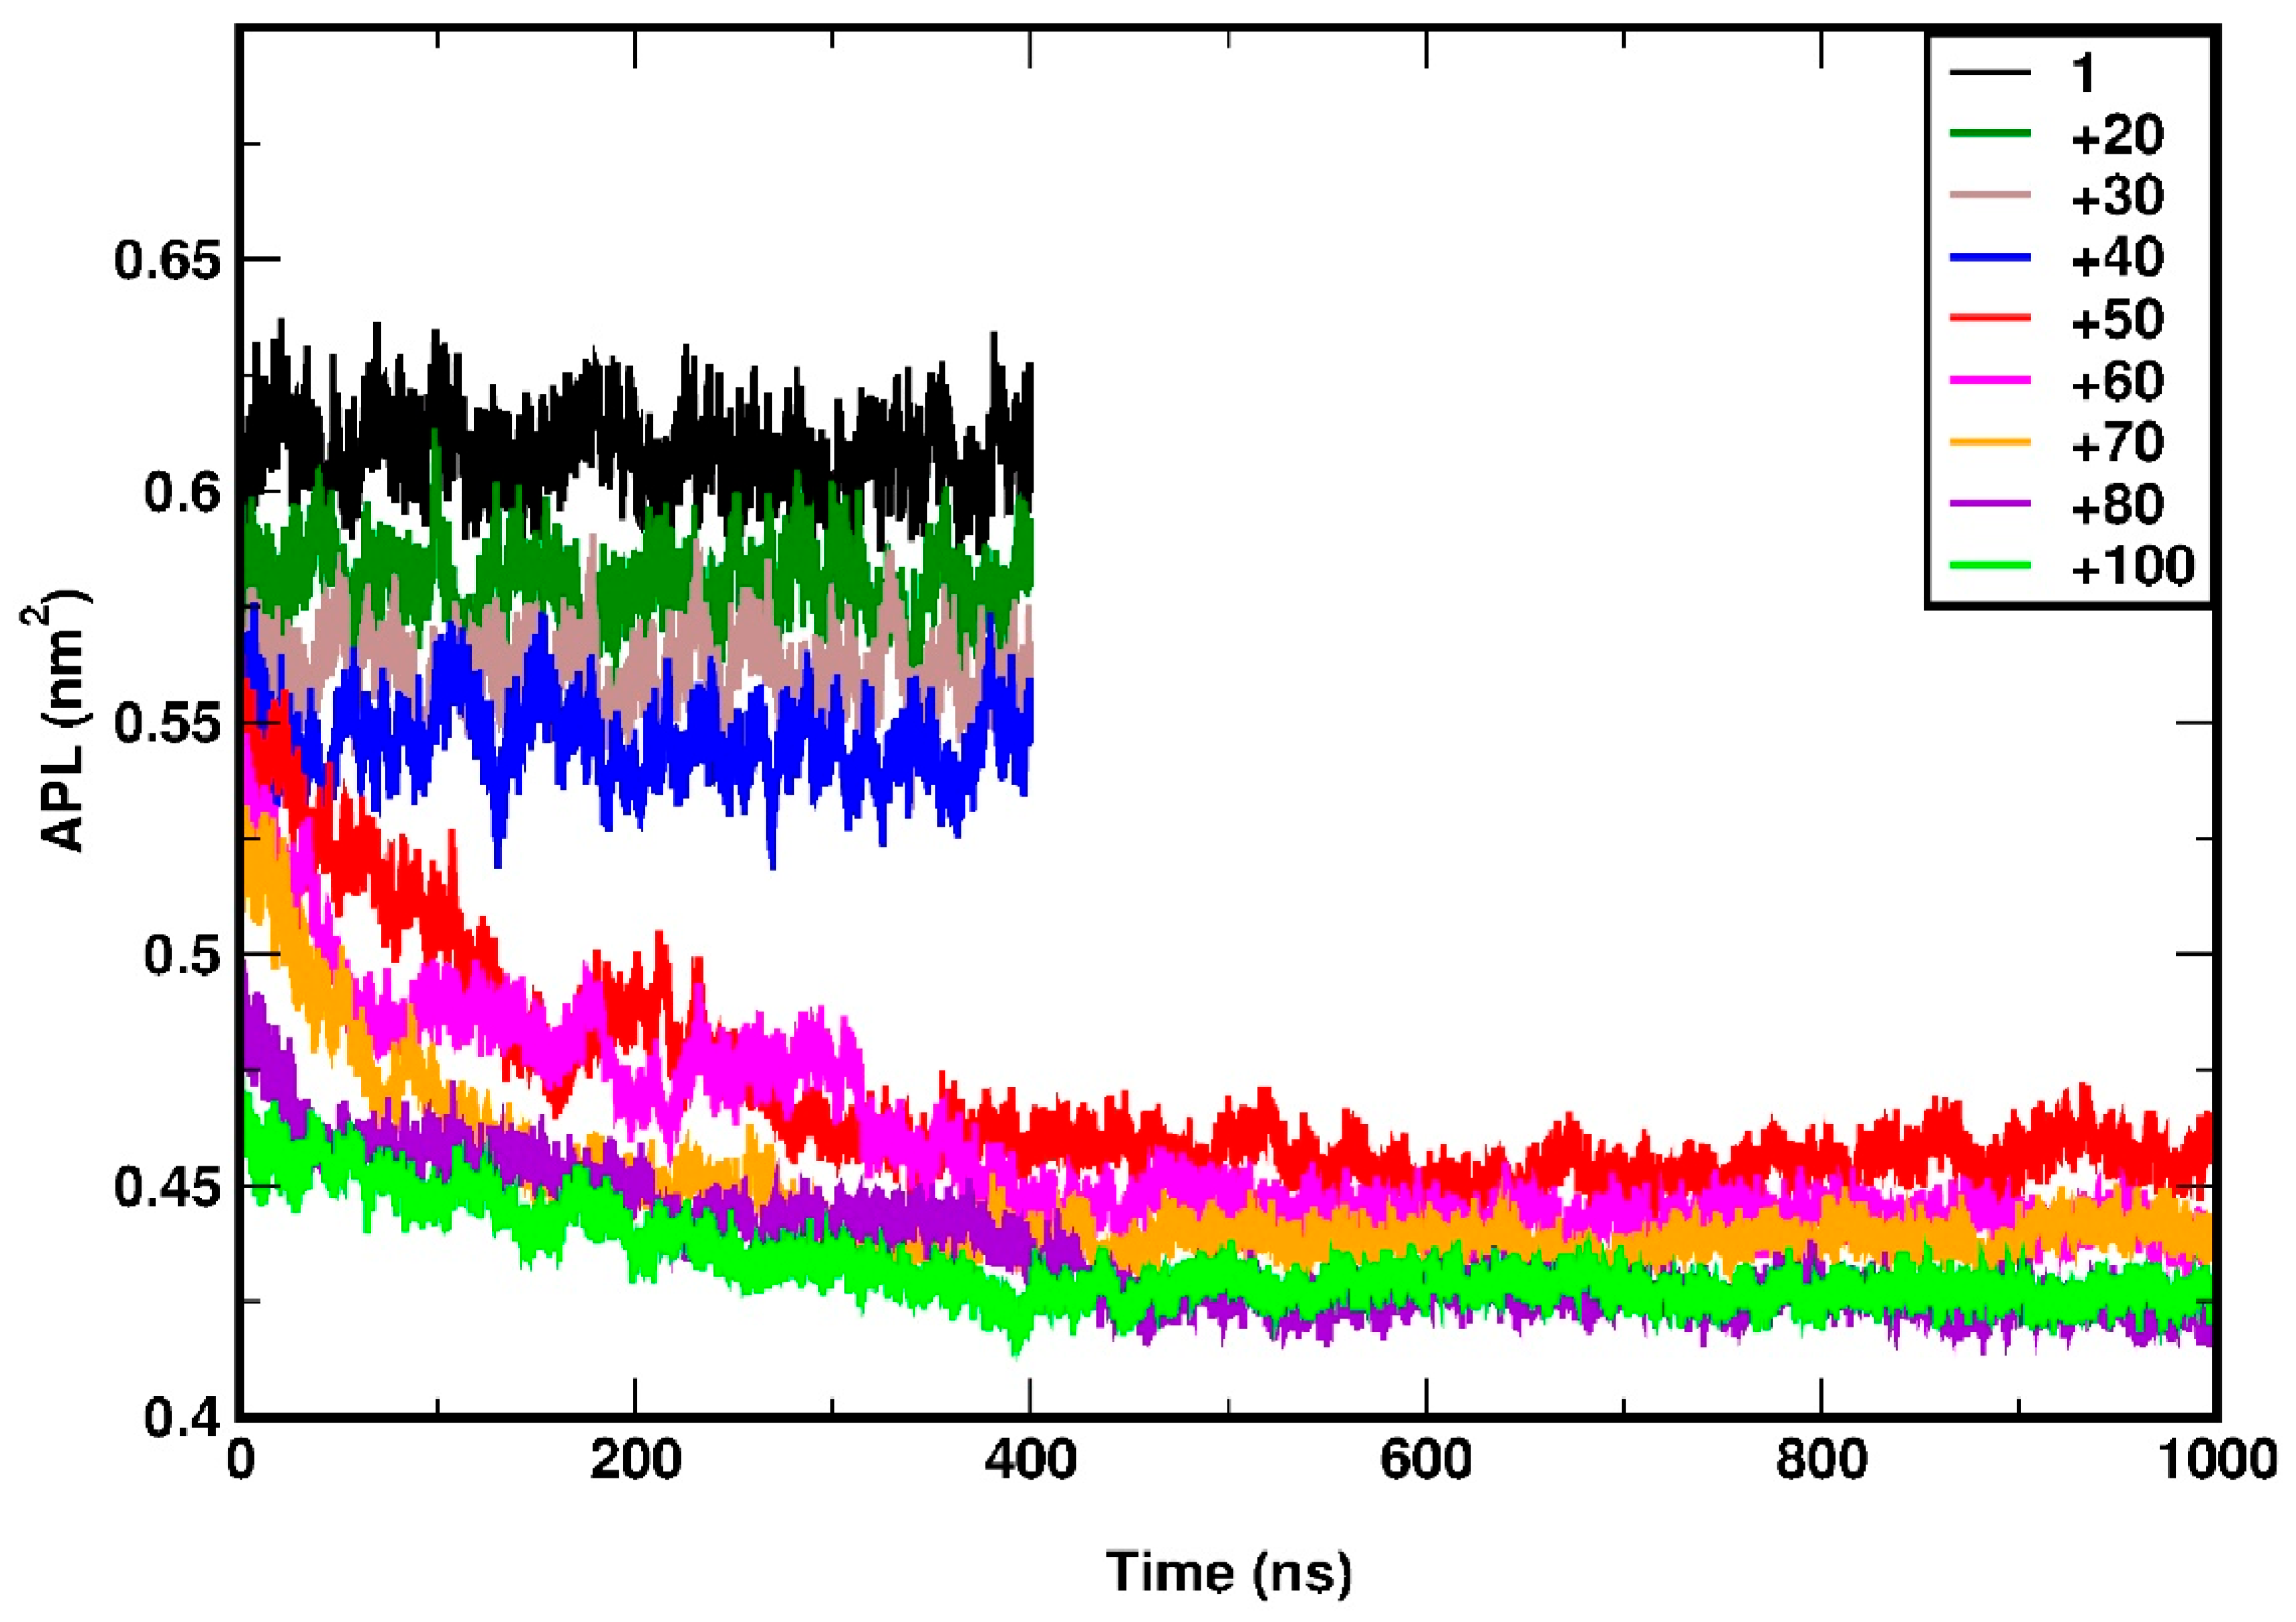
Figure 3.
Mass density profile of DPPC headgroups for compression (panel a) and stretching (panel b). Variation of area per lipid, APL and variance, , for compression (panel c) and stretching (panel d). The dashed lines in panel d show the best linear fit on the simulation data.
Figure 3.
Mass density profile of DPPC headgroups for compression (panel a) and stretching (panel b). Variation of area per lipid, APL and variance, , for compression (panel c) and stretching (panel d). The dashed lines in panel d show the best linear fit on the simulation data.
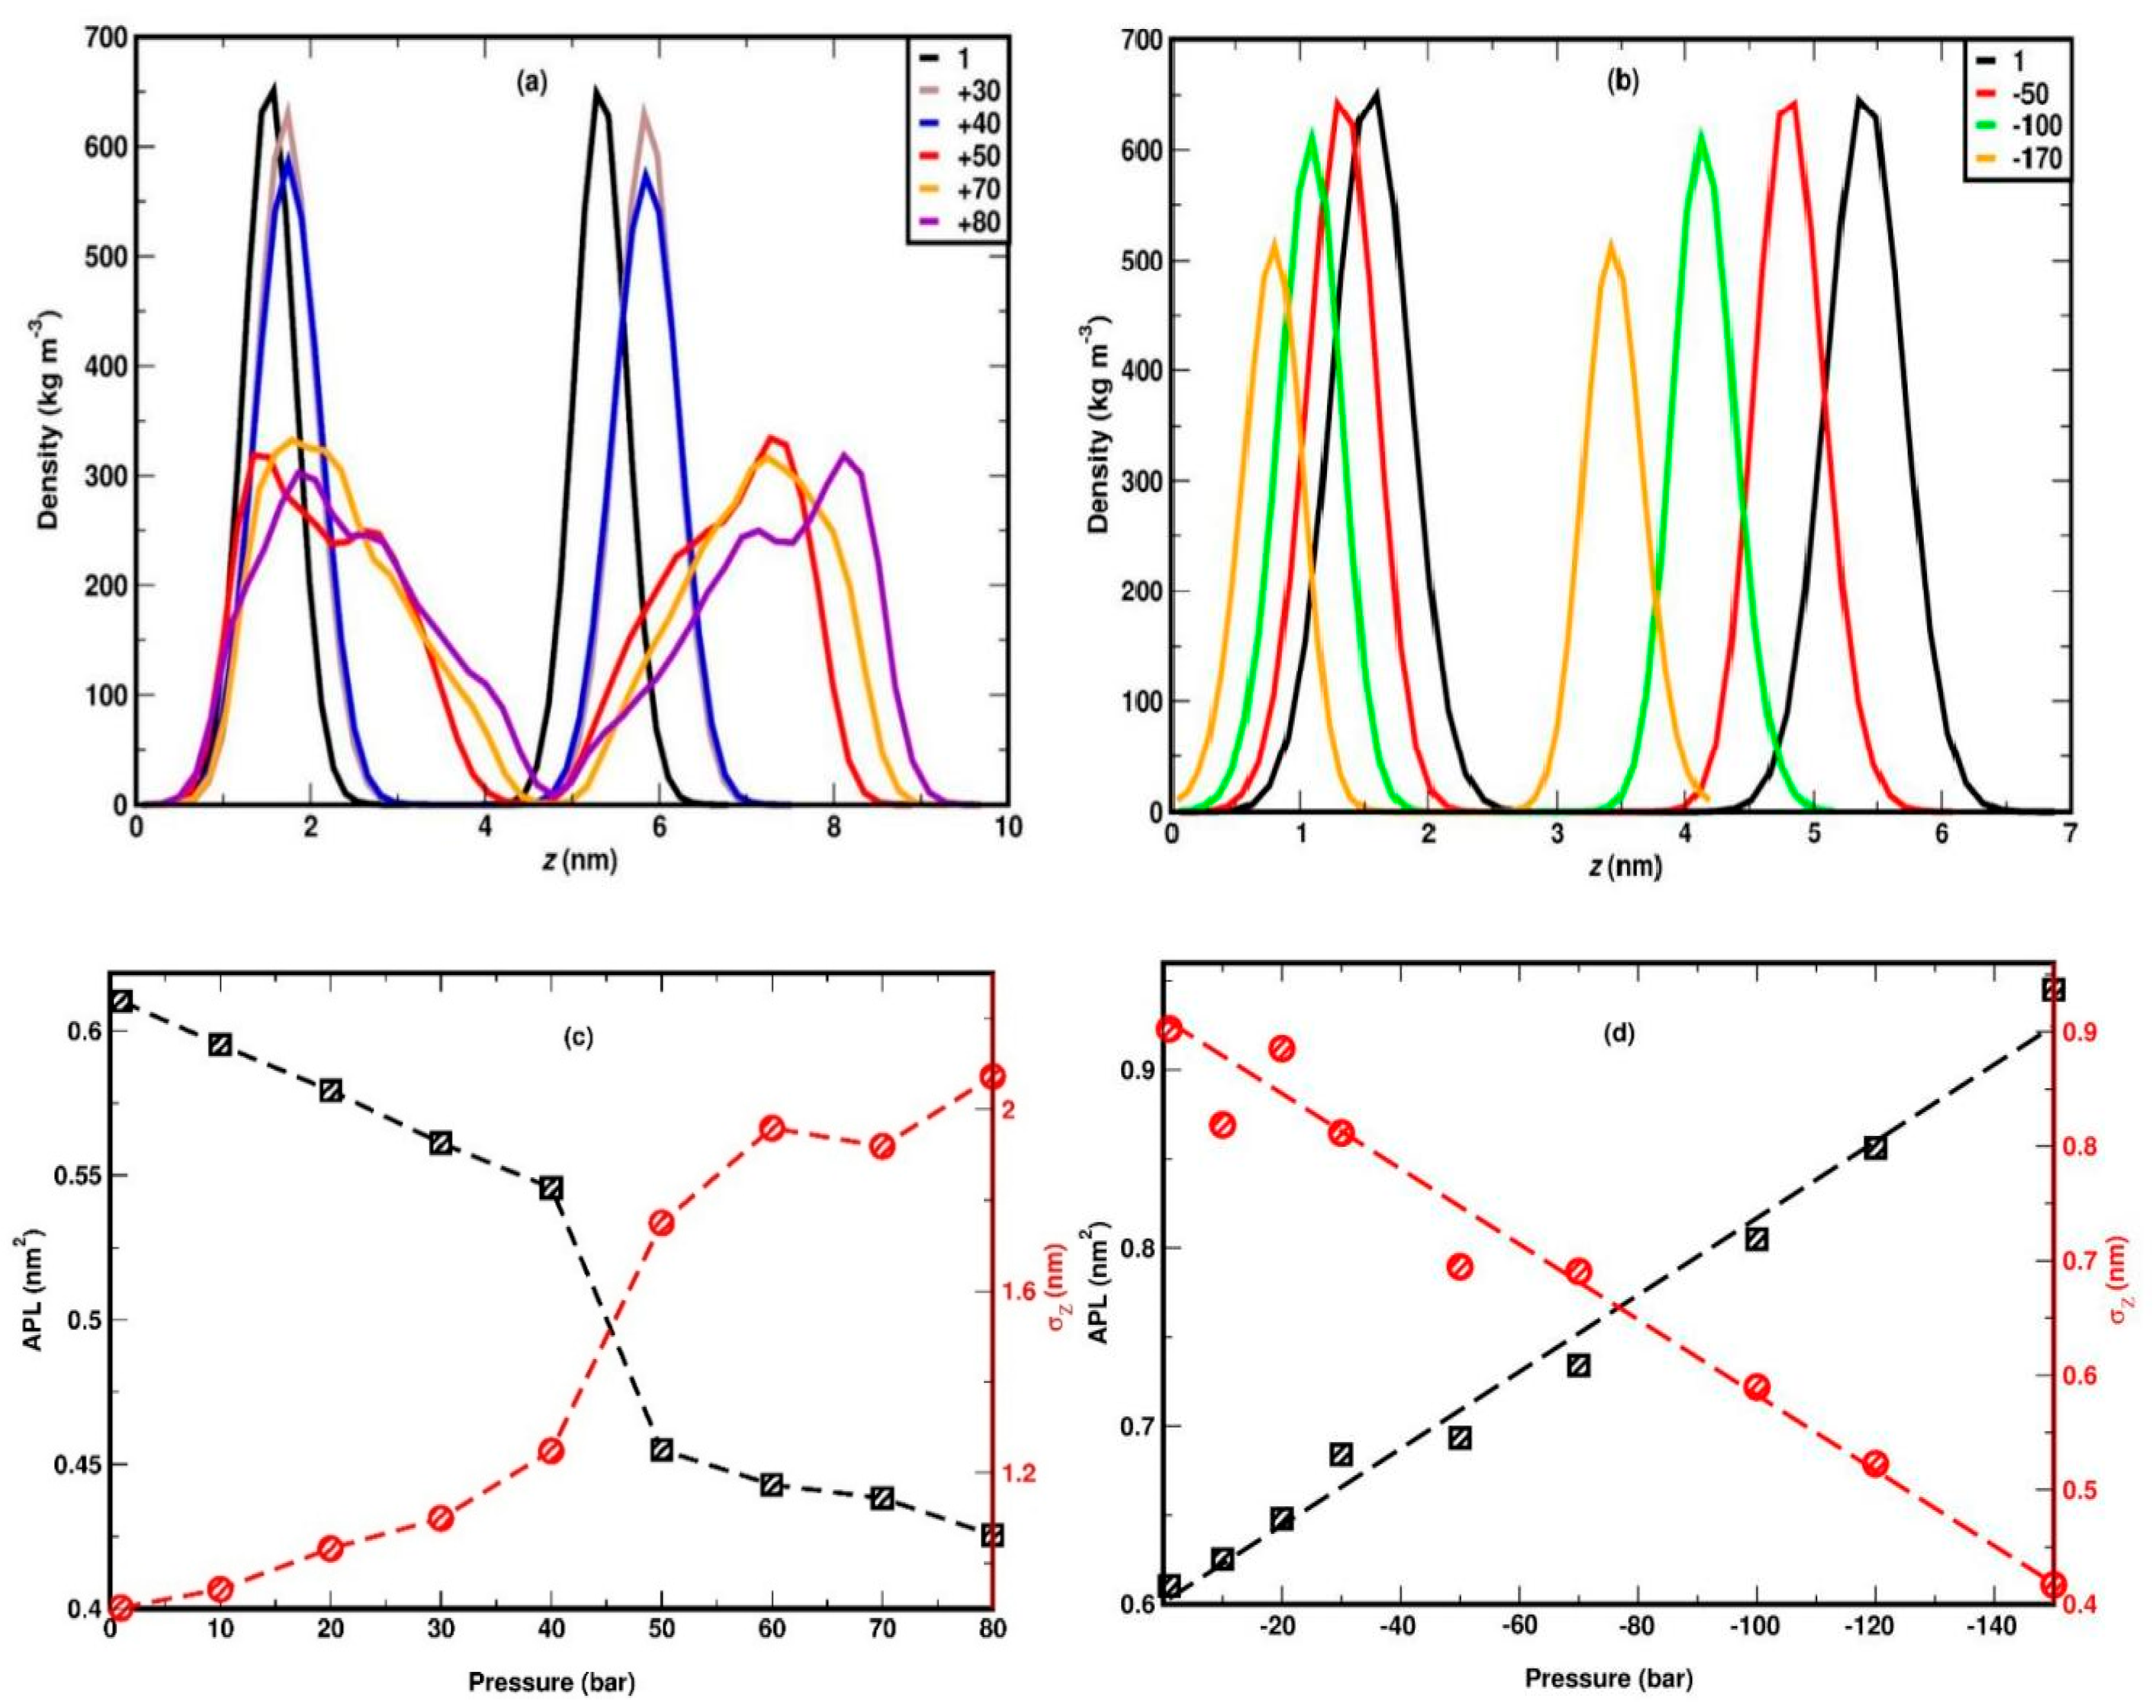
Figure 4.
(a-f) Snapshots of pure DPPC membrane during compression at 1, 20, 40, 50, 60, and 100 bar, respectively. Color convention and atom representation follow that of Fig. 1.
Figure 4.
(a-f) Snapshots of pure DPPC membrane during compression at 1, 20, 40, 50, 60, and 100 bar, respectively. Color convention and atom representation follow that of Fig. 1.
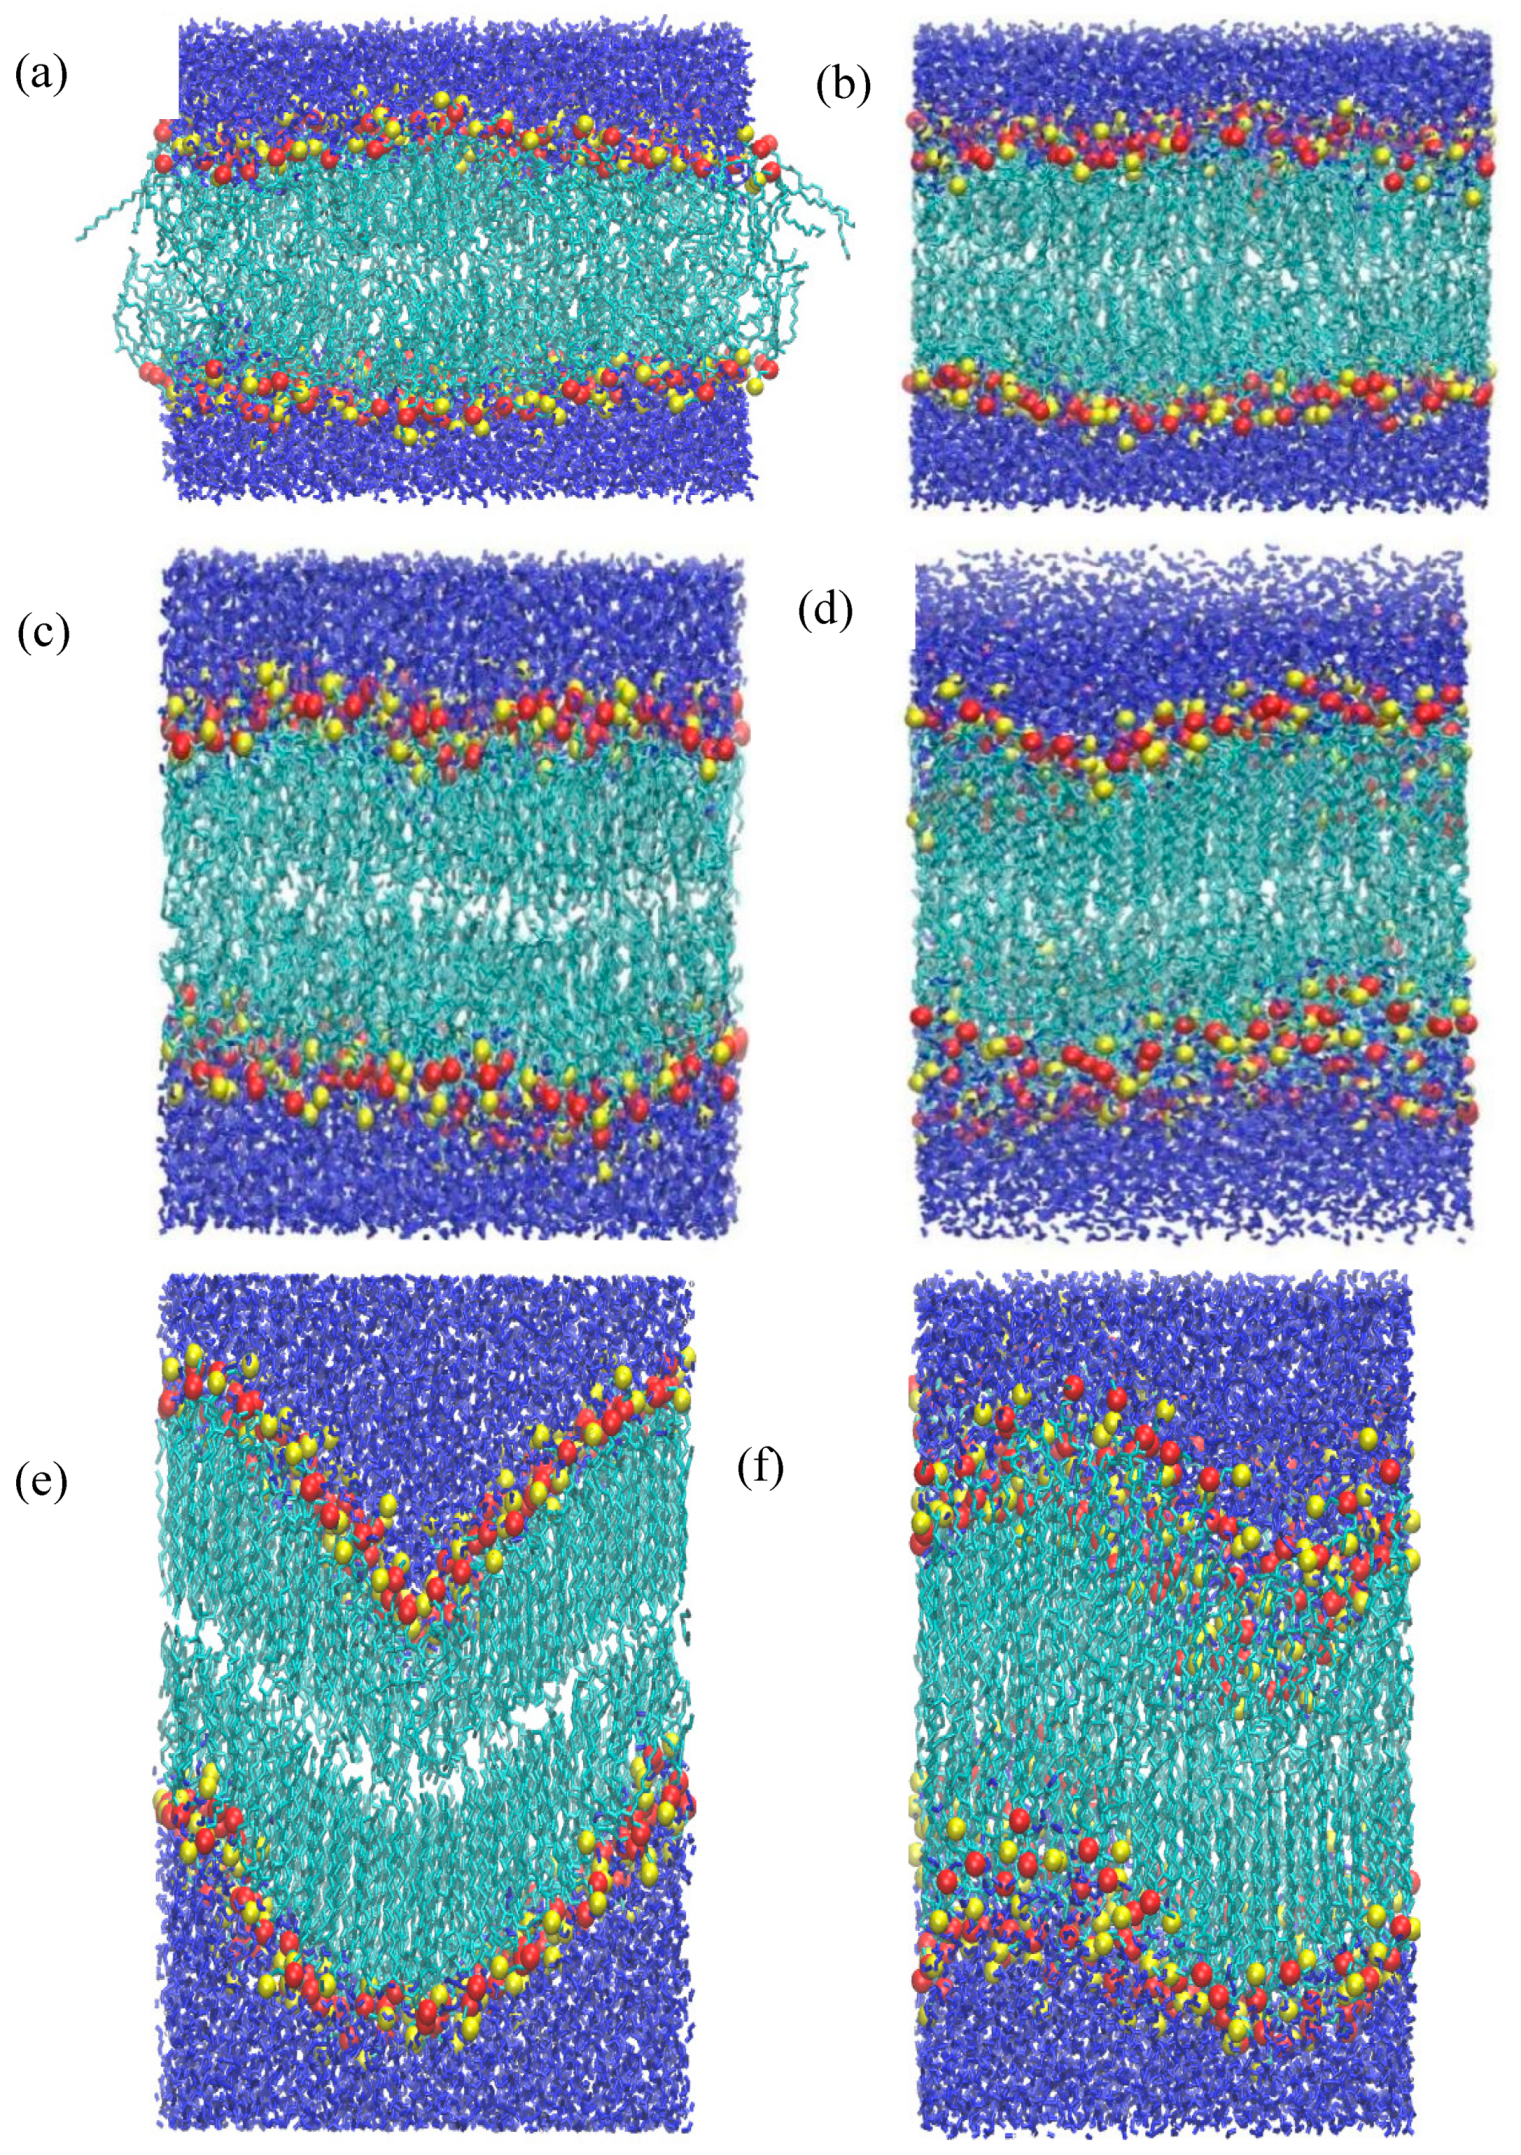
Figure 5.
Mass density profile of DPPC headgroups for compression (LL) for different time intervals along the simulation.
Figure 5.
Mass density profile of DPPC headgroups for compression (LL) for different time intervals along the simulation.
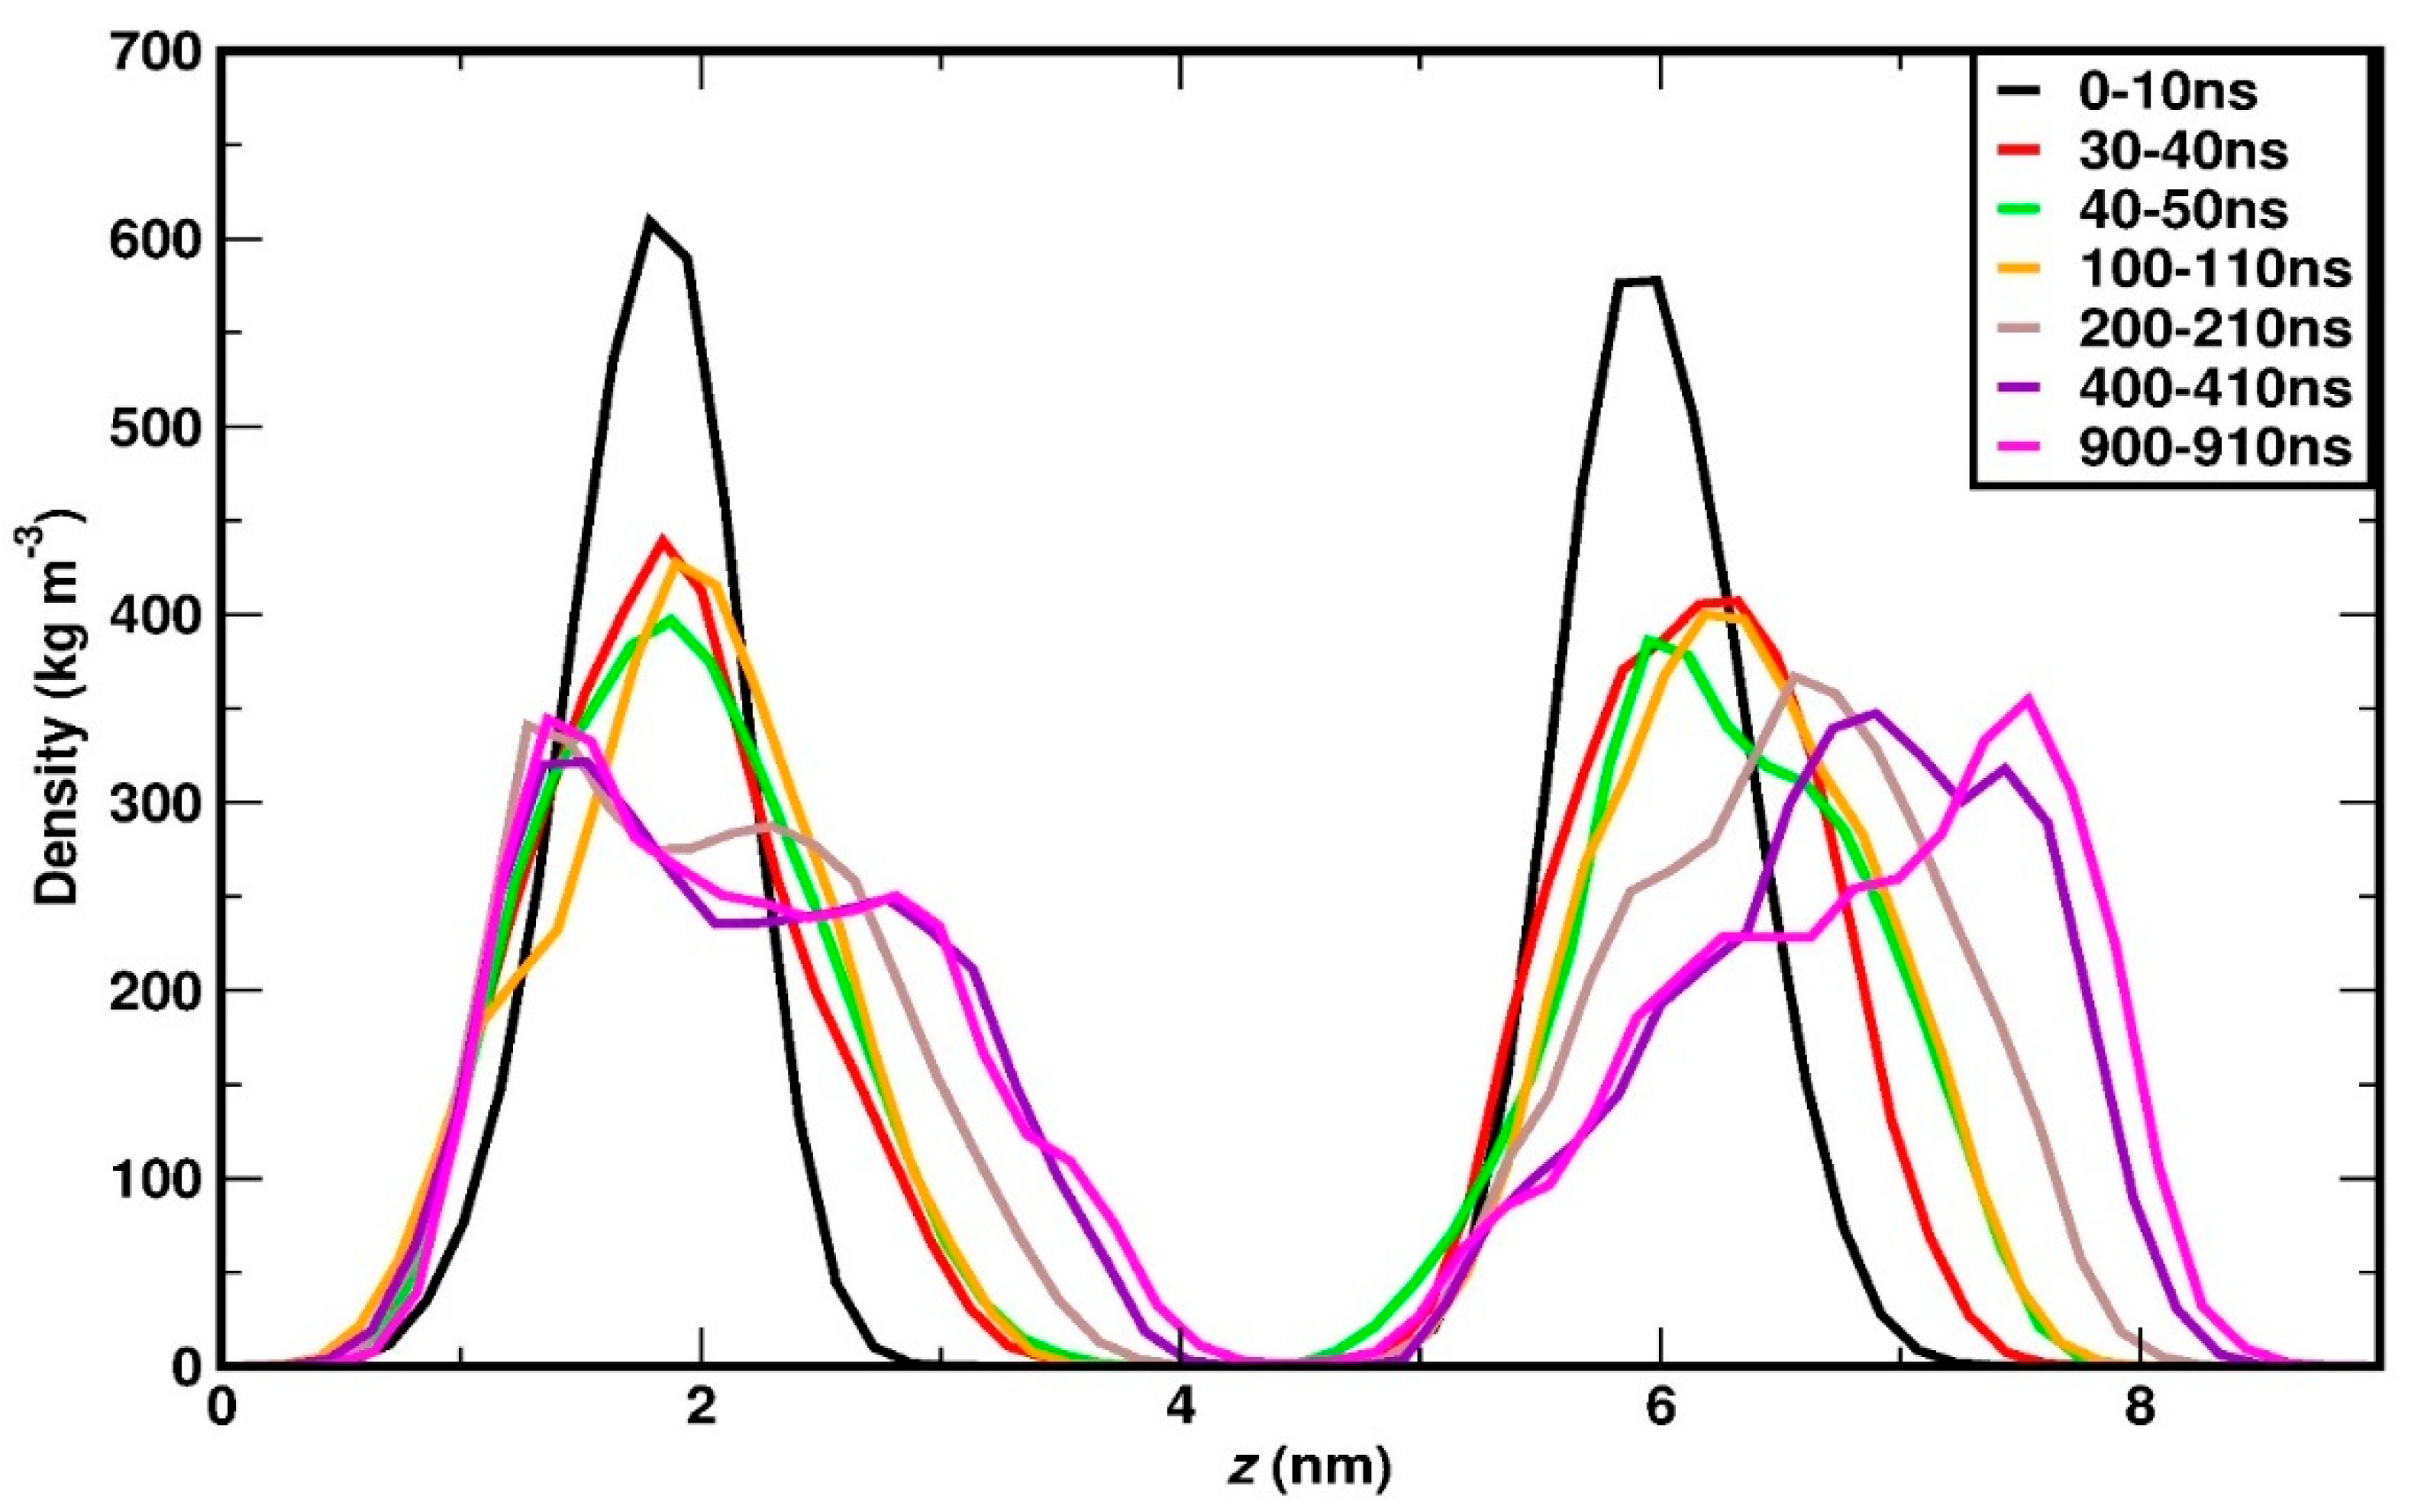
Figure 6.
(a) In the inset a coarse-grained sketch of the DPPC layer is depicted. The orange circle represents the headgroup and the straight lines, the acyl chains. The orange arrows correspond to the global nematic directors of the top and bottom leaflet. Configurations (i) and (ii) correspond to the cross tilt and tilt phases, respectively. Main panel: global nematic order parameter, S, (shown in red) and angular separation of the leaflet nematic vectors (shown in black) as a function of pressure. (b)The distribution of tilt angles for alternate carbon atoms vectors in both the acyl chains of DPPC molecule at different positive and negative pressures. (c) and (d) The (orientational) autocorrelation function, ACF for the vector defined between the same vector for compression (panel c) and stretching (panel d).
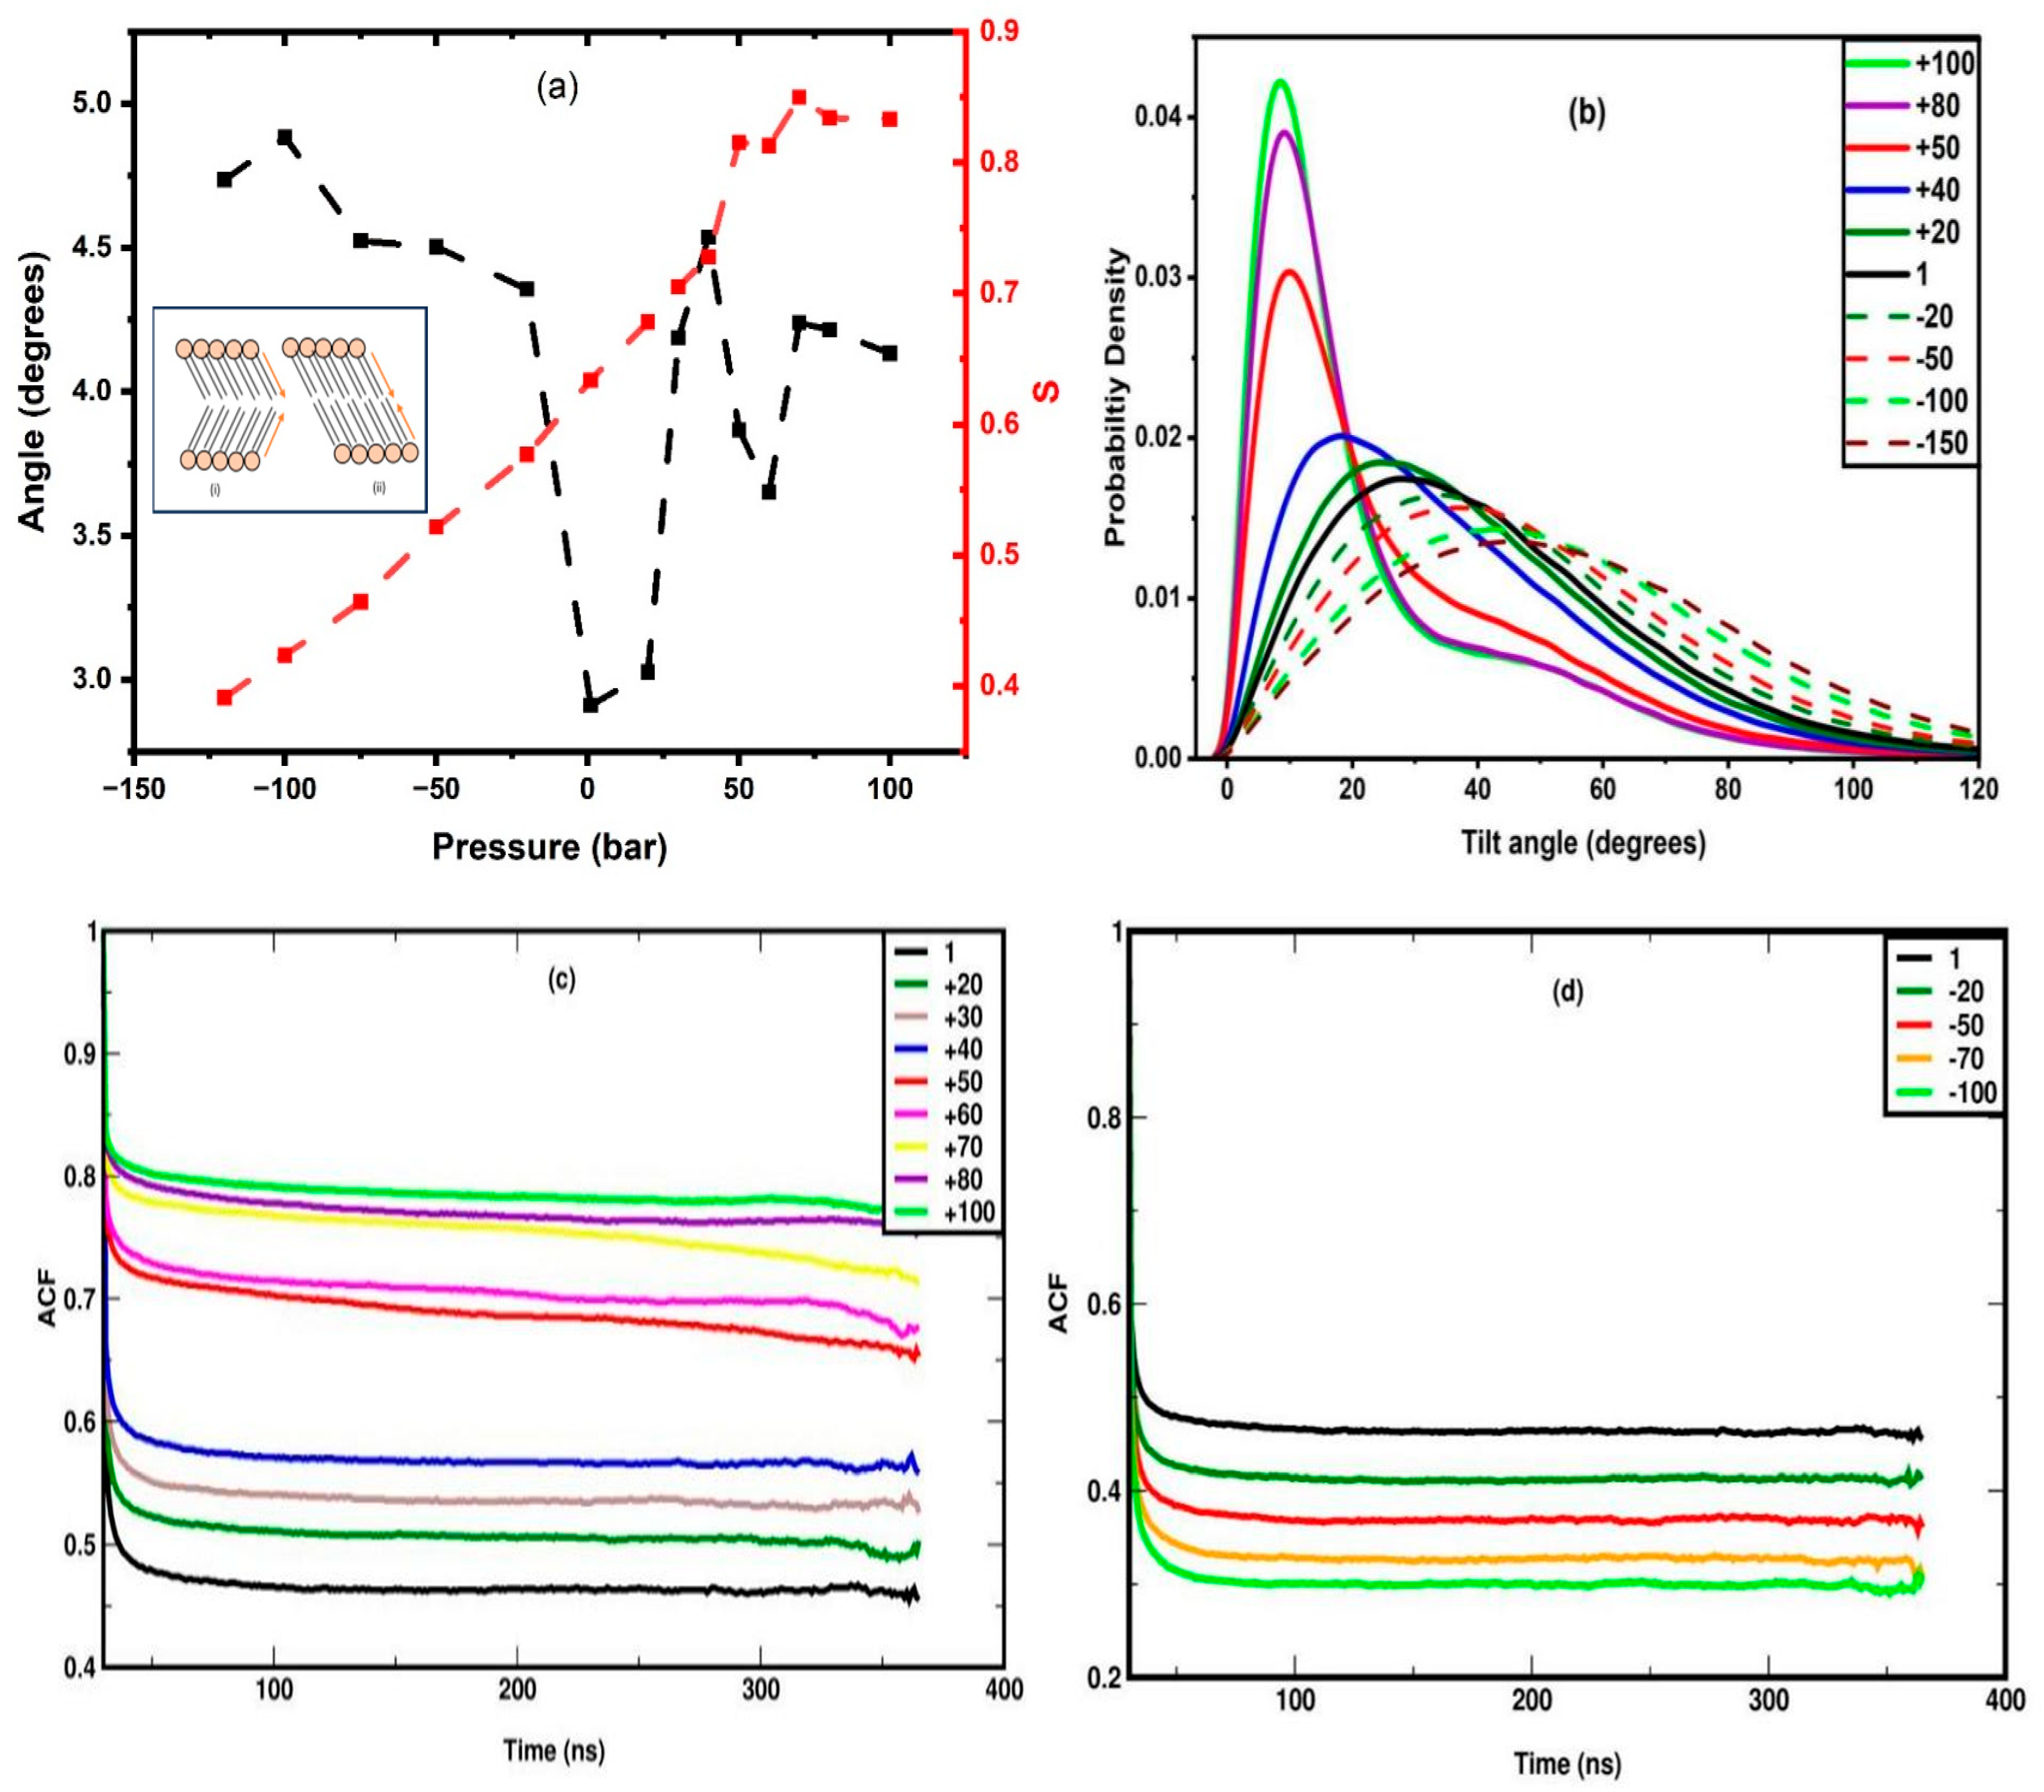
Figure 7.
(a-g) Snapshots of DPPC membrane during stretching at 1, -20, -50, -100, and -150 bar. Panels (f) and (g) focus on the onset (t = 104 ns) and completion (t = 106 ns), respectively, of rupture that occurs at -180 bar. In panels (f) and (g) the hydrophobic part of the membrane is omitted for visual clarity.
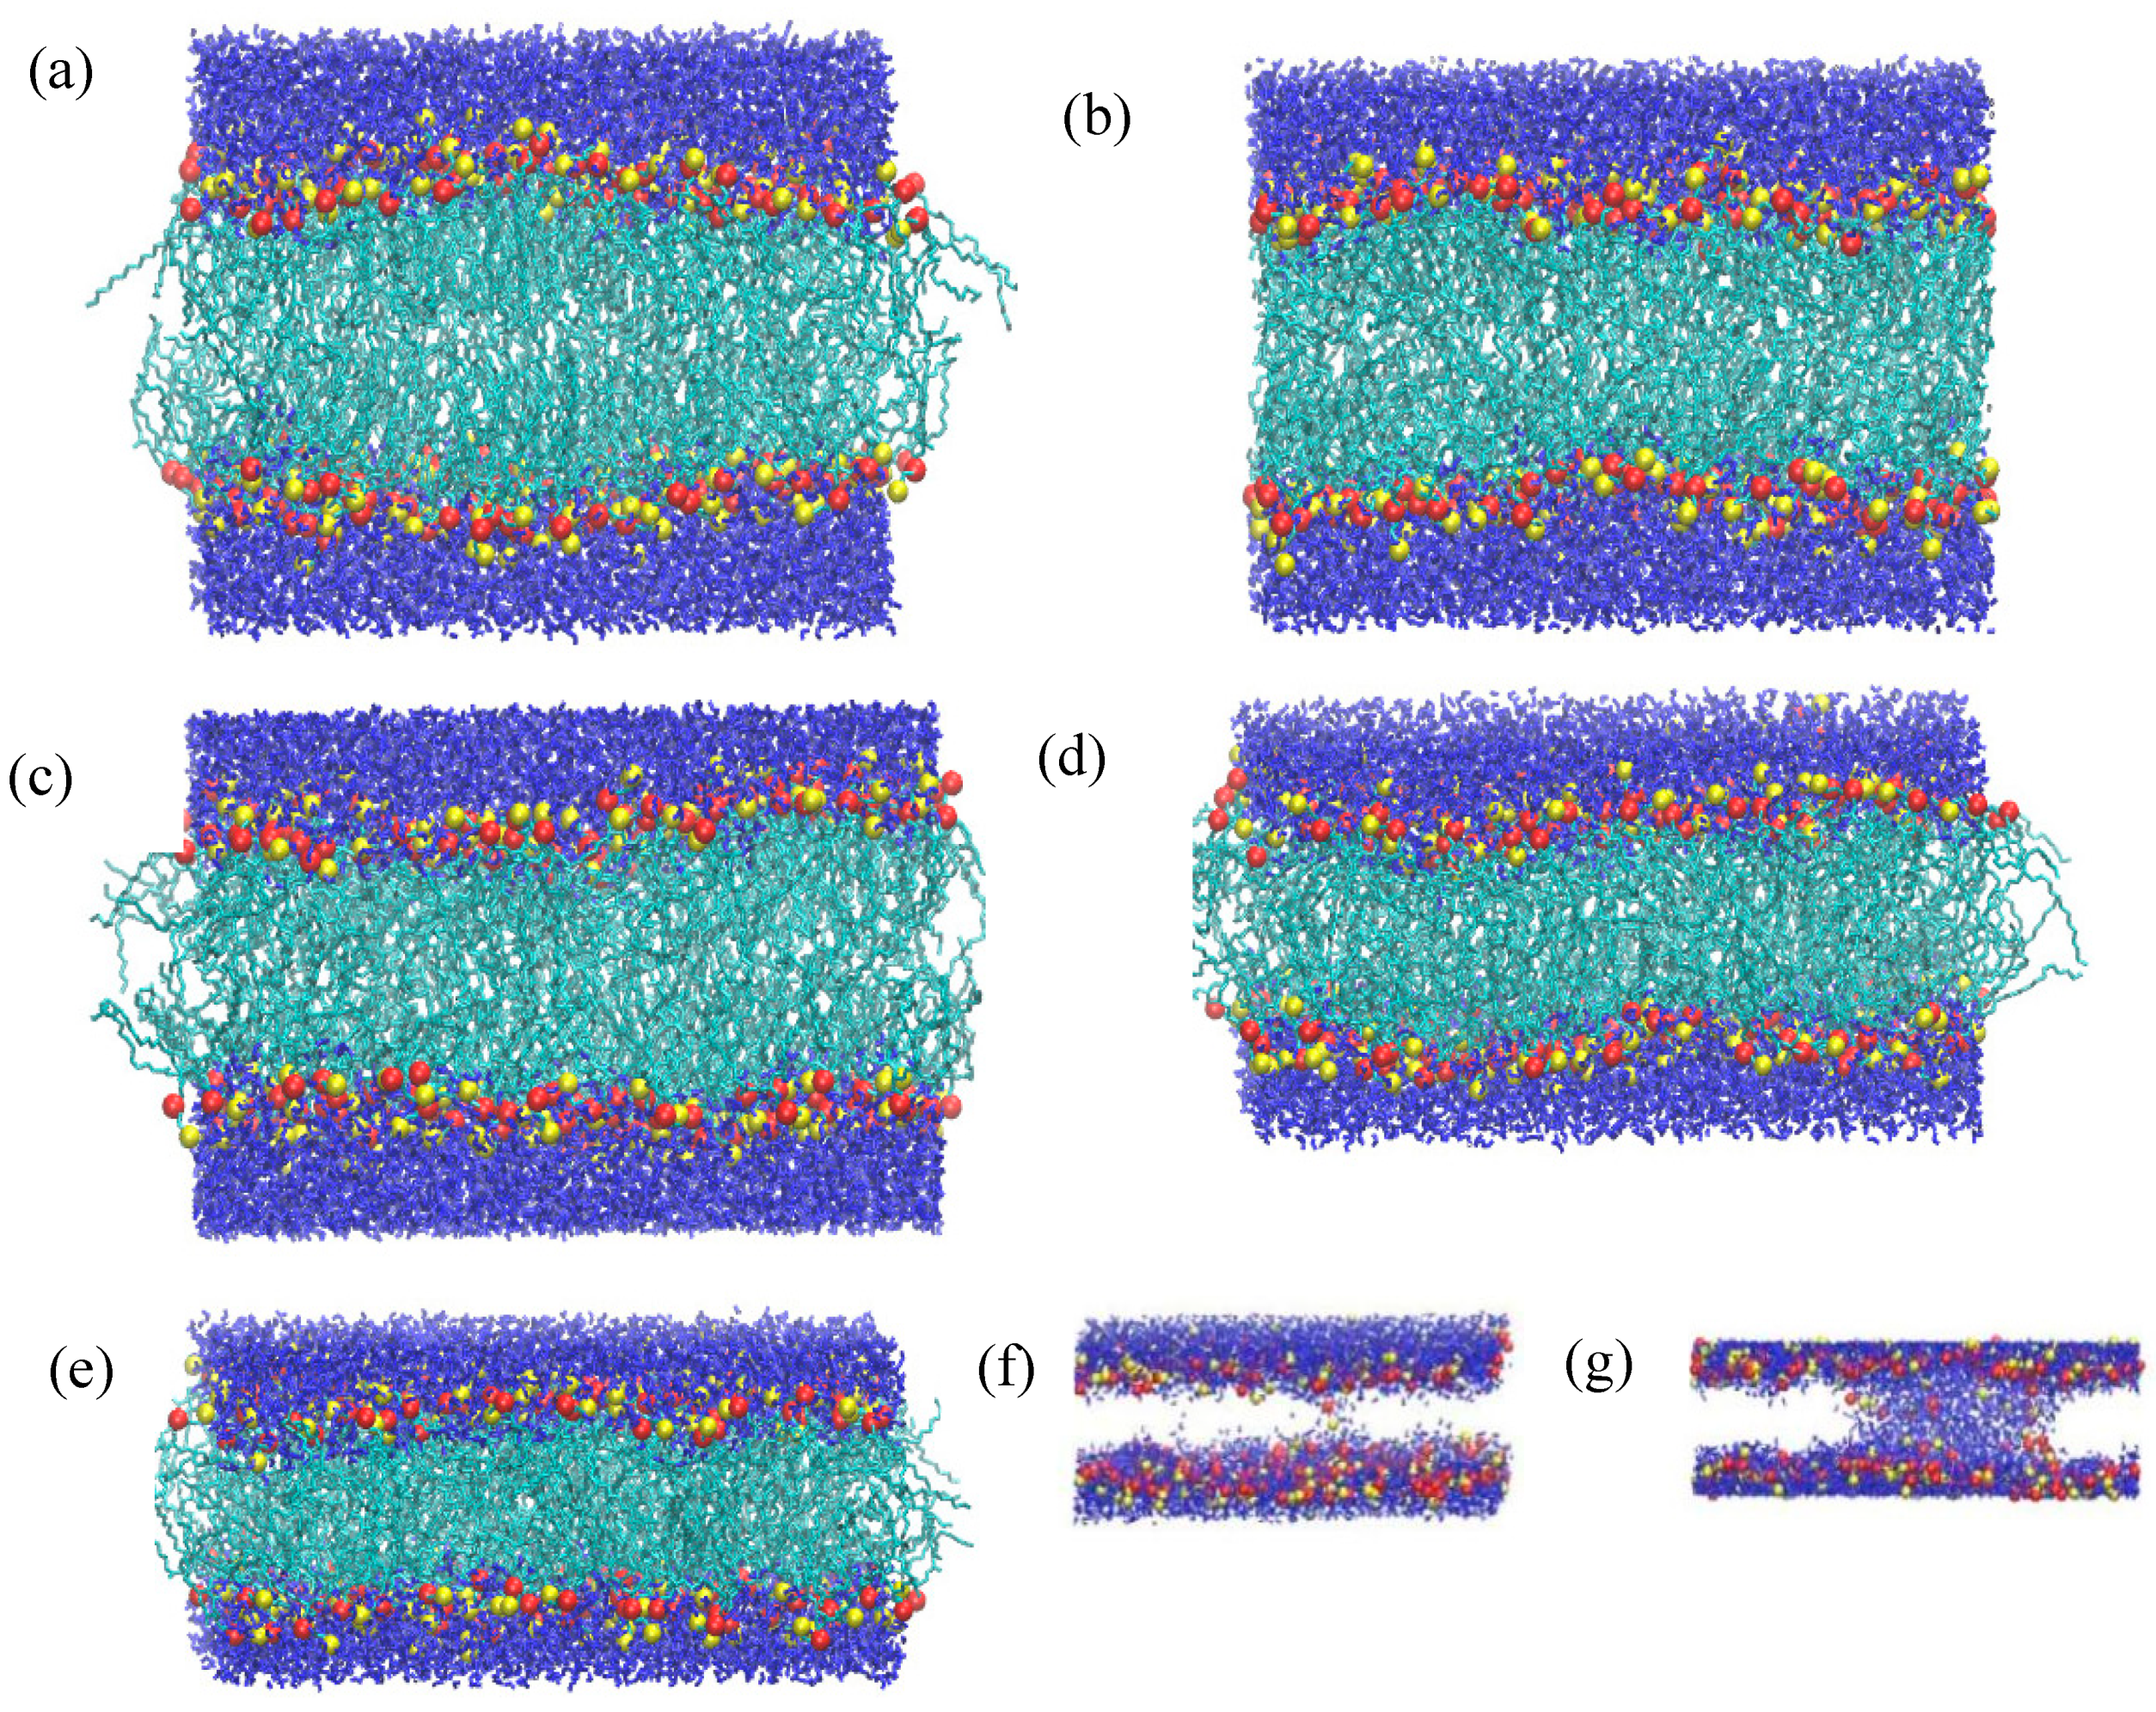
Figure 8.
Pressure hysteresis under (a) compression (b) stretching.
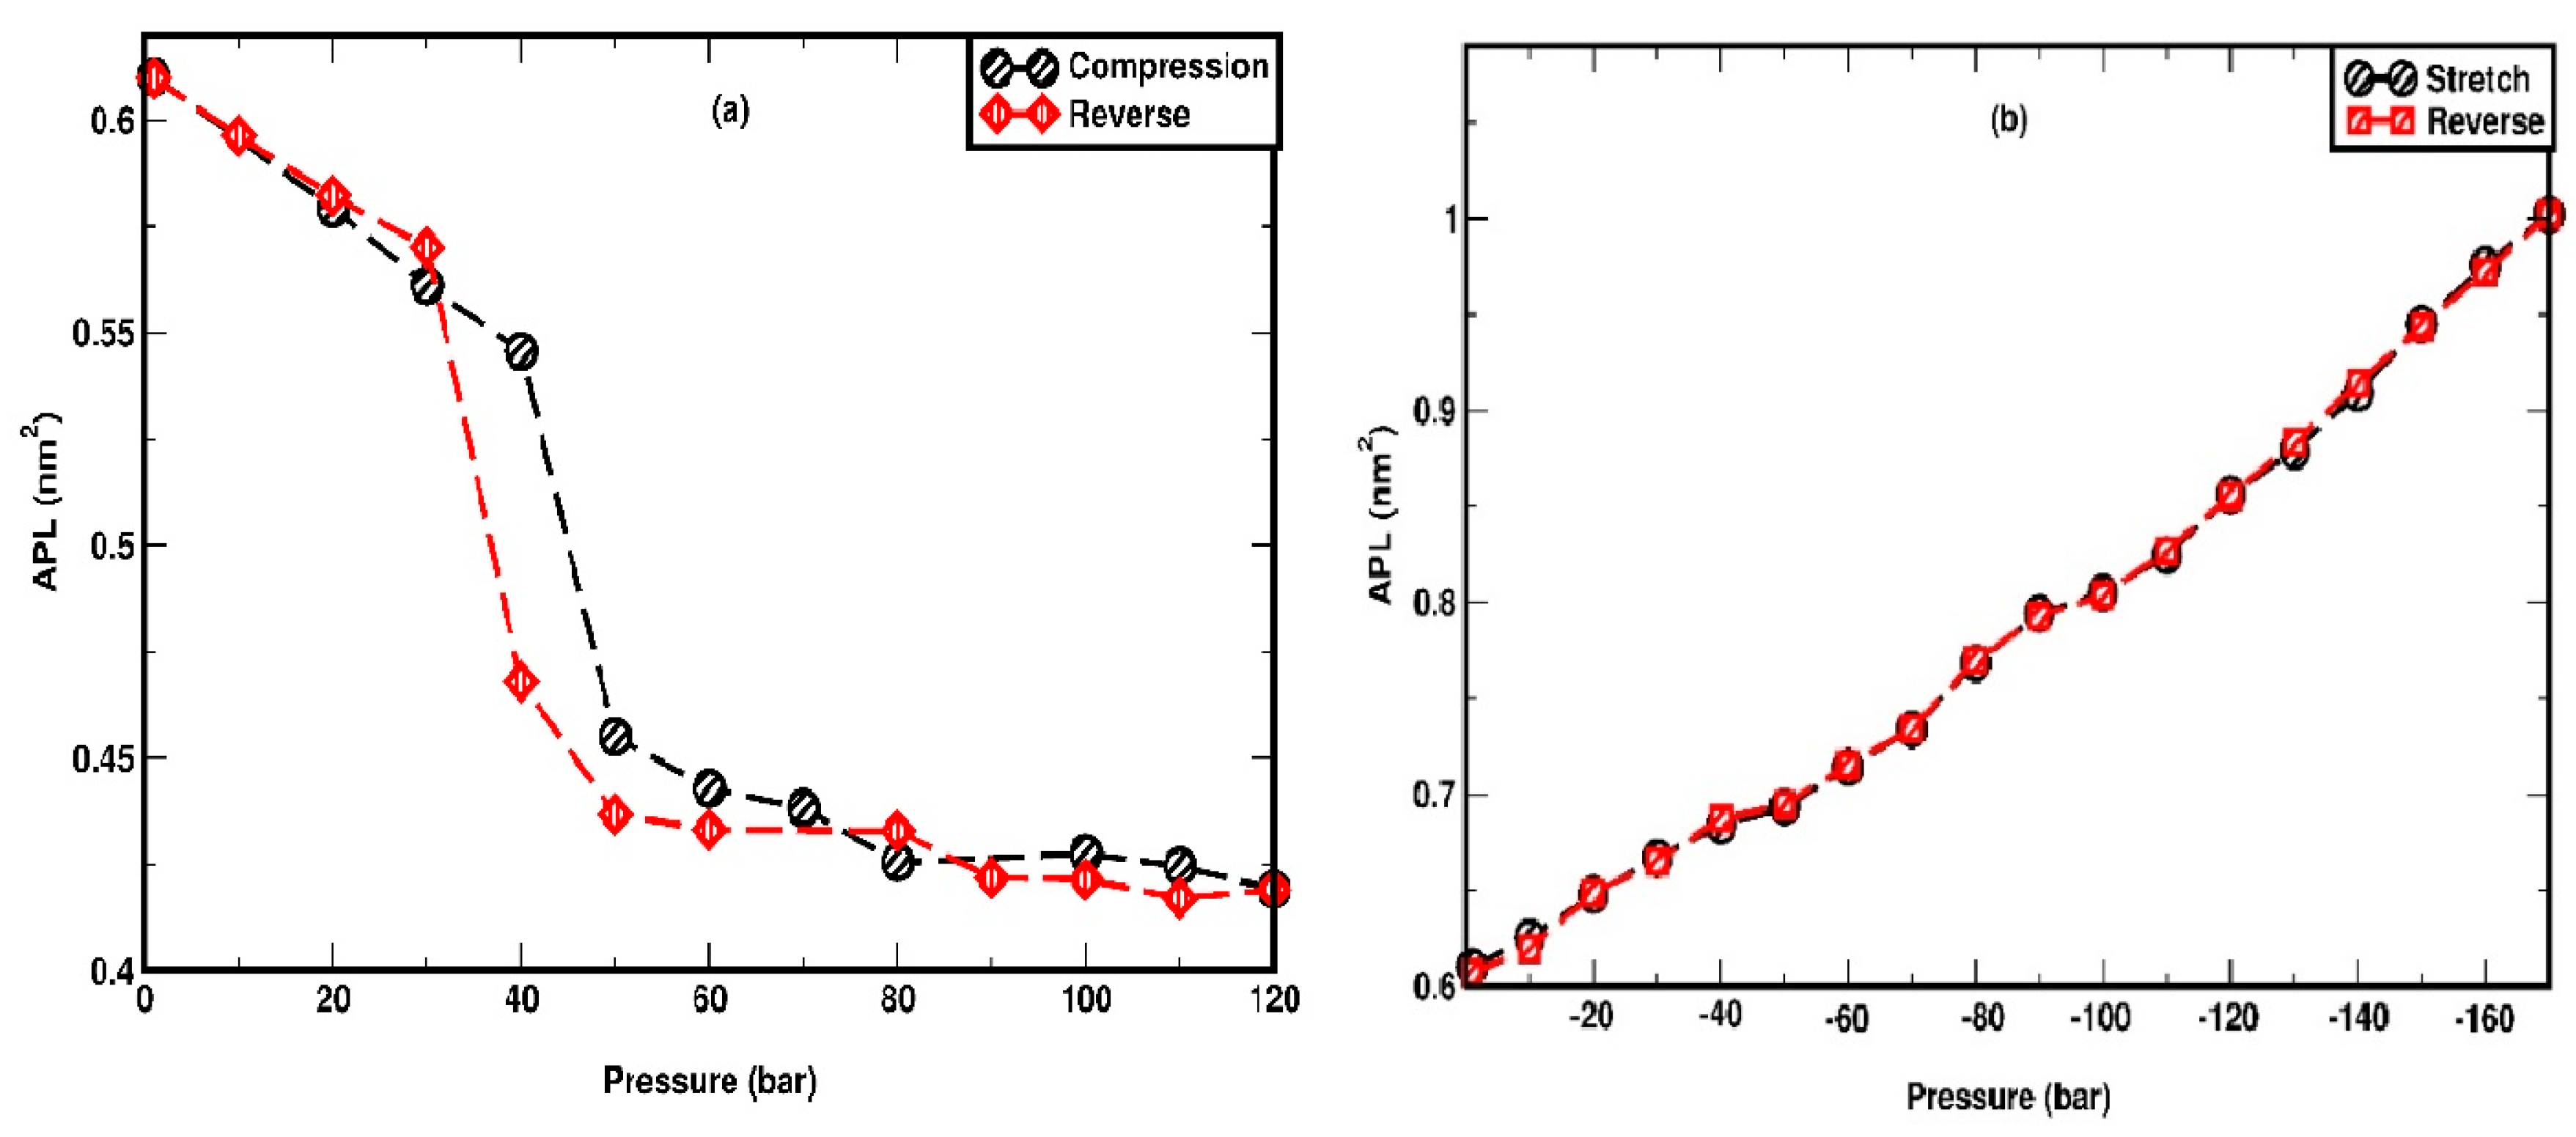

Table 1.
Four independent simulations at each pressure for low loading stretching reporting the occurrence of rupture and the corresponding time (when applicable, otherwise “NA” appears).
Table 1.
Four independent simulations at each pressure for low loading stretching reporting the occurrence of rupture and the corresponding time (when applicable, otherwise “NA” appears).
|
Pressure (bar) Low loading |
Simulation Index | Rupture? | Time of rupture (ns) |
| -170 | #1 | No | NA |
| -170 | #2 | No | NA |
| -170 | #3 | No | NA |
| -170 | #4 | No | NA |
| -180 | #1 | Yes | 106 |
| -180 | #2 | Yes | 426 |
| -180 | #3 | Yes | 416 |
| -180 | #4 | No | NA |
| -190 | #1 | Yes | 238 |
| -190 | #2 | Yes | 74 |
| -190 | #3 | Yes | 103 |
| -190 | #4 | Yes | 458 |
| -200 | #1 | Yes | 188 |
| -200 | #2 | Yes | 55 |
| -200 | #3 | Yes | 207 |
| -200 | #4 | Yes | 154 |
Disclaimer/Publisher’s Note: The statements, opinions and data contained in all publications are solely those of the individual author(s) and contributor(s) and not of MDPI and/or the editor(s). MDPI and/or the editor(s) disclaim responsibility for any injury to people or property resulting from any ideas, methods, instructions or products referred to in the content. |
© 2025 by the authors. Licensee MDPI, Basel, Switzerland. This article is an open access article distributed under the terms and conditions of the Creative Commons Attribution (CC BY) license (http://creativecommons.org/licenses/by/4.0/).
Copyright: This open access article is published under a Creative Commons CC BY 4.0 license, which permit the free download, distribution, and reuse, provided that the author and preprint are cited in any reuse.


