
Submitted:
25 March 2025
Posted:
26 March 2025
You are already at the latest version
Abstract
This study evaluates the efficiency of STEM-based sustainability initiatives at the University of Brasilia (UnB) using a Bootstrap Data Envelopment Analysis (DEA) approach. Twenty projects were analyzed based on input variables — team size, budget, and workload — and output variables — number of beneficiaries and published papers. The results indicate higher efficiency in the Mathematics and Civil Engineering departments, while Energy Engineering showed the lowest performance. A strong correlation (r = 0.78) was observed between budget and publication volume, but no significant relationship was found between budget and social impact. SDG 4 (Quality Education) was the most frequently addressed, whereas SDG 16 (Peace, Justice, and Strong Institutions) and SDG 14 (Life Below Water) received less attention. The study identifies key areas for improvement, emphasizing the need for more balanced resource allocation. It also offers benchmarking insights to other institutions seeking to optimize sustainability efforts.
Keywords:
sustainable development
; climate change
; data envelopment analysis (DEA)
; sustainability initiatives
; higher education
; sustainable projects
; efficiency
1. Introduction
The increasing frequency of extreme weather events worldwide underscores the urgent need to address climate change and promote sustainability [1]. This urgency has driven a global movement toward sustainable development, a concept popularized by the Brundtland Report, which defines it as “a process that meets the needs of the present without compromising the ability of future generations to meet their own needs” [2]. Among the United Nations’ 17 Sustainable Development Goals (SDGs), combating climate change remains a critical priority.
Given this context, Brazil has assumed a pivotal role in advancing global sustainability efforts through its commitments to the Paris Agreement and the 2030 Agenda. Notably, conserving the Amazon rainforest is a main concern, as it is one of the world’s most significant natural carbon sinks, capturing more greenhouse gases than it emits and playing a crucial part in mitigating climate change [3].
However, despite various sustainable development initiatives, the country faces significant challenges in advancing its goals. That scenario is especially evidenced by the [4], which indicates that only 7.7% of the SDGs are being met satisfactorily. This highlights the urgent need to make government initiatives more efficient, in order to maximize the value generated for society and improve public welfare.
Efficiency is key to ensuring that actions produce positive social and environmental impacts while optimally utilizing available resources and reducing waste [5]. Research shows that efficient projects not only reduce environmental costs but also promote social progress, such as greater inclusion, quality of life, and sustainable economic development [6]. It is crucial to focus on solutions that integrate effectiveness, innovation, and collaboration, creating public and private partnerships that enhance results and ensure the implementation of policies that truly transform the social and environmental landscape [7].
Educational institutions play a vital role in shaping society and setting new standards through their socioeconomic, technoscientific and cultural influence in the environment in which they are situated [8]. That role remains instrumental in both shaping and implementing sustainability policies and best practices.
In light of this, the present work aims to systematically evaluate the efficiency of sustainability-focused STEM (Science, Technology, Engineering, and Mathematics) initiatives at the University of Brasilia (UnB), a leading national institution in social and environmental sustainability [9]. By identifying the optimal allocation of resources, the research seeks to enhance the effectiveness of these projects while providing benchmarking insights to support decision making in sustainability-related efforts at other institutions. Ultimately, this study addresses the central question: How efficient have UnB’s internal STEM initiatives been in promoting sustainability?
2. Related Works
A bibliometric approach was conducted to review precedents in the use of Data Envelopment Analysis (DEA) for measuring the efficiency of sustainability-oriented projects. In order to do that, a three-year period was selected, and documents were collected from Web of Science (WOS). The search was restricted to journal articles and conference papers within the field of Engineering and Environmental Sciences to ensure a comprehensive and focused cross-analysis in the STEM field. The query was designed around three key dimensions, combined using the AND operator: DEA (DEA OR "Data Envelopment Analysis"), Sustainability (Sustainab* OR Environ* OR Green OR "Socio-environ*"), and Projects (Project OR Initiative).
The query yielded 129 articles, which were used to conduct co-citation and bibliographic coupling analyses to respectively identify relevant thematic clusters and shared theoretical foundations. A summary of the articles most closely aligned with this research was also elaborated. Figure 1 presents the results obtained from the co-citation analysis using all the documents retrieved.
Four major clusters were identified from the search, each associated with a specific contribution. The red cluster brings together fundamental studies on DEA. [10] introduce the CCR model, establishing it as a method for measuring efficiency in units with multiple inputs and outputs. [11] improves this approach with the slacks-based measure (SBM), which directly addresses inefficiencies in inputs and outputs. Complementarily, [12] propose a three-stage model that adjusts inputs or outputs to account for environmental effects and statistical noise.
Moreover, the purple cluster includes articles on productivity measurement with a focus on Malmquist indexes. [13] develop a theoretical foundation for comparing inputs, outputs, and productivity under different production structures, linking Malmquist and Törnqvist indexes, while [14] apply the Malmquist index to analyze productivity growth in 17 Organisation for Economic Co-operation and Development (OECD) countries, decomposing it into technical change and efficiency change.
The green cluster presents contributions on the use of DEA for evaluating sustainability in specific sectors. [15] propose a DEA model for intermediate networks, focusing on efficiency and technological inequality, in order to evaluate three stages of the sustainability system: economic growth, environmental protection and health promotion in Chinese provinces. In contrast, [16] apply DEA to analyze the performance of energy industries, addressing the challenge of balancing economic development with environmental protection.
Lastly, the yellow cluster explores the historical evolution of DEA in different areas. [17] review 40 years of DEA development, discussing its popular models, advantages, limitations and applications, as well as conducting a bibliometric analysis of publication trends. On the other hand, [18] review the literature from 2017 to 2020, emphasizing the growing use of DEA to measure sustainability, but pointing out the underrepresentation of the social dimension of sustainability and the use of proxy indices as incomplete substitutes for a multidimensional sustainability assessment.
Based on these observations, the obtained clusters suggest that the main research lines have been built upon classical pioneering works in efficiency and productivity analysis. Current work lies on the application of DEA to specific sectors, with ongoing efforts to refine the original methods through the integration of new tools and frameworks.
Furthermore, Figure 2 displays the results derived from the bibliographic coupling analysis of the selected articles.
Through that analysis, six major clusters were detected. The yellow cluster includes studies on the use of DEA to analyze sustainable performance in specific areas. [19] investigate how environmental regulations influence the performance of the circular economy in China, showcasing that regulation mainly promotes performance through a catch-up effect. [20] apply DEA to measure eco-efficiency in the tourism sector in Gansu, revealing that hotels are the largest contributors to carbon emissions. Meanwhile, [21] use DEA to assess the efficiency of industrial pollution control in Chinese provinces. The authors highlight regional differences while also suggesting improvements in efficiency.
Building on that, the green cluster focuses on efficiency in sustainable technologies and green logistics. [22] propose an integrated DEA-SBM approach with projection analysis to assess the performance of green technology R&D in China. [23] develop a model to analyze efficient locations for renewable energy installations in Vietnam. Meanwhile, [24] evaluate green logistics efficiency in Northwest China, highlighting regional differences and proposing strategies to support carbon emission reductions.
The purple cluster seeks to evaluate the impact of different policies and technologies on efficiency and sustainability across various contexts. [25] analyze regional differences in traffic restriction policies in China, suggesting dynamic adjustments towards a sustainable economic development. In contrast, [26] focus on strategies for reusing water and substrates in Mediterranean greenhouses, aiming to promote eco-efficiency and agricultural profitability.
Moving further, the red cluster focuses on evaluating efficiency in key sectors such as energy, tourism, and sustainable financing. [27] investigate the financing efficiency in China’s energy and environmental protection industry, focusing mainly on digital transformation and technological innovation perspectives. [28] analyze tourism efficiency in China, identifying patents and government control as key efficiency factors, while [29] propose a model to assess the performance of the Chinese energy supply chain, aligned with the carbon neutrality and peak emission goals.
Complementarily, the brown cluster focuses on assessing efficiency in sectors related to agriculture and industry, with an emphasis on sustainable practices and its impacts. [30] analyze the effect of off-farm employment on agricultural production efficiency in China, pointing out to the negative impacts of self-employment, especially at lower levels of off-farm employment. On the other hand, [31] examine environmental efficiency in the salmon industry in Chile, observing an improvement in environmental efficiency after the implementation of stricter regulations following the ISA virus outbreak.
Finally, in the orange cluster, [32] analyze the cost efficiency in rapeseed production in Hunan, China, using DEA. The study shows that all technical, allocative and cost efficiencies have room for improvement. The authors point out that expanding farmers’ operations may increase efficiency, but it would also lead to negative environmental impacts.
The clusters from coupling highlight how DEA and sustainability have been combined in recent years. The studies predominantly assess various facets of the sustainability domain applied to different sectors, such as energy, tourism and agriculture. Additionally, other studies focus on determining the impact of isolated factors on improving specific indicators and/or productivity, as well as enhancing decision-making through the combination of different multi-criteria methods.
Finally, a summary of the found previous work most closely aligned with this study was organized in Table 1.
Although the analyzed studies advance the application of DEA to assess efficiency and resource allocation towards sustainability, some limitations persist. The model proposed by [35] relies on some subjectively measured variables, which may introduce potential biases in its evaluation. Similarly, the approach of [36], despite being robust, employs 15 distinct variables, which compromises its generalizability. Meanwhile, [39] is limited by the scope of its sample by using the project’s covered area as one of the selected inputs, whereas [22,34] prioritize metrics such as publications, patents, and energy consumption, neglecting direct social impacts.
In light of these limitations, this study seeks to differentiate itself by proposing an objective approach with few parameters, focused on optimizing the allocation of managerial resources. This characteristic facilitates its application in different contexts, enabling the extraction of practical decision making insights through its replication.
3. Methodology
This is an applied research study with a quantitative approach that utilizes data collected from project reports available on UnB’s central online platform, along with supplementary information gathered through interviews with project coordinators. The obtained data underwent a rigorous processing phase, including an iterative outlier removal and normalization procedure to ensure comparability across different scales and mitigate potential biases. Additionally, linear correlation analyses were conducted to examine the interrelationships among the variables.
With the processed data, the model’s return to scale and orientation were adjusted to align with the study’s objectives and the specific characteristics of the dataset. Finally, the bootstrap technique was applied to enhance the reliability and robustness of the results.
3.1. Model Selection
A technical efficiency approach on the topic was chosen, considering the use of DEA. This method allows a suitable comparison of the studied initiatives based on their inputs and outputs, as it has been a extensively used solution for combining economic, environmental and social indicators with different units within the sustainable domain [40,41].
DEA was chosen for this work because it is particularly well-suited to evaluating the relative efficiency of Decision-Making Units (DMUs) in resource utilization and outcome maximization without the need of predefined weights. It also does not require a prior identification of any type of relationship between the variables nor any specific statistical distribution for the data [18].
3.2. Variables Selection
Six complementary variables were selected for the analysis based on their availability, accuracy and relevance to the study. Team size (TS), project budget (B), and workload (W) were considered as inputs variables, while the amount of published papers (PP) and the number of beneficiaries (NB) were treated as outputs variables. Table 2 summarizes the variables selected.
The decision to lean the input variables toward a managerial perspective was adopted as an alternative to allow its application to projects with different focuses. Concurrently, the output variables were selected to assess both the social impact of the initiatives, measured by the number of people that were benefited, and the scientific contribution, taking into account the academic context in which the sampled projects are situated.
3.3. Data Gathering
The study population comprises all STEM projects associated with sustainability at UnB. To ensure the consistency and comparability of the selected projects, specific inclusion and exclusion criteria were established. Only projects completed between 2020 and 2023 were included, while those associated with junior enterprises, athletic organizations, student chapters, research groups and competition teams were excluded.
The data for this study was collected through the Integrated System for Academic Activity Management (SIGAA), UnB’s central platform for managing academic processes such as enrollment, grade submission, and communication between students and professors. By applying the filters "Engineering”, “Project" and "Sustainability," a detailed list of relevant projects was generated. This list included data on team size, workload, and project budget. Additional information, such as the number of published papers and the number of beneficiaries, was obtained through interviews with project coordinators, as these details were not available in SIGAA reports.
3.4. Outlier Detection
Initially introduced by [42] for ranking efficient DMUs, the super-efficiency DEA model allows for efficiency scores greater than 1, where each DMU cannot use itself as a reference. This variation enables more precise observation among the more efficient DMUs, while inefficient DMUs maintain the same scores as in the standard DEA model [43].
In that way, this model presents a promising alternative for identifying and removing outliers, considering the potential for greater variation in the scale of observed results [44]. Following these principles, an iterative process was conducted to verify the relative super-efficiencies of the sample projects, leading to the elimination of those classified as outliers according to the Interquartile Range (IQR) Method. This procedure spanned a total of three iterations, resulting in a final sample of 20 projects. The complete original sample can be found in Appendix A, Table A1.
3.5. Return to Scale
[45] emphasize the importance of understanding the nature of returns to scale for the correct application of the DEA model. Significant distortions in results can arise from incorrect assumptions about returns to scale, potentially leading to losses in statistical efficiency. In this context, the authors propose calculating scale efficiency as:
, where , is the constant return to scale efficiency, and is the variable return to scale efficiency.
In scenarios where is approximately equal to 1, it is understood that constant returns to scale (CRS) are most appropriate for the data. Conversely, a value significantly lower than 1 may suggest the behavior of variable returns to scale (VRS). For the analyzed sample, for the original data and after the removal of outliers. Given the value being relatively close to 1, the constant returns to scale (CRS) model was adopted.
3.6. Model Orientation
Furthermore, the study explored input orientation through the lens of an isoquant curve, which illustrates all combinations of productive factors that yield the same level of output. By considering the minimum combination of resources on this curve to achieve a specific level of system output, it becomes possible to delineate the frontier defining the efficient set of combinations [46]. From this perspective, the focus shifts to reducing resource usage across projects while maintaining the same output level.
3.7. Bootstrap
To enhance the reliability and acceptance of the DEA model’s efficiency scores, bootstrapping was employed. This technique simulates a sample by applying the original estimator, ensuring that the simulation results replicate the original sample through a Data Generating Process (DGP). This process involves repeated resampling, conducted multiple times [47]. The results were derived from 1,000 resamplings, with a significance level () set at 0.05.
4. Results
This section begins with an evaluation of the project profiles within the sample, emphasizing the relationships between the chosen variables and their characteristics. Finally, the application of the DEA model to the data using bootstrap is introduced.
4.1. Projects Profile
To identify the priorities of action within the evaluated projects, a count of mentions for the different SDGs was conducted. Figure 3 illustrates the findings of this analysis.
Complementarily, the Pearson correlation between the selected inputs and outputs for the model was calculated. In that way, Figure 4 illustrates the degree of linear relationships among the variables. It is important to note that the acronym TS represents team size, B denotes the budget, W indicates workload, PP refers to the number of published papers, and NB signifies the number of beneficiaries.
After gaining an initial understanding of the project profiles and the selected variables, the research moved on to the application of the DEA model.
4.2. Bootstrap DEA Application
Table 3 presents the efficiency scores for each evaluated DMU, which have been anonymized for privacy reasons. It includes both bias-corrected efficiency scores generated by the bootstrapping technique and the corresponding 95% confidence intervals for each project’s efficiency score. The following abbreviations were used for the departments within the sample: Department of Electronic Engineering (EEL), Department of Civil Engineering (ENC), Department of Energy Engineering (EEN), Department of Mechanical Engineering (ENM), Department of Electrical Engineering (ENE), Department of Production Engineering (EPR), Department of Automotive Engineering (EAU), Department of Mathematics (MAT) and Department of Collective Health (DSC).
Linked to the results presented above, it was possible to compare the performance of the different university departments present in the sample based on their distributions. Figure 5 utilizes density plots to demonstrate the results for departments that contain more than one project in total.
Lastly, an analysis of the slacks across the DMUs was conducted. The optimal objective value (B*) can indicate potential excess inputs or shortages of outputs [48]. Table 4 presents the percentage slack for each variable and DMU, considering its distance to the efficiency frontier. The absolute final goal values that correspond to the necessary reductions or increases in the variables can be found in Appendix B, Table A2.
The following section offers a more comprehensive analysis of these findings, delving deeper into their significance and broader implications for the efficiency of the examined projects.
5. Discussions
Based on the obtained results, according to Figure 3, SDG 4 (Quality Education) appeared as the most popular goal among the sampled projects, with a total of 19 citations. Given that the projects originate from a higher education institution, it is reasonable to highlight the emphasis on education, particularly regarding the experiences offered to project participants. Following closely is SDG 11 (Sustainable Cities and Communities), with 15 mentions, which focuses on making cities and communities more inclusive, resilient, and sustainable. Third, SDG 3 (Good Health and Well-Being) is highlighted, emphasizing access to quality healthcare and the promotion of overall well-being. Conversely, the least addressed SDGs were SDG 16 (Peace, Justice, and Strong Institutions), SDG 14 (Life Below Water), and SDG 2 (Zero Hunger and Sustainable Agriculture), which received 1, 3, and 3 mentions, respectively.
The results also indicate that projects with higher volumes of publications are generally those with larger budgets, as it was shown in Figure 4. These two variables showed a strong positive correlation, with . However, the same cannot be said regarding the number of beneficiaries. The calculations demonstrated a weak negative correlation between the budget and number of beneficiaries, with . Overall, no significant relationships were found between the defined inputs and the number of beneficiaries. On the other hand, the relationship between the two measured outputs presented a weak negative correlation (), suggesting that these outputs do not tend to increase simultaneously; in other words, one may be prioritized at the expense of the other.
Moreover, team size and workload showed a moderate positive correlation (), which is evidently explained by the direct relationship between the time spent on a project and the number of allocated members.
Following that, Table 3 and Figure 5 revealed that the EEL, ENM, and ENE departments achieve their highest frequencies at efficiency scores around 0.5, while ENC and MAT detain the top peaks among all departments, close to 0.75. In contrast, EEN stands out with the lowest results, peaking around 0.25. The DSC, EPR, and EAU departments, with only one project each, recorded approximate scores of 0.76, 0.72, and 0.57, respectively, as also summarized in Table 3.
Finally, based on the slack evaluation presented in Table 4, DMU 16 exhibited the most significant need for input reduction to reach the efficiency frontier. Specifically, it requires a 53.9% reduction in team size (TS) and a 7.5% increase in the number of beneficiaries (NB). For DMU 9, the recommendations include an 8.1% reduction in TS and a 21.7% decrease in workload (W). DMU 18 is advised to reduce W by 11.8%, while for DMU 10, a decrease of 9.4% in TS is deemed optimal. These were the projects that required the most significant adjustments.
In practical terms, the findings provide a deeper understanding of the context faced by sustainability projects within higher education, while also proposing concrete actions to objectively enhance their efficiency, ultimately supporting progress toward the SDGs. The results pointed to a direct correlation between a project’s budget and the number of publications, meaning that greater financial resources may indeed lead to a broader dissemination of the actions taken in favor of the aimed SDG.
For academia, this study advances the knowledge frontier by addressing a flexible resource management approach combined with Bootstrap DEA to assess sustainability-focused initiatives. Furthermore, the results serve as a valuable benchmark reference for other universities and institutions seeking more informed decisions regarding resource allocation towards sustainability.
6. Final Considerations
The study successfully achieved its primary goal of evaluating the efficiency of sustainability-focused STEM initiatives at the University of Brasilia. By assessing the relative efficiency of the selected projects, the study identified strategies for optimal resource allocation, providing valuable benchmarking insights for other higher education institutions.
To address the research question, a robust methodology was employed, incorporating an extensive literature review, definition of key variables, data collection from ongoing initiatives and the application of Bootstrap DEA. This comprehensive approach enabled an objective and adaptable evaluation of the initiatives, highlighting areas for improvement and offering actionable recommendations to enhance their performance.
Research limitations include the unavailability of data from 2024 up to the time the current work was written, as well as the low sample of projects linked to specific departments, making it difficult to observe patterns or to detect tendencies.
For future research, extending this analysis to encompass additional universities and academic institutions would offer a more comprehensive view of sustainability practices in higher education, facilitating cross-institutional comparisons. Such a broader perspective could significantly enhance institutional sustainability efforts and contribute to advancing global initiatives for sustainable development.
Author Contributions
Conceptualization, T.S.; Literature review, V.O.; Methodology, R.C. and G.S.; Data collection, R.C. and G.S.; Data curation, R.C.; Formal analysis, R.C.; Investigation, R.C.; Writing - original draft, R.C., T.S. and S.M.; Supervision, S.M. All authors have read and agreed to the published version of the manuscript.
Funding
Not applicable.
Institutional Review Board Statement
Not applicable.
Informed Consent Statement
Not applicable.
Data Availability Statement
The data used to support the findings of this study are available on Appendix A, Table A1.
Conflicts of Interest
The authors declare no conflict of interest.
Appendix A

Table A1.
Original Data.
| DMU | TS | B | W | PP | NB |
|---|---|---|---|---|---|
| DMU 1 | 37 | $ 8,330.00 | 2430 | 1 | 50 |
| DMU 2 | 19 | $ 0.00 | 1140 | 0 | 1000 |
| DMU 3 | 9 | $ 4,080.00 | 1292 | 1 | 183 |
| DMU 4 | 13 | $ 850.00 | 875 | 2 | 62 |
| DMU 5 | 22 | $ 8,500.00 | 3396 | 2 | 161 |
| DMU 6 | 9 | $ 680.00 | 1658 | 0 | 750 |
| DMU 7 | 8 | $ 510.00 | 1000 | 0 | 255 |
| DMU 8 | 4 | $ 1,360.00 | 360 | 0 | 50 |
| DMU 9 | 29 | $ 73.10 | 3400 | 0 | 400 |
| DMU 10 | 16 | $ 170.00 | 480 | 0 | 260 |
| DMU 11 | 17 | $ 51.00 | 1522 | 0 | 50 |
| DMU 12 | 3 | $ 2,856.00 | 735 | 1 | 500 |
| DMU 13 | 15 | $ 22,666.67 | 1820 | 1 | 100 |
| DMU 14 | 6 | $ 0.00 | 1155 | 2 | 5 |
| DMU 15 | 5 | $ 68.00 | 555 | 0 | 57 |
| DMU 16 | 92 | $ 15,164.00 | 1952 | 4 | 59 |
| DMU 17 | 2 | $ 51,000.00 | 126 | 2 | 100 |
| DMU 18 | 42 | $ 13,804.00 | 5762 | 0 | 510 |
| DMU 19 | 24 | $ 68,000.00 | 1680 | 8 | 70 |
| DMU 20 | 20 | $ 0.00 | 1530 | 0 | 20 |
| Outlier 1 | 12 | $ 1,071.00 | 1360 | 0 | 30000 |
| Outlier 2 | 5 | $ 0.00 | 1095 | 1 | 8500 |
| Outlier 3 | 3 | $ 61,443.38 | 27 | 0 | 1500 |
Appendix B
Table A2.
Goals per DMU.
| DMU | TS | B | W | PP | NB |
|---|---|---|---|---|---|
| DMU 1 | 36 | $ 8,330.00 | 2430 | 1 | 50 |
| DMU 2 | 19 | $ 0.00 | 1140 | 0 | 1000 |
| DMU 3 | 9 | $ 4,080.00 | 1292 | 1 | 183 |
| DMU 4 | 13 | $ 850.00 | 875 | 2 | 62 |
| DMU 5 | 22 | $ 8,500.00 | 3217 | 2 | 161 |
| DMU 6 | 9 | $ 680.00 | 1658 | 0 | 750 |
| DMU 7 | 8 | $ 510.00 | 986 | 0 | 255 |
| DMU 8 | 4 | $ 1,360.00 | 360 | 0 | 50 |
| DMU 9 | 27 | $ 73.10 | 2662 | 0 | 400 |
| DMU 10 | 15 | $ 170.00 | 480 | 0 | 260 |
| DMU 11 | 17 | $ 51.00 | 1488 | 0 | 50 |
| DMU 12 | 3 | $ 2,856.00 | 735 | 1 | 500 |
| DMU 13 | 15 | $ 22,666.67 | 1815 | 1 | 100 |
| DMU 14 | 6 | $ 0.00 | 1155 | 2 | 5 |
| DMU 15 | 5 | $ 68.00 | 555 | 0 | 57 |
| DMU 16 | 42 | $ 15,164.00 | 1952 | 4 | 63 |
| DMU 17 | 2 | $ 51,000.00 | 126 | 2 | 100 |
| DMU 18 | 42 | $ 13,804.00 | 5079 | 0 | 510 |
| DMU 19 | 24 | $ 68,000.00 | 1680 | 8 | 70 |
| DMU 20 | 19 | $ 0.00 | 1496 | 0 | 20 |
References
- Ebi, K. L., Vanos, J., Baldwin, J. W., Bell, J. E., Hondula, D. M., Errett, N. A., ... & Berry, P. (2021). Extreme weather and climate change: population health and health system implications. Annual review of public health, 42(1), 293-315.
- Brundtland, G. H., & Khalid, M. (1987). Our Common Future. Oxford University Press.
- USAID (2024). Brazil Climate Change Country Profile: Climate. U.S. Agency for International Development. Retrieved January 5, 2025, from https://www.usaid.gov/climate/country-profiles/brazil.
- Grupo de Trabalho da Sociedade Civil para a Agenda 2030 (2024). VIII Relatório Luz da Sociedade Civil da Agenda 2030. Grupo de Trabalho da Sociedade Civil para a Agenda 2030 (GT Agenda 2030).
- Geissdoerfer, M., et al. (2017). The Circular Economy – A new sustainability paradigm?. Journal of Cleaner Production, 143, 757-768. [CrossRef]
- Porter, M. E., & Kramer, M. R. (2011). Creating shared value. Harvard Business Review, 89(1-2), 62-77.
- Sachs, J. D. (2015). The Age of Sustainable Development. Columbia University Press.
- Curi Filho, W. R., and Wood, T. (2021). "Avaliação do Impacto das Universidades em Suas Comunidades." Cadernos EBAPE. BR, 19(3): 496–509. [CrossRef]
- QS (2024). QS World University Rankings: Sustainability 2024. Retrieved from https://www.topuniversities.com/sustainability-rankings?countries=br.
- Charnes, A., Cooper, W. W., & Rhodes, E. (1978). Measuring the efficiency of decision-making units. European Journal of Operational Research, 2(6), 429-444. [CrossRef]
- Tone, K. (2001). A slacks-based measure of efficiency in data envelopment analysis. European Journal of Operational Research, 130(3), 498-509. [CrossRef]
- Fried, H. O., Lovell, C. A. K., Schmidt, S. S., & Yaisawarng, S. (2002). Accounting for environmental effects and statistical noise in data envelopment analysis. Journal of Productivity Analysis, 17(1), 91-114. [CrossRef]
- Caves, D. W., Christensen, L. R., & Diewert, W. E. (1982). The economic theory of index numbers and the measurement of input, output, and productivity. Econometrica, 50(6), 1393-1414. [CrossRef]
- Färe, R., Grosskopf, S., Norris, M., & Zhang, Z. (1994). Productivity growth, technical progress, and efficiency change in industrialized countries. The American economic review, 66-83.
- Zhang, R., Wei, Q., Li, A., & Chen, S. (2022). A new intermediate network data envelopment analysis model for evaluating China’s sustainability. Journal of Cleaner Production, 356, 131845. [CrossRef]
- Sueyoshi, T., & Goto, M. (2017). World trend in energy: an extension to DEA applied to energy and environment. Journal of Economic Structures, 6, 1-23. [CrossRef]
- Panwar, N., Olfati, M., Pant, P., & Snasel, V. (2022). Review of the evolution of data envelopment analysis: A bibliometric approach. Sustainability, 14(4), 2219.
- Tsaples, G., & Papathanasiou, J. (2021). Data envelopment analysis and the concept of sustainability: A review and analysis of the literature. Renewable and Sustainable Energy Reviews, 138, 110664. [CrossRef]
- Shang, Y., Song, M., & Zhao, X. (2022). The development of China’s Circular Economy: From the perspective of environmental regulation. Waste Management, 149, 186-198. [CrossRef]
- Xia, B., Dong, S., Li, Z., Zhao, M., Sun, D., Zhang, W., & Li, Y. (2022). Eco-efficiency and its drivers in tourism sectors with respect to carbon emissions from the supply chain: An integrated EEIO and DEA approach. International Journal of Environmental Research and Public Health, 19(11), 6951. [CrossRef]
- Zou, W., Zhang, L., Xu, J., Xie, Y., & Chen, H. (2022). Spatial–temporal evolution characteristics and influencing factors of industrial pollution control efficiency in China. Sustainability, 14(9), 5152. [CrossRef]
- Li, G., Wang, P., & Pal, R. (2022). Measuring sustainable technology R&D innovation in China: A unified approach using DEA-SBM and projection analysis. Expert Systems with Applications, 209, 118393.
- Le, M. T., & Nhieu, N. L. (2022). An offshore wind–wave energy station location analysis by a novel behavioral dual-side spherical fuzzy approach: the case study of Vietnam. Applied Sciences, 12(10), 5201. [CrossRef]
- Qin, W., & Qi, X. (2022). Evaluation of green logistics efficiency in Northwest China. Sustainability, 14(11), 6848. [CrossRef]
- Li, Y., Yang, Y., Luo, G., Huang, J., & Wu, T. (2022). The economic recovery from traffic restriction policies during the COVID-19 through the perspective of regional differences and sustainable development: Based on human mobility data in China. Sustainability, 14(11), 6453. [CrossRef]
- Gava, O., Antón, A., Carmassi, G., Pardossi, A., Incrocci, L., & Bartolini, F. (2023). Reusing drainage water and substrate to improve the environmental and economic performance of Mediterranean greenhouse cropping. Journal of Cleaner Production, 413, 137510. [CrossRef]
- Li, B., Huo, Y., & Yin, S. (2022). Sustainable financing efficiency and environmental value in China’s energy conservation and environmental protection industry under the double carbon target. Sustainability, 14(15), 9604. [CrossRef]
- Yang, G., Yang, Y., Gong, G., & Gui, Q. (2022). The spatial network structure of tourism efficiency and its influencing factors in China: A social network analysis. Sustainability, 14(16), 9921. [CrossRef]
- Huang, X., Lu, X., Sun, Y., Yao, J., & Zhu, W. (2022). A Comprehensive Performance Evaluation of Chinese Energy Supply Chain under “Double-Carbon” Goals Based on AHP and Three-Stage DEA. Sustainability, 14(16), 10149. [CrossRef]
- Chang, M., Liu, J., Shi, H., & Guo, T. (2022). The effect of off-farm employment on agricultural production efficiency: micro evidence in China. Sustainability, 14(6), 3385. [CrossRef]
- Salazar, C., Cárdenas-Retamal, R., & Jaime, M. (2023). Environmental efficiency in the salmon industry—an exploratory analysis around the 2007 ISA virus outbreak and subsequent regulations in Chile. Environment, Development and Sustainability, 25(8), 8107-8135. [CrossRef]
- Zhang, Q., Razzaq, A., Qin, J., Feng, Z., Ye, F., & Xiao, M. (2022). Does the expansion of farmers’ operation scale improve the efficiency of agricultural production in China? Implications for environmental sustainability. Frontiers in Environmental Science, 10, 918060. [CrossRef]
- Feng, J., Wang, N., & Sun, G. (2022). Measurement of innovation-driven development performance of large-scale environmental protection enterprises investing in public–private partnership projects based on the hybrid method. Sustainability, 14(9), 5096. [CrossRef]
- Han, S., Park, S., An, S., Choi, W., & Lee, M. (2023). Research on Analyzing the Efficiency of R&D Projects for Climate Change Response Using DEA–Malmquist. Sustainability, 15(10), 8433. [CrossRef]
- Ebnerasoul, M., Ghannadpour, S. F., & Haeri, A. (2023). A collective efficacy-based approach for bi-objective sustainable project portfolio selection using interdependency network model between projects. Environment, Development and Sustainability, 25(12), 13981-14001. [CrossRef]
- Sun, Y., Zhang, R., & Li, A. (2024). A new concept of education-innovation-economy-environment sustainability system: a new framework of strategy-based network data envelopment analysis. Environment, Development and Sustainability, 1-45.
- Li, R., Luo, Y., Chen, B., Huang, H., & Liu, P. (2024). Efficiency of scientific and technological resource allocation in Chengdu–Chongqing–Mianyang Urban agglomeration: based on DEA–Malmquist index model. Environment, Development and Sustainability, 26(4), 10461-10483. [CrossRef]
- Liu, P., Han, G., Yang, H., & Li, X. (2024). A sustainable development study on innovation factor allocation efficiency and spatial correlation based on regions along the belt and road in China. Sustainability, 16(7), 2990. [CrossRef]
- You, M., Huang, Y., Wu, N., & Yuan, X. (2025). Efficiency Evaluation and Resource Optimization of Forestry Carbon Sequestration Projects: A Case Study of State-Owned Forest Farms in Fujian Province. Sustainability, 17(1), 375. [CrossRef]
- Callens, I., and Tyteca, D. (1999). "Towards Indicators of Sustainable Development for Firms: A Productive Efficiency Perspective." Ecological Economics, 28(1): 41–53.
- Zhou, H., Yang, Y., Chen, Y., & Zhu, J. (2018). Data envelopment analysis application in sustainability: The origins, development and future directions. European Journal of Operational Research, 264(1), 1-16. [CrossRef]
- Andersen, P., & Petersen, N. C. (1993). A procedure for ranking efficient units in data envelopment analysis. Management science, 39(10), 1261-1264. [CrossRef]
- Lovell, C. A. K., & Rouse, R. (2003). Measuring the efficiency of decision-making units using data envelopment analysis. Operations Research, 51(3), 493-503.
- Emrouznejad, A., & Cabanda, E. (2014). Super-efficiency in DEA: A review of the literature. International Journal of Applied Management Science, 6(3), 167-188.
- Simar, L., Wilson, P. W., & Paul, L. (2002). A general methodology for bootstrapping in data envelopment analysis. Journal of the Operational Research Society, 53(1), 23-29.
- Peña, J. M. (2008). Data Envelopment Analysis: A Methodology for Assessing the Efficiency of Decision-Making Units. Springer Science and Business Media.
- Serrano, A. L., Saiki, G. M., Rosano-Penã, C., Rodrigues, G. A. P., Albuquerque, R. D. O., & García Villalba, L. J. (2024). Bootstrap method of eco-efficiency in the Brazilian agricultural industry. Systems, 12(4), 136. [CrossRef]
- Tone, K. (1997). A slacks-based measure of efficiency in data envelopment analysis. European Journal of Operational Research, 130(3), 498-509. [CrossRef]
Figure 1.
Co-citation heat map generated in VOSviewer using the WOS database
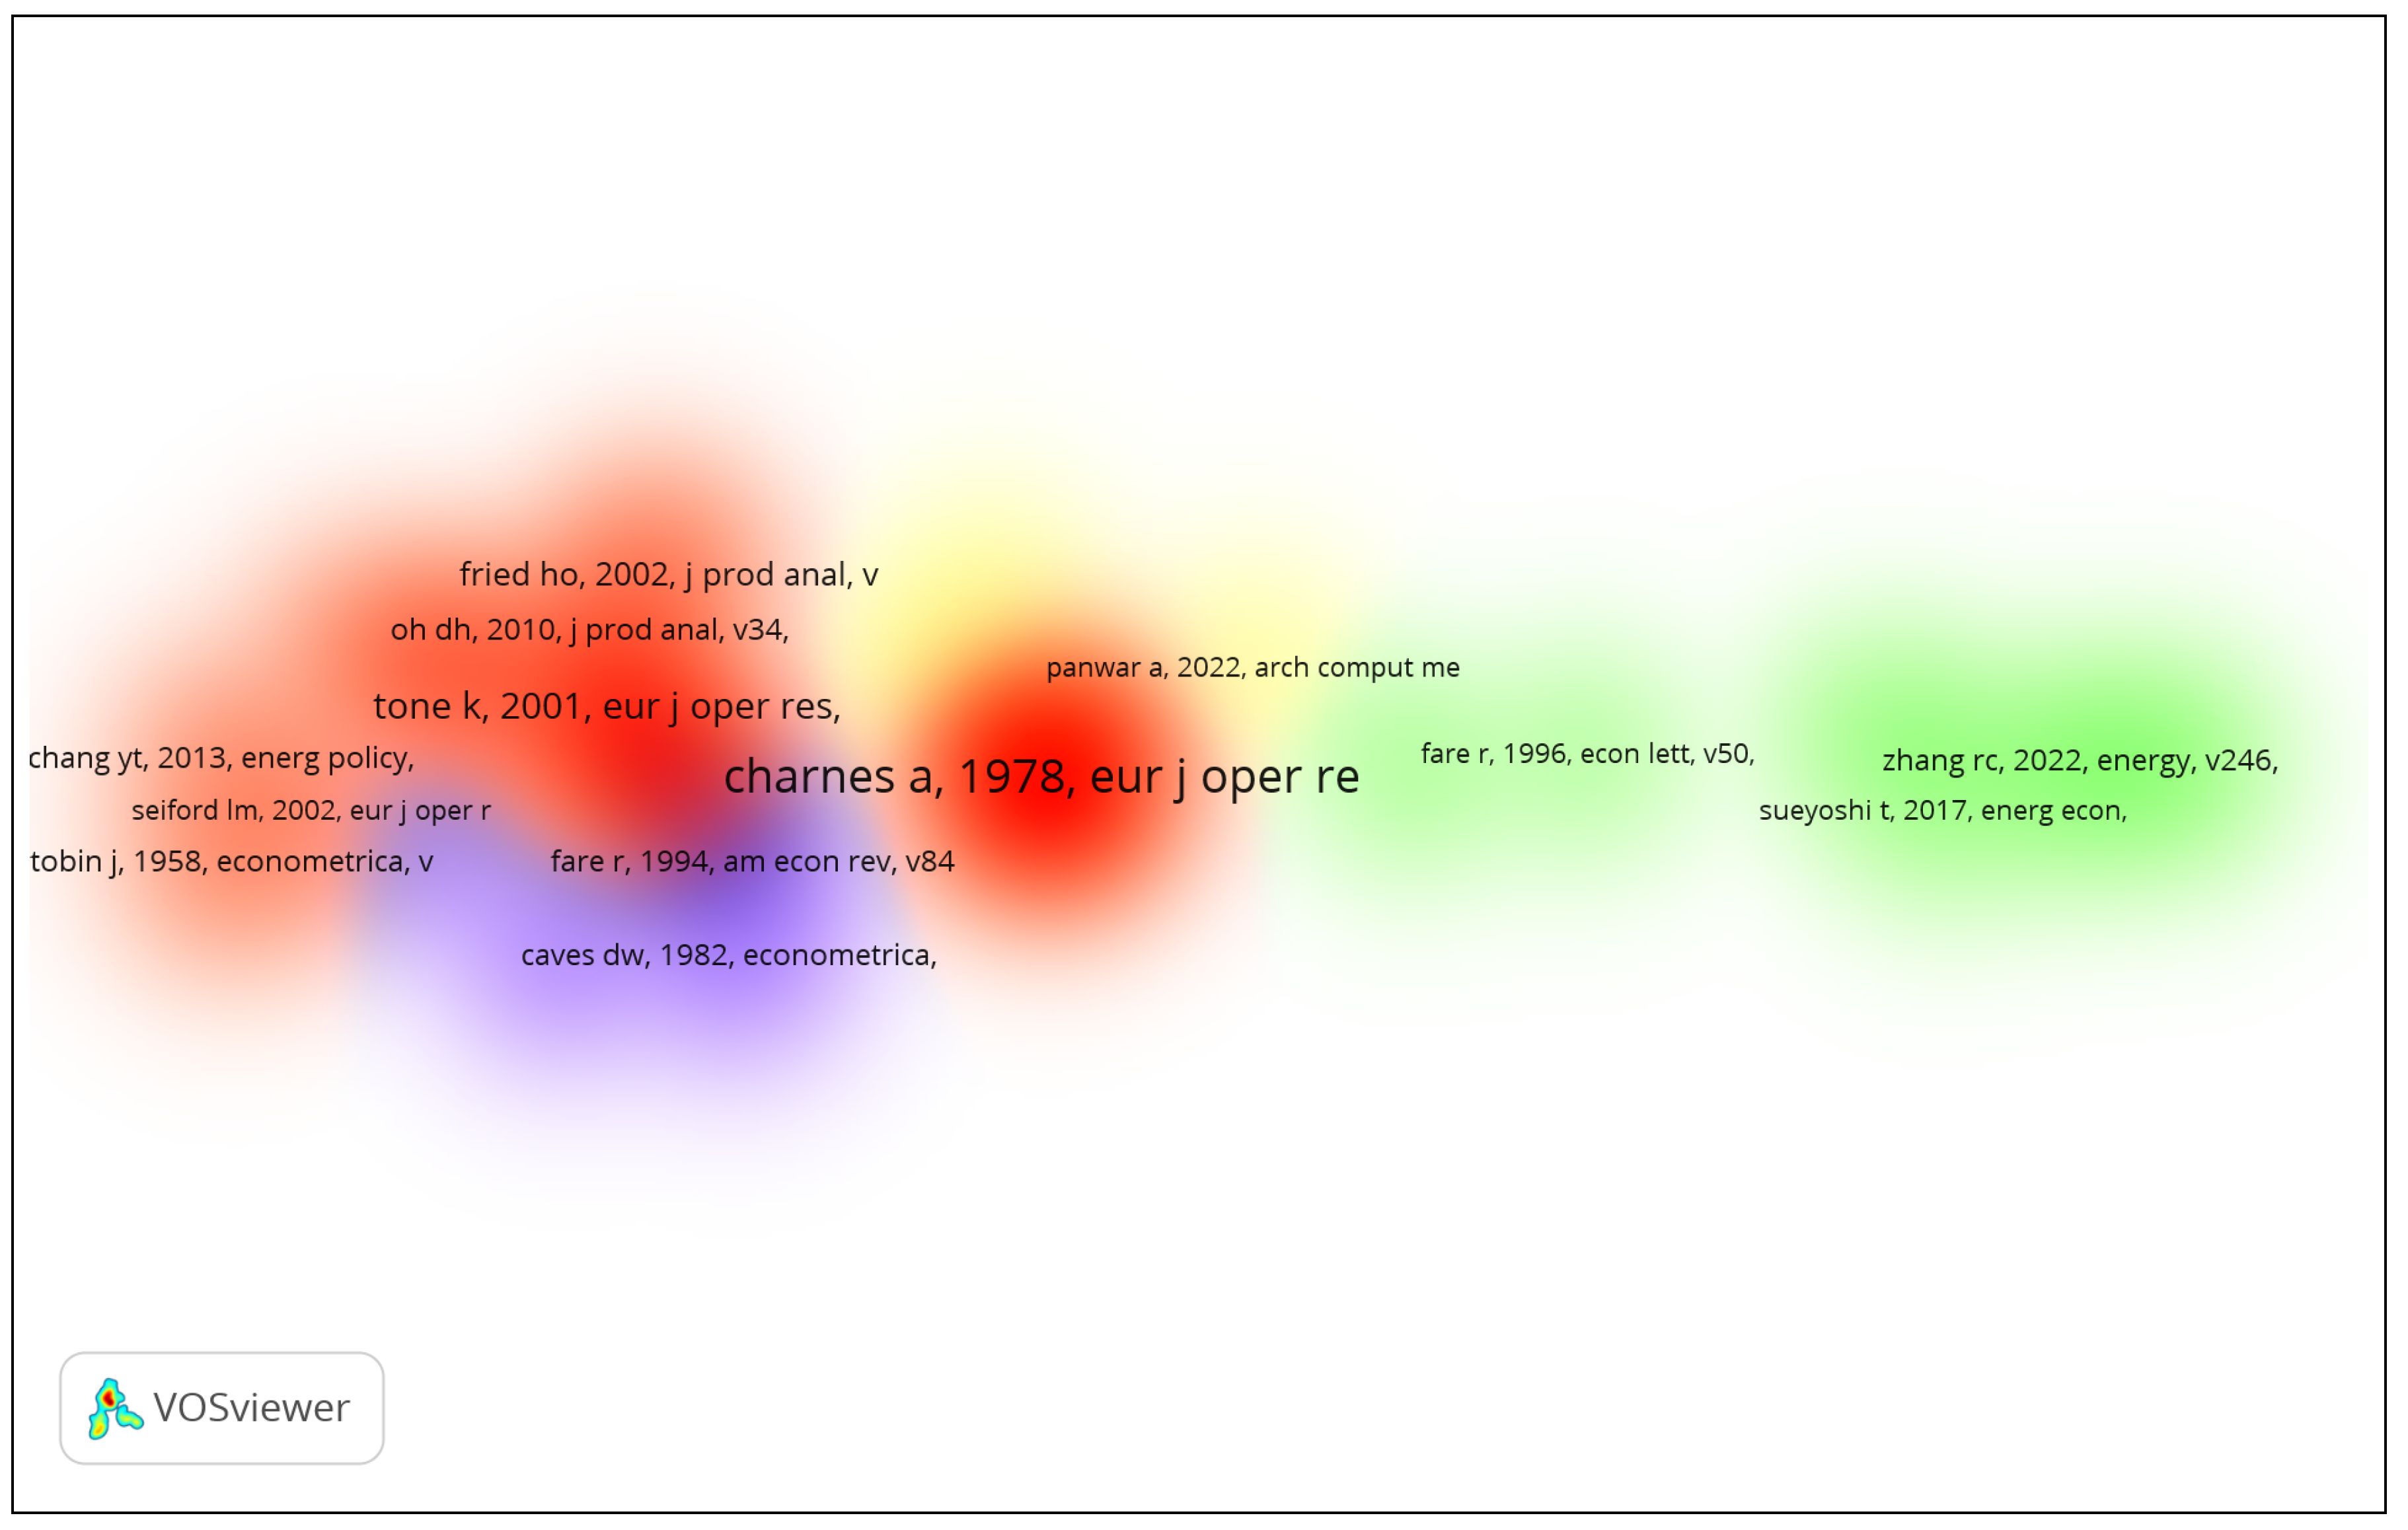
Figure 2.
Bibliographic coupling heat map generated in VOSviewer using the WOS database
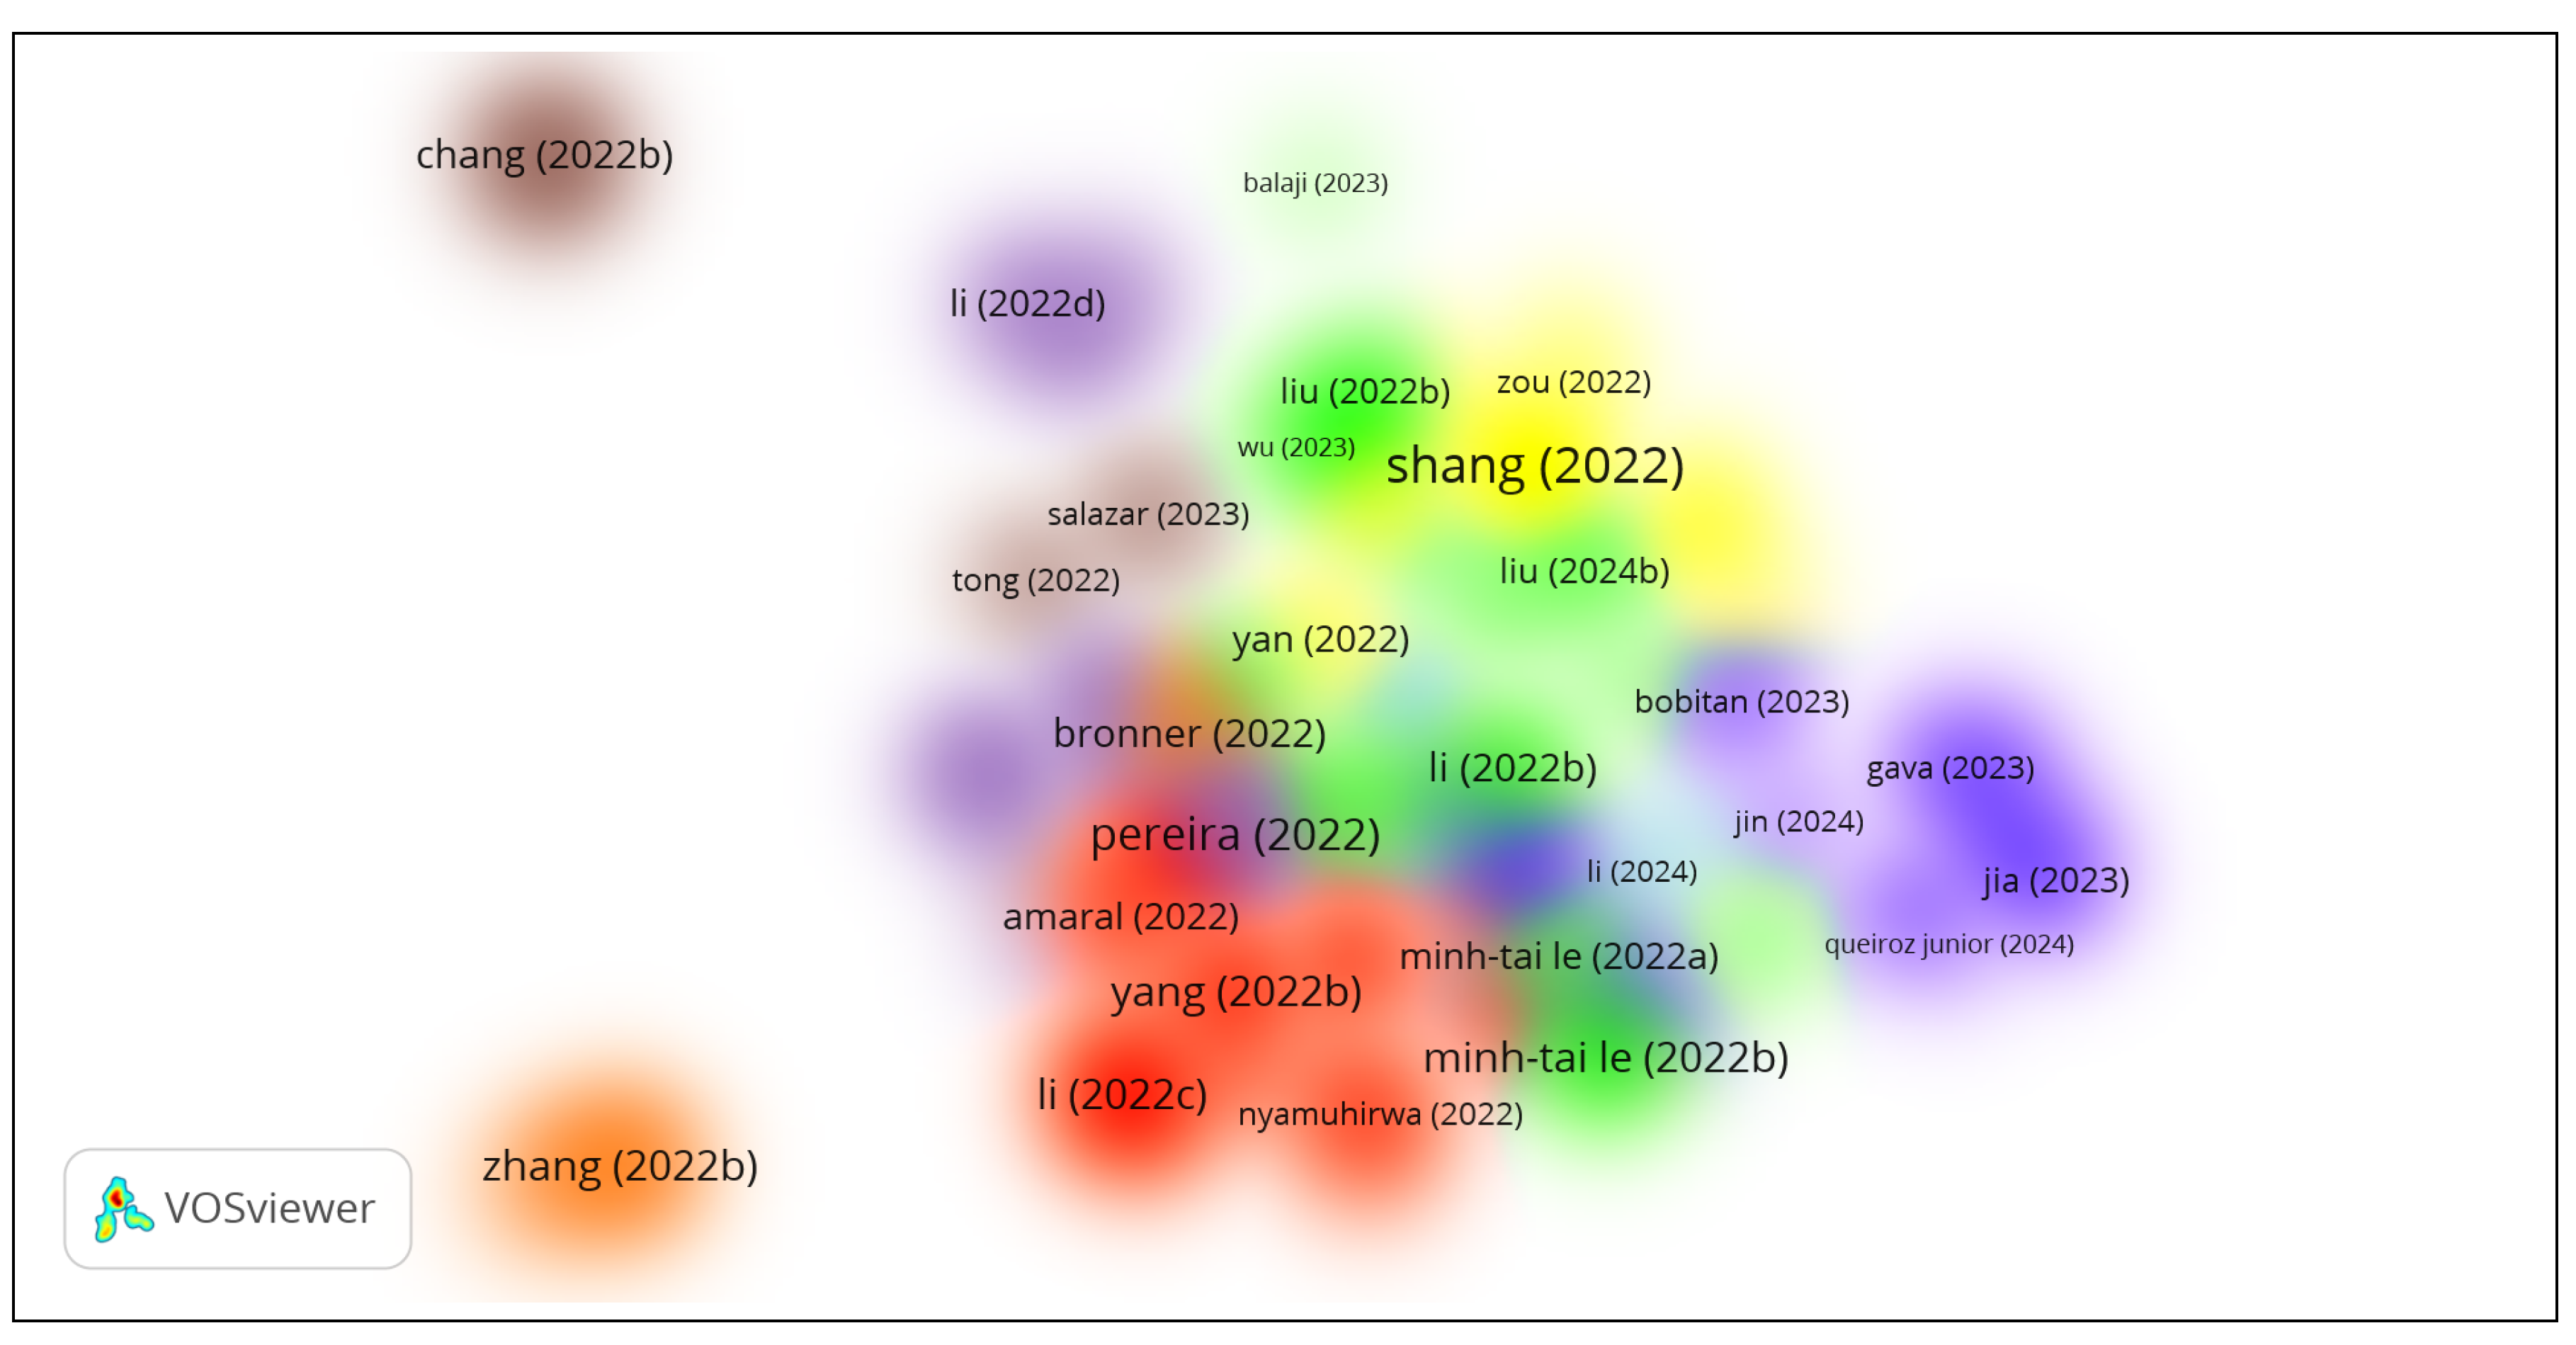
Figure 3.
Mentions per SDG count
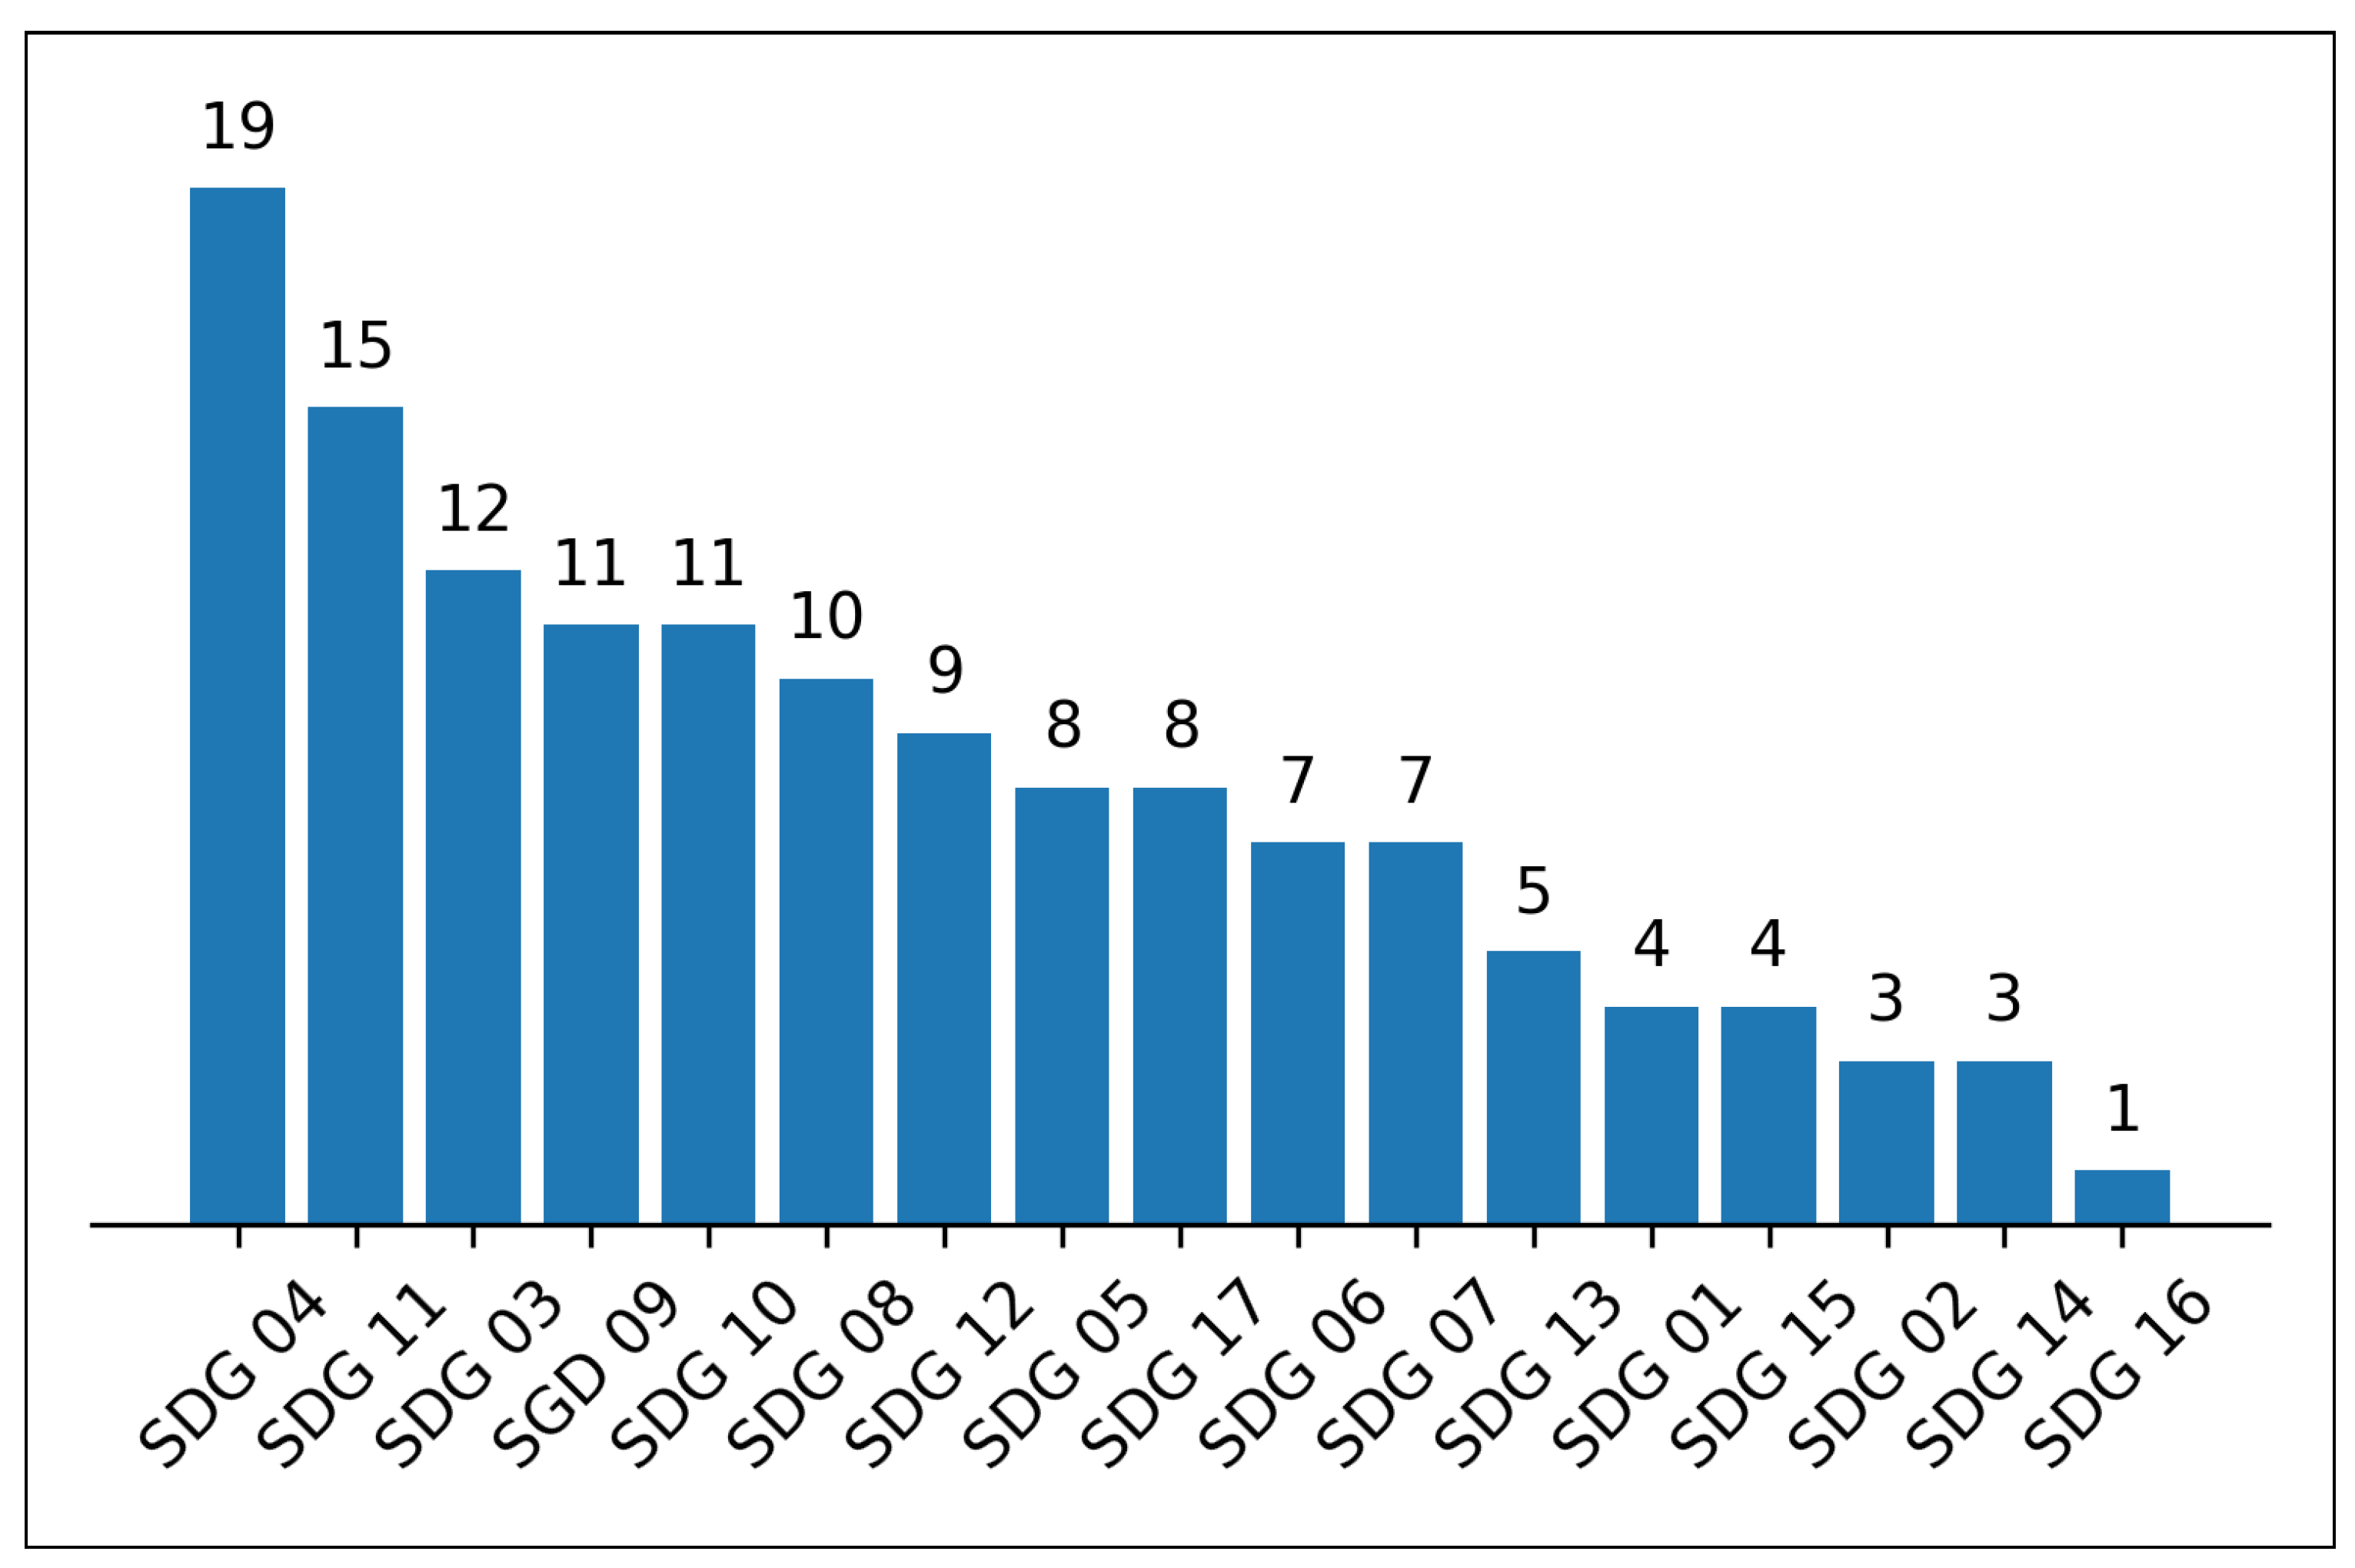
Figure 4.
Variables correlation
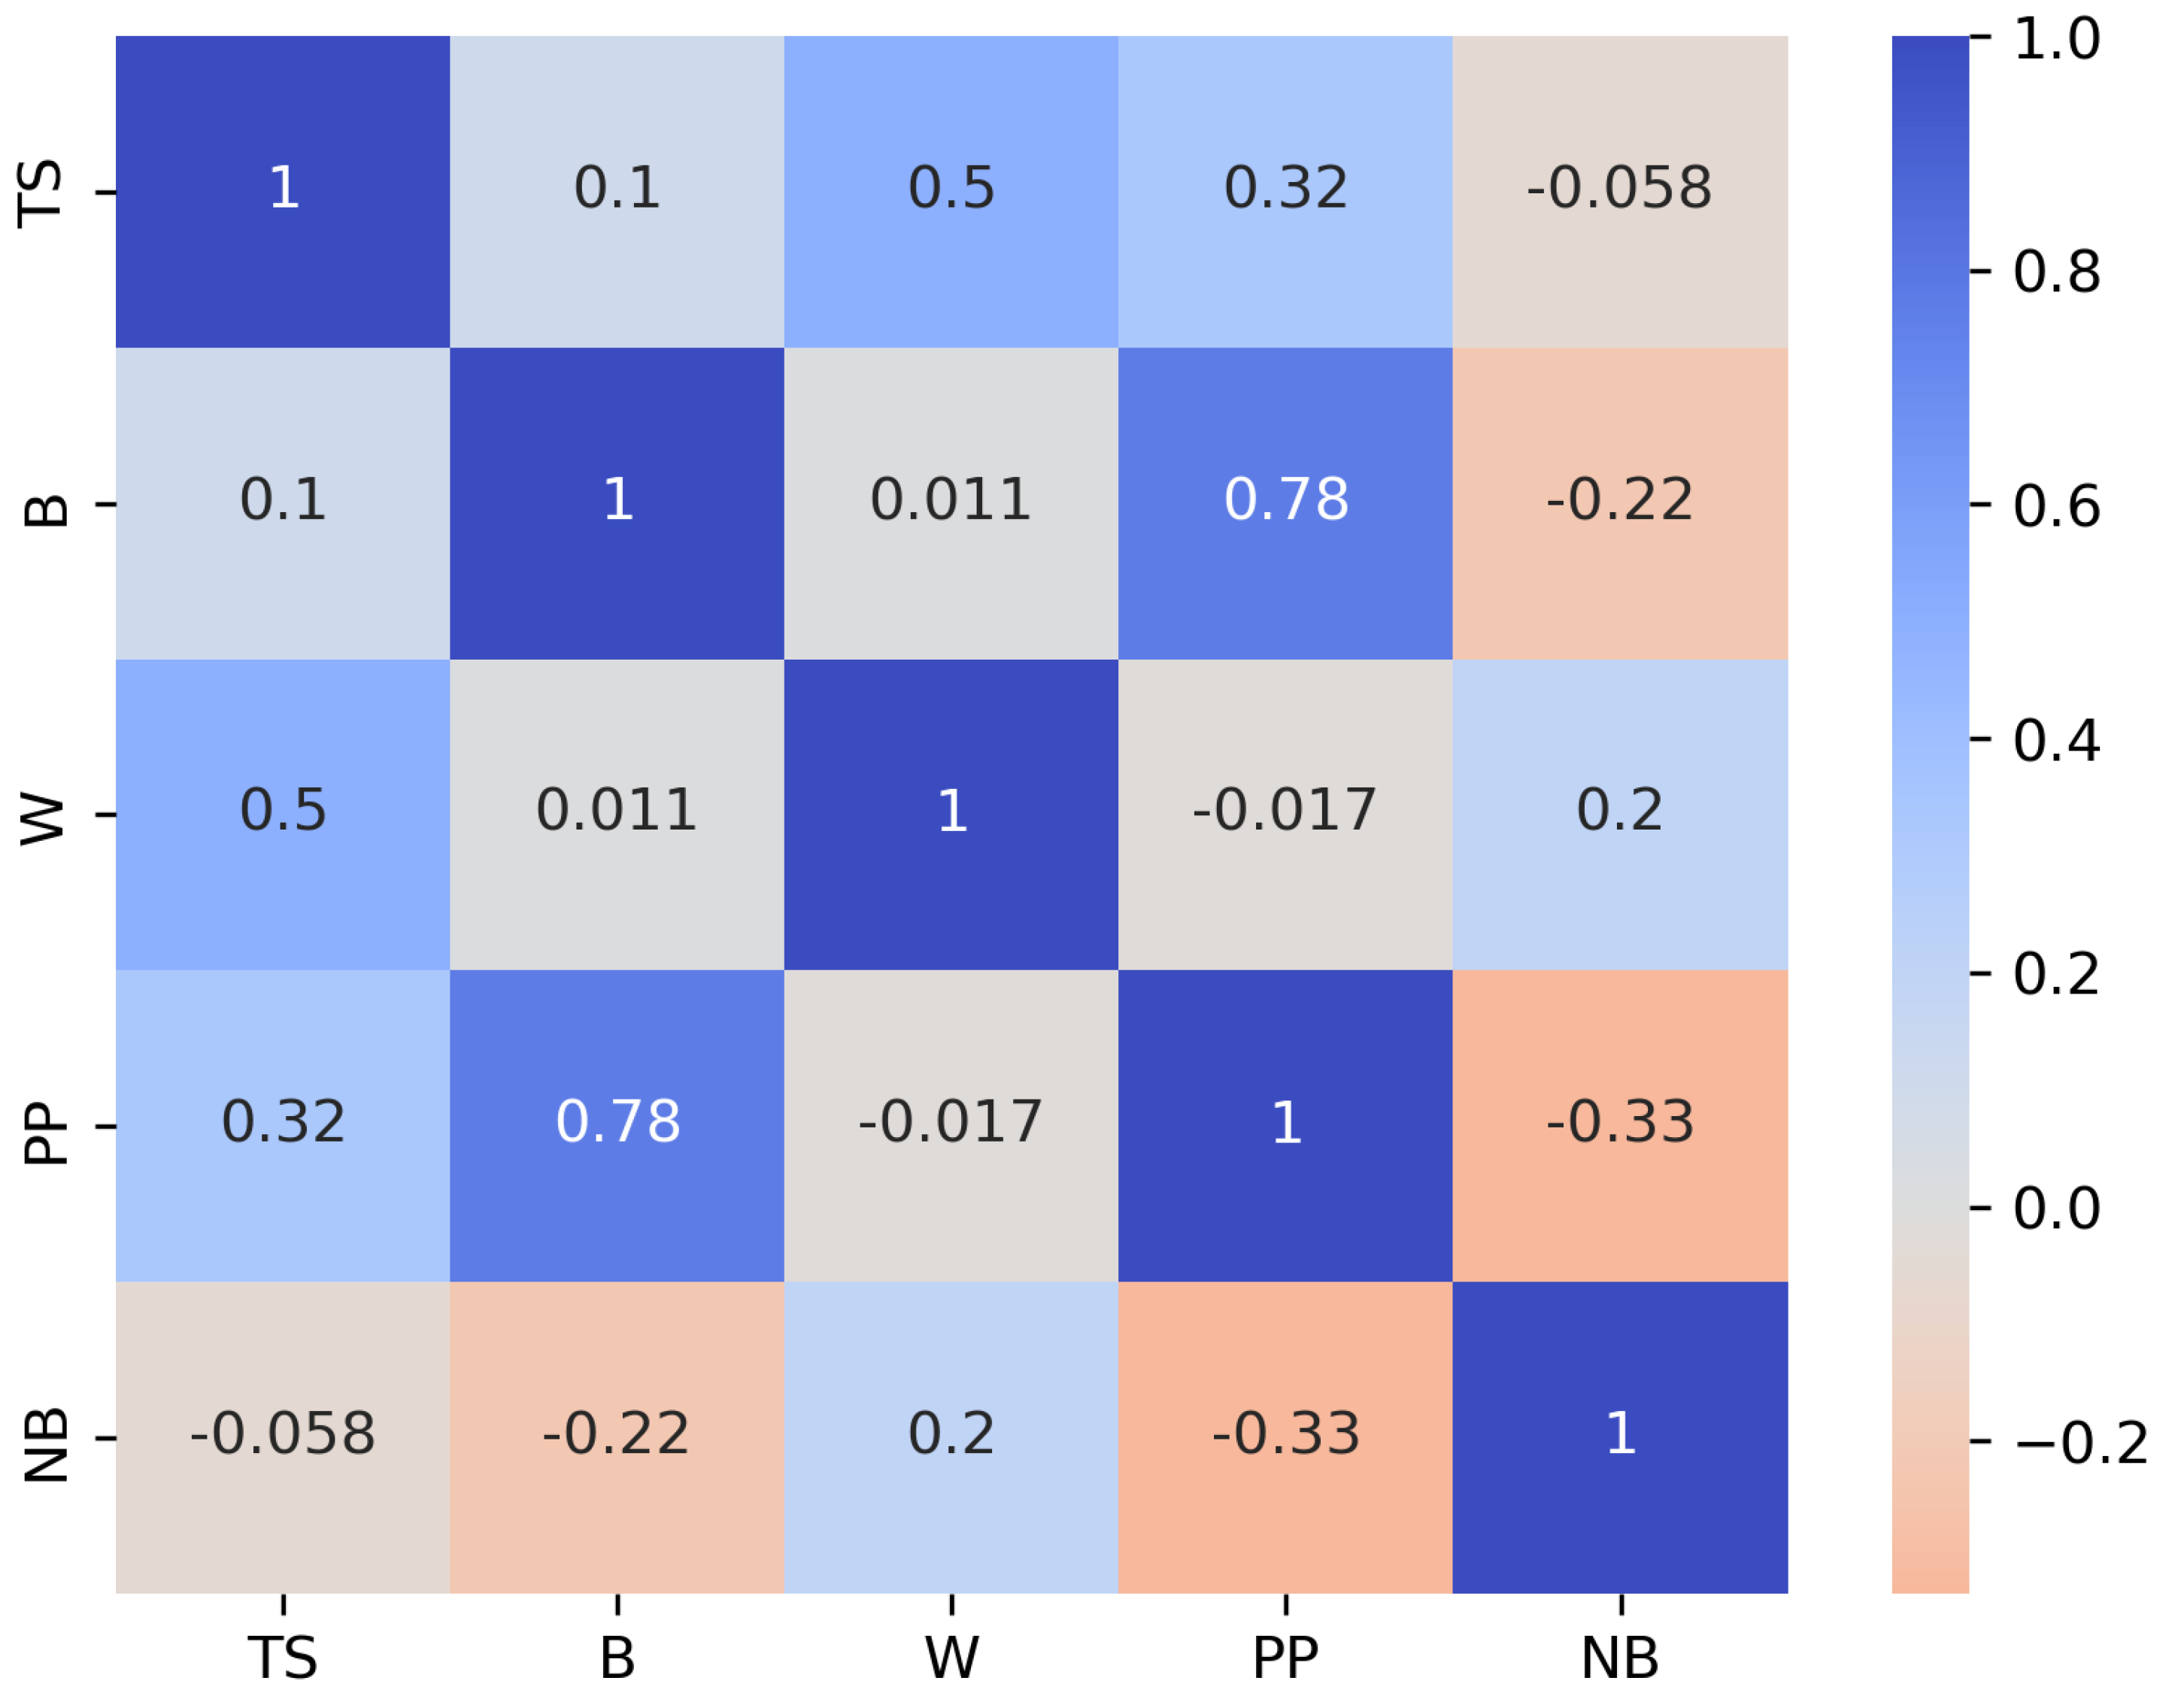
Figure 5.
Density plots per department
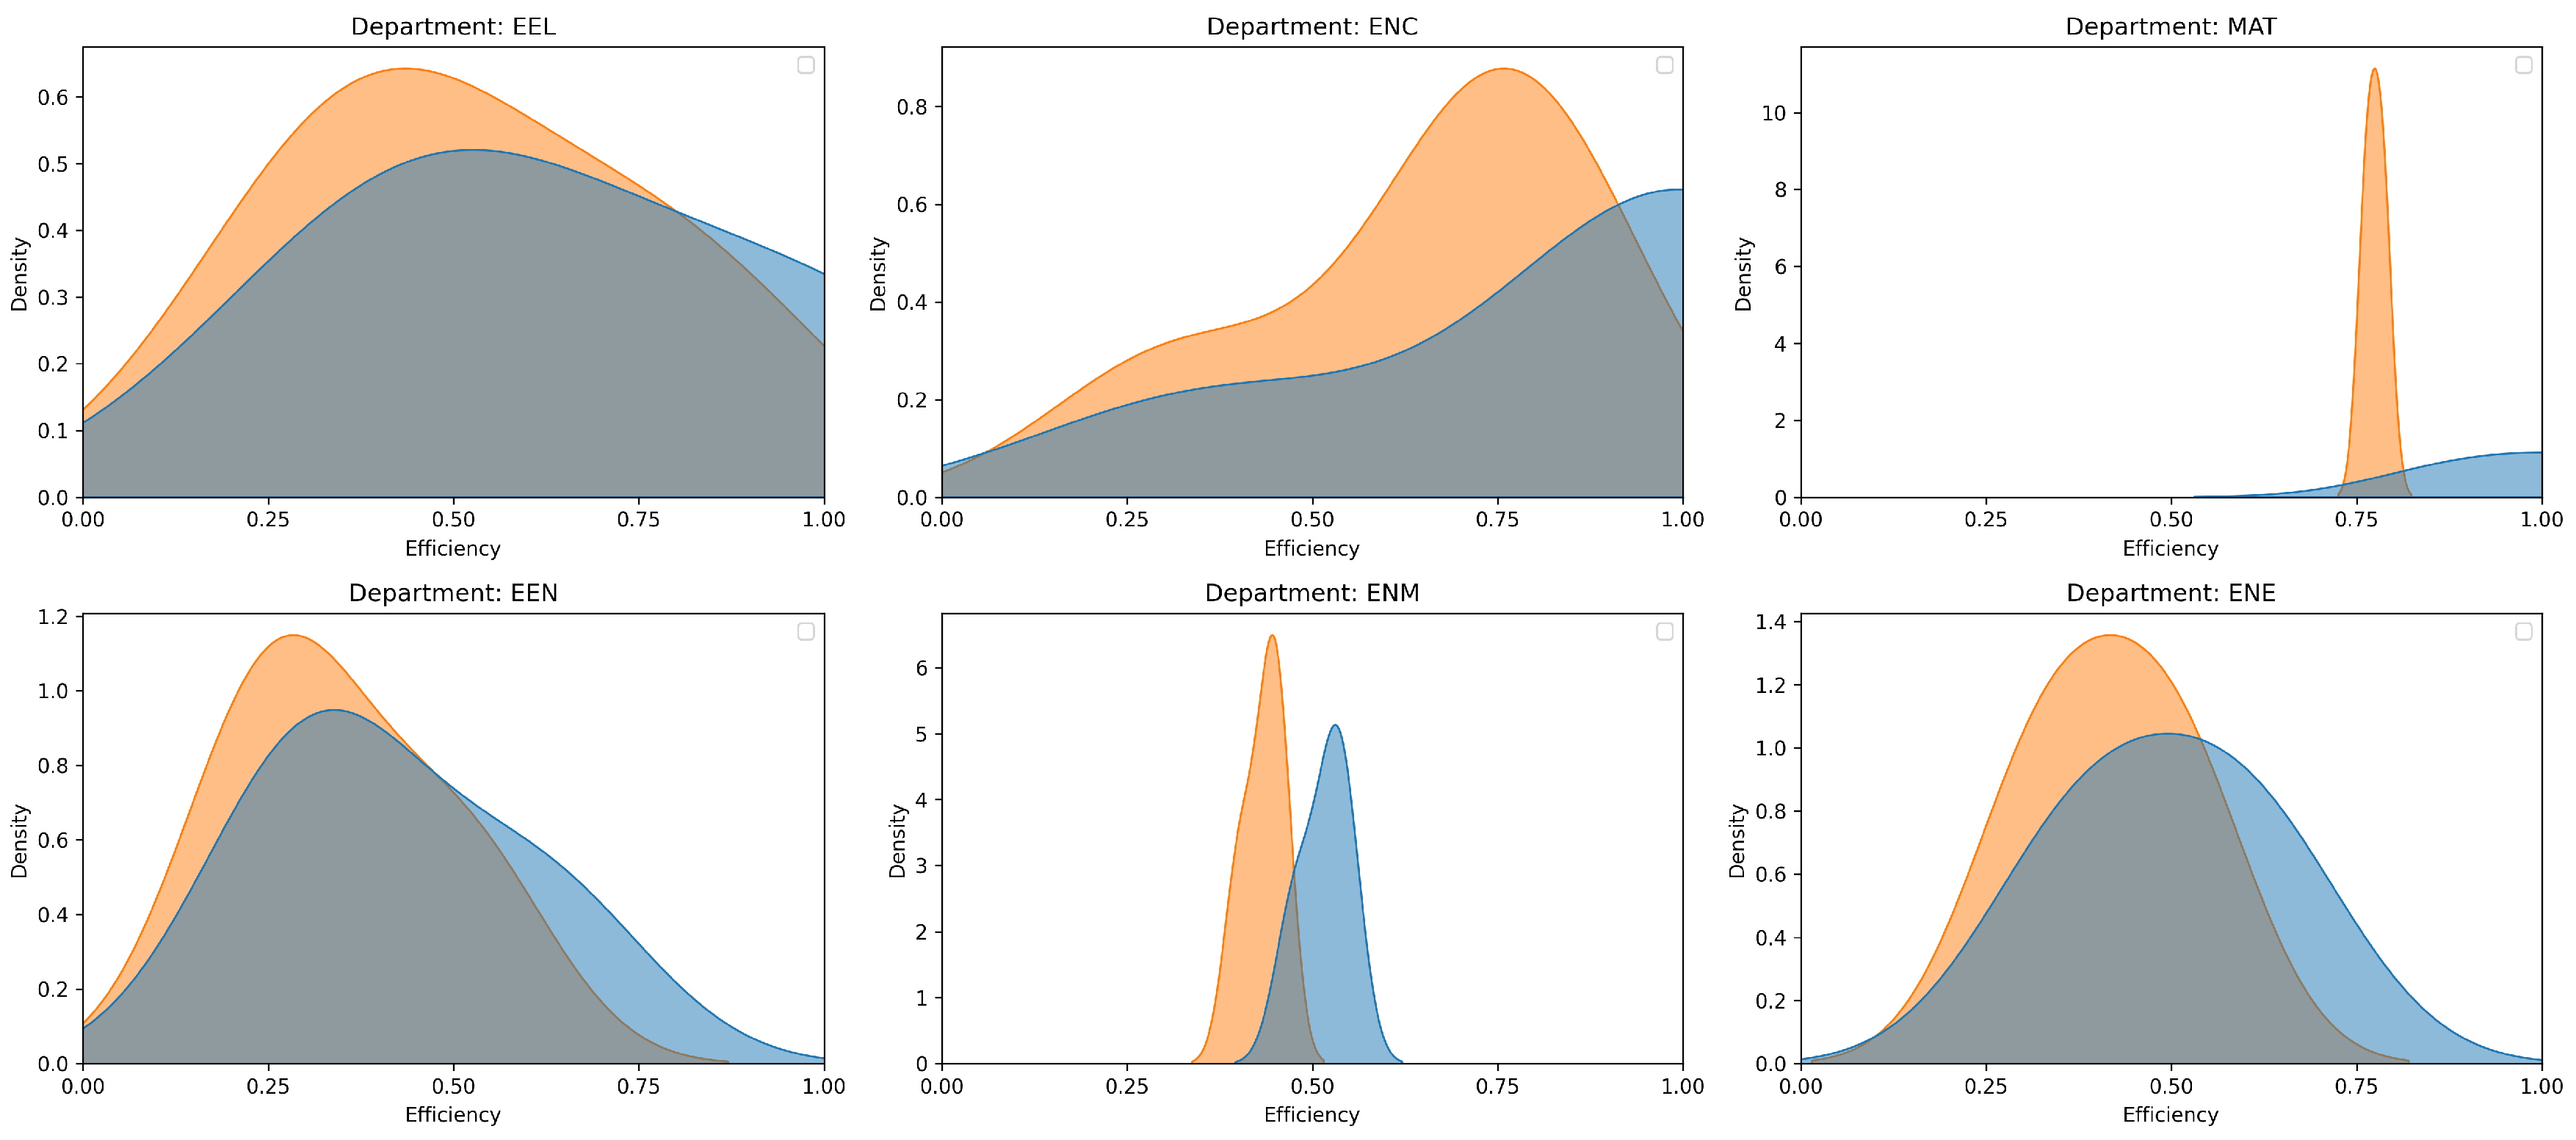
Table 1.
Previous related studies.
| Article | Overview |
|---|---|
| [22] | Use of a DEA-SBM-PA model to evaluate Green Technology R&D Efficiency in China (2011–2017). The results highlight efficiency disparities and identify improvement potentials for inefficient provinces. |
| [33] | Application of DEA with stochastic frontier analysis to assess innovation-driven performance in 20 environmental protection enterprises (2018–2020). The findings suggest optimizing resource use and labor-capital transformation for better efficiency. |
| [34] | Analyzis of 1,500 climate change R&D projects in Korea (2014–2020) using DEA. The results highlight inefficiencies in both technical and scale perspectives and propose improvement strategies to enhance national R&D efficiency. |
| [35] | Proposal of a sustainable model for project portfolio selection using DEA and Bayesian network modeling. The authors show the model outperforms traditional methods in a real case with 21 projects. |
| [36] | Introduction of a new sustainability system combining network DEA, K-means clustering, and Gini coefficient to evaluate university performance in promoting economic growth and environmental protection in China (2007–2019). The results show efficiency regress, with education-innovation gaining more priority over economy-environment. |
| [37] | Use of DEA-Malmquist analysis to evaluate technological resource allocation efficiency in the Chengdu-Chongqing-Mianyang region (2010–2019). The findings show an upward trend in efficiency, driven by technological progress and strong policy support. |
| [38] | Application of a super-efficient SBM-DEA-Malmquist model to evaluate innovation factor allocation along the Belt and Road in China (2012–2021). The results show strong agglomeration, with policy recommendations for enhancing regional innovation development. |
| [39] | Use of DEA to assess the operational efficiency of 14 state-owned forestry carbon sink projects in Fujian, identifying management capability and climate conditions as key efficiency factors. The findings suggest investment barriers limit small-scale forest farms from engaging in such projects. |
Table 2.
Selected variables.
| Type | Variable | Abbreviation | Unit of Measure |
|---|---|---|---|
| Input | Team Size | TS | People |
| Project Budget | B | USD | |
| Workload | W | Hours | |
| Output | Published Papers | PP | Papers |
| Number of Beneficiaries | NB | People |
Table 3.
Efficiency scores with and without correction.
| DMU | Depart | With Correction | 95% Confidence Level | Without Correction | |
|---|---|---|---|---|---|
| Minimum | Maximum | ||||
| DMU 4 | EEL | 0.8131 | 0.7031 | 0.9723 | 1.0000 |
| DMU 7 | EEL | 0.4690 | 0.4064 | 0.5558 | 0.5669 |
| DMU 13 | EEL | 0.3076 | 0.2649 | 0.3672 | 0.3754 |
| DMU 6 | ENC | 0.8030 | 0.6689 | 0.9754 | 1.0000 |
| DMU 17 | ENC | 0.7457 | 0.6211 | 0.9861 | 1.0000 |
| DMU 2 | ENC | 0.7429 | 0.6266 | 0.9766 | 1.0000 |
| DMU 20 | ENC | 0.3184 | 0.2751 | 0.3616 | 0.3668 |
| DMU 14 | MAT | 0.7846 | 0.6709 | 0.9772 | 1.0000 |
| DMU 12 | MAT | 0.7637 | 0.6576 | 0.9803 | 1.0000 |
| DMU 3 | EEN | 0.5136 | 0.4468 | 0.6053 | 0.6211 |
| DMU 1 | EEN | 0.2962 | 0.2548 | 0.3424 | 0.3514 |
| DMU 18 | EEN | 0.2310 | 0.1933 | 0.2738 | 0.2794 |
| DMU 5 | ENM | 0.4466 | 0.3804 | 0.5287 | 0.5393 |
| DMU 8 | ENM | 0.4503 | 0.3919 | 0.5194 | 0.5297 |
| DMU 15 | ENM | 0.4020 | 0.3531 | 0.4687 | 0.4768 |
| DMU 9 | ENE | 0.5031 | 0.4266 | 0.5923 | 0.6065 |
| DMU 11 | ENE | 0.3315 | 0.2893 | 0.3771 | 0.3836 |
| DMU 19 | DSC | 0.7567 | 0.6339 | 0.9666 | 1.0000 |
| DMU 16 | EPR | 0.7190 | 0.6260 | 0.8339 | 0.8597 |
| DMU 10 | EAU | 0.5739 | 0.4902 | 0.6841 | 0.6974 |
Table 4.
Percentage slack per DMU.
| DMU | TS | B | W | PP | NB |
|---|---|---|---|---|---|
| DMU 1 | 2.5% | 0.0% | 0.0% | 0.0% | 0.0% |
| DMU 2 | 0.0% | 0.0% | 0.0% | 0.0% | 0.0% |
| DMU 3 | 0.0% | 0.0% | 0.0% | 0.0% | 0.0% |
| DMU 4 | 0.0% | 0.0% | 0.0% | 0.0% | 0.0% |
| DMU 5 | 0.0% | 0.0% | 5.3% | 0.0% | 0.0% |
| DMU 6 | 0.0% | 0.0% | 0.0% | 0.0% | 0.0% |
| DMU 7 | 0.0% | 0.0% | 1.4% | 0.0% | 0.0% |
| DMU 8 | 1.2% | 0.0% | 0.0% | 0.0% | 0.0% |
| DMU 9 | 8.1% | 0.0% | 21.7% | 0.0% | 0.0% |
| DMU 10 | 9.4% | 0.0% | 0.0% | 0.0% | 0.0% |
| DMU 11 | 2.7% | 0.0% | 2.2% | 0.0% | 0.0% |
| DMU 12 | 0.0% | 0.0% | 0.0% | 0.0% | 0.0% |
| DMU 13 | 0.0% | 0.0% | 0.3% | 0.0% | 0.0% |
| DMU 14 | 0.0% | 0.0% | 0.0% | 0.0% | 0.0% |
| DMU 15 | 0.1% | 0.0% | 0.0% | 0.0% | 0.0% |
| DMU 16 | 53.9% | 0.0% | 0.0% | 0.0% | 7.5% |
| DMU 17 | 0.0% | 0.0% | 0.0% | 0.0% | 0.0% |
| DMU 18 | 0.0% | 0.0% | 11.8% | 0.0% | 0.0% |
| DMU 19 | 0.0% | 0.0% | 0.0% | 0.0% | 0.0% |
| DMU 20 | 4.0% | 0.0% | 2.2% | 0.0% | 0.0% |
Disclaimer/Publisher’s Note: The statements, opinions and data contained in all publications are solely those of the individual author(s) and contributor(s) and not of MDPI and/or the editor(s). MDPI and/or the editor(s) disclaim responsibility for any injury to people or property resulting from any ideas, methods, instructions or products referred to in the content. |
© 2025 by the authors. Licensee MDPI, Basel, Switzerland. This article is an open access article distributed under the terms and conditions of the Creative Commons Attribution (CC BY) license (http://creativecommons.org/licenses/by/4.0/).
Copyright: This open access article is published under a Creative Commons CC BY 4.0 license, which permit the free download, distribution, and reuse, provided that the author and preprint are cited in any reuse.


