Submitted:
08 November 2024
Posted:
11 November 2024
You are already at the latest version
Abstract
The main objective of this study was to analyze the sustainability orientation of research models in four public higher education institutions (HEIs) located in the border area between Ecuador and Colombia. Using a previously validated instrument based on the Delphi methodology, data were collected from the heads of the research units of these HEIs. Statistical analysis revealed no significant differences between the research models of the four institutions and the principles of sustainability in general. However, one institution showed significantly superior performance in the environmental and economic dimensions, suggesting a better integration of sustainability criteria into its research model. The main methodological contribution of this study lies in the comprehensive characterization of HEI research models by assessing multiple indicators in four key dimensions: environmental, social, economic and institutional. This pioneering analysis contributes to the understanding of the integration of sustainability in public HEI research models in a frontier context, a topic scarcely addressed in the specialized literature. The findings have practical implications, providing HEIs with empirical evidence to critically evaluate and improve their research models, aligning their priorities with the Sustainable Development Goals (SDGs).
Keywords:
research models
; public higher education
; sustainability
Introduction
In the Colombian-Ecuadorian border area, research in HEI must focus on the search for viable solutions to pressing challenges such as poverty, social inequality, environmental degradation, and the lack of economic opportunities (Zou et al., 2024). Inter- and transdisciplinary approaches are decisively required, integrating social, economic, cultural, political and environmental perspectives (Soini et al., 2018). Likewise, it is key to promote collaboration between HEIs, local communities, private companies and the public sector to co-create relevant knowledge (Budihardjo et al., 2021).
The objective of this study was to characterize the current components of the research models of four HEI in the Ecuador-Colombia border area using indicators in four dimensions related to sustainability: environmental, social, economic and institutional. For this, the instrument validated by the Delphi methodology was applied, with the information providers responsible for researching these HEI.
The alignment of the objectives of HEI research models with the Sustainable Development Goals (SDG) is essential to promote the sustainable progress of societies (Purcell et al., 2019), (Elalfy et al., 2020), and the Colombian-Ecuadorian border area is not the exception. As León Pupo et al. (2018) points out, university research is leading in achieving the SDG, providing the knowledge, scientific evidence and innovative solutions required to face sustainable development’s complex environmental, economic and social challenges.
Sustainability must be adopted transversally in HEI, permeating all their management areas, including their research systems (Vatn, 2020), (Gomera et al., 2021). It involves strategically orienting research towards relevant and priority topics for sustainability and training competent researchers in this field, providing them with knowledge, skills and values to contribute to sustainable development (Décamps et al., 2017). In this sense, Salvia et al. (2018) suggests aligning the university research agenda with the SDG and the 2030 Agenda, analyzing knowledge gaps, monitoring progress and proposing concrete actions to implement the SDG in local contexts effectively.
Research models in HEI in the region must define objectives, policies, procedures and practices that explicitly promote generating knowledge for sustainable development in its multiple dimensions (Greenland et al., 2022). It will require more significant investment in human capital training and specialized infrastructure (Leal Filho et al., 2018) and the establishment of concrete incentives to motivate and reward sustainability-oriented research (Luna-Krauletz et al., 2021). It is equally vital to implement systems for monitoring and evaluating the progress and impacts of research regarding sustainability. (Adenle et al., 2021)
The effective integration of sustainability into higher education systems has become imperative, given the crucial role of HEI in training professionals and generating knowledge to address complex contemporary challenges (Vatn, 2020). In this context, the research models adopted by higher education institutions (HEI) determine their contribution to sustainable development (Leal Filho et al., 2018). Although there is a growing interest in analyzing the incorporation of sustainability in different HEI, only some studies focus on research models in particular border contexts.
Research must make it possible to evaluate compliance with the objectives set out in the HEI research models from the sustainability perspective. As Mapar et al. (2022) points out, funders and external agencies increasingly demand that HEI adequately evaluate and report on their sustainable development impacts. Therefore, studies must analyze to what extent HEI are complying with generating research that contributes to sustainability.
Finally, it can be noted that this type of evaluative research allows us to identify strengths, weaknesses and gaps in the research systems of HEI regarding their orientation towards sustainability (Leal Filho et al., 2018). The results can guide HEI to establish objectives, incentives and policies that effectively promote sustainability research (Luna-Krauletz et al., 2021). Furthermore, evaluations make it possible to monitor progress and impact over time, becoming valuable tools for the actions and future of HEI.
Literature Review
The integration of sustainability in higher education has gained great relevance in recent decades, given the crucial role played by higher education institutions (HEIs) in training professionals and generating knowledge to address complex contemporary challenges (Findler et al., 2019). In this context, the research models adopted by HEIs are determinant in their contribution to sustainable development. Although there is a growing interest in analyzing the incorporation of sustainability in different aspects of HEIs, Findler et al. (2019) point out that studies that focus specifically on research models, especially in frontier contexts, are scarce. This gap in the literature is particularly relevant, as it is necessary to broaden the perspective from what HEIs do for sustainability to how these activities impact society, the environment, and the economy.
However, the integration of sustainability in higher education is not without its critics and contradictions. Kopnina (2020) questions whether Education for Sustainable Development Goals (ESDG) is really desirable as “an education for the future”. The author argues that many of the challenges posed by the SDGs are supposed to be solved by “inclusive” or “sustainable” economic growth, assuming that economic growth can be conveniently decoupled from resource consumption. However, Kopnina points out that the current hegemony of the sustainability-through-growth paradigm has increased inequalities and pressure on natural resources, exacerbating biodiversity loss, climate change and the resulting social tensions. This critique suggests that, far from challenging the status quo, the SDGs and, consequently, the ESDG, may be condoning continued environmental exploitation.
In line with these concerns, it is crucial to critically examine how HEIs address sustainability in their research models, especially in the context of entrepreneurship. Álvarez Jaramillo et al. (2018) provide a valuable perspective by analyzing the barriers faced by SMEs when implementing sustainable development initiatives. Their study identified 175 barriers, the most frequent being lack of resources, high initial capital cost to implement sustainability measures, and lack of experience. These barriers are particularly relevant in the context of public HEIs in frontier regions, where resources may be limited and expertise in sustainable practices may not be as developed as in larger institutions or more central regions.
It is important to highlight the growing need to establish a framework of key competencies in sustainability for higher education programs. Brundiers et al. (2021) note that the proliferation of sustainability programs over the past two decades has generated an urgent demand for clarity on the competencies that these programs develop in students. This clarification is crucial not only for employers and students, but also for educators and program administrators. The Delphi methodology applied by Brundiers et al. was based on the sustainability core competency framework proposed by Wiek et al. (2011), which has been widely cited and applied in sustainability programs worldwide. This approach seeks to address challenges identified in previous literature, such as the terminological confusion noted by Sterling et al. (2017) and Shephard et al. (2019), in addition to the lack of explicit consensus on a specific sustainability core competency framework.
In this context of growing interest in the role of higher education in sustainable development, Chankseliani and Mccowan (2021) argue that while the SDGs have broadened the focus beyond primary and secondary education to include tertiary education, there is a significant gap in knowledge and evidence on how universities actually contribute to sustainable development. The authors point to the need to document the wide range of activities relevant to sustainable development undertaken by universities, particularly in low- and middle-income countries, and to assess the alignment between teaching, research, community engagement, and campus operations.
The present research aligns with this growing need to examine how sustainability is integrated into HEI research models, especially in border regions. Just as Salvia et al. 2018) sought to identify the main SDGs addressed by experts from different geographic regions, this study focuses on analyzing the orientation towards sustainability in the research models of public HEIs in the border area between Ecuador and Colombia. This perspective allows addressing the gap in the literature pointed out by Findler et al. (2019) on the scarcity of studies in border contexts, considering the criticisms raised by Kopnina (2019) on the effectiveness of Education for the SDGs. By examining the environmental, social, economic, and institutional dimensions of the research models, the study contributes to a more holistic understanding of how HEIs are integrating sustainability into their practices, considering the specific barriers faced by smaller institutions. This research not only provides theoretical insights into the integration of sustainability in higher education in an understudied context, but also provides empirical evidence that can help HEIs to critically evaluate and improve their research models, aligning them with the SDGs in a way that addresses local and global sustainability challenges.
Materials and Methods
The present investigation referenced four public HEI in the Ecuador – Colombia border area. On the Ecuadorian side, the State Polytechnic University of Carchi and the Technical University of the North, while on the Colombian side, the University of Nariño and the Higher School of Public Administration Sede Pasto, the latter, together with the University of Nariño, are the two only public HEI that are located in the area mentioned above. This study used a qualitative approach to examine the relationship between the objectives of the research models of the four HEI and the SDG, for which the following methodology was carried out:
Identification of the Indicators of the Evaluation Instrument
The stages carried out in this research in order to identify the different indicators of a university research model that must be aligned with the dimensions of sustainability were based on the Delphi methodology (Reguant-Álvarez & Torrado-Fonseca, 2016) and are detailed below:
- a)
- Expert selection:
- •
- Identification of experts: A group of relevant experts in sustainability was selected. These experts for the initial round belonged to the “Sustainable Society” research group of the State Polytechnic University of Carchi. In contrast, researchers from some national and international HEI were identified for the final round.
- •
- Invitation: The experts were contacted, and their participation in the Delphi process was requested, clearly explaining the purpose, methodology and estimated duration.
- b)
- Design of the initial indicator matrix:
- •
- Preparation of questions: An initial questionnaire was designed with four open questions, which were focused on identifying, under the experts’ criteria, the indicators specific to each dimension of sustainability. These questions were:
- o
- What indicators should be part of the social dimension for a research model of an HEI located in the Colombian-Ecuadorian border area?
- o
- What indicators should be part of the economic dimension for a research model of an HEI located in the Colombian-Ecuadorian border area?
- o
- What indicators should be part of the environmental dimension for a research model of an HEI located in the Colombian-Ecuadorian border area?
- o
- What indicators should be part of the institutional dimension for a research model of an HEI located in the Colombian-Ecuadorian border area?
- •
- Anonymous format: Through the configuration of the platform used to collect the information, it was ensured that the responses issued by the experts remained anonymous throughout the process.
- c)
- Initial round:
- •
- Distribution of the questionnaire: The initial questionnaire was sent to the experts selected for this round, establishing a deadline for them to complete it.
- •
- Compilation of responses: The experts’ responses were gathered, and initial opinions and estimates were analyzed.
- •
- Summary of results: The responses from the initial round were summarized, providing the experts with an anonymous summary of the responses and comments of the other participants. With these results, the initial matrix contemplated the dimensions of sustainability with their respective indicators.
- d)
- Final round:
- •
- Validation of the initial matrix: They were evaluated, agreed upon and adapted to an initial matrix; the experts’ responses from the initial round were sent to the researchers from the external HEI for their appreciation and contributions.
- •
- Documentation of results: The final results were summarized and documented in a matrix, which included the recommendations and contributions of the experts from the external HEI.
- e)
- Analysis and application of the designed matrix:
- •
- Once the indicators established in the final matrix were analyzed, its argument was reinforced in the theoretical framework of the research, and the instrument was structured based on the said matrix, which was focused on knowing specific and direct information from the representatives of the Research Departments of the HEI evaluated around each of the identified indicators.
Application of the Designed Instrument
The instrument was addressed to the representatives of the Research Department of the four HEI. It was made up of specific questions related to the different indicators corresponding to each dimension of sustainability, which were identified with the Delphi methodology explained above. Those responsible rated each question based on the information available in their department. It should be noted that to protect the privacy and confidentiality of the information provided by each HEI, the results obtained were handled under the criterion of identification data.

Table 1.
Questions asked to those responsible for the Research departments of the HEI.
| Description | ||
| Code | Ask | |
| What is the percentage of the budget allocated to the Research Department for developing research activities aimed at sustainability? | ||
| What percentage of the Research Department’s budget for developing research activities aimed at sustainability comes from external financing? | ||
| What percentage of the Research Department’s budget is used to grant incentives for research activities focused on sustainability? | ||
| Description | ||
| Code | Ask | |
| What is the number of sustainability research activities carried out on an ad honorem basis? | ||
| What is the percentage of research projects involved in optimizing economic resources for sustainable alternatives? | ||
| What is the percentage of research projects for local and regional development with a sustainability focus? | ||
| What is the number of departments and/or centres that carry out research activities with the provision of services to society? | ||
| What is the number of sustainability reports and documents published by the IES and linked to society derived from research activities? | ||
| What is the percentage of participation of women in research activities? | ||
| What is the percentage of research projects related to renewable energy, ecological economy, urban planning, and other environmental projects? | ||
| What is the number of departments, units or environmental management centres that carry out research? | ||
| What is the number of scientific events oriented to the environmental component? | ||
| What is the percentage of research groups focused on the environmental dimension? | ||
| What is the percentage of research seedbeds focused on the environmental dimension? | ||
| How many participants in external scientific events are oriented to the environmental component? | ||
| What is the relationship between the institutional mission and vision of sustainability? | ||
| What is the percentage of HEI research teachers with sustainability training? | ||
| What is the percentage of graduate students with research in sustainability? | ||
| What is the percentage of curricular spaces directed to formative research focusing on sustainability in the institutional, educational model? | ||
| What is the number of research publications focused on topics related to sustainability? | ||
| How many clubs are focused on research and sustainability activities? | ||
| How many research groups are focused on research and sustainability activities? | ||
| How many research hotbeds are focused on research and sustainability activities? | ||
| What is the percentage of graduate programs with a focus on sustainability? | ||
Regarding the statistical analysis and the extraction of information with significant relevance derived from the instrument, it was crucial to consider that the initial data collected through the device in its preliminary stages potentially lacked validity and could encompass atypical observations that, consequently, could hinder the extraction and interpretation of the results obtained.
For these reasons, selecting the Z Score as a data processing technique was decided, simultaneously implementing the Kruskal-Wallis and Dunn- Šidák Tests to evaluate differences and paired Chi and Chi proportion tests for an exhaustive analysis. The methodical selection of these statistical techniques sought not only to mitigate the influence of potential anomalies in the data but also to facilitate an interpretation and extraction of the information coherently aligned with the relevant scientific and academic precepts and standards. This meticulous approach to selecting analytical techniques was instrumental in ensuring the robustness and validity of the conclusions derived from the subsequent analysis process.
Z score articulates a specific data point about the mean and standard deviation within a set of points. Assignment of a score z consists of placing the data in a normalized distribution, defined by a mean of 0 and a standard deviation of 1.
Using the evaluation z is to neutralize the effects caused by the location and scale of the data, thus facilitating direct comparison between different data sets. The logic behind using z -z-score to identify outliers is that, once the data has been centred and rescaled, any value that deviates significantly from zero (typically a threshold set on a score z of 3 or -3) should be identified as an outlier.
Under the assumption that the data are normally distributed (adopting a bell-shaped curve), the expression:
where µ is the average and σ standard deviation will capture 99.7% of the observations. In a statistical context, any value outside this range is considered abnormal. In a simplified way, the standard score can be calculated as follows:
µ+3σ
In rigorous mathematical language, the equation to calculate the score z is:
is the score z for a specific observation; is the observation ‘s value, the data set’s mean and σ is the data set’s standard deviation (Valera & Sánchez, 1997).
Kruskal Wallis test. The information accumulated through the evaluation instrument parameters facilitates an accurate appreciation of the scores achieved in each observation for the unobserved latent variables (factors). Since these data are derived from non-ordinal variables, it is imperative to employ a non-parametric technique for comparison. The Kruskal-Wallis test is presented as a non-parametric alternative to one-way ANOVA, in which it is assumed that the observations in each sample group emanate from an identical distribution. Therefore, the null hypothesis formulated for this test is:
In the previous context presented, ηi is the median of the i-th group defined by the categorical variable in the sample. The null hypothesis is formulated as follows: “H0: the samples come from identical populations.” We assume that the variable representing the total number of observations, mathematically where represents the sample size of each group and symbolizes the number of groups to be compared. When ties exist, the ranks are obtained for each observation in ascending or descending order of magnitude. In this way, represents the rank assigned to the j-th observation of the i-th group, and they represents the sum of ranks assigned to the ith group, applicable for . In this way, the static test T is defined as:
where:
If no ties coexist, it is simplified to the expression and the statistical test is reduced to equation 6:
Under the null hypothesis : and the preliminarily defined assumption, it is distributed asymptotically to the chi-square distribution with degrees of freedom . (Lehmann, 2006; Nwobi & Akanno, 2021)
Dunn Šidák. This test was drawn up for the comparison between more than two samples in a paired manner, thus constituting an alternative posterior test for the Kruskal-Wallis test, where if the level of significance is reached at a general level, the Dunn test can contrast each possible pair and identify which pairs of groups present significant differences. The Dunn- Šidák test was proposed by Tinoco (2008), which was developed on equality. Proposed by Šidák. This update of the inequality expression is considered an improved version of the Bonferroni inequality since the confidence intervals obtained in this case are smaller than those used in the Bonferroni test. Additionally, depending on the family size, the Dunn test is suitable for providing confidence intervals even smaller than the Tuckey test. For a given FWER (family-wise error rate) error metric , the Dunn-Šidák contrast defined as can be calculated by the expression:
where
and are the means of the samples considered; is the number of possible comparisons in the family, and the quantile is obtained from the Student probability distribution for a certain degree of freedom parameter . Finally, the confidence intervals for each possible Dunn- Šidák contrast are obtained by the expression:
Chi proportion test. It focuses primarily on the evaluation of independence between two variables of a categorical nature. The null hypothesis (Ho) postulates the absence of a relationship between the variables in question; in contrast, the alternative hypothesis (Ha) proposes the existence of a relationship between them. The mathematical formulation to calculate. χ2 is articulated as follows:
It should be taken into account that the expected frequency = p*o total. It is essential to emphasize rigour in applying and interpreting the test. χ 2 is essential to obtain valid and applicable results, providing genuine insight into the scientific research (Tinoco, 2008).
Results
Data treatment. The instrument completed by the research departments of the 4 HEIs consisted of 24 questions addressing 4 dimensions that were quantified using percentage indicators. In this way, the responses and data obtained from the 4 institutions were tabulated in a database in format, which was processed using the statistical programming language through the software . The factors used, and the variables coded for each factor are presented in Table 1.
Table 1.
Pairwise comparisons using T-tests with pooled standard deviation.
| Factor | Questions |
| Economic dimensión | |
| Social dimensión | |
| Environmental dimension | |
| Institutional dimension |
Additionally, the descriptive statistics observed in each of the 4 HEI that participated in the experiment are presented in Table 2.
The data collected for each of the multivariate observations were analyzed using the score, which made it possible to determine that there were no atypical observations in the sample. In this way, the Z score of each observation was estimated. When compared with an interval of standard deviations, no outlier observations were identified, so no data was removed from the sample.
Verification of assumptions. Next, the assumptions of normality, linearity, Homogeneity, and Homoscedasticity in the sample were verified to determine whether the sample was parametric or non-parametric. This way, when applying the Shapiro test for each group determined by each HEI, 0.0001086, 0.3166, 0.007109 and 0.02375 were obtained , so the normality assumption was rejected. Similarly, the linearity of the sample was verified using the QQ-Plot, which corresponds to the diagram of sample quantiles, plotted as a function of the theoretical quantiles obtained from a distribution for the number of degrees of freedom defined by the number of sample variables. The QQ-Plot of the sample quantiles concerning the theoretical ones is presented in Figure 1.
As shown in Figure 1, when plotting the sample quantiles concerning the theoretical quantiles, these were oriented in an arrangement similar to a slope line in the interval from -2 to 2, so the assumption of linearity. The assumption of Homogeneity was analyzed using Levene’s test, using the groups defined by each HEI as a categorical variable, using of . In this way, a statistic was obtained that allowed us to determine a , , so the assumption of Homogeneity was rejected. Finally, Homoscedasticity was analyzed using the Breusch -Pagan test, which was applied through the library, where a statistic of , equivalent to a , was obtained , so the null hypothesis was rejected, which implies the rejection of the assumption of homoskedasticity.
Tests of differences. In summary, the sample exceeded the assumption of linearity but did not meet the assumptions of normality, Homogeneity and Homoscedasticity, so it was concluded that it is not parametric. For this reason, the Kruskal-Wallis test was selected as the general test and the Dunn test as the post-hoc test. The results of these difference tests are presented in Figure 2 and Table 3.
As seen in Table 3, the research models generally applied in each HEI did not present significant differences since the p-value obtained in the general Kruskal-Wallis test did not reach the significance level. Likewise, when carrying out all the paired contrasts using the Dunn- Šidák test, no significant difference was identified, so it was concluded that there was not enough evidence to affirm which research model with a focus on sustainability is applied correctly. Better or worse way. It can be considered the general analysis phase of the collected sample; however, essential findings are detailed below when contrasting the indicators collected within each dimension defined in Table 1.
Tests of proportions. The goodness-of-fit test was used to determine if there were significant differences in the frequencies represented by the percentages of indicator data in each of the dimensions proposed in the instrument. If the observed frequencies deviate significantly from a distribution with equal proportions, it is inferred that there is a significant difference. Furthermore, this test was carried out by comparing each pair of HEI research models. The hypotheses raised were:
: The data matches the distribution .
: The data does not match the distribution .
Here, it symbolizes discrete uniform distribution, which in this context indicates equal proportions. Thus, if the null hypothesis is discarded, the distribution does not reflect equitable proportions.
The analysis was initially applied considering the indicators that made up the environmental dimension. The graphic representation and frequency distribution regarding the total score achieved in the environmental dimension are presented in Figure 3. The results of the general goodness-of-fit test χ2 and each paired contrast are detailed in Table 2.
Table 4.
Results of the general and paired goodness-of-fit tests for the proportions of the environmental dimension for each HEI.
Table 4.
Results of the general and paired goodness-of-fit tests for the proportions of the environmental dimension for each HEI.
| Goodness of fit test | |||||||
| 41,983 | Df | 3 | p-value |
4.4e-09 Significant |
|||
| fit tests | |||||||
| HEI 1 | HEI 2 | HEI 3 | HEI 4 | ||||
| HEI 1 | * |
|
|
|
|||
| HEI 2 |
1.108737e-05 Significant |
* |
|
|
|||
| HEI 3 |
3.192852e-10 Significant |
4.406540e-02 Significant |
* |
|
|||
| HEI 4 |
4.353697e-03 Significant |
1.104501e-01 Not significant |
3.335724e-04 Significant |
* | |||
When applying the general test to the database, significant differences were identified between the sample groups in the environmental dimension, with a of . It led to the rejection of the null hypothesis, showing significant differences in the proportions of the frequencies reached by the indicators of each HEI. Therefore, all possible paired comparisons were carried out. When analyzing the results of these comparisons, it was found that HEI 3 achieved a score significantly higher than that of HEI 1, 2 and 4 with p- -values of , and , respectively. Similarly, HEI 2 scored significantly higher than HEI 1 and 4, with p-values of and , respectively. It is observed that the research model of HEI 1 was significantly inferior to that of the other HEIs in the environmental dimension.
Next, the same analysis strategy was applied to the economic dimension. The graphic representation and frequency distribution regarding the total score achieved in the economic dimension are presented in Figure 4. The results of the general goodness-of-fit test χ2 and each paired contrast are detailed in Table 3.
Table 3.
Results of the general and paired goodness-of-fit tests χ2 for the proportions of the economic dimension for each HEI.
Table 3.
Results of the general and paired goodness-of-fit tests χ2 for the proportions of the economic dimension for each HEI.
| Goodness of fit test | ||||||||
| 210.78 | Df | 3 | p-value |
2.2e-16 Significant |
||||
| fit tests | ||||||||
| HEI 1 | HEI 2 | HEI 3 | HEI 4 | |||||
| HEI 1 | * |
|
|
|
||||
| HEI 2 |
4.107690e-02 Significant |
* |
|
|
||||
| HEI 3 |
9.300414e-21 Significant |
1.235322e-28 Significant |
* |
|
||||
| HEI 4 |
5.766790e-01 Not significant |
1.366564e-01 Not significant |
7.858856e-23 Significant |
* | ||||
When applying the general test to the database, significant differences were identified between the sample groups in the economic dimension, with a of , evidencing significant differences in the proportions of the frequencies reached by the indicators of each HEI. For this reason, all possible paired comparisons were carried out. When analyzing the results of these comparisons, it was found that HEI 3 achieved a score significantly higher than that of HEI 1, 2 and 4 with p- p-values of , and , respectively. Similarly, HEI 2 presented a score significantly lower than HEI 1, with a p-value of . Furthermore, it was observed that when comparing HEI 4 with HEI 1 and 2, the significance threshold was not reached, so it was concluded that there was not enough evidence to affirm which HEI had a better or worse performance in the economic dimension.
Subsequently, the same analysis strategy was applied to the institutional dimension. The graphic representation and frequency distribution regarding the total score achieved in the institutional dimension are presented in Figure 5. The results of the general goodness-of-fit test χ2 and each paired contrast are detailed in Table 4.
Table 4.
Results of the general and paired goodness-of-fit tests for the proportions of the institutional dimension for each HEI.
Table 4.
Results of the general and paired goodness-of-fit tests for the proportions of the institutional dimension for each HEI.
| Goodness of fit test | ||||||||
| 210.78 | Df | 3 | p-value |
2.2e-16 Significant |
||||
| fit tests | ||||||||
| HEI 1 | HEI 2 | HEI 3 | HEI 4 | |||||
| HEI 1 | * |
|
|
|
||||
| HEI 2 |
4.107690e-02 Significant |
* |
|
|
||||
| HEI 3 |
9.300414e-21 Significant |
1.235322e-28 Significant |
* |
|
||||
| HEI 4 |
5.766790e-01 Not significant |
1.366564e-01 Not significant |
7.858856e-23 Significant |
* | ||||
When applying the general test to the database for the institutional dimension, significant differences were identified between the sample groups, with a of , thus evidencing significant differences in the proportions of the frequencies reached by the indicators of each HEI. In this way, all possible paired comparisons were made. When analyzing the results of these comparisons, it was found that HEI 3 scored significantly higher than HEI 2 and 4, with p-values of and , respectively. Similarly, HEI 1 presented a score significantly higher than HEI 2 and 4 with p-values of and respectively. Furthermore, it was observed that the significance level still needed to be reached when comparing the scores of HEI 1 with three and HEI 2 with 4. In this study, there needed to be more evidence to determine which of the HEI of each pair performed superiorly.
Finally, the same analysis strategy was applied to the social dimension. The graphic representation and frequency distribution regarding the total score achieved in the social dimension are presented in Figure 6. The results of the general goodness-of-fit test, and each paired contrast are detailed in Table 5.
The general test of the database for the social dimension made it possible to identify significant differences between the sample groups, with a of , thus evidencing significant differences in the proportions of the frequencies reached by the indicators of each HEI. In this way, all possible paired comparisons were made. When analyzing the results of these comparisons, it was found that HEI 3 achieved a score significantly higher than that of HEI 1, 2 and 4 with p- values of , and , respectively. Similarly, HEI 1 scored significantly higher than HEI 2 and 4, with p-values of and , respectively. Furthermore, it was observed that when comparing the scores of HEI 2 and 4, the significance level was not reached, so there needed to be more evidence to affirm which HEI has a better research model focusing on sustainability from the social perspective.
Discussion
The results obtained provide empirical evidence on the level of orientation of these HEI towards sustainability research. One of the study’s main strengths was the use of an instrument validated by experts both in the research area and in sustainability, contextualized to the territory of influence of the participating HEI.
Regarding the findings, the study determined that, in general terms, there were no significant differences between the research models of the four HEI analyzed. However, when examining each dimension separately, divergences were evident. For example, HEI 3 obtained scores significantly higher in the environmental dimension than the rest, while HEI 1 presented lower performance. Similarly, HEI 3 widely stood out above the others in the economic dimension. These results suggest that HEI 3 has achieved greater integration of sustainability criteria in its environmental and economic research priorities, which may be due to the particular characteristics of the institution, such as its extension or how it manages resources with the that says.
An essential aspect of the present research was the comprehensive characterization of model components by evaluating multiple indicators in sustainability dimensions, a broader approach than studies focused on specific indicators such as those carried out by Millones-Gómez et al. (2021) and Armijos Valdivieso et al. (2022).
The study allowed the identification of strengths and weaknesses of the models, establishing statistical differences between HEI in economic, social, environmental and institutional aspects. Systematic comparisons between research models for sustainability constitute another significant contribution, which allows decisions to be made in higher education, as stated (Vatn, 2020).
Among the main contributions is that this is one of the first approaches to integrating sustainability in research models of border public HEI, a little explored context. The indicators could be adapted for broader benchmarking and in other contexts.
Regarding limitations, it can be noted that the results based on perceptions may not reflect actions implemented in the models. Furthermore, the high number of indicators makes an in-depth analysis difficult, and the comparisons are limited to the four HEI studied. Although it did not find radical differences between the models, it did show variations between dimensions, which can guide specific improvements. It is necessary to expand this line of research with more robust studies that analyze a more significant number of HEI and use mixed methSDG to obtain generalizable results.
The findings have practical implications for HEI to critically analyze their models and introduce improvements that align their research priorities with the SDG and the sustainability needs of their local contexts. The research is expected to drive advances towards models that guide objectives and practices to generate relevant knowledge to face these types of contemporary challenges.
Recomnendations
Higher education institutions (HEIs) in the border area between Ecuador and Colombia should strengthen the integration of sustainability criteria in their research models, particularly in the environmental and economic dimensions. This is justified by the results that show significant variations among HEIs in these areas. It is suggested that HEIs with lower performance in these dimensions analyze and adopt the successful practices of HEI 3, which excelled in these aspects. For future research, it is recommended that mixed methods be used to obtain more generalizable and in-depth results. Likewise, HEIs are advised to implement systems for continuous monitoring and evaluation of their research models in relation to sustainability, which will allow for more accurate tracking of the progress and impact of their research in this area. Finally, HEIs are encouraged to foster interdisciplinary and transdisciplinary collaboration, as well as to establish partnerships with local communities, private companies and the public sector to co-create relevant knowledge.
Conclusions
This research analyzed the alignment of the objectives of the research models of four important public HEI in the border area between Ecuador and Colombia with the Sustainable Development Goals. The study provides novel empirical evidence on the level of orientation towards research for sustainability in the border university context studied.
One of the study’s main findings is that, in general terms, no radical differences were found between the models of the HEI analyzed. It suggests that integrating sustainability into research priorities presents little variations between the institutions studied. However, when examining specific dimensions, significant divergences were found.
The study allowed for a comprehensive characterization of the research models by evaluating multiple indicators in the four dimensions of sustainability. This multidimensional approach allows us to identify both strengths and weaknesses in the models, which can become a valuable tool for decision-making by those responsible for each institution.
Systematic comparisons between HEI models constitute another relevant contribution of the research, establishing methodological foundations that could be replicated in broader studies on research models for sustainability in border university contexts.
Acknowledgements
I would like to thank all the people who made this research possible. In particular to all the researchers involved in the design of the instruments and in the collection of the data. Undying gratitude goes to the research departments of the Universidad Técnica del Norte, Universidad de Nariño, Escuela Superior de Administración Pública and Universidad Politécnica Estatal del Carchi, who were the Institutions of Higher Education involved in the study.
References
- Adenle, Y. A., Chan, E. H. W., Sun, Y., & Chau, C. K. (2021). Assessing the relative importance of sustainability indicators for smart campuses : A case of higher education institutions in Nigeria. Environmental and Sustainability Indicators, 9(December 2020), 100092. [CrossRef]
- Álvarez Jaramillo, J., Lía, G., & Mendoza, O. (2018). Barriers to sustainability for small and medium enterprises in the framework of sustainable development — Literature review. Business Strategy and the Environment, June, 1–13. [CrossRef]
- Armijos Valdivieso, P., Avolio Alecchi, B., & Arévalo-Avecillas, D. (2022). Factors that Influence the Individual Research Output of University Professors: The Case of Ecuador, Peru, and Colombia. Journal of Hispanic Higher Education, 21(4), 450–468. [CrossRef]
- Brundiers, K., Barth, M., Cebrián, G., Cohen, M., Diaz, L., Doucette, S., Weston, R., Geoffrey, D., Niki, H., & Meghann, H. (2021). Key competencies in sustainability in higher education — toward an agreed - upon reference framework. Sustainability Science, 16(1), 13–29. [CrossRef]
- Budihardjo, M. A., Ramadan, B. S., Putri, S. A., Wahyuningrum, I. F. S., & Muhammad, F. I. (2021). Towards sustainability in higher-education institutions: Analysis of contributing factors and appropriate strategies. Sustainability (Switzerland), 13(12), 1–14. [CrossRef]
- Chankseliani, M., & Mccowan, T. (2021). Higher education and the Sustainable Development Goals. Higher Education, November 2020, 1–8. [CrossRef]
- Décamps, A., Barbat, G., Carteron, J. C., Hands, V., & Parkes, C. (2017). Sulitest: A collaborative initiative to support and assess sustainability literacy in higher education. International Journal of Management Education, 15(2), 138–152. https://doi.org/https://www.sciencedirect.com/science/article/abs/pii/S1472811717300629.
- Elalfy, A., Palaschuk, N., El-Bassiouny, D., Wilson, J., & Weber, O. (2020). Scoping the evolution of corporate social responsibility (CSR) research in the sustainable development goals (SDGS) era. Sustainability (Switzerland), 12(14). [CrossRef]
- Findler, F., Schönherr, N., & Lozano, R. (2019). Assessing the Impacts of Higher Education Institutions on Sustainable Development — An Analysis of Tools and Indicators. Sustainability, 11, 1–19. [CrossRef]
- Gomera, A., de Toro, A., Aguilar, J. E., Guijarro, C., Antúnez, M., & Vaquero-Abellán, M. (2021). Combining management, education and participation for the transformation of universities towards sustainability: The trébol programme. Sustainability (Switzerland), 13(11). [CrossRef]
- Greenland, S., Saleem, M., Misra, R., & Mason, J. (2022). Sustainable management education and an empirical five-pillar model of sustainability. The International Journal of Management Education, 20(3), 100658. [CrossRef]
- Kopnina, H. (2020). Education for the future ? Critical evaluation of education for sustainable development goals. The Journal of Environmental Education, January, 1–12. [CrossRef]
- Leal Filho, W., Pallant, E., Enete, A., Richter, B., & Brandli, L. L. (2018). Planning and implementing sustainability in higher education institutions: an overview of the difficulties and potentials. International Journal of Sustainable Development and World Ecology, 25(8), 712–720. [CrossRef]
- Lehmann, E. (2006). Nonparametrics Statistical Methods Based on Ranks. Springer New York, NY.
- León Pupo, N. I., Castellanos Domínguez, M. I., Curra Sosa, D., Cruz Ramírez, M., & Rodríguez Palma, M. I. (2018). Investigación en la Universidad de Holguín: compromiso con la Agenda 2030 para el desarrollo sostenible. Actualidades Investigativas En Educación, 19(1). [CrossRef]
- Luna-Krauletz, M. D., Juárez-Hernández, L. G., Clark-Tapia, R., Súcar-Súccar, S. T., & Alfonso-Corrado, C. (2021). Environmental education for sustainability in higher education institutions: Design of an instrument for its evaluation. Sustainability (Switzerland), 13(13). [CrossRef]
- Mapar, M., Bacelar-Nicolau, P., & Caeiro, S. (2022). Sustainability Assessment Tools in Higher Education Institutions: Comprehensive Analysis of the Indicators and Outlook. The Wiley Handbook of Sustainability in Higher Education Learning and Teaching, 153–186. [CrossRef]
- Millones-Gómez, P. A., Yangali-Vicente, J. S., Arispe-Alburqueque, C. M., Rivera-Lozada, O., Calla-Vásquez, K. M., Calla-Poma, R. D., Requena-Mendizábal, M. F., & Minchón-Medina, C. A. (2021). Research policies and scientific production: A study of 94 Peruvian universities. PLoS ONE, 16(5 May), 1–15. [CrossRef]
- Nwobi, F., & Akanno, F. (2021). Power comparison of ANOVA and Kruskal–Wallis tests when error assumptions are violated. Advances in Methodology and Statistics / Metodološki Zvezki, 18(2), 53–71. [CrossRef]
- Purcell, W. M., Henriksen, H., & Spengler, J. D. (2019). Universities as the engine of transformational sustainability toward delivering the sustainable development goals “ Living labs ” for sustainability. 20(8), 1343–1357. [CrossRef]
- Reguant-Álvarez, M., & Torrado-Fonseca, M. (2016). El método Delphi. REIRE. Revista d’Innovació i Recerca En Educació, 9(9 (1)), 0–2. [CrossRef]
- Salvia, A. L., Filho, W. L., Brandli, L. L., & Griebeler, J. S. (2018). Assessing research trends related to sustainable development Goals: Local and global issues. Journal of Cleaner Production, 198, 1276–1288. [CrossRef]
- Shephard, K., Rieckmann, M., & Barth, M. (2019). Seeking sustainability competence and capability in the ESD and HESD literature: An international philosophical hermeneutic analysis. Environmental Education Research, 25(4), 532–547. [CrossRef]
- Soini, K., Jurgilevich, A., Pietikäinen, J., & Korhonen-Kurki, K. (2018). Universities responding to the call for sustainability: A typology of sustainability centres. Journal of Cleaner Production, 170, 1423–1432. https://doi.org/https://www.sciencedirect.com/science/article/abs/pii/S0959652617319303.
- Sterling, S., Glasser, H., Rieckmann, M., & Warwick, P. (2017). “ More than scaling up ”: a critical and practical inquiry into operationalizing sustainability competencies. Envisioning Futures for Environmental and Sustainability Education, 153–168.
- Tinoco, O. (2008). Una aplicación de la prueba chi cuadrado con SPSS. Industrial Data, 11(1), 73–77.
- Valera, A., & Sánchez, J. (1997). Pruebas de significación y magnitud del efecto: Reflexiones y propuestas. Anales de Psicología, 13(1), 85–90.
- Vatn, A. (2020). Institutions for sustainability—Towards an expanded research program for ecological economics. Ecological Economics, 168(September 2019), 106507. [CrossRef]
- Wiek, A., Withycombe, L., & Redman, C. L. (2011). Key competencies in sustainability: A reference framework for academic program development. Sustainability Science, 6(2), 203–218. [CrossRef]
- Zou, F., Bhuiyan, M. A., Crovella, T., & Paiano, A. (2024). Analyzing the borderlands: A regional report on the Colombia–Ecuador border on political, economic, social, legal, and environment aspects. International Migration Review, 58(2), 881–897. [CrossRef]
Figure 1.
Correlation matrix for all possible pairs of questions of the instrument.
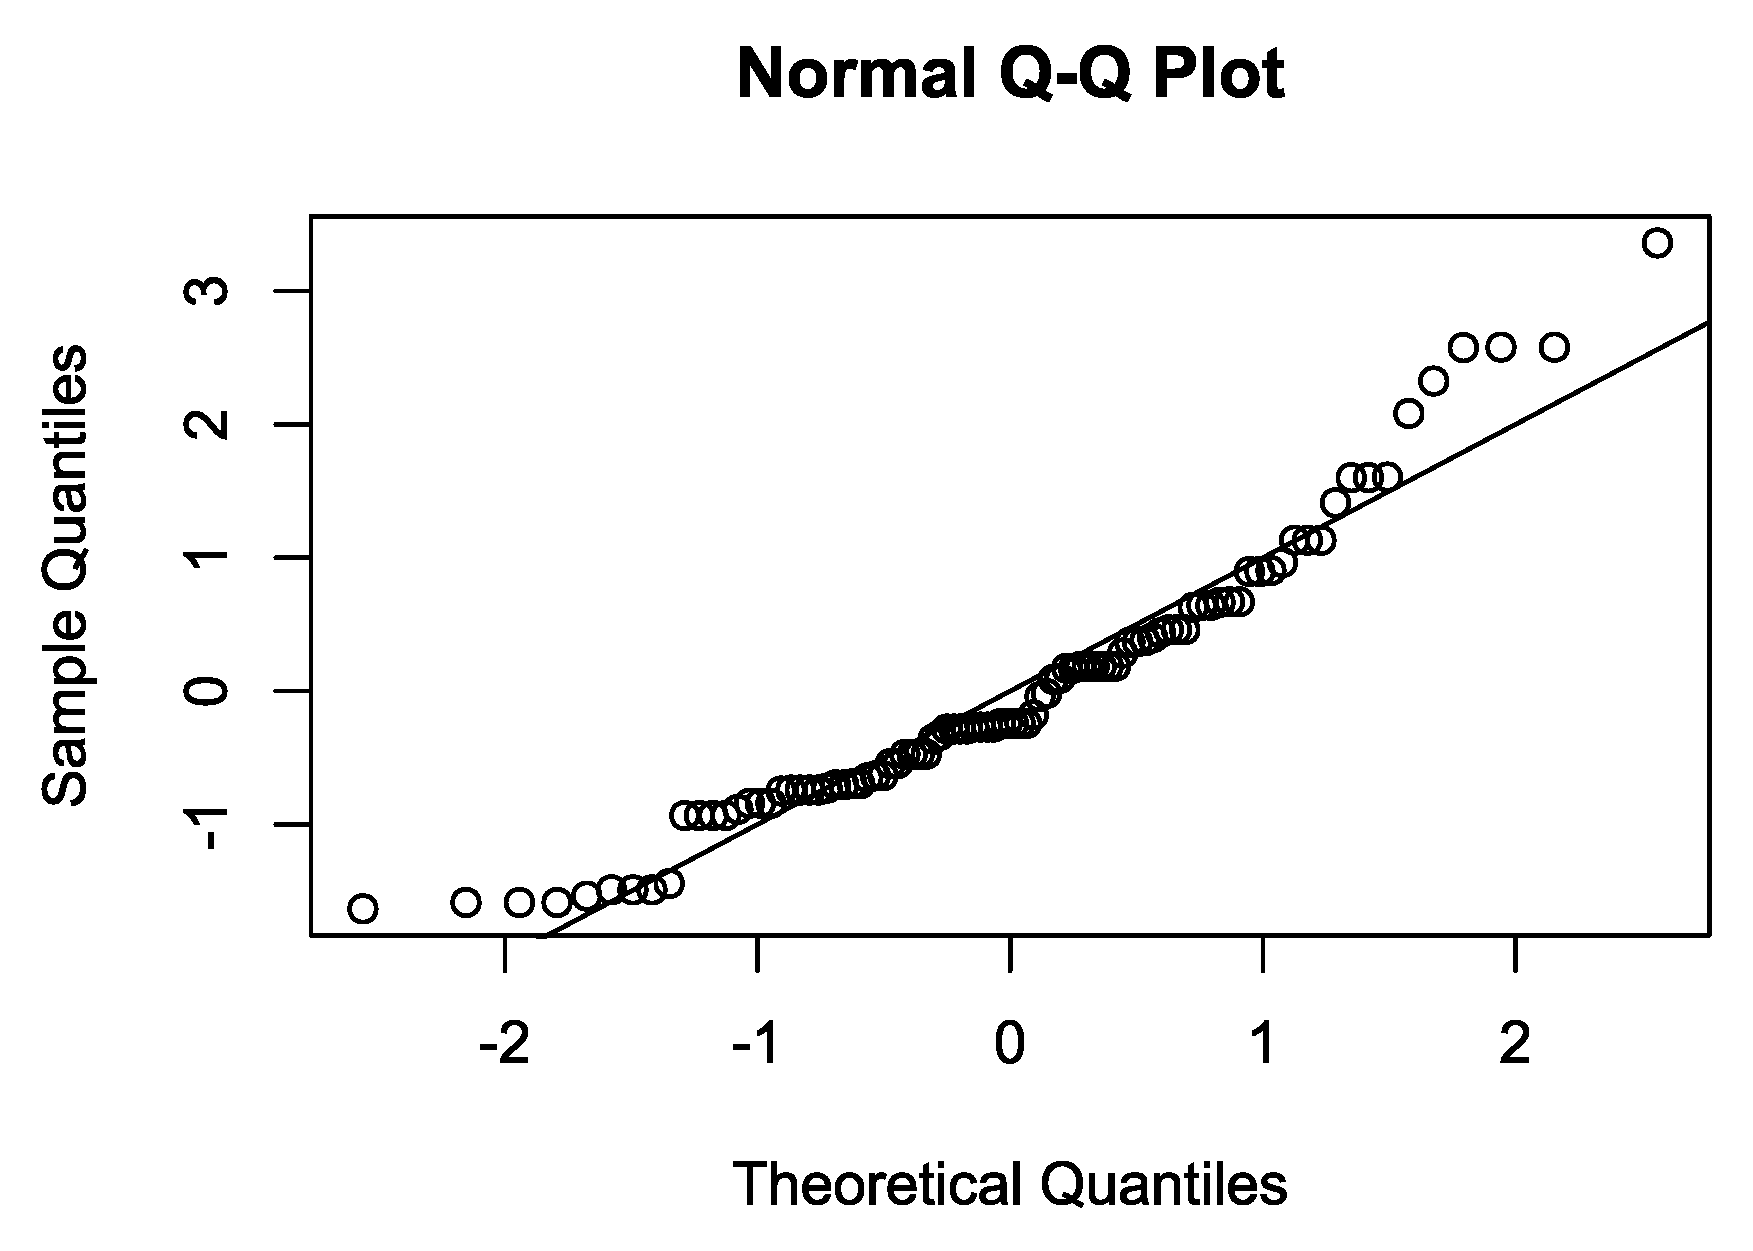
Figure 2.
General contrast of performance of the research models of each HEI.
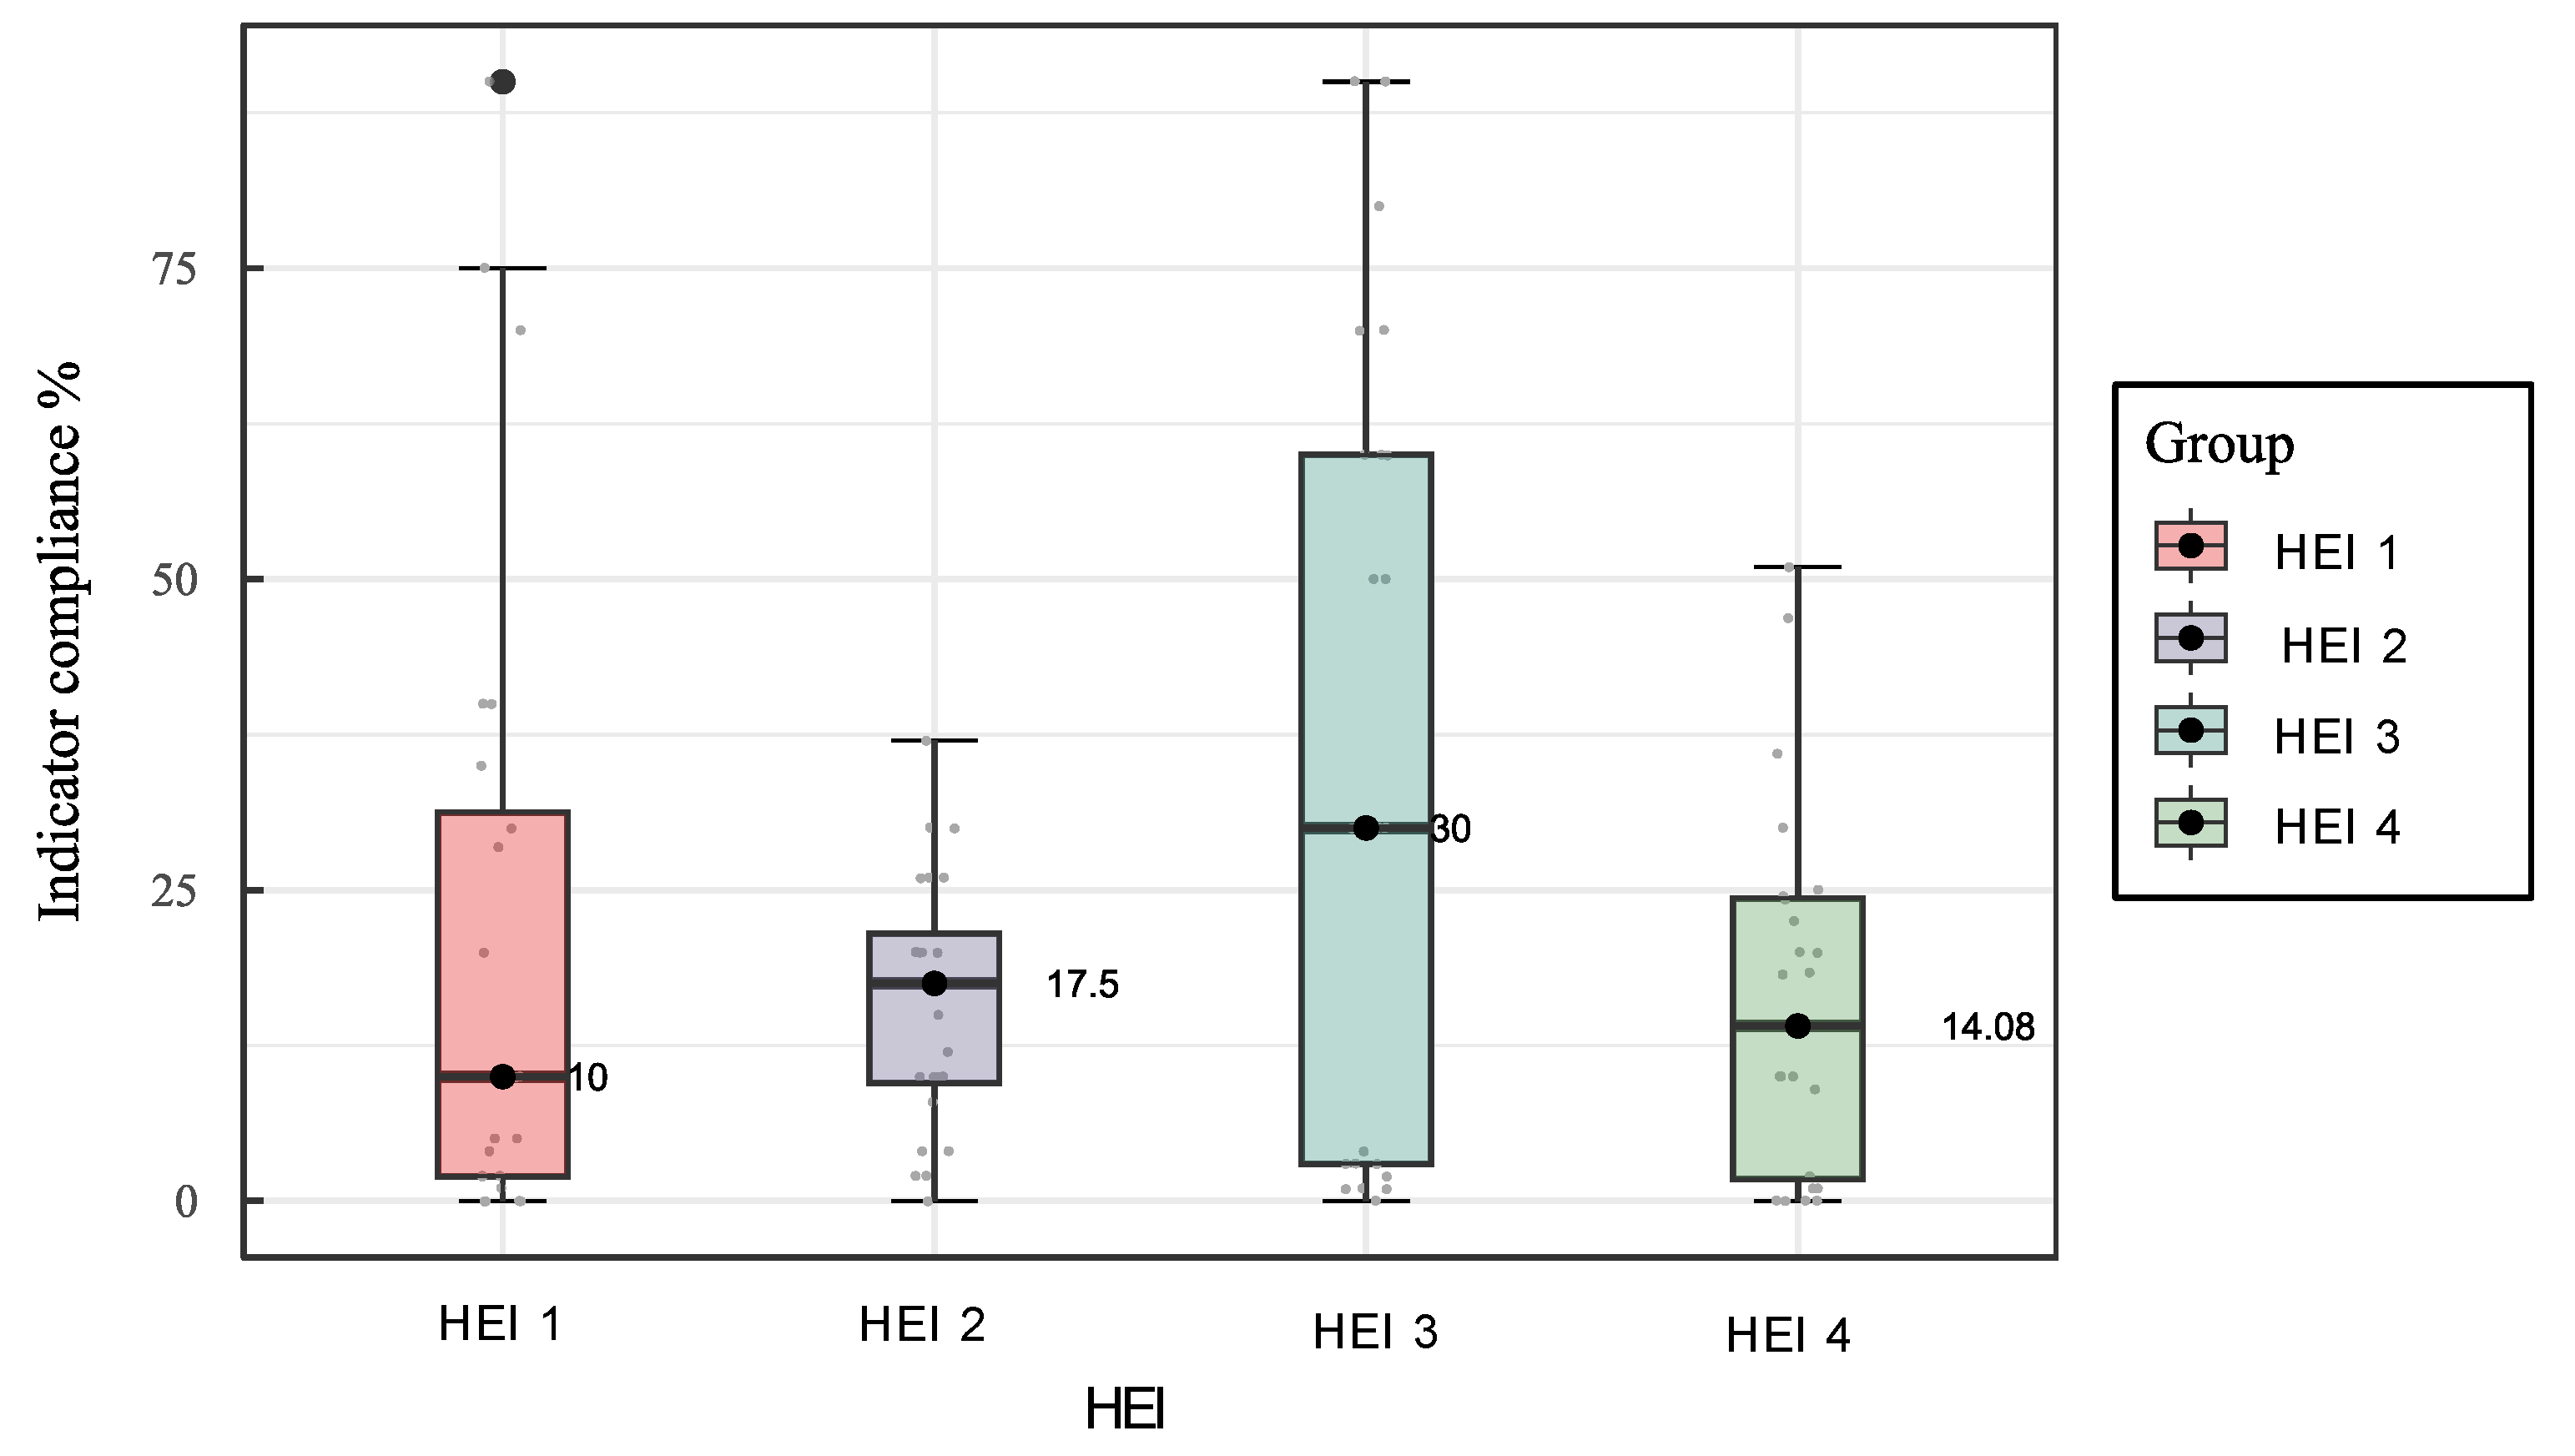
Figure 3.
Proportions by HEI for the environmental dimension.
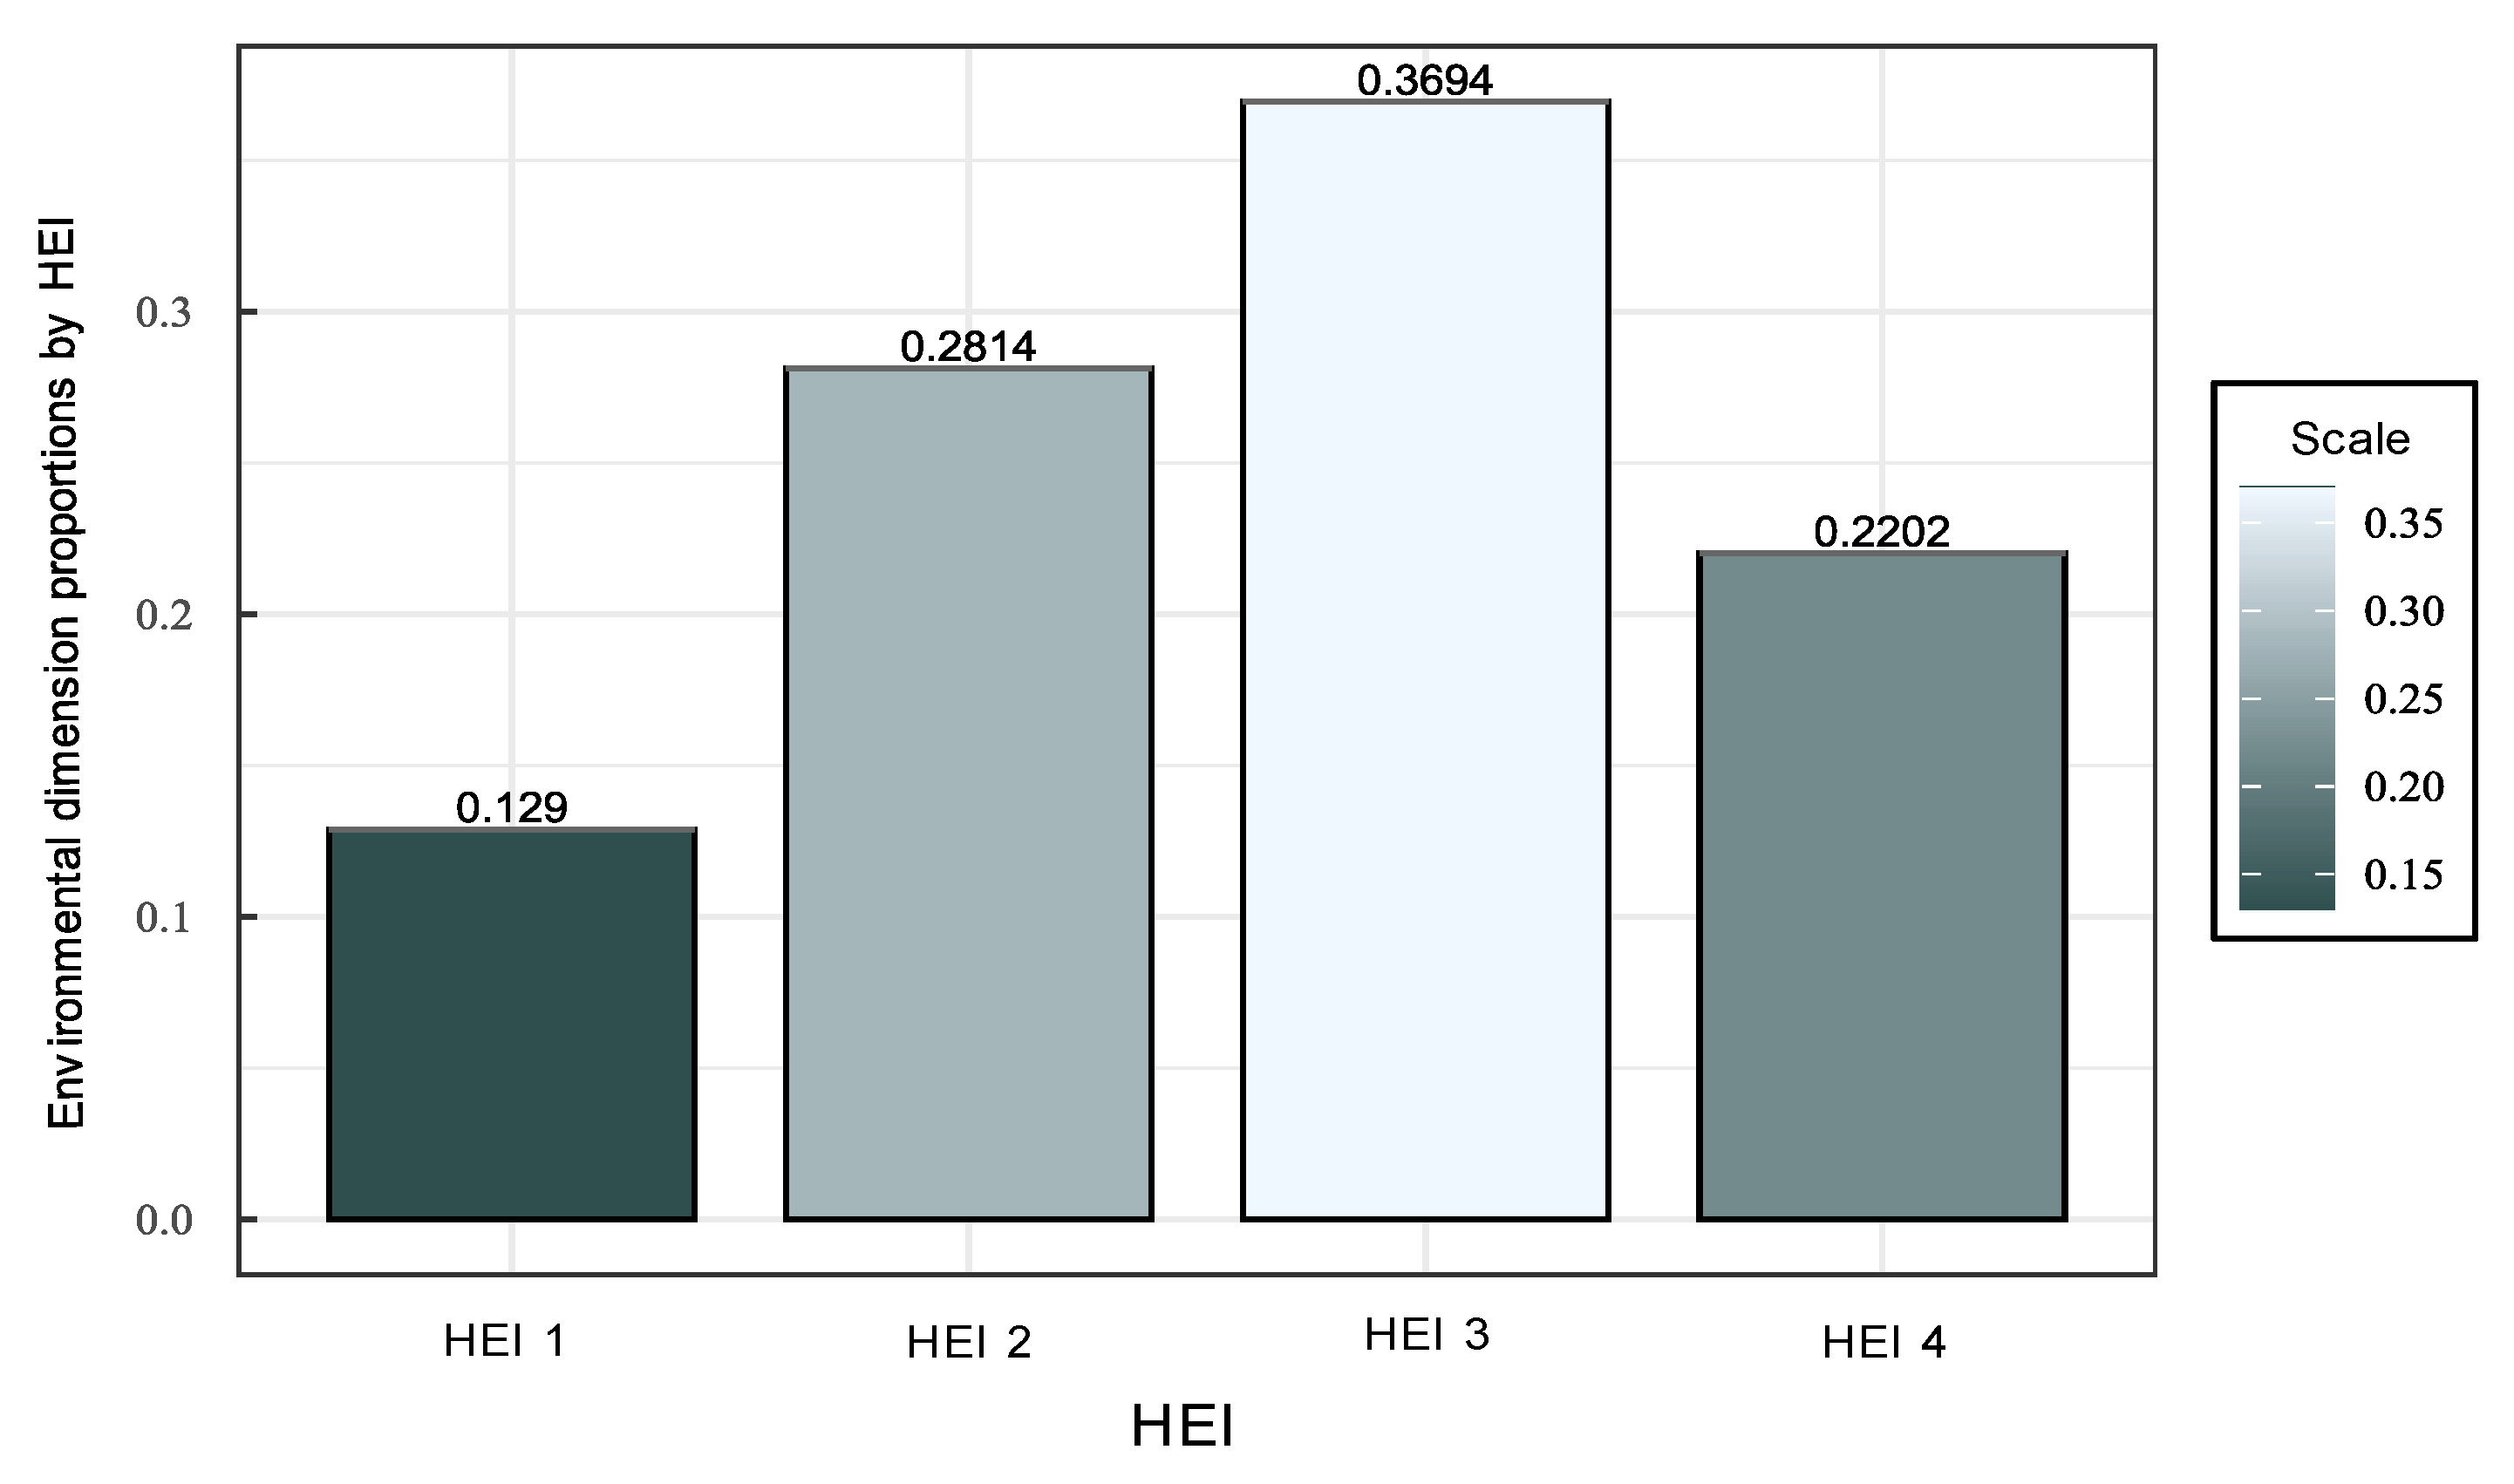
Figure 4.
Proportions by HEI for the economic dimension.
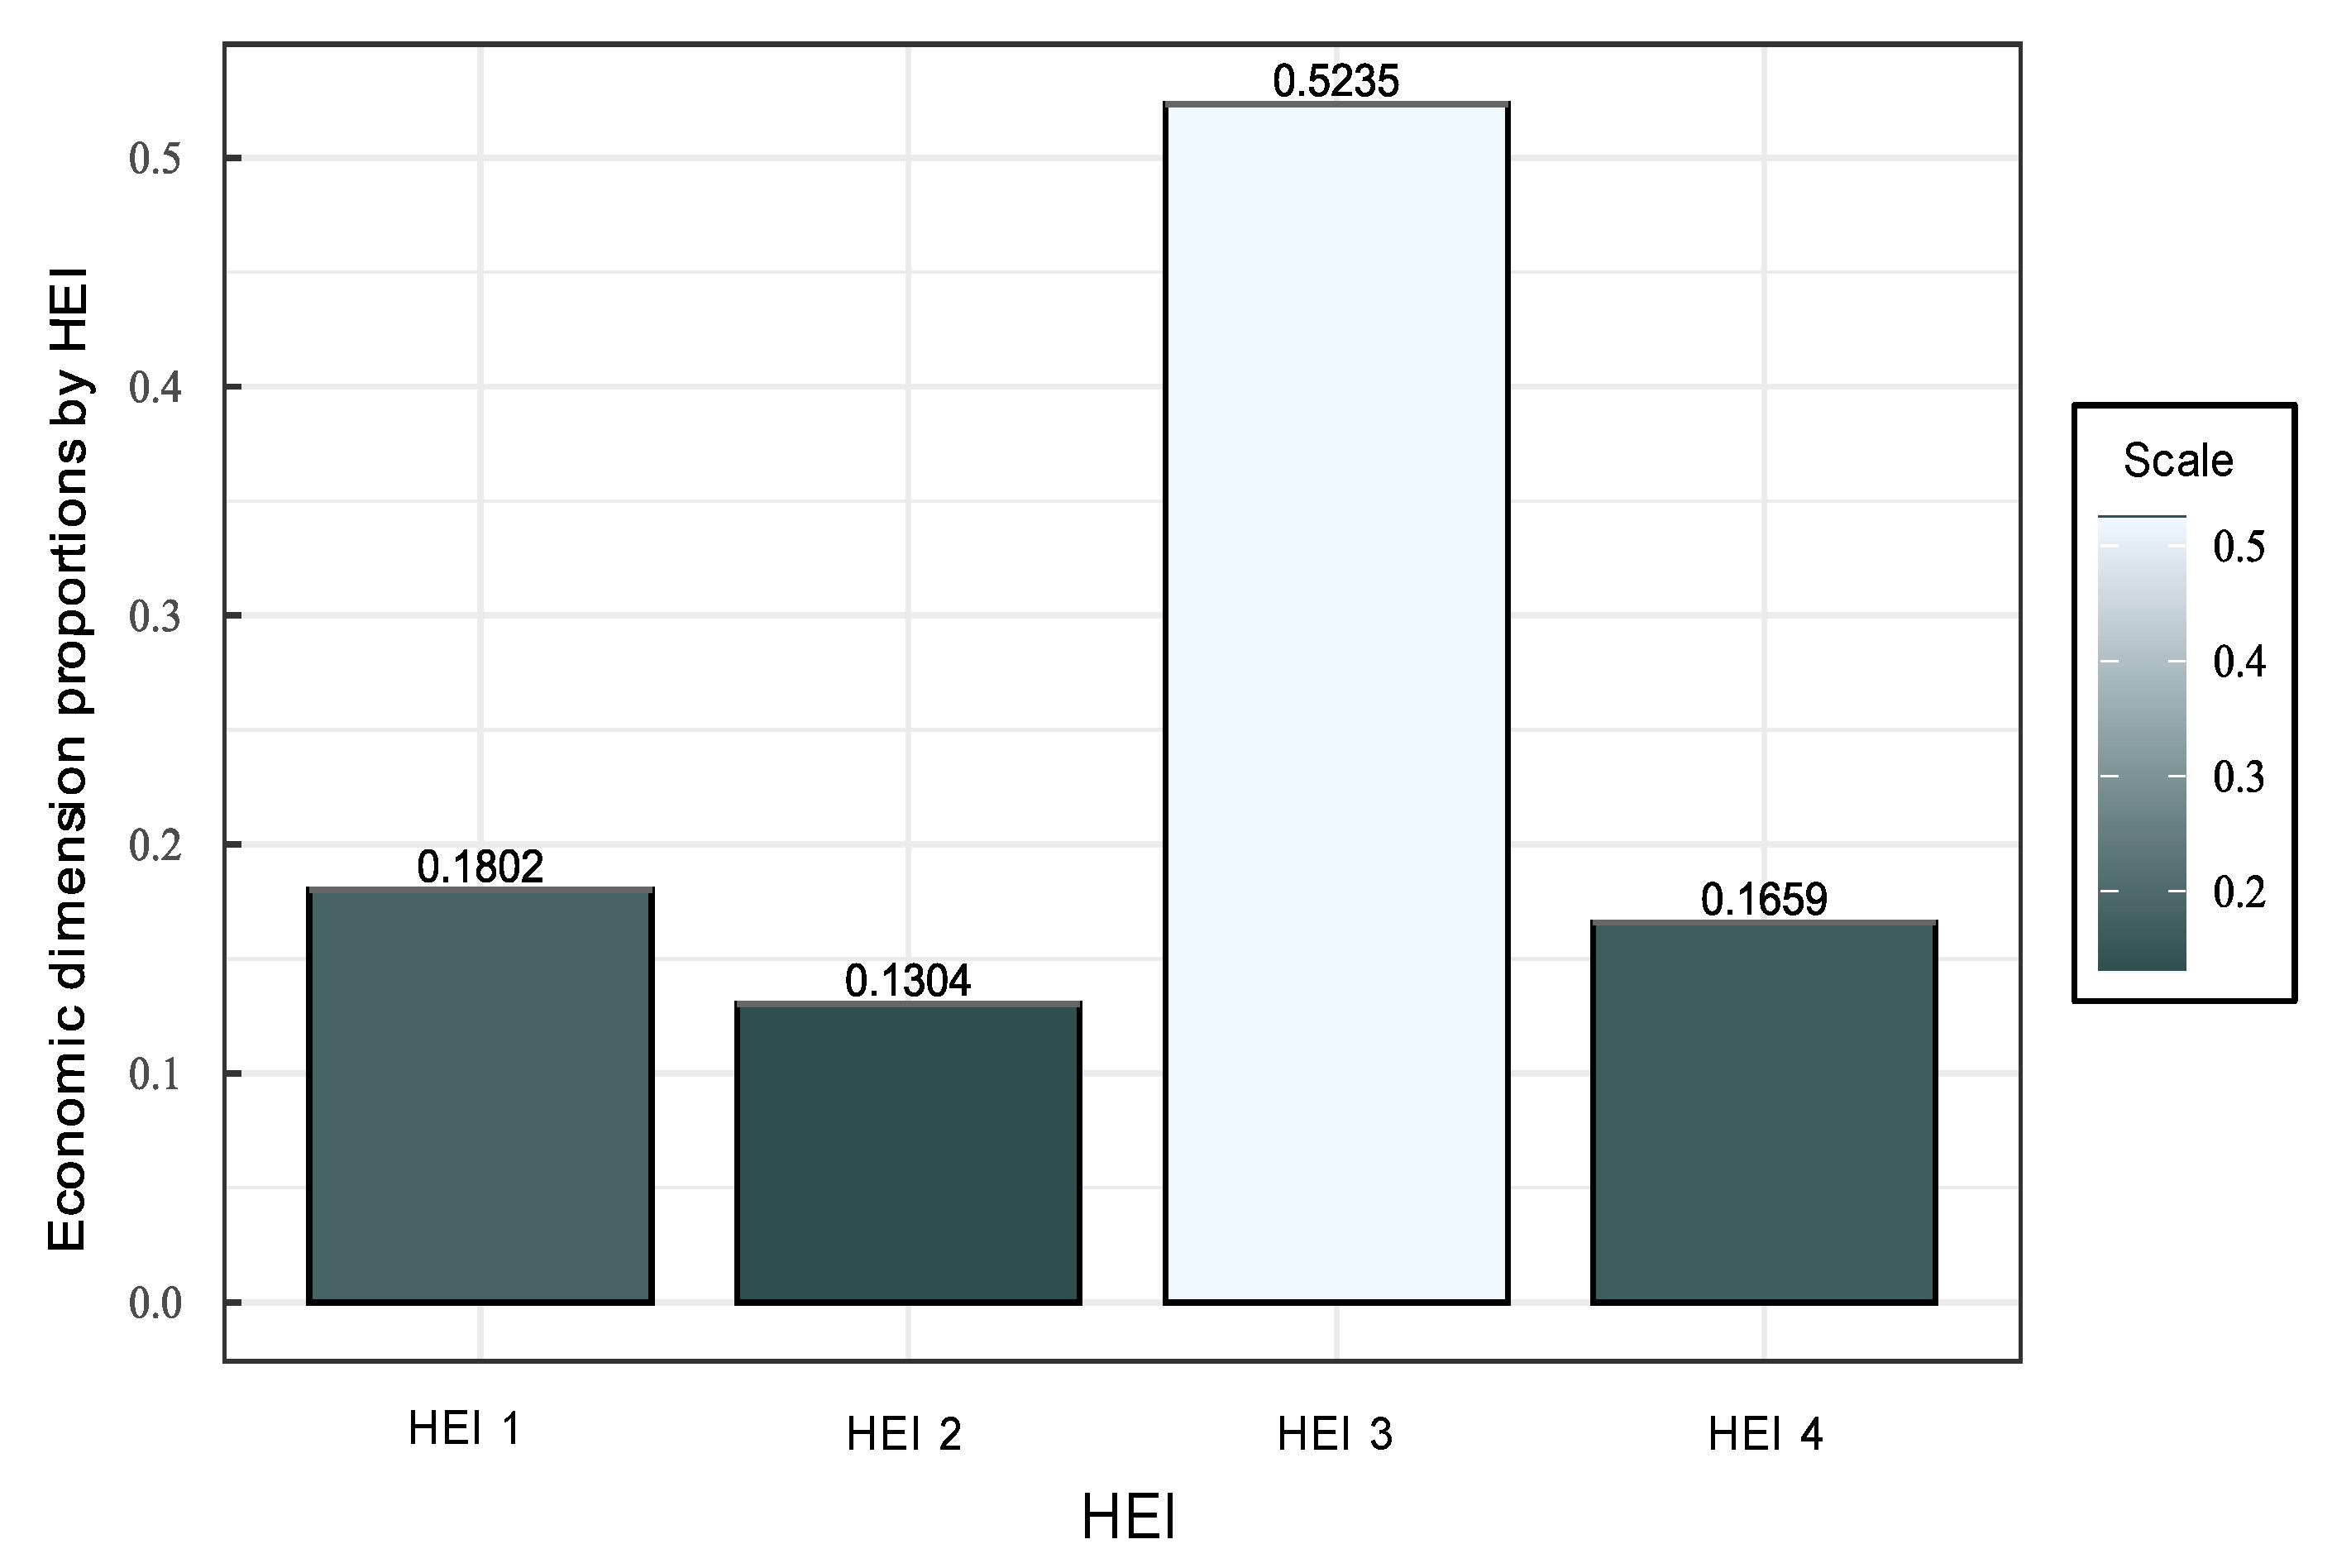
Figure 5.
Proportions by HEI for the institutional dimension.
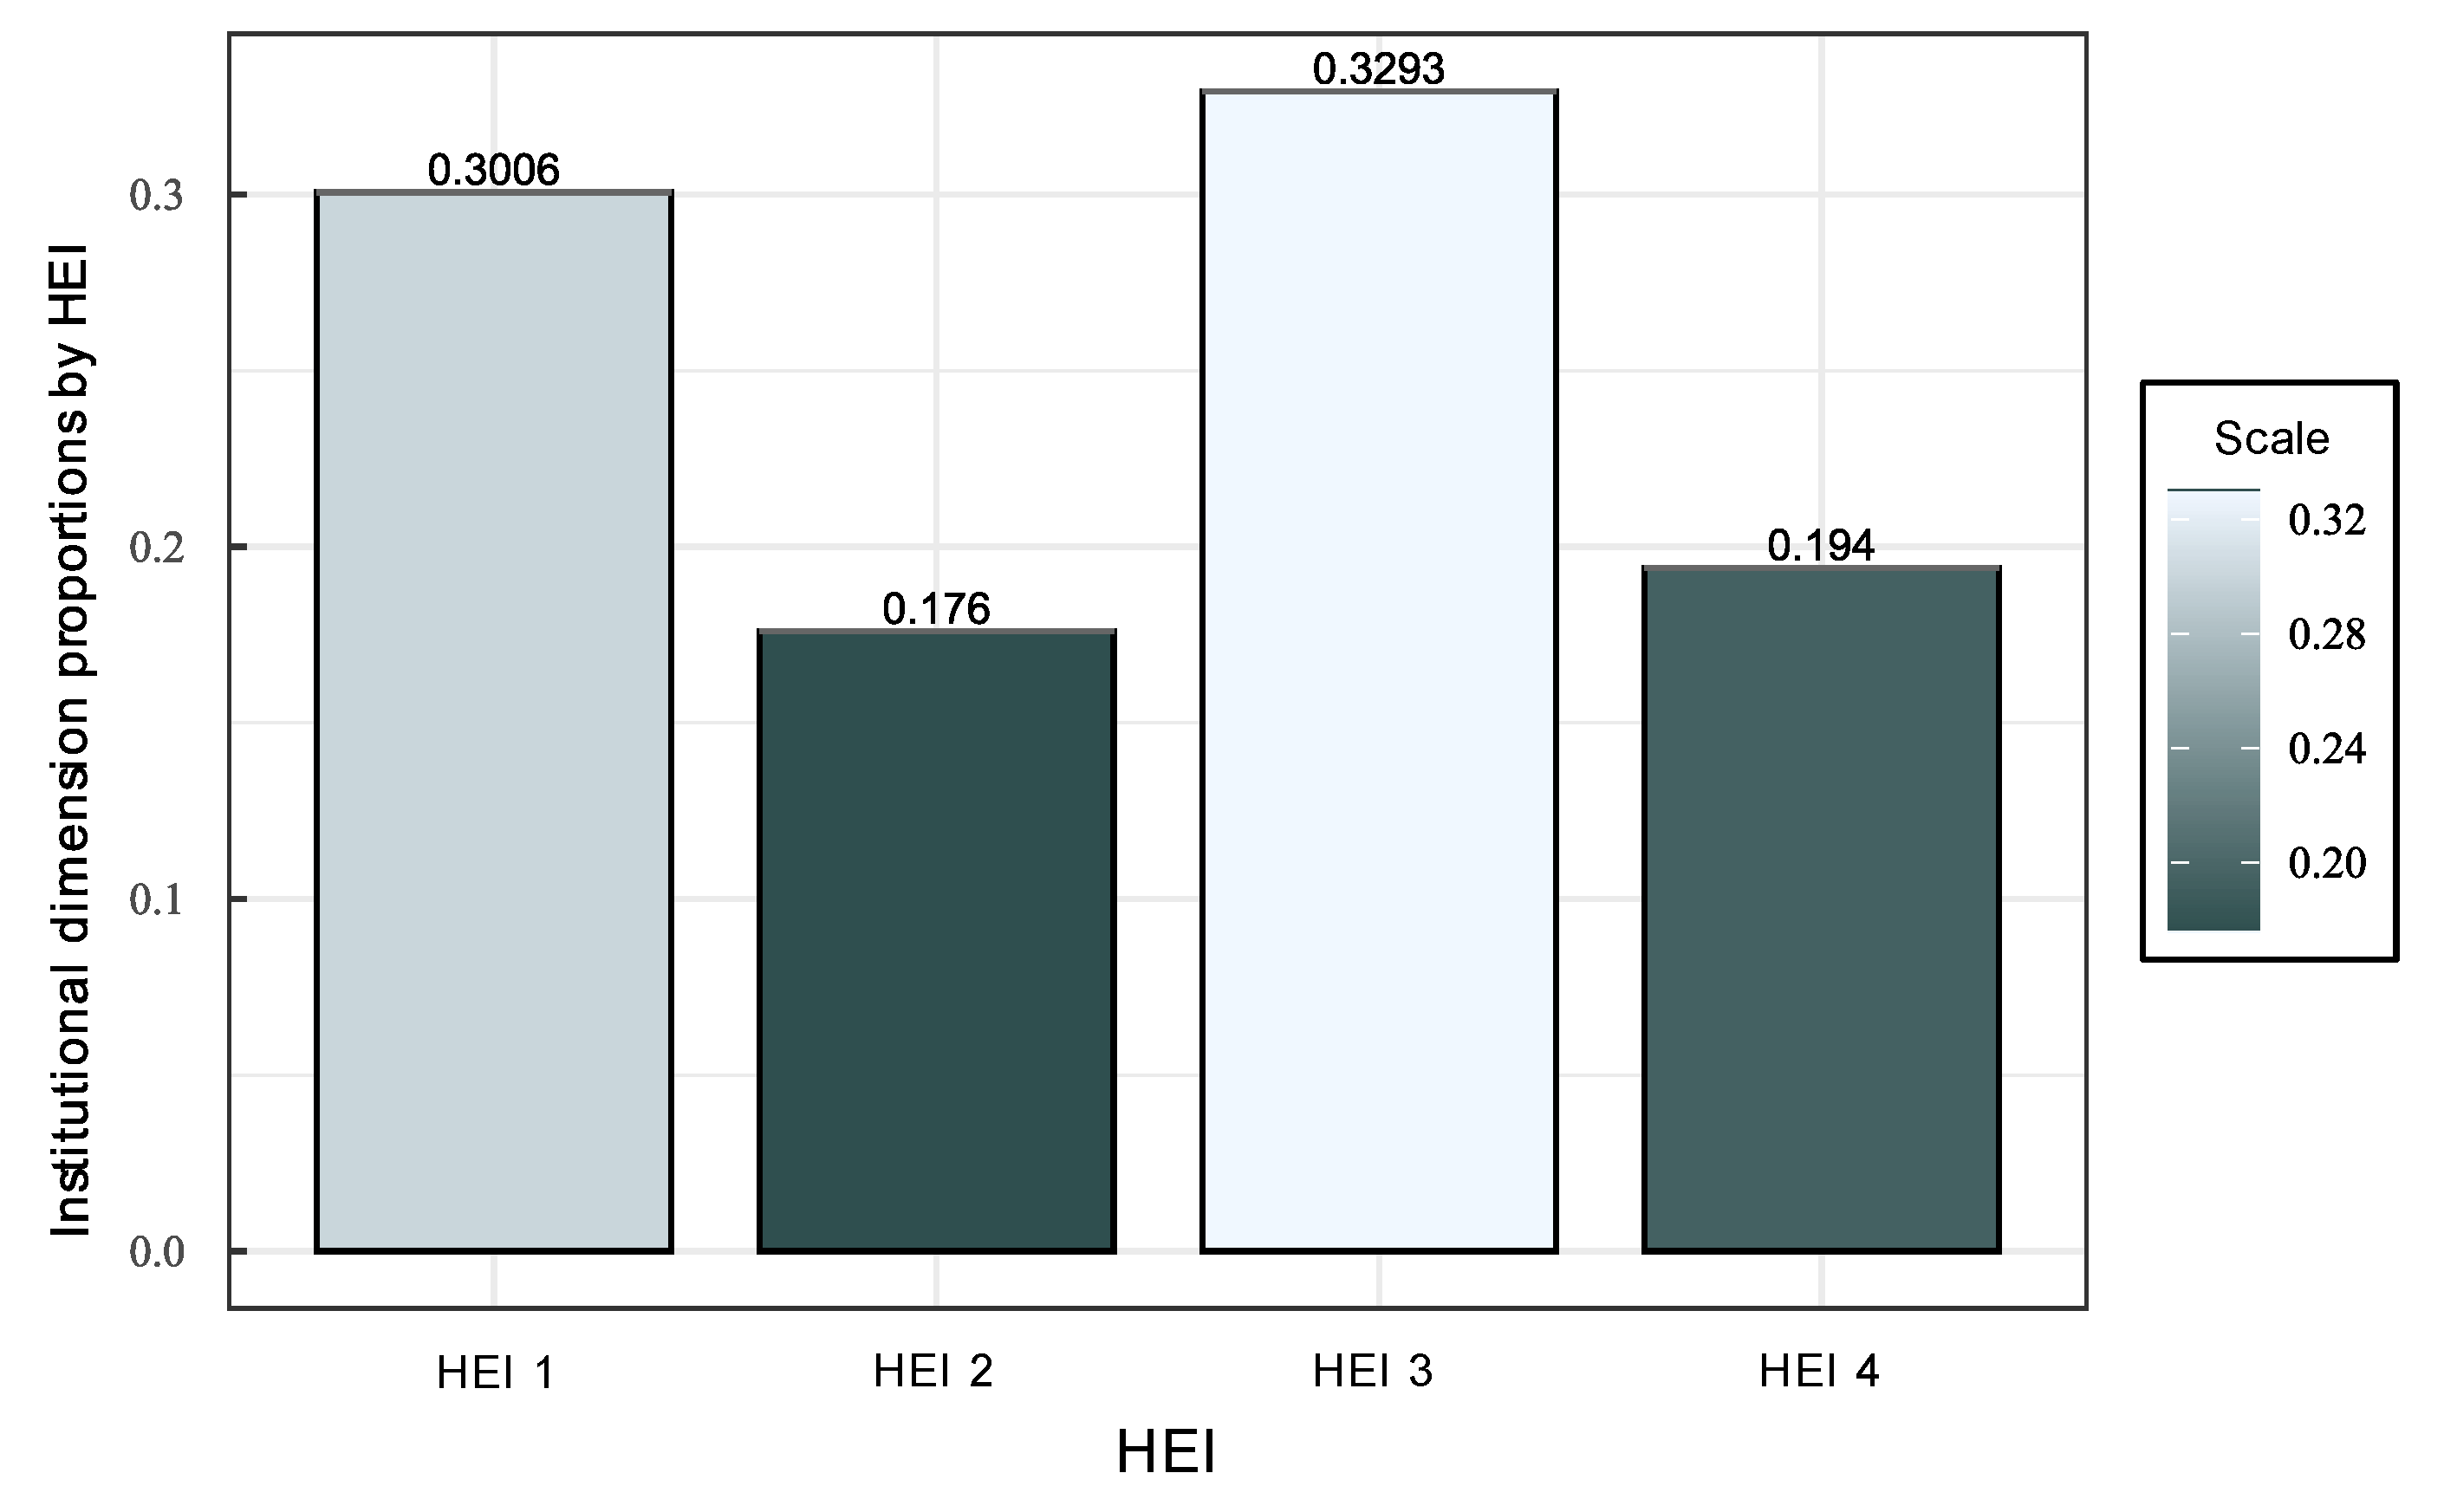
Figure 6.
Proportions by HEI for the social dimension.
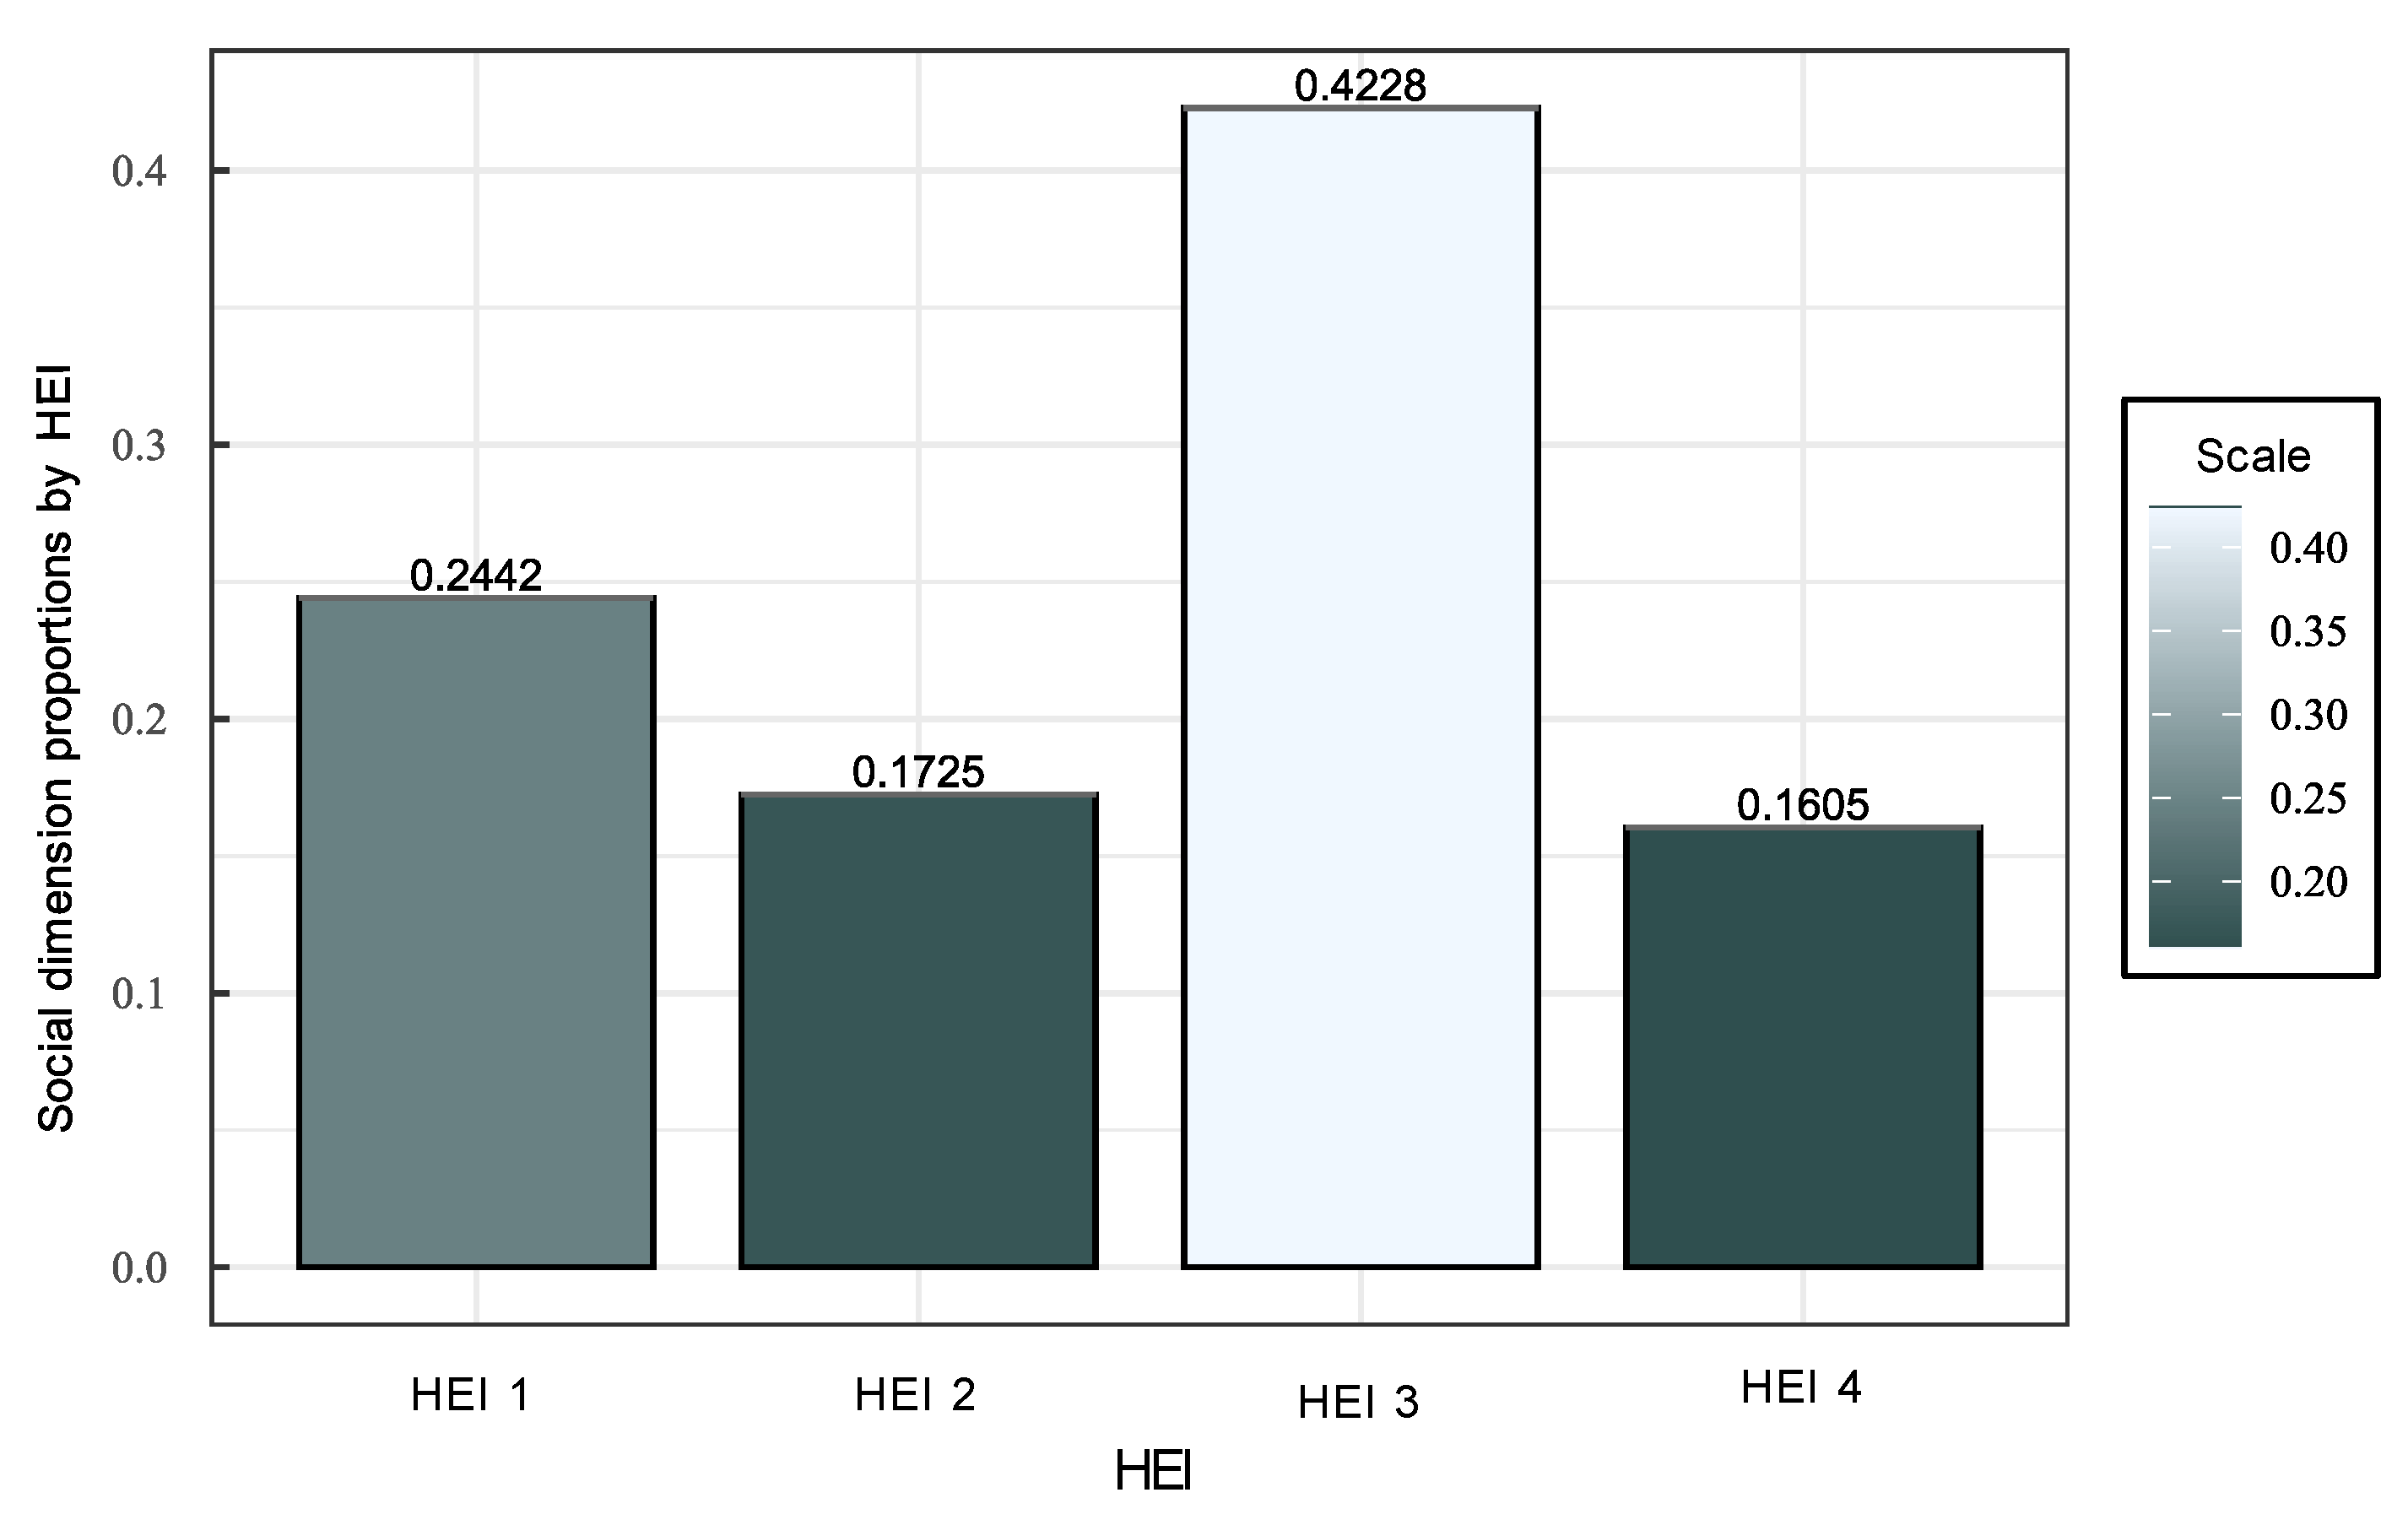
Table 2.
Descriptive statistics of the ordinal variables.
| Variable | HEI 1 | HEI 2 | HEI 3 | HEI 4 |
|---|---|---|---|---|
| Min. | 0.000 | 0.000 | 0.000 | 0.000 |
| First quartile | 2,000 | 9,500 | 3,000 | 1,750 |
| Median | 10,000 | 17,500 | 30,000 | 14,080 |
| Half | 20,400 | 15,920 | 35,330 | 16,240 |
| Third quartile | 31,250 | 21,500 | 60,000 | 4,000 |
| Max. | 90,000 | 37,000 | 90,000 | 24,340 |
| Standard deviation | 26,091 | 10,193 | 31,476 | 51,000 |
Table 3.
Results of the difference tests for the weights obtained by each HEI.
| Kruskal-Wallis test | |||||
| Kruskal Wallis | Degrees of freedom | 3 | p-value |
|
|
| Later – Dunn- Šidák | |||||
| HEI 1 | HEI 2 | HEI 3 | |||
| HEI 2 |
|
||||
| HEI 3 |
|
|
|||
| HEI 4 |
|
|
|
||
Table 5.
Results of the general and paired goodness-of-fit tests for the proportions of the social dimension for each HEI.
Table 5.
Results of the general and paired goodness-of-fit tests for the proportions of the social dimension for each HEI.
| The goodness of fit test | ||||||||
| 72,269 | Df | 3 | p-value |
1.394e-15 Significant |
||||
| fit tests | ||||||||
| HEI 1 | HEI 2 | HEI 3 | HEI 4 | |||||
| HEI 1 | * |
|
|
|
||||
| HEI 2 |
2.428246e-02 Significant |
* |
|
|
||||
| HEI 3 |
9.153887e-06 Significant |
4.690940e-11 Significant |
* |
|
||||
| HEI 4 |
7.617604e-03 Significant |
6.730540e-01 Not significant |
3.246315e-12 Significant |
* | ||||
Disclaimer/Publisher’s Note: The statements, opinions and data contained in all publications are solely those of the individual author(s) and contributor(s) and not of MDPI and/or the editor(s). MDPI and/or the editor(s) disclaim responsibility for any injury to people or property resulting from any ideas, methods, instructions or products referred to in the content. |
© 2024 by the authors. Licensee MDPI, Basel, Switzerland. This article is an open access article distributed under the terms and conditions of the Creative Commons Attribution (CC BY) license (http://creativecommons.org/licenses/by/4.0/).
Copyright: This open access article is published under a Creative Commons CC BY 4.0 license, which permit the free download, distribution, and reuse, provided that the author and preprint are cited in any reuse.


