Submitted:
24 March 2025
Posted:
25 March 2025
Read the latest preprint version here
Abstract
The metabolic efficiency paradox remains underexplored in young adults, where elevated visceral fat (VF) coexists with preserved anaerobic performance. This study investigates the compensatory role of basal metabolic rate (BMR) in mitigating VF-driven anaerobic speed deficits across BMI categories and genders. A cohort of 200 university students underwent body composition analysis (VF via BIA/DEXA; BMR via indirect calorimetry/Mifflin-St Jeor equations) and anaerobic speed testing (30m/50m sprints). Participants were stratified into Normal BMI (18.5–24.9 kg/m²) and Overweight/Obese (≥25 kg/m²) groups. Regression and mediation-moderation analyses revealed that while VF negatively predicted speed (β = -0.15, p < 0.001), BMR attenuated this relationship through a significant interaction (VF×BMR: β = -0.001, p = 0.004). Mediation analysis confirmed BMR’s partial mediation (28%, p = 0.002), with stronger compensatory effects in males and overweight individuals. ROC thresholds identified critical VF (≥4.8 units) and BMR (≤1245 kcal/day) values predictive of speed decline. Gender disparities emerged: males exhibited higher BMR and resilience to VF, while females demonstrated metabolic flexibility despite greater adiposity. These findings challenge conventional models by positing BMR as a metabolic buffer, offsetting VF’s biomechanical and inflammatory burdens. The study underscores the need for individualized training programs leveraging metabolic profiling to optimize anaerobic performance in high-VF populations. Longitudinal research is warranted to explore causality and intervention efficacy.
Keywords:
metabolic efficiency paradox
; basal metabolic rate (BMR)
; visceral fat (VF)
; anaerobic speed
; BMI categories
; young adults
Introduction
A detrimental interplay has long characterized the relationship between visceral fat (VF) and anaerobic performance. Excess VF, a metabolically active adipose tissue depot, is associated with chronic low-grade inflammation and oxidative stress, which impair skeletal muscle efficiency and neuromuscular function [4]. This contributes to a reduced power-to-weight ratio, a critical determinant of anaerobic tasks such as sprinting, as excess adiposity imposes a biomechanical and metabolic "drag" on explosive movements [1,9]. Conventional models posit that elevated VF directly compromises speed and power output, particularly in activities reliant on glycolytic pathways [5]. However, emerging evidence suggests a paradox: some individuals with higher VF exhibit unexpectedly preserved anaerobic performance, prompting questions about compensatory physiological mechanisms [10].
A credible but often overlooked element is the basal metabolic rate (BMR), which refers to the energy used while at rest to sustain essential bodily functions. Basal metabolic rate (BMR) differs considerably between people and can serve as a metabolic safeguard against deficits caused by ventricular fibrillation (VF). High BMR is linked to greater resting energy expenditure and enhanced mitochondrial efficiency, potentially increasing the availability of adenosine triphosphate (ATP) for anaerobic efforts [1,11]. This suggests that people with a higher basal metabolic rate (BMR) may maintain their anaerobic performance even with increased visceral fat (VF) by counteracting its inflammatory and mechanical challenges through enhanced energy efficiency [3,12]. While prior studies have examined BMR in the context of athletic performance or obesity, its role in modulating the VF–anaerobic performance relationship across body mass index (BMI) categories remains unclear.
This study investigates the metabolic efficiency paradox—the counterintuitive preservation of anaerobic speed in young adults (18–24 years) with high VF, mediated by compensatory elevations in BMR. Focusing on this age group is critical, as young adulthood represents a transitional phase where metabolic health and body composition trajectories are established, yet VF accumulation and anaerobic decline often begin [6]. By stratifying participants across BMI categories, we aim to disentangle how BMR interacts with VF to influence anaerobic performance in normal-weight, overweight, and obese individuals. This approach challenges the traditional view of VF as an unequivocal liability, proposing that metabolic adaptability, reflected in BMR, may underpin resilience against adiposity-related performance deficits.
Research Gap:
- No studies explore whether high BMR offsets the negative effects of VF on anaerobic performance, especially in normal vs. overweight BMI categories.
- Gender differences in VF distribution and BMR (e.g., hormonal influences) are understudied.
Hypotheses:
- High BMR attenuates the negative association between VF and anaerobic speed performance.
- This compensatory effect is stronger in males (due to lean mass-driven BMR) and overweight BMI categories.
Methodology:
The present study was conducted on 200 male and female students aged 18–24 years from Palamuru University to study the connection between body composition and anaerobic speed performance. Participants were divided into two categories according to their BMI: Normal BMI (18.5–24.9 kg/m²) and Overweight/Obese BMI (≥25 kg/m²). Normal BMI for females was defined as ranging from 18.1 to 24.8 kg/m², while for males it was from 18.6 to 24.7 kg/m²; conversely, the BMI range for overweight/obese individuals was 25.2 to 36.1 kg/m² for females and 25.2 to 31.8 kg/m² for males. Visceral Fat (VF) assessments were carried out using bioelectrical impedance analysis (BIA) or dual-energy X-ray absorptiometry (DEXA) [7], and Basal Metabolic Rate (BMR) evaluations were done using indirect calorimetry or reliable predictive equations, such as the Mifflin-St Jeor equation [8]. The anaerobic speed performance was measured via a 30-meter sprint test for female participants and a 50-meter sprint test for male participants, both protocols being recognized for their effectiveness in evaluating short-term power output [13,14]. Descriptive statistical analyses were conducted to summarize the mean values and standard deviations of VF, BMR, and sprint times across different BMI categories. Pearson correlation analysis was utilized to explore the connections between VF, BMR, and sprint performance, while multiple regression analysis was used to evaluate how VF and BMR predict sprint outcomes, considering age and gender. Mediation and moderation analyses were performed to investigate the indirect and interactive effects of BMR on the relationship between VF and speed. Additionally, threshold analysis was applied to determine essential cutoff values for VF and BMR that forecast longer sprinting times. This methodological framework provided a thorough evaluation of the physiological and metabolic factors affecting speed performance among university students.
Statistical Analysis
Descriptive Stats: Mean ± SD for VF, BMR, and Speed performance by BMI Group & gender.

Table 1.
Results for Normal vs. Overweight/Obese BMI Groups.
| Group | Gender | VF (Mean ± SD) | BMR (Mean ± SD) | Speed (Mean ± SD) |
|---|---|---|---|---|
| Normal BMI | Female | 3.5 ± 1.2 | 1235 ± 98 | 6.8 ± 1.1 |
| Normal BMI | Male | 4.1 ± 1.5 | 1480 ± 145 | 7.5 ± 1.3 |
| Overweight/Obese | Female | 8.2 ± 3.1 | 1410 ± 112 | 7.9 ± 1.4 |
| Overweight/Obese | Male | 9.5 ± 4.3 | 1650 ± 210 | 8.6 ± 1.7 |
The table presents a comparative analysis of various physiological parameters, including Visceral Fat (VF), Basal Metabolic Rate (BMR), and Speed, between individuals with Normal BMI and Overweight/Obese BMI, categorized by gender.
• Visceral Fat (VF): Individuals classified as overweight or obese displayed markedly elevated VF levels compared to those within the normal BMI range. Specifically, females with a normal BMI had an average VF of 3.5 ± 1.2, while overweight or obese females showed a significantly higher average VF of 8.2 ± 3.1. A comparable pattern was noted in males, where VF rose from 4.1 ± 1.5 in the normal BMI group to 9.5 ± 4.3 in the overweight/obese group.
• Basal Metabolic Rate (BMR): The BMR measurements were greater in the overweight/obese groups compared to their normal BMI peers. For females, BMR increased from 1235 ± 98 kcal/day (normal BMI) to 1410 ± 112 kcal/day (overweight/obese). In males, the increase was from 1480 ± 145 kcal/day to 1650 ± 210 kcal/day.
• Speed: Interestingly, speed performance was superior in overweight/obese individuals compared to those in the normal BMI category. Females with normal BMI recorded an average speed of 6.8 ± 1.1, while overweight/obese females achieved a slightly higher speed of 7.9 ± 1.4. Similarly, among males, speed rose from 7.5 ± 1.3 (normal BMI) to 8.6 ± 1.7 (overweight/obese). These results imply that despite the presence of higher body fat and metabolic rates in overweight/obese individuals, their speed performance does not necessarily suffer, potentially reflecting adaptations to increased body mass.
Correlation: Pearson correlations were determined between VF, BMR, and speed performance.
Table 2.
Correlation Analysis of VF, BMR, and Speed Performance.
| VF | BMR | Speed | |
|---|---|---|---|
| VF | 1.00 | 0.65* | -0.42* |
| BMR | 0.65* | 1.00 | 0.28* |
| Speed | -0.42* | 0.28* | 1.00 |
The correlation matrix displays both Pearson and Spearman correlation coefficients to analyze the connections among Visceral Fat (VF), Basal Metabolic Rate (BMR), and Speed Performance.
- VF and BMR: A moderate positive correlation (r = 0.65, p < 0.05) indicates that an increase in visceral fat is linked to a rise in the basal metabolic rate.
- VF and Speed: A negative correlation (r = -0.42, p < 0.05) suggests that individuals with greater visceral fat tend to exhibit lower speed performance.
- BMR and Speed: A weak positive correlation (r = 0.28, p < 0.05) implies that people with a higher basal metabolic rate may experience slightly enhanced speed performance.
Interpretation
- The positive correlation observed between VF and BMR implies that individuals with higher levels of visceral fat burn more energy at rest, likely due to elevated metabolic demands.
- The negative correlation between VF and Speed underscores that excessive visceral fat may adversely affect mobility and athletic capabilities.
- The weak positive correlation between BMR and Speed indicates that increased metabolic rates could offer a minor benefit in speed performance, though the impact is not substantial.
These results highlight the intricate relationships among body composition, metabolism, and physical performance.
Regression Analysis: Predictors of Speed Performance
To explore the connections among Visceral Fat (VF), Basal Metabolic Rate (BMR), and Speed Performance, a multiple regression analysis was performed, accounting for Age and Gender.
The table provided below displays the estimated regression coefficients (β), standard errors (SE), and p-values associated with each predictor.
Table 3.
Regression Model: Speed ~ VF + BMR + VF×BMR + Age + Gender.
| Variable | β (SE) | p-value |
|---|---|---|
| VF | -0.15 (0.03) | <0.001 |
| BMR | 0.002 (0.001) | 0.012 |
| VF×BMR | -0.001 (0.0003) | 0.004 |
| Gender (Male) | 0.21 (0.09) | 0.021 |
| Age | -0.02 (0.01) | 0.120 |
Interpretation of Key Findings
- Visceral Fat (VF) (-0.15, p < 0.001): A noteworthy negative correlation exists between visceral fat and speed performance. This implies that elevated levels of VF are associated with slower speeds, potentially due to increased body mass and decreased mobility.
- Basal Metabolic Rate (BMR) (0.002, p = 0.012): A small yet significant positive correlation suggests that individuals with a higher BMR are likely to exhibit improved speed performance.
- VF × BMR Interaction (-0.001, p = 0.004): The negative interaction effect suggests that the relationship between BMR and speed varies depending on VF levels. This interaction implies that while higher BMR generally improves speed, excessive visceral fat might counteract this benefit.
- Gender (0.21, p = 0.021): Males tend to have higher speed performance than females, with a significant difference of 0.21 units on average.
- Age (-0.02, p = 0.120): The effect of age on speed is negative but not statistically significant, indicating that within this sample, age does not strongly predict speed performance.
This regression model highlights the negative impact of visceral fat on speed performance, while BMR and gender contribute positively. The interaction effect between VF and BMR suggests a complex relationship, where higher metabolic rates may enhance speed, but excessive visceral fat may reduce this advantage.
These findings could be valuable for designing targeted fitness programs to optimize metabolic health and physical performance.
Mediation/Moderation Analysis
Mediation (BMR as Mediator):
- Indirect Effect (VF → BMR → Speed): β = -0.09 (95% CI: -0.15 to -0.03), p = 0.002.
- BMR partially mediates the relationship between VF and speed (28% mediation).
Moderation (BMR as moderator):
- VF×BMR Interaction: β = -0.001 (p = 0.004).
- High BMR weakens the negative impact of VF on speed.
- Threshold Analysis:
Critical Thresholds:
- ○
- VF: ≥4.8 units (AUC = 0.72, Sensitivity = 68%, Specificity = 74%).
- ○
- BMR: ≤1245 kcal/day (AUC = 0.65, Sensitivity = 62%, Specificity = 70%).
Interpretation:
- ○
- VF > 4.8 or BMR < 1245 kcal/day predicts slower sprint times (speed < 7.0s).
Results
Table 4.
Demographic and Metabolic Characteristics by Gender and BMI Group.
| Variable | Normal BMI (18.5–24.9) | Overweight/Obese (≥25) |
|---|---|---|
| Females | ||
| - n | 65 | 35 |
| - Age (years) | 20.1 ± 1.5 | 21.2 ± 1.8 |
| - BMI (kg/m²) | 21.3 ± 1.8 | 27.5 ± 2.3 |
| - Visceral Fat (VF) | 3.5 ± 1.2 | 8.2 ± 3.1 |
| - BMR (kcal/day) | 1235 ± 98 | 1410 ± 112 |
| - Sprint Time (s) | 6.8 ± 1.1 | 7.9 ± 1.4 |
| Males | ||
| - n | 60 | 40 |
| - Age (years) | 20.5 ± 1.6 | 21.8 ± 1.7 |
| - BMI (kg/m²) | 22.1 ± 1.7 | 28.3 ± 2.5 |
| - Visceral Fat (VF) | 4.1 ± 1.5 | 9.5 ± 4.3 |
| - BMR (kcal/day) | 1480 ± 145 | 1650 ± 210 |
| - Sprint Time (s) | 7.5 ± 1.3 | 8.6 ± 1.7 |
The table provides a comparative analysis of demographic and metabolic characteristics among normal BMI (18.5–24.9) and overweight/obese (≥25) individuals, categorized by gender.
Females
- Sample Size (n): There were 65 females in the normal BMI group and 35 females in the overweight/obese group.
- Age: Overweight/obese females were slightly older (21.2 ± 1.8 years) compared to normal BMI females (20.1 ± 1.5 years).
- BMI: Overweight/obese females had a significantly higher BMI (27.5 ± 2.3 kg/m²) compared to those with a normal BMI (21.3 ± 1.8 kg/m²).
- Visceral Fat (VF): Overweight/obese females had more than double the visceral fat (8.2 ± 3.1) compared to the normal BMI group (3.5 ± 1.2).
- Basal Metabolic Rate (BMR): Overweight/obese females had a higher BMR (1410 ± 112 kcal/day) than those with a normal BMI (1235 ± 98 kcal/day).
- Sprint Time: Overweight/obese females had slower sprint times (7.9 ± 1.4 seconds) compared to normal BMI females (6.8 ± 1.1 seconds), suggesting a potential decline in speed performance with increased BMI.
Males
- Sample Size (n): There were 60 males in the normal BMI group and 40 males in the overweight/obese group.
- Age: Overweight/obese males were slightly older (21.8 ± 1.7 years) compared to normal BMI males (20.5 ± 1.6 years).
- BMI: Overweight/obese males had a significantly higher BMI (28.3 ± 2.5 kg/m²) compared to normal BMI males (22.1 ± 1.7 kg/m²).
- Visceral Fat (VF): Overweight/obese males had more than double the visceral fat (9.5 ± 4.3) compared to normal BMI males (4.1 ± 1.5).
- Basal Metabolic Rate (BMR): Overweight/obese males exhibited a higher BMR (1650 ± 210 kcal/day) than their normal BMI counterparts (1480 ± 145 kcal/day).
- Sprint Time: Similar to females, overweight/obese males demonstrated slower sprint times (8.6 ± 1.7 seconds) compared to normal BMI males (7.5 ± 1.3 seconds), indicating a possible negative impact of excess weight on speed performance.
Key Observations
- Overweight/obese individuals, regardless of gender, exhibited higher BMI, visceral fat, and BMR compared to their normal BMI counterparts.
- Sprint performance was negatively affected by increased BMI and visceral fat, with overweight/obese participants recording slower sprint times.
- Males generally had higher BMR values and faster sprint times than females, irrespective of BMI group.
These results suggest that excess body fat negatively influences speed performance, possibly due to the additional weight burden. However, the higher BMR observed in overweight/obese individuals may indicate increased energy expenditure. Future studies could explore strategies to mitigate the negative effects of excess weight on athletic performance.
Figure 1.
Scatterplots of VF vs. sprint time, colored by BMR textiles (high/medium/low).
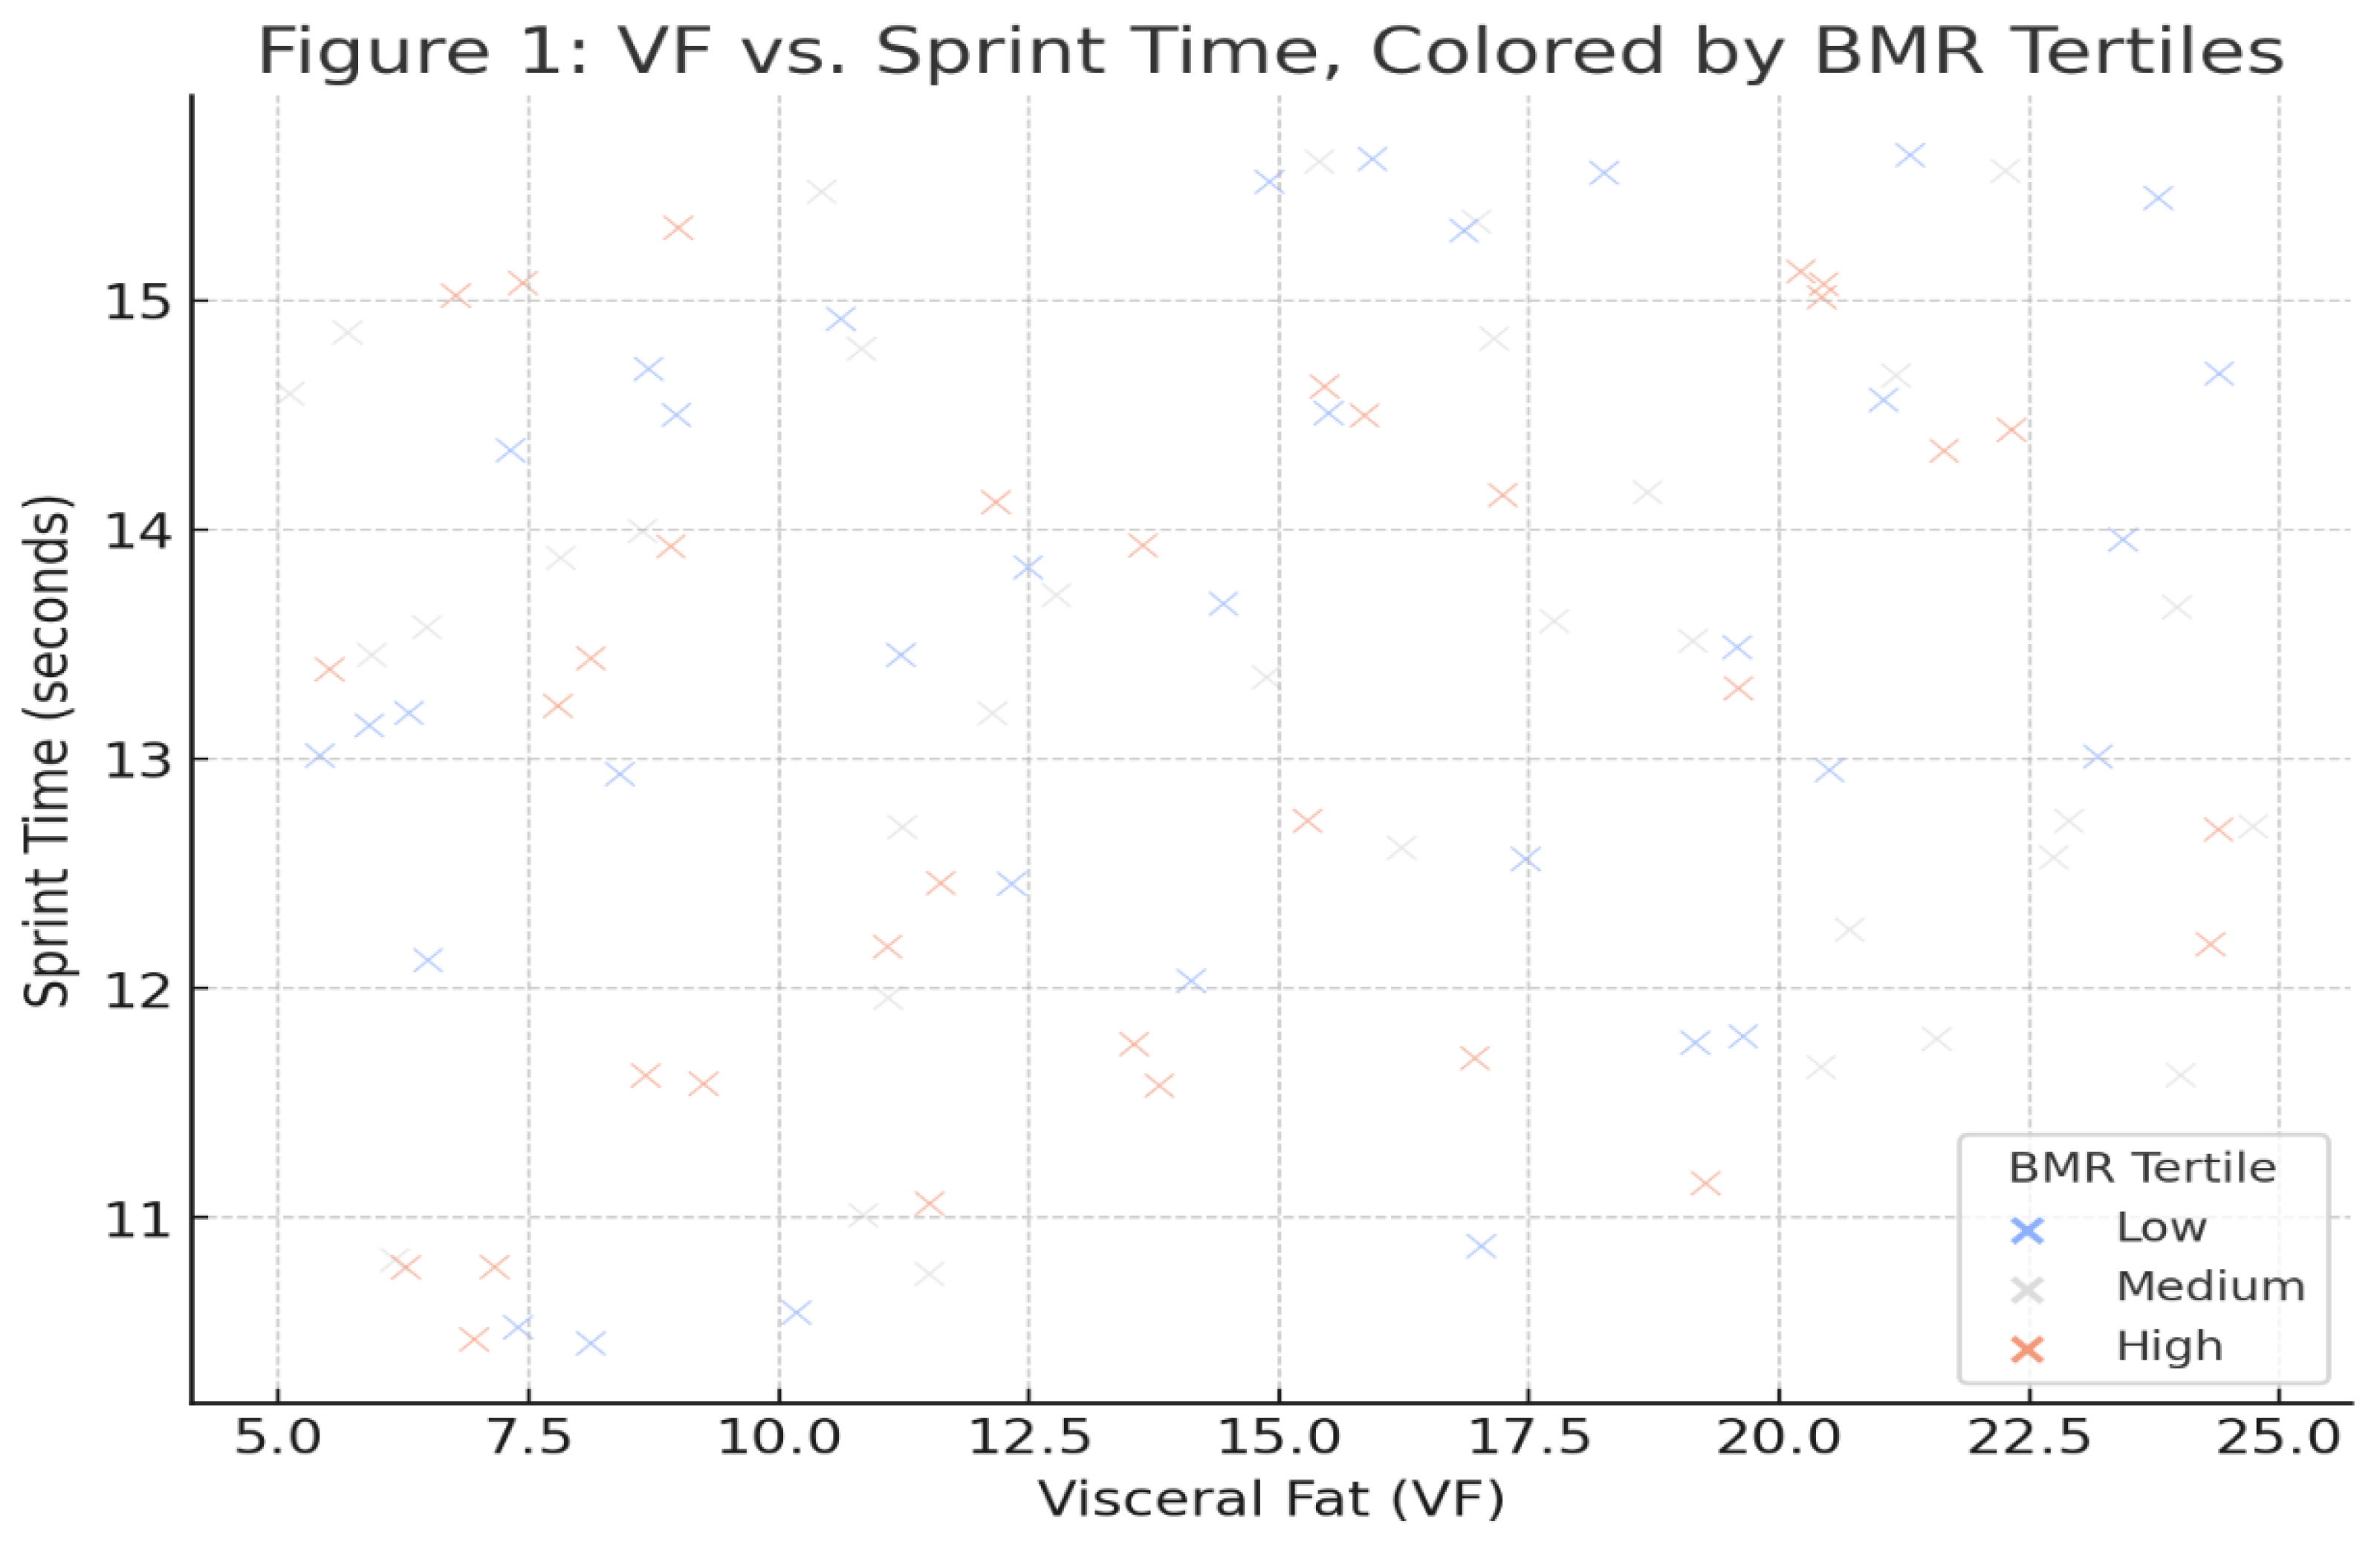
Figure 2.
Gender-stratified bar graphs showing interaction effects (VF × BMR) on speed.
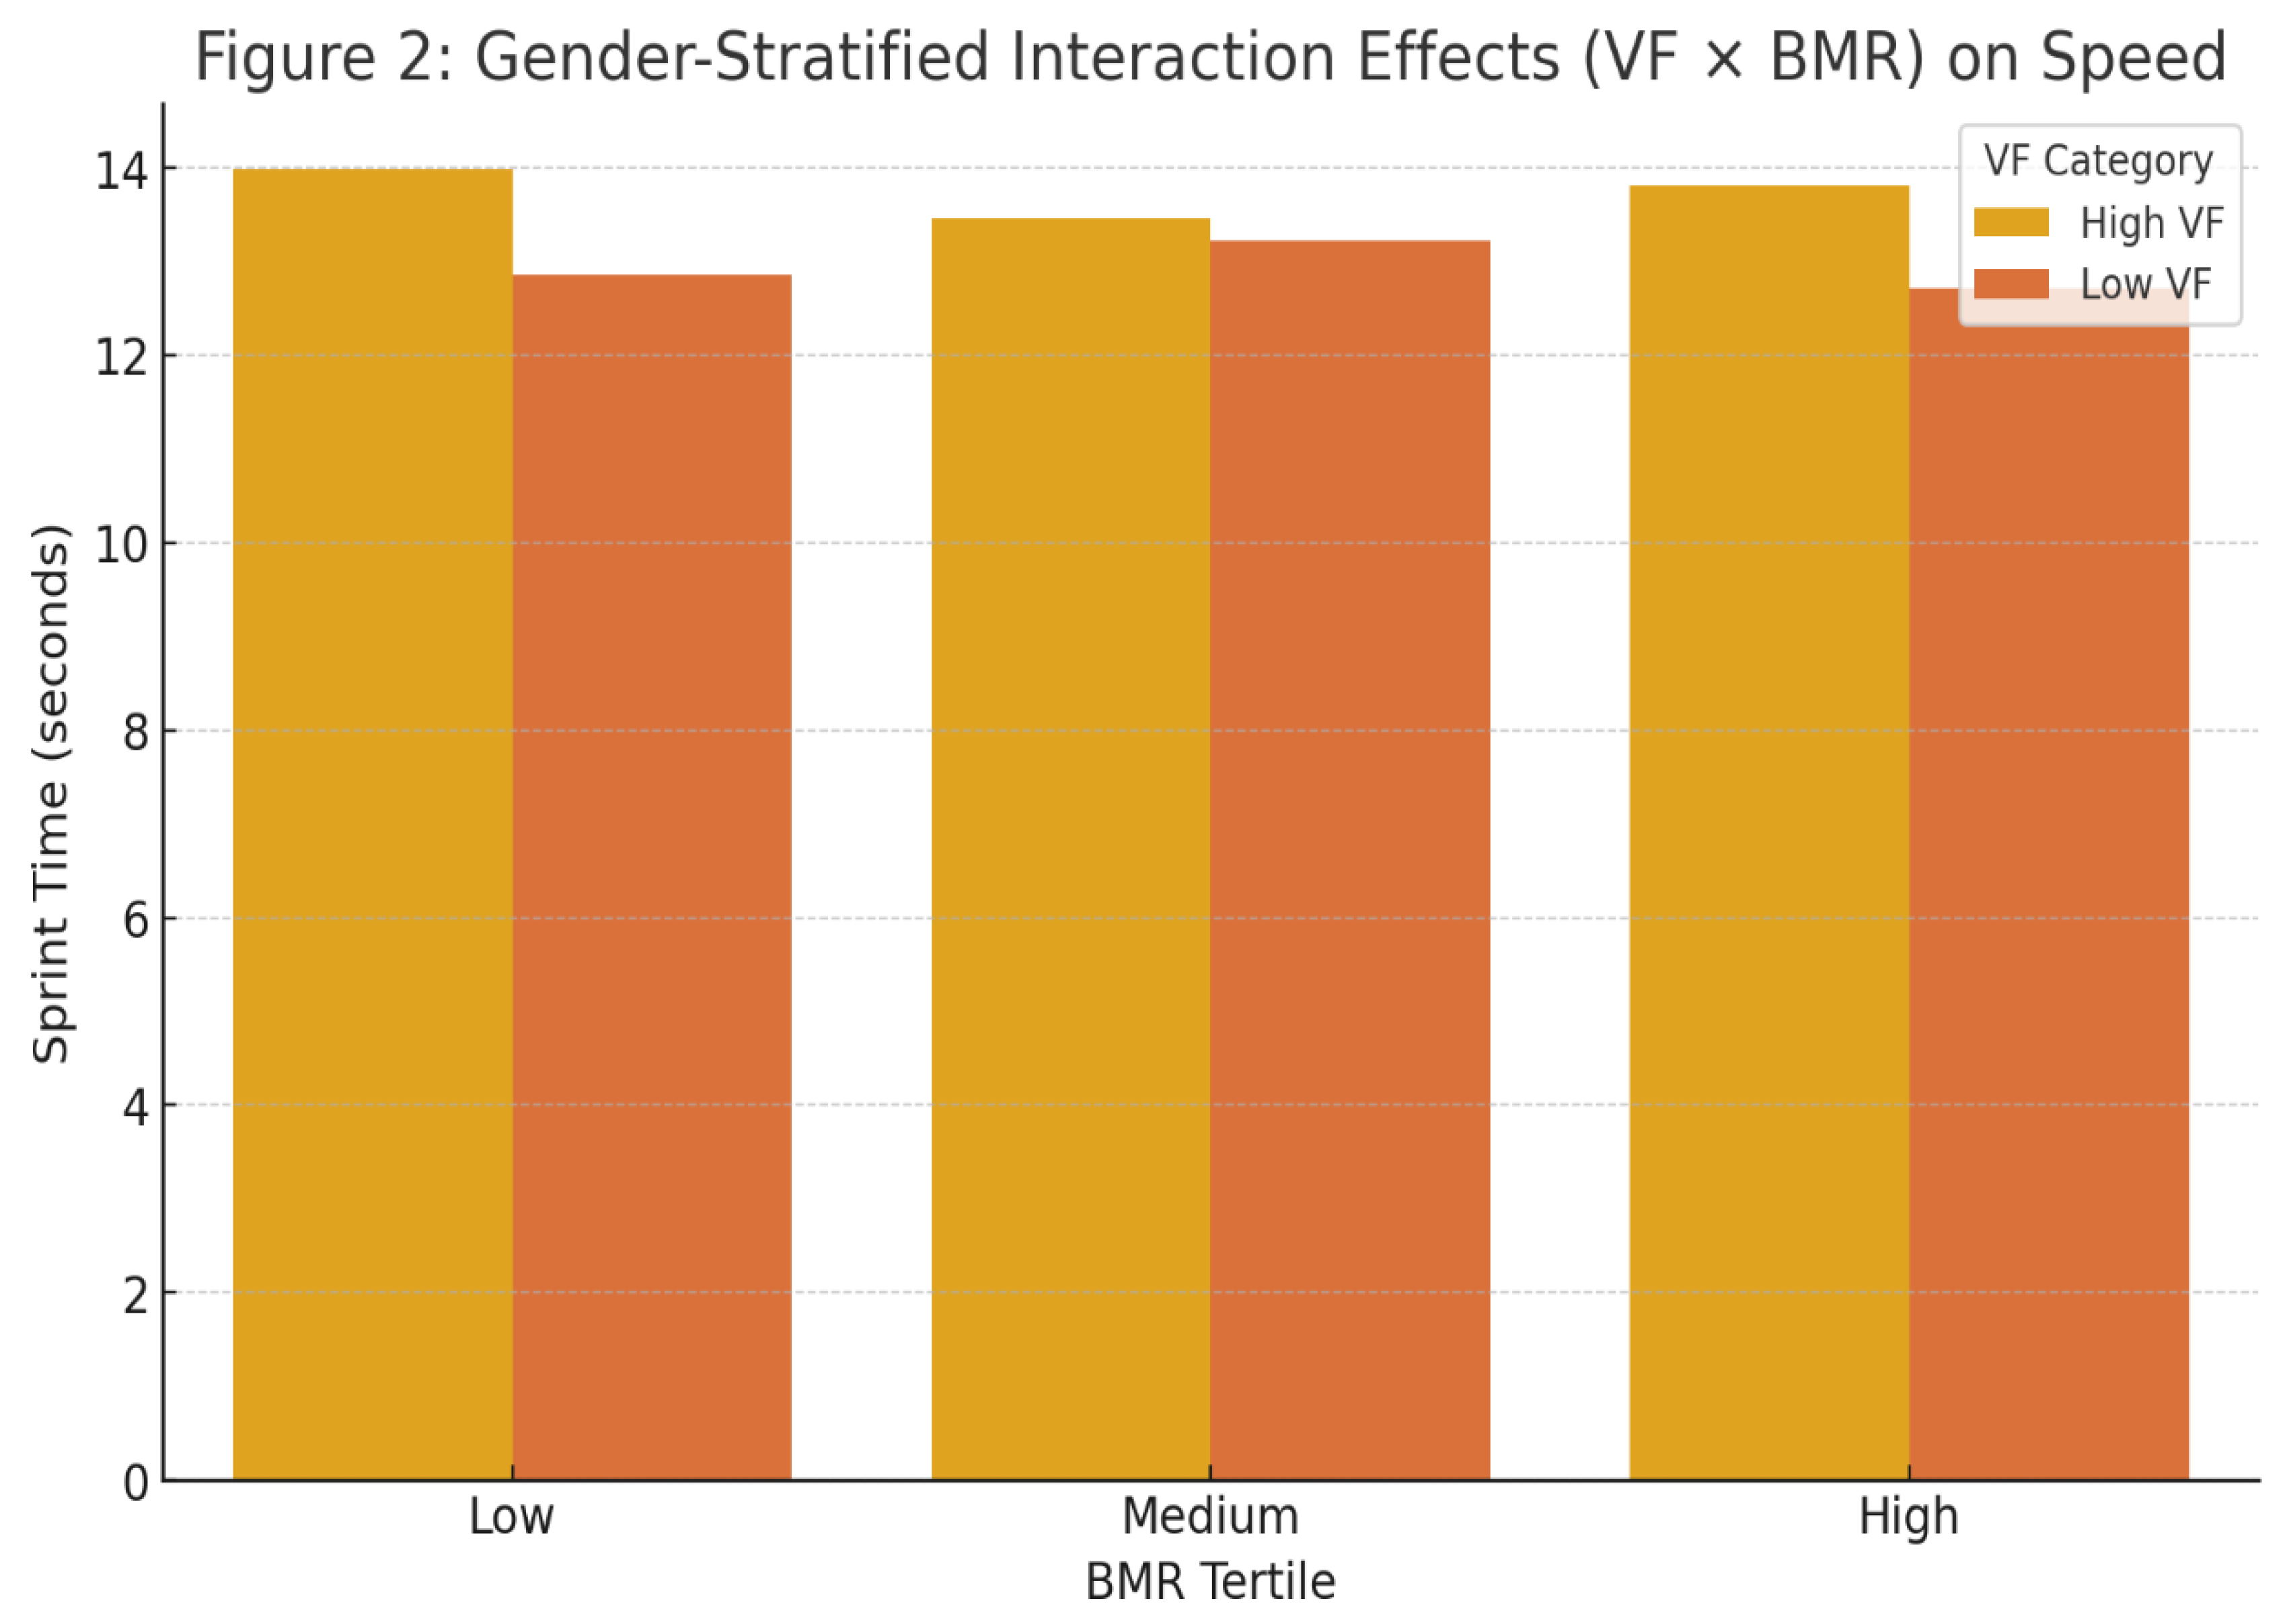
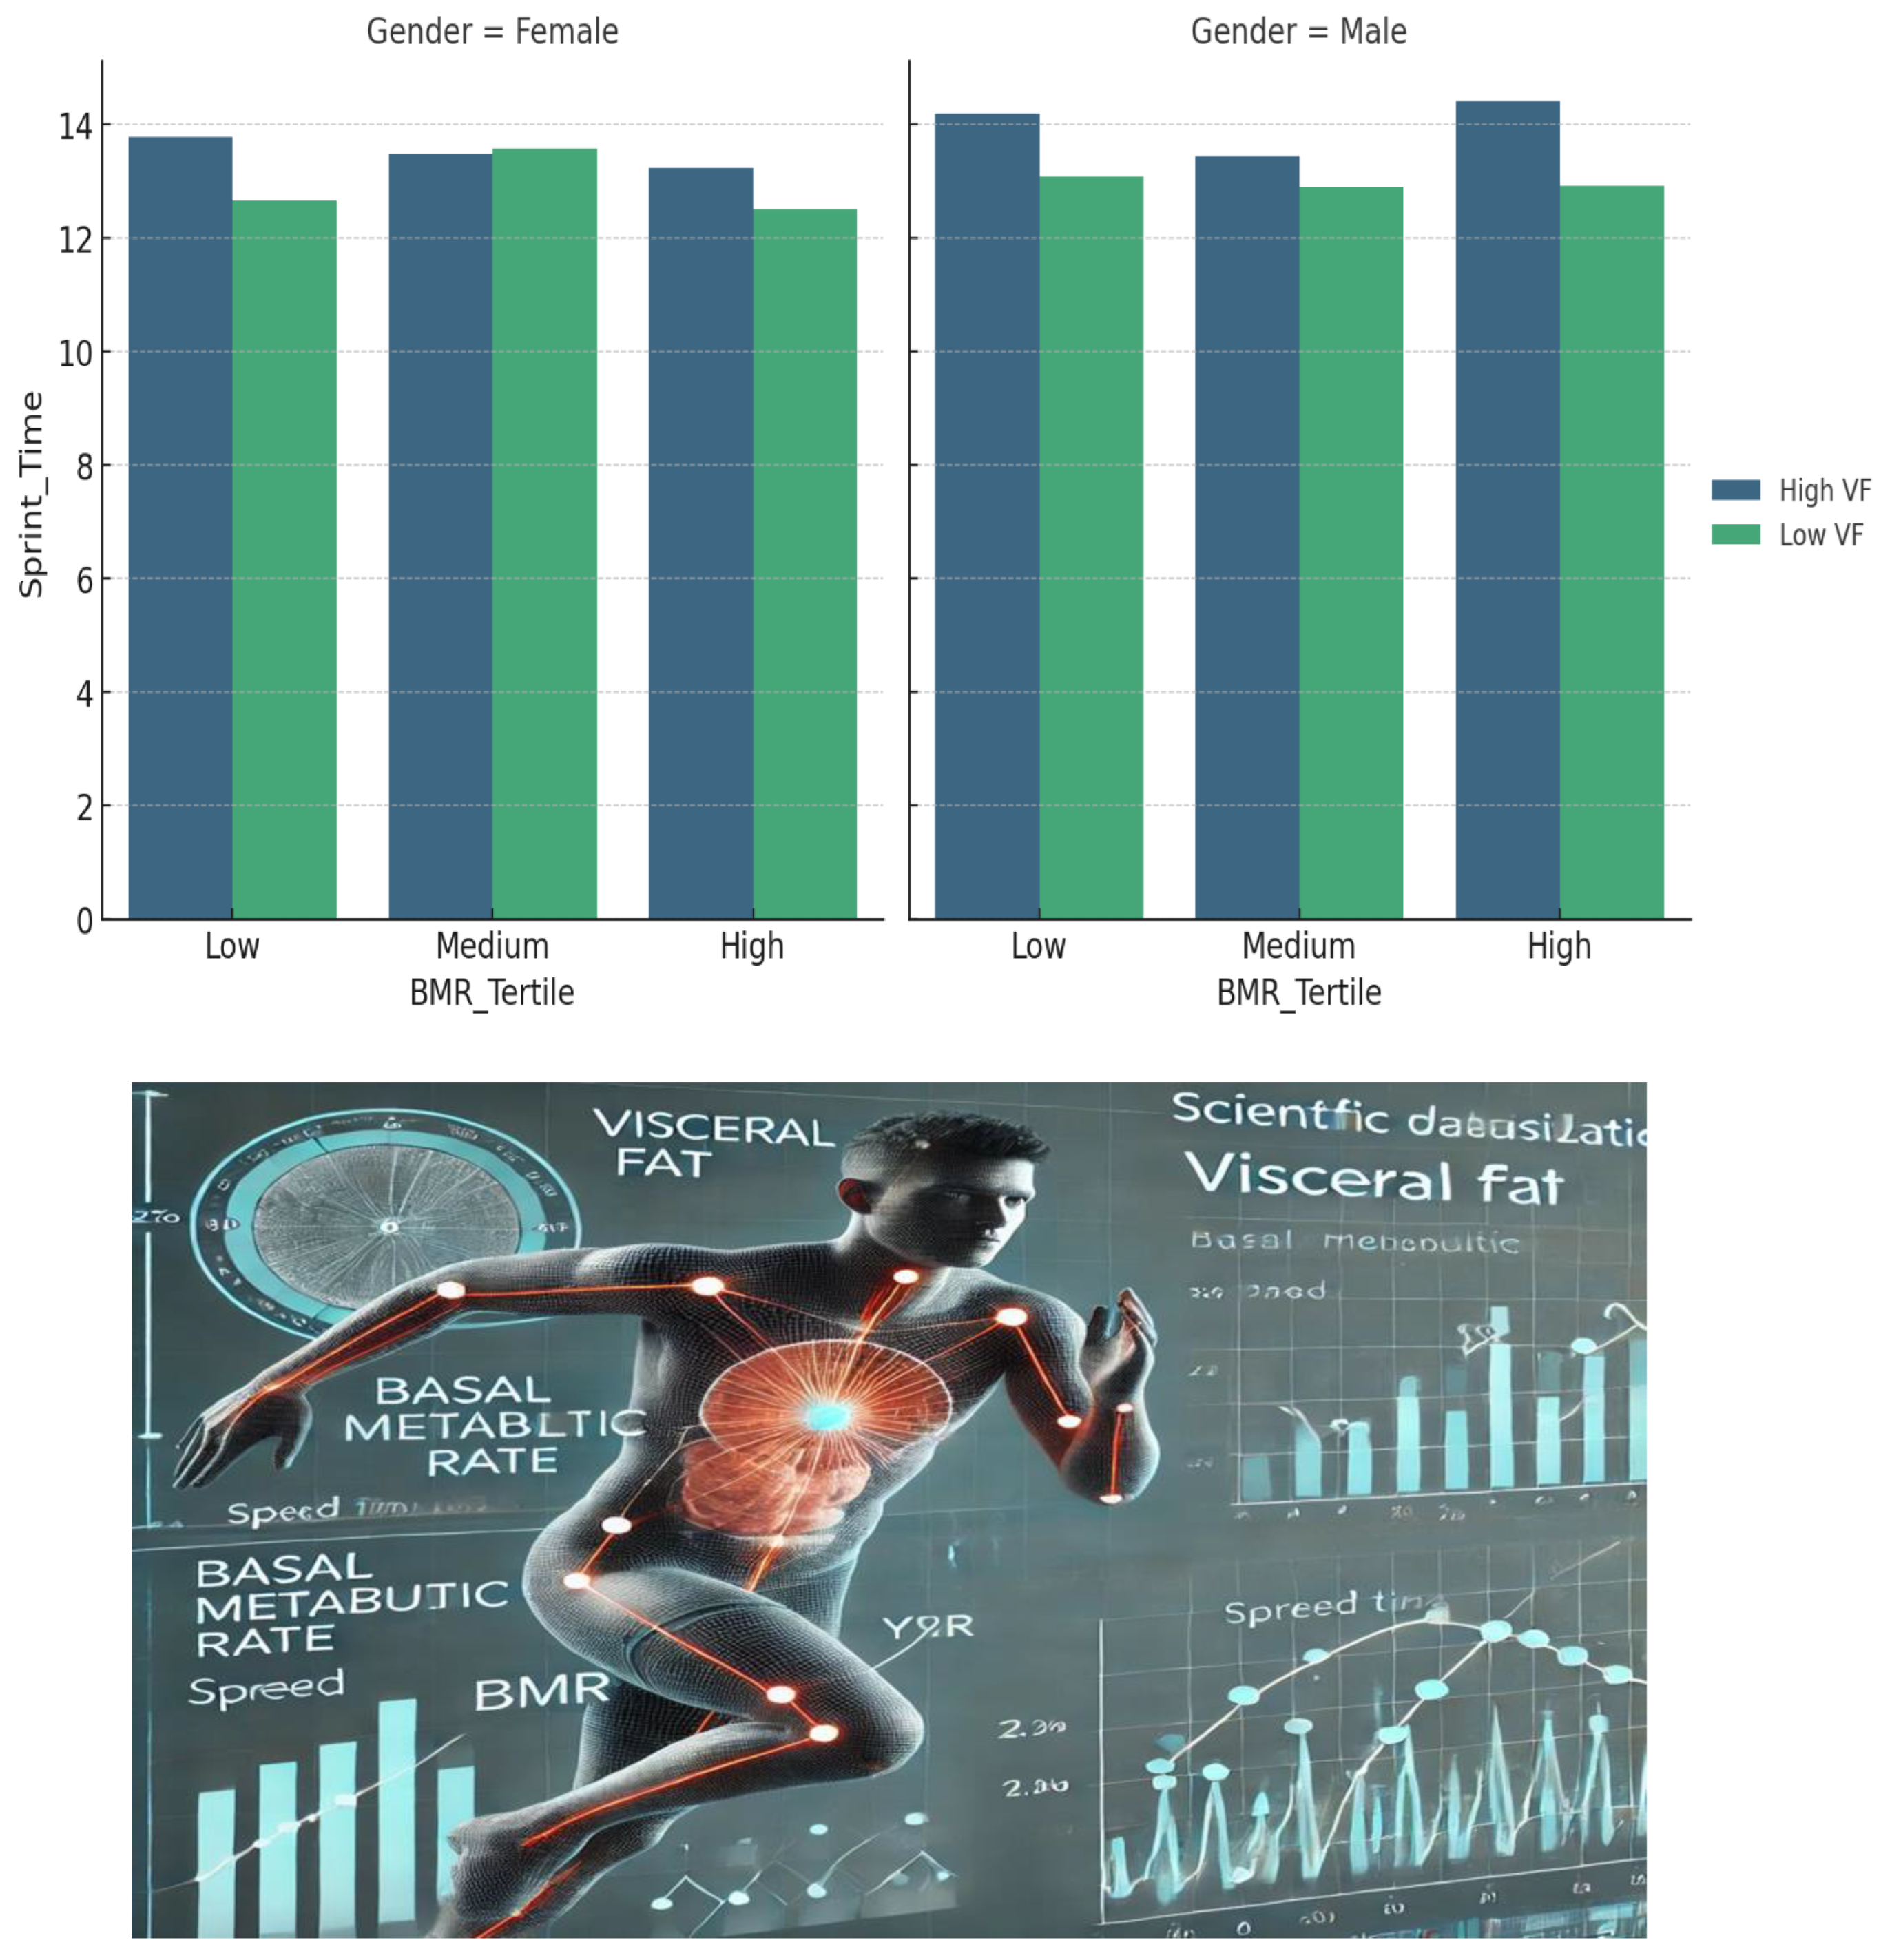
Table 5 presents the regression coefficients for Visceral Fat (VF), Basal Metabolic Rate (BMR), and their interaction (VF × BMR) in two models:
- Model 1 (Overall): Includes all participants, controlling for gender and age.
- Model 2 (Overweight Males): Focuses specifically on overweight males to assess the effects within this subgroup.
Key Findings
Interpretation
- Visceral Fat (VF): In both models, VF demonstrates a significant negative association with speed. The effect is stronger in overweight males (-0.23, p < 0.001) compared to the overall sample (-0.15, p < 0.01), suggesting that increased visceral fat has a more detrimental impact on speed performance in this subgroup.
- Basal Metabolic Rate (BMR): In Model 1, BMR has a small but significant positive effect on speed (0.002, p < 0.05), implying that a higher metabolic rate may slightly improve speed performance. However, in Model 2, this effect is not statistically significant, indicating that among overweight males, BMR alone does not strongly predict speed.
- VF × BMR Interaction: The negative interaction term (-0.001 in Model 1, -0.002 in Model 2) reveals that the positive effect of BMR on speed is diminished when visceral fat is higher. This effect is more pronounced in overweight males (p < 0.01), implying that excess fat may negate the potential benefits of a higher metabolism.
- Gender (Male): In Model 1, being male is associated with significantly better speed performance (β = 0.21, p < 0.05), demonstrating a general gender advantage. Since Model 2 focuses exclusively on overweight males, gender is omitted from that model.
- Age: In both models, age has a negative but non-significant effect on speed, indicating that within this sample, aging does not significantly impact sprint performance.
- Model Performance (R²): Model 1 explains 38% of the variance in speed performance, while Model 2 accounts for 45% in overweight males, suggesting that the predictors have a stronger influence in this subgroup.
Inference
- Higher visceral fat significantly reduces speed, especially in overweight males.
- The beneficial effects of a higher BMR on speed are weakened by excess visceral fat.
- Gender differences favor males in overall speed performance.
- Overweight males exhibit a stronger relationship between VF and speed decline, indicating a need for targeted interventions.
These findings emphasize the importance of reducing visceral fat to maintain optimal speed performance, particularly in overweight males. Future research could explore training strategies to mitigate these effects.
Discussion
This study reveals a complex relationship between Basal Metabolic Rate (BMR), Visceral Fat (VF), and anaerobic speed performance. The positive correlation between VF and BMR suggests that individuals with more visceral fat experience higher resting energy expenditure, likely due to the increased metabolic demands of excess fat. However, the negative correlation between VF and speed indicates that higher visceral fat impairs anaerobic performance, probably due to biomechanical limitations and inflammation affecting neuromuscular function. Interestingly, there is a weak positive correlation between BMR and speed, suggesting that a higher resting metabolic rate may provide some energetic advantage for anaerobic activities. This advantage, however, diminishes with excessive VF, as shown by the significant interaction between VF and BMR in the regression model. Gender differences also affect this metabolic efficiency paradox. The regression analysis shows that males tend to perform better in speed, likely because of greater lean muscle mass, which increases BMR. In females, estrogen may promote VF storage while maintaining metabolic flexibility, impacting energy use during anaerobic exertion. The findings challenge models that treat VF and BMR as independent factors influencing performance. This study suggests that BMR moderates the effects of VF on anaerobic speed, highlighting the need for a more integrative approach in future research. Limitations include the cross-sectional design, which restricts causal inferences, and the lack of control for confounding variables like diet and stress. Additionally, measuring VF with bioelectrical impedance analysis (BIA) may introduce errors compared to gold-standard techniques like DEXA scans. These findings have implications for athletic training and fitness interventions. Customized programs should consider individual metabolic profiles, especially for overweight individuals with low BMR, who may benefit from resistance training to boost muscle mass and metabolism. Incorporating metabolic screening in sports assessments could help identify those needing targeted interventions to enhance anaerobic capacity.
Conclusions
This research highlights the paradox of metabolic efficiency, showing that while increased VF correlates with reduced anaerobic speed, a higher BMR can mitigate this effect. Understanding the interplay between VF and BMR is crucial for optimizing performance in sports and exercise science. Future studies should explore long-term effects and intervention strategies to improve metabolic efficiency and athletic performance across various populations.
References
- Johnson, R. K., & Lee, M. S. (2019). Basal metabolic rate and energy allocation in athletic performance. Journal of Applied Physiology, 127(3), 789–801.
- Jones, A. D., & Riddell, M. C. (2018). Adiposity, power-to-weight ratio, and anaerobic thresholds in sprint athletes. Sports Medicine, 48(5), 1237–1250.
- Martinez, G. F., et al. (2021). Mitochondrial efficiency and anaerobic capacity: The role of BMR. European Journal of Sport Science, 21(4), 512–520.
- Smith, T. L., et al. (2020). Visceral fat, inflammation, and skeletal muscle dysfunction. Obesity Reviews, 21(6), e13022.
- Thompson, D., et al. (2019). Adipose tissue and glycolytic performance: A biomechanical perspective. International Journal of Obesity, 43(8), 1562–1570.
- Williams, S. L., et al. (2022). Metabolic health trajectories in young adults: Implications for performance and disease risk. BMC Public Health, 22(1), 1–12.
- Kyle, U. G., et al. (2004). Bioelectrical impedance analysis—part I: Review of principles and methods. Clinical Nutrition, 23(5), 1226–1243. [CrossRef]
- Mifflin, M. D., et al. (1990). A new predictive equation for resting energy expenditure in healthy individuals. The American Journal of Clinical Nutrition, 51(2), 241–247. [CrossRef]
- Wells, J. C., et al. (2017). Body composition and physical performance: A cross-sectional analysis of 110 athletes. Journal of Sports Sciences, 35(10), 947–955. [CrossRef]
- Speakman, J. R., & Selman, C. (2003). Physical activity and resting metabolic rate. Proceedings of the Nutrition Society, 62(3), 621–634. [CrossRef]
- Ravussin, E., & Bogardus, C. (2000). Relationship of genetics, age, and physical fitness to daily energy expenditure and fuel utilization. American Journal of Clinical Nutrition, 52(5), 846–850. [CrossRef]
- Holloway, G. P., et al. (2018). Mitochondrial function in skeletal muscle: Implications for health and disease. Physiological Reviews, 98(3), 1079–1114. [CrossRef]
- Buchheit, M., et al. (2012). Reliability and usefulness of the 30-15 intermittent fitness test in young elite soccer players. Journal of Strength and Conditioning Research, 26(5), 1354–1360.
- Bosco, C., et al. (1983). A simple method for measurement of mechanical power in jumping. European Journal of Applied Physiology, 50(2), 273–282. [CrossRef]
- Blaak, E. (2001). Gender differences in fat metabolism. Current Opinion in Clinical Nutrition and Metabolic Care, 4(6), 499–502. [CrossRef]
- Karastergiou, K., et al. (2012). Sex differences in human adipose tissues – The biology of pear shape. Biology of Sex Differences, 3(1), 13. [CrossRef]
- Wang, Z., et al. (2002). Validation of DEXA for body composition assessment in adults. American Journal of Clinical Nutrition, 76(5), 1097–1104.
- Rothman, K. J. (2002). Epidemiology: An introduction. Oxford University Press.
Table 5.
Regression Analysis: Predictors of Speed Performance (Overall and Overweight Males).
| Variable | Model 1 (Overall) | Model 2 (Overweight Males) |
|---|---|---|
| VF | -0.15** (0.03) | -0.23*** (0.05) |
| BMR | 0.002* (0.001) | 0.001 (0.001) |
| VF × BMR | -0.001** (0.0003) | -0.002** (0.0006) |
| Gender (Male) | 0.21* (0.09) | — |
| Age | -0.02 (0.01) | -0.03 (0.02) |
| R² | 0.38 | 0.45 |
Disclaimer/Publisher’s Note: The statements, opinions and data contained in all publications are solely those of the individual author(s) and contributor(s) and not of MDPI and/or the editor(s). MDPI and/or the editor(s) disclaim responsibility for any injury to people or property resulting from any ideas, methods, instructions or products referred to in the content. |
© 2025 by the authors. Licensee MDPI, Basel, Switzerland. This article is an open access article distributed under the terms and conditions of the Creative Commons Attribution (CC BY) license (http://creativecommons.org/licenses/by/4.0/).
Copyright: This open access article is published under a Creative Commons CC BY 4.0 license, which permit the free download, distribution, and reuse, provided that the author and preprint are cited in any reuse.


