Submitted:
21 March 2025
Posted:
25 March 2025
You are already at the latest version
Abstract
Air pollution monitoring in Korea has not yet been implemented in agricultural areas. This study compares agricultural air quality with urban air quality during two periods: (1) the entire measurement period and (2) high-PM episodes. To ensure broad spatial cover-age, eight monitoring stations were installed in Yeoju, Nonsan, Naju, Gimhae, Hongcheon, Danyang, Muan, and Sangju. Real-time measurements of PM-10, PM-2.5, SO₂, and NOx were conducted continuously from March 2023 to December 2024. Over the entire meas-urement period, PM concentrations were similar in both agricultural and urban areas, but gaseous pollutants were lower in agricultural areas. PM levels were higher in agricultural areas during summer, whereas urban areas showed higher concentrations in other sea-sons. During high-PM episodes (29 days), all pollutants were significantly higher in urban areas, with PM-2.5 showing a greater difference than PM-10. Diurnal variations revealed that PM-10, PM-2.5, and NO₂ peaked in the morning and reached their lowest levels around 3 PM, with urban levels consistently higher than those in agricultural areas. SO₂ showed a different pattern, reaching its lowest concentration at 6 AM and peaking at noon in urban areas and at 6 PM in agricultural areas. This patter closely followed temperature and wind speed variations.
Keywords:
Air pollution
; Agricultural air quality
; Particulate matter
; High‐PM episodes
; Meteorological parameters
1. Introduction
Air pollution is a major environmental concern with profound implications for public health, ecological sustainability, and agricultural productivity [1,2,3]. In Korea, approximately 800 air pollution monitoring networks are currently in operation, primarily focusing on urban, roadside, background and rural areas [4,5]. Despite extensive monitoring efforts, air quality assessments in agricultural areas have been limited. Agricultural areas are often grouped with rural regions, though they are distinct in terms of land use and activities. However, rural areas sometimes can have heavy traffic and include industrial complexes in Korea, making them very different from purely agricultural zones, which mainly consist of rice paddies and dry fields [4,6]. Agricultural areas cover a large portion of the national land and may exhibit unique air pollution characteristics influenced by farming activities, weather conditions, and long-range transport. Thus, comprehensive measurements are needed to accurately represent both agricultural regions and nearby cities [7,8].
Agricultural and urban environments exhibit distinct air pollution characteristics due to differences in emission sources, land use, and meteorological influences. While urban areas experience high pollutant levels from transportation, industrial activities, and residential heating, rural regions are impacted by agricultural practices such as biomass burning, fertilizer use, and livestock emissions [3,9]. Meteorological factors, including wind patterns, humidity, and solar radiation, further influence pollutant dispersion and chemical interactions, contributing to variations in air quality [10,11,12]. Given these complexities, further research is needed to better understand the relationship between agricultural emissions and air pollution dynamics in Korea.
Although air pollution levels in rural areas are generally lower than in urban regions due to reduced industrial and vehicular emissions [13,14,15], some rural areas can experience higher pollution levels. Agricultural activities, such as biomass burning, fertilizer use, and livestock emissions, can significantly contribute to air pollution, sometimes resulting in higher particulate matter (PM) concentrations than in urban areas [9,16]. Meteorological conditions and long-range transport of pollutants can also exacerbate air quality issues in rural regions [10,12].
In particular, ammonia (NH₃) emissions from agricultural activities are a key contributor to secondary particulate matter formation and regional air pollution [16,17,18,19]. Ammonia from livestock and fertilizers interacts with SO₂ and NO₂ to form secondary aerosols, impacting PM-2.5 levels [9]. While many studies highlight the role of agricultural ammonia emissions in PM-2.5 formation, sulfur dioxide (SO₂) and nitrogen dioxide (NO₂) are sometimes considered more influential [16,20]. This discrepancy arises from limited research on agricultural air quality. Further comprehensive research is required to better assess rural air pollution. Furthermore, a deeper understanding of air pollution dynamics in agricultural areas is crucial for formulating effective environmental policies and reducing health risks for rural communities [10,11,21].
This study established eight air pollution monitoring stations in agricultural regions across Korea and conducted a comparative assessment of air quality (PM-10, PM-2.5, SO₂, and NOx) across agricultural and urban environments. The data were analyzed in two periods: (1) the full measurement period and (2) high-PM episodes. By investigating spatial and temporal variations in air pollution, this study aims to provide a deeper understanding of air quality dynamics in agricultural regions and highlight the necessity of continuous monitoring efforts.
2. Materials and Methods
2.1. Monitoring Sites
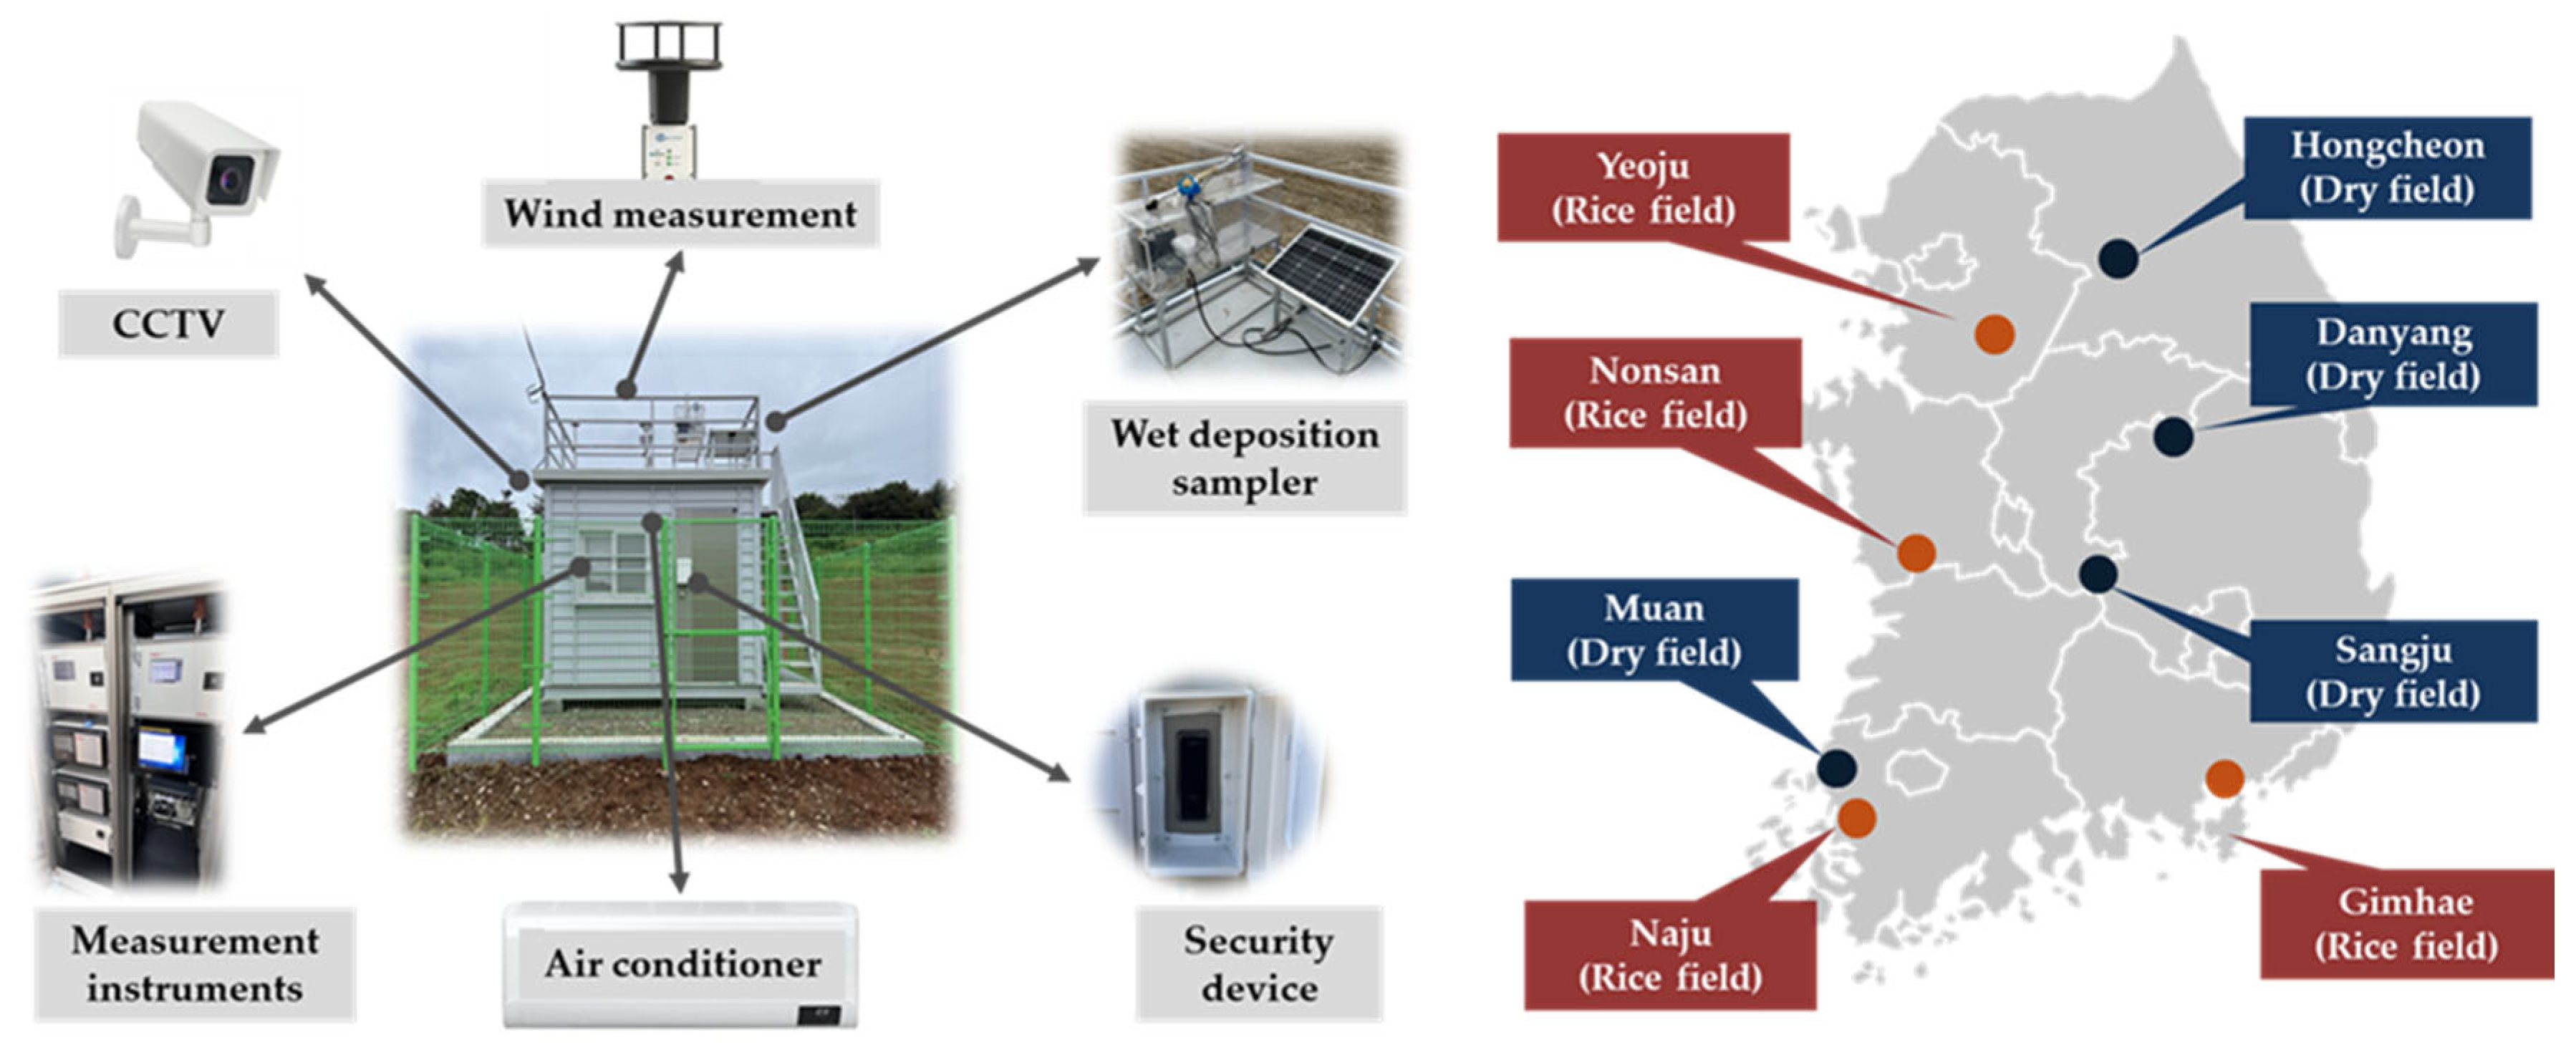
The air quality monitoring system in agricultural areas includes measurement equipment for pollutants (e.g., PM, NOx, NH₃, SO₂), meteorological sensors (wind, rain), and an automatic wet precipitation sampler. It features a closed-circuit television (CCTV) and security devices for monitoring and protection, alongside air conditioning to maintain optimal conditions. This setup provides essential data for understanding and managing agricultural air pollution. The map illustrates the locations of air quality monitoring stations in agricultural regions across South Korea. These 8 sites are categorized into rice cultivation areas (e.g., Nonsan, Naju, Gimhae, Yeoju) and upland crop regions (e.g., Hongcheon, Danyang, Sangju, Muan). The selection of these sites ensures comprehensive coverage of different agricultural environments, facilitating a better understanding of pollutant emissions and atmospheric interactions in agricultural areas.
Figure 1.
Site composition (left) and 006Cocations (right) for agricultural air quality monitoring.
2.2. Measurement
Particulate matter (PM-10 and PM-2.5) was measured using the β-ray attenuation method (Mezus 610, Kentek, Korea), which quantifies particle concentration by analyzing beta radiation absorption [22]. Sulfur dioxide (SO₂) was detected via the pulse UV fluorescence method (Mezus 110, Kentek, Korea), where SO₂ molecules emit fluorescence upon ultraviolet excitation [23]. Nitrogen oxides (NO, NO₂) were measured using the chemiluminescence method (Mizus 210, Kentek, Korea), which combines an NH₃ converter with an NOx analyzer [24]. The measurement ranges were 0 - 2,000 µg/m³ for PM and 0 -1 ppm for gaseous pollutants, with data recorded at five-minute intervals. PM-10 and PM-2.5 were measured in micrograms per cubic meter (µg/m³) with a resolution of 1 µg/m³, while SO₂ and NOx in parts per million (ppm) with a resolution of 0.5 parts per billion (ppb). These methods comply with certification standards from the Korean Ministry of Environment and the U.S. EPA, ensuring reliable air quality assessments in agricultural regions. Wind speed, wind direction, temperature and relative humidity were measured using an ultrasonic anemometer (KMS-4300, KEMIC corporation, Korea).
2.3. Data Processing and Maintenance
Since March 2023, monitoring sites have been measuring air pollution in agricultural areas, and the calibration and maintenance protocol for all measuring instruments and sampling systems was also periodically carried out. This study utilizes two years of measurement data from eight agricultural sites, covering the period from March 2023 to December 2024. The data were categorized into two periods: the full measurement period, the high-PM event period. High-PM episodes were identified as periods during which urban PM-2.5 levels (24 hours average) remained above Korea’s 24-hour air quality standard of 35 μg/m³. The dataset was processed using five-minute average data (raw data). Data affected by mechanical or electrical sparks, periods of constant values suggesting instrumental errors, and readings affected by inaccurate calibration were removed to ensure accuracy. The data presented in this study were averaged into one-hour intervals after data screening. Air quality data from near major cities (matched pairs: Daejeon-Nonsan, Gwangju-Naju, Busan-Gimhae, Suwon-Yeoju, Chuncheon-Hongcheon, Jecheon-Danyang, Daegu-Sangju, and Gwangju-Muan), measured by the urban air quality monitoring network, were also processed for a comparative analysis of agricultural and urban air quality. The average value of the 8 sites was used as the representative value for each region. Because each comparatively paired agricultural and urban area belongs to the same region, meteorological data such as temperature, relative humidity, and wind velocity measured at the agricultural site were applied equally. The data analysis period was divided into two main periods: (1) the entire measurement period and (2) the high-PM events period. In the daily variation analysis, different patterns were observed between summer and the other seasons, thus the period was divided into June to September and October to May, and the hourly averages for each period were used.
3. Results
3.1. Comparative Analysis of air Quality Between Agricultural and Urban Regions
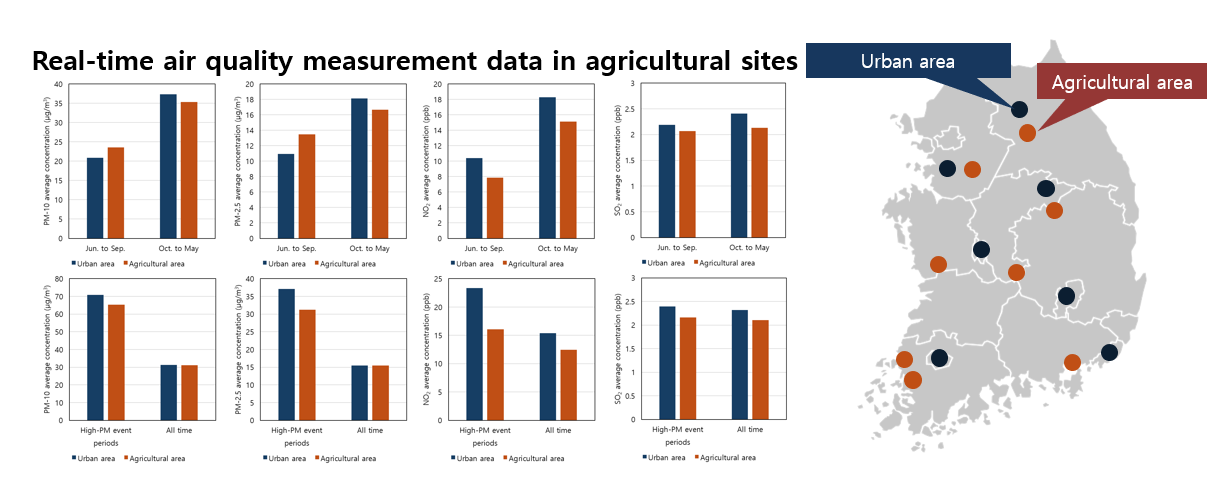
Figure 2 illustrates time-series variations in average PM-10 and PM-2.5 concentrations measured at urban and agricultural monitoring sites from March 2023 to December 2024. High-PM event periods of fine particulate matter (PM-2.5) occurred 8 times in 2023 and 6 times in 2024 (29 days = 696 hours). Considering that measurements began in March 2023, it can be observed that 2023 was a year with more frequent high-PM event events than the year of 2024. Most of these high-PM event periods occurred between December and April. Throughout the observation period, both urban and agricultural areas showed very similar concentration levels and variations, which can be attributed to the widespread spatial distribution of PM-2.5 and PM-10 pollution. Particularly, particulate matter generally showed higher concentrations in agricultural areas than in urban areas during the summer, with a more noticeable difference in PM-2.5 levels. This suggests that the secondary formation mechanisms in the two regions differ during the summer. The increase in PM-2.5 in agricultural areas during the summer is primarily attributed to enhanced ammonia (NH₃) volatilization under high temperatures, leading to gas-to-particle conversion. This secondary particulate matter formation is more significant than physical activities such as plowing and harvesting, which are associated with coarse particles [20,25,26].
Figure 3 illustrates time-series variations in average NO₂ and SO₂ concentrations measured at urban and agricultural monitoring sites from March 2023 to December 2024. Similar to particulate matter, gaseous substances also exhibited a similar pattern of concentration changes between urban and rural areas, with higher concentrations observed in urban areas. This was because urban areas have a high concentration of emission sources of nitrogen oxides and sulfur oxides emissions compared to rural or agricultural areas. Assuming that the main sources of SO₂ and NO₂ emissions are in urban areas rather than agricultural areas, NO₂ and SO₂ undergo significant gas-to-particle conversion in urban areas [4,27].
Table 1 compares air quality data for urban and agricultural areas, focusing on PM-10, PM-2.5, NO₂, and SO₂ concentrations. Average PM-10 levels are similar in both regions (urban: 34.62 µg/m³, agricultural: 34.29 µg/m³), though the maximum concentration is slightly higher in urban areas (264.47 µg/m³) compared to agricultural areas (267.82 µg/m³). For PM-2.5, average concentrations are nearly identical (urban: 16.42 µg/m³, agricultural: 16.44 µg/m³), but the maximum level is significantly higher in agricultural areas (56.97 µg/m³) than in urban areas (51.78 µg/m³), suggesting episodic pollution events in agricultural regions. NO₂ levels are higher in urban areas both on average (15.11 ppb vs. 8.64 ppb) and at peak concentrations (38.67 ppb vs. 41.78 ppb), reflecting more consistent urban pollution. SO₂ levels are slightly higher on average in urban areas (2.26 ppb vs. 2.00 ppb), while agricultural areas experience higher peak concentrations (4.33 ppb vs. 3.44 ppb). The averages from March 2023 to December 2024 also showed a similar trend to the averages for each year. Overall, urban areas exhibit more consistent pollution, while agricultural regions experience occasional spikes in certain pollutants
Figure 4 illustrates the diurnal patterns of particulate matter concentrations and meteorological parameters in agricultural and urban areas. Significant seasonal differences in fine particulate matter (PM-2.5) levels were observed. During summer, agricultural areas exhibited higher PM-2.5 concentrations, whereas urban areas experienced elevated levels in all other seasons. [4] compared agricultural in a specific region (Gochang, southwestern Korea) with urban areas and found that, dry field area had lower PM2.5 concentrations during the summer of 2020, while dry field area showed higher PM2.5 levels in all other seasons. The result differs somewhat from the findings of this study. This discrepancy arises because our study used average values from 8 sites distributed across the Korean Peninsula, while [4] study focused on a specific area, comparing a single dry field site with a nearby urban site. In general, many studies have reported that PM2.5 concentrations in urban areas are higher than those in rural or background regions [6,13,14,15]. Ammonia concentrations also exhibit seasonal variations between rural and urban areas. Rural regions generally have higher NH₃ levels due to agricultural activities like fertilizer use and livestock farming [17]. In rural areas, NH₃ peaks in summer due to increased volatilization, while winter sees the lowest levels due to reduced emissions. It is generally known that ammonia concentrations are lower in urban areas, emissions from traffic and industry contribute to seasonal fluctuations. NH₃ emissions in rural areas are closely linked to agricultural activity, with higher levels observed during peak fertilizer application and warm temperatures [28,29]. During the summer, the highest PM-2.5 concentrations in urban areas were observed between 9 AM and 12 PM, both in the morning and afternoon. In contrast, agricultural areas exhibited their peak PM-2.5 levels earlier in the day, typically between 6 AM and 9 AM, occurring approximately three hours earlier than in urban areas. Specifically, the highest PM-2.5 concentrations in agricultural areas were observed between 6 PM and 9 PM, while the highest concentrations in urban areas tended to occur between 9 AM and 12 PM. Previous research has shown that PM-2.5 concentrations in urban areas peak between 9 AM and 12 PM, decrease afterward, and then rise again in the evening, continuing to increase until midnight [6]. A previous monitoring study conducted in an agricultural area (dairy farm) observed a PM-2.5 peak between 6 AM and 9 AM, followed by a decrease. Another peak was observed in the evening, between 6 PM and 10 PM [20]. These PM-2.5 daily variations are consistent with the findings of this study. PM-2.5 concentrations were highest during times of high temperatures (wind speed) and low humidity, and also showed high levels when humidity was high. Regardless of the season, PM-2.5 concentrations in agricultural areas followed a pattern closely resembling that of humidity among the meteorological factors.
Figure 5 presents the diurnal variations of NO₂ and SO₂ concentrations in agricultural and urban areas. The concentrations of both NO₂ and SO₂ were generally higher in urban areas. NO₂ levels reached their peak during the morning and evening rush hours at both urban and agricultural sites, with lower concentrations observed during the late morning and around 3 PM. While NO₂ levels in urban areas showed consistent diurnal variation across seasons, agricultural areas in summer exhibited a unique pattern, characterized by a midday decrease in concentration and relatively stable levels throughout the rest of the day. NO₂ emissions are commonly associated with automobiles. From October to May, both agricultural and urban areas are primarily influenced by vehicle emissions during rush hours and this result is consistent with previous research findings [6]. During the summer months, NO₂ concentrations in urban areas continue to be affected by vehicle emissions, while agricultural areas are mainly influenced by other factors (meteorological parameters, agricultural activities, and so on) rather than vehicle emissions. SO₂ concentrations followed a simpler diurnal pattern, increasing during daylight hours and decreasing afterward. The concentration levels and diurnal patterns of SO₂ were nearly identical between urban and agricultural areas in summer. The diurnal variation pattern of SO₂ concentrations in both urban and agricultural areas follows a trend similar to temperature and wind speed, increasing in the morning, peaking during the hottest hours, and then decreasing afterward. [30] reported that in Mongolia, SO₂ concentrations are directly proportional to humidity and inversely proportional to temperature [30,31]. On the other hand, some studies have reported that SO₂ concentrations are directly proportional to temperature and that their relationship with climate and urban location (e.g., coastal cities) can vary, showing either a direct or inverse correlation to temperature [32,33]. At this point, the diurnal variation patterns of SO₂ concentrations cannot be clearly defined.
3.2. Comparative Analysis of Air Quality in High-PM Event Periods
Figure 6 and Figure 7 shows the concentrations of particulate matter, NO₂, and SO₂ during high-PM event periods in urban and agricultural areas. In general, pollutant concentrations were higher in urban areas than in agricultural areas. During Asian Dust episodes, coarse particles typically increase, which lowers the PM-2.5/PM-10 ratio. During Asian Dust episodes, coarse particles typically increase, leading to a lower PM₂.₅/PM₁₀ ratio. On April 12, 2023, and April 17–18, 2024, this pattern suggests that these periods corresponded to Asian Dust events [34,35]. In contrast, the PM₁₀ ratio was relatively lower than PM-2.5 concentrations on April 6–7, 2023, suggesting that the secondary formation of fine particles might have been dominant during this period. The notably high NO₂ concentrations observed in December 2023 are significant. In March 2023, high SO₂ concentrations were detected in agricultural regions. The high concentrations during certain periods are likely closely associated with large-scale agricultural activities conducted during those times.
Table 2 compares the concentrations of PM-10, PM-2.5, NO₂, and SO₂ during high-PM event periods at 8 sites in urban and agricultural areas. During the high-PM event season, not only the concentration of particulate matter but also that of gaseous substances significantly increased, compared to those during the entire measurement period. Urban areas show higher average concentrations of PM-10 (70.85 µg/m³) and PM-2.5 (37.12 µg/m³) compared to agricultural areas (PM-10: 65.40 µg/m³, PM-2.5: 31.26 µg/m³), with higher maximum values in urban areas (PM-10: 361.67 µg/m³, PM-2.5: 96.00 µg/m³). NO₂ levels are also higher in urban areas (average: 23.36 ppb) compared to agricultural areas (16.07 ppb), with urban maximums reaching 56.14 ppb. SO₂ concentrations are slightly higher in urban areas on average (2.39 ppb), but peak levels are much higher in agricultural areas (9.91 ppb vs. 3.98 ppb in urban areas). These findings suggest that urban areas experience higher average pollution levels, while agricultural areas see occasional peaks, particularly in SO₂.
Figure 10 shows diurnal patters of particulate matter, NO₂ and SO₂ concentrations and meteorological parameters in agricultural and urban area. During high-PM event periods, the concentrations of particulate matter were higher in urban areas than in agricultural area across all time points. Both urban and agricultural area exhibited similar diurnal patterns. In agricultural area, PM-2.5 concentrations peaked between 9-10 AM, while in urban areas, the peak occurred between 10-11 AM, with the lowest concentrations observed between 2-4 PM. NO₂ concentrations were highest around 8 AM in both agricultural and urban areas, with the lowest levels observed between 2-4 PM, suggesting that gas-to-particle (nitrate) conversion from NO₂ in the atmosphere may have influenced these patterns. In urban areas, PM-10, PM-2.5, NO₂, and SO₂ all followed similar diurnal patterns, whereas SO₂ exhibited a single peak between 3-6 PM in agricultural areas and this . This unusual pattern is likely due to increased emissions from SO₂ sources depending on weather conditions or a concentration increase from long-range transport [34,35,36]. Notably, the concentration difference of PM-2.5 between urban and rural areas was significantly higher than that of PM-10. Compared with Figure 4, this result highlights a distinct feature of high-PM event periods, likely linked to secondary formation. [37] emphasized that secondary aerosols play a key role in urban air pollution, higher concentrations of oxidants (OH radicals, NO) and precursor gases (NH₃, SO₂, NO₂) enhance gas-to-particle conversion compared to rural areas [37](Seinfeld and Pandis, 2016). [38] and [11] further support this, showing that secondary formation significantly contributes to urban particulate pollution, especially during haze events [11,38]. Similar to the previous findings, SO₂ concentrations in agricultural areas during high-concentration periods exhibited a pattern consistent with temperature and wind speed trends, suggesting that meteorological factors predominantly influence SO₂ levels in agricultural regions.
4. Conclusions
This study aimed to establish air pollution monitoring stations in agricultural areas across Korea, as air pollution monitoring has not been implemented in these regions. Eight stations were set up in agricultural areas, and real-time measurements of PM-10, PM-2.5, SO₂, NOx, and NH₃ were conducted from March 2023 to December 2024. A comparative analysis was performed between air quality in agricultural and urban environments during the entire measurement period and high-PM episodes. Overall, the concentration of particulate matter was observed to be similar in both agricultural and urban areas, while gaseous pollutants were higher in urban areas than in agricultural areas. In summer PM-2.5 concentrations were higher in agricultural areas than in urban areas, indicating differences in secondary formation mechanisms. Gaseous substances showed similar concentration diurnal patterns in urban and agricultural areas but were higher in urban areas due to more nitrogen oxide and sulfur oxide emission sources. PM-2.5 concentrations were higher in agricultural areas during summer due to ammonia emissions from fertilizer, while urban areas had consistently high levels in other seasons. High-PM events were more frequent in 2023 than in 2024, with most occurring between December and April. During high-PM event periods, particulate matter concentrations were higher in urban areas, with both urban and agricultural areas showing similar diurnal patterns. The greater difference in PM-2.5 levels between urban and agricultural areas suggests that secondary formation plays a key role, driven by higher concentrations of oxidants and precursor gases in urban environments. Meteorological factors, particularly temperature and wind speed, primarily influence SO₂ concentrations in agricultural areas during high-PM event periods. The findings of this study will provide valuable insights into the behavior of airborne pollutants in agricultural settings and contribute to the development of targeted strategies for improving air quality management in these regions.
Author Contributions
Conceptualization, H. J., J. K., B.O.; methodology, J.B. and H.J.; software, J.B. and S.B.; validation, H.J. and J.B.; formal analysis, J.B. and S.B.; investigation, J.B., H.J., and S.B.; data curation, H. J., J.B., S.B., J.K., and O.B.; writing—original draft preparation, J.B. and H.J.; writing—review and editing, H.J.; visualization, J.B. and S.B.; supervision, H.J.; project administration, J.K., B.O.; funding acquisition, J.K.; All authors have read and agreed to the published version of the manuscript.
Funding:
Funding: This work was supported by the research project titled “Cooperative Research Program for Agriculture Science & Technology Development (Project No. PJ017075)”, Rural Development Administration of Korea
Conflicts of Interest
This work was supported by the research project titled “Cooperative Research Program for Agriculture Science & Technology Development (Project No. PJ017075)”, Rural Development Administration of Korea
Abbreviations
The following abbreviations are used in this manuscript:
| PM-10 | Particulate matter with diameters less than 10 microns |
| PM-2.5 | Particulate matter with diameters less than 2.5 microns |
| SO₂ | Sulfur dioxide |
| NO₂ | Nitrogen dioxide |
| AM | Ante meridiem |
| PM | Post meridiem |
| WHO | World Health Organization |
| NH3 | Ammonia |
| NOx | Nitrogen oxides |
| CCTV | Closed-circuit television |
| UV | Ultra violet |
| ppb | Part per billion |
| U.S. EPA | United States Environmental Protection Agency |
| OH | Hydroxyl |
| NO | Nitrogen monoxide |
References
- Kim, K.-H.; Jahan, S.A.; Kabir, E. A review on human health perspective of air pollution with respect to allergies and asthma. Environ. Int. 2013, 59, 41–52. [Google Scholar] [CrossRef] [PubMed]
- World Health Organization (WHO). Air pollution and health; WHO: 2021. Available online: https://www.who.int/news-room/fact-sheets/detail/ambient-(outdoor)-air-quality-and-health.
- Wyer, K.E.; Kelleghan, D.B.; Blanesidal, V.; Schauberger, G.; Curran, T.P. Ammonia emissions from agriculture and their contribution to fine particulate matter: A review of implications for human health. Journal of Environmental Management 2022, 323, 116285. [Google Scholar] [CrossRef] [PubMed]
- Kim, M.; Kim, J.; Kim, K.; Hong, S. Study on the Emission Characteristics of Air Pollutants from Agricultural Area. Korean J. Environ. Agric. 2021, 40, 211–218. [Google Scholar] [CrossRef]
- Jung, C.H.; Kim, Y.P. Current status of air quality and greenhouse gas monitoring networks: Case studies from various countries and implications for South Korea. J. Korean Soc. Atmos. Environ. 2024, 40, 704–732. [Google Scholar] [CrossRef]
- Oh, S.-H.; Oh, S.-H.; Bae, M.-S. Characteristics of Atmospheric Compounds based on Regional Multicorrelation Analysis in Honam Area; Journal of Environmental Analysis. Health and Toxicology 2022, 25, 85–98. [Google Scholar] [CrossRef]
- Seo, J.; Park, D.-S.R.; Kim, J.Y.; Youn, D.; Lim, Y.B.; Kim, Y. Effects of meteorology and emissions on urban air quality: A quantitative statistical approach to long-term records (1999–2016) in Seoul, South Korea. Atmos. Chem. Phys. 2018, 18, 16121–16137. [Google Scholar] [CrossRef]
- Zhang, Y.; Tao, S.; Shen, H.; Ma, J. Inhalation exposure to ambient polycyclic aromatic hydrocarbons and lung cancer risk of the Chinese population. Proc. Natl. Acad. Sci. USA 2019, 106, 21063–21067. [Google Scholar] [CrossRef]
- Gu, B.; Zhang, L.; Van Dingenen, R.; Vieno, M.; Van Grinsven, H.J.M.; Zhang, X.; Zhang, S.; Chen, Y.; Wang, S.; Ren, C.; Rao, S.; Holland, M.; Winiwarter, W.; Chen, D.; Xu, J.; Sutton, M.A. Abating ammonia is more cost-effective than nitrogen oxides for mitigating PM2.5 air pollution. Science 2021, 374, 758–762. [Google Scholar] [CrossRef]
- Huang, K.; Zhuang, G.; Lin, Y.; Wang, Q.; Fu, J.S.; Fu, Q.; Liu, T.; Deng, C. How to improve the air quality over megacities in China: Pollution characterization and source analysis in Shanghai before, during, and after the 2010 World Expo. Atmos. Chem. Phys. 2013, 13, 5927–5942. [Google Scholar] [CrossRef]
- Huang, R.J.; Zhang, Y.; Bozzetti, C.; et al. High secondary aerosol contribution to particulate pollution during haze events in China. Nature 2014, 514, 218–222. [Google Scholar] [CrossRef]
- Yadav, R.; Sahu, L.K.; Beig, G.; Jaaffrey, S.N.A. Role of long-range transport and local meteorology in seasonal variation of surface ozone and its precursors at an urban site in India. Atmos. Res. 2016, 176–177, 96–107. [Google Scholar] [CrossRef]
- Röösli, M.; Braun-Fährlander, C.; Künzli, N.; Oglesby, L.; Theis, G.; Camenzind, M.; Mathys, P.; Staehelin, J. Spatial variability of different fractions of particulate matter within an urban environment and between urban and rural sites. Journal of the Air & Waste Management Association 2000, 50, 1115–1124. [Google Scholar] [CrossRef]
- Van Donkelaar, A.; Martin, R.V.; Brauer, M.; Kahn, R.; Levy, R.; Verduzco, C.; Villeneuve, P.J. Global estimates of ambient fine particulate matter concentrations from satellite-based aerosol optical depth: Development and application. Environ. Health Perspect. 2010, 118, 847–855. [Google Scholar] [CrossRef] [PubMed]
- Mues, A.; Manders, A.; Schaap, M.; van Ulft, L.H.; van Meijgaard, E.; Builtjes, P. Differences in particulate matter concentrations between urban and rural regions under current and changing climate conditions. Atmospheric Environment 2013, 80, 232–247. [Google Scholar] [CrossRef]
- Behera, S.N.; Sharma, M. Reconstructing primary and secondary components of PM2.5 composition for an urban atmosphere. Aerosol Sci. Technol. 2010, 44, 983–992. [Google Scholar] [CrossRef]
- Behera, S.N.; Sharma, M.; Aneja, V.P.; Balasubramanian, R. Ammonia in the atmosphere: A review on emission sources, atmospheric chemistry, and deposition on terrestrial bodies. Environ. Sci. Pollut. Res. 2013, 20, 8092–8131. [Google Scholar] [CrossRef]
- Pinder, R.W.; Dennis, R.L.; Bhave, P.V. Observable indicators of the sensitivity of PM2.5 nitrate to emission reductions—Part I: Derivation of the adjusted gas ratio and applicability at regulatory-relevant time scales. Atmos. Environ. 2008, 42, 1275–1286. [Google Scholar] [CrossRef]
- Paulot, F.; Jacob, D.J. Hidden cost of US agricultural exports: Particulate matter from ammonia emissions; Environ. Sci. Technol. 2014, 48, 903–908. [Google Scholar] [CrossRef]
- Joo, H.S.; Han, S.W.; Han, J.S.; Ndegwa, P.M. Emission characteristics of fine particles in relation to precursor gases in agricultural emission sources: A case study of dairy barns. Atmosphere 2023, 14, 171. [Google Scholar] [CrossRef]
- Van der Werf, G.R.; Randerson, J.T.; Giglio, L.; Van Leeuwen, T.T.; Chen, Y.; Rogers, B.M.; Kasibhatla, P.S. Global fire emissions and the contribution of deforestation, savanna, forest, agricultural, and peat fires (1997–2009). Atmos. Chem. Phys. 2010, 10, 11707–11735. [Google Scholar] [CrossRef]
- McMurry, P.H. A review of atmospheric aerosol measurements. Atmos. Environ. 2000, 34, 1959–1999. [Google Scholar] [CrossRef]
- Luke, W.T. Evaluation of a commercial pulsed fluorescence detector for the measurement of low-level SO₂ concentrations during Gas-Phase Sulfur intercomparison experiment. J. Geophys. Res. 1997, 102, 16255–16265. [Google Scholar] [CrossRef]
- Maeda, Y.; Takenaka, N. Chemiluminescence determination of trace amounts of ammonia and halogen species in the environment. Proc. SPIE 1993, 1715. [Google Scholar] [CrossRef]
- Joo, H.S.; Park, K.; Lee, K.; Ndegwa, P.M. Mass concentration coupled with mass loading rate for evaluating PM₂.₅ pollution status in the atmosphere: A case study based on dairy barns. Environ. Pollut. 2015, 207, 374–380. [Google Scholar] [CrossRef]
- Meng, Z.; Xu, X.; Lin, W.; Ge, B.; Xie, Y.; Song, B.; Jia, S.; Zhang, R.; Peng, W.; Wang, Y.; Cheng, H.; Yang, W.; Zhao, H. Role of ambient ammonia in particulate ammonium formation at a rural site in the North China Plain. Atmos. Chem. Phys. 2018, 18, 167–184. [Google Scholar] [CrossRef]
- Khoder, M.I. Atmospheric conversion of sulfur dioxide to particulate sulfate and nitrogen dioxide to particulate nitrate and gaseous nitric acid in an urban area. Chemosphere 2002, 49, 675–684. [Google Scholar] [CrossRef]
- Sutton, M.A.; Erisman, J.W.; Dentener, F.; Möller, D. Ammonia in the environment: From ancient times to the present. Environ. Pollut. 2008, 156, 583–604. [Google Scholar] [CrossRef]
- Joo, H.S.; Ndegwa, P.M.; Wang, X.; Heber, A.J.; Ni, J.-Q.; Cortus, E.L.; Ramirez-Dorronsoro, J.C.; Bogan, B.W.; Chai, L. Ammonia and hydrogen sulfide concentrations and emissions for naturally ventilated freestall dairy barns. Transactions of the ASABE 2015, 58, 1321–1331. [Google Scholar] [CrossRef]
- Luvsan, M.-E.; Shie, R.-H.; Purevdorj, T.; Badarch, L.; Baldorj, B.; Chan, C.-C. The influence of emission sources and meteorological conditions on SO₂ pollution in Mongolia. Atmospheric Environment 2012, 61, 542–549. [Google Scholar] [CrossRef]
- Sezer Turalıoğlu, F.; Nuhoğlu, A.; Bayraktar, H. Impacts of some meteorological parameters on SO₂ and TSP concentrations in Erzurum, Turkey. Chemosphere 2005, 59, 1633–1642. [Google Scholar] [CrossRef]
- Jayamurugan, R.; Kumaravel, B.; Palanivelraja, S.; Chockalingam, M.P. Influence of Temperature, Relative Humidity and Seasonal Variability on Ambient Air Quality in a Coastal Urban Area. Int. J. Atmos. Sci. 2013, 264046. [Google Scholar] [CrossRef]
- Li, R.; Fu, H.; Cui, L.; Li, J.; Wu, Y.; Meng, Y.; Wang, Y.; Chen, J. The spatiotemporal variation and key factors of SO₂ in 336 cities across China. J. Clean. Prod. 2019, 210, 602–611. [Google Scholar] [CrossRef]
- Han, S.; Joo, H.; Song, H.; Lee, S.; Han, J. Source Apportionment of PM₂.₅ in Daejeon Metropolitan Region during January and May to June 2021 in Korea Using a Hybrid Receptor Model. Atmosphere 2022, 13, 1902. [Google Scholar] [CrossRef]
- Han, S.; Joo, H.; Kim, K.; Cho, J.; Moon, K.; Han, J. Modification of Hybrid Receptor Model for Atmospheric Fine Particles (PM₂.₅) in 2020 Daejeon, Korea, Using an ACERWT Model. Atmosphere 2024, 15, 477. [Google Scholar] [CrossRef]
- Kim, K.; Lee, C.; Choi, D.; Han, S.; Eom, J.; Han, J. A Study on the Formation Reactions and Conversion Mechanisms of HONO and HNO₃ in the Atmosphere of Daejeon, Korea. Atmosphere 2024, 15, 267. [Google Scholar] [CrossRef]
- Seinfeld, J.H.; Pandis, S.N. Atmospheric Chemistry and Physics: From Air Pollution to Climate Change; John Wiley & Sons: 2016.
- Zhang, Q.; Wang, G.; Guo, S.; Zamora, M.; Ying, Q.; Wang, W.; Hu, M.; Wang, Y. Formation of urban fine particulate matter. Chem. Rev. 2015, 115, 3803–3855. [Google Scholar] [CrossRef]
Figure 1.
PM-10 and PM-2.5 concentrations in agricultural and urban sites of Korea from 2023 to 2024. Horizontal dotted line indicates the Korea’s 24-hours air quality standards and vertically red shade areas were the high-PM event periods.
Figure 1.
PM-10 and PM-2.5 concentrations in agricultural and urban sites of Korea from 2023 to 2024. Horizontal dotted line indicates the Korea’s 24-hours air quality standards and vertically red shade areas were the high-PM event periods.
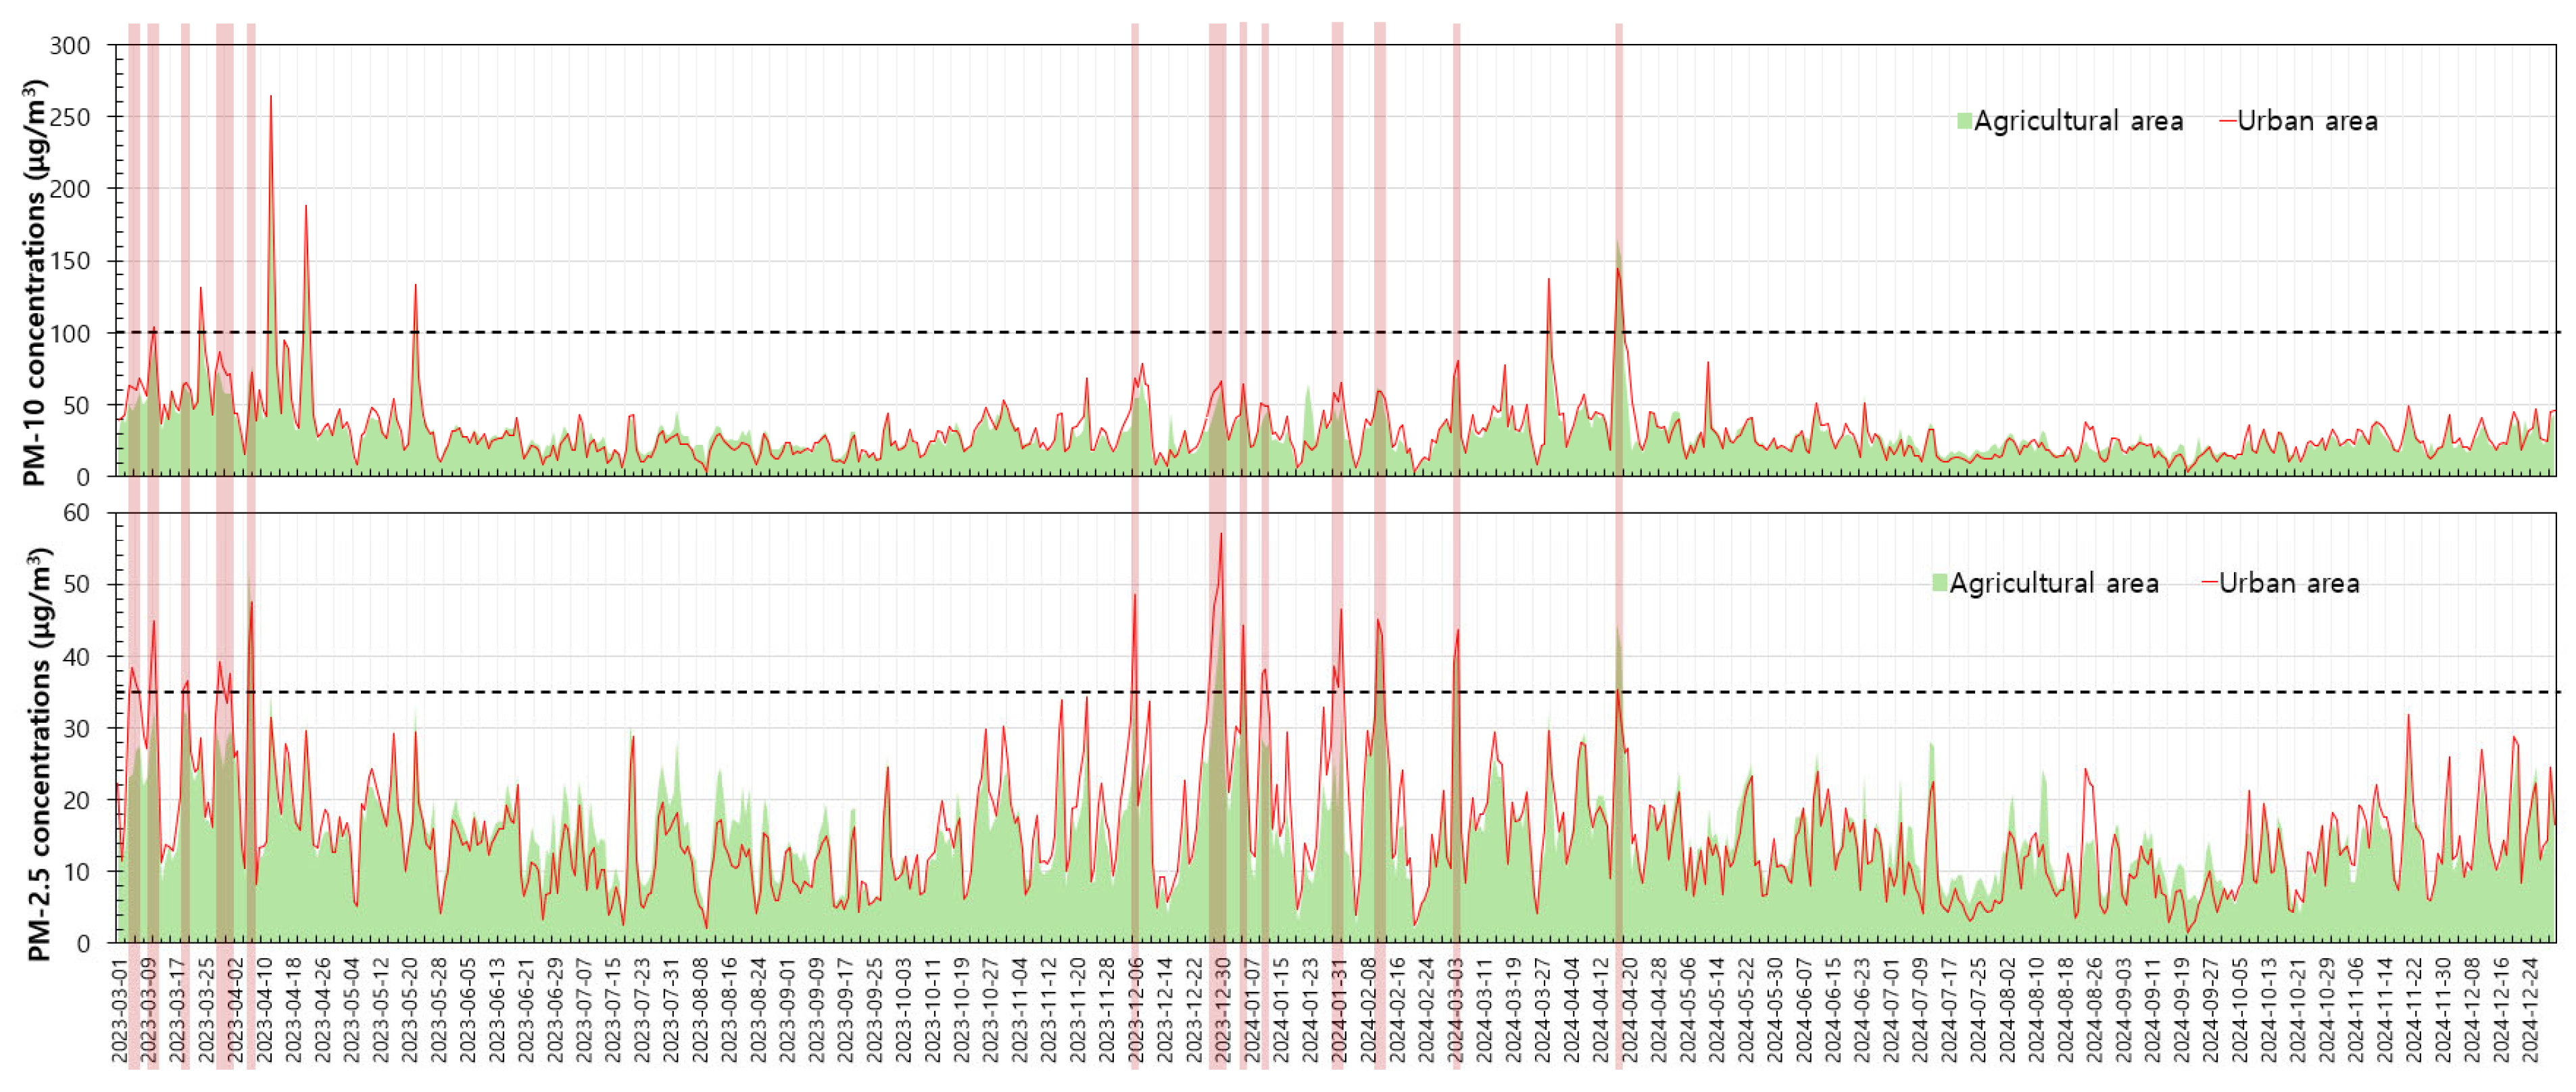
Figure 3.
NO₂ and SO₂ concentrations in agricultural and urban sites of Korea from 2023 to 2024. Vertically red shade area were the high-PM event periods.
Figure 3.
NO₂ and SO₂ concentrations in agricultural and urban sites of Korea from 2023 to 2024. Vertically red shade area were the high-PM event periods.
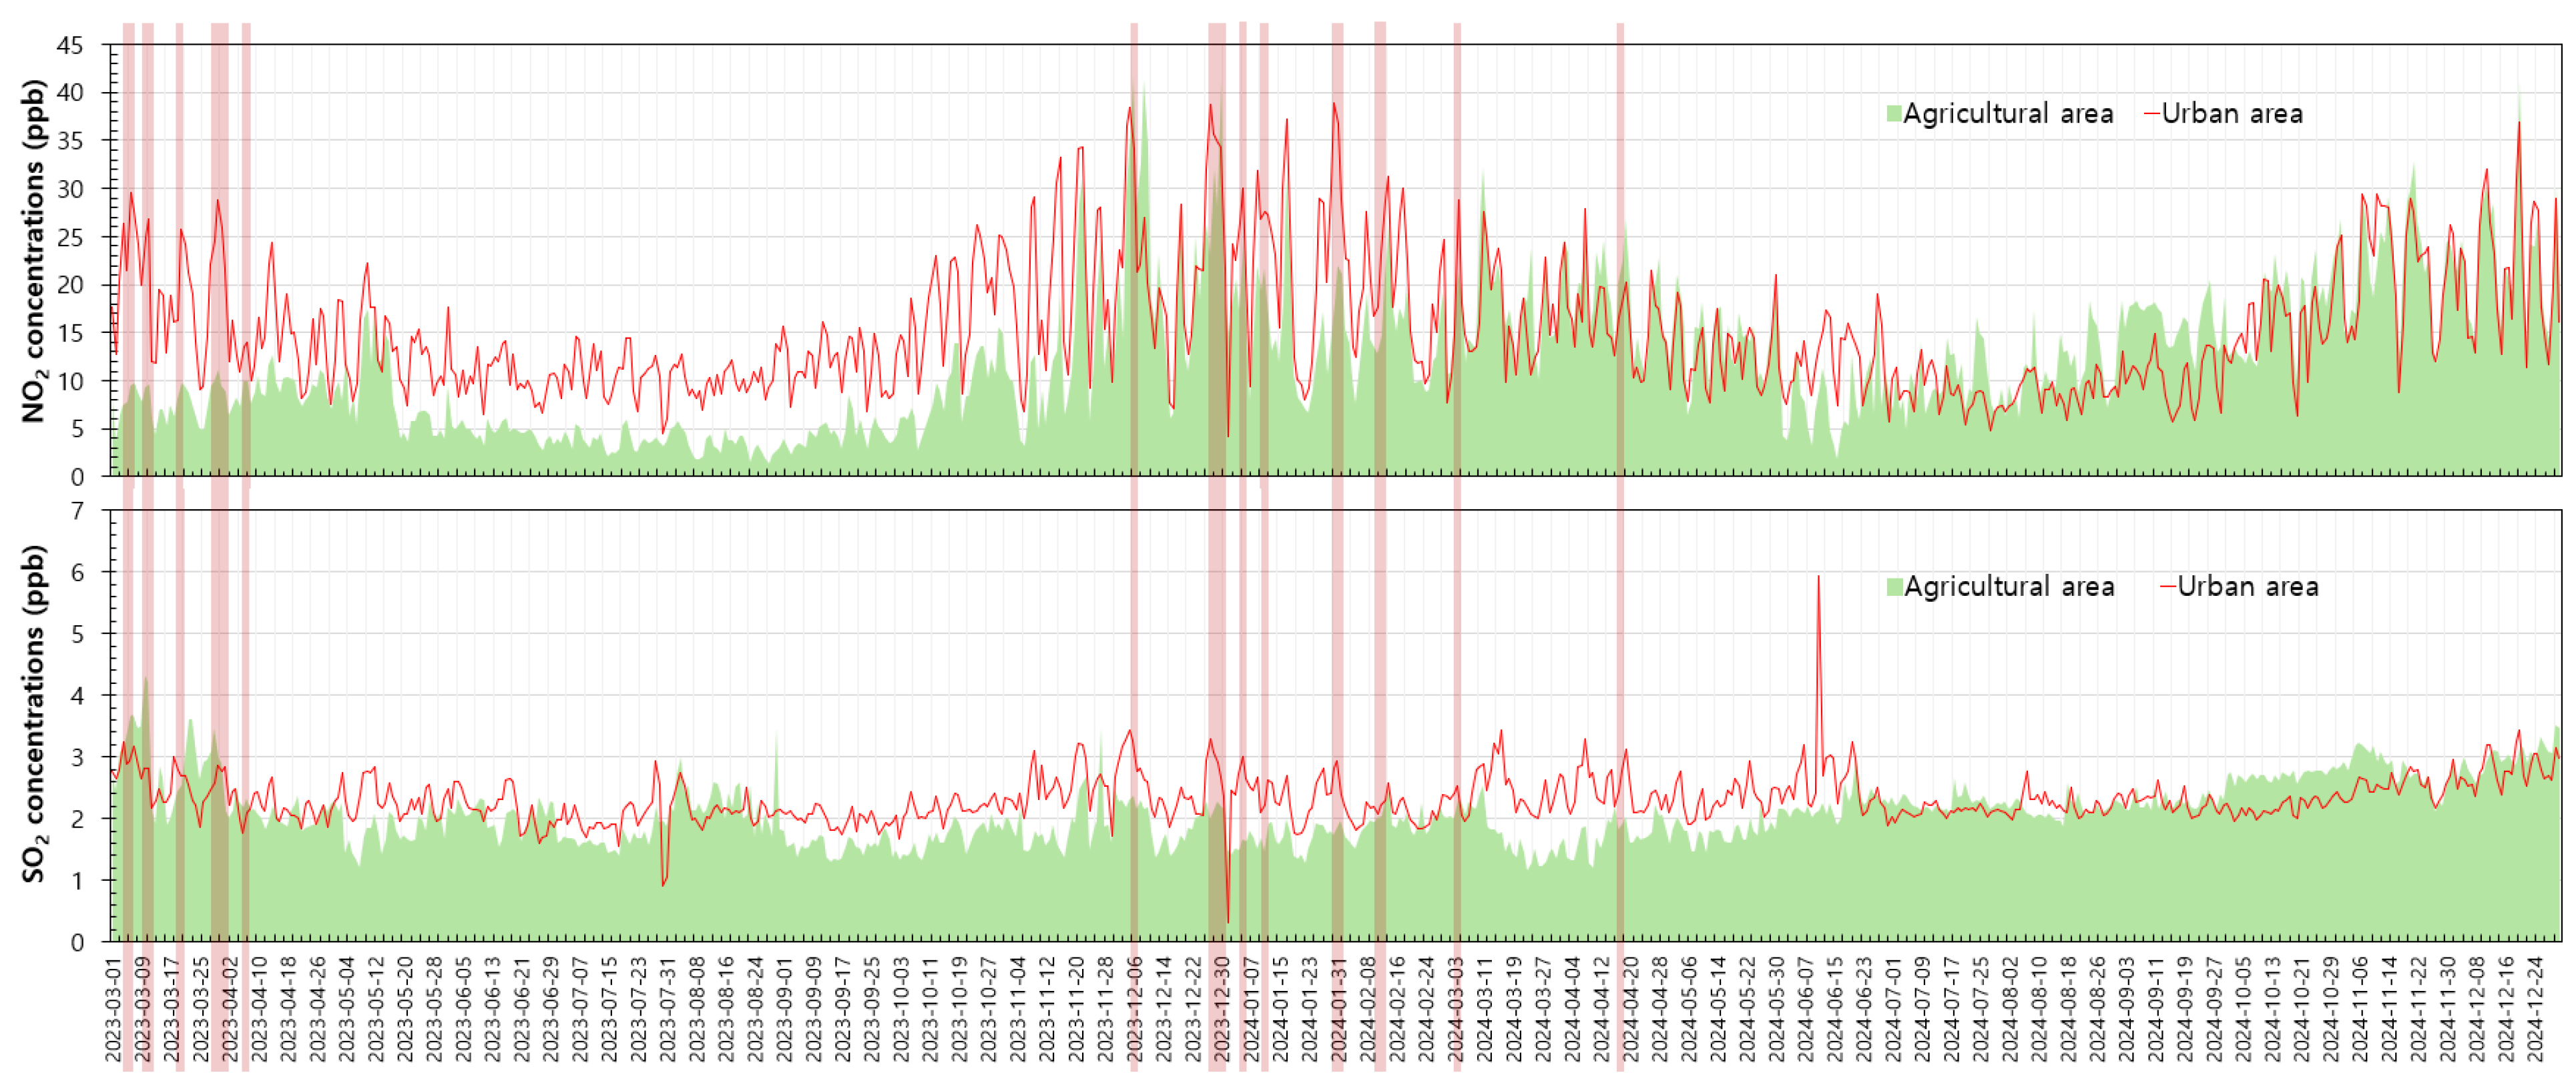
Figure 4.
Diurnal patterns of particulate matter and meteorological parameters in agricultural and urban areas.
Figure 4.
Diurnal patterns of particulate matter and meteorological parameters in agricultural and urban areas.
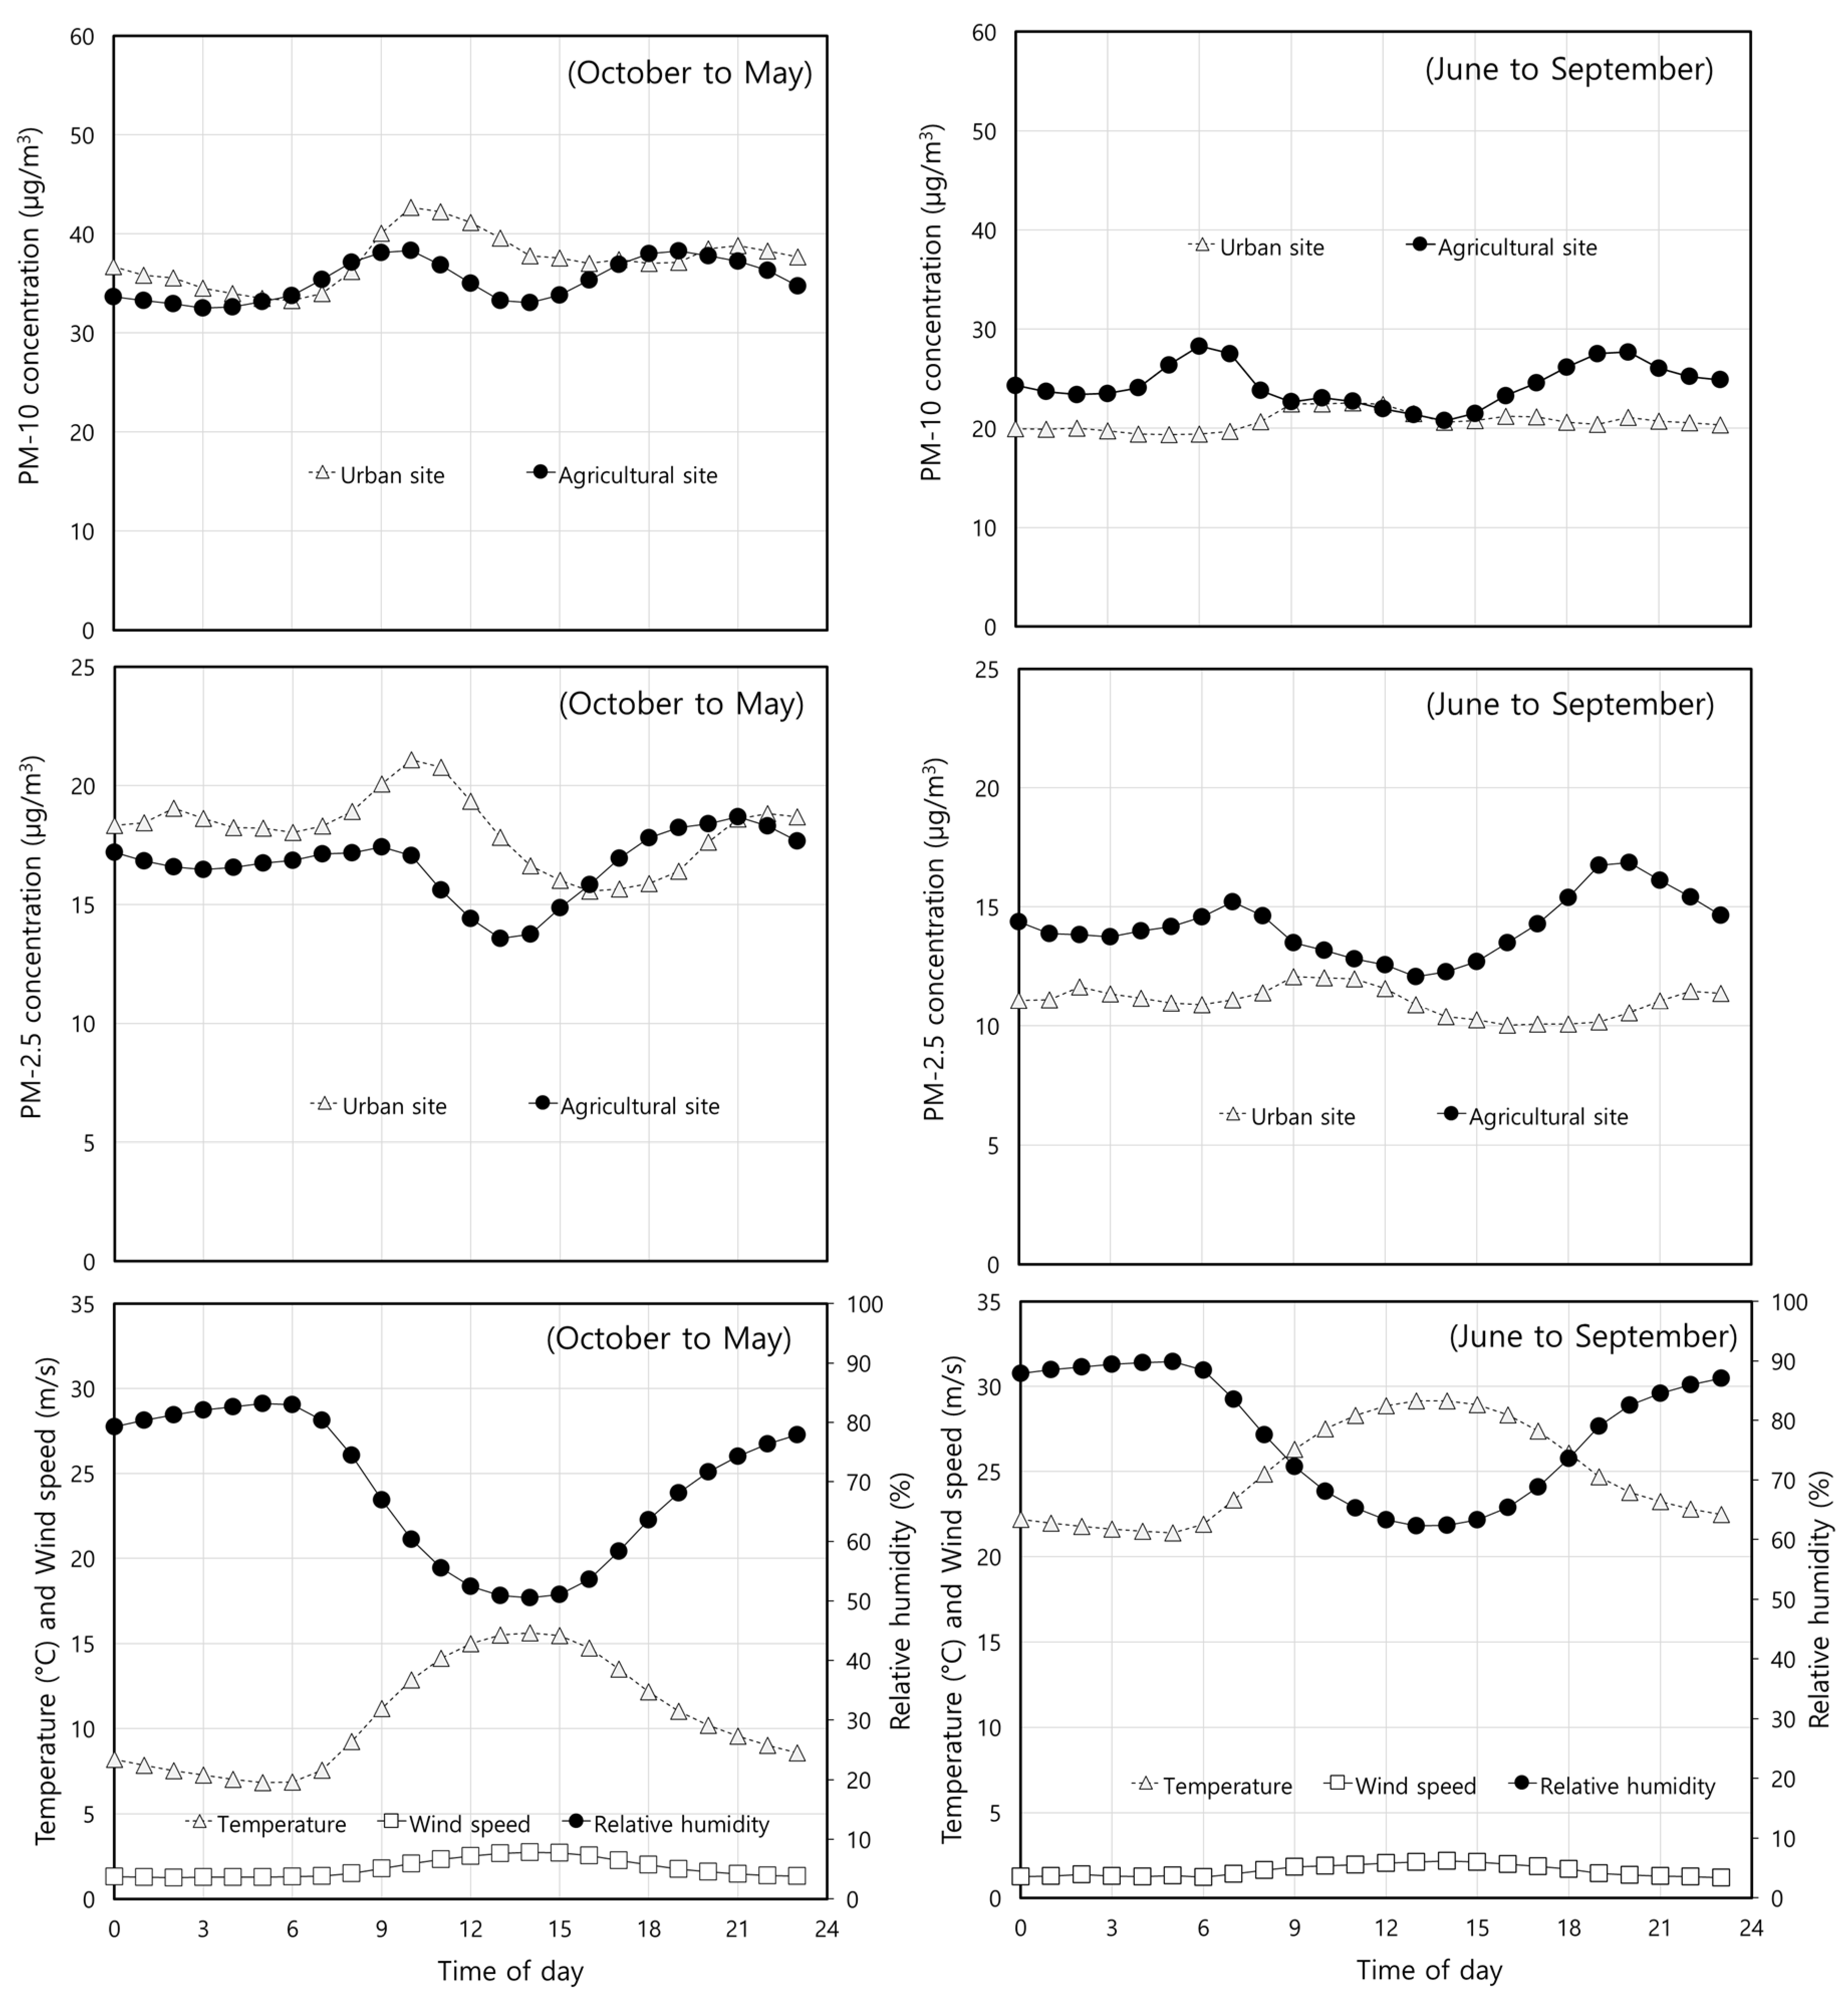
Figure 5.
Diurnal patters of NO₂ and SO₂ concentrations in agricultural and urban area.
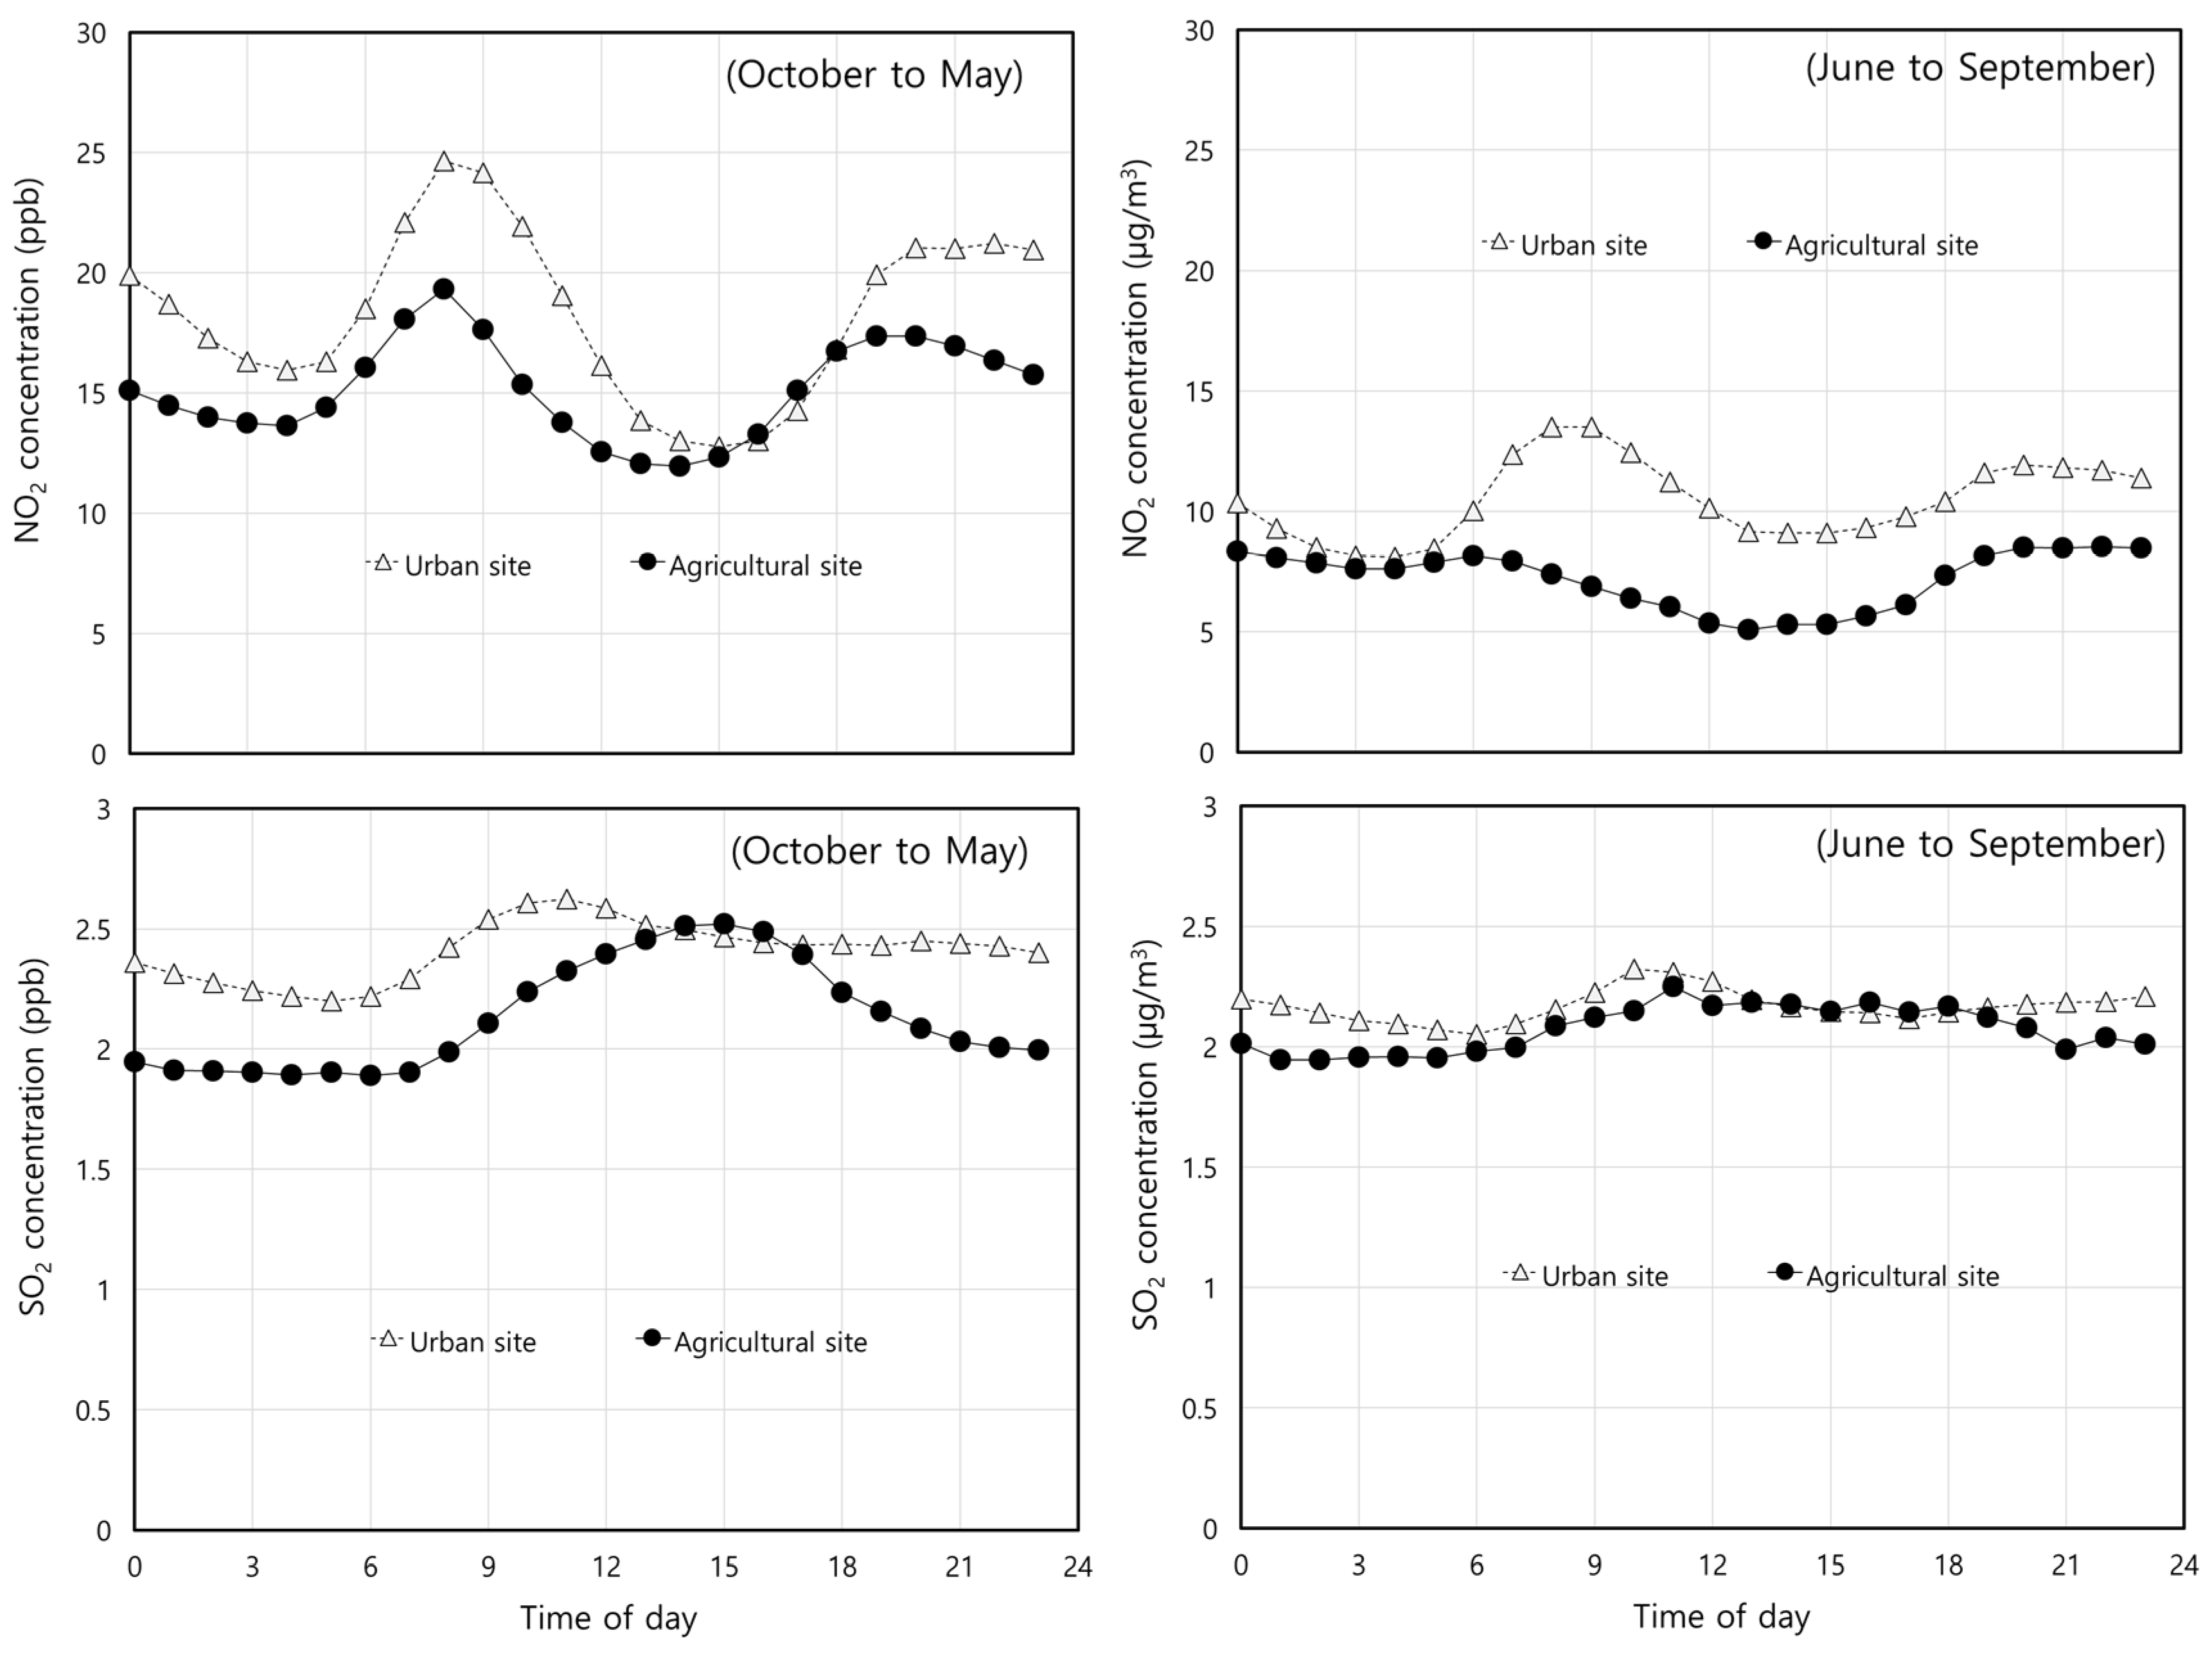
Figure 6.
Particulate matter concentrations in agricultural and urban area during high-PM event periods.
Figure 6.
Particulate matter concentrations in agricultural and urban area during high-PM event periods.
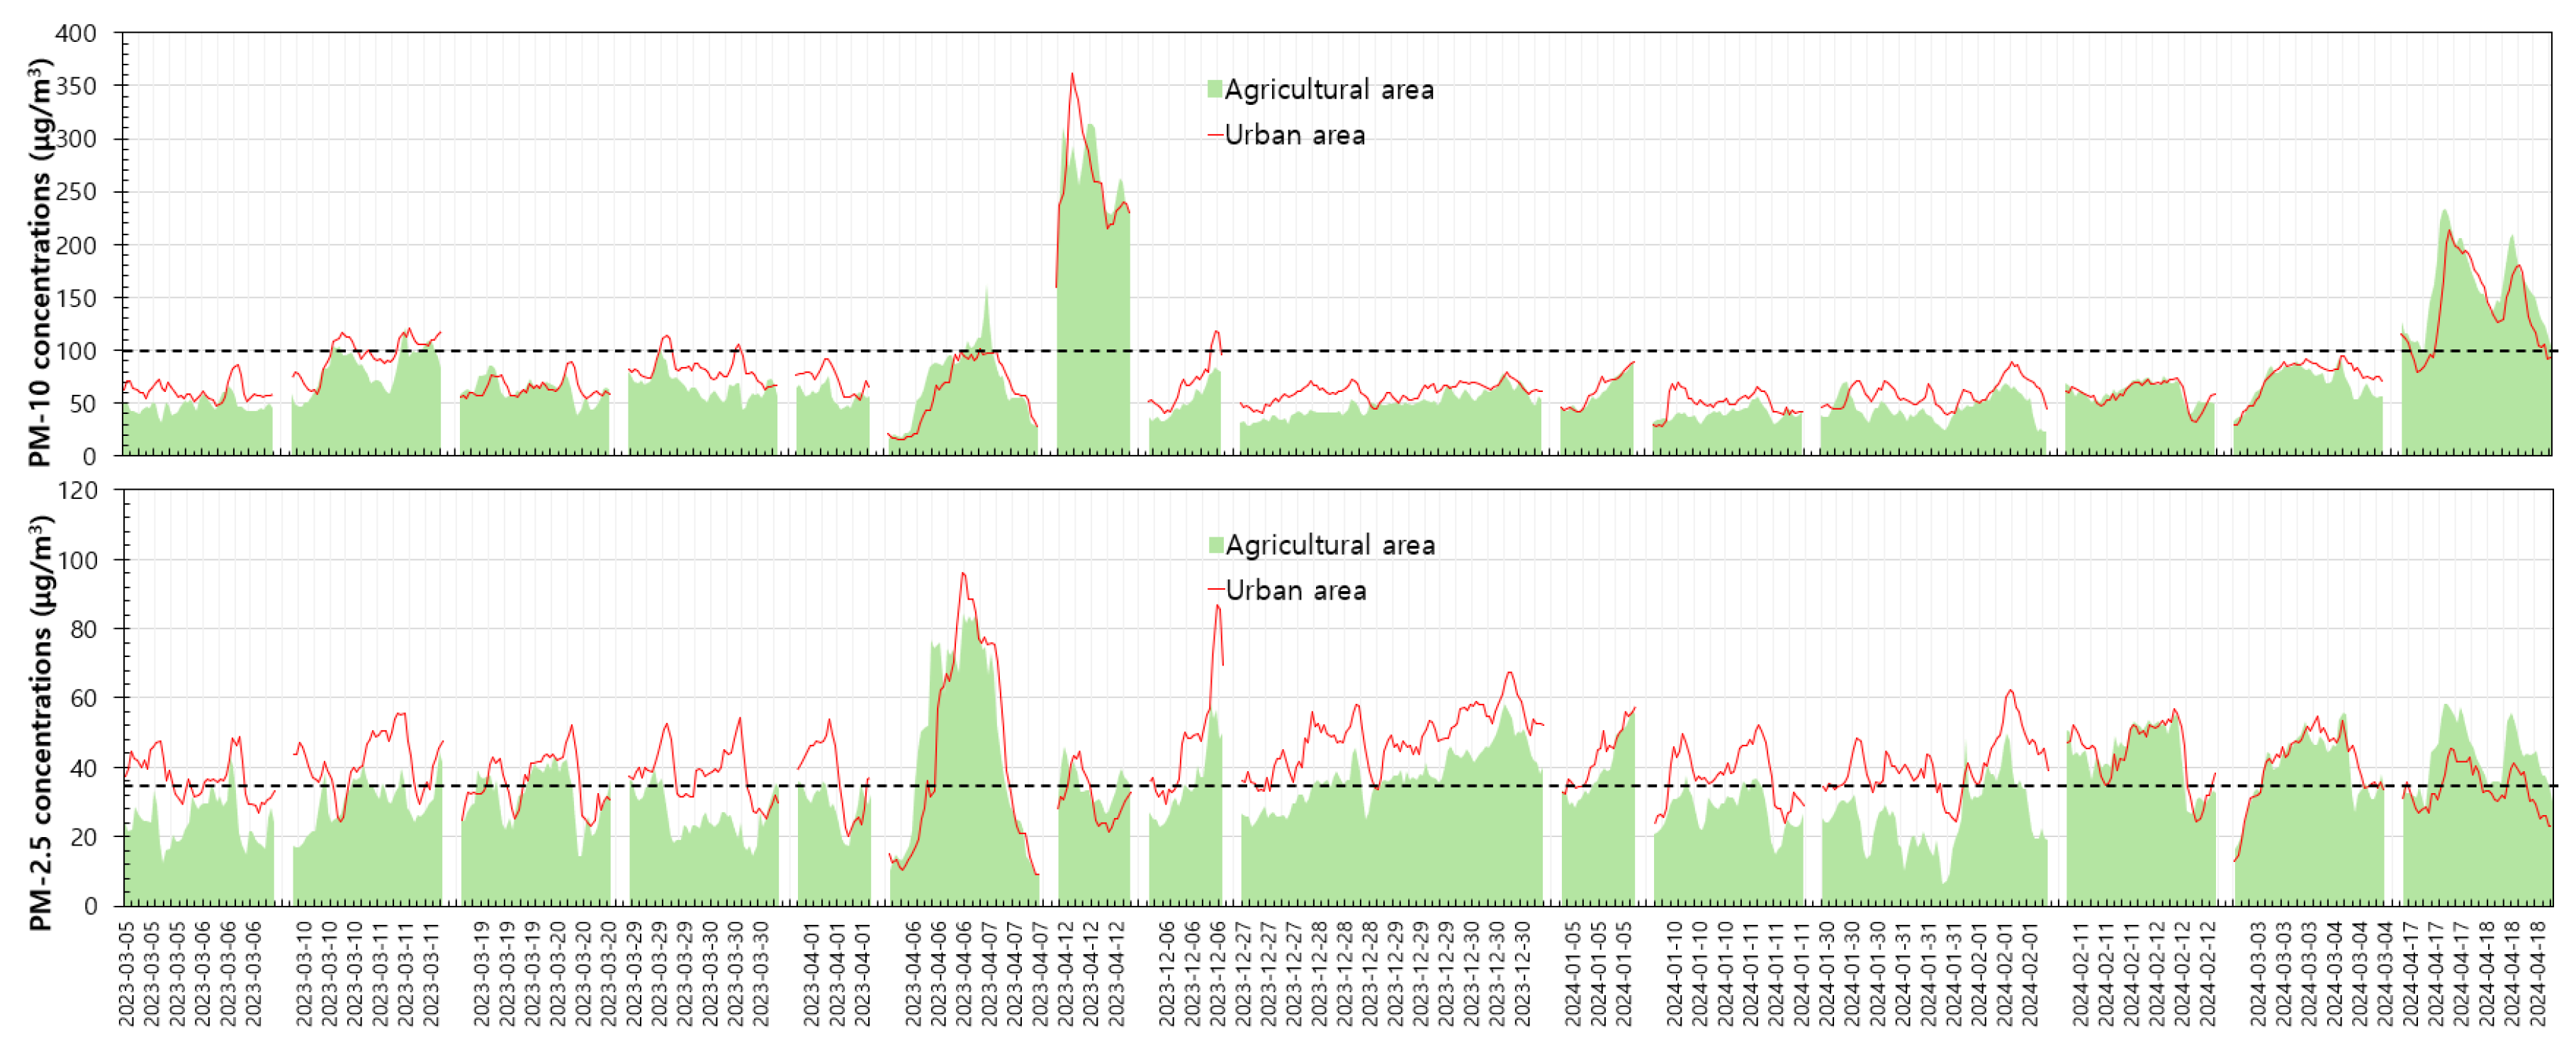
Figure 7.
NO₂ and SO₂ concentrations in agricultural and urban area during high-PM event periods.
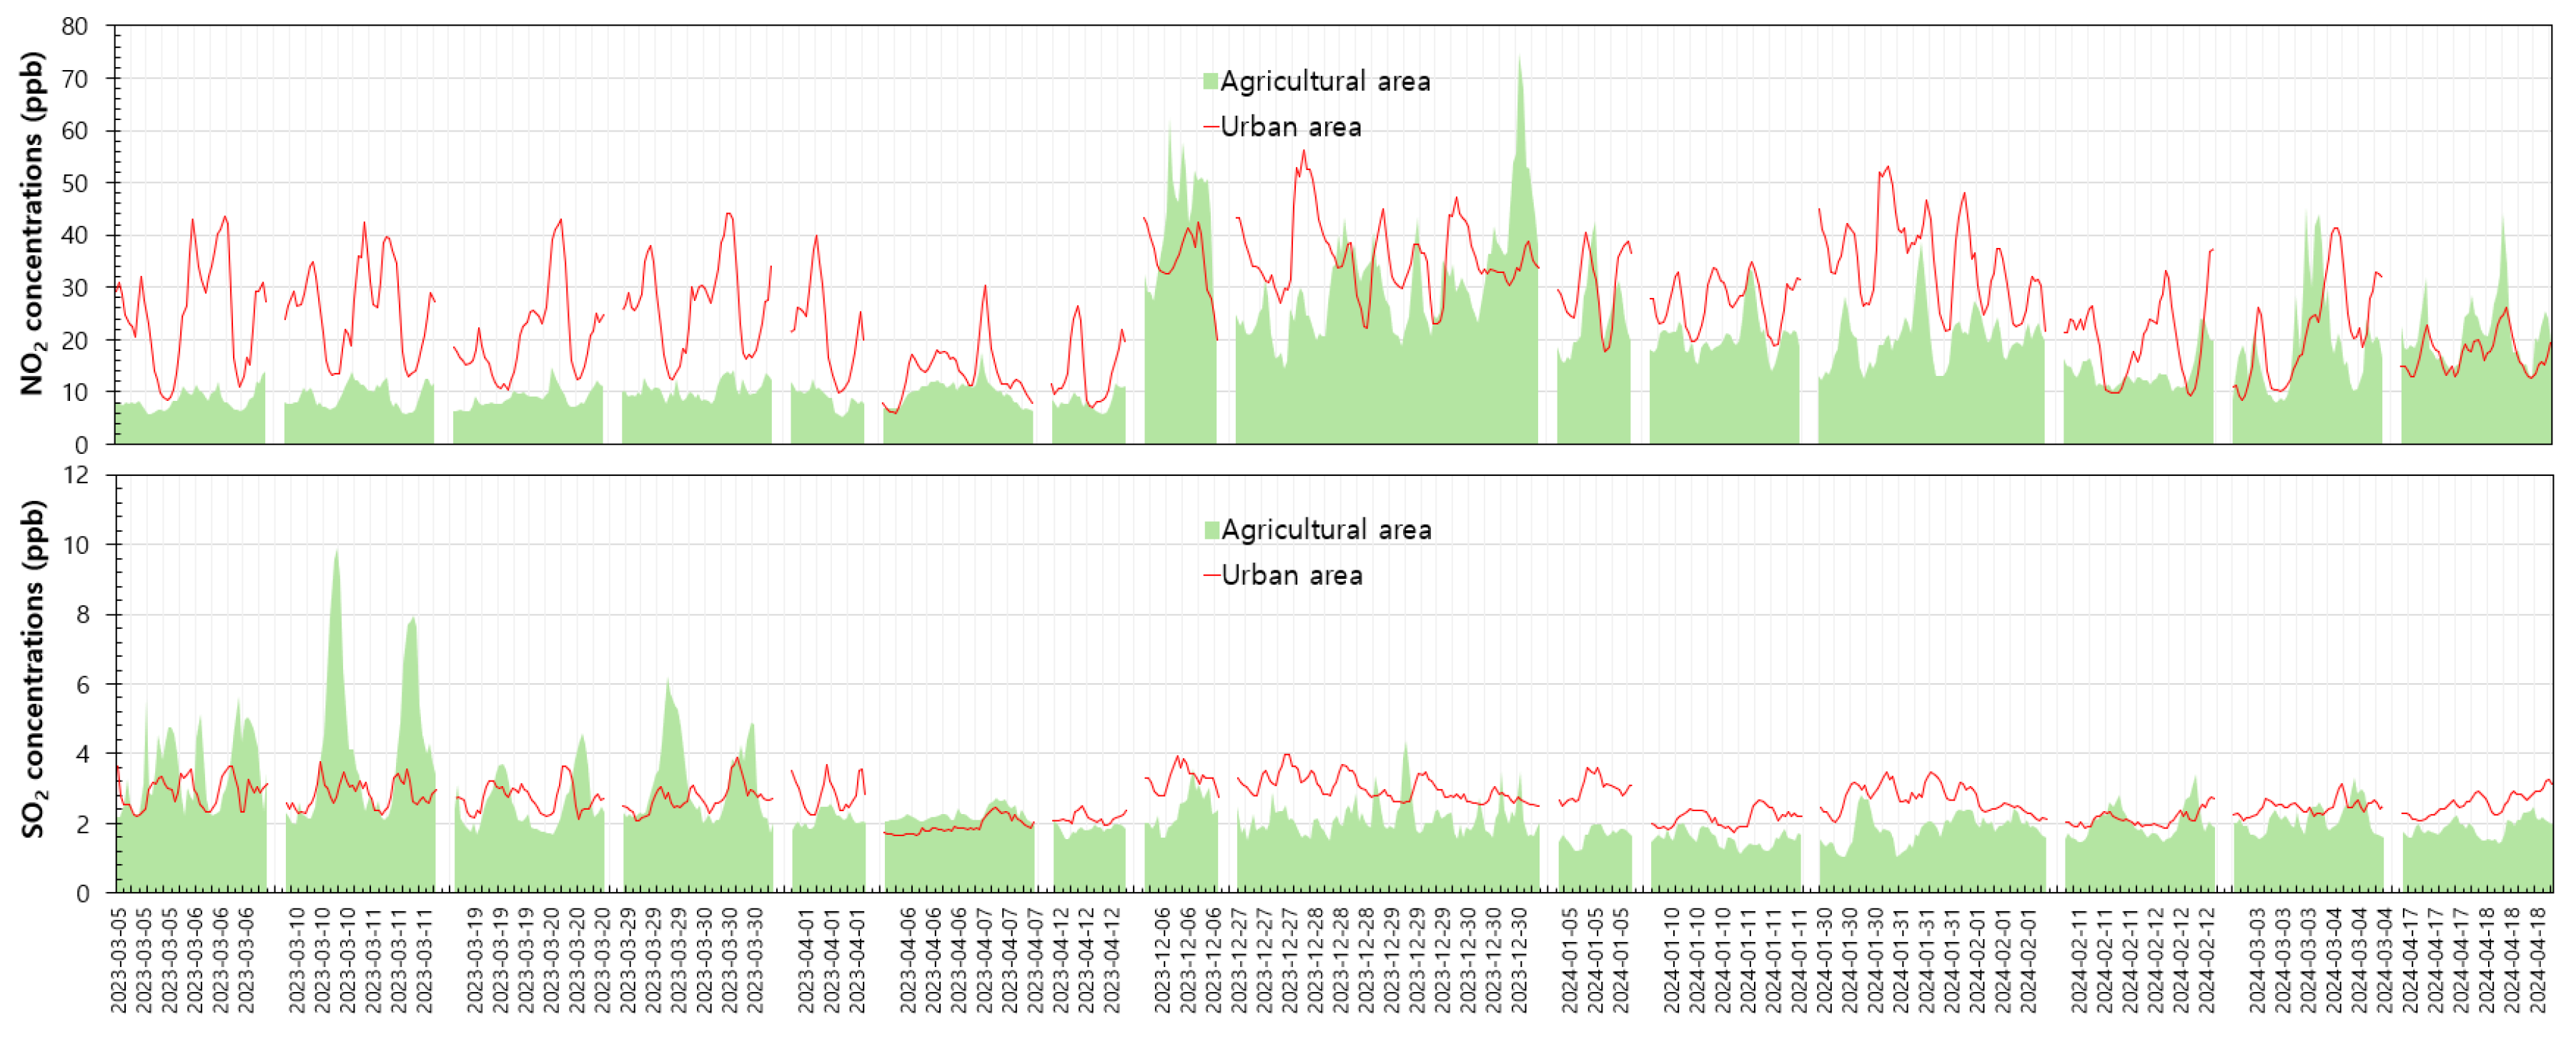
Figure 10.
Diurnal patters of particulate matter, NO₂ and SO₂ concentrations in agricultural and urban area during high-PM event period.
Figure 10.
Diurnal patters of particulate matter, NO₂ and SO₂ concentrations in agricultural and urban area during high-PM event period.
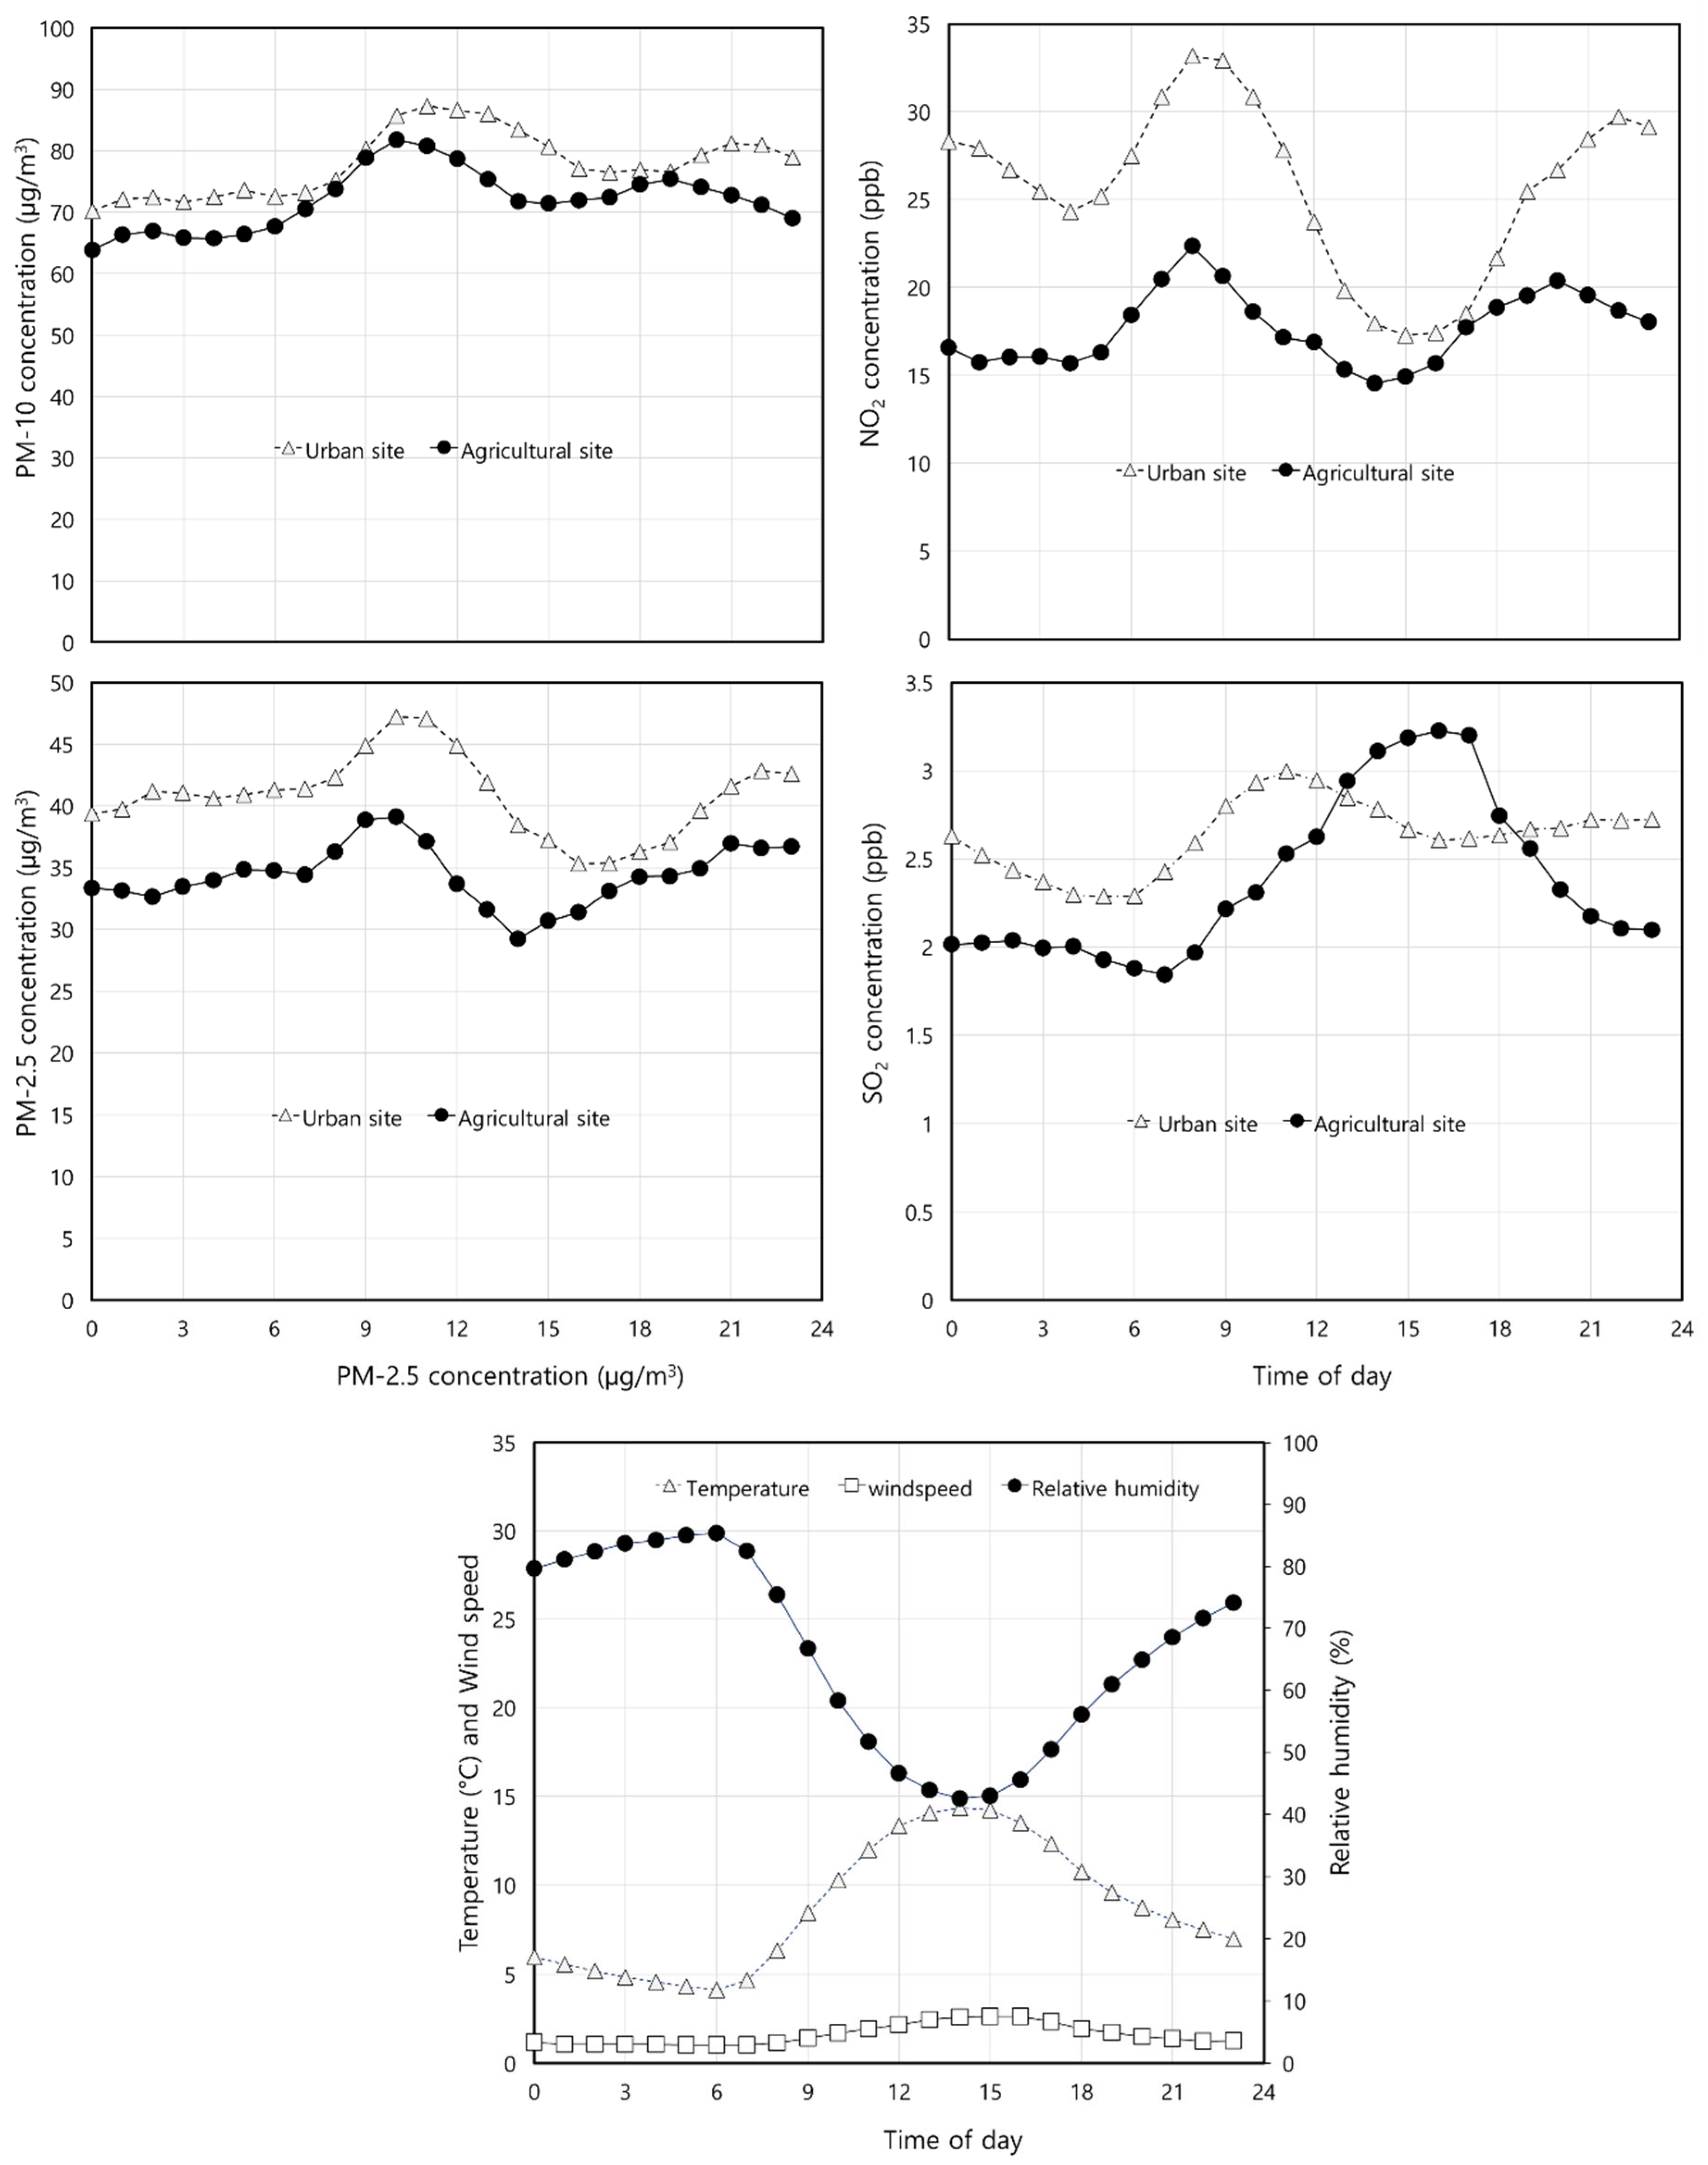

Table 1.
Comparison of particulate matter, NO₂ and SO₂ concentrations (8 sites average) between agricultural and urban sites.
Table 1.
Comparison of particulate matter, NO₂ and SO₂ concentrations (8 sites average) between agricultural and urban sites.
| PM-10 (μg/m3) | PM-2.5 (μg/m3) | NO₂ (ppb) | SO₂ (ppb) | |||||
| Urban | Agricultural | Urban | Agricultural | Urban | Agricultural | Urban | Agricultural | |
| Period | March 2023 to December 2023 | |||||||
| Average | 34.62 | 34.29 | 16.42 | 16.44 | 15.11 | 8.64 | 2.26 | 2.00 |
| Minimum | 3.84 | 6.68 | 2.14 | 3.08 | 4.48 | 1.38 | 0.91 | 1.21 |
| Maximum | 264.47 | 267.82 | 56.97 | 51.78 | 38.67 | 41.78 | 3.44 | 4.33 |
| Period | January 2024 to December 2024 | |||||||
| Average | 28.47 | 28.39 | 14.61 | 14.72 | 15.56 | 15.59 | 2.37 | 1.84 |
| Minimum | 3.65 | 3.21 | 1.58 | 2.05 | 4.17 | 1.79 | 0.30 | 0.72 |
| Maximum | 144.08 | 165.52 | 46.46 | 45.28 | 38.83 | 41.31 | 5.93 | 3.45 |
| Period | March 2023 to December 2024 | |||||||
| Average | 31.27 | 31.08 | 15.43 | 15.50 | 15.36 | 12.43 | 2.32 | 1.91 |
| Minimum | 3.65 | 3.21 | 1.58 | 2.05 | 4.17 | 1.38 | 0.30 | 0.72 |
| Maximum | 264.47 | 267.82 | 56.97 | 51.78 | 38.83 | 41.78 | 5.93 | 4.33 |
Table 2.
Comparison of particulate matter, NO₂ and SO₂ concentrations (8 sites average) in high-PM event periods.
Table 2.
Comparison of particulate matter, NO₂ and SO₂ concentrations (8 sites average) in high-PM event periods.
| PM-10 (μg/m3) | PM-2.5 (μg/m3) | NO₂ (ppb) | SO₂ (ppb) | |||||
| Urban | Agricultural | Urban | Agricultural | Urban | Agricultural | Urban | Agricultural | |
| Average | 70.85 | 65.40 | 37.12 | 31.26 | 23.36 | 16.07 | 2.39 | 2.16 |
| Minimum | 15.14 | 15.91 | 9.14 | 6.37 | 5.96 | 5.11 | 1.64 | 1.06 |
| Maximum | 361.67 | 313.46 | 96.00 | 84.67 | 56.14 | 74.88 | 3.98 | 9.91 |
Disclaimer/Publisher’s Note: The statements, opinions and data contained in all publications are solely those of the individual author(s) and contributor(s) and not of MDPI and/or the editor(s). MDPI and/or the editor(s) disclaim responsibility for any injury to people or property resulting from any ideas, methods, instructions or products referred to in the content. |
© 2025 by the authors. Licensee MDPI, Basel, Switzerland. This article is an open access article distributed under the terms and conditions of the Creative Commons Attribution (CC BY) license (http://creativecommons.org/licenses/by/4.0/).
Copyright: This open access article is published under a Creative Commons CC BY 4.0 license, which permit the free download, distribution, and reuse, provided that the author and preprint are cited in any reuse.


