Submitted:
22 March 2025
Posted:
24 March 2025
You are already at the latest version
Abstract
Methane (CH4) is a major greenhouse gas contributing to climate change, and degraded wetlands are both sources and sinks of CH4. However, little is known about the role of microbial communities in mediating methane cycling during the process of wetland degradation. To investigate the microbial mechanisms influencing CH4 flux in degraded marsh wetlands, a metagenomic approach was used to study the processes of CH4 production and oxidation in herbaceous marsh wetlands. In this study, soil samples were collected from four degradation gradients of herbaceous marshes in the lower reaches of the Tumen River in Jilin Province, China. In situ CH4 fluxes were measured, and the microbial communities involved in CH4 metabolism, the abundance of key enzymes and KEGG pathways were analyzed. Environmental factors influencing CH4 flux were also correlated. One-way ANOVA indicated that wetland degradation significantly reduced CH4 flux and altered environmental factors. Metabolic pathway analysis showed that the CO2 pathway of methanogenesis was dominant. The abundance of methanogens and the key enzyme (mcrA; EC: 2.8.4.1) decreased, while the number of methanotrophs increased, with no significant change in the abundance of the key enzyme (pMMO; EC: 1.14.18.3). Random forest and partial least squares regression analyses(PLSR)indicated that the key environmental factors affecting CH4 flux are soil water content (SW), total carbon (TC), and soil pH. Therefore, the decrease in methanogen abundance and metabolic activity due to reduced soil moisture is the primary reason for the rapid decline in methane emissions. The main factor affecting methane flux is the methane production process, rather than methane oxidation. Further research is needed to reduce the significant uncertainty in estimating CH4 emissions from degraded wetlands.
Keywords:
Wetland degradation
; CH4 metabolism
; Methanogens
; Methanotrophs
; Metagenomic
1. Introduction
Wetland is a transitional area between terrestrial ecosystems and aquatic ecosystems, which is known as the “cradle of life” and the “kidney of the earth” [1]. Although wetlands cover only 5% to 8% of the global land surface, they contribute approximately one-third of the world’s total CH4 emissions [2,3]. However, in recent years, soil degradation caused by climate change and human activities has become an increasingly serious problem for wetlands [4]. Changes in vegetation density and composition caused by wetland degradation can lead to variations in the quantity and quality of litter [5,6]. The availability of organic matter for soil microbial communities is consequently affected, altering the natural exchange of greenhouse gases (GHGs) such as methane (CH4) and nitrous oxide (N2O) [7,8].Given that degraded wetlands are significant sources of GHG emissions to the atmosphere [9,10], it is urgently necessary to determine the impacts of widespread wetland degradation on GHG exchanges.
Methane (CH4) is a potent greenhouse gas with a global warming potential 34 times that of carbon dioxide (CO2), and its atmospheric concentration has increased 2.5 times since the Industrial Revolution [11]. Model predictions indicate that global CH4 emissions from wetlands will increase in the 21st century, resulting in a positive feedback to global warming [12]. Wetland degradation causes changes in the fundamental physical and chemical properties of soil and the biogeochemical cycling of soil nutrients [13]. It also leads to high spatiotemporal variability in the biotic and abiotic factors regulating CH4 flux [14]. Therefore, studying the mechanisms of CH4 emissions under the influence of climate and human activities is crucial.
Soil organic matter is metabolized by microorganisms to produce CH4 as the final product [15]. Generally speaking, the CH4 flux in wetlands is the net result of production under anaerobic conditions and consumption under aerobic conditions, and it is transported to the atmosphere through molecular diffusion, ebullition, and plant aerenchyma [16,17]. Methanogens utilize simple carbon compounds such as carbon dioxide (CO2), acetate, and formate to produce methane [18]. In contrast, the CH4 oxidation process in the soil directly affects the rate of CH4 oxidation and the flux of CH4 released into the atmosphere [19]. Identifying the micro-regulatory mechanisms of these two processes on CH4 metabolism in degraded wetlands is particularly important. Previous studies have explored the factors influencing CH4 flux in degraded wetlands. Most research suggests that the decline in soil water content is both a cause of wetland degradation and the main driving factor affecting CH4 flux [14,20]. There are also studies that have confirmed the significant impact of carbon substrates and soil temperature on CH4 metabolism [21,22]. However, these studies mostly focus on environmental factors affecting CH4 flux, with relatively little research conducted at the level of microbial community composition and metabolic pathways. Additionally, research in both natural and laboratory systems indicates that methane flux may exhibit compensatory responses due to changes in methanogenic community composition [23], suggesting that solely quantifying physical and chemical variables is insufficient to characterize methane production capacity. Since microorganisms play a central role in CH4 emissions, determining how the structure and activity of microbial communities support local variability in methane production may further enhance our ability to understand, model, and predict wetland CH4 flux on a global scale. Therefore, revealing the impact of wetland degradation on carbon metabolism-related microbial communities and metabolic pathways is of great significance for better elucidating the entire carbon cycle process.
Metabolic enzymes released by microorganisms regulate the production and oxidation of CH4. Under anoxic conditions, methanogens use a series of specialized intracellular enzymes and coenzymes to produce CH4 through a series of biochemical reactions [24]. The key enzyme in the methanogenesis process is methyl coenzyme M reductase (MCR), which is responsible for reducing the methyl group bound to coenzyme M in the final step of all methanogenesis pathways. It is commonly used as a functional gene marker [25]. Methane monooxygenase (MMO) is the most crucial enzyme in the methane oxidation process. In the first step of the biochemical pathway of CH4 oxidation, aerobic methanotrophs use methane monooxygenase to catalyze the oxidation of methane to methanol. Methanol is then oxidized to formaldehyde through other pathways, and formaldehyde is converted into intracellular substances via the serine pathway or the ribulose monophosphate pathway [11]. However, the impact of wetland degradation on CH4 related microbial metabolic enzymes has not yet been fully elucidated.
This paper reports a case study in which in-situ soil CH4 fluxes across four degradation gradients were measured during the 2023 growing season. The study analyzed the impact of wetland degradation on soil CH4 emissions and identified soil microbial metabolic processes, including CH4 production and oxidation, based on Kyoto Encyclopedia of Genes and Genomes (KEGG) pathways. This study aims to determine the response of these two processes to wetland degradation, elucidate how soil microbial communities, detailed metabolic pathways, and related enzymes in these processes regulate changes in CH4 emissions after wetland degradation, and identify the key environmental factors driving these changes. Based on this, the following hypotheses were proposed: (1) Wetland degradation characterized by moisture loss may inhibit the activity of methanogens and reduce CH4 flux; (2) Wetland degradation will cause changes in the KEGG pathways of soil CH4 production and oxidation, and these changes may play an important role in regulating soil CH4 metabolism.
2. Materials and Methods
2.1. Site Description and In Situ CH4 Measurement
The sampling site was located at the Jingxin Wetland, Hun Chun, China (42°42’, 130°34’E; elevation: 11 m; Figure 1). The study region has a medium temperate offshore monsoon climate and influenced by the Sea of Japan. The annual average temperature in the study area is 5.6 ℃ and the annual average precipitation is 823.7 mm. According to the classification method of Xiaoping and Guilin [26], the Jingxin Wetland is a wetland complex with intermittent distribution of riverine wetland, lake wetland, marsh wetland and artificial wetland. The soils are divided into 8 soil types, with white slurry soil and meadow soil as the main ones.
This experiment was conducted in September 2022, during the peak growing season. As shown in Figure 1, this experiment was conducted in September 2022, during the peak growing season. Based on the characteristics of plant community structure (proportion of dominant plant species, vegetation coverage, and above-ground biomass) and hydrology (water level), the herbaceous swamp wetlands were divided into four treatments: non-degraded (ND), lightly degraded (LD), moderately degraded (MD), and highly degraded (HD). Six transects (300 meters) provided 6 replicates. For each transect, four plots along approximately 300 meters were randomly selected to represent the four degradation gradients. In total, 24 samples (four degradation levels × 6 replicates) were measured for in-situ CH4.
This study used the static chamber method to collect CH4 gas. The static chamber consists of two parts: a movable gas sampling chamber (50 cm × 50 cm × 60 cm) and a base (60 cm × 60 cm × 20 cm). A gas sampling port was installed at the top, which was sealed with a silicone stopper. A sampling point was randomly selected within the experimental plot. One week before gas sampling began, the base was inserted into the soil to a depth of 10 cm. During gas sampling, water was added to 2/3 of the depth of the base’s groove to ensure that the gas sampling chamber could be inserted while maintaining a seal and preventing water overflow. This setup ensured that the gas sampling chamber remained well-sealed during the sampling period. Gas sampling was conducted at 09:00 Beijing time, which represents the optimal time for daily average flux [27]. After sampling, the gas samples were transported to the laboratory for measurement using a gas chromatograph.
2.2. Soil Sampling
At the conclusion of the in-situ CH4 measurements on August 1, 2022, a soil drill was used to collect the topsoil (0-15 cm) in the center of the PVC ring, and the samples collected from five points in each plot were mixed to form one composite sample. The mixed soil samples were then divided into two subsamples. The first subsample was air-dried for physicochemical property analysis, including soil water content (SW), total carbon (TC), pH, electrical conductivity (EC), soil temperature (ST), carbon-to-nitrogen ratio (C/N), microbial biomass carbon (MBC), and dissolved organic carbon (DOC). The second subsample was stored at -80 °C for metagenomic sequencing.
2.3. Metagenomic Sequencing
Environmental soil samples were collected, and metagenomic sequencing was conducted on the Illumina high-throughput sequencing platform (Shanghai Majorbio Technology Co., Ltd.).Soil samples were subjected to genomic DNA extraction using the Mag-Bind® Soil DNA Kit (Omega Bio-tek, Norcross, GA, U.S.). Concentration and purity of extracted DNA was determined with TBS-380 and NanoDrop2000, respectively. DNA extract quality was checked on 1% agarose gel. DNA extract was fragmented to an average size of about 400 bp using Covaris M220 (Gene Company Limited, China) for paired-end library construction. Paired-end library was constructed using NEXTFLEX® Rapid DNA-Seq (Bioo Scientific, Austin, TX, USA). Adapters containing the full complement of sequencing primer hybridization sites were ligated to the blunt-end of fragments. Paired-end sequencing was performed on an Illumina NovaSeq 6000 (Illumina Inc., San Diego, CA, USA) at Majorbio Bio-Pharm Technology Co., Ltd. (Shanghai, China) using the NovaSeq 6000 S4 Reagent Kit v1.5 (300 cycles) according to the manufacturer’s instructions (www.illumina.com). The following specific procedures are detailed in the Supplementary Methods.
2.4. Statistical Analyses
Soil physiochemical properties and enzyme abundance of four degradation levels (ND, LD, MD, HD) were analyzed via one-way analysis of variance in SPSS (ver. 25.0; IBM, Armonk, NY, USA) with Tambane’s T2, with p < 0.05 considered significant. The significance of the effect of each variable on CH4 production and oxidation was determined through Mantel tests, and the obtained significance level was assessed using the r statistic and p values. Partial least squares regression (PLSR) is an alternative method to ordinary regression for problems with partly or highly co-linear predictor variables. Prior to using PLSR, a preliminary analysis indicated that many of the environmental predictors were co-linear (Table S3). Therefore, we used the R package „pls” to evaluate how environmental factors influence CH4 flux. In PLSR modeling, the importance of a predictor for both the independent and the dependent variables is given by the variable importance for the projection (VIP). The terms that have large VIP values have the greatest explanatory power of the dependent variable. The cross-validated goodness of prediction (Q2) and the percentage of variance explained for the response variables (CH4 flux), as well as the cross-validated root-mean-squared error (RMSECV), which represents the difference between the predicted and observed values of each individual pass, were determined for each model. The regression coefficients (RC) reveal the direction and strength of the impact of each variable in the PLSR model.
3. Results
3.1. Methane Flux and Environmental Factors
Degradation significantly altered wetland CH4 emissions and soil physicochemical properties. The CH4 emissions were 6.62 ± 3.76 mg m-2h-1, 0.47 ± 0.91 mg m-2h-1, 0.16 ± 0.10 mg m-2h-1, and 0.05 ± 0.04 mg m-2h-1 for the ND, LD, MD, and HD plots, respectively (Table S1). Degradation significantly reduced CH4 emissions, but differences between degradation gradients were not significant (Figure 2a). Wetland degradation significantly reduced SW (from 337.67 ± 97.30% in ND to 34.15 ± 1.85% in HD, Figure 2b), TC (from 154.13 ± 18.25 g kg-1 in ND to 30.46 ± 2.51 g kg-1 in HD, Figure 2f), and EC (from 122.20 ± 39.39 us cm-3 in ND to 46.32 ± 3.59 us cm-3 in HD, Figure 2d) and decreased continuously with increasing degradation gradient, but did not reach significant levels. Their trends were consistent with those of methane emissions. In contrast, degradation caused significant increases in ST, from 16.08 ± 0.26 °C in ND to 19.13 ± 0.31 °C in HD. PH increased from 5.05 ±0.09 in ND to 5.57 ± 0.02 in HD. As the degradation gradient increased, C/N (from 14.66 ± 0.52 in ND to 9.06 ± 0.40 in HD, Figure 2i) decreased significantly(Table S1). However, There were no significant differences in DOC among the four degradation levels (Figure 2g). In addition, MBC were higher in LD than in the others treatments (Figure 2h).
3.2. Effects of Wetland Degradation on Microbial Community
Methanogens are key methane-producing microorganisms and phylogenetically belong to the Archaea domain. Species annotation results based on the NR database indicate that the study area encompasses the three nutritional pathways of methane production: hydrogenotrophic, acetoclastic, and methylotrophic. The dominant methanogens in the four wetland degradation gradients are hydrogenotrophic methanogens, including the orders Methanocellales , Methanobacteriales, Methanococcales, Methanomicrobiales, and Methanopyrales. Their proportion of the total methanogens increased from 49.51% in ND to 76.99% in HD (Table 1). The second most abundant methanogens are facultative methanogens of the order Methanosarcinales, whose proportion decreased from 37.95% in ND to 16.39% in HD. The third most abundant methanogens are acetoclastic methanogens, including Methanosarcina and obligate aceticlastic methanogens of the genus Methanothrix, whose proportion decreased from 9.83% in ND to 9.03% in HD as the wetlands degraded. Methylotrophic methanogens, including Methanomassiliicoccales and Methanonatronarchaeales, had the smallest proportion, increasing from 3.92% in ND to 6.62% in HD. However, wetland degradation led to an overall 99.93% reduction in methanogen abundance, significantly decreasing the abundance of all types of methanogens.
Aerobic methanotrophs in the study area include the phyla Proteobacteria and Verrucomicrobia. Among them, Proteobacteria include type I and type II methanotrophs. The proportion of type I methanotrophs in the total methanotrophs decreased from 31.78% in ND to 3.22% in HD (Table 2). Type II methanotrophs have consistently been the dominant group in the region, with their proportion in the total methanotrophs increasing from 62.83% in ND to 94.94% in HD. The phylum Verrucomicrobia had the smallest proportion, decreasing from 5.39% in ND to 1.84% in HD. A non-parametric test of methanotrophs abundance at the family level showed that wetland degradation significantly increased the abundance of type II methanotrophs from the family Beijerinckiaceae, excluding Methylocystaceae, from 16.21±4.06 in ND to 38.85±4.29 in MD. However, degradation significantly reduced the abundance of type I methanotrophs and the family Verrucomicrobiaceae, decreasing from 22.13±13.11 and 3.75±1.01 in ND to 1.74±0.72 and 1.00±0.47 in HD, respectively, with no significant differences observed among LD, MD, and HD.
3.3. Differences of CH4 Metabolism Pathways Under Different Degradation
The study identified four methane production (MP) pathways in the study area: the CO₂ pathway, trimethylamine metabolism, the methanol pathway, and the acetate pathway. Based on their nutritional types, the CO₂ pathway is classified as hydrogenotrophic, trimethylamine metabolism and the methanol pathway as methylotrophic, and the acetate pathway as acetoclastic.
One-way ANOVA of key enzyme abundances revealed that wetland degradation significantly impacted the CO₂ pathway by reducing enzyme levels at multiple stages. In the initial step, the abundance of fwdA (EC: 1.2.7.12), which catalyzes CO₂ reduction to formyl, decreased significantly (Figure 3b (1)). Similarly, enzymes involved in the intermediate conversion of formyl to methyl-coenzyme M—ftr (EC: 2.3.1.101), mtd (EC: 1.5.98.1), and mtrA (EC: 2.1.1.86)—also showed notable declines of 85.26%, 84.48%, 100%, and 96.29%, respectively, in HD compared to ND(Figure 3b (2), (4), (6)). Conversely, the abundance of mer (EC: 1.5.98.2), another enzyme in the intermediate stage, significantly increased by 87.48%, while mch (EC: 3.5.4.27) showed no significant change(Figure 3b (5), (3)). In the acetate pathway, early-stage enzymes involved in acetate activation and metabolism—ackA (EC: 2.7.2.1), pta (EC: 2.3.1.8), and acs (EC: 6.2.1.1)—exhibited significant increases in abundance, rising by 26.57%, 57.34%, and 4.52%, respectively(Figure 3b (8), (7), (9)). Conversely, in the methanol pathway, the key enzymes MtaA (EC: 2.1.1.246) and MtaB (EC: 2.1.1.90), responsible for methanol activation and methyl transfer, showed significant declines with increasing degradation levels, dropping by 93.82% and 79.92%, respectively(Figure 3b (10), (11)). In the trimethylamine metabolism pathway, the abundance of dmd (EC: 1.5.8.1/2), which catalyzes the initial activation of trimethylamine, increased dramatically by 1121.83%. However, the abundances of enzymes involved in methyl transfer—Mtba (EC: 2.1.1.247), MtmB (EC: 2.1.1.248), MtbB (EC: 2.1.1.249), and MttB (EC: 2.1.1.250)—declined significantly by 94.71%, 99.29%, 98.33%, and 77.63%, respectively. But most importantly, wetland degradation significantly reduced the abundance of the key enzyme methyl-coenzyme M reductase α-subunit (McrA; EC: 2.8.4.1), which catalyzes the final step of methane production, with a 99.90% decline compared to ND (p < 0.05).
The study focused only on the key steps of methane oxidation, where methane monooxygenase (MMO) catalyzes the conversion of methane to methanol, which is subsequently oxidized to formaldehyde by methanol dehydrogenase. The abundance of pmoA (EC: 1.14.18.3), which is involved in the first step of methane oxidation, showed no significant change. However, the abundance of mmoX (EC: 1.14.13.25) significantly increased in LD and MD, rising by 69.58% and 45.43% compared to ND, respectively, while no significant difference was observed between HD and ND. During the conversion of methanol to formaldehyde, the abundance of mdh1 (EC: 1.1.2.7) first increased and then decreased, with no significant difference observed between ND and HD. In contrast, the abundance of xoxF (EC: 1.1.2.10) in degraded wetlands significantly increased compared to ND.
3.4. Factors Determining CH4 Emission Under Different Degradation
To identify the factors driving methane-metabolizing microbial communities in degraded wetlands, we used Mantel analysis to relate functional composition (based on biochemical KEGG modules) to environmental factors. The methane-producing (MP) functional community showed no significant correlation with environmental factors in ND and HD. In LD, SW was significantly correlated with the methane-producing community (P < 0.05, Figure 5), while in MD, pH was significantly correlated with the MP community (p < 0.05, Figure 5). The methane-oxidizing (MO) functional community was significantly correlated with ST and pH (P < 0.05, Figure 5).
Table 4 presents the individual PLSR models constructed for CH₄ flux in ND and LD-MD-HD soils, including the number of components required for each model to achieve optimal predictive performance (maximum Q² and minimum RMSECV). The first two components explained 74% and 78% of the total variance in ND and LD-MD-HD, respectively. Figure 5 illustrates the Variable Importance in Projection (VIP) and Regression Coefficients (RC) of the environmental factors. In the model constructed for ND (Figure 5a), DOC obtained the highest VIP value, followed by SW. Higher DOC levels corresponded to increased CH₄ flux. Similarly, lower SW contributed to reduced CH₄ flux, as indicated by the positive RC. In the model constructed for LD-MD-HD (Figure 5b), SW had the highest VIP value, followed by pH. Lower SW levels corresponded to reduced CH₄ flux (positive regression coefficient), while higher pH levels corresponded to reduced CH₄ flux (negative regression coefficient).

Table 3.
Summary of the PLSR models for methane flux at different stages of degradation.
| Treatment | R2 | Q2 | Component | % of explained variability in Y |
Cumulative explained variability in Y (%) |
RMSECV | Q2 cum | |
| ND | 0.74 | 0.87 | 1 | 73.86 | 73.86 | 1.095 | 0.446 | |
| 2 | 22.24 | 96.10 | 0.839 | 0.871 | ||||
| LD-MD-HD | 0.78 | 0.73 | 1 | 78.06 | 78.06 | 1.029 | 0.729 | |
4. Discussion
4.1. Effects of Wetland Degradation on Magnitude of Methane Emissions
The most common form of wetland degradation, characterized by water loss, reduces methane emissions. For example, the pristine peatlands in the Zoige region have degraded due to artificial drainage, significantly reducing CH4 emissions. The degradation of peatland vegetation on the Qinghai-Tibet Plateau has also led to a decrease in CH4 flux. Research on high-altitude permafrost wetlands in Tibet suggests that wetland degradation and soil moisture loss lead to a decrease in methane production potential. These findings are consistent with the results of this study. Although the degradation of swamp peatlands in the Amazon region only affects CH4 emissions on a micro scale and is not significant on a macro scale, the main environmental driving factors are also related to moisture [14]. Additionally, a study by Padhy, Bhattacharyya, Dash, Nayak, Parida, Baig and Mohapatra [28] on the Sundarbans mangroves in India found that wetland degradation increased the abundance of enzymes involved in methanogenesis. This implies that mangrove degradation could lead to higher CH4 emissions because the degradation decreases sediment salinity, reducing competition for substrates between sulfate-reducing bacteria and methanogens. A study on tropical peatlands in Southeast Asia indicated that wetland degradation caused by fires leads to variations in methane emissions corresponding to changes in floodwater levels, resulting in distinct dry and wet periods [29].
4.2. Effects of Wetland Degradation on Environmental Factors
Methane flux is affected by factors such as soil water content (SW), pH, soil temperature (ST), and the availability of carbon substrates. These soil characteristics play a significant role, either directly or indirectly, in regulating soil CH₄ flux. Previous studies have shown that certain soil physicochemical properties undergo significant changes as wetlands degrade. Abulaizi, Chen, Yang, Hu, Zhu and Jia [30] conducted a study on the alpine wetlands of Bayanbulak and found that SW, TC, and TN exhibited a decreasing trend with increasing degradation levels (p < 0.05). Yan, Yang, Chen, Zou, Zhao, Yan, Wang and Wu [31]found that SW decreased with increasing degradation. Our findings are consistent with previous studies. We demonstrated that as wetland degradation intensifies, SW significantly decreases (Figure 2b), with a statistically significant difference between ND and other degradation stages (p < 0.001). This may be because wetland degradation is typically accompanied by a decline in water table levels, changes in soil drainage properties, and the loss of moisture, all of which directly affect the soil’s water retention capacity. As a result, wetland degradation often leads to a reduction in soil water content. Furthermore, water scarcity inhibits plant growth and affects nutrient uptake by plants[32], potentially causing dominant species in native wetlands to lose their dominance. Consequently, lower SW results in suboptimal growth conditions, leading to a decline in soil organic matter [33,34]. Changes in soil water content also affect the stoichiometric C/N balance, the relationship between soil C and N, and other soil properties. Consistent with the changes in surface soil C/N observed in the study by Huo, Chen, Zou, Lu, Guo and Tang [35], we found a significant decrease in C/N along the degradation gradient (p < 0.001). Furthermore, wetland degradation significantly affects soil pH. In the study area, the soil in non-degraded (ND) wetlands was mildly acidic. However, the pH values in the low-degraded (LD), medium-degraded (MD), and high-degraded (HD) areas were significantly higher than those in the ND area, indicating that wetland degradation reduces soil acidity. This result is consistent with the findings of Li, Hao, Yan, Kang, Wang, Zhang, Li, Wu and Kang [36], where the increase in pH was attributed to enhanced water evaporation during wetland degradation, causing salts and alkali to rise from the subsoil to the topsoil. The decline in groundwater levels and soil moisture further increased the salinity and alkalinity concentration in the topsoil, which likely exacerbated the rise in soil pH. This study also found a significant decrease in EC, which is consistent with the findings of Wan, Yu, Kong, Zhang, Chen, Zhao and Liu [37] and Zhang, Qi, Tong, Wang, An, Zhang and Lu [38]. This may be due to the reduction in vegetation and organic matter during the degradation process, leading to a decrease in the concentration of electrolytes (such as calcium, magnesium, potassium, and sodium ions) in the soil, thereby lowering EC.
4.3. Effects of Wetland Degradation on Microbial Communities Associated with Methane Production and Oxidation
Methanotrophy (oxidation of CH4) and methanogenesis (production of CH4) are the two important microbial mediated processes that play an important role in methane emission from soil to the atmosphere in wetland ecologies [28,39]. Changes in the community structure of methanogens and methanotrophs may be the primary reason for the decrease in CH4 flux after the degradation of the Jingxin Wetland. The abundance of methanogens and the abundance of the MCR (EC: 2.8.4.1) enzyme are both inhibited by wetland degradation (Table 1; Figure 3b (12)), while the abundance of dominant methanotrophs and soluble methane monooxygenase (sMMO; EC: 1.14.13.25) are promoted by wetland degradation (Table 2, Figure 3b (13)). This suggests that the strong suppression of methane production and the slight stimulation of methane oxidation in the soil may be the reasons for the decrease in net CH4 flux [11].
The abundance of methanogens and methanotrophs is often used to reflect the potential for methane production and oxidation [21,40]. Undoubtedly, the observed low abundance of methanogens typically indicates lower methane emissions. Some scholars believe that disrupting the original water balance of wetlands is the essence of wetland degradation, and changes in soil moisture are the primary cause of wetland degradation. It is well known that methane production is a strictly anaerobic microbial process; therefore, when wetlands degrade and soil moisture decreases, the soil’s anaerobic conditions are weakened, which in turn inhibits methane production [41,42]. In our study, a consistent conclusion was drawn that in the LD treatment, the methane production functional module was significantly positively correlated with SW (Figure 4b). This may be because the decrease in SW allows oxygen to penetrate the wetland surface, leading to a significant reduction in the abundance of methanogens [43,44].
Methanotrophs are the only microbial CH4 sinks in wetlands, and their relative abundance also affects CH4 flux [45]. Type II methanotrophs have been described as microorganisms that can survive under adverse conditions and tolerate stress [46], and they exhibit a competitive advantage over Type I methanotrophs under low pH conditions [47,48,49]. Therefore, the weakly acidic conditions in the wetland of this study area may be the main reason why Type II methanotrophs have become the dominant methane-oxidizing microbial community. In addition, we observed a significant increase in the Beijerinckiaceae family of Type II methanotrophs in the MD treatment (Table 2), which may be related to the increase in temperature and pH (Figure 4c). CH₄ uptake often shows very little temperature dependence, generally increasing slightly with increasing soil temperatures [50]. This effect may be associated with the temperature-dependent increase in the enzymatic activity of soil methane-utilizing bacteria and the reduced diffusion resistance of CH₄ in air at higher temperatures [51,52]. The increase in the Beijerinckiaceae family may be due to their optimal growth at neutral pH, while the significant decline of Type I methanotrophs and Verrucomicrobia may be attributed to their acidophilic nature [53]. In an existing study discussing the evolution of Type II methanotrophs in the Beijerinckiaceae family, it was emphasized that they exhibit strong oxidation capabilities in environments with low methane concentrations, effectively degrading methane even at lower concentrations. As a result, they play an important role in environments with low methane concentrations [54]. This may explain why, after wetland degradation, Beijerinckiaceae could significantly increase compared to other types of methanotrophs.
However, a higher relative abundance of Type II methanotrophs does not necessarily imply a higher methane oxidation rate. This can be explained by the C1 assimilation RuMP pathway utilized by Type I methanotrophs, which is more efficient at converting carbon into biomass compared to the serine pathway used by Type II methanotrophs [55]. Additionally, it has been reported that most microbial species in the soil (up to 80%) are in an inactive or dormant state [56].
The first step of the methane oxidation process involves methane monooxygenase (MMO) oxidizing methane to methanol. MMO can be categorized into particulate methane monooxygenase (pMMO; EC: 1.14.18.3) and soluble methane monooxygenase (sMMO; EC: 1.14.13.25). pMMO is more common because it is produced by all methane-oxidizing microorganisms in wetland and upland environments, whereas sMMO can only be expressed by a single genus, primarily in moist, copper-deficient environments [57,58]. Therefore, pMMO is likely to play a more crucial role than sMMO in the consumption of atmospheric CH4 [11]. In this study, sMMO significantly increased after degradation, while pMMO showed no significant differences among the four treatments (Figure 3b). This may indicate that wetland degradation only slightly stimulates methane oxidation.
4.4. Effects of Wetland Degradation on Methane Metabolism Pathways
We found that SW is the primary environmental factor affecting CH4 flux (Figure 5). Some researchers believe that disrupting the original water balance of wetlands is the essence of wetland degradation, and changes in soil moisture are the primary cause of wetland degradation. It is well known that methane generation is a strictly anaerobic microbial process. Therefore, after wetland degradation, the decrease in soil moisture can reduce soil anoxia, thereby inhibiting methane production [42,59]. In our study, the decrease in SW allowed oxygen to penetrate the top layer of the wetland, which may be the direct reason for the significant disappearance of methanogens. In contrast, aerobic conditions stimulated the growth of methanotrophs, which subsequently decreased (Table 2). The abundance of type II methanotrophs increased, which is consistent with the findings of Zhang, Naafs, Huang, Song, Xue, Wang, Zhao, Evershed, Pancost and Xie [60] that type II methanotrophs activity may be enhanced during drought periods. The changes in the abundance of sMMO and pMMO indicate a slight increase in the metabolic activity of the methane-oxidizing community.
Soil carbon substrates are an important factor influencing greenhouse gas emissions from wetlands [61]. Plants can provide carbon substrates for methane production through root exudates and litter [22,62]. Changes in soil moisture are closely related to shifts in vegetation community structure. Soil moisture and organic matter content largely determine plant composition and biomass production [63]. Due to the decrease in SW, dominant species in native wetlands may lose their dominance, affecting soil carbon input and organic carbon decomposition, leading to a reduction in organic matter and TC [64]. Previous studies have investigated the effects of soil organic carbon, dissolved organic carbon, total nitrogen, and C/N on methane production [21,22,61]. Our current research highlights the significant role of TC in methane generation (Figure 5), while the impact of soil organic carbon as a carbon substrate on methane flux remains underexplored. Therefore, further research on the specific contribution of SOC to the methane generation process and its influencing mechanisms is of great significance for a comprehensive understanding of the methane cycle.
We also found that pH plays an important role in influencing the microbial community. While the slightly acidic soil in ND limits the growth of certain flora, fauna, and methane-metabolizing microorganisms, it simultaneously creates a unique ecological environment that cultivates a group of specialized acid-tolerant methanogens, supporting the survival of specific species. For example, in acidic bog peatlands (pH < 5), the dominant methanogenesis pathway is hydrogenotrophic methanogenesis [65,66,67]. According to the experimental results of Li, Sun, Li and Yuan [68], when the pH decreased from 7 to 4.8, the abundance of acetoclastic methanogens decreased with the lowering pH, while the total hydrogenotrophic methanogens increased from 12.8% to 66.5%. This indicates that hydrogenotrophic methanogens are more acid-tolerant than acetoclastic methanogens. The study by [69] also reached the same conclusion: hydrogenotrophic methanogens can grow under low pH conditions (pH 6.0 - 4.0), while acetoclastic methanogens are more sensitive to low pH (5.5 - 4.0) than hydrogenotrophic methanogens. This might explain why the hydrogenotrophic pathway is the primary methanogenesis pathway in our study area. However, after wetland degradation, the decrease in soil acidity may render the original methanogenic community unsuitable for survival, leading to a significant loss of hydrogenotrophic methanogens. Methanosarcina and Methanothrix, which belong to acetoclastic methanogens, completely disappeared. After the decrease in soil acidity, no inhibition of methanotrophs was observed. This may be because soil pH shapes the diversity and composition of CH4 oxidation microbial communities. Methanotrophs seem to thrive in soils ranging from acidic to neutral pH [70].
Methane emissions from wetland soil microorganisms are not only influenced by carbon substrates provided by plants [71,72], but plants also act as conduits for methane transfer from the soil to the atmosphere. The decline in soil moisture may alter the vegetation community, particularly plants with aerenchyma, leading to a reduction in methane emissions [73]. In this study, wetland degradation led to a decrease in the number of Cyperus species with aerenchyma in ND [74], which restricted CH4 transfer to the atmosphere and may be one of the reasons for the decline in CH4 flux.
5. Conclusion
Based on metagenomic methods, this study investigated the microbial regulatory mechanisms of CH4 emissions in wetlands at different degradation levels in the Tumen River basin. The following conclusions were drawn:
(1) Wetland degradation significantly altered environmental factors such as SW, TC, and pH. These changes had a notable impact on CH4 flux, leading to a near disappearance of CH4 emissions.
(2) The decline in SW and TC content, along with the decrease in soil acidity, led to reduced abundance of methanogens and key enzymes (mcrA; EC: 2.8.4.1) across all pathways, which is the reason for the dramatic reduction in methane production. The increase in methanotrophs and the lack of significant changes in the abundance of key enzymes (pMMO; EC: 1.14.18.3) indicate that methane consumption only slightly increased.
(3) After wetland degradation, the decline in CH4 production activity far exceeds the increase in CH4 oxidation activity, leading to the disappearance of methane sources in wetlands. This indicates that under degradation conditions, the primary factor influencing methane flux is the methane production process rather than methane oxidation. Therefore, we believe that the rapid decline in methane emissions is primarily due to the reduced abundance and metabolic activity of methanogens, which is largely caused by the decrease in soil moisture.
Given the complexity of marsh wetlands and the uncertainties of global climate change, further research is needed to explore the mechanisms through which wetland degradation affects CH4 emissions.
Supplementary Materials
The following supporting information can be downloaded at the website of this paper posted on Preprints.org.
References
- Wang Z, Zhao H, Zhao C. Temporal and spatial evolution characteristics of land use and landscape pattern in key wetland areas of the West Liao River Basin, Northeast China [J]. Journal of Environmental Engineering and Landscape Management 2022, 30, 195–205. [Google Scholar] [CrossRef]
- Malone S L, Starr G, Staudhammer C L, et al. Effects of simulated drought on the carbon balance of Everglades short-hydroperiod marsh [J]. Global Change Biology 2013, 19, 2511–2523. [Google Scholar] [CrossRef]
- Zedler J B, Kercher S. Wetland resources: status, trends, ecosystem services, and restorability [J]. Annu Rev Environ Resour 2005, 30, 39–74. [CrossRef]
- Khaledian Y, Kiani F, Ebrahimi S, et al. Assessment and monitoring of soil degradation during land use change using multivariate analysis [J]. Land Degradation & Development 2017, 28, 128–141. [Google Scholar]
- Hergoualc’h K, Hendry D T, Murdiyarso D, et al. Total and heterotrophic soil respiration in a swamp forest and oil palm plantations on peat in Central Kalimantan, Indonesia [J]. Biogeochemistry 2017, 135, 203–220. [CrossRef]
- van Lent J, Hergoualc’h K, Verchot L, et al. Greenhouse gas emissions along a peat swamp forest degradation gradient in the Peruvian Amazon: soil moisture and palm roots effects [J]. Mitigation Adapt Strategies Global Change 2019, 24, 625–643. [Google Scholar] [CrossRef]
- Ise T, Dunn A L, Wofsy S C, et al. High sensitivity of peat decomposition to climate change through water-table feedback [J]. Nature Geoscience 2008, 1, 763–766. [Google Scholar] [CrossRef]
- Limpert K E, Carnell P E, Trevathan-Tackett S M, et al. Reducing Emissions From Degraded Floodplain Wetlands [J]. Frontiers in Environmental Science 2020, 8. [Google Scholar]
- Günther A, Barthelmes A, Huth V, et al. Prompt rewetting of drained peatlands reduces climate warming despite methane emissions [J]. Nature Communications 2020, 11, 1644. [Google Scholar] [CrossRef]
- Zou J, Ziegler A D, Chen D, et al. Rewetting global wetlands effectively reduces major greenhouse gas emissions [J]. Nature Geoscience 2022, 15, 627–632. [Google Scholar] [CrossRef]
- Wang N, Zhu X, Zuo Y, et al. Microbial mechanisms for methane source-to-sink transition after wetland conversion to cropland [J]. Geoderma 2023, 429. [Google Scholar]
- Zhang Z, Zimmermann N E, Stenke A, et al. Emerging role of wetland methane emissions in driving 21st century climate change [J]. Proceedings of the National Academy of Sciences 2017, 114, 9647–9652. [Google Scholar] [CrossRef]
- Jiménez-Ballesta R, García-Navarro F J, Bravo Martín-Consuegra S, et al. The Impact of the Storage of Nutrients and Other Trace Elements on the Degradation of a Wetland [J]. International Journal of Environmental Research 2018, 12, 87–100. [Google Scholar] [CrossRef]
- Hergoualc’h K, Dezzeo N, Verchot L V, et al. Spatial and temporal variability of soil N2O and CH4 fluxes along a degradation gradient in a palm swamp peat forest in the Peruvian Amazon [J]. Global Change Biology 2020, 26, 7198–7216. [Google Scholar] [CrossRef] [PubMed]
- Kimura M, Murase J, Lu Y. Carbon cycling in rice field ecosystems in the context of input, decomposition and translocation of organic materials and the fates of their end products (CO2 and CH4) [J]. Soil Biology and Biochemistry 2004, 36, 1399–1416. [CrossRef]
- Chen S, Wang D, Ding Y, et al. Ebullition Controls on CH4 Emissions in an Urban, Eutrophic River: A Potential Time-Scale Bias in Determining the Aquatic CH4 Flux [J]. Environmental Science & Technology 2021, 55, 7287–7298.
- Yang P, Lai D Y, Yang H, et al. Large increase in CH4 emission following conversion of coastal marsh to aquaculture ponds caused by changing gas transport pathways [J]. Water Res 2022, 222, 118882. [Google Scholar] [CrossRef]
- Zhou Z, Zhang C-j, Liu P-f, et al. Non-syntrophic methanogenic hydrocarbon degradation by an archaeal species [J]. Nature 2022, 601, 257–262. [Google Scholar] [CrossRef]
- Yun J, Crombie A T, Ul Haque M F, et al. Revealing the community and metabolic potential of active methanotrophs by targeted metagenomics in the Zoige wetland of the Tibetan Plateau [J]. Environmental Microbiology 2021, 23, 6520–6535. [Google Scholar] [CrossRef]
- Zhang H, Yao Z, Ma L, et al. Annual methane emissions from degraded alpine wetlands in the eastern Tibetan Plateau [J]. Science of The Total Environment 2019, 657, 1323–1333. [Google Scholar] [CrossRef]
- Zhang W, Kang X, Kang E, et al. Soil water content, carbon, and nitrogen determine the abundances of methanogens, methanotrophs, and methane emission in the Zoige alpine wetland [J]. Journal of Soils and Sediments 2021, 22, 470–481.
- Dou X, Zhou W, Zhang Q, et al. Greenhouse gas (CO2, CH4, N2O) emissions from soils following afforestation in central China [J]. Atmospheric Environment 2016, 126, 98–106. [CrossRef]
- McCalley C K, Woodcroft B J, Hodgkins S B, et al. Methane dynamics regulated by microbial community response to permafrost thaw [J]. Nature 2014, 514, 478–481. [Google Scholar] [CrossRef]
- Buan N, R. Methanogens: pushing the boundaries of biology [J]. Emerging Topics in Life Sciences 2018, 2, 629–646. [Google Scholar]
- Friedrich M, W. Methyl-Coenzyme M Reductase Genes: Unique Functional Markers for Methanogenic and Anaerobic Methane-Oxidizing Archaea [M]. Methods in Enzymology. Academic Press. 2005; 428–442. [Google Scholar]
- Xiaoping T, Guilin H. Study on classification system for wetland types in China [J]. Forest Research 2003, 16, 531–539. [Google Scholar]
- Song C, Xu X, Tian H, et al. Ecosystem–atmosphere exchange of CH4 and N2O and ecosystem respiration in wetlands in the Sanjiang Plain, Northeastern China [J]. Global Change Biol 2009, 15, 692–705. [CrossRef]
- Padhy S R, Bhattacharyya P, Dash P K, et al. Elucidation of dominant energy metabolic pathways of methane, sulphur and nitrogen in respect to mangrove-degradation for climate change mitigation [J]. Journal of Environmental Management 2022, 303, 114151. [CrossRef]
- Akhtar H, Lupascu M, Sukri R S, et al. Significant sedge-mediated methane emissions from degraded tropical peatlands [J]. Environmental Research Letters 2021, 16, 014002. [Google Scholar]
- Abulaizi M, Chen M, Yang Z, et al. Response of soil bacterial community to alpine wetland degradation in arid Central Asia [J]. Frontiers in Plant Science 2023, 13, 990597. [Google Scholar] [CrossRef]
- Yan Z, Yang S, Chen L, et al. Responses of soil fungal community composition and function to wetland degradation in the Songnen Plain, northeastern China [J]. Frontiers in Plant Science 2024, 15.
- Vargas A I, Schaffer B, Sternberg L d S L. Plant water uptake from soil through a vapor pathway [J]. Physiologia Plantarum 2020, 170, 433–439. [Google Scholar] [CrossRef]
- Abulaizi M, Chen M, Yang Z, et al. Response of soil bacterial community to alpine wetland degradation in arid Central Asia [J]. Front Plant Sci 2022, 13, 990597. [Google Scholar]
- Wei J, Gao J, Wang N, et al. Differences in soil microbial response to anthropogenic disturbances in Sanjiang and Momoge Wetlands, China [J]. FEMS Microbiology Ecology 2019, 95, fiz110.
- Huo L, Chen Z, Zou Y, et al. Effect of Zoige alpine wetland degradation on the density and fractions of soil organic carbon [J]. Ecological Engineering 2013, 51, 287–295. [Google Scholar] [CrossRef]
- Li M, Hao Y, Yan Z, et al. Long-term degradation from marshes into meadows shifts microbial functional diversity of soil phosphorus cycling in an alpine wetland of the Tibetan Plateau [J]. Land Degradation & Development 2022, 33, 628–637. [Google Scholar]
- Wan D, Yu P, Kong L, et al. Effects of inland salt marsh wetland degradation on plant community characteristics and soil properties [J]. Ecological Indicators 2024, 159. [Google Scholar]
- Zhang D, Qi Q, Tong S, et al. Soil Degradation Effects on Plant Diversity and Nutrient in Tussock Meadow Wetlands [J]. Journal of Soil Science and Plant Nutrition 2019, 19, 535–544. [Google Scholar] [CrossRef]
- Padhy S R, Bhattacharyya P, Nayak S K, et al. A unique bacterial and archaeal diversity make mangrove a green production system compared to rice in wetland ecology: A metagenomic approach [J]. Science of The Total Environment 2021, 781, 146713. [Google Scholar] [CrossRef]
- Wang H, Yu L, Zhang Z, et al. Molecular mechanisms of water table lowering and nitrogen deposition in affecting greenhouse gas emissions from a Tibetan alpine wetland [J]. Global change biology 2017, 23, 815–829. [Google Scholar] [CrossRef]
- Ma W, Alhassan A-R M, Wang Y, et al. Greenhouse gas emissions as influenced by wetland vegetation degradation along a moisture gradient on the eastern Qinghai-Tibet Plateau of North-West China [J]. Nutrient Cycling in Agroecosystems 2018, 112, 335–354. [Google Scholar] [CrossRef]
- Dijkstra F A, Prior S A, Runion G B, et al. Effects of elevated carbon dioxide and increased temperature on methane and nitrous oxide fluxes: evidence from field experiments [J]. Frontiers in Ecology and the Environment 2012, 10, 520–527. [Google Scholar] [CrossRef]
- Scheller S, Goenrich M, Boecher R, et al. The key nickel enzyme of methanogenesis catalyses the anaerobic oxidation of methane [J]. Nature 2010, 465, 606–608. [Google Scholar] [CrossRef] [PubMed]
- Ermler U, Grabarse W, Shima S, et al. Crystal Structure of Methyl-Coenzyme M Reductase: The Key Enzyme of Biological Methane Formation [J]. Science 1997, 278, 1457–1462. [Google Scholar] [CrossRef]
- Ruiz-Ruiz P, Gómez-Borraz T L, Revah S, et al. Methanotroph-microalgae co-culture for greenhouse gas mitigation: Effect of initial biomass ratio and methane concentration [J]. Chemosphere 2020, 259, 127418. [Google Scholar] [CrossRef] [PubMed]
- Ho A, Kerckhof F-M, Luke C, et al. Conceptualizing functional traits and ecological characteristics of methane-oxidizing bacteria as life strategies [J]. Environmental Microbiology Reports 2013, 5, 335–345. [Google Scholar] [CrossRef]
- Kou Y, Wei K, Li C, et al. Deterministic processes dominate soil methanotrophic community assembly in grassland soils [J]. Geoderma 2020, 359, 114004. [Google Scholar] [CrossRef]
- Zhao J, Cai Y, Jia Z. The pH-based ecological coherence of active canonical methanotrophs in paddy soils [J]. Biogeosciences 2020, 17, 1451–1462. [Google Scholar] [CrossRef]
- Zheng S, Deng S, Ma C, et al. Type I methanotrophs dominated methane oxidation and assimilation in rice paddy fields by the consequence of niche differentiation [J]. Biology and Fertility of Soils 2023, 60, 153–165. [Google Scholar]
- Fest B, Hinko-Najera N, von Fischer J C, et al. Soil methane uptake increases under continuous throughfall reduction in a temperate evergreen, broadleaved eucalypt forest [J]. Ecosystems 2017, 20, 368–379. [CrossRef]
- Brumme R, Borken W. Site variation in methane oxidation as affected by atmospheric deposition and type of temperate forest ecosystem [J]. Global Biogeochemical Cycles 1999, 13, 493–501. [Google Scholar] [CrossRef]
- Smith K A, Ball T, Conen F, et al. Exchange of greenhouse gases between soil and atmosphere: interactions of soil physical factors and biological processes [J]. European journal of soil science 2018, 69, 10–20. [Google Scholar] [CrossRef]
- Yao X, Wang J, Hu B. How methanotrophs respond to pH: a review of ecophysiology [J]. Frontiers in Microbiology 2023, 13, 1034164. [Google Scholar]
- Tamas I, Smirnova A V, He Z, et al. The (d) evolution of methanotrophy in the Beijerinckiaceae—a comparative genomics analysis [J]. The ISME journal 2014, 8, 369–382. [Google Scholar] [CrossRef] [PubMed]
- Kalyuzhnaya M G, Yang S, Rozova O N, et al. Highly efficient methane biocatalysis revealed in a methanotrophic bacterium [J]. Nature Communications 2013, 4, 2785. [Google Scholar] [CrossRef]
- Bodelier P L E, Meima-Franke M, Hordijk C A, et al. Microbial minorities modulate methane consumption through niche partitioning [J]. The ISME Journal 2013, 7, 2214–2228. [Google Scholar] [CrossRef]
- Hanson R S, Hanson T E. Methanotrophic bacteria [J]. Microbiological reviews 1996, 60, 439–471. [Google Scholar] [CrossRef]
- Hakemian A S, Rosenzweig A C. The biochemistry of methane oxidation [J]. Annu Rev Biochem 2007, 76, 223–241. [Google Scholar] [CrossRef]
- Ma W, Alhassan A-R M, Wang Y, et al. Greenhouse gas emissions as influenced by wetland vegetation degradation along a moisture gradient on the eastern Qinghai-Tibet Plateau of North-West China [J]. Nutrient Cycling in Agroecosystems 2018, 112, 335–354. [Google Scholar] [CrossRef]
- Zhang Y, Naafs B D A, Huang X, et al. Variations in wetland hydrology drive rapid changes in the microbial community, carbon metabolic activity, and greenhouse gas fluxes [J]. Geochim Cosmochim Acta 2022, 317, 269–285. [CrossRef]
- Hu H, Chen J, Zhou F, et al. Relative increases in CH4 and CO2 emissions from wetlands under global warming dependent on soil carbon substrates [J]. Nature Geoscience 2024, 17, 26–31. [Google Scholar] [CrossRef]
- Koelbener A, Ström L, Edwards P J, et al. Plant species from mesotrophic wetlands cause relatively high methane emissions from peat soil [J]. Plant and Soil 2010, 326, 147–158. [Google Scholar] [CrossRef]
- Eneyew B G, Assefa W W. Anthropogenic effect on wetland biodiversity in Lake Tana Region: A case of Infranz Wetland, Northwestern Ethiopia [J]. Environmental and Sustainability Indicators 2021, 12.
- Craine J M, Gelderman T M. Soil moisture controls on temperature sensitivity of soil organic carbon decomposition for a mesic grassland [J]. Soil Biology and Biochemistry 2011, 43, 455–457. [Google Scholar] [CrossRef]
- Williams R T, Crawford R L. Methane production in Minnesota peatlands [J]. Applied and Environmental Microbiology 1984, 47, 1266–1271. [Google Scholar] [CrossRef]
- Horn M A, Matthies C, Kusel K, et al. Hydrogenotrophic methanogenesis by moderately acid-tolerant methanogens of a methane-emitting acidic peat [J]. Appl Environ Microbiol 2003, 69, 74–83. [Google Scholar] [CrossRef] [PubMed]
- Kotsyurbenko O R, Friedrich M W, Simankova M V, et al. Shift from Acetoclastic to H2-Dependent Methanogenesis in a West Siberian Peat Bog at Low pH Values and Isolation of an Acidophilic Methanobacterium Strain [J]. Applied and Environmental Microbiology 2007, 73, 2344–2348. [Google Scholar] [CrossRef]
- Li Y, Sun Y, Li L, et al. Acclimation of acid-tolerant methanogenic propionate-utilizing culture and microbial community dissecting [J]. Bioresour Technol 2018, 250, 117–123. [Google Scholar] [CrossRef] [PubMed]
- Zhang L, Ban Q, Li J, et al. Response of Syntrophic Propionate Degradation to pH Decrease and Microbial Community Shifts in an UASB Reactor [J]. J Microbiol Biotechnol 2016, 26, 1409–1419. [Google Scholar] [CrossRef]
- Song H, Peng C, Zhu Q, et al. Quantification and uncertainty of global upland soil methane sinks: Processes, controls, model limitations, and improvements [J]. Earth-Science Reviews 2024, 252.
- Le Mer J, Roger P. Production, oxidation, emission and consumption of methane by soils: A review [J]. European Journal of Soil Biology 2001, 37, 25–50. [CrossRef]
- Dinsmore K J, Skiba U M, Billett M F, et al. Effect of water table on greenhouse gas emissions from peatland mesocosms [J]. Plant and Soil 2009, 318, 229–242. [Google Scholar] [CrossRef]
- Yang G, Chen H, Wu N, et al. Effects of soil warming, rainfall reduction and water table level on CH4 emissions from the Zoige peatland in China [J]. Soil Biology and Biochemistry 2014, 78, 83–89. [CrossRef]
- Bhullar G S, Edwards P J, Olde Venterink H. Variation in the plant-mediated methane transport and its importance for methane emission from intact wetland peat mesocosms [J]. Journal of Plant Ecology 2013, 6, 298–304. [Google Scholar] [CrossRef]
Figure 1.
Study region and four degradation gradients in the Jingxin Wetland, Hun Chun, China. ND, LD, MD, and HD represent the four degradation levels: non-degraded (ND), lightly degraded (LD), moderately degraded (MD), and highly degraded (HD), respectively.
Figure 1.
Study region and four degradation gradients in the Jingxin Wetland, Hun Chun, China. ND, LD, MD, and HD represent the four degradation levels: non-degraded (ND), lightly degraded (LD), moderately degraded (MD), and highly degraded (HD), respectively.
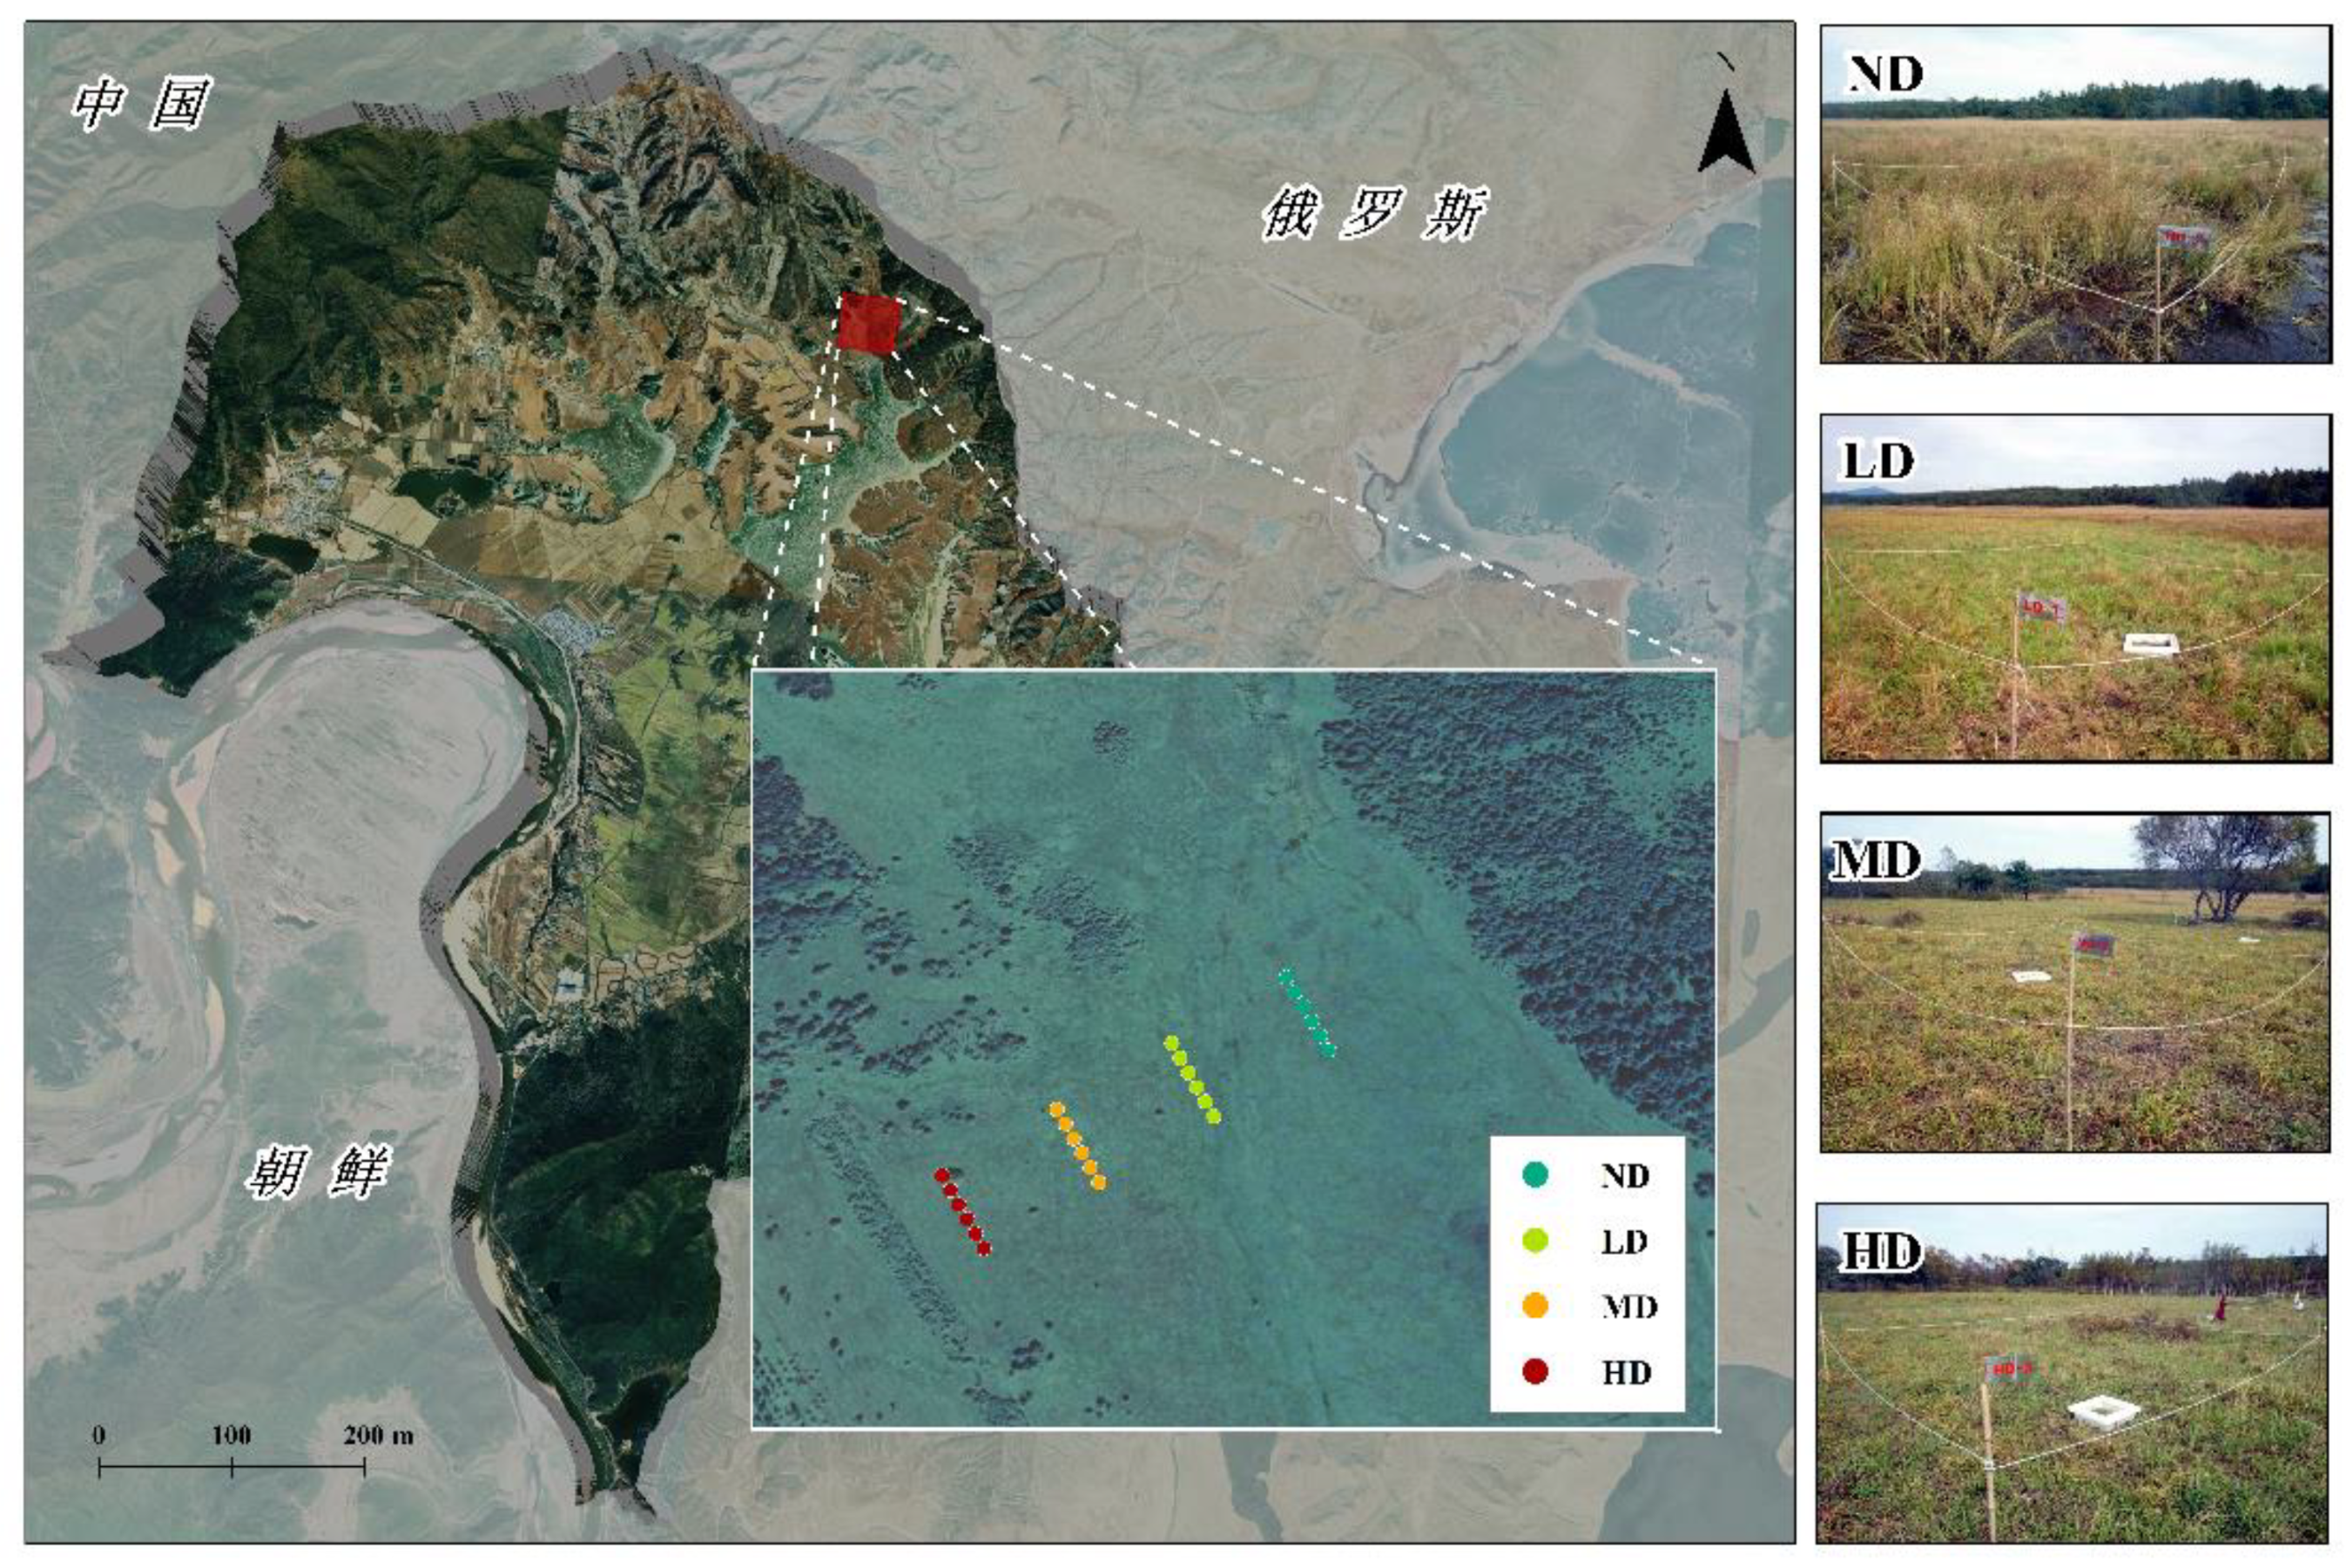
Figure 2.
Environmental factors at the different degradation gradient sites. (a-i) Represent the trends of CH4 Flux, SW, TC, pH, EC, ST, C/N, MBC, DOC with degradation gradient, respectively. Different lowercase letters indicate significant differences at the p < 0.05 level (errorbars indicate standard errors). ND, non-degraded; LD, lightly degraded; MD, moderately degraded; HD, highly degraded; SW, soil water content; TC, total carbon; EC, electrical conductivity; ST, soil temperature; C/N, ratios of TC and TN; MBC, microbial biomass carbon; DOC, dissolved organic carbon.
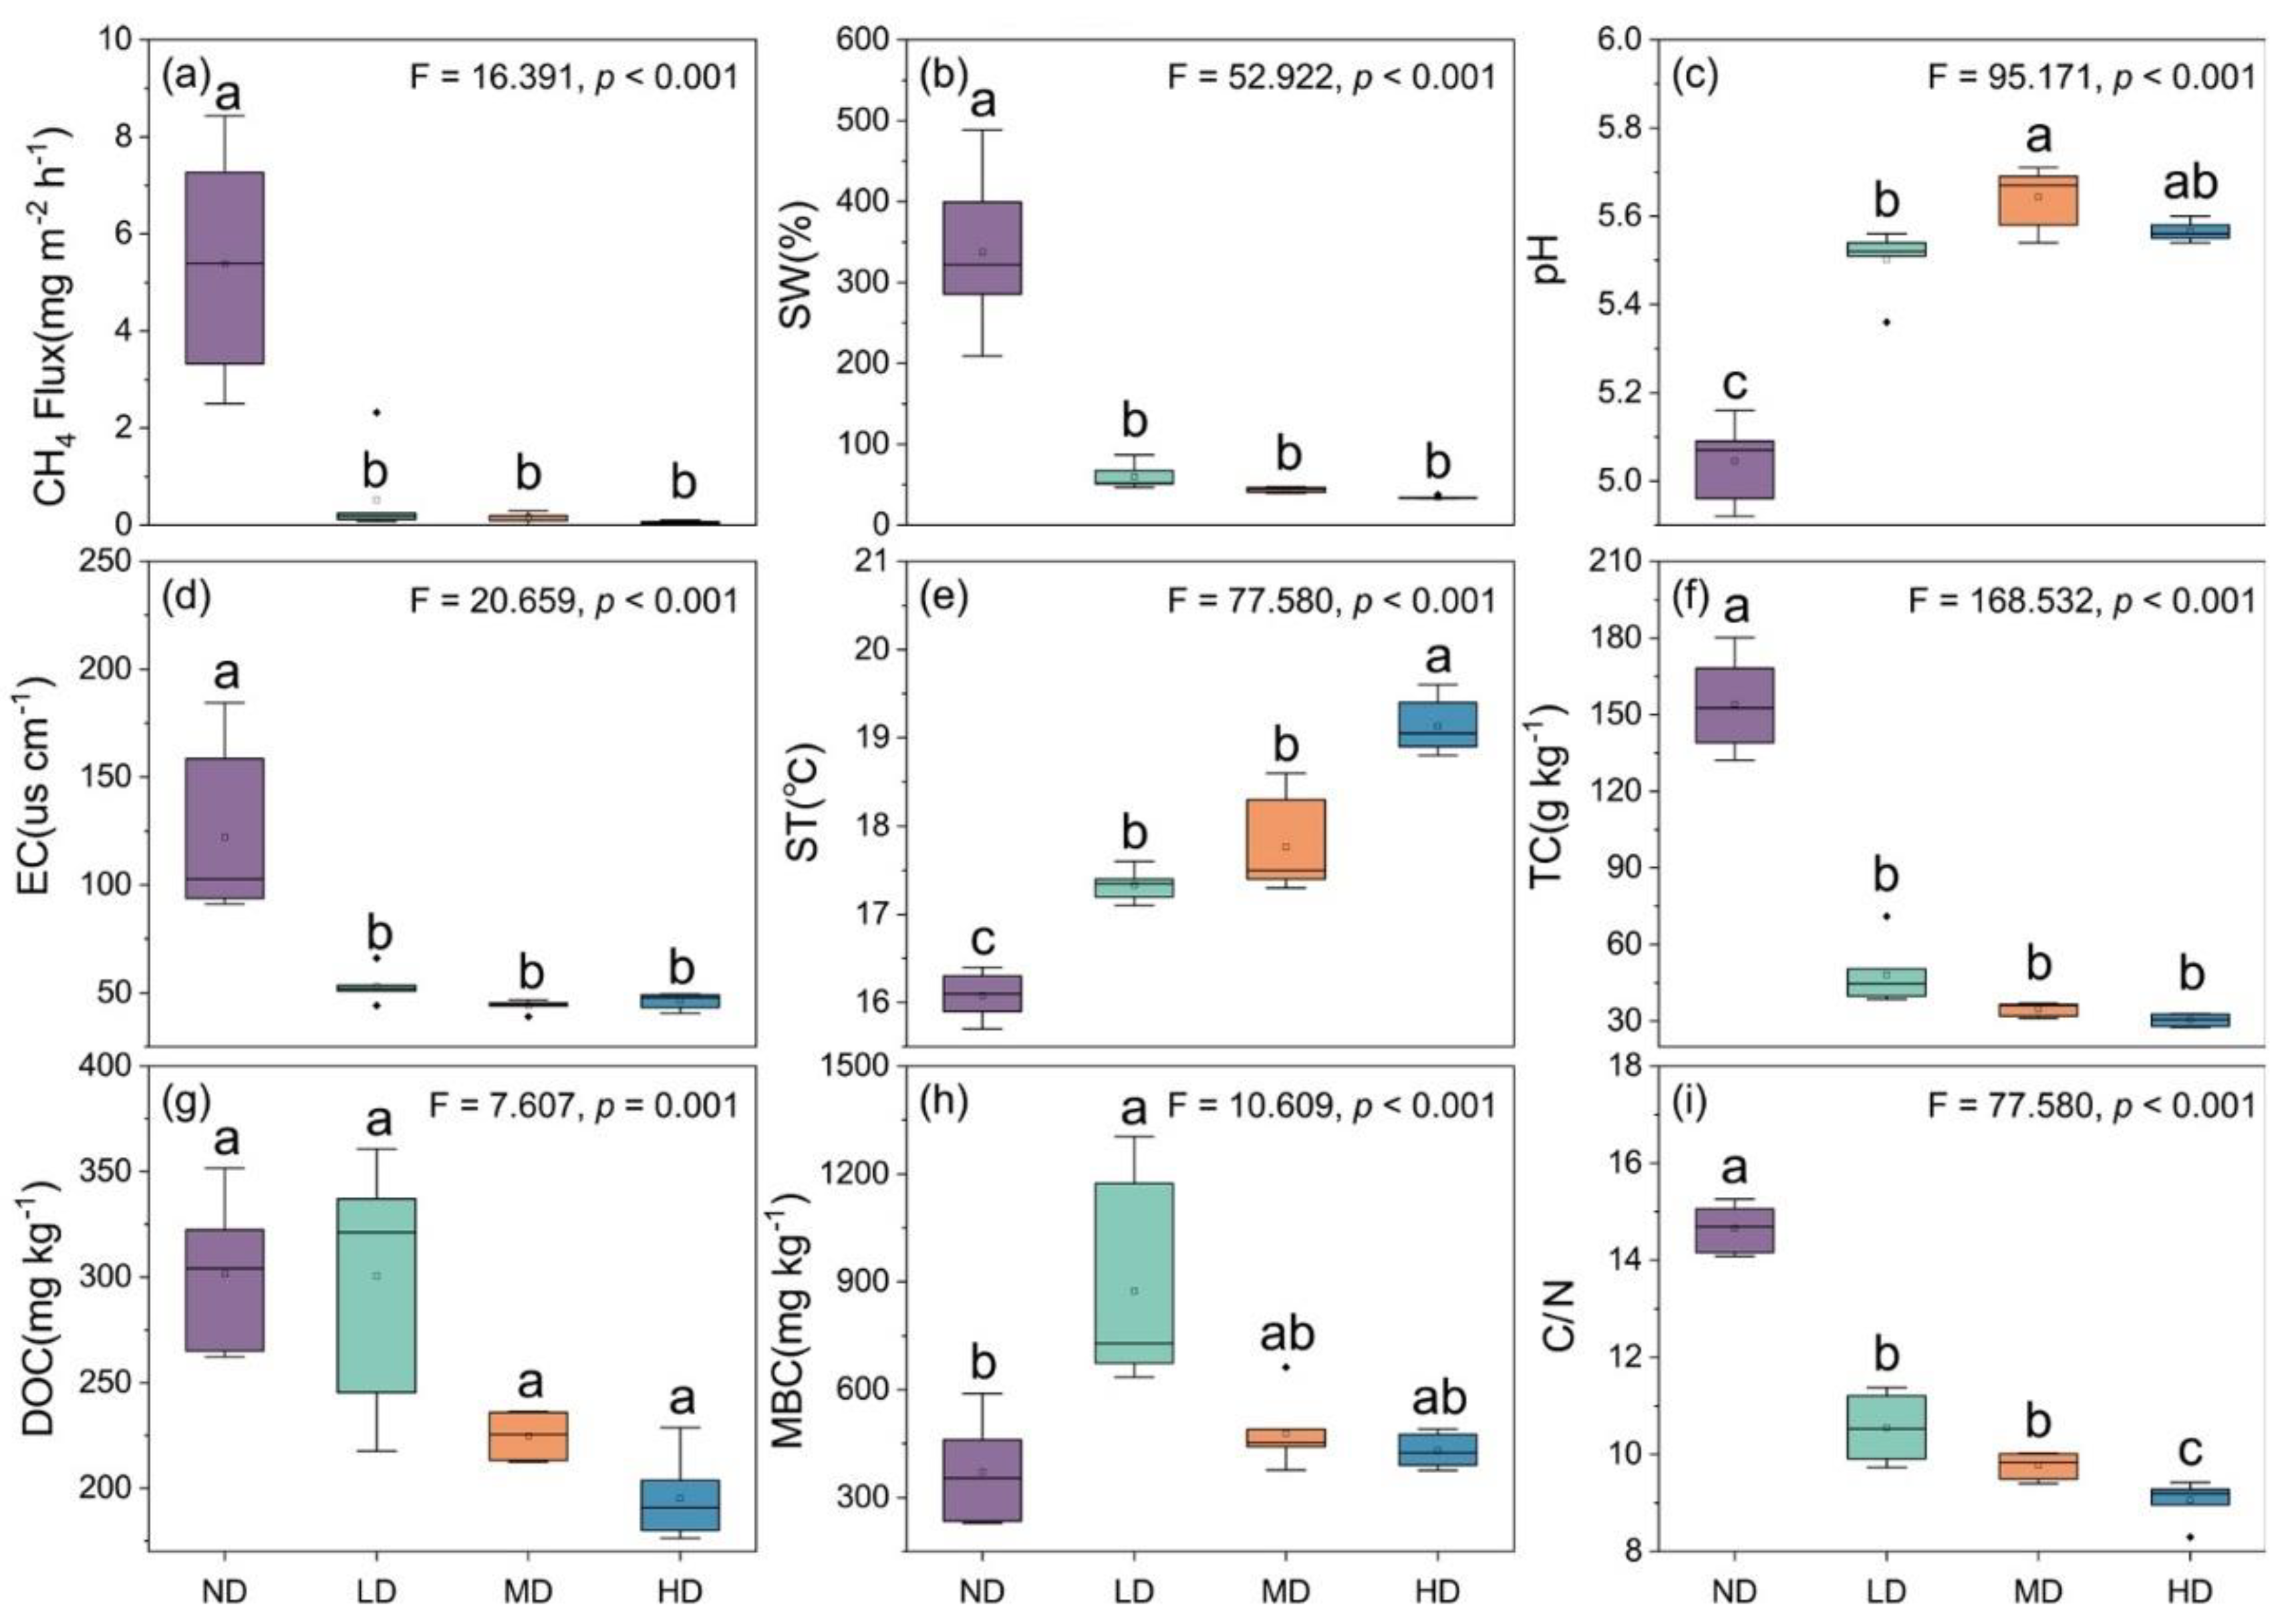
Figure 3.
Significant Kyoto Encyclopedia of Genes and Genomes (KEGG) pathways of CH4 production and oxidation in wetland soils (a). The five related pathways are colored differently, including the CO2 pathway, trimethylamine metabolism, methanol pathway, acetate pathway and CH4 oxidation pathway. One-way analysis of variance (ANOVA) was conducted for the relative abundances of genes encoding enzymes involved in CH4 metabolism (b). ND, LD, MD, and HD represent the four degradation levels: non-degraded (ND), lightly degraded (LD), moderately degraded (MD), and highly degraded (HD), respectively.
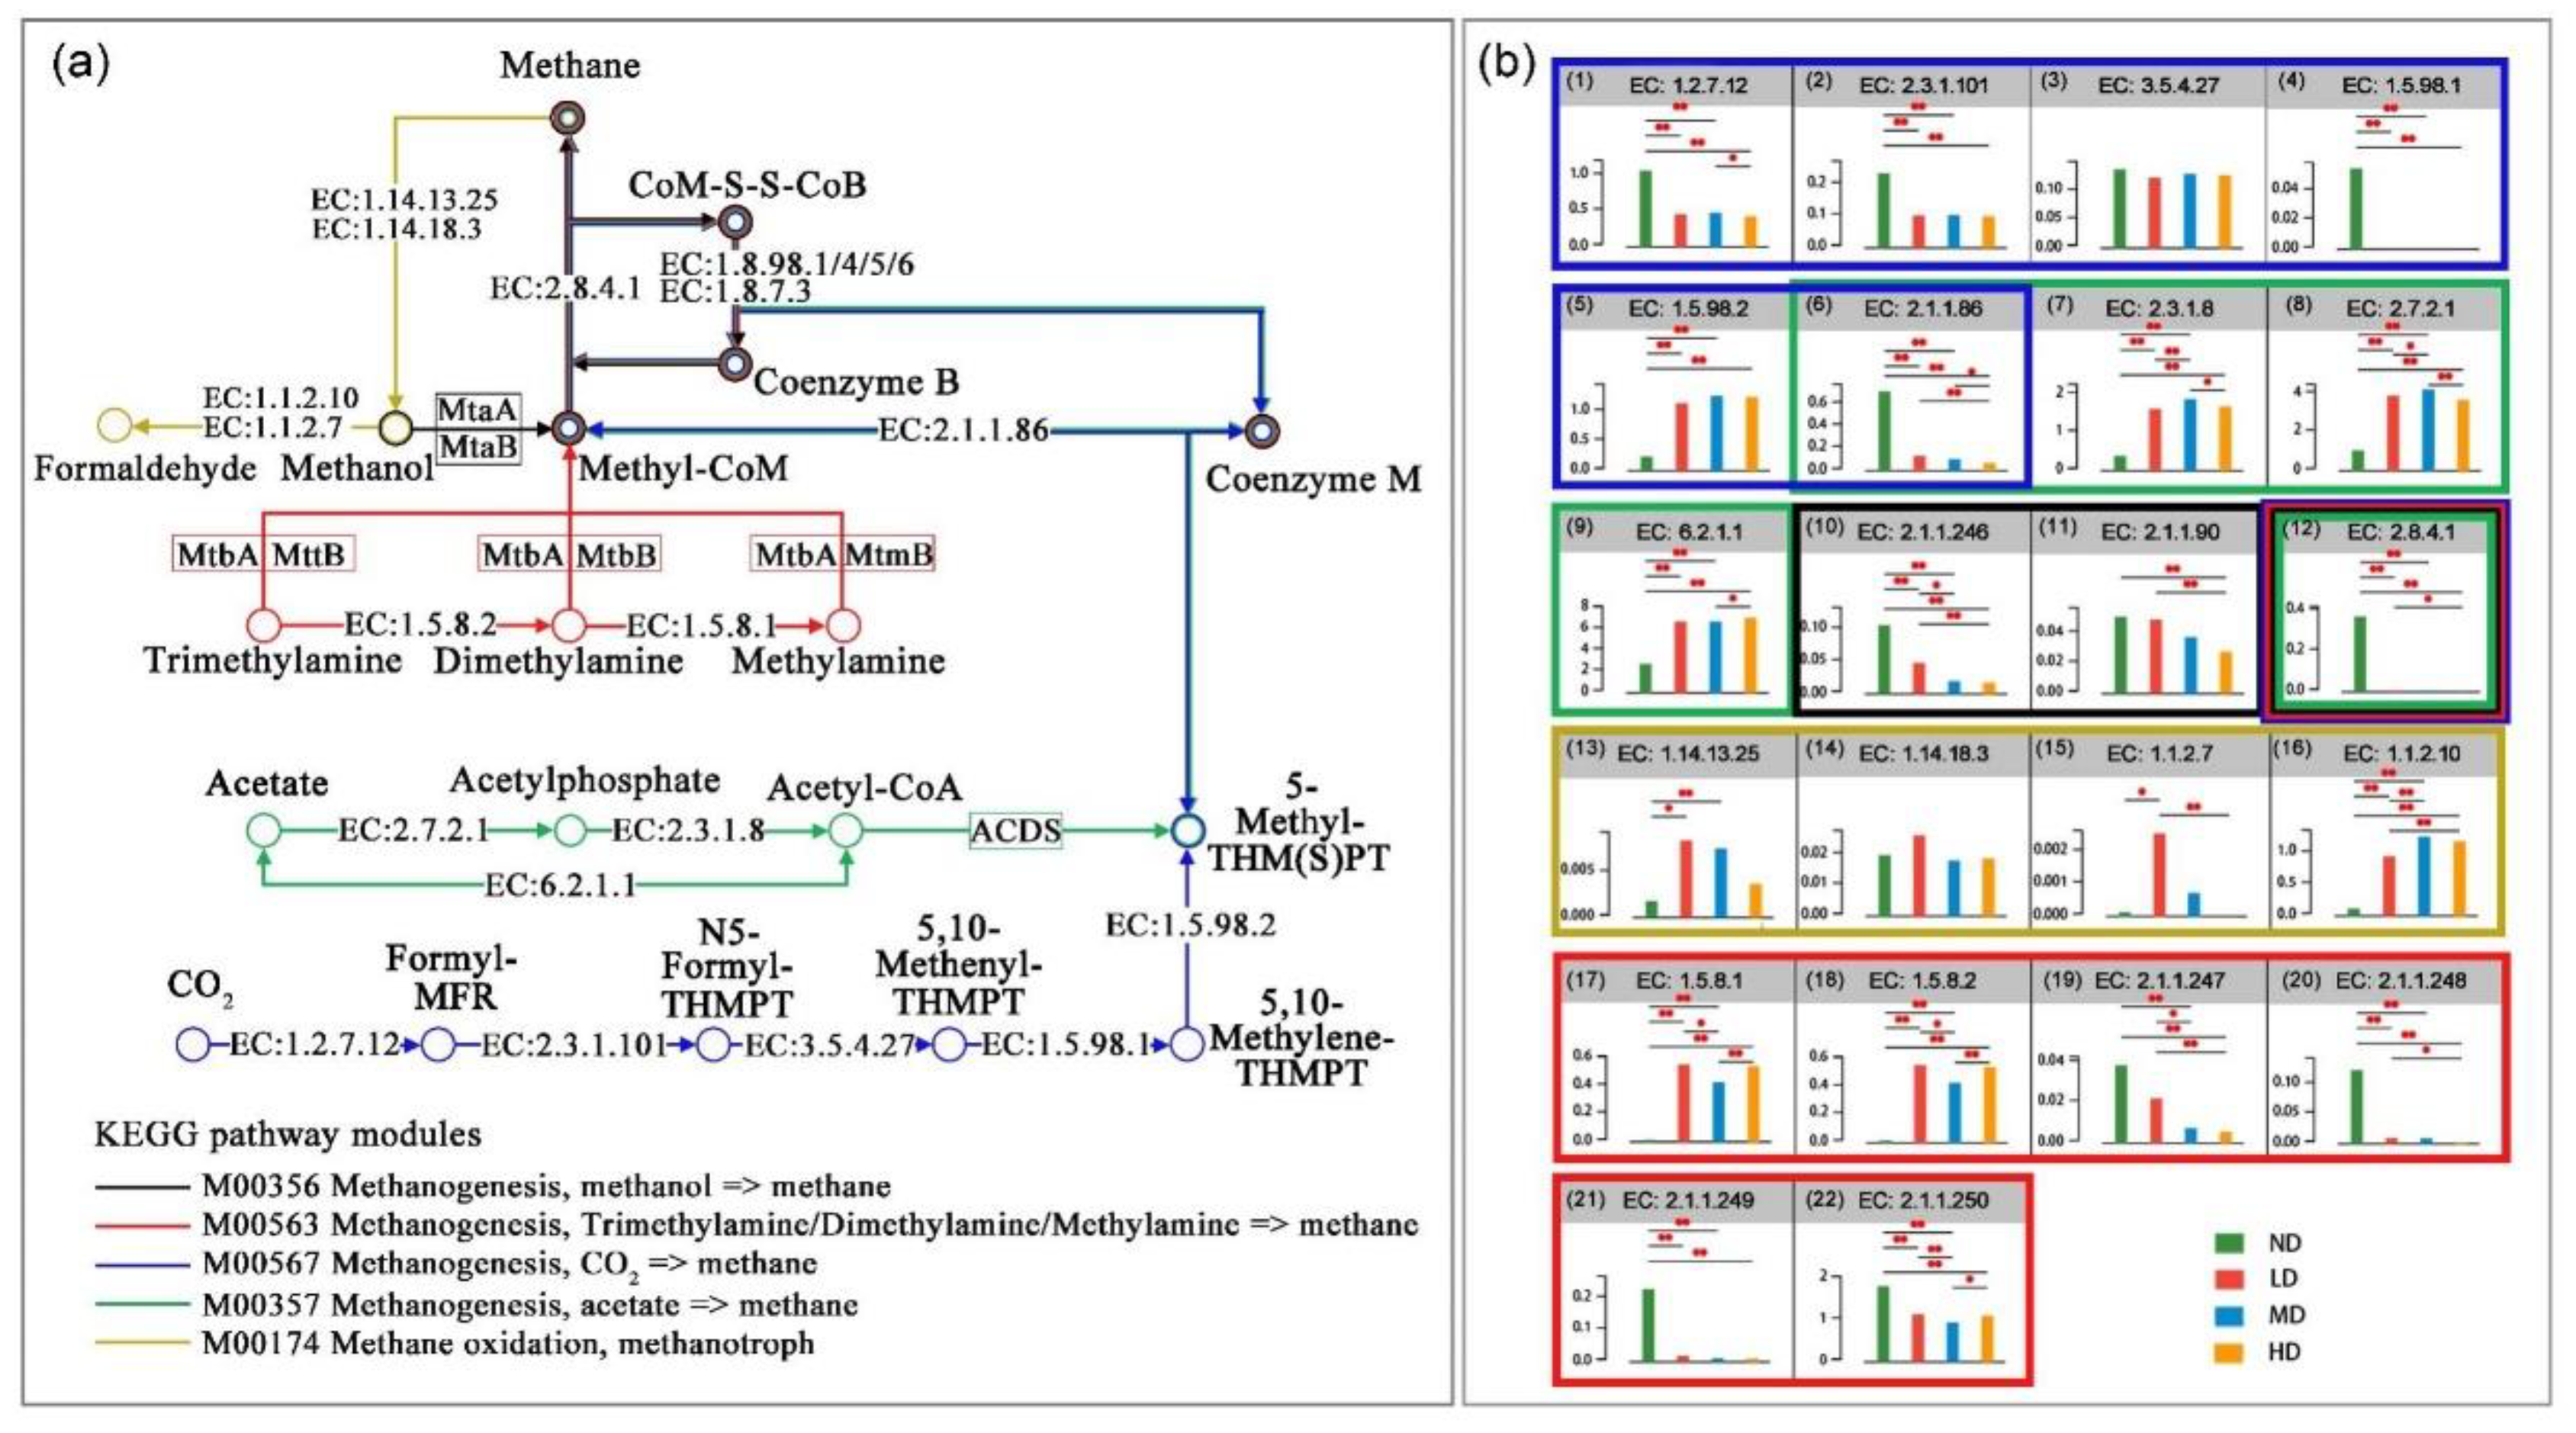
Figure 4.
The significance of the effect of environmental factors on the soil microbial community involved in CH4 production and oxidation was defined using Mantel tests (permutations =999), and the resulting significance level was tested using the Mantel r statistic and p values. The color gradient denotes Spearman’s correlation coefficients. MP, methane production related microbial subcommunity; MO, methane oxidation related microbial subcommunity. Panels (a), (b), (c), and (d) represent non-degraded (ND), lightly degraded (LD), moderately degraded (MD), and highly degraded (HD), respectively.
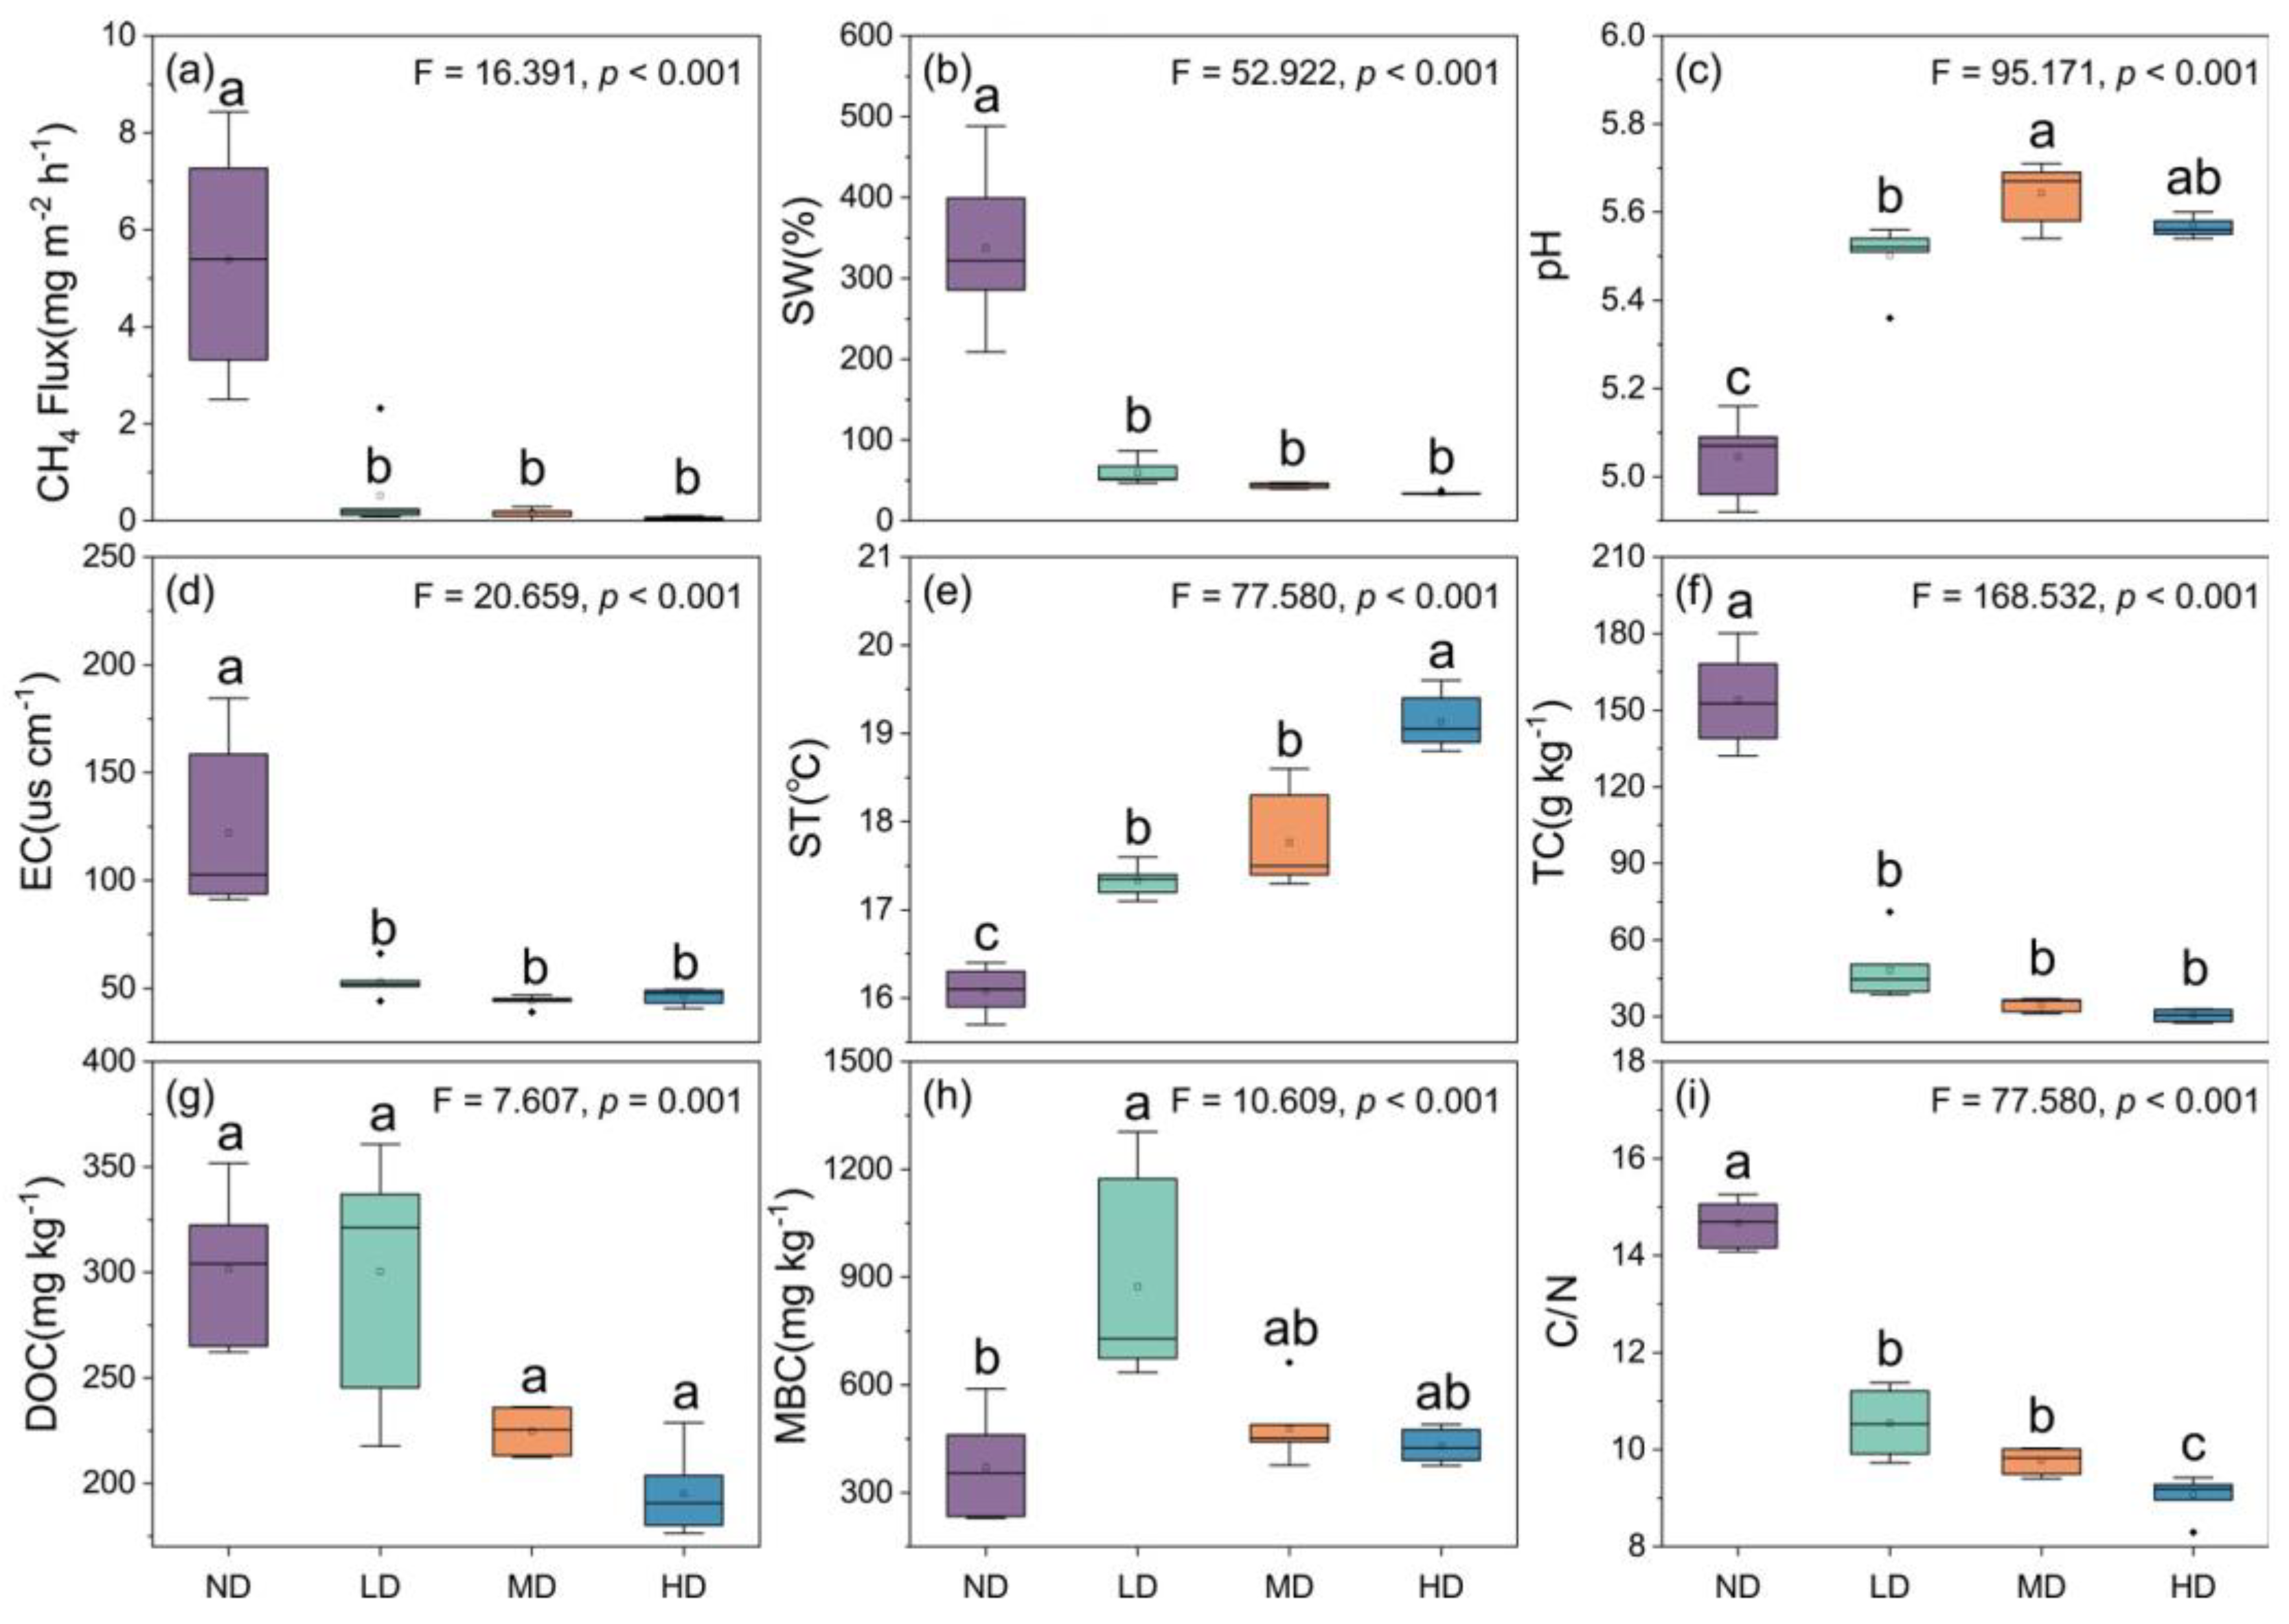
Figure 5.
Partial Least Squares Regression (PLSR) analysis results of the impact of environmental factors on CH4 flux. ND, LD, MD, and HD represent the four degradation levels: non-degraded (ND), lightly degraded (LD), moderately degraded (MD), and highly degraded (HD), respectively.
Figure 5.
Partial Least Squares Regression (PLSR) analysis results of the impact of environmental factors on CH4 flux. ND, LD, MD, and HD represent the four degradation levels: non-degraded (ND), lightly degraded (LD), moderately degraded (MD), and highly degraded (HD), respectively.
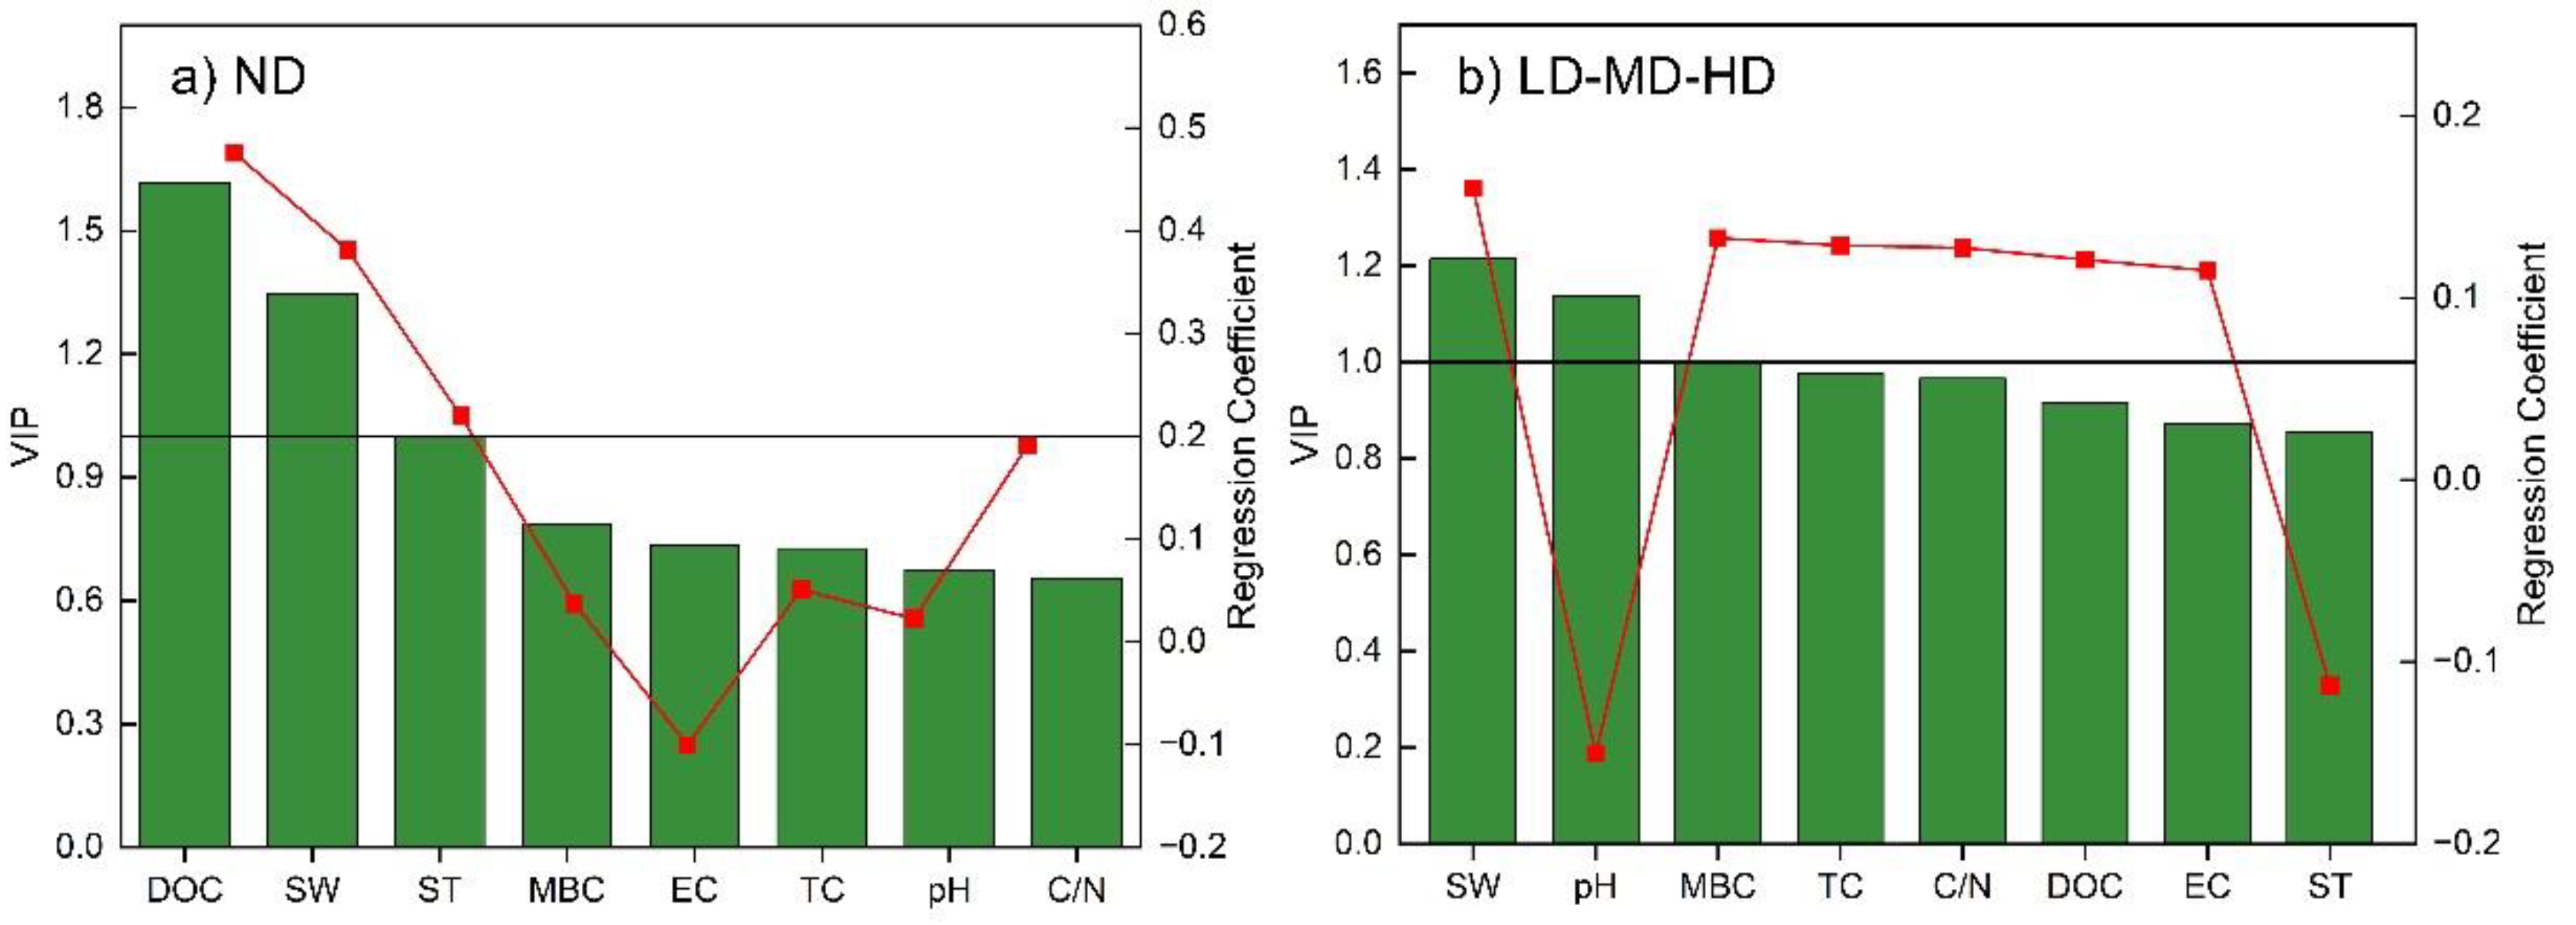
Table 1.
Abundance of methanogens with different nutritional types (mean ± standard deviation; n = 6) and results of Kruskal-Wallis H statistical tests. Values represent species abundance normalized as Transcripts Per Million (TPM). TPM accounts for sequencing depth and gene length, calculated as the number of reads per gene divided by its length (in kilobases), normalized across all species within a sample. ND, LD, MD, and HD represent the four degradation levels: non-degraded (ND), lightly degraded (LD), moderately degraded (MD), and highly degraded (HD), respectively.
| Category | Methanogens | ND | LD | MD | HD | p value |
| hydrogenotrophic methanogens | Methanocellales | 324.54 ± 80.42 a | 1.49 ± 1.01 b | 1.44 ± 0.62 b | 0.88 ± 0.64 b | <0.01 |
| Methanobacteriales | 396.27 ± 73.90 a | 1.64 ± 1.37 ab | 0.50 ± 0.33 b | 0.69 ± 1.37 b | <0.01 | |
| Methanococcales | 29.94 ± 7.99 a | 0.00 ± 0.00 b | 0.00 ± 0.00 b | 0.00 ± 0.00 b | < 0.001 | |
| Methanomicrobiales | 183.49 ± 36.05 a | 0.79 ± 1.29 ab | 0.099 ± 0.15 b | 0.06 ± 0.10 b | <0.01 | |
| Methanopyrales | 3.94 ± 0.92 a | 0.18 ± 0.23 ab | 0.00 ± 0.00 b | 0.00 ± 0.00 b | < 0.001 | |
| methylotrophic methanogens | Methanomassiliicoccales | 72.94 ± 18.45 a | 0.00 ± 0.00 b | 0.03 ± 0.05 b | 0.14 ± 0.22 b | <0.01 |
| Methanonatronarchaeales | 1.32 ± 0.53 a | 0.00 ± 0.00 b | 0.00 ± 0.00 b | 0.00 ± 0.00 b | < 0.001 | |
| Acetate- degrading methanogens | Methanothrix | 163.48 ± 50.81 a | 0.16 ± 0.24 ab | 0.03 ± 0.07 b | 0.00 ± 0.00 b | < 0.001 |
| Methanosarcina | 22.73 ± 5.15 a | 0.32 ± 0.35 b | 0.02 ± 0.05 b | 0.19 ± 0.32 b | <0.01 | |
| facultative methanogen | Methanosarcinales | 719.18 ± 149.06 a | 0.36 ± 0.40 b | 0.19 ± 0.13 b | 0.35 ± 0.49 b | <0.01 |
Table 2.
Abundance of methanotrophs with different nutritional types (mean ± standard deviation; n = 6) and results of Kruskal-Wallis H statistical tests. Values represent species abundance normalized as Transcripts Per Million (TPM). TPM accounts for sequencing depth and gene length, calculated as the number of reads per gene divided by its length (in kilobases), normalized across all species within a sample. ND, LD, MD, and HD represent the four degradation levels: non-degraded (ND), lightly degraded (LD), moderately degraded (MD), and highly degraded (HD), respectively.
| Category | Methanotrophs | ND | LD | MD | HD | p value |
| Type II methanotrophs | Beijerinckiaceae | 16.21 ± 4.06 b | 30.02 ± 2.34 ab | 38.85 ± 4.29 a | 32.17 ± 2.42 ab | < 0.001 |
| Methylocystaceae | 27.53 ± 12.95 a | 19.19 ± 5.67 a | 19.50 ± 1.71 a | 19.24 ± 3.53 a | 0.457 | |
| Type I methanotrophs | Methylococcaceae | 22.13 ± 13.11 a | 2.58 ± 0.86 ab | 2.38 ± 0.89 b | 1.74 ± 0.72 b | <0.01 |
| Verrucomicrobia | Verrucomicrobiaceae | 3.75 ± 1.01 a | 0.70 ± 0.25 b | 1.16 ± 0.20 b | 1.00 ± 0.47 b | <0.01 |
Disclaimer/Publisher’s Note: The statements, opinions and data contained in all publications are solely those of the individual author(s) and contributor(s) and not of MDPI and/or the editor(s). MDPI and/or the editor(s) disclaim responsibility for any injury to people or property resulting from any ideas, methods, instructions or products referred to in the content. |
© 2025 by the authors. Licensee MDPI, Basel, Switzerland. This article is an open access article distributed under the terms and conditions of the Creative Commons Attribution (CC BY) license (http://creativecommons.org/licenses/by/4.0/).
Copyright: This open access article is published under a Creative Commons CC BY 4.0 license, which permit the free download, distribution, and reuse, provided that the author and preprint are cited in any reuse.


