
Submitted:
23 March 2025
Posted:
24 March 2025
You are already at the latest version
Abstract
Political fragmentation in Africa lead to a significant challenge to effective governance and stability. Traditional measures of party system fragmentation, such as the Effective Number of Parties (ENP) index, often fail to capture the nuanced realities of African political landscapes, particularly the influence of dominant parties, fluid party affiliations, and the impact of ethnic and regional cleavages. To address these limitations, this paper introduces two novel, \emph{"apolitical"} or \emph{institutional} metrics for calculating the effective number of parties, focusing on geographical and demographic dimensions, including population size and land area. By integrating these local realities and ensuring a minimum threshold of two parties, the proposed models offer a simpler, more contextually relevant framework for understanding political dynamics in Africa, especially in data-scarce environments. This approach provides a valuable tool for analyzing and rationalizing political systems, with potential for broader application beyond the African context.
Keywords:
party system fragmentation
; effective number of parties
; apolitical index
; African political systems
; party dynamics
; data-scarce environments
1. Introduction
Political fragmentation [1] in Africa is a complex and multidimensional phenomenon characterized by the division of states into multiple political entities, often marked by ethnic, religious, regional, or ideological groups. While fragmentation remains moderate in Anglophone and Lusophone countries, it is more pronounced in Francophone countries, where a multitude of political parties intend to one day attain power. For instance, the Democratic Republic of Congo (DR Congo) holds the record among African countries in terms of the number of political parties, with a total of 910 according to the list of authorized political parties [2] operating in the Democratic Republic of Congo as of June 2023. However, some of these parties, although officially registered, lack significant presence or influence at the national level. While the multiplicity of parties is often seen as a sign of democracy, it leads to a dispersion of votes and difficulty in forming coherent majorities [3,4,5]. African political parties are generally fragile, with weak structures and programs, not representing mass movements, and suffering from a lack of stable organization as well as committed activists [6]. Moreover, many parties lack clear programs and are often centered around personalities rather than ideologies or public policies [7]. Bratton and van de Walle [8] emphasize that many parties in Africa are centered on personalities rather than ideologies, which limits their ability to effectively represent citizens. This situation weakens the capacity of states to address the needs of the population and implement structural reforms. Consequently, this excessive fragmentation of political parties in Africa is an obstacle to effective governance and political stability.
A limited and reasonable number of parties leads to a highly institutionalized system, promoting political stability and democratic development [9]. Institutionalization involves strong organizational structures, clear ideologies, and a consistent presence in the political arena, thereby contributing to the stability of the democratic process. A trivial approach to reduce the fragmentation of political systems would be to encourage their regrouping by regions or the geographical areas they represent or their ideologies [10]. In countries with strong regional divisions, parties could form regional coalitions rather than maintaining separate structures. This would reduce the number of parties while ensuring balanced regional representation. Additionally, requiring a significant presence in multiple regions for national recognition would prevent the creation of "Shop" parties representing only local or personal interests [11]. However, reducing the number of parties requires a robust methodological framework to quantify political fragmentation.
The effective number of parties (ENP) index, introduced by Laakso and Taagepera [12], has been a cornerstone in political science for measuring party system fragmentation. However, it faces several limitations, including exaggerated maximum fragmentation, inability to distinguish absolute dominance, sensitivity to small parties, and lack of ideological consideration. These shortcomings have led to a various alternatives and modifications to the original ENP formula. Many works [13,14,15,16,17,18] in this field has focused on refining the concept of ENP index and its calculation methods. They have emphasized the need to consider factors beyond votes and seats, such as legislative power, cabinet positions, and ideological similarities between parties. Some researchers have proposed new interpretations of the ENP, like Caulier’s[16] statistical framework linking it to party sizes through size-biased sampling. Others, like Grofman and Kline [17], have introduced measures to account for ideological groupings. Notable contributions to enhance ENP index include Golosov’s [19] new approach for fragmented and concentrated systems, Borooah’s [20] generalized entropy inequality indices, and Taagepera’s Seat Product Model [21]. Despite these advancements, debates continue on how to best represent party relevance and system fragmentation, particularly in single-party majority situations and highly fragmented systems.
Focusing solely on electoral systems can overlook other influential factors like social cleavages or political culture, while measures tailored to single-party majority situations may be less relevant in fragmented systems [22]. Moreover, no single index can fully encapsulate the intricacies of party systems, as the most suitable measure often hinges on specific research objectives, data accessibility, and contextual factors [22,23]. Researchers must consider whether their focus lies in analyzing bargaining power, vote distribution, or ideological diversity [23]. Additionally, the availability and reliability of data on coalition behavior, legislative influence, or ideological groupings play a crucial role in determining the most appropriate index [22,24]. Given these complexities, recent methods frequently employ multiple variants of the ENP index, including those based on votes, seats, and legislative power, to gain a more comprehensive understanding of party systems [22]. The political landscape, such as the degree of fragmentation, the maturity of democratic institutions, and the governmental structure, further influences the choice of measurement tool[23].
In many African countries, the conventional ENP models struggle to capture the nuanced realities of party systems [25]. Traditional measures like the Laakso–Taagepera index rely heavily on stable vote or seat shares, yet many African electoral environments are characterized by fluid party affiliations, shifting alliances, and even electoral irregularities. The political dynamics in these contexts often feature dominant parties that, while numerically few, exert disproportionate control through patronage networks and clientelist practices that these indices do not capture [3,6,11]. Moreover, electoral systems in Africa can be hybrid or evolving, leading to volatile outcomes that static models cannot accurately represent. Ethnic diversity and regional disparities further complicate the picture, as ENP models [16] may not capture the ethnic and regional cleavages that significantly influence political fragmentation in Africa. Moreover, the diverse electoral systems and regulatory frameworks for political parties can lead to unique party system dynamics that are not captured by models developed for different contexts. As example, since May 2020, Benin has reduced its political parties from over a hundred to thirteen (13) where existing models fails to capture. Furthermore, more advanced models that incorporate legislative power, ideological dimensions, or entropy-based measures face significant challenges in African settings. These approaches typically require detailed, reliable data on legislative behavior, coalition agreements, or voter distribution—data [15] that are often scarce or inconsistent in many African countries. Additionally, the underlying assumptions of stability and rational party competition in these models frequently do not hold in contexts where political identities and alliances are highly dynamic and influenced by non-institutional factors. As a result, the existing methods often fail to reflect the true complexity of party systems in Africa, necessitating the development of new, context-sensitive measurement tools [25]. Furthermore, these limitations underscore the need for more adaptable and integrated measures of ENP that can capture the complexity of political party systems across various contexts, especially in Africa.
To address these limitations, in this paper, we come up two innovative and alternative formulas for calculating the effective number of parties that are better suited to the realities of African political landscapes. These formulas are apolitical, meaning they do not depend on bargaining power, vote or seat distributions, and ideological diversity. Instead, our models focus solely on geographical and demographic dimensions, integrating local realities such as population size and land area to streamline the analysis of political landscapes. Designed to be both simple and effective, these models also incorporate a minimum threshold of two parties, reflecting the universal political reality, even in the least competitive environments. This approach represents a significant advancement over existing methodologies, offering a more nuanced and contextually relevant framework for understanding political dynamics. Our contributions can be summarized as follows:
- We introduce for the first time "apolitical" mathematical models, allowing to meaningfully calculate the effective number of political parties, especially adapted to the African context.
- Unlike approaches focused exclusively on institutions or electoral behaviors, our model directly integrates the combined effect of a country’s demography and geography.
- Our approaches, which are simple, universal and pragmatic, relies solely on local realities while ensuring a viable democratic principle, which makes it a valuable solution in the absence or insufficiency of institutional data.
- We propose a flexible and adaptable model, capable of reflecting varied contexts, such as large countries with low populations or small countries with high populations.
- Finally, although designed for the African context, our models are easily extensible to other regions of the world, offering a universal tool to analyze and rationalize political systems.
The remainder of this paper is organized as follows. Section 2 reviews the literature on metrics for measuring the effective number of political parties. In Section 3, we introduce our models and present the framework for estimating the effective number of political parties. Section 4 details our experimental study, evaluates the performance of our methods, and presents results from applying them to African countries. Finally, Section 5 concludes our work and outlines directions for future research.
2. Literature Review on Effective Number of Parties Models
The concept of the effective number of parties [12], introduced by Laakso and Taagepera in 1979, aims to quantify the number of competitive parties in an electoral system by considering their relative weight, that is, based on the proportion of seats or votes obtained by political parties. The formula is as follows:
where represents the proportion of seats or votes obtained by the i-th party and n is the number of parties.
Despite its widespread adoption, critiques soon emerged regarding its underlying assumptions and its applicability to various contexts—particularly in highly fragmented or very concentrated party systems. Several approaches have sought to generalize or formalize ENP using new equations and entropy-based models. Borooah et al [20,25] introduced a general measure using generalized entropy inequality indices, thereby encompassing existing measures (including Laakso–Taagepera) and allowing aggregation at the national level. This approach underscores how subjective considerations (e.g., which dimension of "effectiveness" one emphasizes) can substantially alter ENP values. similary, Bhattacharya and Smarandache [18] developed an entropic political equilibrium framework for multiparty democracies with "floating voters", suggesting that the level of uncertainty or dispersion among voters can be captured with an entropy-based ENP calculation. On the other hand, Golosov [19] introduced a new approach to the ENP calculation that addresses biases in highly fragmented or concentrated contexts, thereby refining the index’s performance across different electoral environments. This index assigns a reduced weight to smaller parties to limit their impact on the calculation of the effective number of parties. Its formula is as follows:
where represents the proportion of seats or votes obtained by the i-th party and is the largest party’s proportion of all votes or seats.
Although this method is effective in describing complex multiparty systems, it primarily focuses on "ex post" data (electoral results), which limits its usefulness for predicting the effects of institutional reforms or for emerging political systems, particularly in Africa.
Existing methods that focusing on raw votes or seats alone fails to capture true political influence [15]. Caulier and Dumont [16] extend the idea of relevant parties by integrating voting-power measures into ENP. Their work provides a more nuanced count that better reflects a party’s actual capacity to influence legislative or executive outcomes. Further, Blau et al [15] outlines how ENP can be measured at four scales—votes, seats, legislative power, and cabinet power—highlighting that large seat shares do not always translate into proportional policy influence. Because ENP is closely linked to how many parties "effectively" matter, other works also examine party system fragmentation and nationalization. Kselman and Powell [26] explore how party fragmentation can facilitate new party entry in established democracies, connecting these dynamics to observed ENP values. Golosov [27] places ENP within the broader context of party system nationalization, showing how territorial heterogeneity can influence fragmentation and the distribution of party support. Xhaferaj [28] applies the ENP concept to the Albanian party system, underscoring the importance of context-specific measures for newer democracies. Grofman and Kline [17] propose a measure of the ideologically cognizable number of parties, reflecting the degree to which parties can be grouped based on coherent policy or ideological positions.
Recently, the "Seat Product Model" [21], a mathematical model based on deductive principles, offered predictive and theoretical models that connect ENP to broader electoral system properties, such as district magnitude, mechanical effects of electoral rules, and heterogeneity of the electorate. This model predicts the effective number of parties in a legislature based on the district magnitude (M) and the size of the assembly (S):
This formula is based on the idea that partisan fragmentation depends on the permissiveness of the electoral system. It is notable for its simplicity and independence from social or behavioral variables, making it a universally applicable tool for institutional design. However, its limitations include the exclusion of complex (multi-level) systems and the inability to predict the number of parties receiving votes (). Li and Shugart [29] extend the Seat Product model to include multi-level electoral systems (with compensatory seats) and integrate data from elections in both established and emerging democracies. Their model retains Taagepera’s simple institutional structure while adding a corrective factor for complex systems, with the following formula:
where is an empirically determined constant related to the proportion of seats allocated at the upper level (t). represents the product of district magnitudes and the total size of base seats. They also demonstrate that adding social variables, such as ethnic diversity, only marginally improves prediction accuracy. Finally, they establish a relationship between et , showing that the gap between the two remains constant, enabling an indirect estimation of electoral fragmentation.
In summary, three major approaches have been widely used such as the Laakso-Taagepera index [12], the Golosov model [19], and the Seat Product Model by Taagepera [21]. The three models present complementary approaches for measuring and predicting the effective number of political parties. The Laakso-Taagepera model remains a benchmark for its simplicity, while Golosov provides a useful correction for highly concentrated systems. Finally, Taagepera’s "Seat Product" model offers a robust institutional perspective. However, gaps remain, particularly in accounting for behavioral dynamics and social cleavages. Integrating the strengths and limitations of these models could pave the way for more comprehensive tools for analyzing party systems.
3. Proposed Methods
Our approach introduces a novel method for calculating an effective number of parties based on two essential factors: population size and area of regions or countries. This method, which we call the Noua Index, aims to provide a more comprehensive understanding of party systems by incorporating demographic and geographic variables. We propose two models within the Noua Index framework: the hard model and the soft model. Both models ensure a minimum of two political parties (), reflecting the universal political reality that even the least competitive systems require some form of opposition.
Let P represent the population and A the area of a given country. We introduce adjustable constants and to weight the relative importance of population and area in determining the number of parties. Specifically, represents the number of inhabitants per political party, while represents the area per political party.
3.1. The Hard Model
The hard model calculates the effective number of parties using a logarithmic transformation of the population and area, ensuring a minimum of two parties. The hard model is defined by the following equation:
Where log denotes the natural logarithm.
For this model as the population is express in millions and area in thousands, we use and . When and , we refer to this variant as the Hard-Flex model which is suitable for non-Africa countries.
3.2. The Soft Model
The soft model, on the other hand, uses a linear combination of population and area to calculate the effective number of parties. The soft model is defined by the equation:
In this model, the parameters and are estimated using the Levenberg-Marquardt (LM) algorithm [30], which is a widely used optimization technique for solving non-linear least squares problems. The estimation of and is crucial for the accuracy of the soft model. LM is employed to minimize the error between the predicted and actual number of political parties. This algorithm iteratively adjusts the parameters to find the optimal values that best fit the data.
To ensure the accuracy of our prediction model for the optimal number of political parties, we estimated the parameters and using the Levenberg-Marquardt (LM) [30] algorithm. LM is employed to minimize the error between the predicted and actual number of political parties. This algorithm iteratively adjusts the parameters to find the optimal values that best fit the data.
3.2.1. Initial Parameter Estimation
We initialized the Optimization algorithm with empirically derived values for and using the averages of population, area, and ENP values from the Hard model. This intuition stems from the fact that and represent the number of inhabitants per political party and the area per political party, respectively. This estimation provides a relevant starting point for the algorithm.
Where represents the actual or observed number of political parties derived from the Hard model.
3.2.2. Optimization Process
The algorithm minimizes the sum of squared residuals between observed and predicted ENP values:
Where:
- is the observed ENP value for country i
- and are respectively the population in year 2023 and area of country i
- n is the total number of (officially constituted) countries which is 54 for Africa.
The optimization process iteratively adjusts and until convergence, defined as when the change in the sum of squared residuals between iterations falls below a predefined threshold ( 1e-6 for and 1e-4 for ). To ensure the robustness of our model, we run the algorithm twenty (20) times. The optimal values obtained are:
3.2.3. Innovative Approach to ENP Calculation: The Noua Index
Our models offer a unique approach to calculating the effective number of parties by incorporating population and area factors, which are not typically considered in traditional ENP [29] calculations. While established methods like the Laakso-Taagepera index focus on vote or seat shares, our Noua Index provides an alternative perspective based on demographic and geographic characteristics. The inclusion of a minimum threshold of two parties in both models reflects the practical reality of political systems, where even highly centralized governments typically face some form of opposition. This feature ensures that our models capture the essence of political competition, even in less diverse party systems.
By offering both a hard and soft model, our approach allows for flexibility in application. The hard model, with its logarithmic scale, may be more suitable for countries with extreme variations in population or area, while the soft model provides a more linear relationship between these factors and the ENP. The use of the Levenberg-Marquardt algorithm for parameter estimation in the soft model demonstrates a commitment to optimizing the model’s predictive power. This data-driven approach enhances the model’s reliability and potential for accurate predictions across diverse political landscapes.
4. Experiment Results
In this section, we provide the performance of our models where we carried out comprehensive experiments to calculate the effective number of parties. Both models are implemented in Python using Google Colab [31], running on a device equipped with an Intel Core i7-9750H CPU @2.6GHz and an NVIDIA GPU. We use the Levenberg-Marquardt algorithm from SciPy library [32] to determine and .
4.1. Dataset
This section describes the data sources, preparation steps, and final structure of the dataset used in this study. The data for African countries is extracted from the World Bank Group database [33], focusing solely on the 54 officially recognized African nations, including their area and population statistics. The population is measured in millions of inhabitants, and the area is expressed in square kilometers (km²). The dataset was derived from two CSV files containing population and area data for African countries. After importing the data, the two sources were merged into a single dataset, ensuring consistency and retaining only the relevant columns: country name, country code, population, and area. The country code was used to distinguish between countries like the two Congo and the three Guineas. We selected population data for the years 2014 to 2023 and categorized each country to their geographical region: Central Africa, East Africa, West Africa, North Africa, or Southern Africa. Additionally, we included regional economic communities, such as the Economic Community of West African States (ECOWAS) [34], the Economic Community of Central African States (ECCAS) [35], and the Alliance of Sahel States (AES) [36]. The final dataset provides a robust foundation for analyzing the relationship between population, area, and regional affiliation among African countries. Table 1 shows a sample of the final dataset while Figure 1 the distribution of the dataset.
4.2. Predicting the Effective Number of Parties
In this section, we evaluate our and models to estimate the effective number of political parties for each country in Africa. Figure 2 and Table 2 present both relational area/population) trends and differences between our two approaches. In Table 2, the last column represents the mean values of both models to have a net view of the ENP for a given country. In Figure 2, counties are sort first by area and then a population to demonstrate a visual comparison and the relational distribution of our indexes which facilitates the identification of geographical and demographic factor relation and country-specific variations in the relationship between and methods. In general, we observed that in the figure there are noticeable spikes in each region where these spikes occur in the largest countries in terms of area and population for both models. In the same time, countries with small size in population and area have the lowest values of ENP.
4.2.1. Observations on the Hard Model
The Hard Index for effective number of parties, displayed in Figure 2 and Table 2, reveals significant variation across African countries. Small island nations with both low populations and small areas, such as Seychelles, Sao Tome and Principe, Comoros, Mauritius, and Cape Verde, consistently exhibit the minimum value of 2.00. Conversely, countries with large populations and/or areas tend to have higher scores. Nigeria, with the largest population and a substantial area, exemplifies this trend with a higher value of 12.26. However, the relationship between population/area and the Hard Index isn’t perfectly linear. While both factors contribute, their impact diminishes logarithmically, meaning that increases in either variable yield progressively smaller increases in the index. For example, while Algeria, DR Congo, and Sudan all have very large areas, DR Congo’s exceptionally large population helps it achieve the highest score (12.42). No other country exceeds this value, attributable to DR Congo’s combination of over 100 million people and over 2 million square kilometers. A cluster of countries, including larger nations such as Sudan, Egypt, South Africa, Ethiopia, and Tanzania, show relatively high Hard Index values, generally exceeding 11. This suggests that while these countries may have large areas than Nigeria, their substantial populations contribute to significant lower their ENP. Other countries, particularly those in Central and West Africa, display intermediate values between 3 and 10, reflecting their relative area/populations size.
4.2.2. Observations on the Soft Model
The Soft Index, shows a distinct pattern compared to the Hard Index. A significant number of countries cluster at the lower end of the spectrum, with Soft Index values around 2.00. This group includes small island nations like Seychelles, São Tomé and Príncipe, Comoros, Mauritius, and Cape Verde, as well as larger countries such as Gambia, Eswatini, Djibouti, Rwanda, Equatorial Guinea, Lesotho, Guinea-Bissau, Togo, Sierra Leone, Liberia, Benin, Eritrea, Malawi, and Tunisia. Other countries with relatively low Soft Index values (below 5.00) include Senegal, Guinea, Congo, Burkina Faso, Ghana, Zimbabwe, Côte d’Ivoire, Uganda, Botswana, the Central African Republic, Cameroon, and South Sudan. This clustering at the lower end suggests that the Soft Index is less sensitive to variations in area size and population. In contrast, the highest Soft Index scores (above 10.00) are primarily found in larger, more populous countries such as the Democratic Republic of Congo, Algeria, Nigeria, Sudan, Ethiopia, Libya, Egypt, and South Africa. Notably, the Democratic Republic of Congo holds the highest value at 20.21. With the exception of South Africa, these values exceed those of the Hard Index. The remaining countries fall within an intermediate range of 5.00 to 10.00.
Overall, the Soft Index exhibits a weaker correlation with small and medium-sized countries in terms of area and population compared to the Hard Index. However, for larger countries with greater area and population, the Soft Index tends to yield higher values than the Hard Index. This underscores the importance of considering a broader set of factors when analyzing party system fragmentation in African countries.
4.2.3. Comparison of Hard and Soft Models
Comparing both models, it’s clear that while both exhibit a generally increasing trend, the Soft index has the higher ENP than the "Hard" model. Based on the results from both models, the Hard Index serves as a more nuanced and responsive indicator of factors related to population and area, capturing a wider range of values across countries. This suggests that it incorporates subtle aspects of these variables effectively. In contrast, the Soft Index act as threshold-based indicator, highlighting countries with significant population and area sizes. It more implies that countries with larger areas and populations should have more political parties compared to those with smaller or moderate sizes. In terms of specific country observations, the Democratic Republic of Congo exhibits the highest Effective Number of Parties, followed by Nigeria, Algeria, Sudan, Ethiopia, Egypt, and South Africa, which also show relatively high ENP values. Conversely, Seychelles, Sao Tome and Principe, Comoros, Mauritius, and Cape Verde are notable for having the lowest ENP.
In summary, based on both models, we can categorize the political landscape in Africa into two groups such as the Two-party system and the multiparty system. We suggest that Seychelles, Sao Tome and Principe, Comoros, Mauritius, and Cape Verde should have the two-party system. In addition, based on the mean values of both models, we suggest that for a given country, the ENP should not exceed 20. Moreover, the political landscape can be categorized into three levels of Effective Number of Parties based on the results from both models:
- Low: ENP values less or equal than 5 ().
- Medium: ENP values ranging from greater than 5 to 10 ().
- High: ENP values greater than 10 ().
4.2.4. Temporal Dynamics: How Changes in Population and Land Area over Time Affect the ENP
Figure 3 and Figure 4 illustrate the effective number of political parties in various African countries for the years 2014 and 2023. These comparisons aim to reveal how the hard and soft models’ trends behave over a 10-year interval, considering static land area and population growth. In Figure 3, the Hard index reveals that most countries experienced a slight increase in the effective number of parties from 2014 to 2023, highlighting the stability of the Hard model. However, some countries, such as Seychelles, Sao Tome and Principe, Comoros, Mauritius, and Cape Verde, consistently maintained a low ENP of 2, showing no variation over the decade. This suggests that population growth has minimal impact on the political landscape in these nations. In contrast, Figure 4 demonstrates a clear distinction between two groups of countries. One group, including Seychelles, Sao Tome and Principe, Comoros, Mauritius, Cape Verde, Gambia, Eswatini, Djibouti, Rwanda, Equatorial Guinea, Lesotho, Guineau-Bissau, Togo, Sierra Leone, Liberia, Benin, Eritrea, Malawi and Tunisia maintained a consistently low ENP of 2 with no change over the decade. The other group exhibited ENP values greater than 2 and greater variability, with a slight overall increase from 2014 to 2023. This pattern suggests that the soft model also demonstrates stability, over a decade.
4.3. Flexibility of Our Soft Model
Our soft model demonstrates great flexibility, allowing each country to define its context by adjusting the values of and to obtain the effective number of political parties that corresponds to its situation. The results presented here do not include the optimal NEP values for each country, as presented earlier, but instead highlight the political dynamics specific to each country. In this section, we focus on certain countries in West and Central Africa, regions characterized by particularly high political fragmentation. The values of and used are calculated at the continental level, though they can also be adjusted for regional or community scales according to the needs of the analysis. This flexible approach allows for a nuanced analysis of party systems, taking into account local specificities while providing a comparative basis at the continental level. The Table 3 below presents different values of and , calculated from descriptive statistics (mean and quartiles) of the population and area data for African countries. Quartiles are statistical measures that divide a dataset into four equal parts. They help to understand the distribution of the data by identifying key points. The Q1, also called the first quartile, represents the value below which 25% of the data falls. The Q2, or median, divides the data into two equal parts, indicating the central value predicted by the model. The Q3, or third quartile, represents the value below which 75% of the data falls. These values help to understand how the values of and influence the distribution of the ENP.
The results are showing in the following sections where for each country, each cell in the heatmap represents the effective number of parties for a specific combination of and values.
4.3.1. Effective Number of Political Parties in West Africa
Case of AES Countries
Figure 5 presents the results for the three countries of the AES and shows significant variability in the effective number of political parties. The results of Burkina Faso is illustrated in Figure 5(a) where we have a broader range of values. Notably, consistently low ENP values around 2.0 are observed when either k1 or k2, or both, are set to Mean, Q3, or Q3div2, indicating minimal party system fragmentation under these conditions. In contrast, moderate ENP values (5-12) arise when one parameter is Q1, and the other is Q1 or Q1div2, reflecting a more pronounced, though not extreme, level of fragmentation. The highest ENP value (16.5) emerges when k1 is Q1 and k2 is Q1div2. This specific combination signals a substantial increase in party system fragmentation, suggesting that the interplay between the lower quartile and half of the lower quartile plays a pivotal role in promoting party diversity and competition within the analyzed parameter space. The data highlights the sensitivity of ENP to parameter choices and underscores the importance of considering these interactions when assessing party system dynamics.
Figure 5(b) shows the ENP of Mali where low ENP values, ranging roughly from 2.1 to 6.1, are generally observed when k1 is set to Mean, Q2, Q2div2, Q3, or Q3div2, irrespective of the k2 value. This indicates that under these conditions, the party system tends to be less fragmented. The lowest ENP values occur when k1 is Q3 or Q3div2 regardless of the value of K2. The highest ENP values, ranging from 16.8 to 19.1, are prominently clustered when k1 is Q1div2, indicating a strong positive influence on party system fragmentation when this parameter is activated. The very highest ENP value (19.1) is attained when k1 is Q1div2 and k2 is Q2, suggesting a notable interplay between half the lower quartile and the median in shaping the competitive landscape of Malian political parties. Additionally, ENP values between 9.1 and 11.4 are observed when k1 is Q1, revealing a moderate level of fragmentation compared to the extremes.
The Figure 5(c) for Niger visualizes the relationship between different combinations of k1 and k2 and their impact on the Effective Number of Parties (ENP). Generally, low ENP values occur when k1 is Mean, Q3, or Q3div2, irrespective of the k2 value. The lowest ENP values are consistently found when k1 or k2 are equal to Q3 (reaching as low as 2.2 when both are Q3), suggesting minimal party system fragmentation under these conditions. The highest ENP value (16.1) is attained when k1 is Q1 and k2 is Q2div2, which is significantly higher than other combinations and shows a high level of party fragmentation when Q1 is combined with Q2div2. Also noteworthy are the moderate ENP values, typically ranging from 9 to 12, observed when k1 is Q1 combined with other k2 values. These moderate values suggest that the lower quartile contributes to a more fragmented party system, though not as extremely as the Q1 and Q2div2 combination.
Case of ECOWAS Countries
The analysis of the effective number of political parties in the countries of the Economic Community of West African States (ECOWAS) reveals varied trends across the different countries as showing in Figure 6 where we present the results for three countries such as Benin, Senegal and Togo.
The Figure 6(a) for Benin illustrates that lower ENP values are generally observed when k1 is Q1 or Q2div2. The lowest ENP values are consistently found when k1 is Q2div2, irrespective of k2 (ranging from 2.2 to 5.8), suggesting a less fragmented party system under these conditions. In contrast, when k1 is Q1 and k2 is the mean, Q1, Q1div2, and Q2, the ENP values ranges from 4.8 to 8.4. The highest ENP value (12.9) is attained when k1 is Q1div2 and k2 is Q1div2, indicating a notable increase in party system fragmentation in this specific parameter configuration. The moderate ENP values, ranging from 9.3 to 11.0, are observed when k1 is Q1div2 combined with either the Mean or Q1 for k2. These moderate values, along with the high value, suggests a significant shift in the dynamics of Benin’s party system under these parameters.
The ENP landscape of Senegal is visualized in Figure 6(b). It’s clear that that when k1 is Mean, Q2, Q3, or Q3div2, the ENP values are generally low, typically remaining at or below 7.8. Notably, the absolute minimum ENP values are observed when either k1 or k2 are Q3, with the lowest value of 2.0 occurring when k1 is Q3 and k2 is Mean, Q2, Q3, or Q3div2. This suggests a more consolidated party system under these conditions. Conversely, a significant increase in ENP values is evident when k1 is Q1 or Q1div2. The highest ENP values, ranging from 11.9 to 18.2, are achieved when k1 is Q1div2. Specifically, the peak ENP value of 18.2 arises when k1 is Q1div2 and k2 is Q1div2. This indicates that half the first quartile combined with the second quartile is most strongly associated with greater party system fragmentation in Senegal. When k1 is Q1, depending on the k2 value, ENP ranges from 6.1 to 15.0.
Figure 6(c) visualizes the impact of different k1 and k2 combinations on ENP in Togo. When k1 is Q1, the ENP values are consistently low, ranging from 3.1 to 4.9, irrespective of the k2 value. The lowest ENP values in this state are observed when k2 is Mean, Q3 or Q3div2 with ENP values around 3.1, suggesting minimal party fragmentation when Q1 is paired with these conditions. In contrast, when k1 is Q1div2, ENP values are generally higher, ranging from 6.1 to 7.9. The peak ENP value (7.9) occurs when k2 is Q1div2 indicating a relatively high degree of party system fragmentation when both k1 and k2 are Q1div2. Moderate ENP values, around 6.1 to 6.4, occur with various other k2 values (Mean, Q2, Q2div2, Q3, Q3div2), indicating that Q1div2 contributes more significantly to party fragmentation than Q1.
4.3.2. Effective Number of Political Parties for Central Africa Countries
In this section, we analyze the effective number of political parties in three member countries of the Economic Community of Central African States: Cameroon, Chad, and the Democratic Republic of Congo, as presented in Figure 7.
The ENP in the landscape of Chad is showing in Figure 7(a). There, we can see that, when k1 is Mean, Q2, Q3 or Q3div2 ENP values are notably low, generally remaining below 6.6. In particular, the lowest ENP values are observed when either k1 or k2 are Q3, with the absolute minimum occurring when k1 is Q3 and k2 is Q3 at an ENP of 2.0. This suggests a fairly consolidated party system under these conditions. Conversely, a clear increase in ENP values is observed when k1 is Q1 or Q1div2. The highest ENP values, ranging from 13.9 to 16.4, are achieved when k1 is Q1div2. The peak ENP value (16.4) specifically arises when k1 is Q1div2 and k2 is Q2, signifying that half the first quartile combined with the second quartile is most strongly associated with greater party system fragmentation in Chad. When k1 is Q1, depending on the k2 value, ENP ranges from 7.7 to 10.1.
The Cameroon results in Figure 7(b) demontrates that lower ENP values (generally below 7) are observed when k2 is either Q2, Q2div2, Q3 or Q3div2 and when k1 is Mean, the lowest ENP values occur at Q3 (2.0). A similar trend of low ENP can be seen throughout Q3 and Q3div2 for k1, with values rarely exceeding 5. The lowest ENP value in the matrix is 2.0, occurring when k1 and k2 are Q3. This signifies a relatively consolidated party system under these conditions. The highest ENP values (16.6 - 19.7) are clustered when k2 is Q1div2 and k1 is Q2div2 (19.7), indicating that the configuration with k1 as Q2div2 exhibits the highest level of party fragmentation. Also noteworthy are the high ENP values when k2 is Q1div2 and k1 is Mean, Q2, Q3 or Q3div2 which all demonstrate a significant presence of diverse parties. This points to Q1div2 as a parameter that significantly influences party system fragmentation in Cameroon, especially in combination with Q2div2.
The Democratic Republic of Congo results is displayed in Figure 7(c) where relatively low ENP values are seen when k1 is Mean or Q3, particularly when paired with k2 values of Mean, Q3 or Q3div2. Specifically, the lowest ENP observed is 5.8 when k1 is Q3 and k2 is Q3, indicating limited party system fragmentation under these conditions. In general, when k1 is Q3, ENP is low and similar irrespective of the value of K2. The highest ENP value (14.5) is achieved when k1 is Q2 and k2 is Q2, suggesting a peak in party system fragmentation under this specific parameter combination. Moreover, when k1 is Q3div2, ENP values consistently range from 10.6 to 13.5, suggesting a more fragmented landscape compared to when k1 is Mean or Q3. These elevated values suggest that the interplay between the median and half the third quartile plays a significant role in shaping the diversity and competitiveness of political parties in the DR Congo.
4.4. Comparison with State-of-the-Art Methods
We compare our models with state-of-the-art methods, including the Laakso index [12], Golosov index [19], and the Seat Product [21]. Table 4 presents the comparative results of our models and these existing methods for predicting the effective number of parties. As shown in the table, existing methods lack values for countries like Eritrea, Libya, Somalia, and Eswatini due to the absence of elections or missing data. In contrast, the Noua indexes, which do not rely on institutional parameters, provide ENP values for these countries, demonstrating the advantage of using an institutional-free index like the Noua indexes.
The Laakso and Golosov indices often classify countries with medium-sized (e.g., Ghana, Congo) and larger size (e.g., Ethiopia, Sudan, South Sudan) as single-party systems, a tendency that is more pronounced for the Golosov index. This classification is inconsistent with the official political structures of these countries, as none of them formally declare themselves as single-party states. This discrepancy raises significant questions about the accuracy and reliability of these indices in capturing the true nature of party systems, particularly in contexts where political dynamics are complex or electoral competition is limited. Additionally, the Laakso and Golosov indices produce inconsistent results, such as the exceptionally high values for the Democratic Republic of the Congo (34.08 and 36.67, respectively), which are significantly higher than the second-highest value of 6.94. Meanwhile, the Seat Product generally yields lower ENP values compared to the Noua indexes and fails to provide data in cases of missing information, such as in countries without functioning electoral systems or reliable institutional data. This highlights the limitations of relying solely on institutional parameters like vote and seat shares, which may not fully reflect the political realities in certain contexts.
In summary, traditional methods like the Laakso and Golosov indices and the Seat Product are limited to countries with functioning electoral systems and cannot accurately capture party system fragmentation in contexts where elections are absent or heavily controlled. These methods rely on institutional data (e.g., vote and seat shares), which are often contested by opposition groups, further undermining their reliability in certain political environments.
5. Conclusion and Future Work
In this study, we introduced a structured approach to rationalize the political landscape in Africa by integrating geographical and demographic factors, specifically population size and land area. Our model, the Noua Index "an apolitical measure", effectively calculates an adjusted effective number of political parties using a formula that balances these factors with adjustable constants k1 and k2. This approach ensures a minimum of two political parties, reflecting the universal need for political opposition. The model’s flexibility allows for the adjustment of key parameters (k1 and k2) to predict the ENP for various African countries. The results demonstrated that our model effectively captures the diversity of political landscapes across Africa, with higher ENP values observed in larger and more populous countries, and lower values in smaller nations. Our analysis revealed significant variability in the ENP across different African countries, highlighting the impact of geographical and demographic factors on political fragmentation. The heatmaps for various countries demonstrated how different combinations of and influence the ENP, with the highest values often occurring when these parameters are aligned at specific quartiles.
Our work establishes a solid foundation for discussions regarding the rationalization of the number of political parties in Africa. While this project does not prescribe how this reduction should occur, nor which parties should remain, it sets the stage for exploring the policy implications of achieving an optimal Effective Number of Parties in each country. Such insights could inform governance strategies aimed at balancing political representation and stability. In our future work, we will explore the mechanisms for achieving this rationalization by proposing merger and cooperation scenarios among existing political parties within each country. We believe that fostering the fusion or cooperation of political parties with similar visions can contribute to more streamlined political landscapes and more stable, effective democratic systems. Although the current study focuses on African countries, the Noua Indexes can be adapted and applied to other regions globally by adjusting the model’s parameters and incorporating region-specific variables.
Author Contributions
Conceptualization, A. Nouboukpo.; Methodology, A. Nouboukpo.; Software, A. Nouboukpo. and K. M. Aladji; Investigation, A. Nouboukpo.; Writing—original draft, A. Nouboukpo.; Writing—review & editing, K. M. Aladji and B. Muktar. All authors have read and agreed to the published version of the manuscript.
Funding
This research received no external funding.
Data Availability Statement
The dataset used in this study is available on the World Bank Group website at https://databank.worldbank.org/source/world-development-indicators under a Creative Commons Attribution 4.0 International License (CC BY 4.0), accessed on 30 January 2025.
Conflicts of Interest
The authors declare no conflicts of interest.
References
- Ricciuti, R. Political fragmentation and fiscal outcomes. Public choice 2004, 118, 365–388. [CrossRef]
- CENI-RDC. Commission Électorale Nationale Indépendante. Accessed: 2025-02-16.
- Koffi, A.D.; Agbetoézian, A.K. Élections en Afrique: enjeux démocratiques et quête de sens. Revue ACAREF - ACADEMIE AFRICAINE DE RECHERCHE ET D’ETUDES FRANCOPHONES 2021.
- Tine, A. Le Sénégal, sous Senghor et Diouf, une démocratie buissonnière?: une critique du pluralisme des partis politiques; L’Harmattan Sénégal, 2017.
- Stoner, K.; McFaul, M. Transitions to democracy: a comparative perspective; JHU Press, 2013.
- Erdmann, G.; Basedau, M. Party systems in Africa: Problems of categorising and explaining party systems. Journal of Contemporary African Studies 2008, 26, 241–258. [CrossRef]
- Osei, A. La connexion entre les partis et les électeurs en Afrique : le cas Ghanéen. Politique africaine 2006, 104, 38–60. [CrossRef]
- Bratton, M.; de Walle, N.V. Democratic Experiments in Africa: Regime Transitions in Comparative Perspective; Cambridge University Press: Cambridge, UK, 1997.
- Daddieh, C.K.; Bob-Milliar, G.M., Ghana: The African Exemplar of an Institutionalized Two-Party System? In Party Systems and Democracy in Africa; Palgrave Macmillan, London, 2014; p. 107–128. [CrossRef]
- Collier, P. Wars, guns and votes: Democracy in dangerous places; Random House, 2009.
- Bayart, J.F. The State in Africa: the politics of the belly; Wiley, 2009.
- Laakso, M.; Taagepera, R. Effective number of parties: a measure with application to West Europe. Comparative political studies 1979, 12, 3–27. [CrossRef]
- Taagepera, R.; Grofman, B. Rethinking Duverger’s law: predicting the effective number of parties in plurality and PR systems–parties minus issues equals one. European Journal of Political Research 1985, 13, 341–352. [CrossRef]
- Taagepera, R.; Shugart, M.S. Predicting the number of parties: A quantitative model of Duverger’s mechanical effect. American Political Science Review 1993, 87, 455–464. [CrossRef]
- Blau, A. The effective number of parties at four scales: Votes, seats, legislative power and cabinet power. Party politics 2008, 14, 167–187. [CrossRef]
- Caulier, J.F.; Dumont, P. The effective number of relevant parties: how voting power improves Laakso-Taagepera’s index. Munich Personal RePEc Archive 2005.
- Grofman, B.; Kline, R. How many political parties are there, really? A new measure of the ideologically cognizable number of parties/party groupings. Party Politics 2012, 18, 523–544. [CrossRef]
- Bhattacharya, S.; Smarandache, F. Effective Number of Parties in A Multi-Party Democracy Under an Entropic Political Equilibrium with Floating Voters. Case 1: Shock size 50% of Y0 2006, p. 62.
- Golosov, G.V. The effective number of parties: A new approach. Party politics 2010, 16, 171–192. [CrossRef]
- Borooah, V.K. A general measure of the ‘effective’number of parties in a political system. In Constitutional economics and public institutions; Edward Elgar Publishing, 2013; pp. 146–159. [CrossRef]
- Taagepera, R. Predicting party sizes: The logic of simple electoral systems; OUP Oxford, 2007.
- Raymond, C.D.; Huelshoff, M.; Rosenblum, M.R. Electoral systems, ethnic cleavages and experience with democracy. International Political Science Review 2016, 37, 550–566. [CrossRef]
- Wolff, S. Electoral systems design and power-sharing regimes. Powersharing: New Challenges for Divided Societies 2005, pp. 59–74.
- Hazama, Y. Social cleavages and electoral support in Turkey: Toward convergence? The Developing Economies 2003, 41, 362–387. [CrossRef]
- Bogaards, M. Counting parties and identifying dominant party systems in Africa. European journal of political research 2004, 43, 173–197. [CrossRef]
- Kselman, D.M.; Powell, E.N.; Tucker, J.A. Crowded space, fertile ground: party entry and the effective number of parties. Political Science Research and Methods 2016, 4, 317–342. [CrossRef]
- Golosov, G.V. The Number of Parties and Party System Nationalization in an Integrated Analytical Framework. comparative sociology 2015, 14, 662–681. [CrossRef]
- Xhaferaj, A. Which Parties Count?-The Effective Number of Parties in the Albanian Party System. Philpapers 2014.
- Li, Y.; Shugart, M.S. The Seat Product Model of the effective number of parties: A case for applied political science. Electoral Studies 2016, 41, 23–34. [CrossRef]
- Ranganathan, A. The levenberg-marquardt algorithm. Tutoral on LM algorithm 2004, 11, 101–110.
- Google. Google Colaboratory. Accessed: February 27, 2025.
- SciPy. Scipy optimize: Least squares Algorithm. Accessed: February 27, 2025.
- Group, W.B. DataBank, World Development Indicators, 2025. Accessed: 2025-01-30.
- ECOWAS. Economic Community of West African States. Accessed: 2025-02-16.
- ECCAS. Economic Community of Central African States . Accessed: 2025-02-16.
- AES. Confederation of Sahel States. Accessed: 2025-02-16.
Figure 1.
Population vs. Area of African Countries
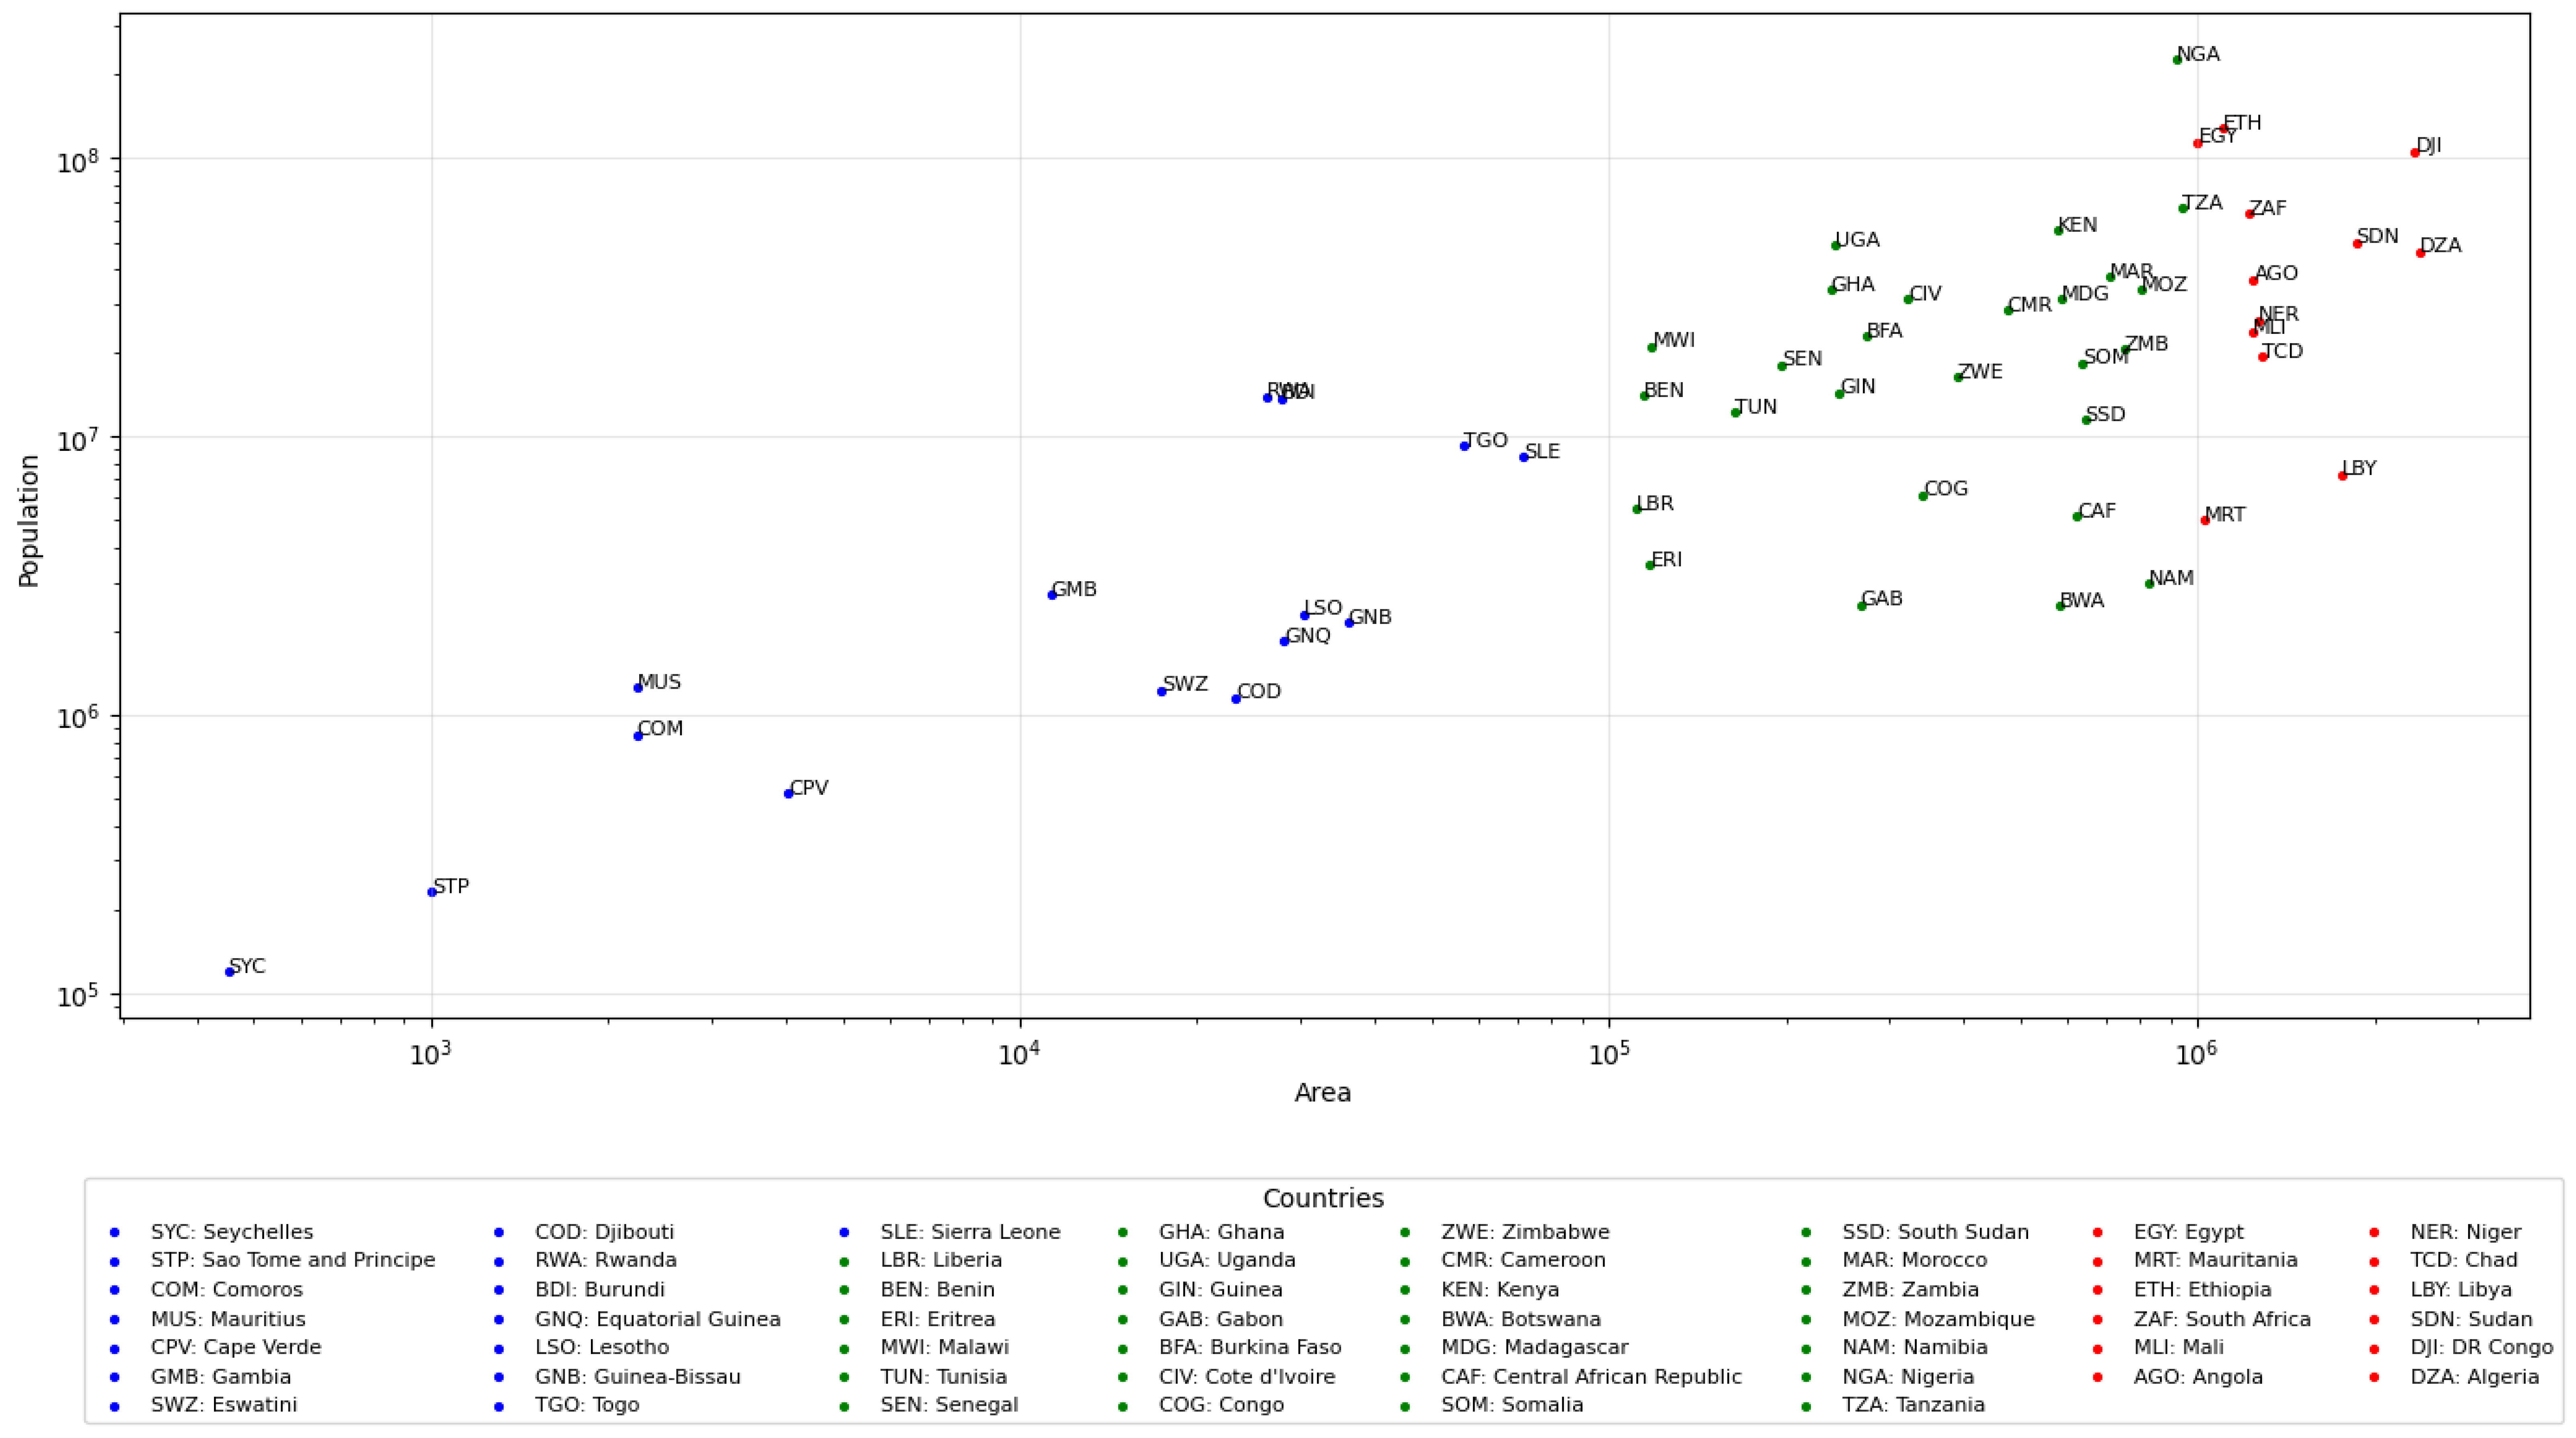
Figure 2.
Comparison of the effective number of parties between Hard and Soft Index across different countries
Figure 2.
Comparison of the effective number of parties between Hard and Soft Index across different countries
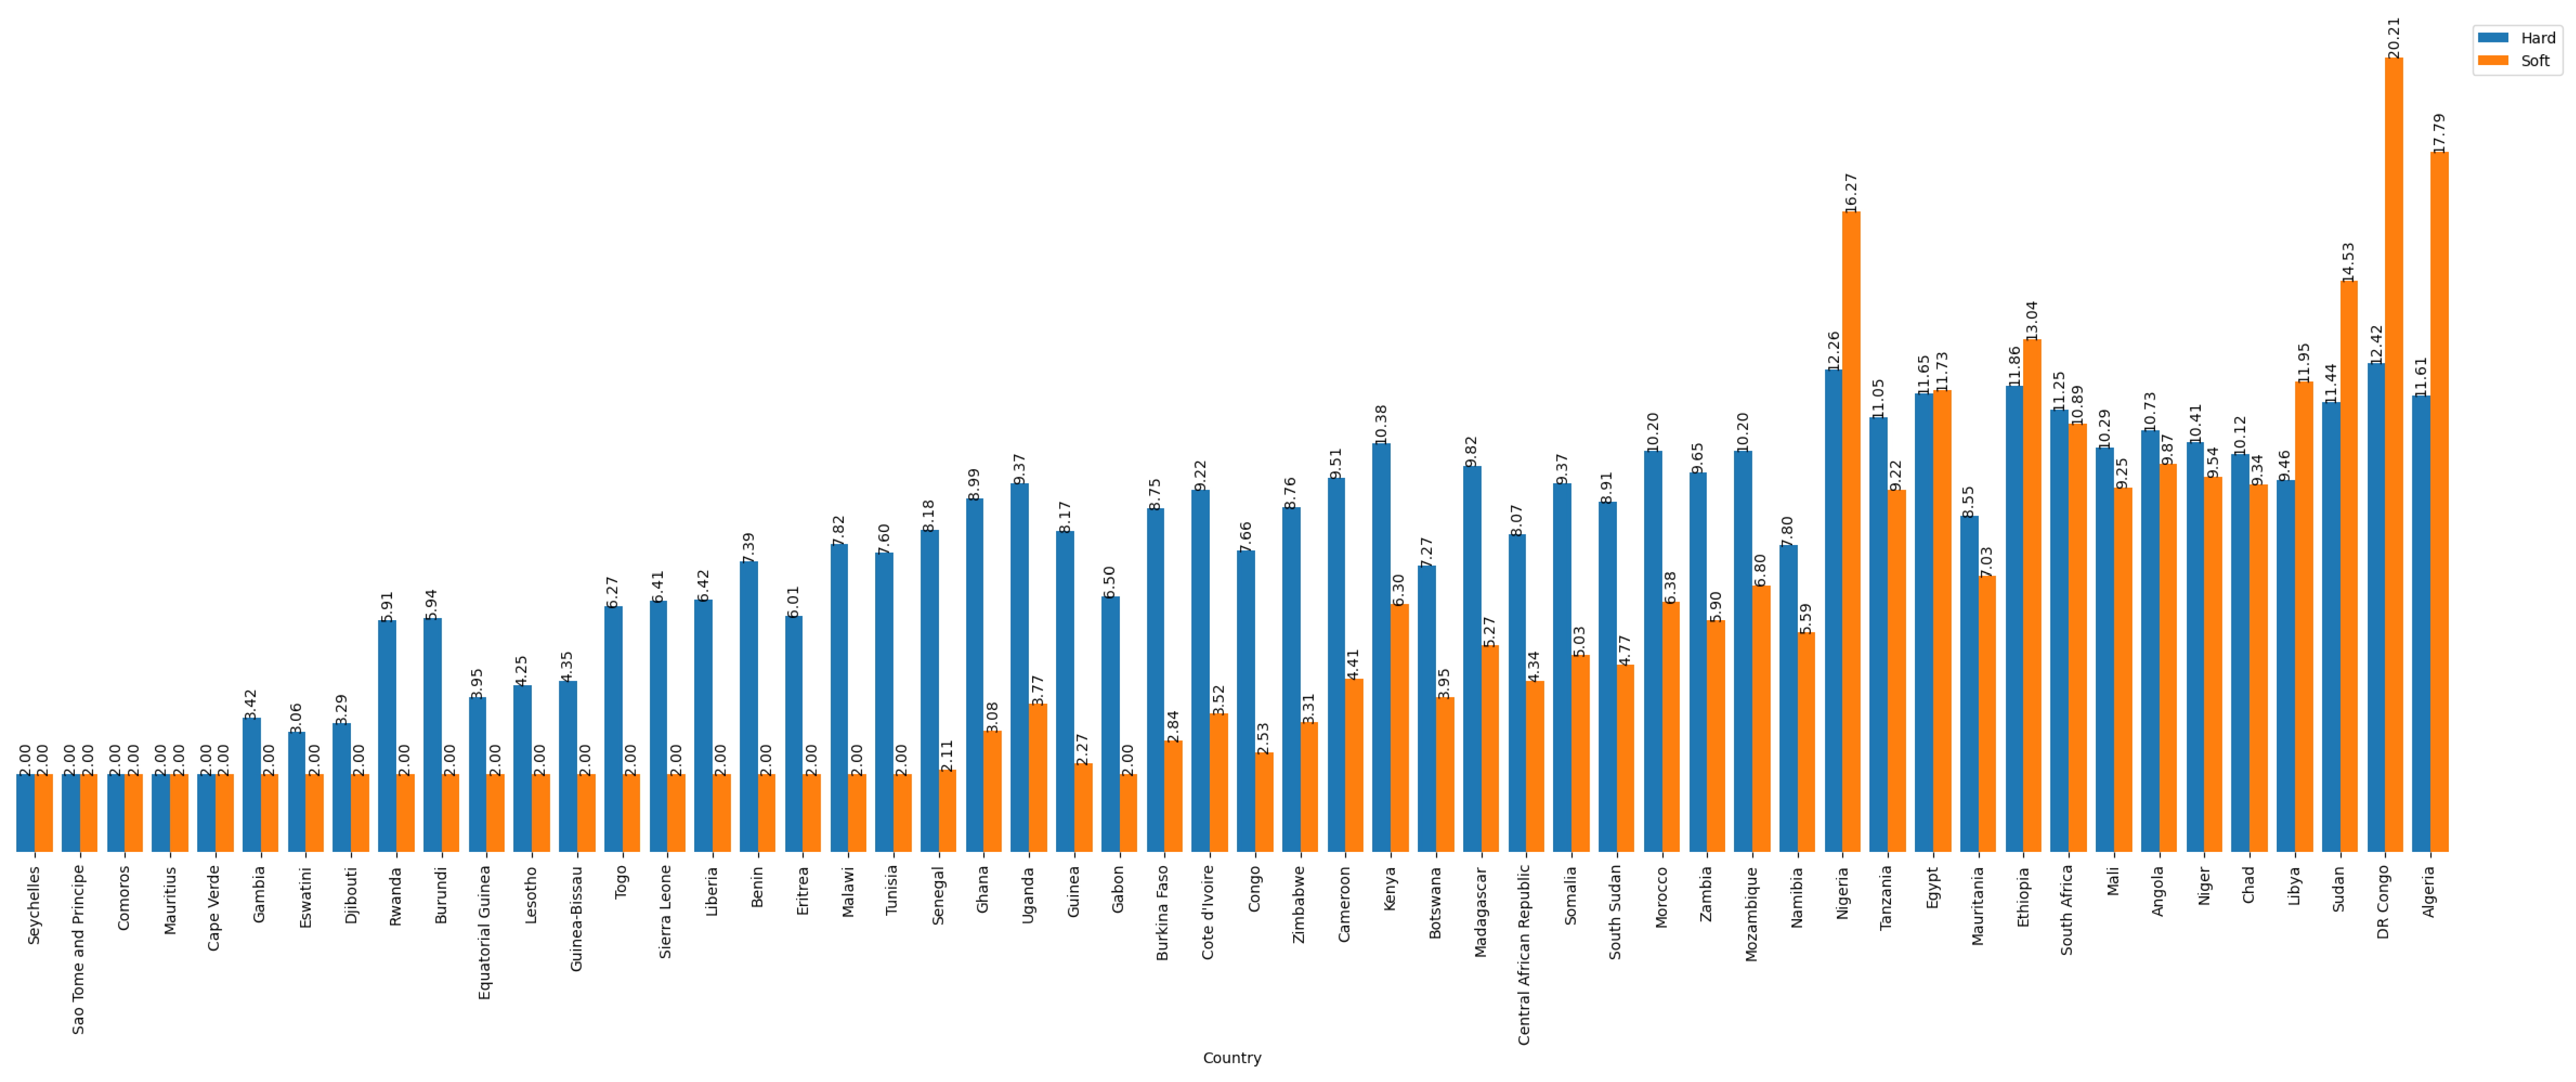
Figure 3.
Party Systems Trends in Africa using Hard Index: Examining the shift in the effective number of political parties from 2014 to 2023.
Figure 3.
Party Systems Trends in Africa using Hard Index: Examining the shift in the effective number of political parties from 2014 to 2023.
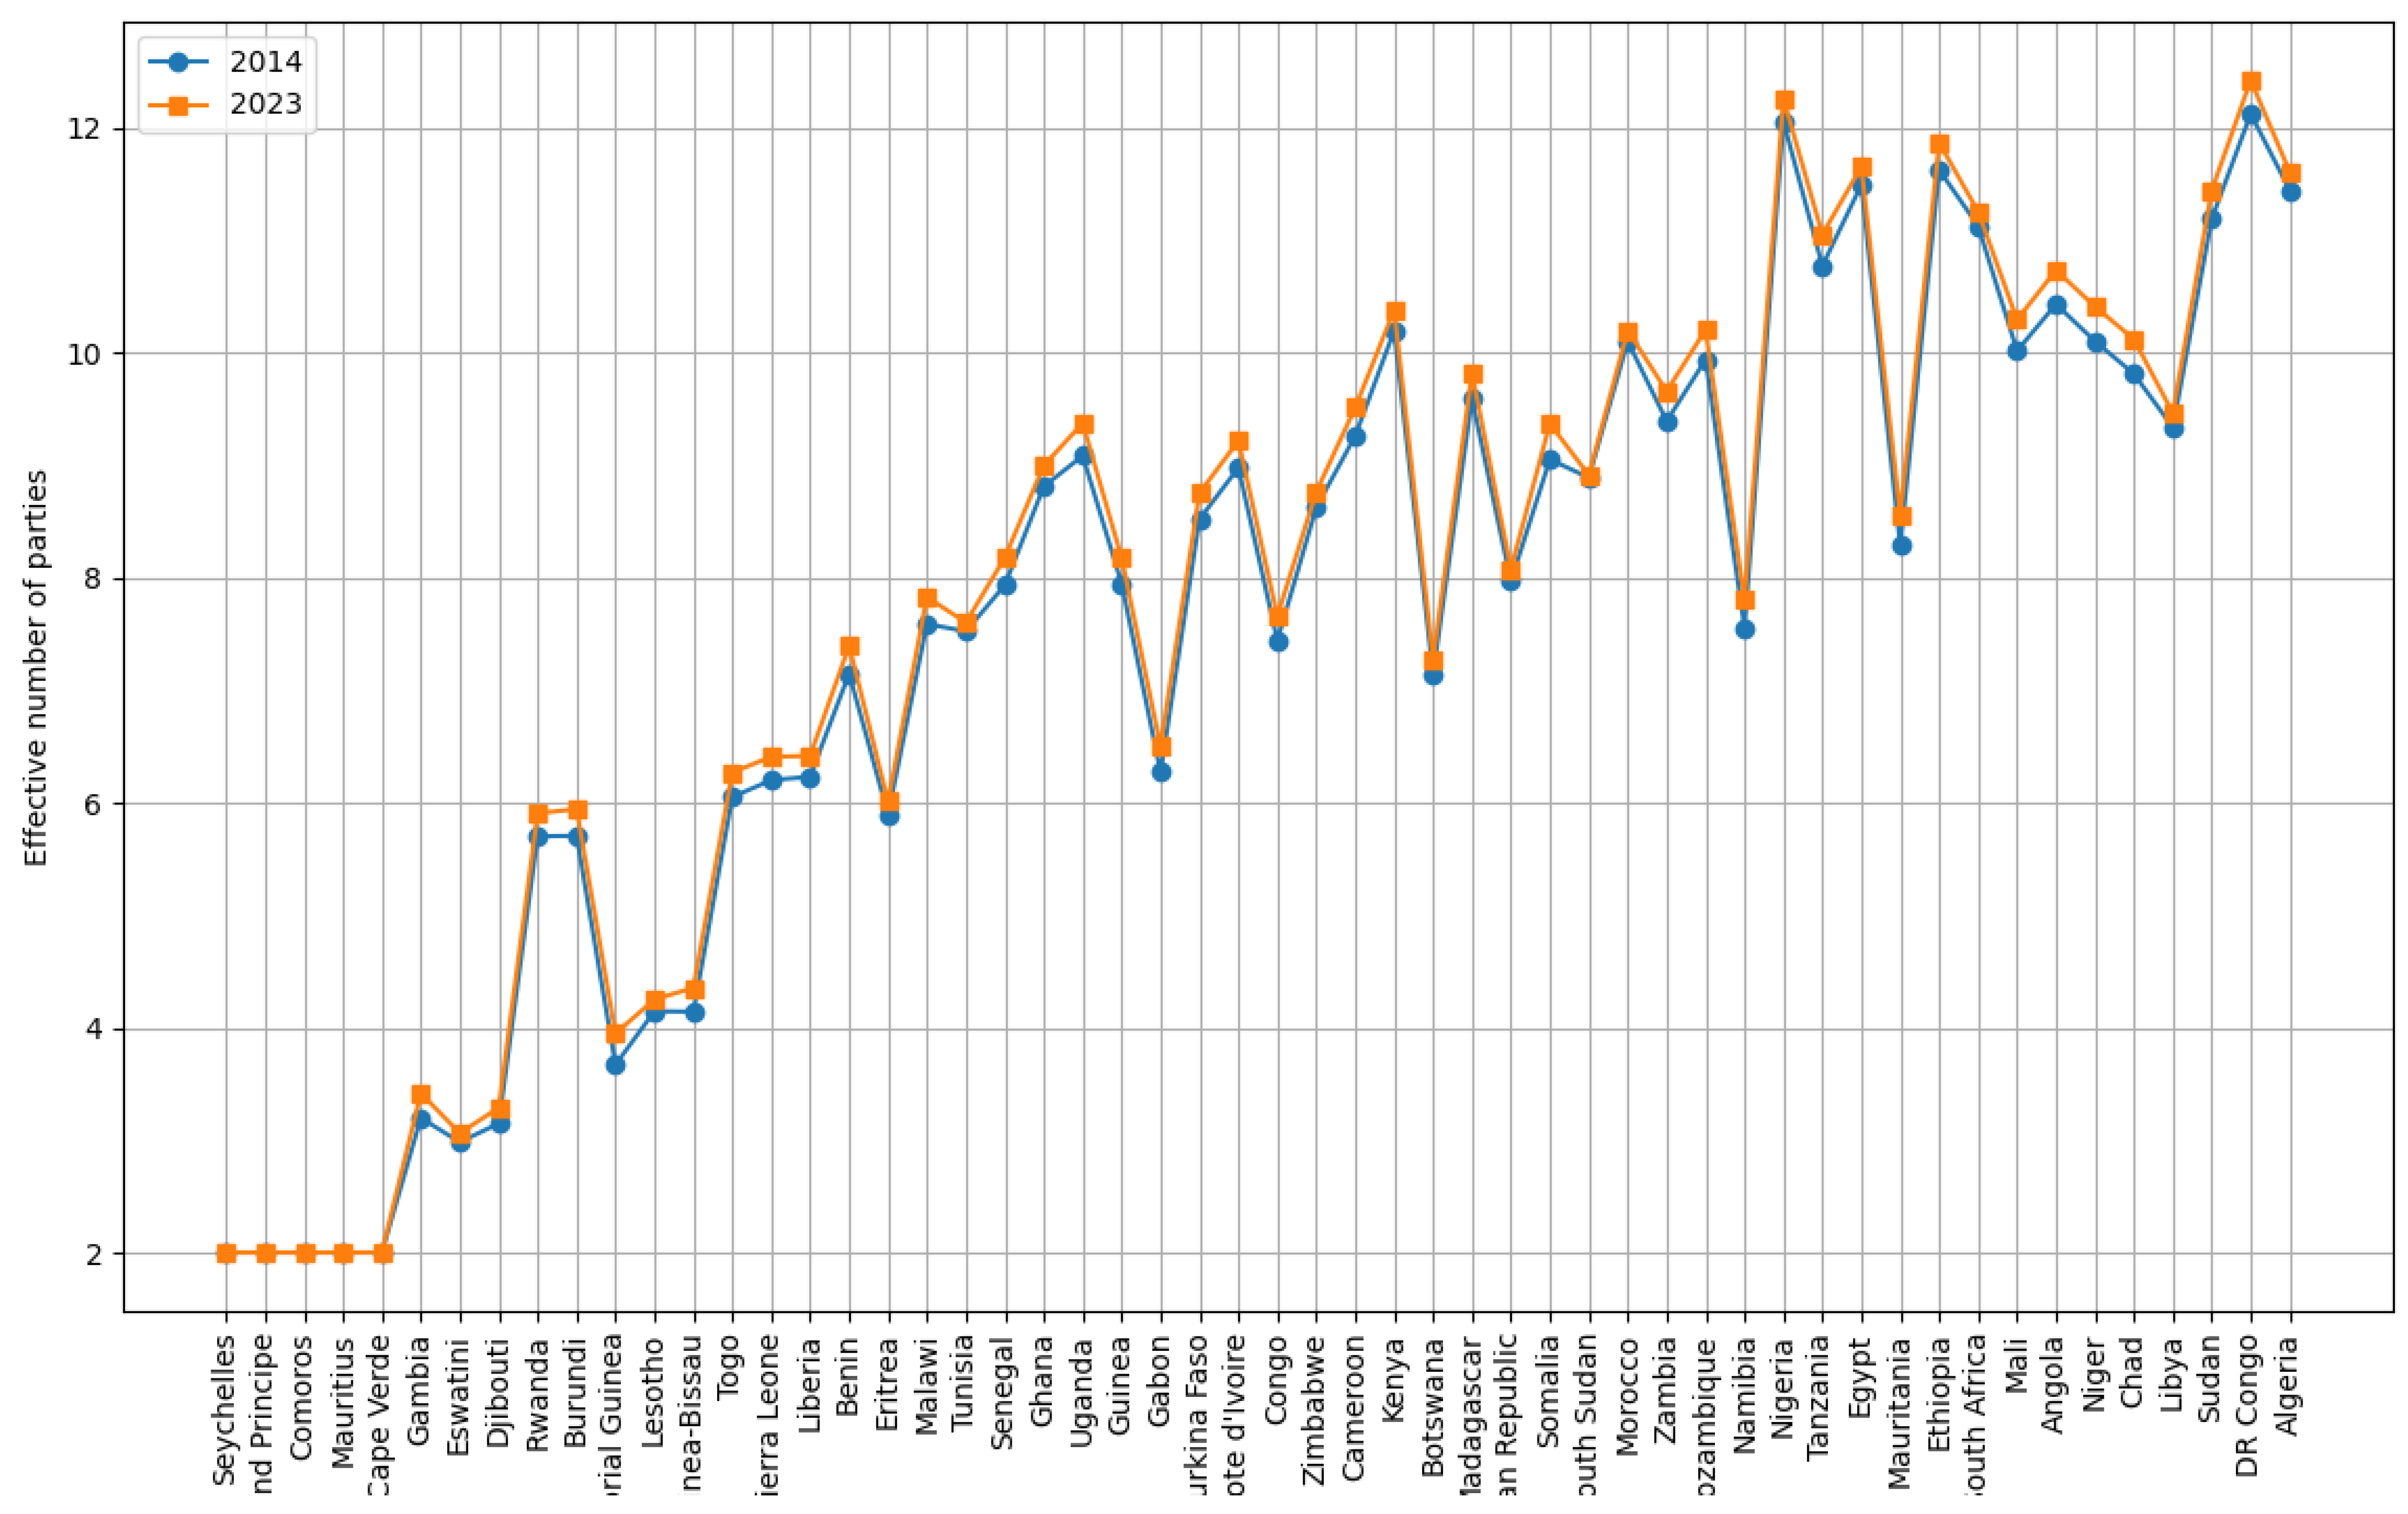
Figure 4.
Party Systems Trends in Africa using Soft Index: Examining the shift in the effective number of political parties from 2014 to 2023.
Figure 4.
Party Systems Trends in Africa using Soft Index: Examining the shift in the effective number of political parties from 2014 to 2023.
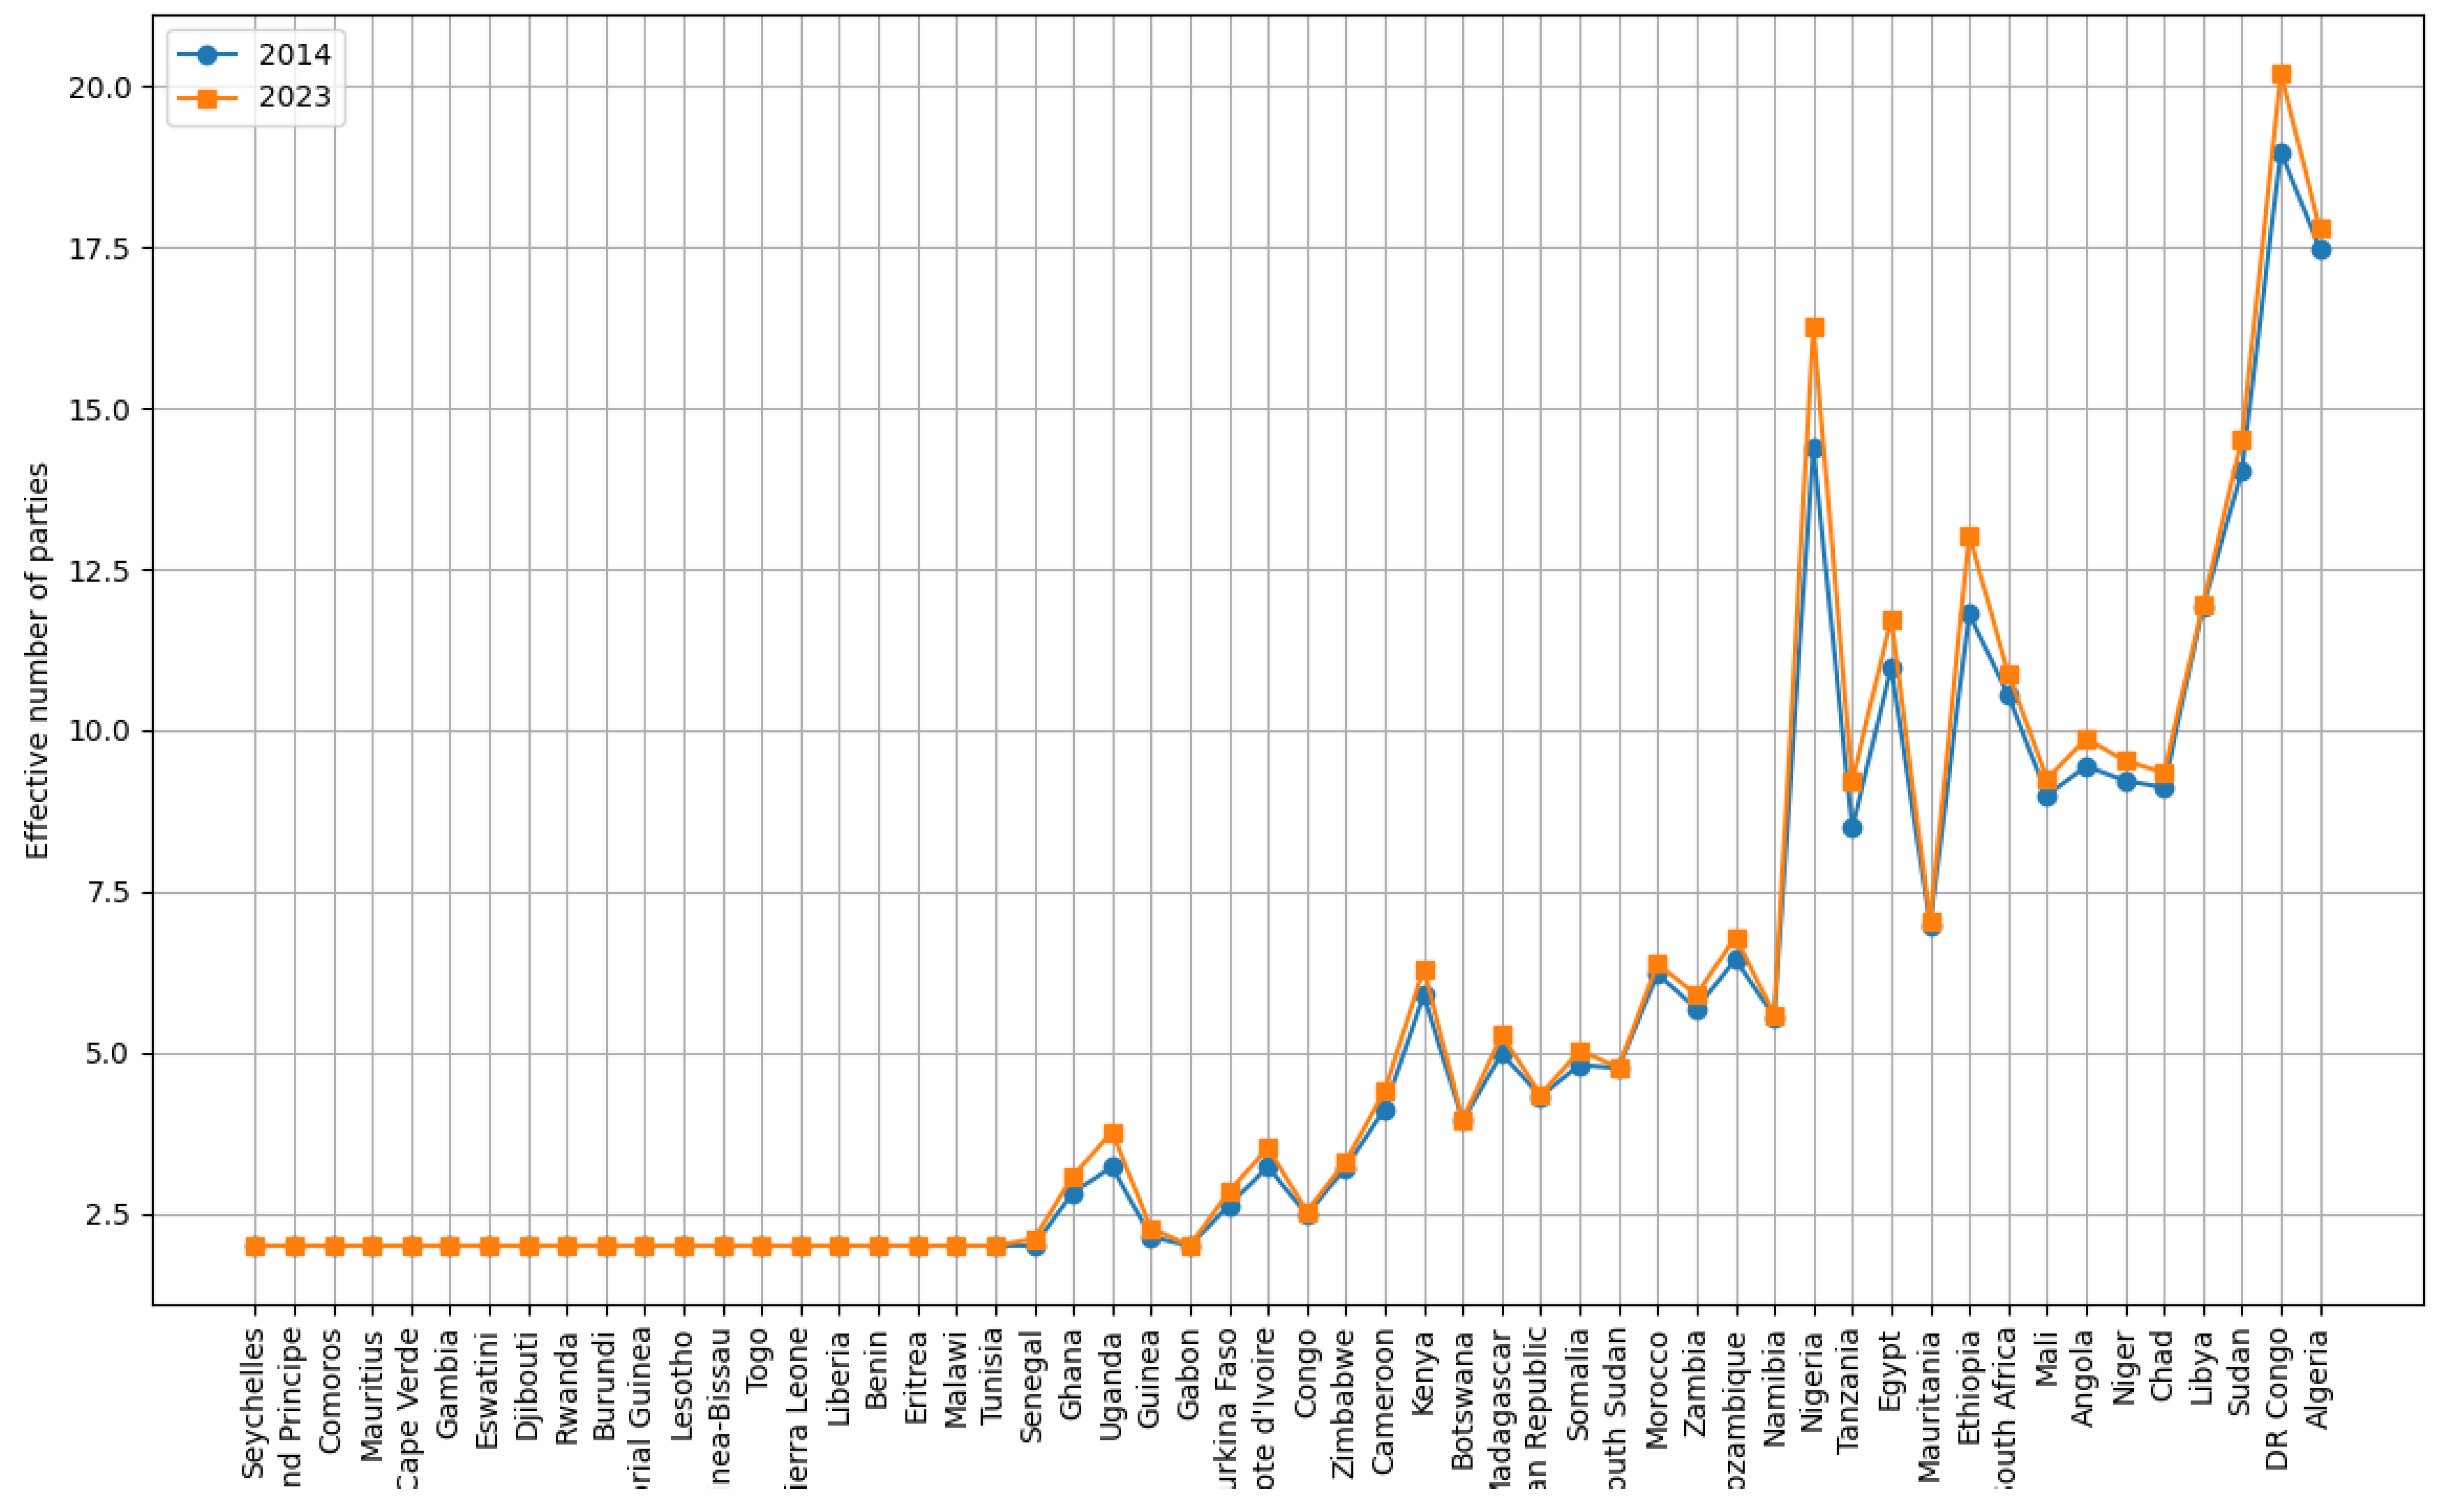
Figure 5.
Effective Number of Parties values for the Confederation of Sahel States, illustrating the impact of different combinations of and across various statistical measures. For each country, the heatmap displays a matrix of ENP values. Each cell in the heatmap represents the ENP for a specific pairing of and , where these parameters take values derived from the mean, quartiles (Q1, Q2, Q3), and their respective divisions by 2 (Q1div2, Q2div2, Q3div2). The color intensity represents the magnitude of ENP values, with darker shades indicating higher values.
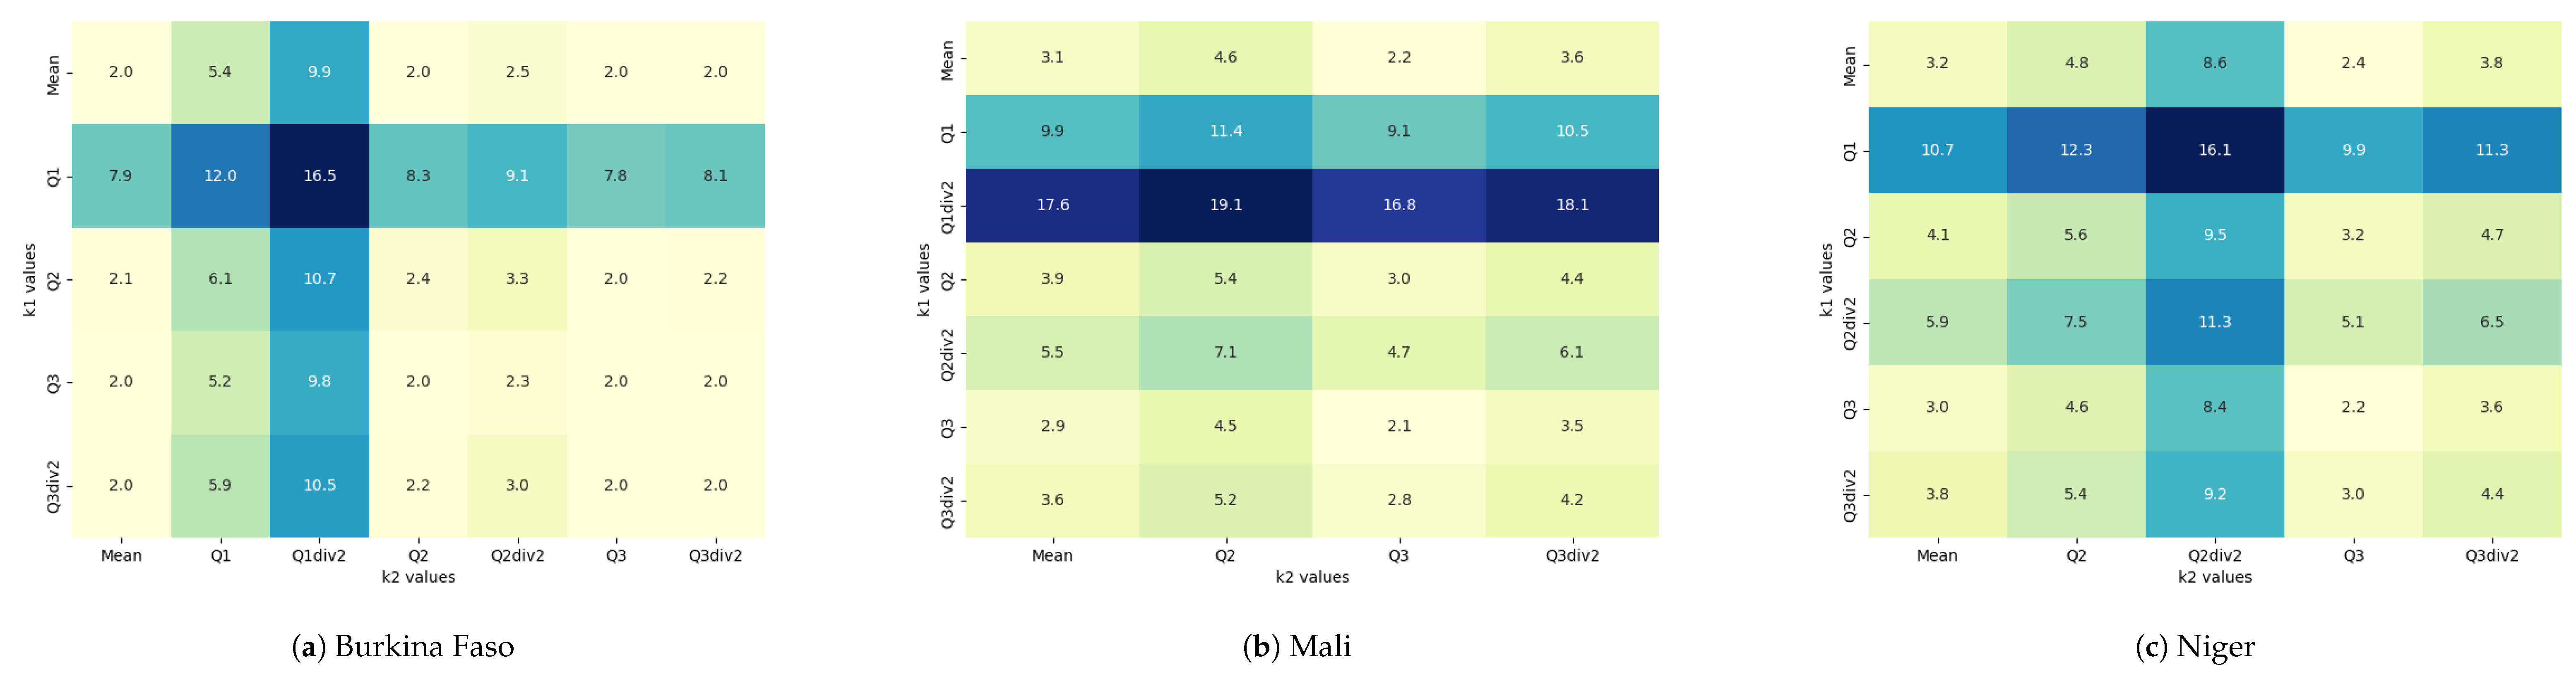
Figure 6.
Effective Number of Parties values for ECOWAS, illustrating the impact of different combinations of and across various statistical measures. For each country, the heatmap displays a matrix of ENP values. Each cell in the heatmap represents the ENP for a specific pairing of and , where these parameters take values derived from the mean, quartiles (Q1, Q2, Q3), and their respective divisions by 2 (Q1div2, Q2div2, Q3div2). The color intensity represents the magnitude of ENP values, with darker shades indicating higher values.
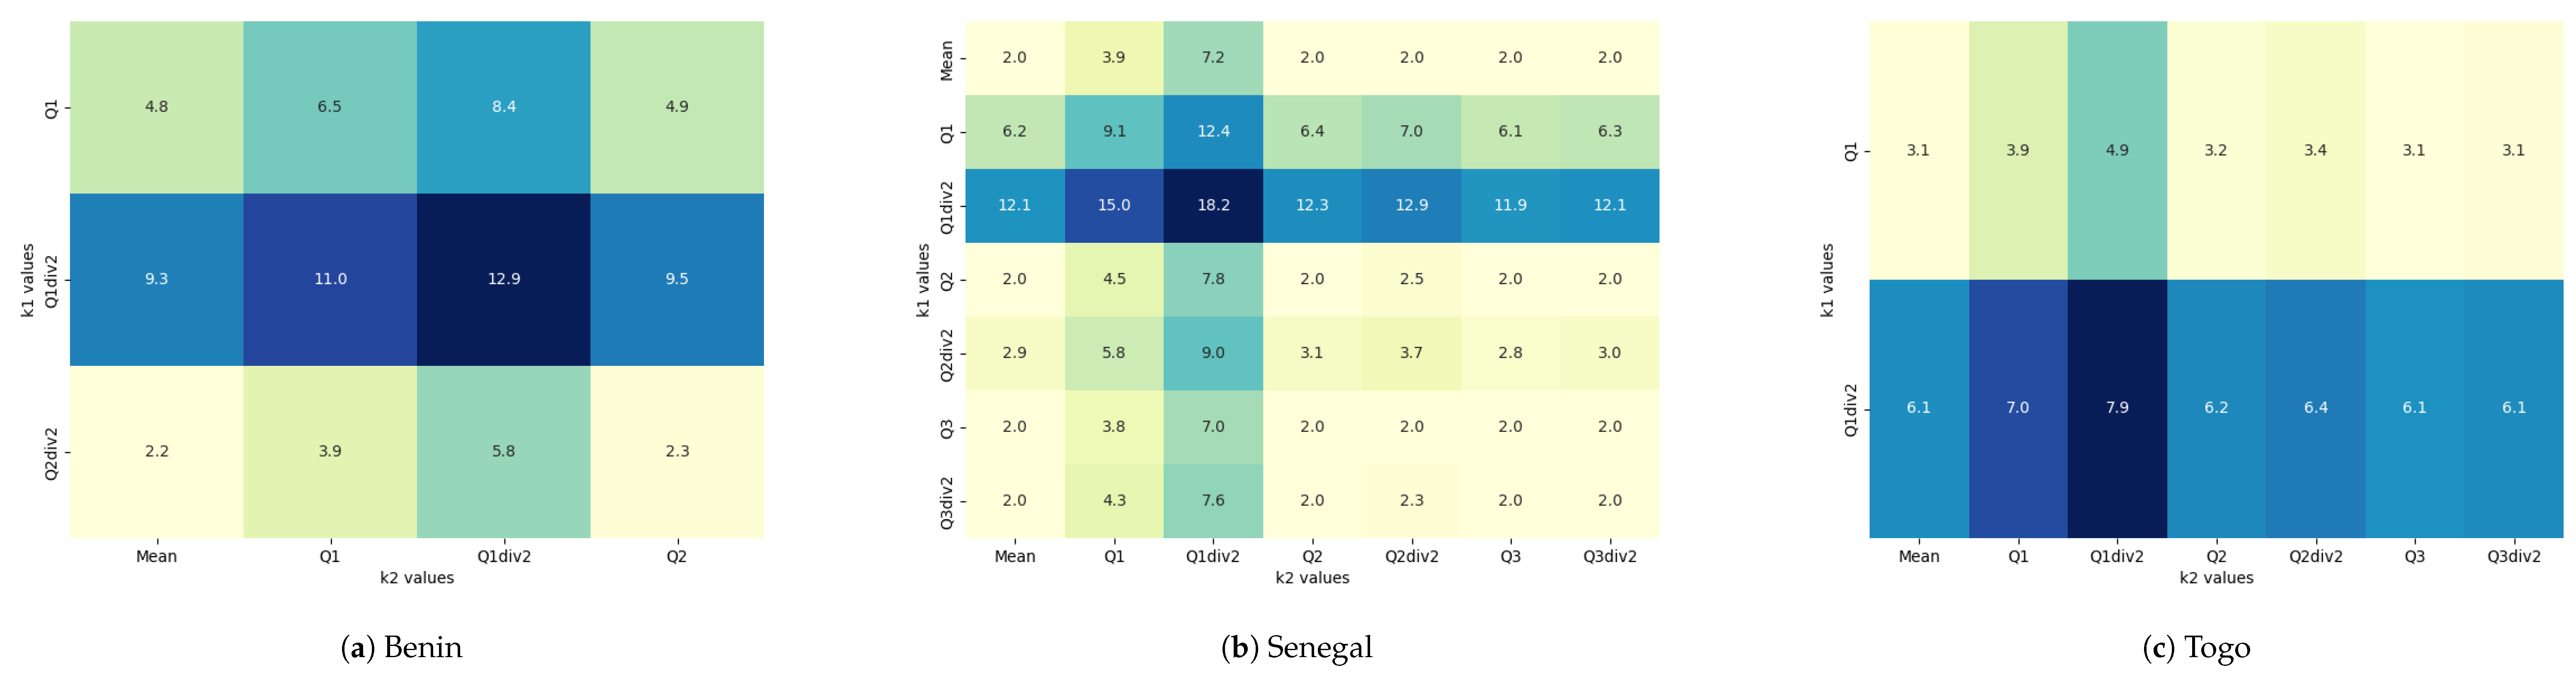
Figure 7.
Effective Number of Parties values for ECCAS, illustrating the impact of different combinations of and across various statistical measures. For each country, the heatmap displays a matrix of ENP values. Each cell in the heatmap represents the ENP for a specific pairing of and , where these parameters take values derived from the mean, quartiles (Q1, Q2, Q3), and their respective divisions by 2 (Q1div2, Q2div2, Q3div2). The color intensity represents the magnitude of ENP values, with darker shades indicating higher values.
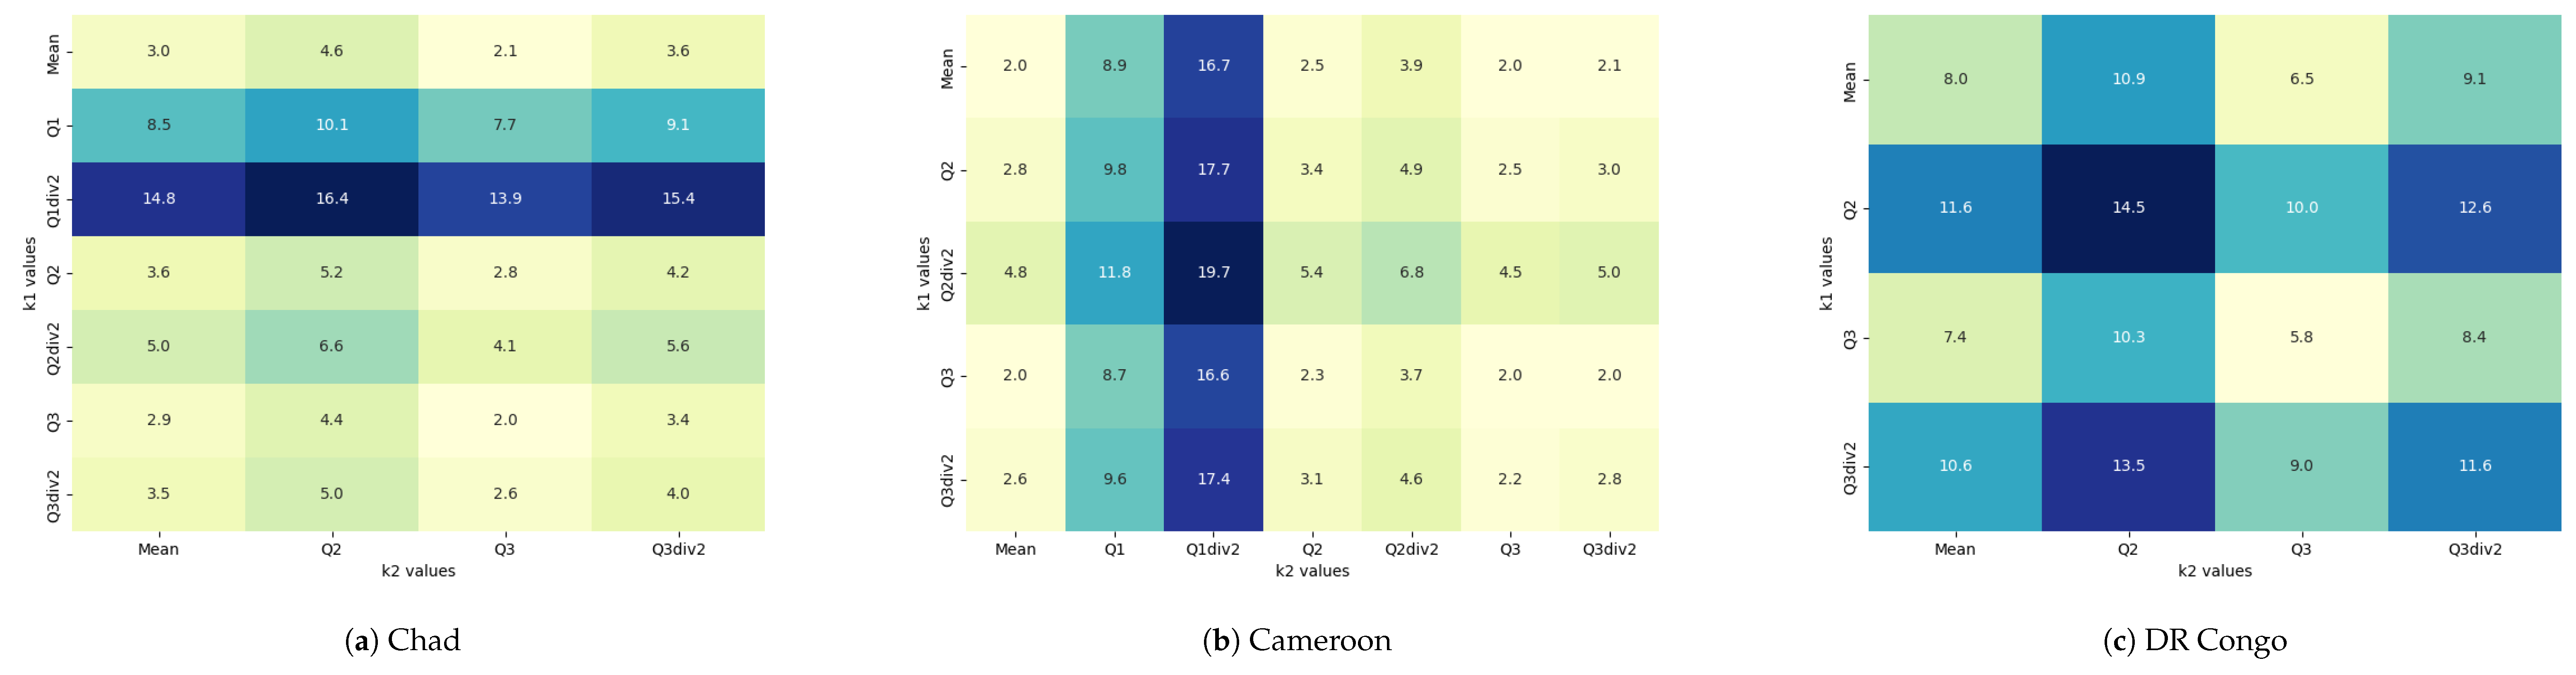

Table 1.
Sample of the final dataset
| Country | Population | Area | Region | Community |
| DR Congo | 109 276 265 | 2 267 050 | Central Africa | ECCAS |
| Togo | 9 304 337 | 56 785 | West Africa | ECOWAS |
| Burkina Faso | 23 548 781 | 273 600 | West Africa | AES |
| Mali | 24 478 595 | 1 220 190 | West Africa | AES |
| Niger | 27 032 412 | 1 266 700 | West Africa | AES |
Table 2.
Effective number of parties for Africa countries using Noua Indexes
| Country | Hard Index | Soft Index | Mean of Both models |
| Seychelles | 2.00 | 2.00 | 2.00 |
| Sao Tome and Principe | 2.00 | 2.00 | 2.00 |
| Comoros | 2.00 | 2.00 | 2.00 |
| Mauritius | 2.00 | 2.00 | 2.00 |
| Cape Verde | 2.00 | 2.00 | 2.00 |
| Gambia | 3.42 | 2.00 | 2.71 |
| Eswatini | 3.06 | 2.00 | 2.53 |
| Djibouti | 3.29 | 2.00 | 2.65 |
| Rwanda | 5.91 | 2.00 | 3.96 |
| Burundi | 5.94 | 2.00 | 3.97 |
| Equatorial Guinea | 3.95 | 2.00 | 2.98 |
| Lesotho | 4.25 | 2.00 | 3.12 |
| Guinea-Bissau | 4.35 | 2.00 | 3.17 |
| Togo | 6.27 | 2.00 | 4.13 |
| Sierra Leone | 6.41 | 2.00 | 4.21 |
| Liberia | 6.42 | 2.00 | 4.21 |
| Benin | 7.39 | 2.00 | 4.70 |
| Eritrea | 6.01 | 2.00 | 4.00 |
| Malawi | 7.82 | 2.00 | 4.91 |
| Tunisia | 7.60 | 2.00 | 4.80 |
| Senegal | 8.18 | 2.11 | 5.14 |
| Ghana | 8.99 | 3.08 | 6.04 |
| Uganda | 9.37 | 3.77 | 6.57 |
| Guinea | 8.17 | 2.27 | 5.22 |
| Gabon | 6.50 | 2.00 | 4.25 |
| Burkina Faso | 8.75 | 2.84 | 5.79 |
| Cote d’Ivoire | 9.22 | 3.52 | 6.37 |
| Congo | 7.66 | 2.53 | 5.09 |
| Zimbabwe | 8.76 | 3.31 | 6.04 |
| Cameroon | 9.51 | 4.41 | 6.96 |
| Kenya | 10.38 | 6.30 | 8.34 |
| Botswana | 7.27 | 3.95 | 5.61 |
| Madagascar | 9.82 | 5.27 | 7.54 |
| Central African Republic | 8.07 | 4.34 | 6.21 |
| Somalia | 9.37 | 5.03 | 7.20 |
| South Sudan | 8.91 | 4.77 | 6.84 |
| Morocco | 10.20 | 6.38 | 8.29 |
| Zambia | 9.65 | 5.90 | 7.78 |
| Mozambique | 10.20 | 6.80 | 8.50 |
| Namibia | 7.80 | 5.59 | 6.70 |
| Nigeria | 12.26 | 16.27 | 14.27 |
| Tanzania | 11.05 | 9.22 | 10.14 |
| Egypt | 11.65 | 11.73 | 11.69 |
| Mauritania | 8.55 | 7.03 | 7.79 |
| Ethiopia | 11.86 | 13.04 | 12.45 |
| South Africa | 11.25 | 10.89 | 11.07 |
| Mali | 10.29 | 9.25 | 9.77 |
| Angola | 10.73 | 9.87 | 10.30 |
| Niger | 10.41 | 9.54 | 9.97 |
| Chad | 10.12 | 9.34 | 9.73 |
| Libya | 9.46 | 11.95 | 10.71 |
| Sudan | 11.44 | 14.53 | 12.98 |
| DR Congo | 12.42 | 20.21 | 16.32 |
| Algeria | 11.61 | 17.79 | 14.70 |
Table 3.
Differents values of k1 and k2
| Statistics | K1 | K2 |
| Mean | 26123118.10 | 511180.71 |
| Q1(25%) | 2525592.25 | 28680.00 |
| Q2(50%) | 14152176.50 | 269800.00 |
| Q3(75%) | 31957274.50 | 814062.50 |
Table 4.
Comparison of the effective number of parties predicted by our models with state-of-the-art methods (Laakso, Golosov, and Seat Product) across African countries: Traditional methods lack data for countries without elections (e.g., Eritrea, Libya), while the institution-free Noua indexes provide ENP values in such cases. The table highlights inconsistencies in traditional methods, such as misclassifying medium and large countries as single-party systems and outlier values for the Democratic Republic of Congo, underscoring the advantages of the Noua indexes in unstable or non-democratic contexts.
| Country | Laakso | Golosov | Seat Product | Ours ( Noua Hard Index) | Ours ( Noua Soft Index ) |
| Ethiopia | 1.07 | 1.04 | 7.77 | 11.86 | 13.04 |
| South Sudan | 1.11 | 1.06 | 5.54 | 8.91 | 4.77 |
| Djibouti | 1.13 | 1.07 | 4.02 | 3.29 | 2 |
| Tanzania | 1.26 | 1.13 | 7.32 | 11.05 | 9.22 |
| Comoros | 1.41 | 1.22 | 2.88 | 2 | 2 |
| Tunisia | 1.47 | 1.25 | 4.61 | 7.6 | 2 |
| Sudan | 1.72 | 1.4 | 7.52 | 11.44 | 14.53 |
| Rwanda | 1.77 | 1.43 | 3.66 | 5.91 | 2 |
| Mozambique | 1.79 | 1.45 | 6.3 | 10.2 | 6.8 |
| Congo | 1.79 | 1.45 | 5.33 | 7.66 | 2.53 |
| Burundi | 1.79 | 1.45 | 4.93 | 5.94 | 2 |
| Cameroon | 1.8 | 1.37 | 5.65 | 9.51 | 4.41 |
| Ghana | 1.85 | 1.53 | 6.51 | 8.99 | 3.08 |
| Algeria | 1.86 | 1.49 | 7.41 | 11.61 | 17.79 |
| Zimbabwe | 2.05 | 1.81 | 6.54 | 8.76 | 3.31 |
| Guinea | 2.06 | 1.6 | 4.83 | 8.17 | 2.27 |
| Gabon | 2.07 | 1.62 | 5.23 | 6.5 | 2 |
| Sierra Leone | 2.08 | 1.81 | 5.13 | 6.41 | 2 |
| Seychelles | 2.08 | 1.87 | 3.27 | 2 | 2 |
| Togo | 2.14 | 1.67 | 4.5 | 6.27 | 2 |
| Namibia | 2.17 | 1.69 | 4.58 | 7.8 | 5.59 |
| Angola | 2.2 | 2.05 | 6.04 | 10.73 | 9.87 |
| Uganda | 2.28 | 1.75 | 8.09 | 9.37 | 3.77 |
| Cape Verde | 2.41 | 2.13 | 4.16 | 2 | 2 |
| South Africa | 2.58 | 1.99 | 7.37 | 11.25 | 10.89 |
| Mauritania | 2.6 | 1.97 | 5.6 | 8.55 | 7.03 |
| Zambia | 2.76 | 2.4 | 5.38 | 9.65 | 5.9 |
| Nigeria | 2.77 | 2.32 | 7.11 | 12.26 | 16.27 |
| Senegal | 2.89 | 2.44 | 5.48 | 8.18 | 2.11 |
| Botswana | 2.94 | 2.24 | 3.85 | 7.27 | 3.95 |
| Madagascar | 2.95 | 2.72 | 5.46 | 9.82 | 5.27 |
| Sao Tome and Principe | 2.95 | 2.49 | 3.8 | 2 | 2 |
| Equatorial Guinea | 2.98 | 2.28 | 8.42 | 3.95 | 2 |
| Egypt | 2.98 | 2.28 | 8.4 | 11.65 | 11.73 |
| Cote d’Ivoire | 3.21 | 2.46 | 6.33 | 9.22 | 3.52 |
| Mauritius | 3.42 | 3.17 | 4.12 | 2 | 2 |
| Benin | 3.48 | 3.12 | 4.78 | 7.39 | 2 |
| Kenya | 4.03 | 3.34 | 7.04 | 10.38 | 6.3 |
| Guinea-Bissau | 4.05 | 3.35 | 4.67 | 4.35 | 2 |
| Malawi | 4.13 | 3.72 | 5.77 | 7.82 | 2 |
| Chad | 4.32 | 3.26 | 5.73 | 10.12 | 9.34 |
| Lesotho | 4.43 | 3.73 | 4.93 | 4.25 | 2 |
| Gambia | 4.53 | 4.51 | 3.76 | 3.42 | 2 |
| Morocco | 5.68 | 5.49 | 7.34 | 10.2 | 6.38 |
| Mali | 5.7 | 4.61 | 5.28 | 10.29 | 9.25 |
| Central African Republic | 6.05 | 5.8 | 5.19 | 8.07 | 4.34 |
| Niger | 6.09 | 4.63 | 5.5 | 10.41 | 9.54 |
| Burkina Faso | 6.45 | 5.15 | 5.03 | 8.75 | 2.84 |
| Liberia | 6.94 | 6.96 | 4.18 | 6.42 | 2 |
| DR Congo | 34.08 | 36.67 | 7.81 | 12.42 | 20.21 |
| Eritrea | - | - | - | 6.01 | 2 |
| Eswatini | - | - | - | 3.06 | 2 |
| Libya | - | - | - | 9.46 | 11.95 |
| Somalia | - | - | - | 9.37 | 5.03 |
Disclaimer/Publisher’s Note: The statements, opinions and data contained in all publications are solely those of the individual author(s) and contributor(s) and not of MDPI and/or the editor(s). MDPI and/or the editor(s) disclaim responsibility for any injury to people or property resulting from any ideas, methods, instructions or products referred to in the content. |
© 2025 by the authors. Licensee MDPI, Basel, Switzerland. This article is an open access article distributed under the terms and conditions of the Creative Commons Attribution (CC BY) license (http://creativecommons.org/licenses/by/4.0/).
Copyright: This open access article is published under a Creative Commons CC BY 4.0 license, which permit the free download, distribution, and reuse, provided that the author and preprint are cited in any reuse.


