
Submitted:
20 March 2025
Posted:
24 March 2025
You are already at the latest version
Abstract
Hypoxia is a crucial characteristic of hepatocellular carcinoma (HCC) and contributes to immune resistance by upregulating PD-L1 and recruiting immunosuppressive cells. However, the molecular mechanisms of hypoxia-induced immunotherapy resistance are still unclear. The hypoxia-related immunotherapy response (IRH) genes were identified and developed a hypoxia risk score model to predict patient survival. The model was validated using GSE233802 and EGAD00001008128 datasets. A hypoxia-induced drug-resistant (HepG2-R) cell line was established by co-culturing HepG2 cells with Jurkat T cells under CoCl₂-induced hypoxia and PD-L1 inhibitor administration. The effect of NOXA knockdown on the apoptosis of HepG2-R cells under the same co-culture conditions was examined. The hypoxia risk score model including NOXA effectively stratified patients based on risk and demonstrated excellent survival predictive ability (p = 0.0236). Prolonged exposure to hypoxia (48h) in HepG2 cells significantly led to the increased hypoxia risk score (p < 0.02). The establishment of the HepG2-R cell line showed that prolonged hypoxia reduced cancer cell apoptosis, which implies potential treatment resistance. Under hypoxia and PD-L1 inhibitor treatment, NOXA knockdown increased the survival rate of HepG2-R cells and reduced early and late apoptosis. This indicates that NOXA plays a crucial role in apoptosis regulation and immune response in hypoxic tumors. NOXA knockdown significantly reduces apoptosis in immunotherapy-resistant cells induced by hypoxia. These findings provide important evidence that targeting NOXA may enhance immunotherapy efficacy and help overcome treatment resistance in HCC, highlighting its potential as a therapeutic target.
Keywords:
hepatocellular carcinoma
; hypoxia
; immunotherapy resistance
; noxa
; hypoxia risk score model
1. Introduction
Hepatocellular carcinoma (HCC) is a leading cause of cancer-related mortality worldwide. Regrettably, most HCC cases are diagnosed at advanced stages. Despite significant advancements in therapeutic strategies, the prognosis for patients with advanced HCC remains poor, with a persistently low five-year survival rate. Notably, over 50% to 60% of these patients require systemic therapies, such as immunotherapy, underscoring the critical role of systemic treatment in managing this malignancy [1,2].
Atezolizumab, a PD-L1 inhibitor, in combination with bevacizumab, a VEGF-targeting antibody, has been approved by the U.S. Food and Drug Administration (FDA) as a first-line treatment for unresectable HCC [3]. In malignant tumor cells, PD-L1 is overexpressed. Atezolizumab binds specifically to PD-L1, disrupting the PD-1/PD-L1 immunosuppressive axis, thereby enhancing the cytotoxicity of antitumor T cells and exerting anticancer effects [4]. The PD-1/PD-L1 signaling pathway is significant in cancer immunotherapy, and inhibitors targeting this pathway have achieved notable therapeutic breakthroughs. However, the current objective response rate of this regimen remains below 30%, with a three-year overall survival rate of less than 50% [1].
Hypoxia is a common feature of solid tumors, arising from an imbalance between oxygen supply and consumption due to continuous tumor cell proliferation [5]. Within the hypoxic tumor microenvironment (TME), hypoxia-inducible factors (HIFs) are activated and serve as pivotal transcription factors regulating cellular responses to low oxygen conditions [6]. Substantial evidence indicates that HIFs play a crucial role in the pathogenesis and pathophysiology of HCC. Under hypoxic conditions, the expression of anti-apoptotic proteins such as Mcl-1 and Bcl-XL increases, while the expression of pro-apoptotic proteins like Bax decreases, facilitating tumor cell survival [7]. NOXA, a pro-apoptotic member of the Bcl-2 protein family, is regulated by HIFs and contributes to the cellular response to hypoxia [8]. In HCC, the interplay between NOXA expression and hypoxic conditions may influence tumor progression and therapeutic outcomes.
In this study, we developed a hypoxia risk score model using bioinformatics and machine learning to assess its association with immunotherapy outcomes. Co-culture experiments were conducted to investigate the effect of NOXA on immune cell activity and the efficacy of PD-L1 inhibitors under hypoxic conditions. By integrating computational modeling with experimental validation, this study aims to elucidate the interplay between hypoxia, NOXA expression, and immune checkpoint blockade efficacy. These findings suggest that modulating NOXA expression may enhance immunotherapy responses, highlighting its potential as a novel biomarker and therapeutic target.
2. Results
2.1. Identification of IRH and HRH genes from public dataset
The results of this sub-section have been reported in the following preprint (https://doi.org/10.20944/preprints202501.2142.v1).
As shown in Figure 1a, in the EGAD00001008128 dataset, 84 differentially expressed genes (DEGs) were identified (q-value < 0.05, Up-regulated genes: Fold change > 1.999, Down-regulated genes: Fold change < 1/1.999). As shown in Figure 1b, in the GSE14520 dataset, 400 up-regulated DEGs and 400 down-regulated DEGs were identified (q-value < 0.05, Up-regulated genes: Fold change > 1.139, Down-regulated genes: Fold change < 1/1.1276).
As shown in Figure 1c, in the GSE41666 dataset, 400 up-regulated DEGs and 400 down-regulated DEGs were identified (q-value < 0.05, Up-regulated genes: Fold change > 1.277, Down-regulated genes: Fold change < 1/1.370) and were used for an overlap analysis with the DEGs in the GSE14520 dataset. Among them, 300 up-regulated DEGs were used for an overlap analysis with the DEGs in the EGAD00001008128 dataset (q-value < 0.05, Fold change > 1.3202).
Overlap analysis of the EGAD00001008128 and GSE41666 datasets revealed three statistically significant overlapping DEGs (PMAIP1 (NOXA), CD3D, and CD2), which were designated as immunotherapy response to hypoxia genes (IRHs) (p = 0.026, Figure 1d). For the GSE14520 and GSE41666 datasets, overlap analysis identified 52 statistically significant overlapping DEGs, which were named HCC-hypoxia overlap genes (HHOs) (p = 0.0032, Figure 1e).
2.2. Hypoxia Risk Scoring Model
The results of this sub-section have been reported in the following preprint: https://doi.org/10.20944/preprints202501.2142.v1
In our previous study, we established a hypoxia risk scoring model using the survival package and glmnet package in R language. Based on the FPKM (fragments per kilobase of exon model per million mapped reads) data from the The Cancer Genome Atlas Liver Hepatocellular Carcinoma (TCGA-LIHC) dataset, univariate COX regression analysis was performed on the HHOs, and 21 genes significantly associated with survival were selected out (p-value < 0.001, Table S1). Subsequently, through the Least Absolute Shrinkage and Selection Operator (LASSO) algorithm and cross-validation (the optimal λ value: log(λ) ≈ -4), 9 key genes were further selected out and incorporated into the hypoxia risk scoring model (Table S2). Based on previous literature research, the NOXA gene from the IRHs was also included in the model. The hypoxia risk scoring model composed of PHLDA2, DLGAP5, N4BP2L1, CENPA, UPB1, CABYR, AFM, HMMR, KIF20A, and PMAIP1 was subjected to another COX regression analysis using the FPKM dataset of TCGA-LIHC to ensure a significant association with the survival outcomes related to hypoxia (Table S3). In the formula, the expression of each gene is assigned a coefficient representing its impact on survival. A positive coefficient indicates an increased risk, while a negative coefficient indicates a decreased risk. This formula was used to calculate the hypoxia scores of the GSE233802 and EGAD00001008128 datasets for further validation and analysis of the model.
2.3. Validation of the Hypoxia Risk Scoring Model
2.3.1. Validation of Hypoxic Cell Line Dataset
The model was applied to the GSE233802 dataset, which includes HepG2 cell lines exposed to 0h, 24h, and 48h of hypoxia. Hypoxia risk scores were computed for each time point, showing significant differences (ANOVA, p-value < 0.02) in Figure 2a. Scores for the 48h hypoxia group were higher than those for 24h, while scores at 0h were higher than at 24h. These results suggest that early hypoxia reduces risk due to cell proliferation slowdown caused by transient oxygen deprivation, but prolonged hypoxia significantly increases risk, suggesting a critical transition in tumor adaptation under hypoxic stress.
2.3.2. Clustering of Hypoxia Risk Scores and Survival Analysis
Patients of the EGAD00001008128 dataset were classified according to their hypoxia risk scores using unsupervised K-Means clustering. The dataset was divided into a group of 106 high-risk patients and a group of 94 low-risk patients in Figure 2b. A histogram analysis confirmed a near-normal distribution of hypoxia risk scores, with cluster centers effectively distinguishing the two subpopulations in Figure S1.
Kaplan-Meier survival analysis demonstrated that patients in the Low Hypoxia group exhibited a prolonged PFS compared to those in the High Hypoxia group in Figure 2c. A p-value of 0.0236 was obtained from the log-rank test, which meant that the difference in survival outcomes between the two groups was statistically significant. These findings confirm the hypoxia risk stratification model's effectiveness in differentiating patient survival outcomes.
2.4. Hypoxia-Induced Resistance in HepG2 Cells
To evaluate the successful establishment of hypoxia-induced drug-resistant cells, we analyzed HIF-1α expression as an important marker of hypoxia. Using Western blot analysis, we measured HIF-1α expression level under different CoCl₂ concentrations and exposure durations. As shown in Figure 3a, the levels of HIF-1α protein increased as the concentration of CoCl₂ rose, and the hypoxic effect was observed within 4 to 48 hours of exposure. After co-culturing for 48 hours, the HIF-1α expression level in the co-culture group with a concentration of 200 μM CoCl₂ was still significantly higher than that in the normoxic group. The protein expression levels of HIF-1α in the Western blot images under the conditions of different concentrations of CoCl₂ and different durations of hypoxia are shown in Figure S2. In subsequent experiments, we used 200 μM CoCl₂ to induce hypoxia in HepG2 cells.
Flow cytometry analysis indicated that when hypoxia-induced HepG2 cells were co-cultured with different concentrations of the PD-L1 inhibitor, there was a significant decrease in the apoptosis rate compared to the normoxic control group. As the duration of exposure to hypoxia lengthened, the anti-apoptotic capacity gradually enhanced. As shown in Figure 3b, 1-round hypoxia treatment significantly reduced the apoptotic rate compared to the normoxic control group (p-value = 0.0005, T-statistic = -4.1431, t-test). 4-round hypoxia treatment resulted in an even greater reduction in apoptosis (p-value < 0.0001, T-statistic = -10.7825, t-test). The comparison between the 1-round and 4-round hypoxia groups showed a significantly greater reduction in apoptosis in the 4-round hypoxia group (T-statistic = -8.3049, p-value < 0.00001, t-test). These results indicate that the HepG2 cell line treated with 4 rounds of hypoxia has developed a certain level of anti-apoptotic capability and drug resistance. The HepG2 cell line treated with four rounds of hypoxic co-culture is regarded as the HepG2-R cell line. The gating strategy of flow cytometry is shown in Figure S3.
To better determine the appropriate concentration of PD-L1 inhibitor for subsequent experiments, we used Nikon's NIS-Element AR software to analyze cell proliferation before and after co-culture under microscopic observation. Based on the AI-driven CNN algorithm, the software can identify and quantify the cell fill area on the culture dish before and after co-culture. The analysis results show that the concentration of 0.1 μM PD-L1 inhibitor exhibits the most effective inhibition of cell proliferation. Figure 3c shows the change in cell fill area on the culture dish before and after co-culture. The analysis before and after co-culture showed no significant differences between groups with different inhibitor concentrations. This indicates that the changes in apoptosis rates were not caused by differences in cell proliferation, but rather by the duration of hypoxia exposure.
2.5. NOXA Knockdown Efficiency
Western blot and qPCR were used to confirm NOXA knockdown efficiency in HepG2-R cells. This validation step was consistent with the duration of cell co-culture. As shown in Figure 4a, the protein expression levels of NOXA were significantly reduced after transfection with 4 different siRNAs. siNOXA4 showed the most effective knockdown effect. Compared with the control group, the NOXA protein level was significantly reduced (p-value < 0.01). β - actin was used as an internal control. The qPCR results also confirmed that NOXA mRNA expression was significantly decreased in cells transfected with siNOXA4, further validating the knockdown efficiency, as shown in Figure 4b.
2.6. Apoptosis Analysis of NOXA-Knockdown Potentially Resistant Cells
To evaluate the role of NOXA in apoptosis regulation, NOXA-knockdown (siNOXA) HepG2-R cells were co-cultured with Jurkat T cells under hypoxic conditions. The control group consisted of HepG2-R cells. Apoptosis rates were analyzed using flow cytometry. Figure 5 shows the effect of siNOXA on apoptosis in HepG2-R cells under hypoxic conditions and treatment with 0.1 μM PD-L1 inhibitor. The results indicate that the proportion of live cells increased from 64.10% in the control group to 70.05% in the siNOXA group, suggesting that siNOXA may enhance cell survival in HepG2-R cells under PD-L1 inhibitor treatment. The early apoptosis decreased from 14.77% to 10.50%, while late apoptosis significantly decreased in the siNOXA group, from 16.50% to 10.38%. To further quantify the effect of NOXA knockdown on apoptosis, Cohen's d values for late and early apoptosis rates are 1.2976 and 1.5109, respectively, both exceeding the 0.8 threshold for large effect size. This indicates that NOXA knockdown has a strong biological effect on reducing apoptosis in HepG2 cells. These results suggest that siNOXA in HepG2-R cells may reduce both early and late apoptosis and potentially regulate PD-L1 inhibitor and hypoxia-induced cell death.
3. Discussion
Hypoxia is a common feature of the tumor microenvironment. The rapid proliferation of tumors leads to an imbalance between oxygen supply and consumption. Hepatocellular carcinoma (HCC) is one of the most hypoxic tumors, with an intertumoral median oxygen level as low as 0.8%. HCC is a highly vascularized and hypoxic tumor [9,10]. Hypoxia induces molecular and phenotypic changes in cancer cells, primarily through hypoxia-inducible factors (HIFs), especially HIF-1α. Activated HIF-1α can alter gene expression, promoting angiogenesis, metabolic reprogramming, and epithelial-mesenchymal transition, thereby driving tumor progression and metastasis [11]. Hypoxia within tumors can induce the generation of reactive oxygen species (ROS), leading to oxidative stress, increasing DNA damage, and disrupting the DNA repair mechanism. These changes increase the probability of gene mutations and prompt genetic alterations within tumor cells, resulting in uncontrolled cancer cell proliferation, resistance to apoptosis, and the development of treatment resistance [12]. Many studies have reported that hypoxia increases the expression of the immune checkpoint PD-L1 on the surface of tumor cells, enabling them to enhance immune evasion [12]. These findings highlight the potential significant impact of hypoxia on HCC progression and treatment response.
In this study, across multiple datasets, we identified some key genes (IRHs and HRGs) related to hypoxia and immunotherapy response in HCC and developed a hypoxia risk score model to predict patient survival. We validated the hypoxia risk score model using the GSE233802 dataset, which includes hypoxic HepG2 cell lines. We found that cells exposed to long-term hypoxia (48 hours) exhibited significantly higher hypoxia risk scores compared to those exposed to short-term hypoxia (24 hours). This suggests that the internal regulatory mechanisms of tumor cells experience alterations, allowing them to adapt to the hypoxic environment and enhance survival. This adaptation might increase the risk of treatment resistance. The hypoxia risk score model was further validated using the EGAD00001008128 dataset, showing its ability to stratify patients based on hypoxia risk. The progression-free survival (PFS) of patients in the high hypoxia risk group was significantly lower than that of the low-risk group. This result showed the potential of this model in predicting patient survival. Recent studies have also found that the hypoxic tumor microenvironment reduces the efficacy of PD-1/PD-L1 immunotherapy through multiple mechanisms. For example, in glioma cells, HIF-1α can directly bind to the PD-L1 promoter region, enhancing PD-L1 expression [13]. Moreover, hypoxia recruits immunosuppressive cells such as myeloid-derived suppressor cells (MDSCs) and regulatory T cells (Tregs). In hypoxic conditions, these cells selectively upregulate PD-L1 expression by binding HIF-1α to the PD-L1 promoter, which further inhibits T cell activity [14]. Therefore, in our subsequent research, we further explored strategies to overcome hypoxia-induced immunotherapy resistance.
We identified IRHs: PMAIP1 (NOXA), CD3D, and CD2. These genes further emphasize the significant impact of hypoxia on immunotherapy response. Notably, NOXA was included as a key gene in the hypoxia risk score model. NOXA is a pro-apoptotic protein in the Bcl-2 family and plays a crucial role in the regulation of cell apoptosis. NOXA promotes the activation of Bax and Bak by binding to anti-apoptotic proteins such as Mcl-1 and Bcl-xL. This binding leads to alterations in the permeability of the mitochondrial outer membrane, ultimately resulting in the induction of apoptosis. In tumor cells, the expression of NOXA is generally under the regulation of p53. When cells experience stress stimuli such as DNA damage, p53 upregulates NOXA expression, promoting the apoptosis of damaged cells and preventing the accumulation of abnormal cells [15]. In hypoxic environment, HIF-1α can directly bind to the promoter region of NOXA, leading to its increased expression. This upregulation promotes apoptosis through the mitochondrial pathway [8]. Recent studies have found that higher NOXA levels may enhance the susceptibility of cancer cells to the cytotoxicity mediated by CAR-T cells by promoting the apoptotic pathway. Downregulation or inhibition of NOXA may lead to resistance to this therapy [16]. Therefore, understanding the regulatory mechanisms of NOXA in the hypoxic tumor microenvironment is crucial for improving immunotherapy outcomes.
We co-cultured activated Jurkat T cells with HepG2 cells under CoCl₂-induced hypoxic conditions to simulate the hypoxic tumor microenvironment and establish the HepG2-R cell line. Under the same hypoxic conditions and PD-L1 inhibitor treatment, we explored the function of NOXA knockdown in regulating HepG2-R cell apoptosis, revealing its potential as a therapeutic target for improving treatment efficacy. After 4 rounds of hypoxic co-culture, HepG2 apoptosis was significantly reduced. This indicates that hypoxia might impact immunotherapy effectiveness, as tumor cells can adapt to hypoxic environments and develop treatment resistance. To explore the regulatory role of NOXA in the hypoxic tumor microenvironment and its impact on immune efficacy, we knocked down NOXA in HepG2-R cells. The results showed that under hypoxic conditions with PD-L1 inhibitor treatment, siNOXA increased the proportion of live cells and reduced early and late apoptosis. These findings indicate that NOXA plays a critical role in regulating apoptosis in HepG2-R cells, and its knockdown may enhance cell survival. Therefore, NOXA inhibition may help overcome tumor resistance in hypoxic environments and improve immunotherapy outcomes.
4. Materials and Methods
Study Design
This study consists of bioinformatics analysis, machine learning, and cell line experiments. Figure 6 shows the overview of the computational hypoxia risk model.
4.1. Data Collection and Preprocessing
Several publicly accessible datasets were subjected to bioinformatic analysis, modeling, and cellular experimental validation. These datasets include: EGAD00001008128 from the European Genome-phenome Archive (EGA), downloaded on October 10, 2023. GSE41666, GSE14520, and GSE233802 from the National Center for Biotechnology Information (NCBI) database, acquired in January 2022, January 2022, and June 2024, respectively. The TCGA-LIHC dataset from The Cancer Genome Atlas (TCGA) database, obtained in January 2024.
4.1.1. Clinical datasets
The EGAD00001008128 dataset comprises RNA sequencing data from 290 HCC patients' biopsies. Post-biopsy, these patients received treatment with either atezolizumab or a combination of atezolizumab and bevacizumab. Therapeutic responses were categorized into responders (90 patients) and non-responders (200 patients). The GSE14520 dataset includes microarray data from 214 patients, covering both tumor tissues and adjacent normal tissues, facilitating comparative analyses. The TCGA-LIHC dataset from The Cancer Genome Atlas (TCGA) provides gene expression profiles (FPKM values) and survival data for 367 patients.
4.1.2. Cell culture datasets
The GSE41666 dataset includes gene expression profiles of the HepG2 cell line cultures. These cultures were maintained under hypoxic conditions (0% O₂) and normoxic conditions (21% O₂) for 24 hours. The data was obtained by employing a microarray platform. The GSE233802 dataset contains RNA sequencing data derived from HepG2 cell cultures. These cells were exposed to hypoxia (1% O₂) for 24 hours and 48 hours respectively, with normoxia set as the control group. In both the GSE41666 and GSE233802 datasets, each experimental condition was repeated three times to ensure biological reproducibility.
4.1.3. Pre-processing of RNA sequencing raw data
For RNA sequencing data from the EGAD00001008128 and GSE233802 datasets, standard processing pipelines were applied. Quality assessment was performed using FastQC, while Fastp was used for base trimming and adapter removal. Reads were aligned to the human reference genome (GRCh38.104 from NCBI) using HISAT2, and gene expression was quantified with FeatureCounts, generating the raw expression matrix [17].
To deal with low-quality sequencing results, gene filtering methods from related research were applied. In the analysis of the EGAD00001008128 dataset, for each gene, the median counts per million (CPM) and coefficient of variation (CV) were calculated. Genes below the 25th percentile threshold or expressed in fewer than 75% of samples were excluded [18]. For the GSE233802 dataset, which contains 9 samples, only genes with nonzero CPM values in at least 6 samples were retained.
4.1.4. Normalizing the data of gene expression
The gene expression data, generated using microarray technology from the GSE41666 dataset, had the expression levels of multiple probes per gene averaged. This step resulted in the formation of an expression matrix featuring unique gene symbols. The data went through Variance Stabilizing Normalization (VSN) and was then standardized to a normal distribution, N (0,1).
For the RNA sequencing datasets EGAD00001008128 and GSE233802, preprocessing was performed using the DESeq2 normalization function (deseq2_norm) in Python. This method applies sample-specific scaling factors to the expression matrices, effectively correcting for sequencing depth and technical variability across samples.
To rescale the EGAD00001008128 expression matrix to a standardized range for further analysis models, the StandardScaler from sklearn in Python was used. This method fits a scaler based on the mean and standard deviation of each gene’s expression. The fitted scaler was then applied to standardize the data to a normal distribution, N (0,1). For the GSE233802 dataset, each gene’s expression was log-transformed and then standardized to N (0,1) to validate the subsequent Cox regression model.
4.2. Selection of genomic features
4.2.1. Differential Expression Analysis
Differential expression analysis (DEA) was performed on the EGAD00001008128, GSE41666, and GSE14520 datasets, using t-test q-values and fold change (FC) as evaluation criteria. The statistical significance of each gene was determined by calculating p-values. To control the false discovery rate (FDR), q-values were obtained. For the GSE41666 and GSE14520 microarray data, the Storey-Tibshirani method was applied, while for EGAD00001008128 RNA sequencing data, the Benjamini-Hochberg method was used. Genes were regarded as differentially expressed (DEGs) when they met the criteria of q-value < 0.05 and the thresholds for upregulated or downregulated FC.
4.2.2. Enrichment analysis
The Venny 2.1 platform (https://bioinfogp.cnb.csic.es/tools/venny/, accessed on May 25, 2024) was used to generate Venn diagrams. These diagrams illustrate the overlap of DEGs between the GSE41666 dataset and the EGAD00001008128 and GSE14520 datasets. The overlapping genes from these datasets were then classified into two separate groups: IRH (immunotherapy response to hypoxia) genes and HHO (HCC-hypoxia overlap) genes. Our previous studies have already reported the HHO genes [19].
4.3. Hypoxia risk score Model Development
To analyze gene expression (FPKM values) and survival data from HCC patients in the TCGA Liver Cancer (LIHC) database for developing a hypoxia scoring model associated with drug response, we first excluded samples with missing survival time or a survival time of 0 days. This led to a final set of 367 clinical samples being used for training the hypoxia score model. Subsequently, univariate Cox regression analysis (R survival package)was carried out on HHOs, followed by the application of the Least Absolute Shrinkage and Selection Operator (LASSO) algorithm. The R glmnet package was used to perform 10 - fold cross - validation to determine the optimal parameter λ and the hypoxia - related genes (previously reported in our studies) [20]. These selected genes were then combined with IRHs to construct the model. The phreg function from Statsmodels library was used to fit the proportional hazards regression model, and regression coefficients for the model genes were calculated from the TCGA dataset.
The model performance was evaluated using the hazard function λ(t), and the baseline hazard function λ0(t) signified the risk level when there were no covariates. The impact on risk was indicated by the covariate coefficient βi a positive value meant an increased risk, while a negative value indicated a decreased risk.
4.4. Model Validation
4.4.1. Calculation of Hypoxia Score
To evaluate tumor risk under varying durations of hypoxia, the model was further verified using the standardized GSE233802 dataset. This dataset contains cell lines that have been exposed to hypoxia conditions for 0, 24, and 48 hours. Due to the problems of current clinical techniques in directly measuring intertumoral hypoxia, the model was applied to the standardized EGAD00001008128 dataset to evaluate the risk of hypoxia in HCC patients. The calculated hypoxia risk scores were included in the feature set for further analysis.
4.4.2. K-Means Clustering of Hypoxia Score
To categorize patients in the EGAD00001008128 dataset based on their hypoxia scores, unsupervised K-means clustering was applied. The patients in the dataset received biopsy and RNA sequencing before receiving immunotherapy. To validate the direct relationship between the hypoxia score and Progression-Free Survival (PFS) rate, patients with an immunotherapy response were excluded from the dataset. The K-Means function from the scikit-learn library was used with clusters = 2 to divide the samples into two clusters. The clustering was performed on the Hypoxia score variable, and the resulting cluster labels were mapped to High and Low hypoxia groups.
4.4.3. Survival Analysis Using Kaplan-Meier Curves
Kaplan-Meier survival analysis was used to evaluate the survival differences between the High and Low hypoxia groups in the EGAD00001008128 dataset. The KaplanMeierFitter function from the lifelines package was applied to fit survival curves for each of both groups. Progression-free survival (PFS) was used as the time-to-event variable. To determine whether the survival distributions of the High and Low hypoxia groups differed significantly, a log-rank test was performed using the logrank test function from lifelines. A p-value < 0.05 was considered statistically significant.
4.5. Cell experiment
4.5.1. Cell Lines and Culture
The hepatocellular carcinoma (HCC) cell line HepG2 and human T lymphocyte cell line Jurkat T were utilized in this study. Both cell lines were procured from the Chinese Academy of Sciences Cell Bank. HepG2 cells were cultured in Dulbecco’s Modified Eagle Medium (DMEM; Gibco) supplemented with 10% fetal bovine serum (FBS; Gibco) and 1% penicillin-streptomycin (P/S; Sigma-Aldrich). Jurkat T cells were cultured in RPMI-1640 medium (Gibco) containing 10% FBS and 1% P/S. All cells were incubated at 37°C in a humidified atmosphere with 5% CO₂.
4.5.2. Establishment Co-Culture System
Jurkat T cells were activated with 2 μg/mL phytohemagglutinin (PHA; Sigma-Aldrich) for 48 h. HepG2 cells were labeled with CellTrace™ reagent (Thermo Fisher Scientific) at a 1:1000 dilution (cell density: 1 × 10⁶ cells/mL) and incubated at 37°C for 30 minutes. Then, HepG2 cells were seeded into 6-well plates (2 × 10⁵ cells/well) containing DMEM 10% FBS, 1% P/S, 10 ng/mL IFN-γ (PeproTech) and 200 μM cobalt chloride (CoCl₂; Sigma-Aldrich) for 24 h. After that, HepG2 medium was replaced with fresh DMEM containing 10% FBS, 1% P/S, 200 μM CoCl₂ and PD-L1 inhibitor (PD-L1i) at concentrations ranging from 0 μM to 1 μM. The activated Jurkat T cells were added to HepG2 cells at an E/T ratio (effective cells to target cells) of 10:1 and co-cultured for 48 h. HepG2 cells were exposed to multiple rounds of hypoxia induction and co-culture. To better determine the appropriate concentration of the PD-L1 inhibitor, the NIS - Element AR software from Nikon was used to analyze the proliferation rate of cells before and after co-culture. Based on the convolutional neural network (CNN) algorithm of artificial intelligence, this software can identify and calculate the changes in the fill area by cells in the culture dish before and after co-culture. The experimental workflow is shown in Figure 7.
4.5.3. NOXA Gene Knockdown in Hypoxia-Resistant Cells
HepG2 cells resistant to hypoxia (HepG2-R) were seeded at 2 × 10⁵ cells/well in 6-well plates. After 24 h, HepG2-R cells were transfected with four distinct siRNAs targeting NOXA (siNOXA1–4; Jima Company) using Lipofectamine™ 3000 (Thermo Fisher Scientific). The siRNA-Lipofectamine complexes were added to HepG2-R cells in Opti-MEM™ medium (Thermo Fisher Scientific) for 6 h. After that, the medium was replaced with containing DMEM 10% FBS and 1% P/S for 12h. Untreated HepG2-R cells served as control group. After transfection, the cell co-culture experiments were conducted. The transfection experimental workflow is shown in Figure 8.
4.5.4. Western Blot Analysis
After co-culture, HepG2 cells and HepG2-R cells were lysed in RIPA buffer (Thermo Fisher Scientific) containing protease inhibitors. Protein concentrations were quantified using a Quick BCA Protein Assay Kit (Thermo Fisher Scientific). Lysates were denatured in Laemmli buffer at 98°C for 10 minutes, resolved on 12% or 15% SDS-polyacrylamide (SDS-PAGE) gels. Proteins were transferred to PVDF membranes (Millipore). The membranes were blocked with 5% skim milk in TBST for 1h, incubated overnight at 4°C with primary antibodies. The following antibodies were used: anti- HIF1α (1:4000, Abcam, ab179483), anti-NOXA (1:1000, Abcam, ab13654) and anti-β-Actin (1:5000, CST, 4967S). The membranes were then incubated with horseradish peroxidase (HRP)-conjugated secondary antibodies (1:5000, Thermo fisher, 31462) for 1 hour at room temperature. β-Actin was used as a control. Protein bands were visualized using ECL reagent (Millipore) and analyzed with ImageJ software.
4.5.5. RT- qPCR Analysis
Total RNA was extracted using TRIzol reagent (Thermo Fisher Scientific), quantified via NanoDrop 2000C (Thermo Fisher Scientific), and reverse-transcribed into cDNA using a Takara Bio kit. The qPCR experiment was performed using a Real-Time fluorescent qPCR instrument (Roche LightCycler 480) in combination with SYBR Green PCR Master Mix (Vazyme, Q411 - 02/03). Primer sequences are listed in Table 1. Data were normalized to β-actin and analyzed using the 2−ΔΔCt method.
4.5.6. Apoptosis Assay
The cells (Jurkat T and HepG2 cells) that have completed co-culture were collected and resuspended in a binding buffer (1 × 10⁶ cells/mL). The co-culture of HepG2 cells without hypoxia treatment was used as the control group for establishing the hypoxia-resistant (HepG2-R) cell line. The co-culture of HepG2-R cells without NOXA knockdown treatment was used as the control group for the transfection experiment. Cell suspensions (100 μL) were stained with 5 μL FITC Annexin V and 5 μL propidium iodide (PI; BD Pharmingen) for 15 minutes in the dark. After adding 200 μL binding buffer, apoptosis was analyzed using a BD FACSCantoTM II flow cytometer. Data were processed with FlowJo software (v10.8.1).
4.5.7. Statistical analysis
Using software tools, including ImageJ, flowjo, and Excel, to analyze cell experimental results. The results were presented as the mean ± standard deviation. Statistical analysis was performed using one-way analysis of variance (ANOVA), T-test and Cohen's d quantifies. Satisfying the criterion p-value < 0.05 was considered statistically significant.
5. Conclusions
In conclusion, our research reveals the critical role of hypoxia in regulating the immune response and apoptosis of HCC cells. We established a hypoxia risk score model, developed a hypoxia-resistant HepG2-R cell line, and validated the regulatory role of NOXA in apoptosis within resistant cell lines. This study provides important insights into the immune resistance induced by the hypoxic tumor microenvironment. Regulating NOXA expression has the potential to enhance immunotherapy efficacy and reduce treatment resistance in HCC. Future research should further investigate the molecular mechanisms through which NOXA regulates apoptosis under hypoxic conditions and explore the potential therapeutic effects of combining NOXA inhibition with PD-L1 inhibitors.
Supplementary Materials
The following supporting information can be downloaded at the website of this paper posted on Preprints.org.
Author Contributions
Conceptualization, M.H. and L.W.C.C.; methodology, M.H., T.L., and L.W.C.C.; software, M.H. and X.C.; validation, M.H., T.L., X.D., R.C. and S.C.C.W.; formal analysis, M.H. and L.W.C.C.; investigation, M.H. and L.W.C.C.; data curation, X.C. and R.C.; writing—original draft preparation, M.H. and L.W.C.C.; writing—review and editing, M.H., W.C.S.T., and L.W.C.C.; visualization, M.H., X.C. and R.C.; supervision, L.W.C.C.; project administration, L.W.C.C. All authors have read and agreed to the published version of the manuscript.
Funding
This study was not supported by any funding.
Institutional Review Board Statement
Not applicable for this study due to the use of public data.
Informed Consent Statement
Patient consent was waived due to public data.
Data Availability Statement
Conflicts of Interest
The authors declare no conflict of interest.
References
- Calderon-Martinez, E.; Landazuri-Navas, S.; Vilchez, E.; Cantu-Hernandez, R.; Mosquera-Moscoso, J.; Encalada, S.; Al Lami, Z.; Zevallos-Delgado, C.; Cinicola, J. Prognostic Scores and Survival Rates by Etiology of Hepatocellular Carcinoma: A Review. J Clin Med Res 2023, 15, 200–207. [Google Scholar] [CrossRef] [PubMed]
- Leowattana, W.; Leowattana, T.; Leowattana, P. Systemic treatment for unresectable hepatocellular carcinoma. World J Gastroenterol 2023, 29, 1551–1568. [Google Scholar] [CrossRef] [PubMed]
- Feng, M.Y.; Chan, L.L.; Chan, S.L. Drug Treatment for Advanced Hepatocellular Carcinoma: First-Line and Beyond. Curr Oncol 2022, 29, 5489–5507. [Google Scholar] [CrossRef] [PubMed]
- Han, Y.; Liu, D.; Li, L. PD-1/PD-L1 pathway: current researches in cancer. Am J Cancer Res 2020, 10, 727–742. [Google Scholar] [PubMed]
- Emami Nejad, A.; Najafgholian, S.; Rostami, A.; Sistani, A.; Shojaeifar, S.; Esparvarinha, M.; Nedaeinia, R.; Haghjooy Javanmard, S.; Taherian, M.; Ahmadlou, M.; et al. The role of hypoxia in the tumor microenvironment and development of cancer stem cell: a novel approach to developing treatment. Cancer Cell Int 2021, 21, 62. [Google Scholar] [CrossRef] [PubMed]
- Ciepla, J.; Smolarczyk, R. Tumor hypoxia unveiled: insights into microenvironment, detection tools and emerging therapies. Clin Exp Med 2024, 24, 235. [Google Scholar] [CrossRef] [PubMed]
- Harrison, L.R.; Micha, D.; Brandenburg, M.; Simpson, K.L.; Morrow, C.J.; Denneny, O.; Hodgkinson, C.; Yunus, Z.; Dempsey, C.; Roberts, D.; et al. Hypoxic human cancer cells are sensitized to BH-3 mimetic-induced apoptosis via downregulation of the Bcl-2 protein Mcl-1. J Clin Invest 2011, 121, 1075–1087. [Google Scholar] [CrossRef] [PubMed]
- Kim, J.Y.; Ahn, H.J.; Ryu, J.H.; Suk, K.; Park, J.H. BH3-only protein Noxa is a mediator of hypoxic cell death induced by hypoxia-inducible factor 1alpha. J Exp Med 2004, 199, 113–124. [Google Scholar] [CrossRef] [PubMed]
- Huynh, K.N.; Rao, S.; Roth, B.; Bryan, T.; Fernando, D.M.; Dayyani, F.; Imagawa, D.; Abi-Jaoudeh, N. Targeting Hypoxia-Inducible Factor-1alpha for the Management of Hepatocellular Carcinoma. Cancers (Basel) 2023, 15. [Google Scholar] [CrossRef] [PubMed]
- Chen, C.; Lou, T. Hypoxia inducible factors in hepatocellular carcinoma. Oncotarget 2017, 8, 46691–46703. [Google Scholar] [CrossRef] [PubMed]
- Chowdhury, M.; Das, P.K. Hypoxia: Intriguing Feature in Cancer Cell Biology. ChemMedChem 2024, 19, e202300551. [Google Scholar] [CrossRef] [PubMed]
- Chen, Z.; Han, F.; Du, Y.; Shi, H.; Zhou, W. Hypoxic microenvironment in cancer: molecular mechanisms and therapeutic interventions. Signal Transduct Target Ther 2023, 8, 70. [Google Scholar] [CrossRef]
- Jiacheng, D.; Jiayue, C.; Ying, G.; Shaohua, W.; Wenhui, L.; Xinyu, H. Research progress and challenges of the PD-1/PD-L1 axis in gliomas. Cell Biosci 2024, 14, 123. [Google Scholar] [CrossRef] [PubMed]
- Bandopadhyay, S.; Patranabis, S. Mechanisms of HIF-driven immunosuppression in tumour microenvironment. J Egypt Natl Canc Inst 2023, 35, 27. [Google Scholar] [CrossRef] [PubMed]
- Doffo, J.; Bamopoulos, S.A.; Kose, H.; Orben, F.; Zang, C.; Pons, M.; den Dekker, A.T.; Brouwer, R.W.W.; Baluapuri, A.; Habringer, S.; et al. NOXA expression drives synthetic lethality to RUNX1 inhibition in pancreatic cancer. Proc Natl Acad Sci U S A 2022, 119. [Google Scholar] [CrossRef] [PubMed]
- Yan, X.; Chen, D.; Wang, Y.; Guo, Y.; Tong, C.; Wei, J.; Zhang, Y.; Wu, Z.; Han, W. Identification of NOXA as a pivotal regulator of resistance to CAR T-cell therapy in B-cell malignancies. Signal Transduct Target Ther 2022, 7, 98. [Google Scholar] [CrossRef] [PubMed]
- Jiang, G.; Zheng, J.Y.; Ren, S.N.; Yin, W.; Xia, X.; Li, Y.; Wang, H.L. A comprehensive workflow for optimizing RNA-seq data analysis. BMC Genomics 2024, 25, 631. [Google Scholar] [CrossRef] [PubMed]
- Zhu, A.X.; Abbas, A.R.; de Galarreta, M.R.; Guan, Y.; Lu, S.; Koeppen, H.; Zhang, W.; Hsu, C.H.; He, A.R.; Ryoo, B.Y.; et al. Molecular correlates of clinical response and resistance to atezolizumab in combination with bevacizumab in advanced hepatocellular carcinoma. Nat Med 2022, 28, 1599–1611. [Google Scholar] [CrossRef] [PubMed]
- Huang, M.; Yang, S.; Tai, W.C.S.; Zhang, L.; Zhou, Y.; Cho, W.C.S.; Chan, L.W.C.; Wong, S.C.C. Bioinformatics Identification of Regulatory Genes and Mechanism Related to Hypoxia-Induced PD-L1 Inhibitor Resistance in Hepatocellular Carcinoma. Int J Mol Sci 2023, 24. [Google Scholar] [CrossRef] [PubMed]
- Mohan, H.; Chan, W.C. Hypoxia-related genes and PD-L1 inhibitor resistance in hepatocellular carcinoma. JCO Global Oncology 2023, 9, 158–158. [Google Scholar] [CrossRef]
Figure 1.
Differential Expression Analysis. (a) A volcano plot for the EGAD00001008128 dataset; (b) A volcano plot for the GSE41666 dataset; (c) A volcano plot for the GSE14520 dataset; (d) IRH genes: The overlapping DEGs between the EGAD00001008128 and GSE41666 datasets; (e) HHO genes: The overlapping DEGs between the GSE41666 and GSE14520 datasets.
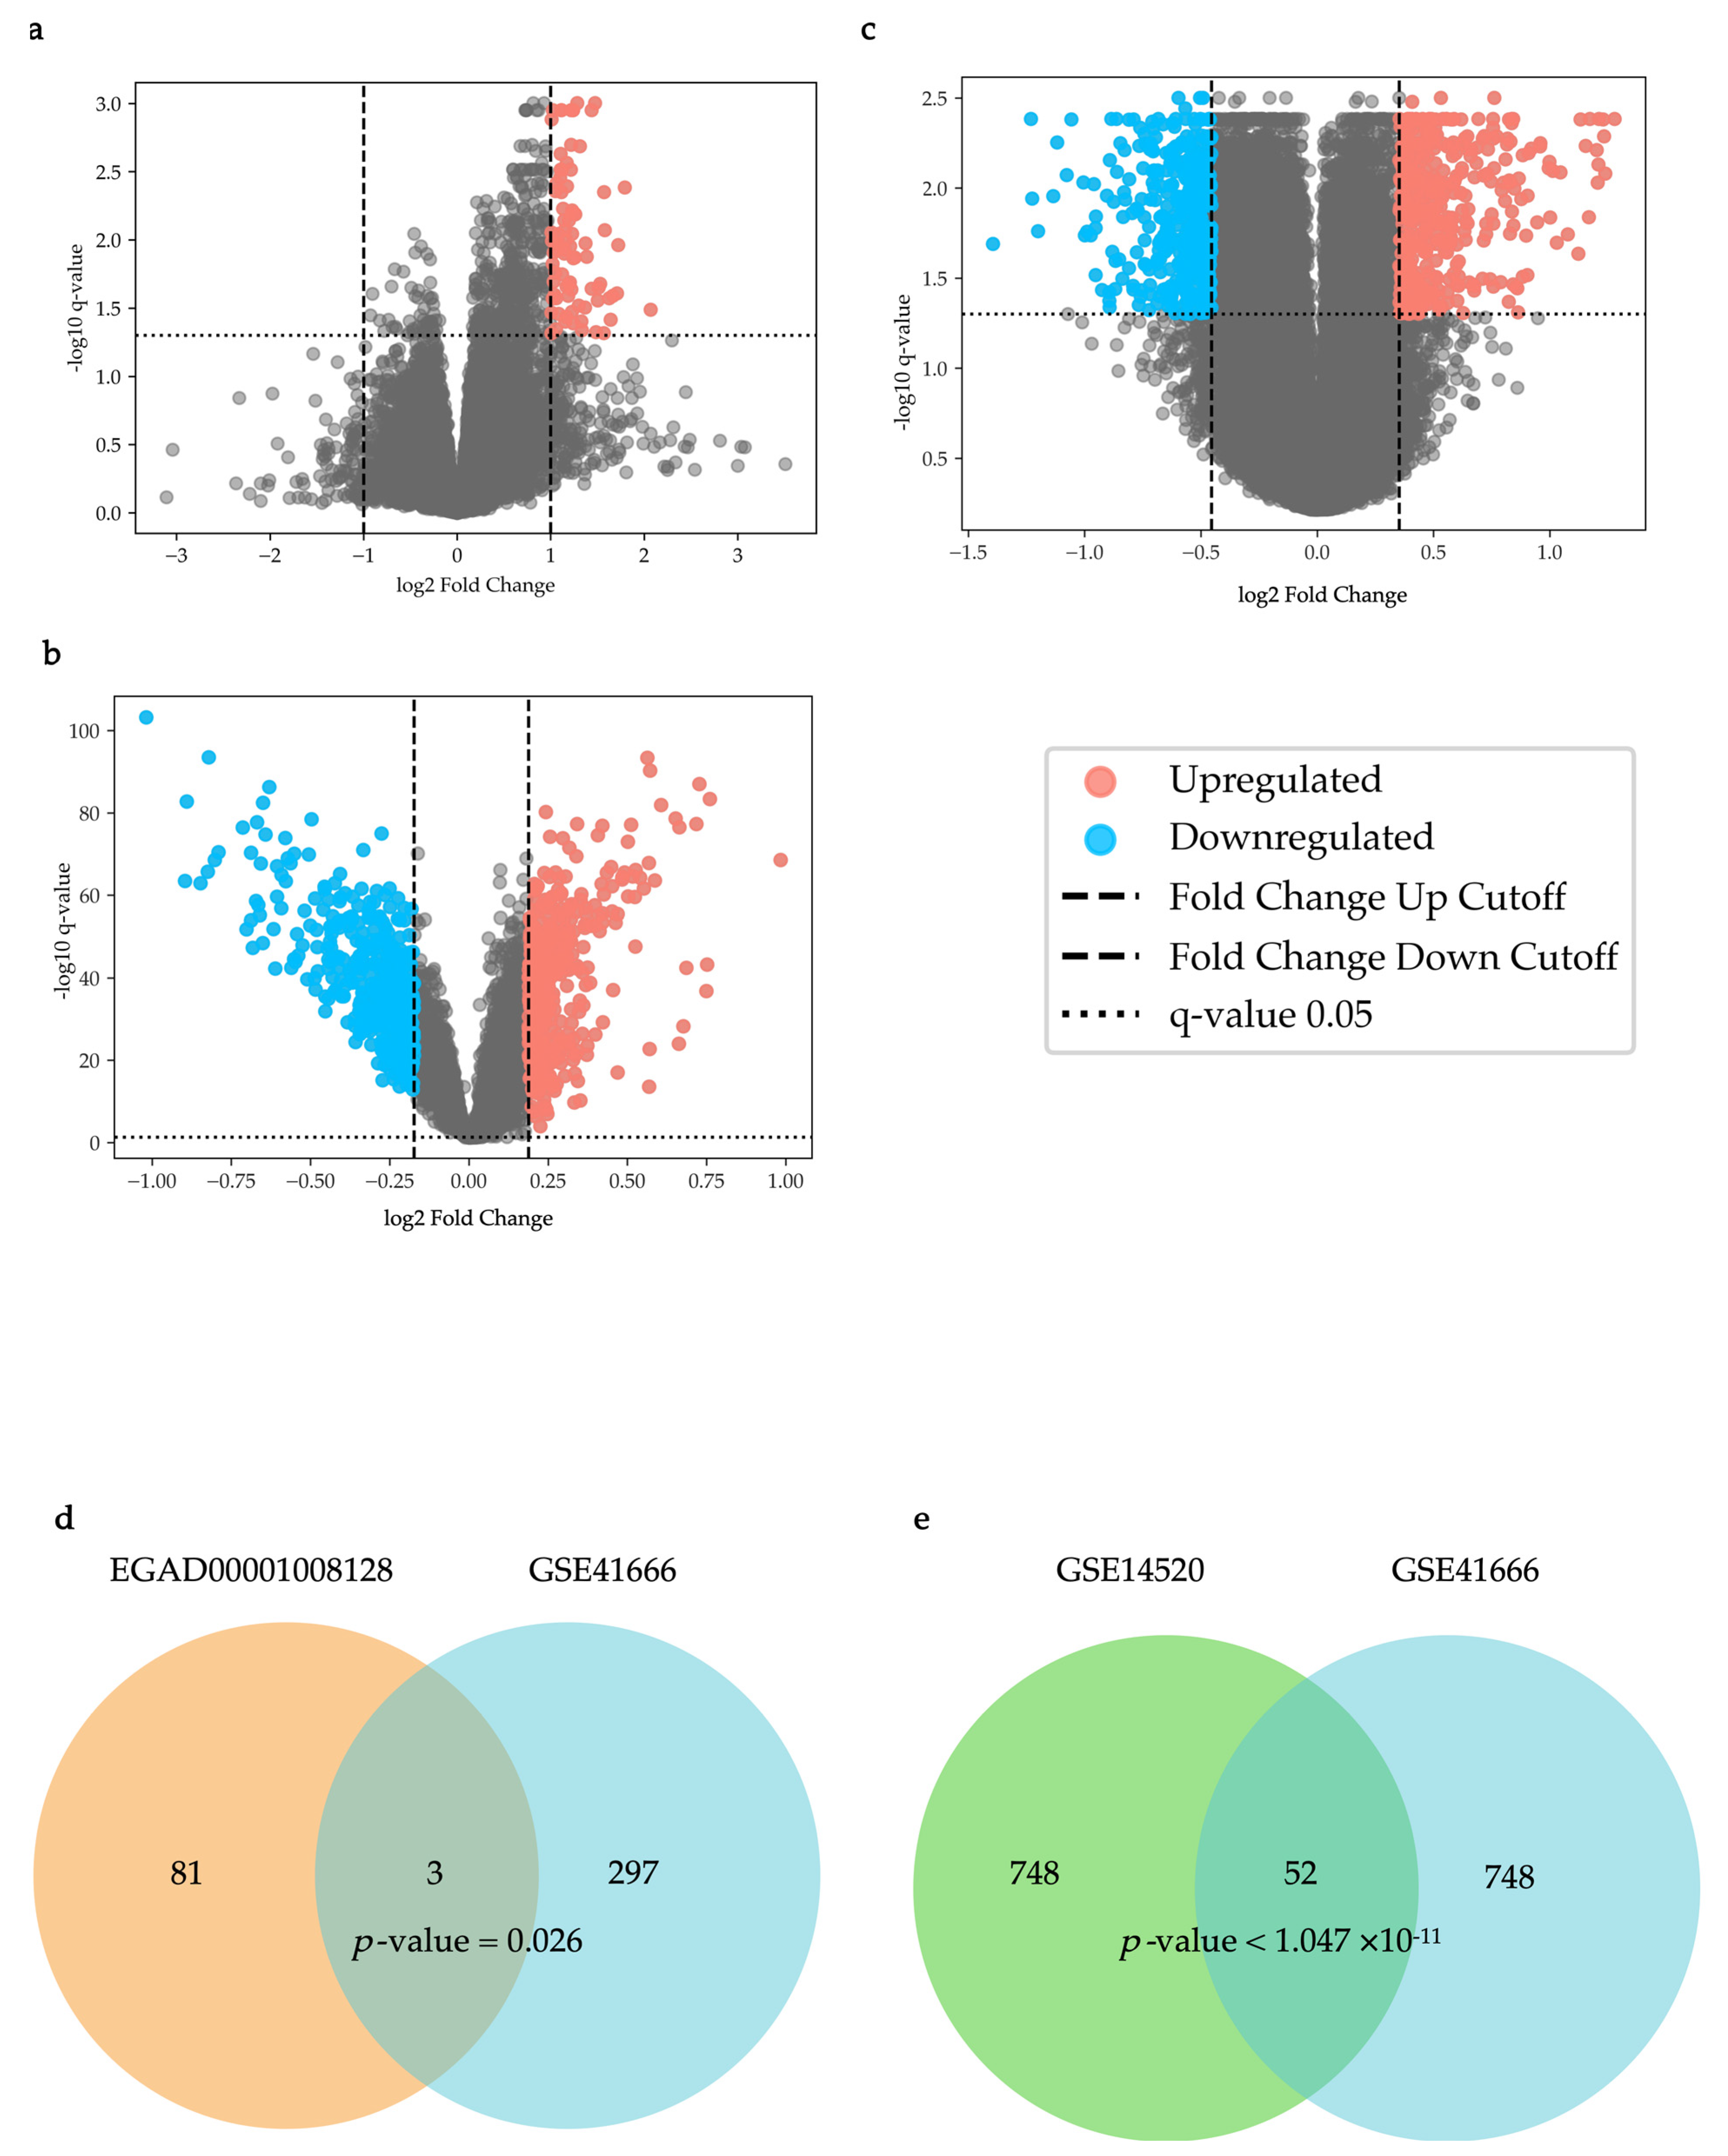
Figure 2.
Hypoxia Scoring Model Validation. (a) Hypoxia risk scores for HepG2 cells exposed to hypoxia for 0h, 24h, and 48h in the GSE233802 dataset (p-value < 0.02). (b) K-Means clustering of hypoxia risk scores, dividing patients into high- and low-risk groups in the EGAD00001008128 dataset. (c) Kaplan-Meier survival curves between high hypoxia risk and low hypoxia risk patient group (p-value = 0.0236).
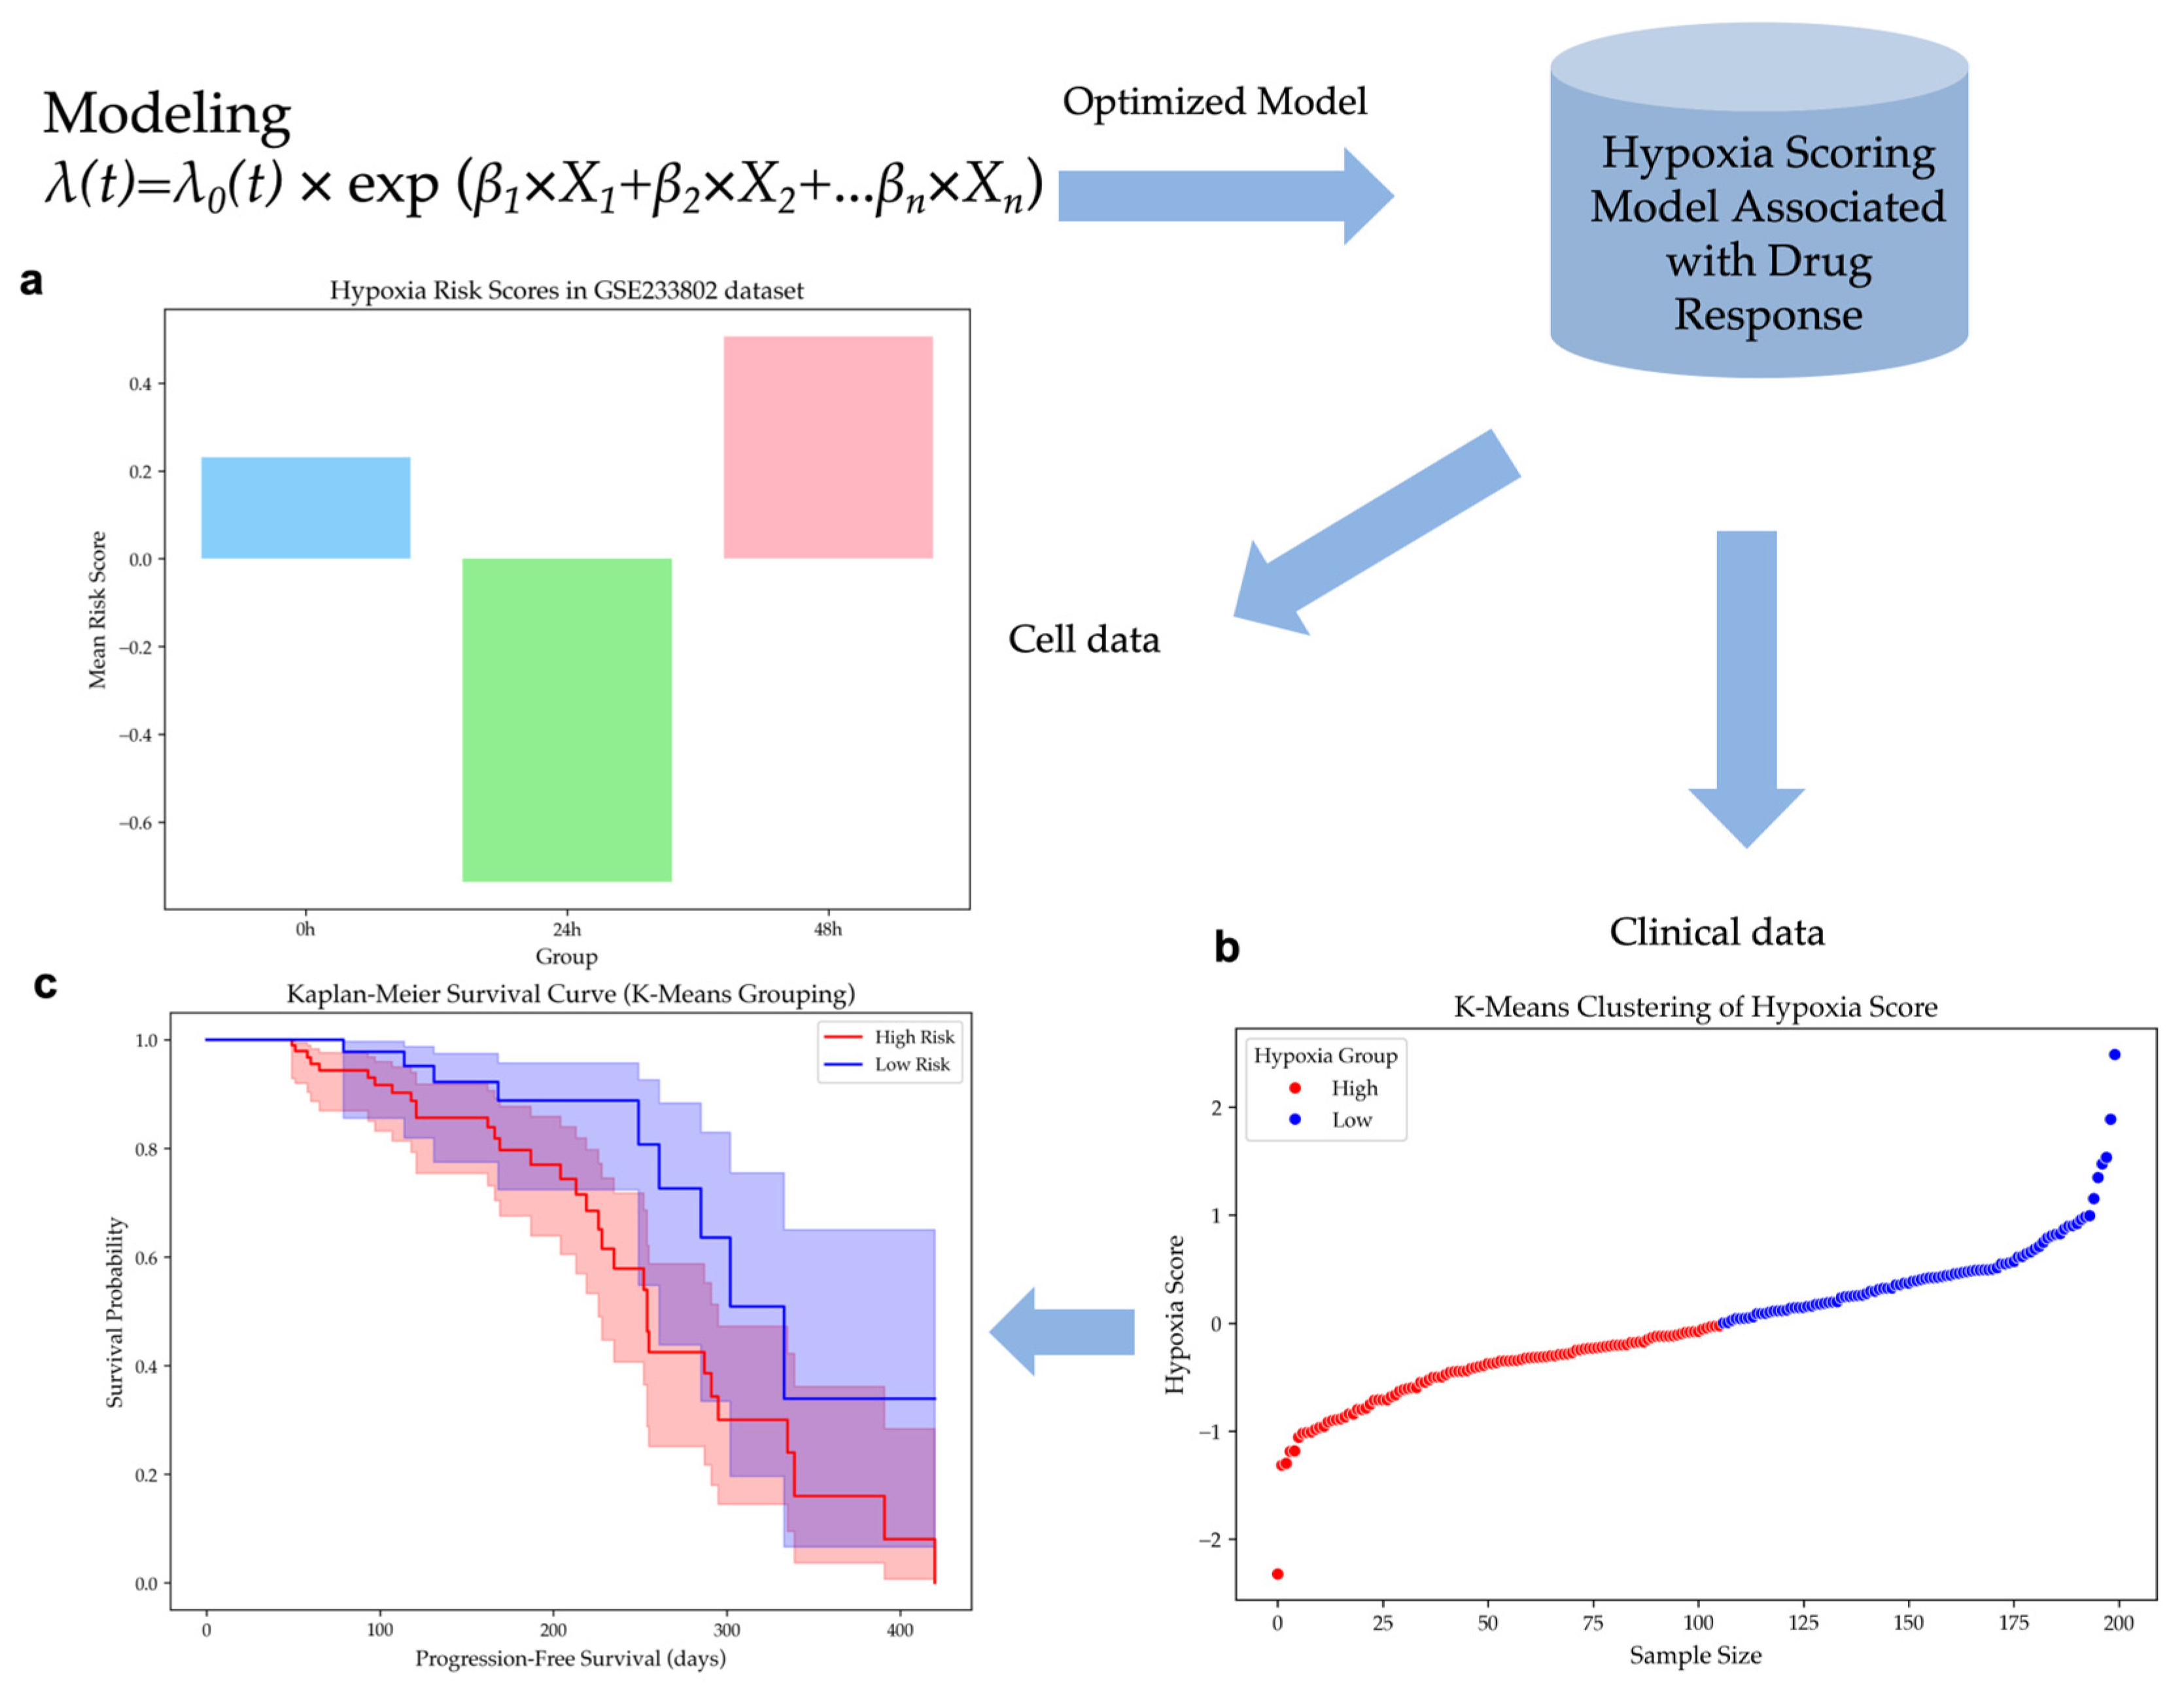
Figure 3.
Establishment of hypoxia-induced drug-resistant cells. (a) Western blotting was used to detect the effect of CoCl₂ on the expression of HIF-1α in HepG2 cells. The grayscale values were analyzed using ImageJ software. β-Actin was used as the internal control. Protein expression was normalized to the control group. (b) Apoptosis analysis of co-culture cell lines. Graphs show the percentage of live cells, early apoptosis cells, and late apoptosis cells in normoxic, hypoxic-treated 1- and 4- round HepG2 cells (normoxic : 1 round hypoxia, p-value = 0.0005; normoxic : 4 rounds hypoxia, p-value < 0.0001; 1 round hypoxia: 4 rounds hypoxia , p-value < 0.00001). (c) Proliferation comparison of co-cultured cells under the microscope. Before co-culture, only HepG2 cells were contained. After co-culture, both Jurkat T cells and HepG2 cells were contained. The graph on the right displays the fill area of cells at different PD-L1 inhibitor concentrations. The data are expressed as mean ± SD, ns p>0.05, **p < 0.01, ***p < 0.001 vs control.
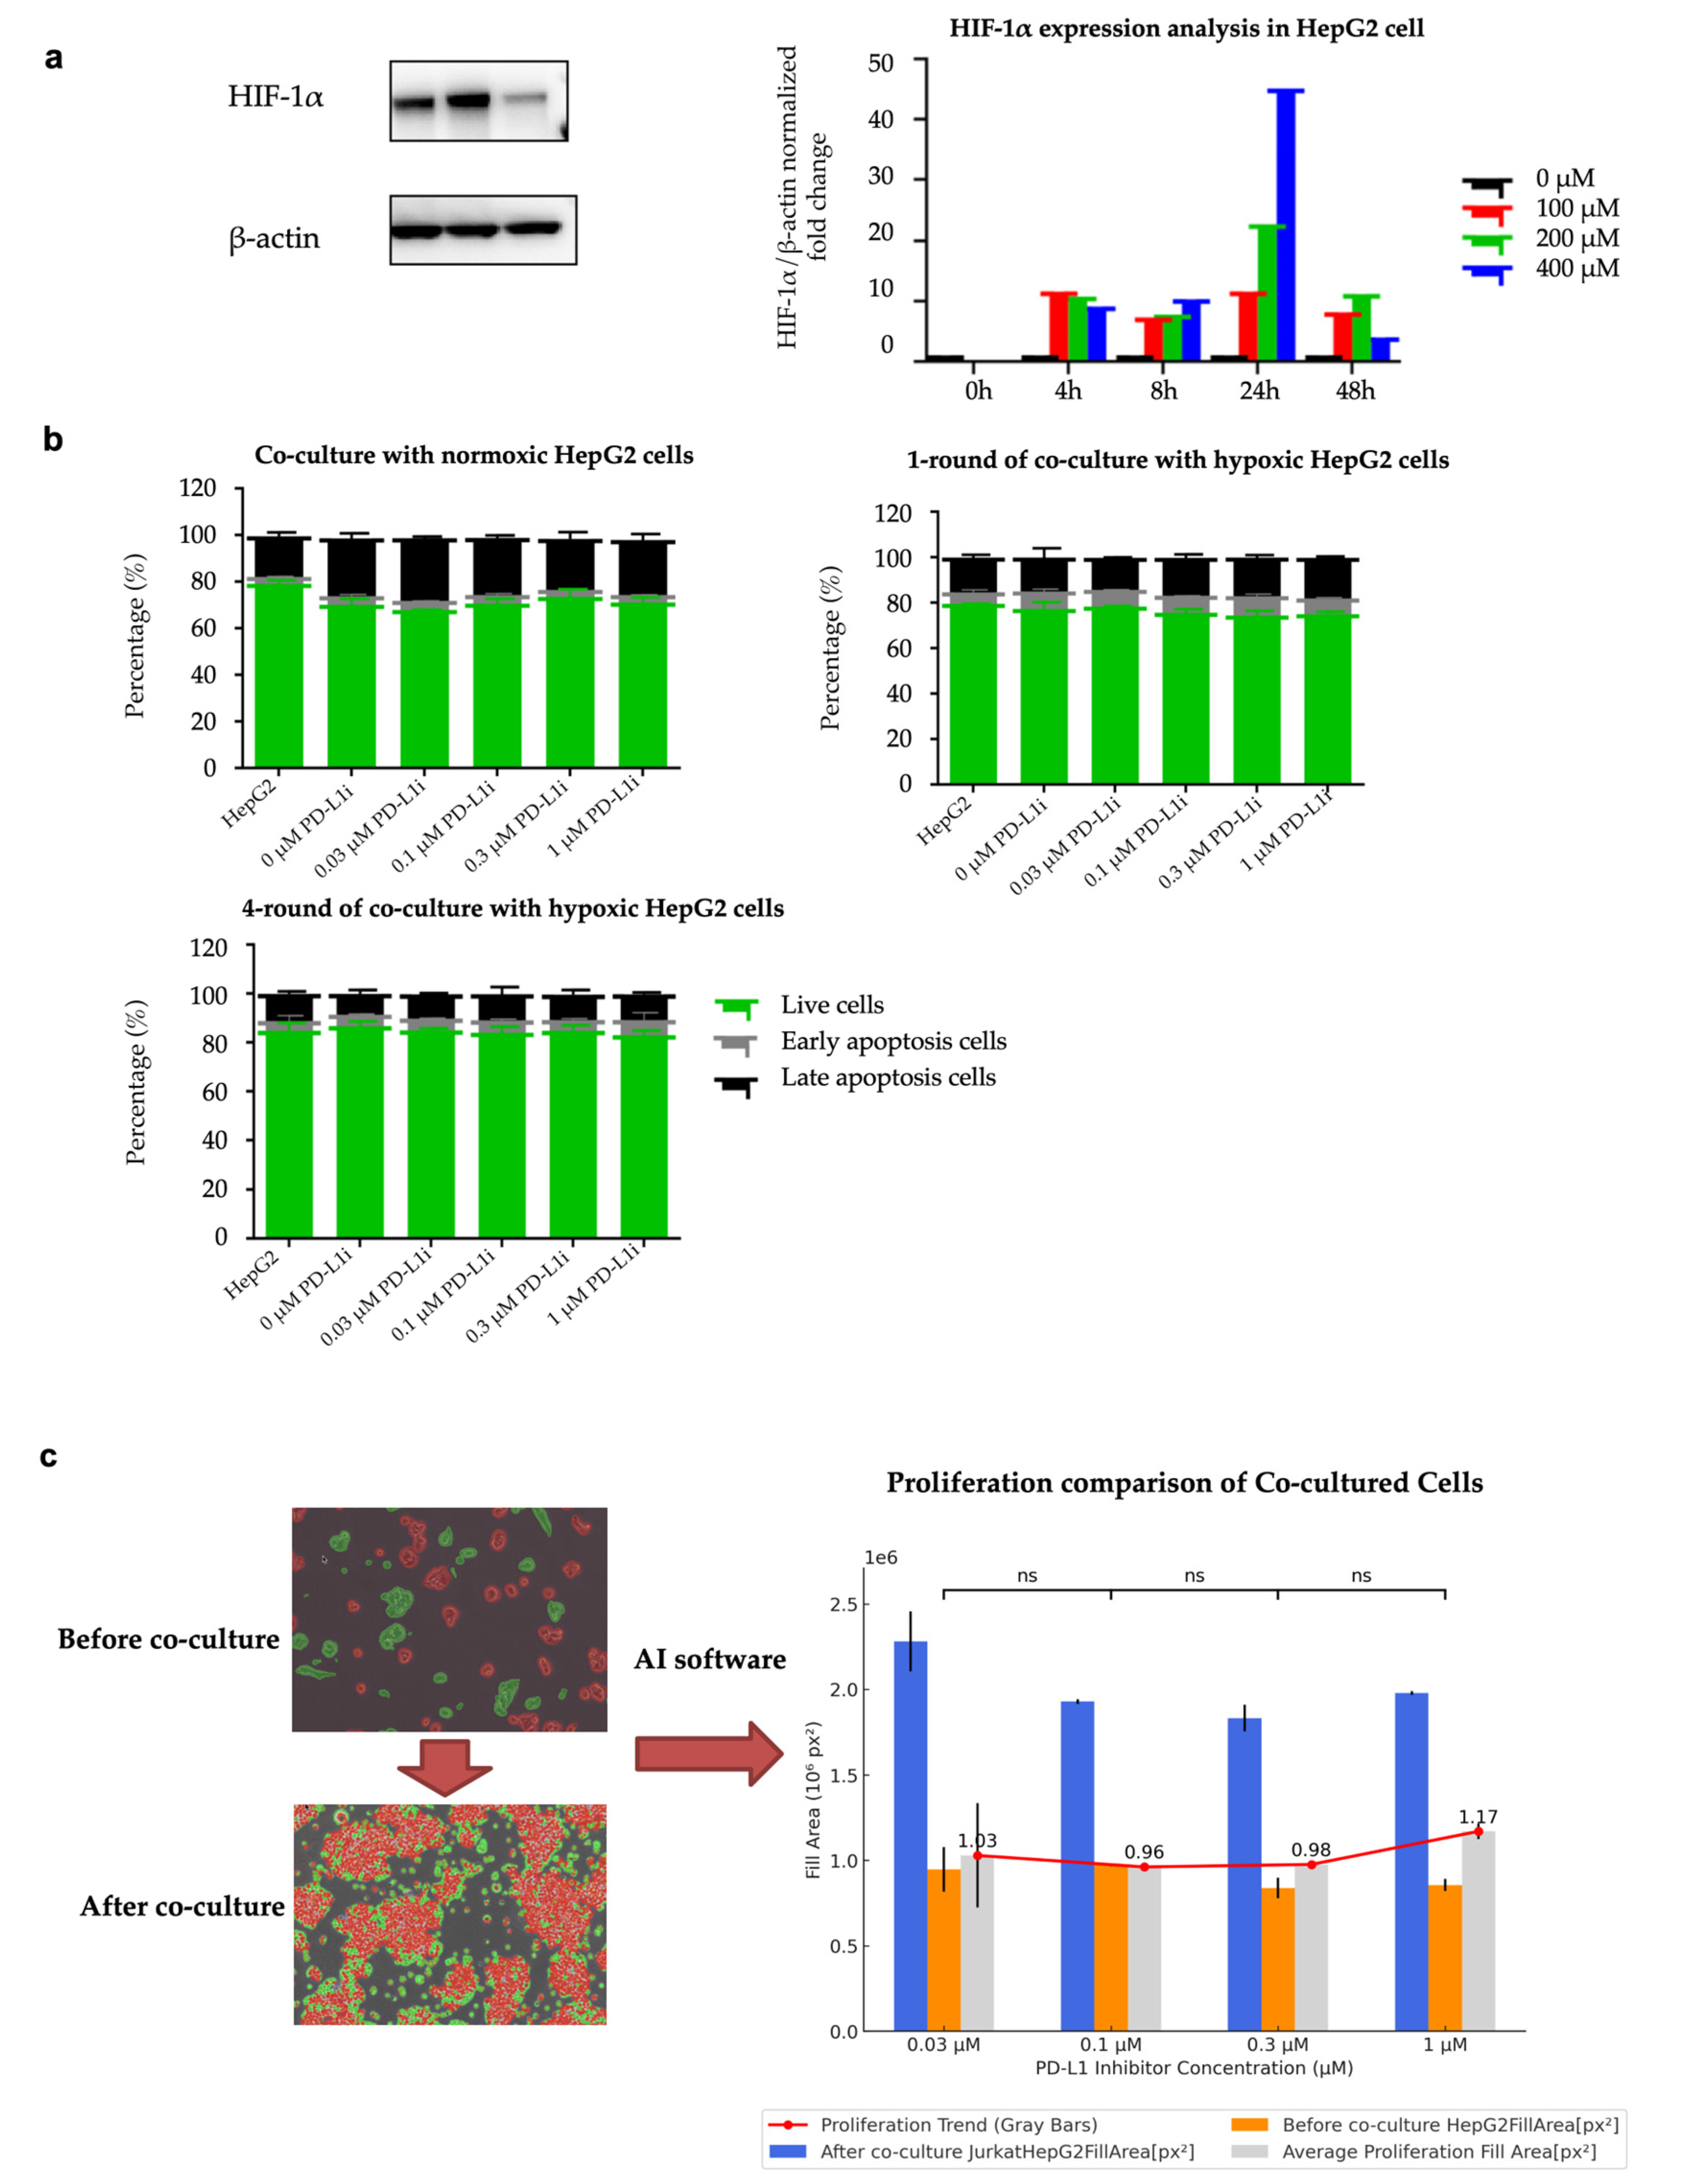
Figure 4.
NOXA Knockdown Efficiency in HepG2-R Cells. (a) Western blot analysis showing the protein expression levels of NOXA in HepG2-R cells transfected with 4 different siRNAs. The bar graph below represents the relative NOXA protein levels. (b) qPCR analysis of NOXA mRNA expression in HepG2-R cells transfected with siRNA4 and the control group. The data are expressed as mean ± SD, ns p-value >0.05, **p-value < 0.01, ***p-value < 0.001 vs control.
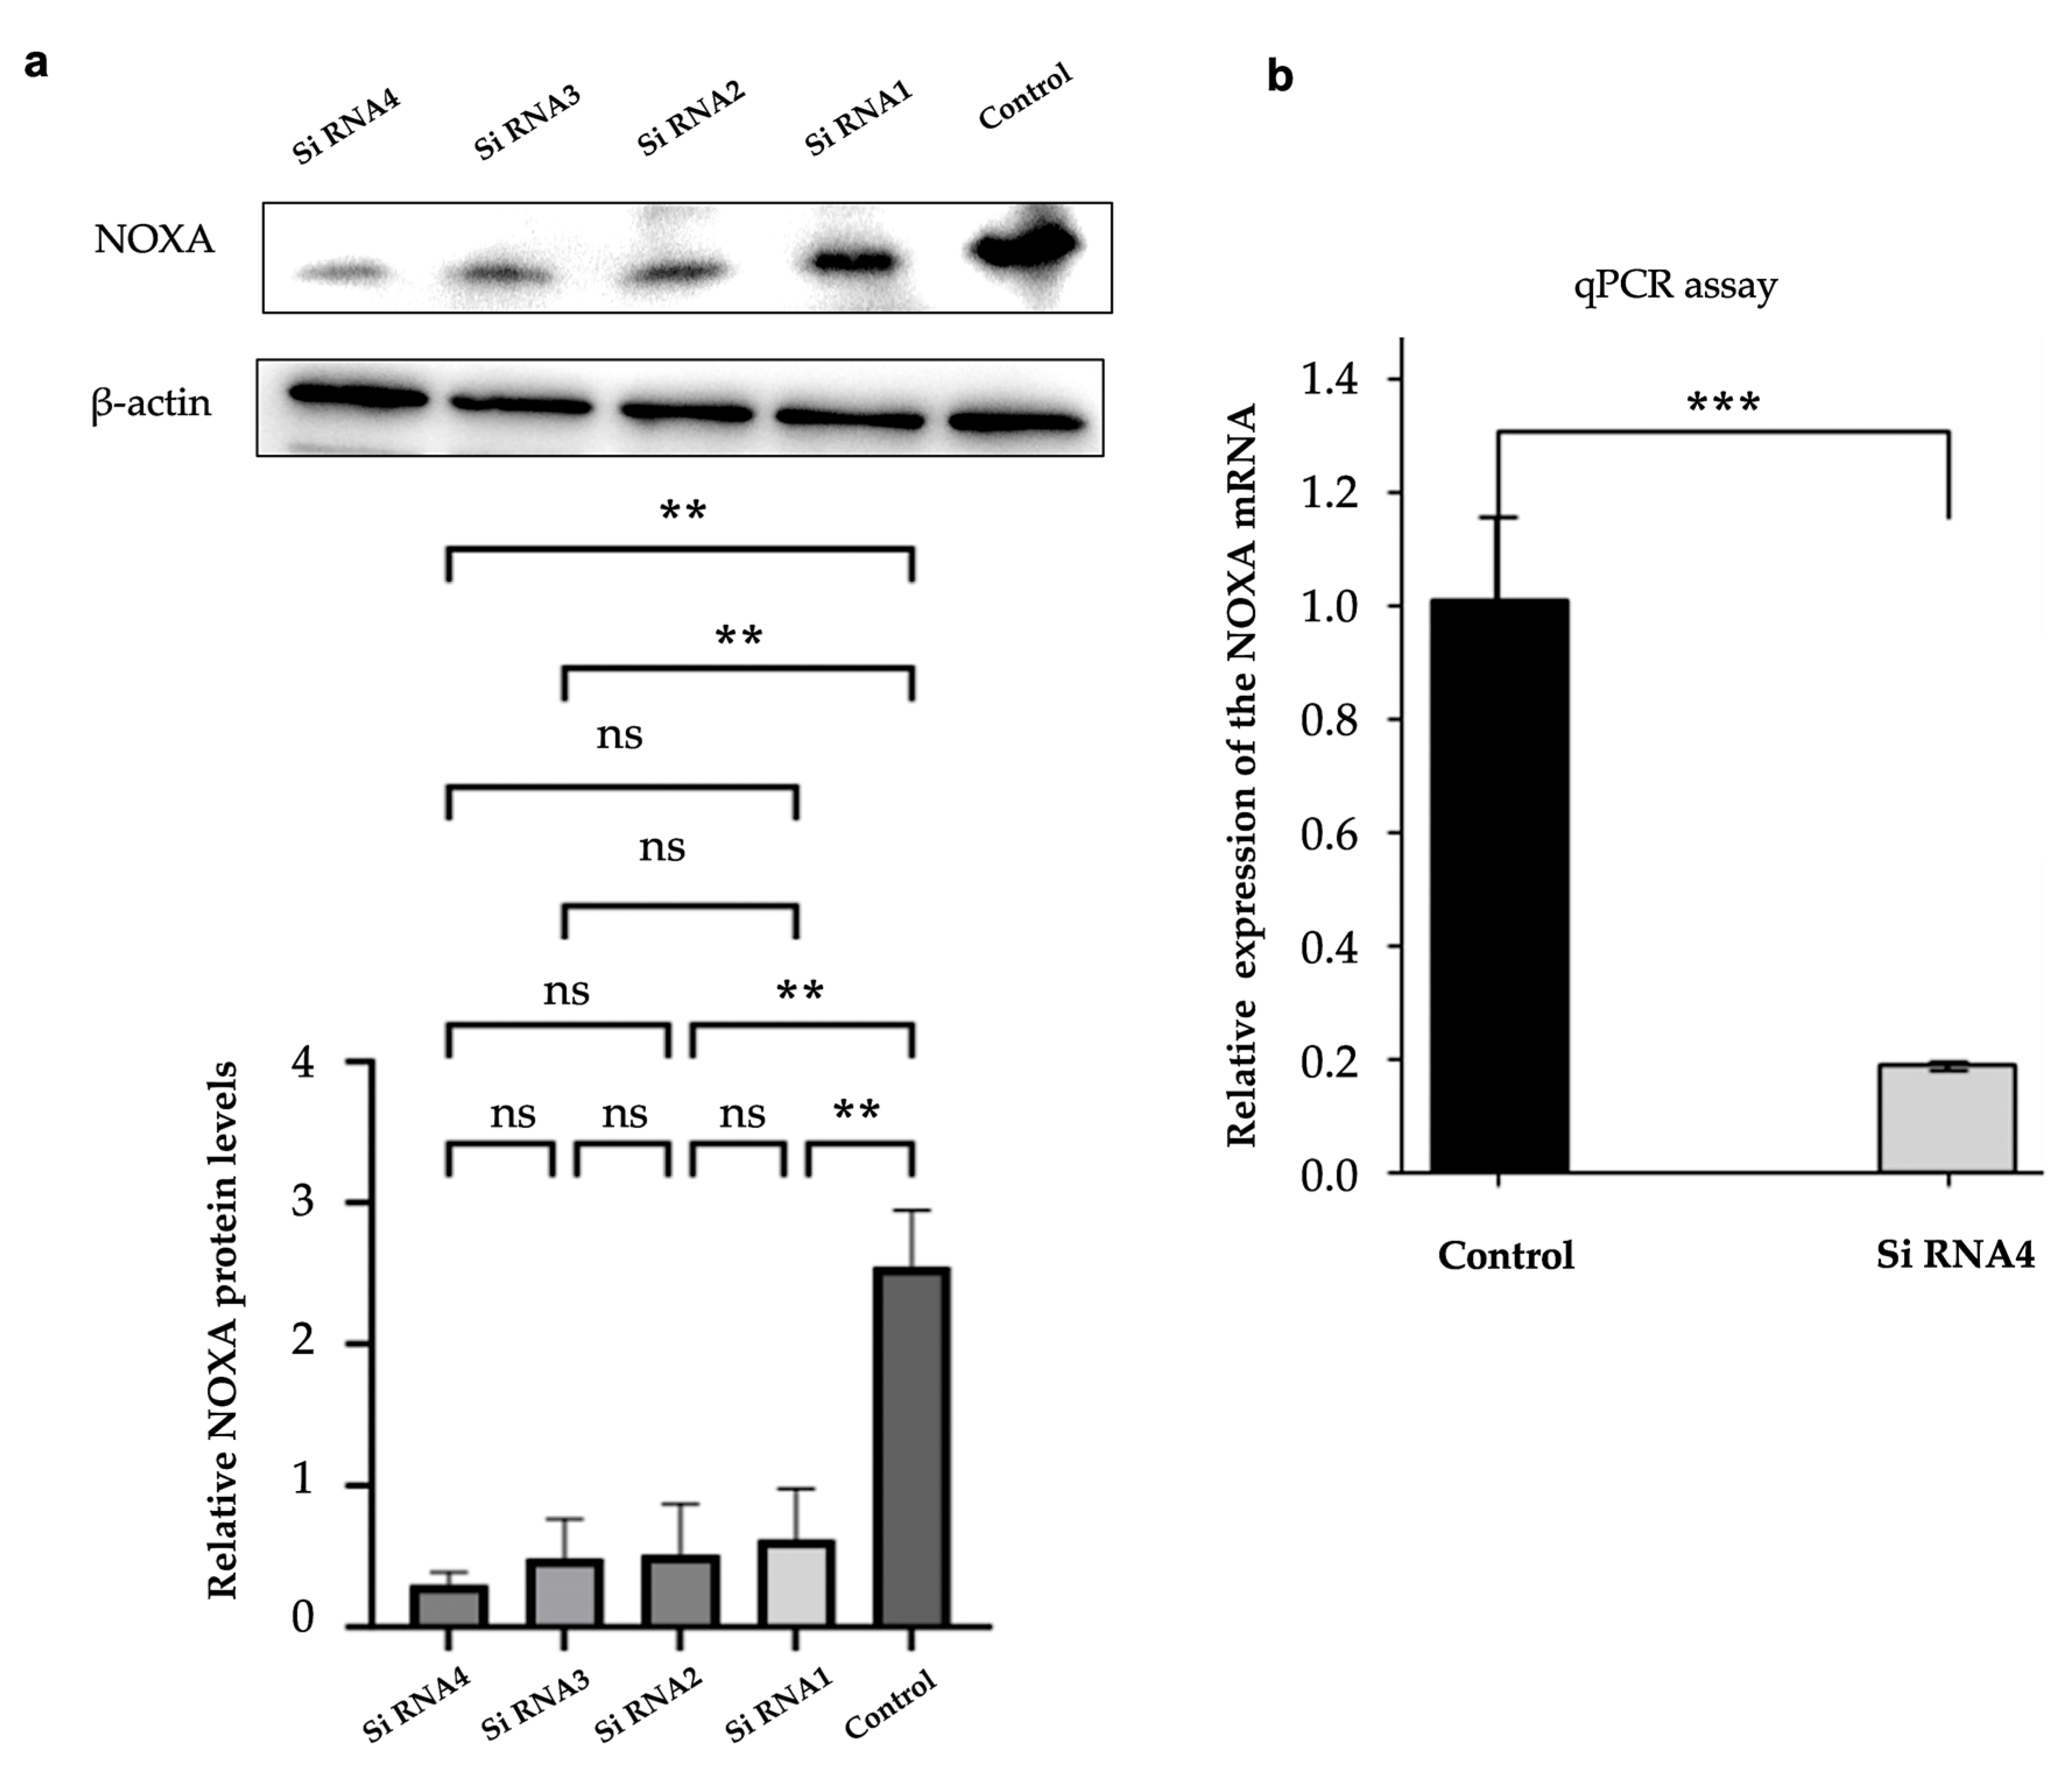
Figure 5.
Effect of siNOXA on HepG2-R cell apoptosis. (a) Flow cytometry analysis shows the distribution of live, early apoptosis, and late apoptosis cells in the control and siNOXA groups. (b) Bar chart shows the percentage of live cells, early apoptosis cells, and late apoptosis cells in the control and siNOXA groups. Cohen's d value for early apoptosis rate is 1.5109. Cohen's d value for late apoptosis rate is 1.2976.
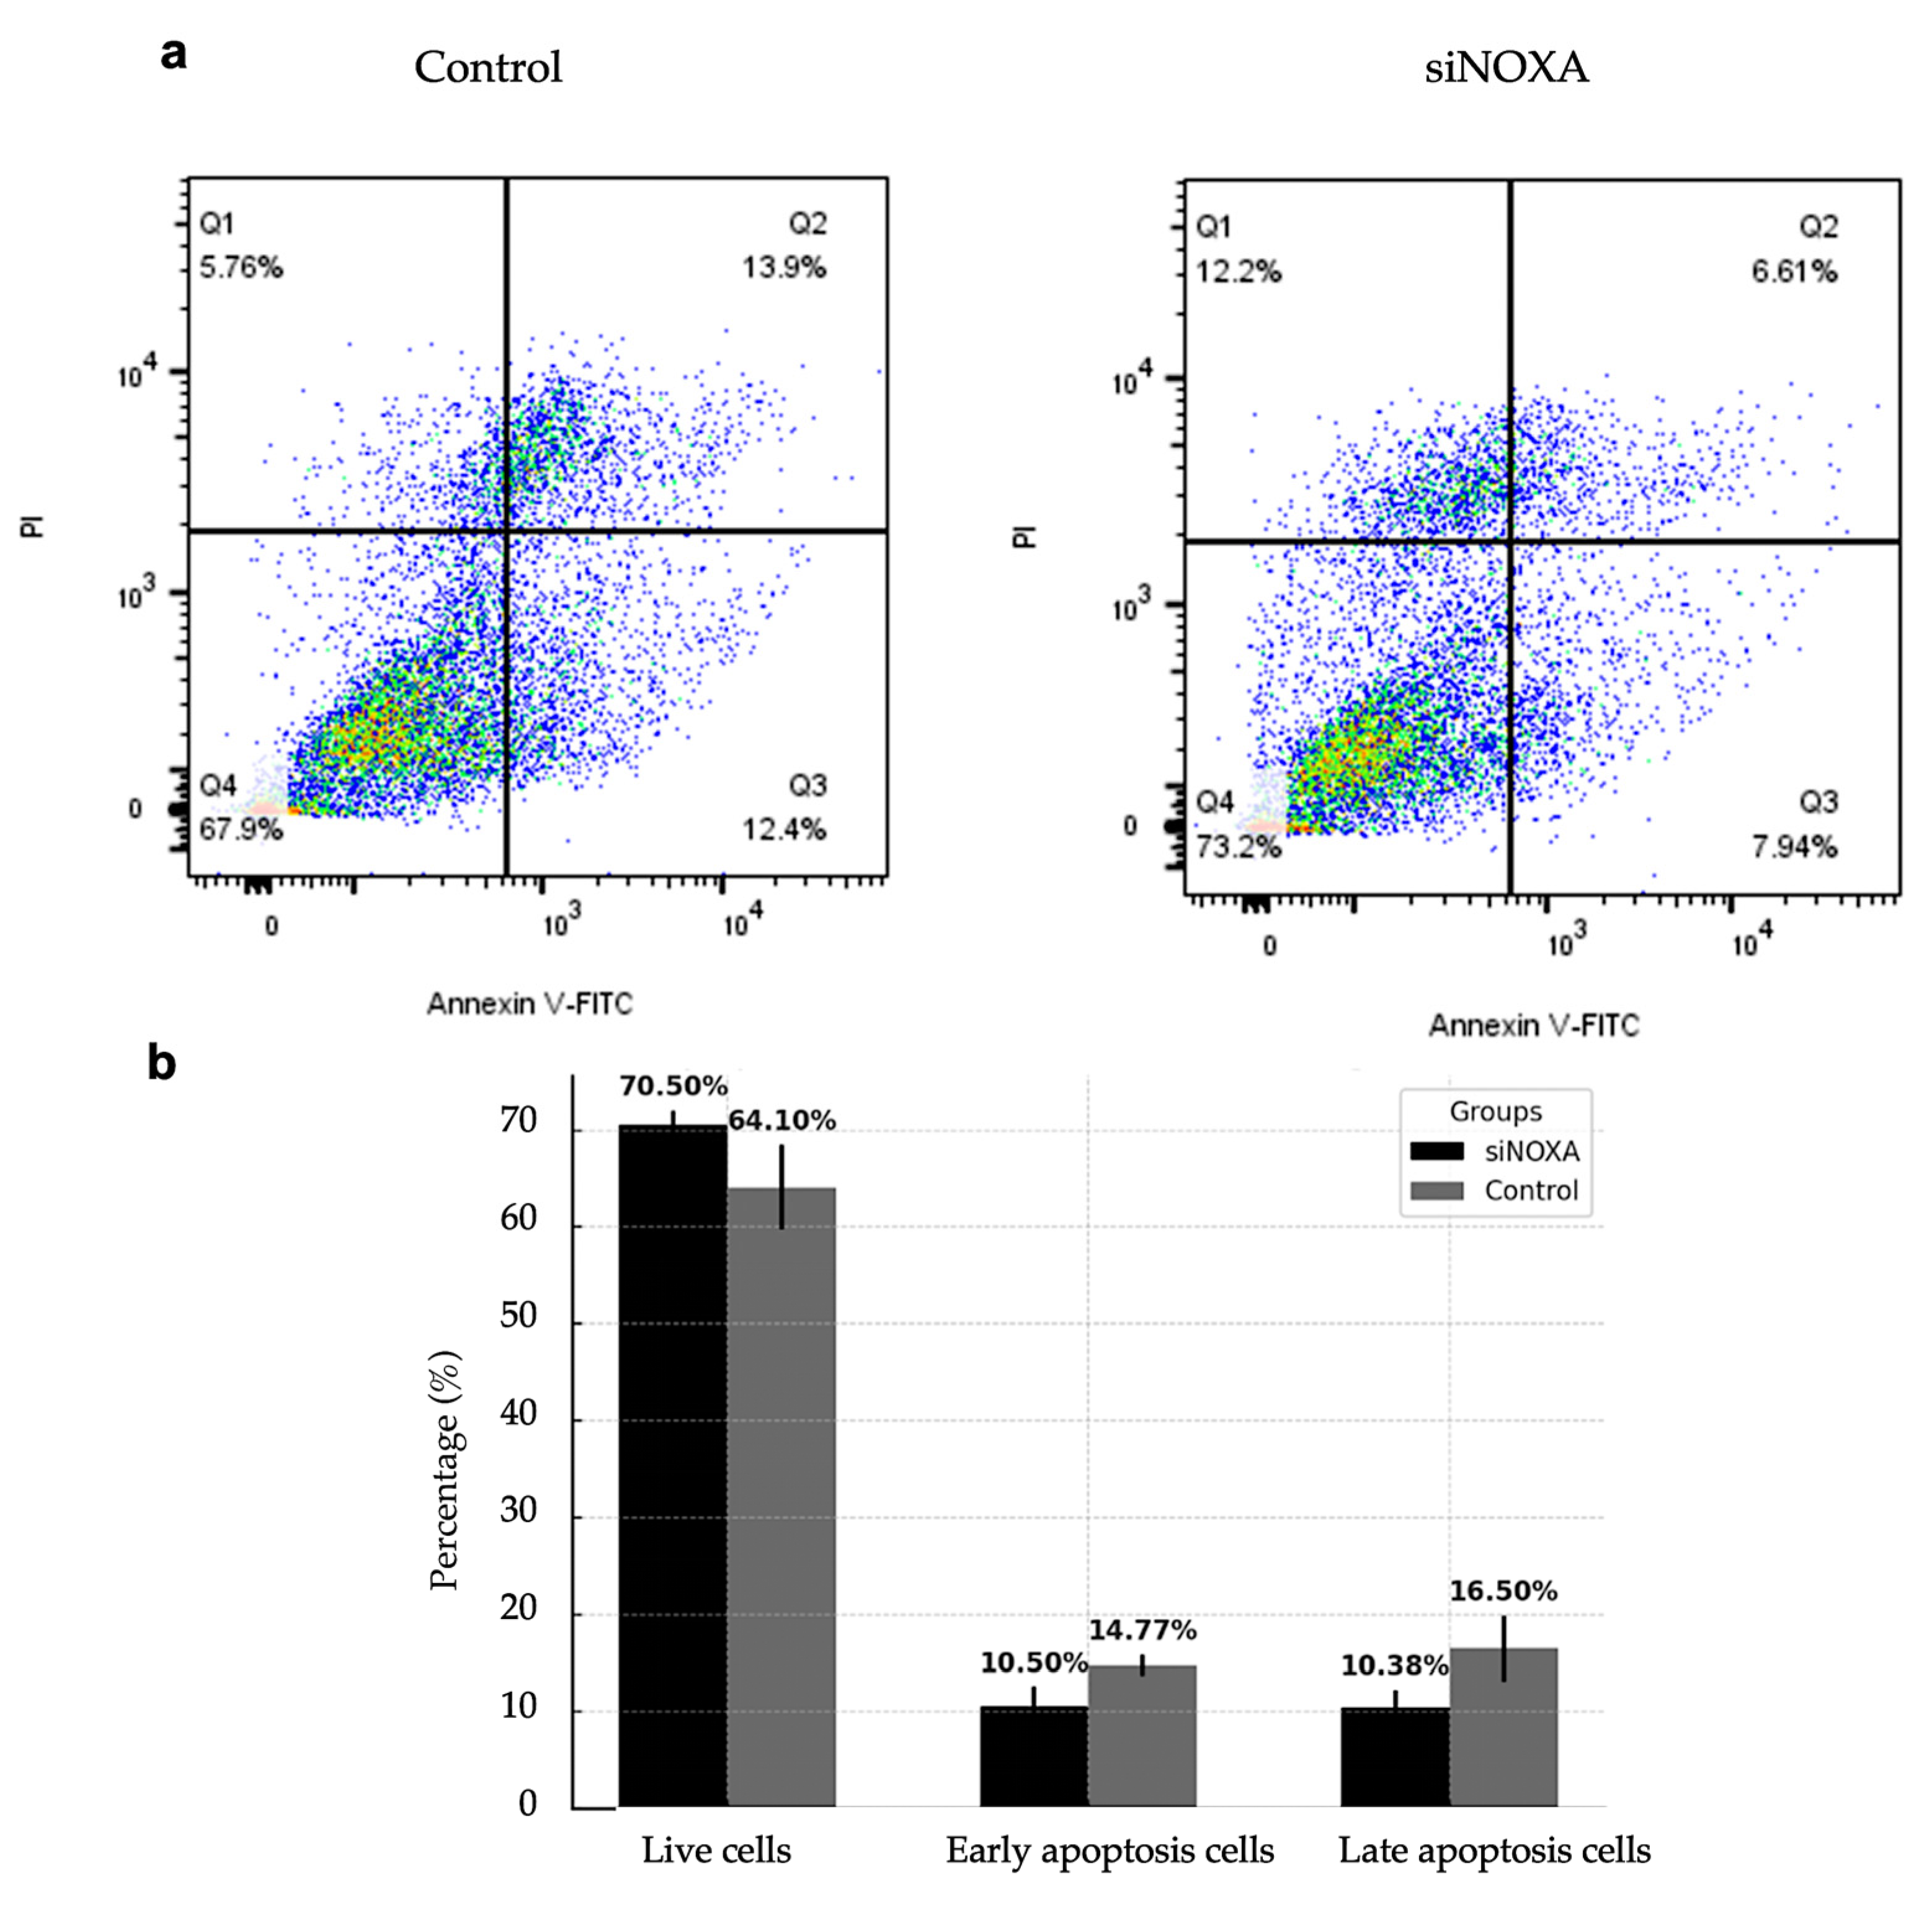
Figure 6.
The overview of computational hypoxia risk model.
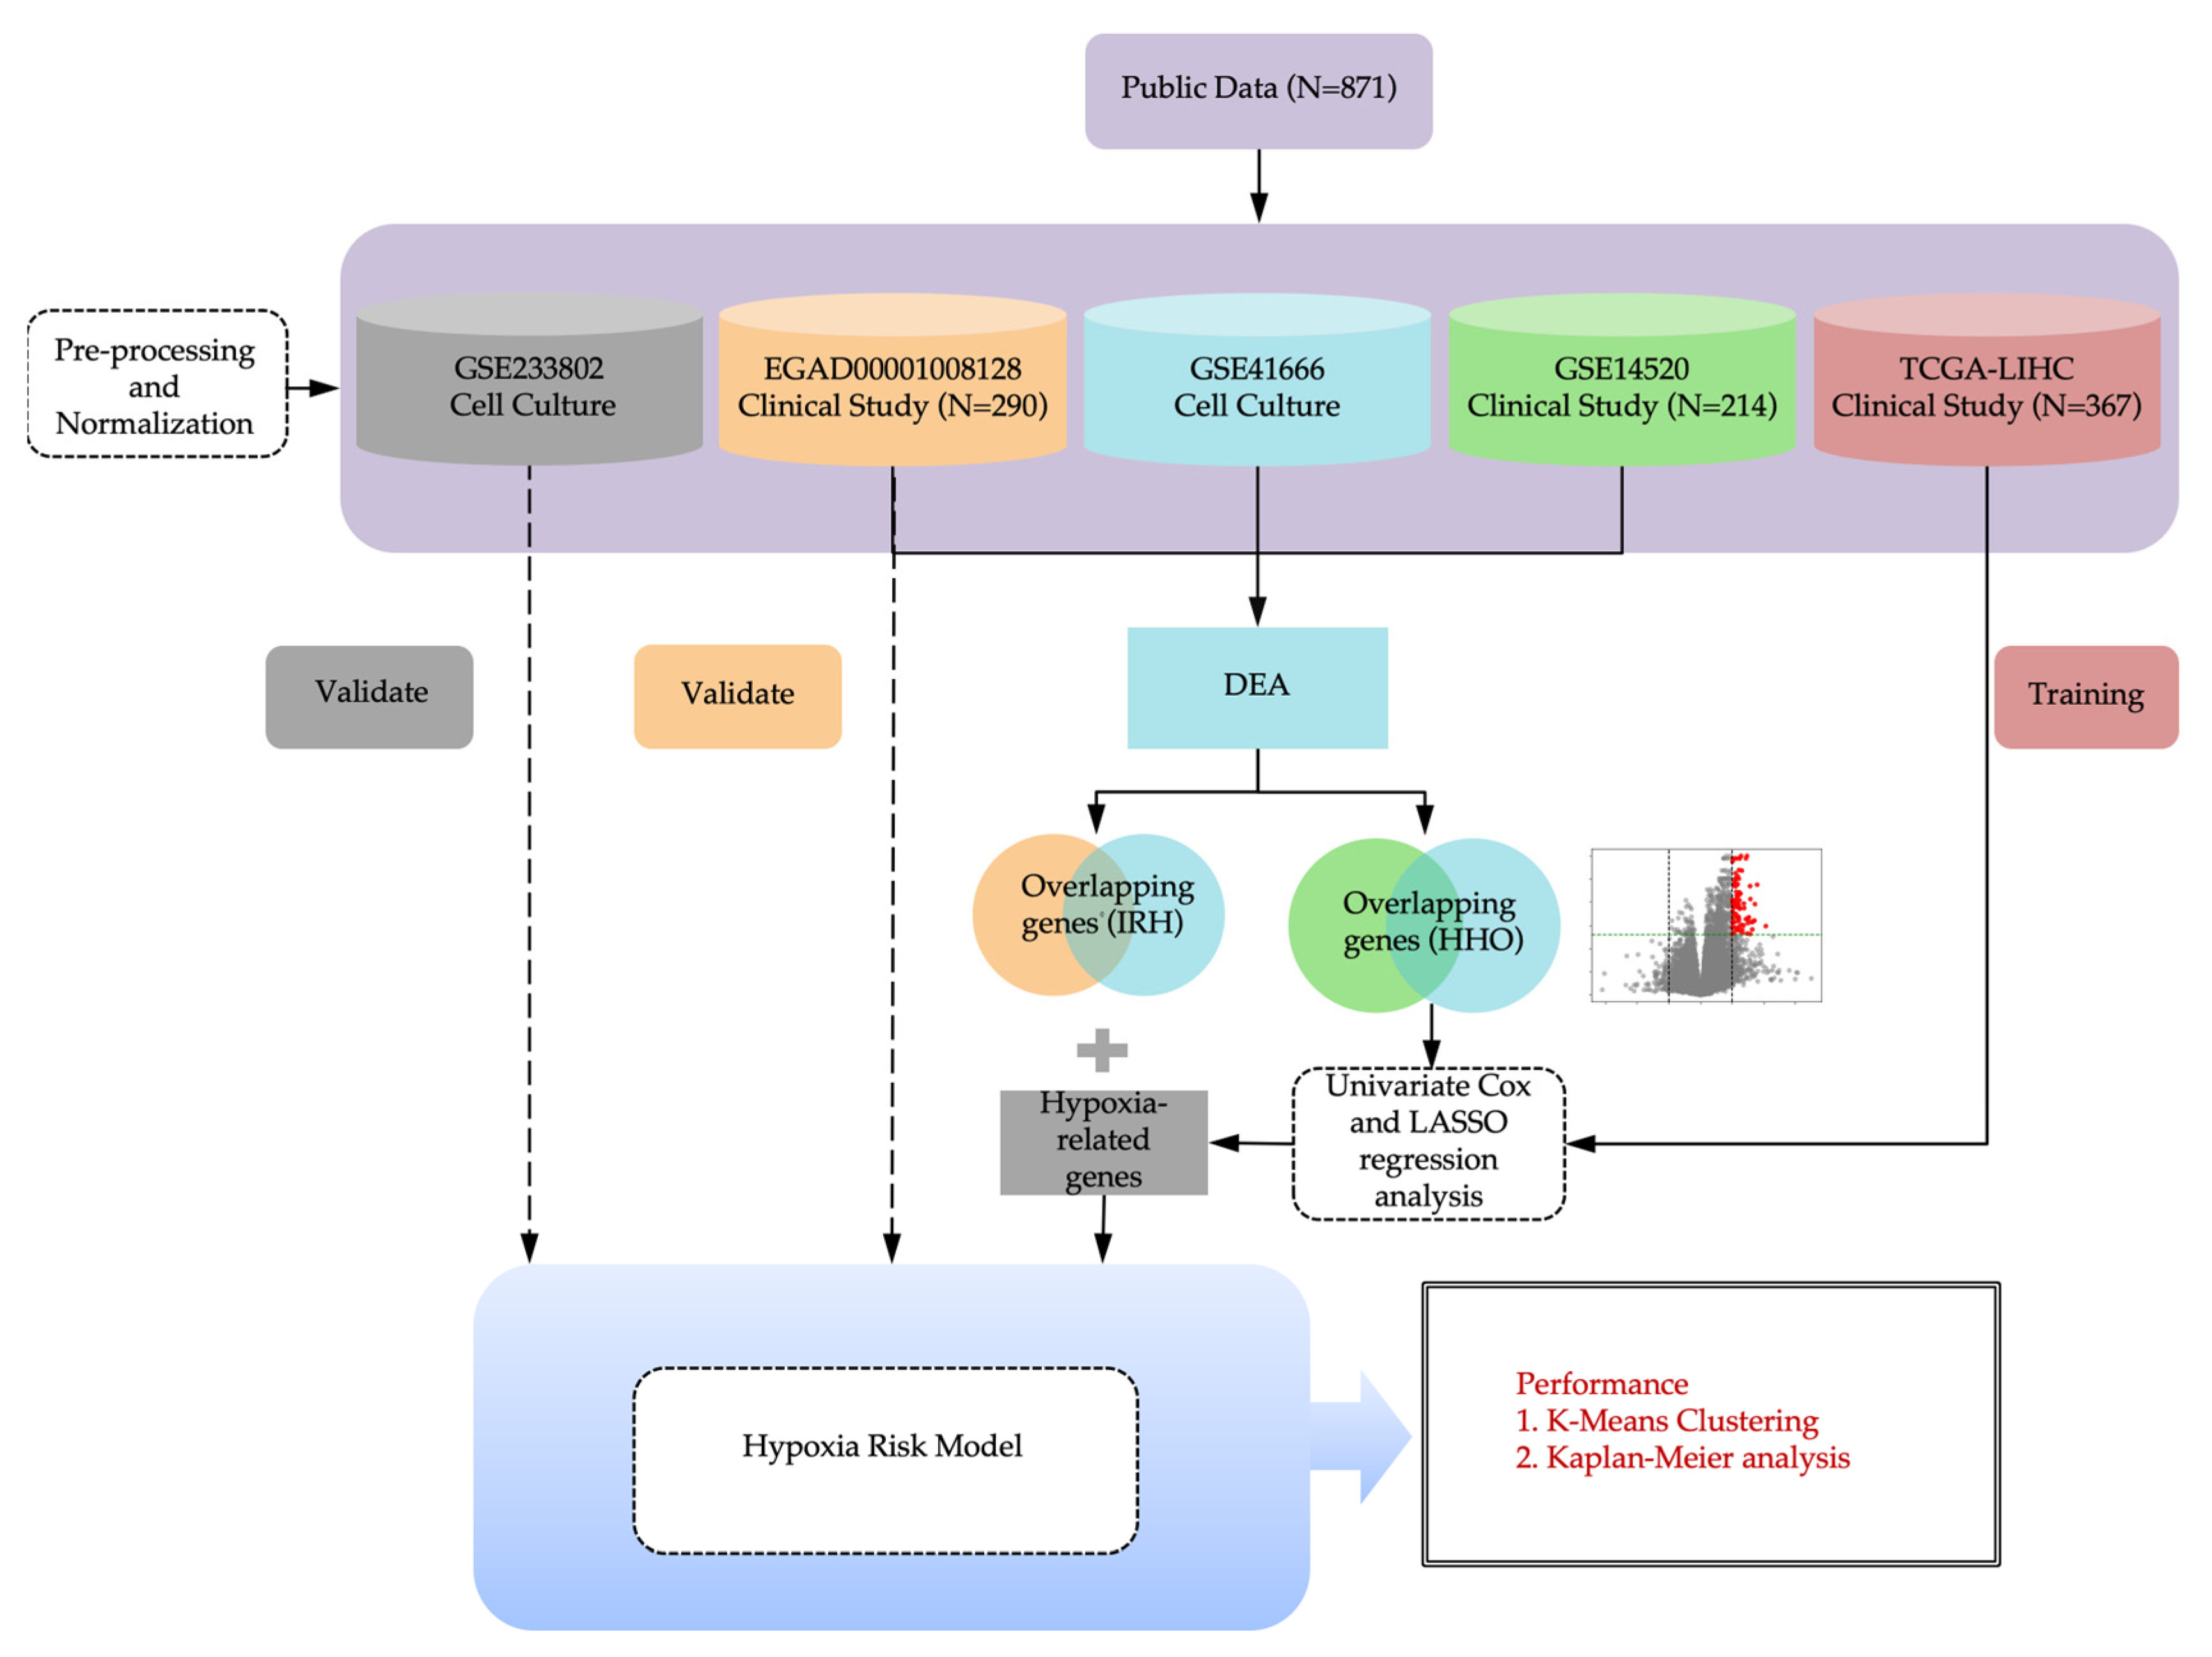
Figure 7.
Co-culture flowchart.
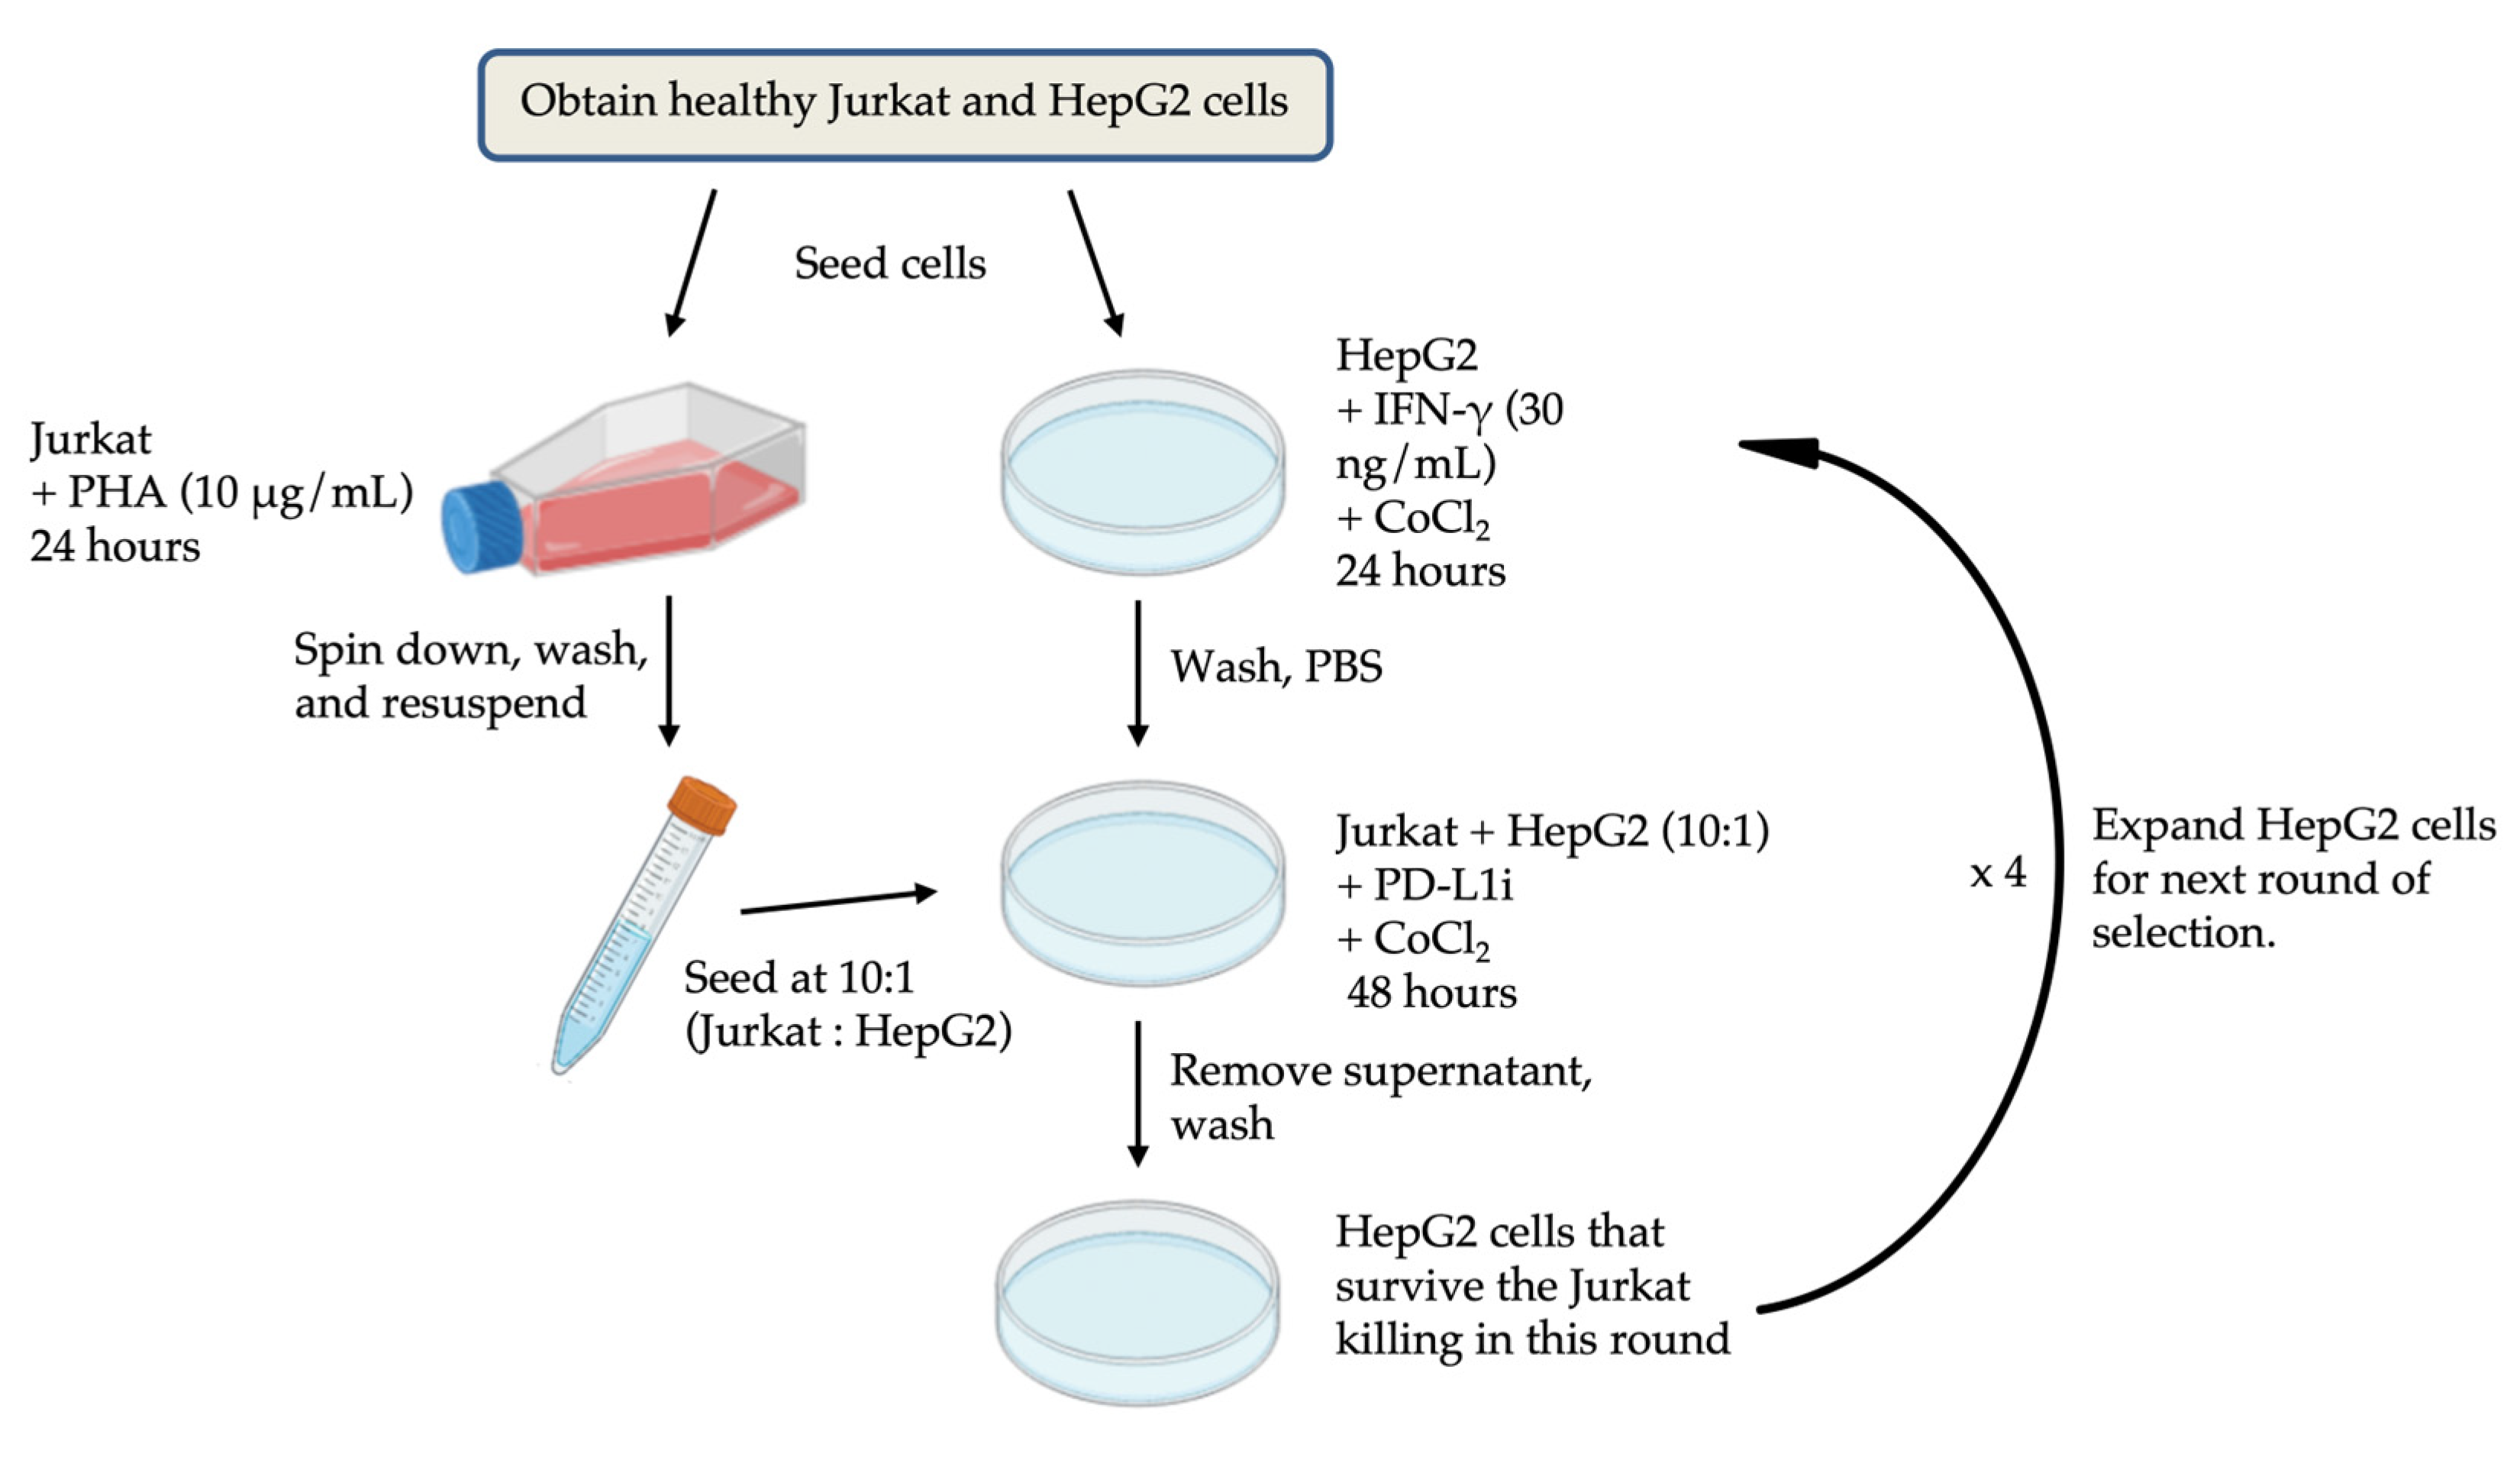
Figure 8.
The experimental workflow for NOXA knockdown by transfection in HepG2-R cells.
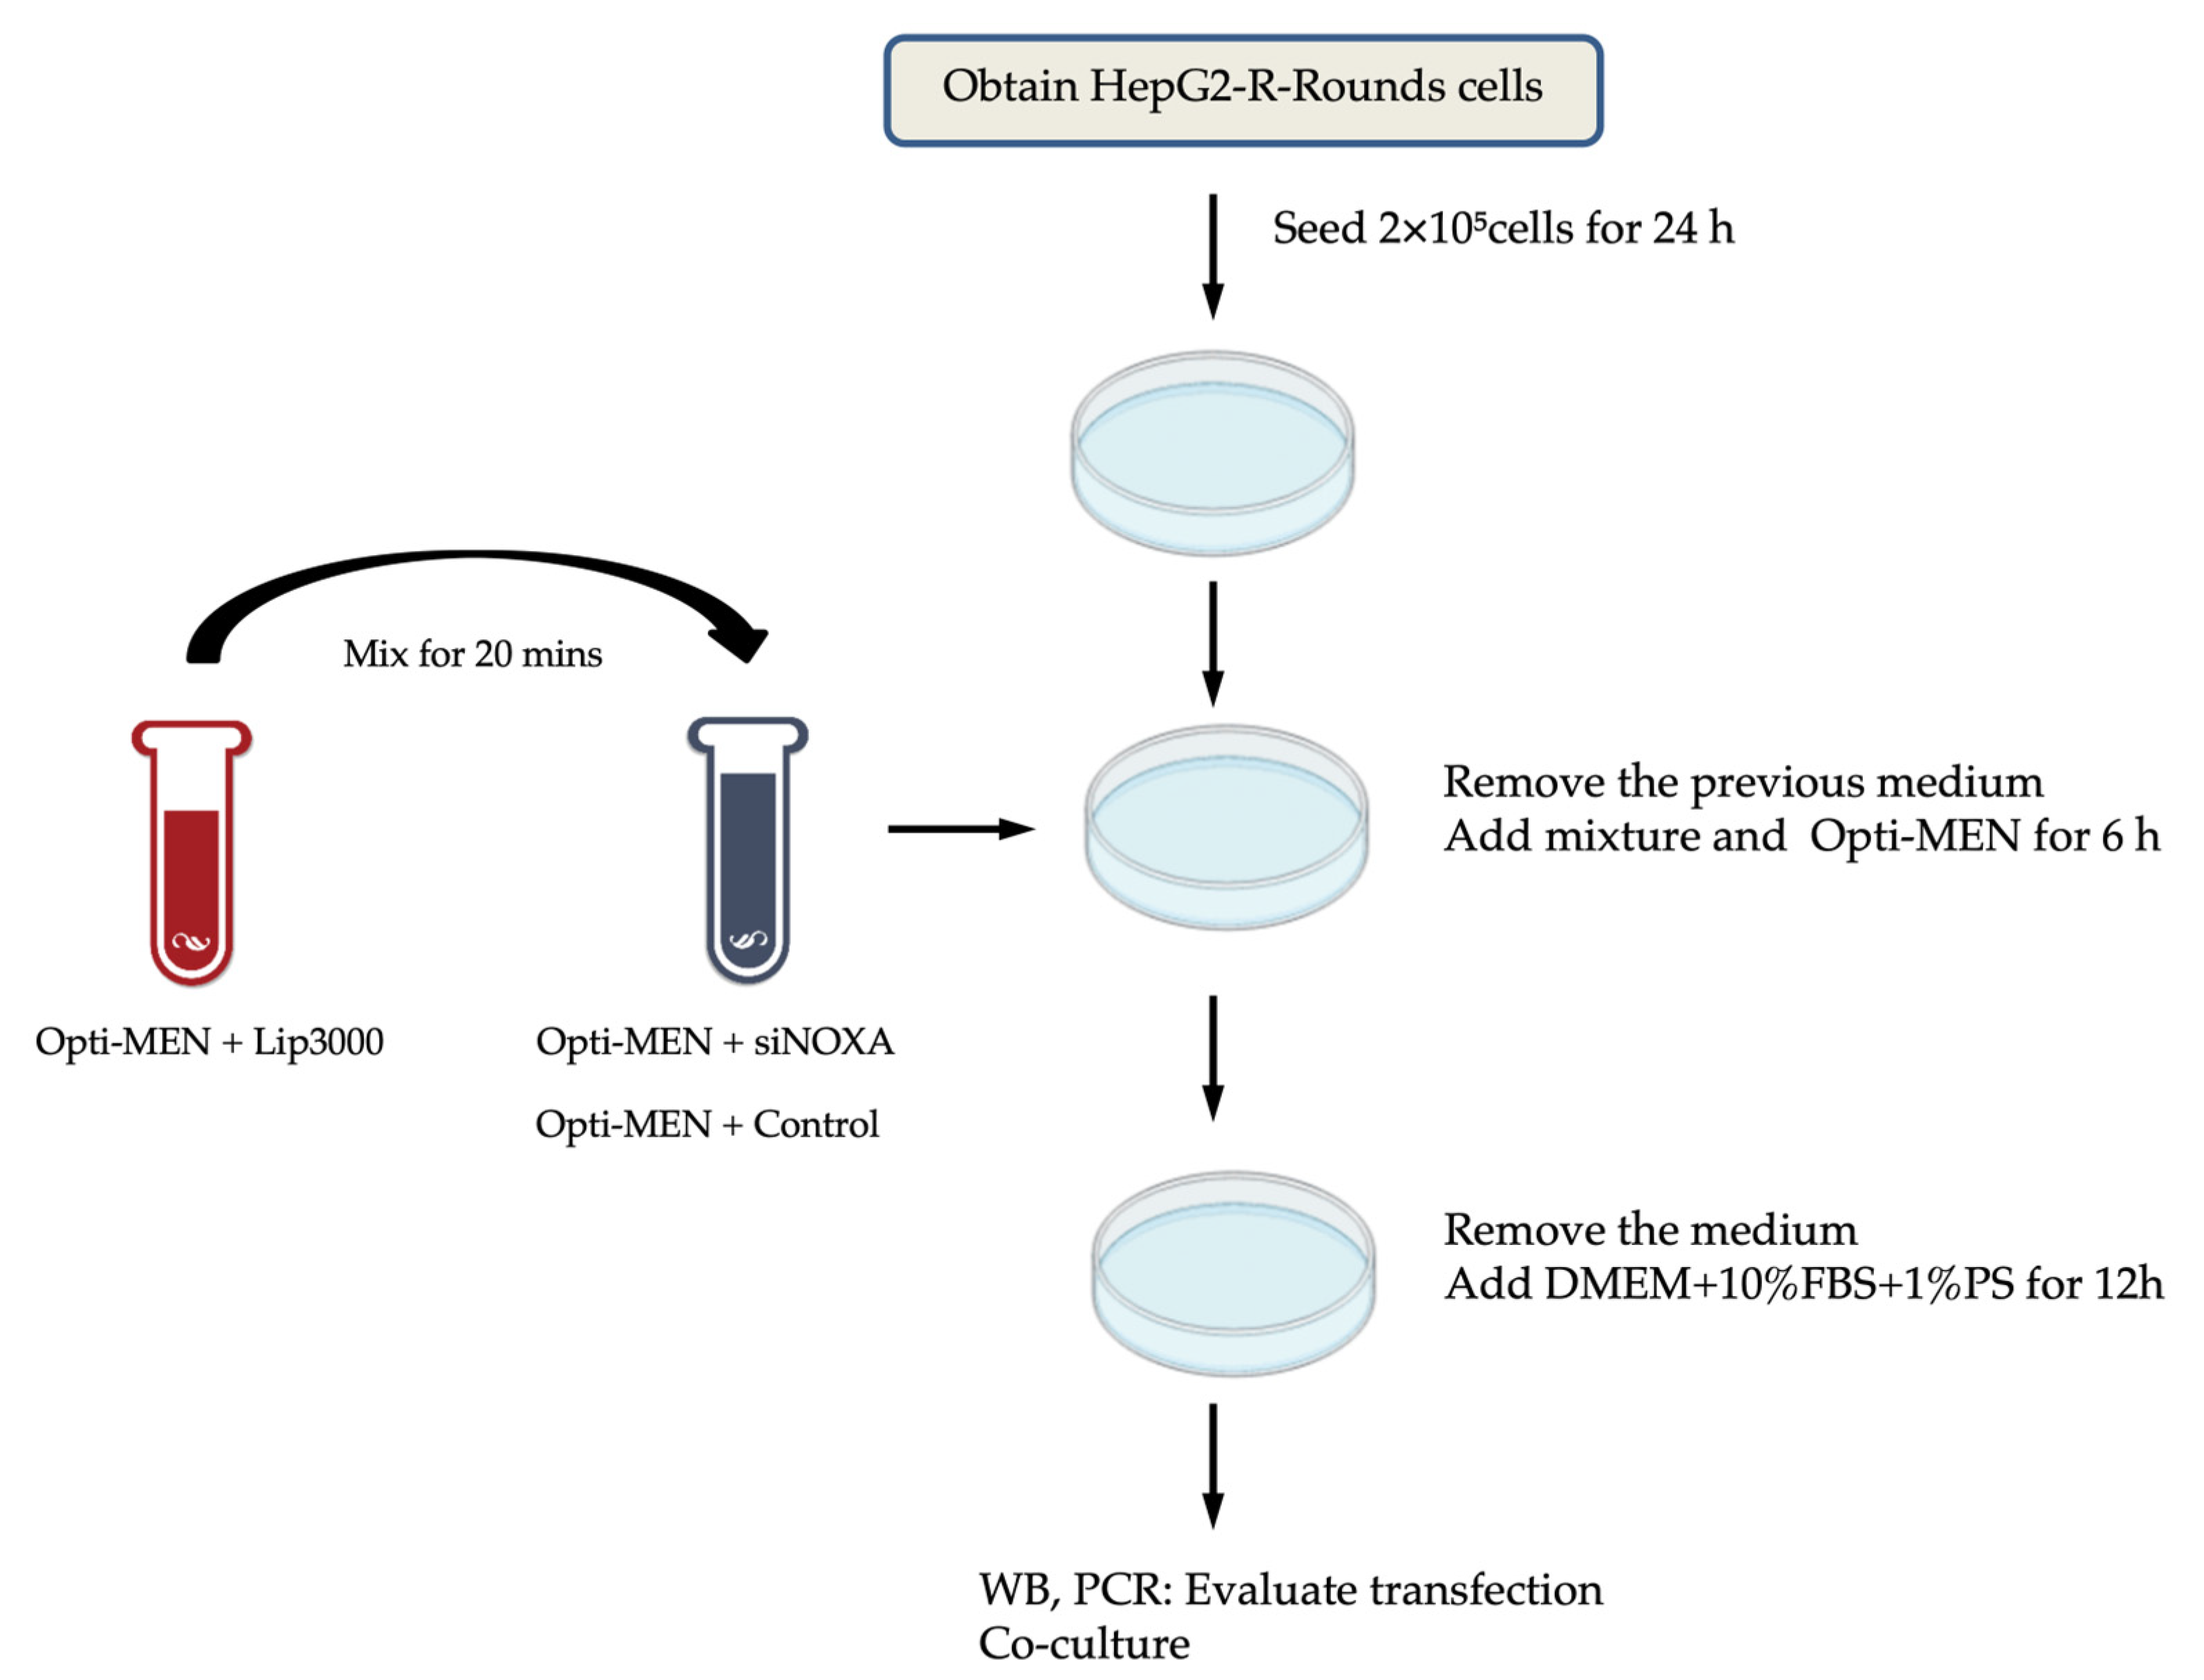

Table 1.
The sequences of primers.
| Gene | Forward Primer (5-3′) | Reverse primer (5- 3′) |
| NOXA | CAGAGCTGGAAGTOGAGTGTGC | TGCAGTCAGGTTCCTGAGCAGA |
| β-actin | AGGATTCCTATGTGGGCGAC | ATAGCACAGCCTGGATAGCAA |
Disclaimer/Publisher’s Note: The statements, opinions and data contained in all publications are solely those of the individual author(s) and contributor(s) and not of MDPI and/or the editor(s). MDPI and/or the editor(s) disclaim responsibility for any injury to people or property resulting from any ideas, methods, instructions or products referred to in the content. |
© 2025 by the authors. Licensee MDPI, Basel, Switzerland. This article is an open access article distributed under the terms and conditions of the Creative Commons Attribution (CC BY) license (http://creativecommons.org/licenses/by/4.0/).
Copyright: This open access article is published under a Creative Commons CC BY 4.0 license, which permit the free download, distribution, and reuse, provided that the author and preprint are cited in any reuse.


