
Submitted:
28 January 2025
Posted:
28 January 2025
You are already at the latest version
Abstract
Hepatocellular carcinoma (HCC) is a leading cause of cancer-related deaths, with immunotherapy being a first-line treatment at the advanced stage and onwards. Hypoxia plays a critical role in tumor progression and resistance to therapy. This study develops and validates an artificial intelligence (AI) model based on publicly available genomics datasets to predict hypoxia-related immunotherapy responses. Based on the HCC-Hypoxia Overlap (HHO) and immunotherapy response to hypoxia (IRH) genes selected by differential expression and enrichment analyses, a hypoxia model was built and validated on TCGA-LIHC and GSE233802 datasets respectively. The training and test sets were assembled from the EGAD00001008128 dataset of 290 HCC patients and the response and non-response classes were balanced by the Synthetic Minority Over-Sampling Technique. With the genes selected by minimum Redundancy Maximum Relevance and stepwise forward methods, a Kolmogorov-Arnold Network (KAN) model was trained. Support Vector Machine (SVM) combined the Hypoxia and KAN models to predict immunotherapy response. The hypoxia model was constructed using 10 genes (IRH and HHO). The KAN model with 11 genes achieved a test accuracy of 0.7. The SVM integrating the hypoxia and KAN models achieved a test accuracy of 0.725. The established AI model can predict immunotherapy response based on hypoxia risk and genomic factors potentially intervenable in HCC patients.
Keywords:
Hepatocellular carcinoma
; Hypoxia
; Immunotherapy response
; Kolmogorov-Arnold Network
; Support Vector Machine
1. Introduction
Hepatocellular carcinoma (HCC) represents the predominant subtype of primary liver cancer and one of the leading causes of cancer-related mortality globally. The majority of HCCs were diagnosed at advanced stages [1]. During the disease trajectory, over 50-60% of HCC patients undergo systemic therapy, which has emerged as the mainstay treatment modality for patients presenting with unresectable tumors [2].
Immunotherapy has emerged as a groundbreaking addition to the armamentarium of systemic therapies. The immune checkpoint inhibitor (ICI), Atezolizumab (PD-L1 inhibitor), in combination with Bevacizumab (VEGF antibody), has received FDA approval as a first-line treatment for unresectable HCC [3]. Atezolizumab binds to PD-L1, disrupting the PD-1/PD-L1 axis and enhancing the cytotoxic activity of anti-tumor T cells. However, the objective response rate remains around 30%, and the 3-year overall survival rate falls short of 50% [4,5]. A significant proportion of patients fail to derive benefit from anti-PD-1/PD-L1 therapy, which is associated with high costs and the potential for adverse events.
The tumor immune microenvironment (TIME) plays a pivotal role in mediating the response to ICIs and has a profound influence on both the efficacy of immunotherapeutic interventions and tumor progression [6]. Hypoxic TIME is a prevalent feature of HCC solid tumors, which is caused by the rapid proliferation of HCC cells combined with an inadequate vascular oxygen supply [7]. Such an environment triggers the activation of various oncogenic markers and promotes the upregulation of PD-L1 expression, enhancing the tumor's resistance to cytotoxic T-lymphocytes (CTLs) and contributing to immunotherapy tolerance and resistance [8].
Current genomic research primarily utilizes two approaches: machine learning and bioinformatics. Machine learning employs algorithms to find complex interactions among genomic factors, achieving high predictive accuracy when supported by genomic sequencing data connected to clinical information [9]. Bioinformatics relies on statistical methods such as differential gene expression analysis, enrichment analysis, and regression analysis to identify potential genes, pathways, and molecular mechanisms [10]. While both approaches are individually performed, they have limitations in capturing the intricate interactions between high-dimensional genomic data and TME, particularly the critical role of hypoxia in regulating immune responses. Therefore, traditional models often fail to integrate diverse biological features that contribute to therapeutic resistance, thereby limiting their clinical applicability.
Kolmogorov Arnold Networks (KANs) emerged recently as a novel deep-learning model framework that incorporates parametrized splines as the learnable activation functions on edges, instead of inputting the weighted sum to the fixed activation functions as Multi-Layer Perceptrons (MLPs). The modeling performance of KANs is comparable to and, on small-scale tasks, even better than that of MLPs. The intuitive representation of KANs facilitates high interpretability compared with traditional deep learning networks [11]. This study used KAN to model the effect of genomic factors on the immunotherapy response.
In this study, the Cox regression model with genes selected by differential expression was trained on clinical and cell experiment datasets to predict the hypoxia risk, while the KAN model for predicting immunotherapy response was trained on a different clinical dataset. A support vector machine was used to integrate the outputs of two heterogeneous models into a single score where their advantages can be suitably combined.
2. Methods
Study Design
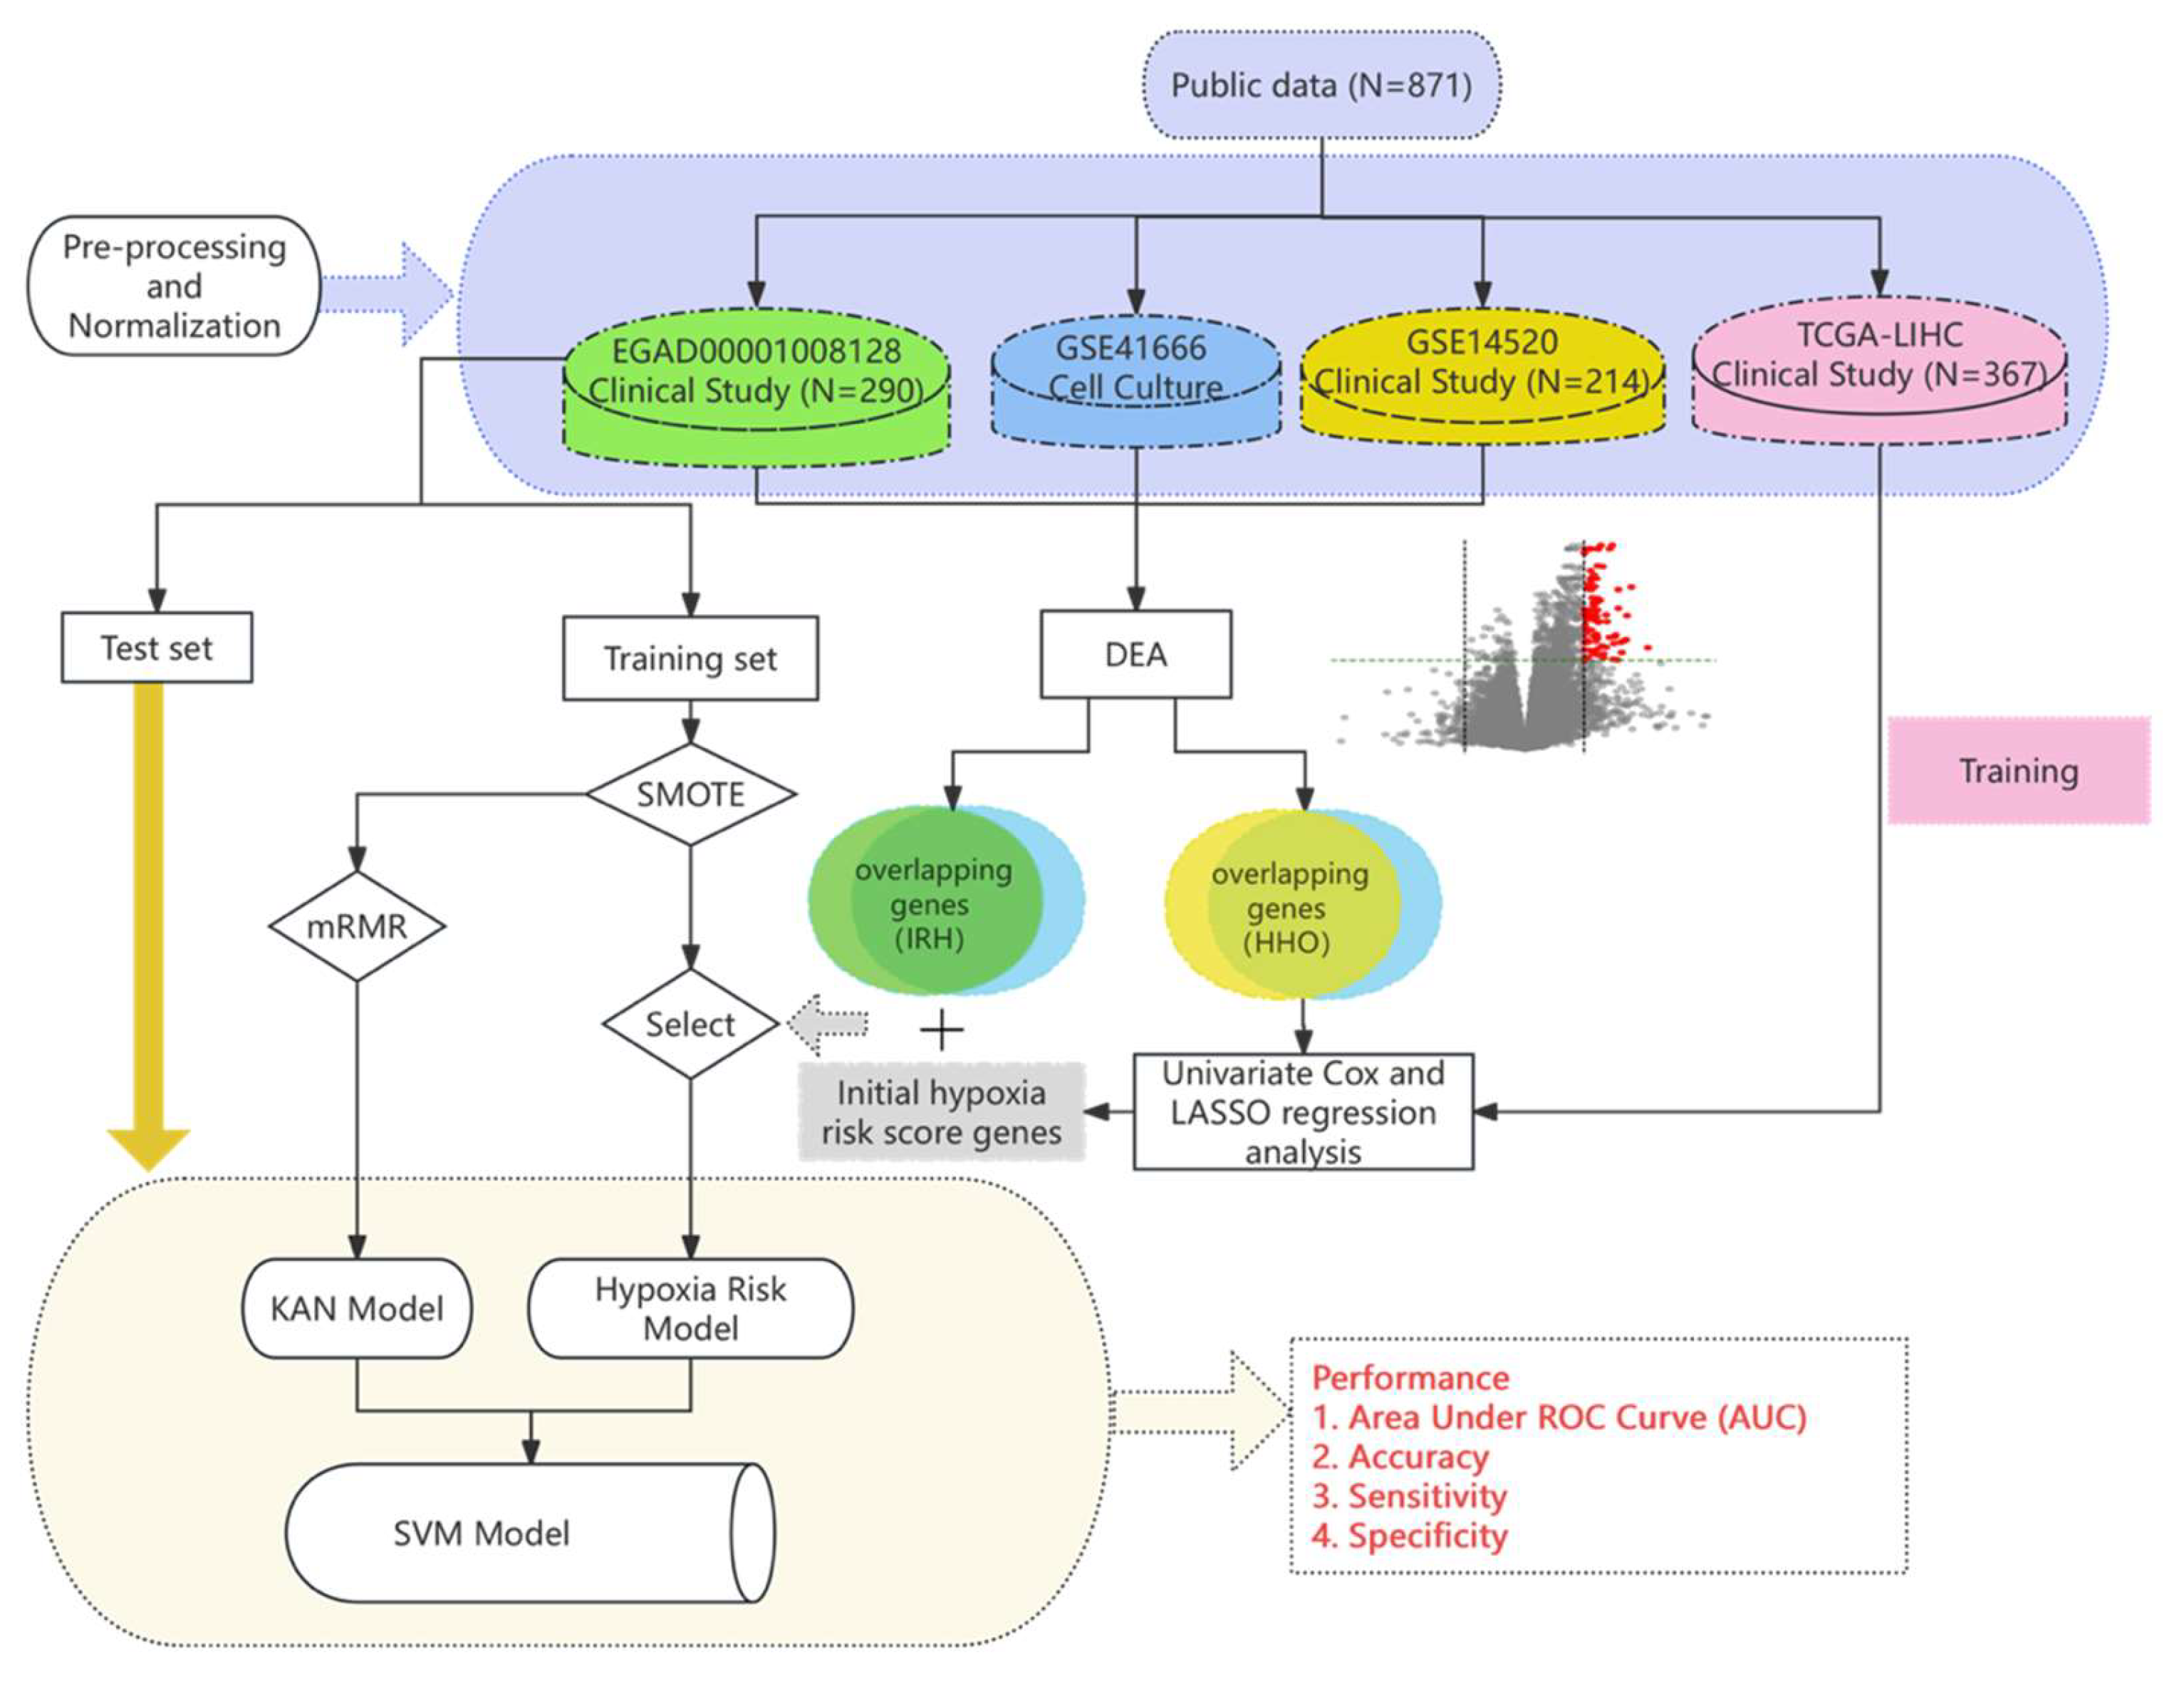
Figure 1.
The overview of computational modeling of immunotherapy response prediction.
2.1. Data Collection and Preprocessing
Bioinformatics analysis, modeling, and validation were performed on publicly available datasets: EGAD00001008128 from the European Genome-Phenome Archive (EGA) (https://ega-archive.org/datasets/ downloaded on 10 October 2023), GSE41666, and GSE14520 from the National Center for Biotechnology Information (NCBI) database (https://www.ncbi.nlm.nih.gov/, in January 2022, January 2022 and June 2024, respectively), and The Cancer Genome Atlas Liver Hepatocellular Carcinoma (TCGA-LIHC) dataset from TCGA database (https://www.cancerimagingarchive.net/collection/tcga-lihc/, in January 2024).
2.1.1. Clinical datasets
The EGAD00001008128 dataset includes RNA sequencing data of 290 HCC patients who underwent the treatment of Atezolizumab or Atezolizumab+Bevacizumab following biopsies. The responses to the treatment were categorized into positive (90 patients) and negative (200 patients). The dataset was divided into training and test sets for immunotherapy response prediction model development. As the non-response class constitutes the majority of cases, a 9:1 split was first applied to the non-response cases. From the 200 non-response cases, 20 were randomly selected for the test set, alongside 20 from the 90 response cases. The training set thus consists of 180 non-response cases and 70 response cases. The GSE14520 dataset consists of microarray data of HCC tumor tissues compared to adjacent normal tissues of 214 patients. The Cancer Genome Atlas (TCGA) Liver Cancer (LIHC) dataset consists of gene expression profiles (FPKM values) and survival data of 367 patients.
2.1.2. Cell culture datasets
The GSE41666 dataset includes gene expression profiles of the HepG2 cell line cultures under the hypoxic (0% O2) and normoxic (21% O2) conditions for 24 hours, generated using a microarray platform. Each condition in GSE41666 was replicated three times to ensure biological reproducibility.
2.1.3. Pre-processing of RNA sequencing raw data
For RNA sequencing data, the datasets EGAD00001008128 was processed using a standard processing pipeline that includes (i) FastQC for initial quality assessment, (ii) Fastp for trimming of low-quality bases and removal of adapters, (iii) HISAT2 for alignment of cleaned reads to the human reference genome (GRCh38.104 from NCBI), and (iv) FeatureCounts for gene expression quantification, all ensuring the data integrity, quality, and reliability for comprehensive analysis. Expression matrices were then formed [12].
To account for low quality sequencing results, gene filtering methods adopted by relevant studies were applied. For the EGAD00001008128 dataset, the median normalized counts-per-million (CPM) and the coefficient of variation (CV) of values were calculated for each gene, with 25th percentiles used as thresholds. Genes were excluded if they fell below these thresholds or were expressed in less than 75% of the samples [2].
2.1.4. Normalization of gene expression data
Gene expression data from the GSE41666 dataset, generated using microarray technology, was processed by averaging the expression levels of multiple probes corresponding to each gene, resulting in an expression matrix with unique gene symbols. The data underwent Variance Stabilizing Normalization (VSN) and was subsequently standardized to a normal distribution, N(0,1).
For the RNA sequencing datasets EGAD00001008128, preprocessing was conducted using the DESeq2 normalization function (deseq2_norm) in Python/R, which adjusts for sequencing depth and technical variations among samples by applying sample-specific scaling factors to the expression matrices.
To rescale the expression matrix of EGAD00001008128 into a standard range for further analysis models, the StandardScaler function of the Sklearn Python package was used to fit a scaler concerning the mean and standard deviation of the expression profile of each gene in the training set. Both training and test sets were standardized to the normal distribution, N(0,1), using the fitted scaler. The dataset includes the immunotherapy strategy: Atezolizumab monotherapy (coded by 0) or its combination with Bevacizumab (coded by 1). This variable was then standardized alongside the gene expression data in both training and test sets.
2.2. Feature Selection
2.2.1. Differential Expression Analysis
Differential expression analysis (DEA) was performed on the EGAD00001008128, GSE41666, and GSE14520 datasets based on t-test q-values and fold change (FC) criteria. P-values were calculated for each gene to determine statistical significance, and q-values were derived using the Storey-Tibshirani method for the GSE41666 and GSE14520 microarray data, and the Benjamini-Hochberg method for the EGAD00001008128 RNA sequencing data to control the false discovery rate (FDR). Genes were considered differentially expressed (DEGs) if they met the criteria of q-value < 0.05 and FC thresholds for upregulation or downregulation.
2.2.2. Enrichment analysis
Venn diagrams were generated using the Venny 2.1 platform (https://bioinfogp.cnb.csic.es/tools/venny/, accessed on May 25, 2024) to visualize the intersection of DEGs from the GSE41666 dataset with those from the EGAD00001008128 and GSE14520 datasets. Overlapping genes identified across these datasets were then categorized into two distinct groups: IRH (immunotherapy response to hypoxia) genes and HHO (HCC-Hypoxia Overlap) genes. HHOs have been reported in our previous study [10].
2.3. Model Development
2.3.1. Oversampling of imbalanced data
Balanced class distributions are known to improve model predictive performance. In the training set of the EGAD00001008128 dataset, a significant class imbalance was observed, with 70 responders and 180 non-responders. To address this, the Synthetic Minority Over-Sampling Technique (SMOTE) was applied as an initial preprocessing step. SMOTE generates synthetic samples by interpolating between the existing data points in the minority class, i.e. responders in this case, based on their nearest neighbors, while maintaining key characteristics of gene expression profiles and Bevacizumab treatment option. This process resulted in a balanced training set with 180 samples in each class.
2.3.2. Hypoxia Scoring Model Associated with Drug Response
To develop a hypoxia scoring model associated with drug response, gene expression (FPKM values) and survival data from 367 HCC patients in the TCGA Liver Cancer (LIHC) database were analyzed. First, univariate Cox regression analysis was performed on HHOs, followed by using the LASSO algorithm to identify hypoxia-related genes. The results of the analysis were reported in our previous study [13]. Subsequently, hypoxia-related genes were combined with immunotherapy response to hypoxia (IRH) genes to construct the hypoxia scoring model. Ultimately, a proportional hazards regression model was fitted using the phreg function from the Statsmodels library, and the regression coefficients for each gene in the hypoxia scoring model were calculated based on the TCGA dataset. The hazard function λ(t) is an indicator used to evaluate the performance model. The baseline hazard function λ0(t) represents the risk level when all covariates are zero. The coefficients βi of the covariates reflect their impact on risk, with positive values indicating increased risk and negative values indicating reduced risk.
2.3.3. Model Validation
To address the challenges of current clinical techniques in measuring intratumoral hypoxia, the model was applied to the standardized EGAD00001008128 dataset to evaluate hypoxia risk in HCC patients. The hypoxia risk scores were then incorporated into the feature set for further analysis.
2.3.4. KAN model architecture and training
The Minimum Redundancy Maximum Relevance (mRMR) algorithm was applied to rank genes by their correlation with immunotherapy response, selecting the top 50 most relevant feature genes. Stepwise Forward Selection was then used to iteratively add feature genes to the model, focusing on those with the highest predictive power, which helped simplify the model and reduce overfitting.
The Kolmogorov-Arnold Network (KAN) has comparable mathematical foundations but better accuracy and interpretability than Multi-Layer Perceptron (MLP). Instead of learnable weights in MLP, the parameters of the activation functions of KAN are adjusted in the training process, leading to a simpler but more precise model for learning limited data. The model prediction, f(x), is defined as a double summation: The inner summation, , transforms each feature xi using a feature-specific function ϕ0,j,i. The outer summation, , combined these transformed features across all m predictors via ϕ1,j. This structure allows KAN to capture complex feature interactions with improved precision and interpretability.
2.3.5. SVM model
A Support Vector Machine (SVM) model with a radial basis function (RBF) kernel was employed to predict immunotherapy response, using inputs derived from KAN output and hypoxia model output. The model was implemented using the Sklearn.svm module, with parameters set to 'gamma=0.2' and 'C=0.1'. The RBF kernel controls the feature mapping through the parameter σ, which determines the spread of the kernel and projects features into a higher-dimensional space. In the feature representation, variables x and xc represent genomic features, while the Euclidean distance ||x - xc||, which quantifies the similarity between a sample and the central feature xc, was incorporated into the RBF kernel. This approach captures the proximity of a sample to the characteristics of responders. By integrating these features, the SVM model effectively identifies interactions between genomic characteristics and hypoxia scores, enhancing the accuracy of immunotherapy response prediction.
3. Results
3.1. Identification of IRH and HRH genes from public dataset
In the EGAD00001008128 dataset, 84 upregulated DEGs were identified between immunotherapy responders and non-responders using thresholds of q-value < 0.05, FC > 1.999 (upregulation), and FC < 1/1.999 (downregulation) (Figure 2a). To account for variation across groups, the overlap was adjusted for greater significance. In the GSE41666 dataset, FC thresholds were set at 1.3202 and 1/1.3202, identifying 300 upregulated hypoxia-related genes (HRGs) for overlap analysis with the EGAD00001008128 dataset (Figure 2b). FC thresholds were adjusted to 1.277 and 1/1.370, identifying 400 upregulated and 400 downregulated genes for overlap analysis with the GSE14520 dataset (Figure 2c). These adjustments and results have been reported in a prior study.
Analysis of the EGAD00001008128 and GSE41666 datasets identified 3 overlapping genes (PMAIP1 (NOXA), CD3D, and CD2) as immunotherapy response to hypoxia (IRH) genes (p = 0.026) (Figure 2d). PMAIP1 (NOXA) has been consistently related to hypoxia in previous studies. Further analysis of the GSE41666 and GSE14520 datasets identified 52 significantly overlapping genes classified as HCC-Hypoxia Overlap (HHO) genes (p = 0.0032) (Figure 2e).
3.2. Hypoxia Scoring Model
A hypoxia risk scoring model was established using 10 genes. Among these, 9 genes were identified from HHOs. These genes were first analyzed using univariate Cox regression based on FPKM data from the TCGA-LIHC dataset, and those with significant associations with survival were further refined through the LASSO algorithm (Figure 3). The remaining gene, PMAIP1 (NOXA), was derived from the IRHs. After incorporating PMAIP1 (NOXA) into the model, the final set of 10 genes was subjected to an additional Cox regression analysis using the TCGA-LIHC FPKM dataset. This step ensured that all genes in the model were significantly associated with hypoxia-related survival outcomes. The model calculates a weighted combination of gene variables, where a coefficient is assigned to each gene representing its impact on survival. Positive coefficients indicate increased risk, while negative coefficients suggest reduced risk (Table 1). The final key genes in the model include PHLDA2, DLGAP5, N4BP2L1, CENPA, UPB1, CABYR, AFM, HMMR, KIF20A, and PMAIP1. This formula was applied to the EGAD00001008128 dataset to calculate hypoxia risk scores for each patient, facilitating patient stratification and further analysis.
3.3. Feature Selection and KAN Model
The mRMR algorithm was applied to rank genes based on their relevance to immunotherapy response and inter-redundancy. The top 50 genes were initially selected from the EGAD00001008128 dataset. These 50 genes were further refined using the KAN model, which identified 11 genes most strongly associated with immunotherapy response: TLR8, SCHIP1, ZNF729, ATG9B, BAMBI, OXSR1, ZNF564, CCR8, ADAM23, RRN3P3_1, and RDH14. A training dataset was constructed by combining these 11 selected genes with Bevacizumab usage as features. Both the training and validation datasets were converted into PyTorch tensors, ensuring data completeness by verifying and correcting any missing values. The model used a classification threshold of 0.5, binarizing predictions for immunotherapy response. The KAN model achieved an accuracy of 0.9361 on the training set, demonstrating strong performance in binary classification. The trained KAN model was then tested on a validation dataset using the same classification threshold of 0.5. The test set achieved an accuracy of 0.7 (Figure 4). KAN scores from both the training and test datasets were incorporated into the feature columns for further analysis and validation.
3.4. SVM Model for Immunotherapy Response Prediction
A support vector machine (SVM) model was trained using the KAN score and hypoxia scores as features to classify immunotherapy response in the EGAD00001008128 dataset. The training set included these two features along with immunotherapy response results. The model achieved an accuracy of 0.9361 on the training set. When evaluated on the test set, the model achieved an accuracy of 0.725 (Figure 5). The SVM model used a radial basis function (RBF) kernel with parameters gamma = 0.2 and C = 0.1. These results demonstrated that the combination of KAN and hypoxia scores provides strong predictive power in immunotherapy response.
4. Discussions
Despite advancements in hepatocellular carcinoma (HCC) treatment, the prognosis for patients with advanced HCC remains poor. Current systemic therapies, immune checkpoint inhibitors, provide limited benefits for many patients. The high mortality rate of advanced HCC continues to be a major public health challenge. The lack of reliable tools to predict immunotherapy response further complicates treatment decisions. Therefore, there is an urgent need to develop a predictive model to guide immunotherapy strategies for advanced HCC patients, improve survival outcomes, and optimize clinical decisions.
In recent years, the relationship between hypoxia-related genes and cancer progression, immune evasion, and treatment resistance has been widely studied. These genes have been used to develop predictive models for survival outcomes and drug resistance in various cancers [14]. The liver, as one of the most metabolically active and hypoxia-sensitive organs, is deeply involved in oxygen homeostasis, tumor metabolism, and immune regulation [15,16]. This study used hypoxia-related and response-related genes to construct a predictive model for immunotherapy response in HCC, providing a novel finding for linking hypoxia with immunotherapy outcomes.
We developed a prediction model for PD-L1 inhibitor response in HCC by integrating the Kolmogorov-Arnold Network (KAN) model with the hypoxia risk scoring model. The hypoxia risk scoring model was constructed using 10 genes. Nine of these genes were selected from the HCC-Hypoxia Overlap (HHO) gene set, which was identified by overlapping the GSE41666 and GSE14520 datasets through Cox regression and LASSO analysis, demonstrated strong performance in stratifying patients based on hypoxia-associated survival outcomes. NOXA was selected from the IRH (Immunotherapy Response to Hypoxia) gene set, derived from the intersection of the EGAD00001008128 and GSE41666 datasets. Based on the selected hypoxia-related genes, we analyzed data from the TCGA-LIHC dataset to establish a hypoxia model associated with immune response.
NOXA is well-documented in recent studies for its role in hypoxia and immunotherapy. Hypoxia-induced HIF-1α has been shown to upregulate NOXA mRNA and protein expression by binding to the hypoxia response element (HRE) at -1275 bp within the NOXA promoter, independently of p53 [17,18]. NOXA, a pro-apoptotic BH3-specific protein, plays a key role in tumor cell apoptosis. Studies have shown that NOXA knockout reduces CAR T cell-mediated tumor apoptosis, leading to resistance against CAR T cell therapy [19]. In colorectal cancer, PTEN and NOXA expression are strongly correlated, with high PTEN levels linked to tumor regression [20]. These findings highlight NOXA as a critical regulator of anti-tumor responses across different treatments. Our study further found NOXA expression was upregulated in hypoxic HepG2 cell lines and immunotherapy responders, emphasizing its potential as a therapeutic target. Future research is required to explore whether modulating NOXA expression can enhance responses to immunotherapy.
Subsequently, we developed the Kolmogorov–Arnold Network (KAN) model to predict PD-L1 inhibitor response in HCC, demonstrating strong predictive performance. The KAN model contributed significantly to the prediction model by refining the feature set through SMOTE and mRMR. Of the 50 genes initially selected by mRMR, 11 were identified as the most relevant predictors of immunotherapy response. The KAN model achieved high accuracy in both the training set (0.9361) and the test set (0.7), demonstrating its ability to generalize and perform well on unseen data. Compared to traditional models, the KAN model’s adaptive activation functions allowed it to handle the nonlinear and complex interplay between gene expression and immune response more efficiently. This advantage is particularly relevant in HCC, where hypoxia and immune modulation are highly interconnected. Our findings highlight the potential of KAN models for clinical application in personalized medicine.
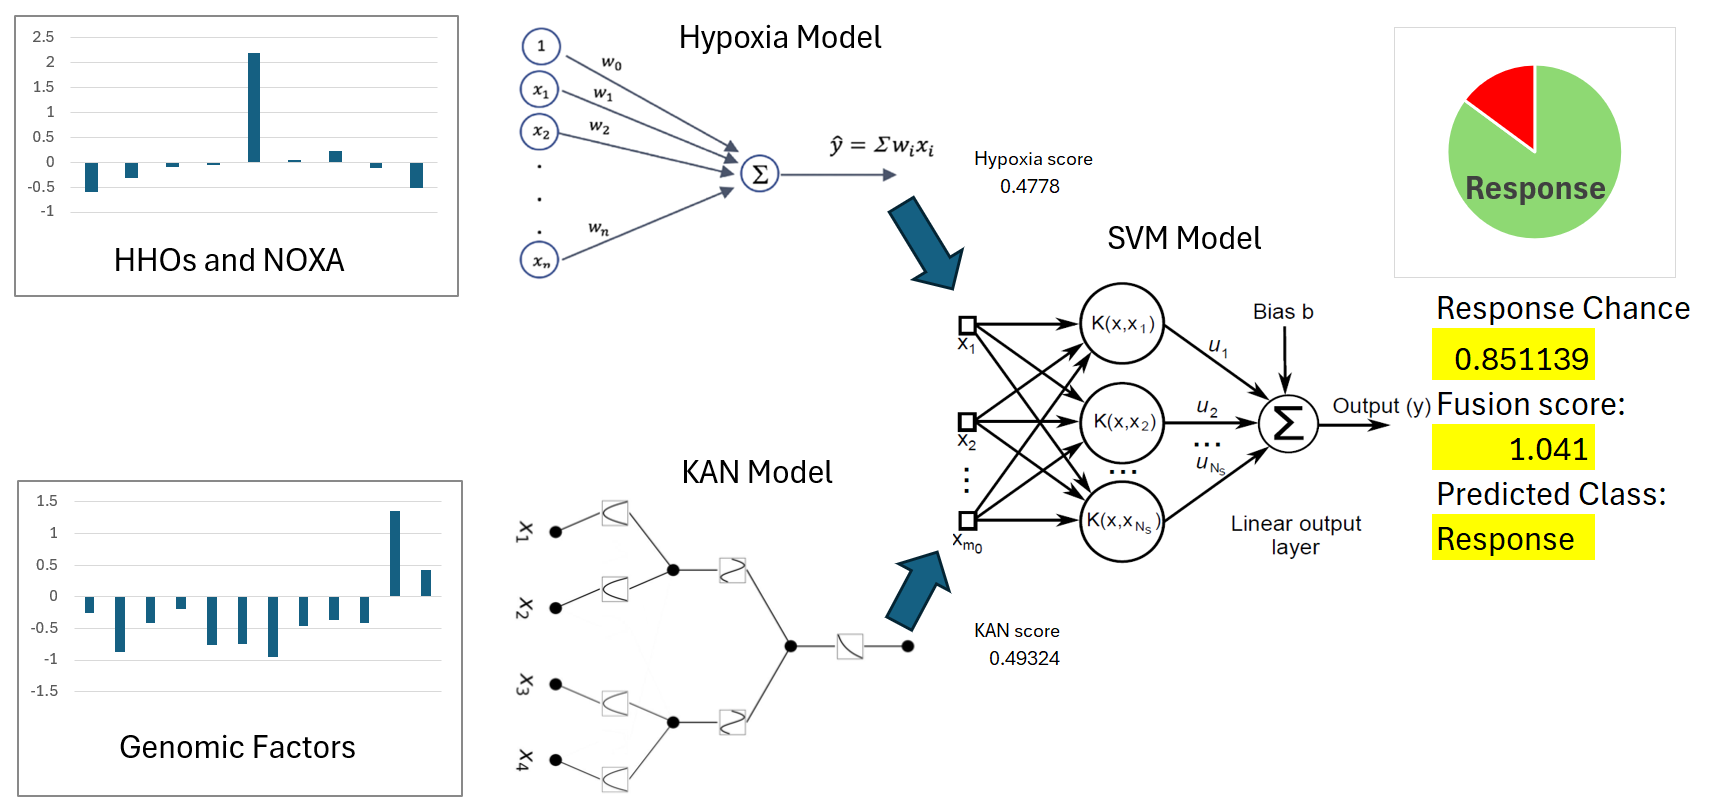
The integration of hypoxia scores and KAN-derived feature scores in the SVM model demonstrated the potential of this combined approach for predicting PD-L1 inhibitor response in HCC. The training set of EGAD00001008128 incorporated these two features alongside immunotherapy response data, achieving an accuracy of 0.9361. When applied to the test set, the model maintained a discriminative performance with an accuracy of 0.725, highlighting its ability to generalize to unseen data. The combined model is shown in Figure 6. Hypoxia scores captured the influence of the tumor microenvironment on immune response, while KAN-derived features reflected key genomic factors associated with immunotherapy outcomes. This integration highlights the importance of a multifactorial approach in enhancing the precision of immunotherapy predictions.
Despite its strengths, this study has certain limitations. The training set used for model development exhibited an imbalance in the distribution of responders and non-responders, which was addressed using the Synthetic Minority Over-sampling Technique (SMOTE). While SMOTE improved the training process by balancing the data, it may have introduced artificial patterns that could affect the model's performance. Additionally, the small size of the test set could impact the generalizability of the findings. While the prediction model demonstrated high accuracy in both the training and test datasets, external validation using independent cohorts is essential to confirm its robustness and clinical utility. Furthermore, the biological mechanisms underlying the identified hypoxia-related genes (NOXA) with PD-L1 inhibitors require experimental validation to support their clinical potential. Future studies should focus on increasing datasets, improving data balance without over-reliance on synthetic methods, and validating the model through experiments.
5. Conclusion
In conclusion, this study provides a novel, integrative approach for predicting PD-L1 inhibitor response in HCC. The KAN model effectively captured the complex relationships between gene expression and immune response. By incorporating hypoxia-related risk features, the model addresses the critical role of the tumor microenvironment in influencing immunotherapy outcomes. This study highlights the importance of multi-dimensional analysis in advancing precision medicine for HCC.
References
- Ayuso, C.; Rimola, J.; Vilana, R.; Burrel, M.; Darnell, A.; Garcia-Criado, A.; Bianchi, L.; Belmonte, E.; Caparroz, C.; Barrufet, M.; et al. Diagnosis and staging of hepatocellular carcinoma (HCC): current guidelines. Eur J Radiol 2018, 101, 72–81. [Google Scholar] [CrossRef]
- Llovet, J.M.; Pinyol, R.; Kelley, R.K.; El-Khoueiry, A.; Reeves, H.L.; Wang, X.W.; Gores, G.J.; Villanueva, A. Molecular pathogenesis and systemic therapies for hepatocellular carcinoma. Nat Cancer 2022, 3, 386–401. [Google Scholar] [CrossRef]
- Hsu, C.; Rimassa, L.; Sun, H.C.; Vogel, A.; Kaseb, A.O. Immunotherapy in hepatocellular carcinoma: evaluation and management of adverse events associated with atezolizumab plus bevacizumab. Ther Adv Med Oncol 2021, 13, 17588359211031141. [Google Scholar] [CrossRef]
- Cheon, J.; Jung, S.; Kim, J.S.; Kang, B.; Kim, H.; Chan, L.L.; Becker, L.; Gaillard, V.E.; Chan, S.L.; Kim, C.; et al. Organ-specific responses to atezolizumab plus bevacizumab in advanced hepatocellular carcinoma: A multicentre, retrospective study. Liver Int 2024, 44, 1961–1970. [Google Scholar] [CrossRef] [PubMed]
- Carloni, R.; Sabbioni, S.; Rizzo, A.; Ricci, A.D.; Palloni, A.; Petrarota, C.; Cusmai, A.; Tavolari, S.; Gadaleta-Caldarola, G.; Brandi, G. Immune-Based Combination Therapies for Advanced Hepatocellular Carcinoma. J Hepatocell Carcinoma 2023, 10, 1445–1463. [Google Scholar] [CrossRef]
- Oura, K.; Morishita, A.; Tani, J.; Masaki, T. Tumor Immune Microenvironment and Immunosuppressive Therapy in Hepatocellular Carcinoma: A Review. Int J Mol Sci 2021, 22. [Google Scholar] [CrossRef]
- Zeng, F.; Zhang, Y.; Han, X.; Zeng, M.; Gao, Y.; Weng, J. Employing hypoxia characterization to predict tumour immune microenvironment, treatment sensitivity and prognosis in hepatocellular carcinoma. Comput Struct Biotechnol J 2021, 19, 2775–2789. [Google Scholar] [CrossRef]
- Dai, X.; Pi, G.; Yang, S.L.; Chen, G.G.; Liu, L.P.; Dong, H.H. Association of PD-L1 and HIF-1alpha Coexpression with Poor Prognosis in Hepatocellular Carcinoma. Transl Oncol 2018, 11, 559–566. [Google Scholar] [CrossRef]
- Cheng, B.; Zhou, P.; Chen, Y. Machine-learning algorithms based on personalized pathways for a novel predictive model for the diagnosis of hepatocellular carcinoma. BMC Bioinformatics 2022, 23, 248. [Google Scholar] [CrossRef]
- Huang, M.; Yang, S.; Tai, W.C.S.; Zhang, L.; Zhou, Y.; Cho, W.C.S.; Chan, L.W.C.; Wong, S.C.C. Bioinformatics Identification of Regulatory Genes and Mechanism Related to Hypoxia-Induced PD-L1 Inhibitor Resistance in Hepatocellular Carcinoma. Int J Mol Sci 2023, 24. [Google Scholar] [CrossRef]
- Liu, Z.; Wang, Y.; Vaidya, S.; Ruehle, F.; Halverson, J.; Soljačić, M.; Hou, T.Y.; Tegmark, M. KAN: Kolmogorov–Arnold Networks, arXiv:2404.19756.
- Jiang, G.; Zheng, J.Y.; Ren, S.N.; Yin, W.; Xia, X.; Li, Y.; Wang, H.L. A comprehensive workflow for optimizing RNA-seq data analysis. BMC Genomics 2024, 25, 631. [Google Scholar] [CrossRef] [PubMed]
- Huang, M.; Chan, L.W.C. Machine learning identification of hypoxia-related genes and prognostic risk-scoring model for effective survival stratification in hepatocellular carcinoma. Journal of Clinical Oncology 2024, 42 (Suppl. 16), e16261–e16261. [Google Scholar]
- Jing, X.; Yang, F.; Shao, C.; Wei, K.; Xie, M.; Shen, H.; Shu, Y. Role of hypoxia in cancer therapy by regulating the tumor microenvironment. Mol Cancer 2019, 18, 157. [Google Scholar] [CrossRef] [PubMed]
- Suzuki, T.; Shinjo, S.; Arai, T.; Kanai, M.; Goda, N. Hypoxia and fatty liver. World J Gastroenterol 2014, 20, 15087–15097. [Google Scholar] [CrossRef] [PubMed]
- Yuen, V.W.; Wong, C.C. Hypoxia-inducible factors and innate immunity in liver cancer. J Clin Invest 2020, 130, 5052–5062. [Google Scholar] [CrossRef] [PubMed]
- Wang, C.; Tan, J.Y.M.; Chitkara, N.; Bhatt, S. TP53 Mutation-Mediated Immune Evasion in Cancer: Mechanisms and Therapeutic Implications. Cancers (Basel) 2024, 16. [Google Scholar] [CrossRef] [PubMed]
- Park, S.Y.; Jeong, M.S.; Jang, S.B. In vitro binding properties of tumor suppressor p53 with PUMA and NOXA. Biochem Biophys Res Commun 2012, 420, 350–356. [Google Scholar] [CrossRef] [PubMed]
- Yan, X.; Chen, D.; Wang, Y.; Guo, Y.; Tong, C.; Wei, J.; Zhang, Y.; Wu, Z.; Han, W. Identification of NOXA as a pivotal regulator of resistance to CAR T-cell therapy in B-cell malignancies. Signal Transduction and Targeted Therapy 2022, 7, 98. [Google Scholar] [CrossRef] [PubMed]
- Yazdani, Y.; Farazmandfar, T.; Azadeh, H.; Zekavatian, Z. The prognostic effect of PTEN expression status in colorectal cancer development and evaluation of factors affecting it: miR-21 and promoter methylation. J Biomed Sci 2016, 23, 9. [Google Scholar] [CrossRef]
Figure 2.
(a) Volcano plot for EGAD00001008128; (b) Volcano plot for GSE41666; (c) Volcano plot for GSE14520; (d) IRH genes: Overlapping DEGs between EGAD00001008128 and GSE41666 datasets; (e) HHO genes: Overlapping DEGs between GSE41666 and GSE14520 datasets.
Figure 2.
(a) Volcano plot for EGAD00001008128; (b) Volcano plot for GSE41666; (c) Volcano plot for GSE14520; (d) IRH genes: Overlapping DEGs between EGAD00001008128 and GSE41666 datasets; (e) HHO genes: Overlapping DEGs between GSE41666 and GSE14520 datasets.
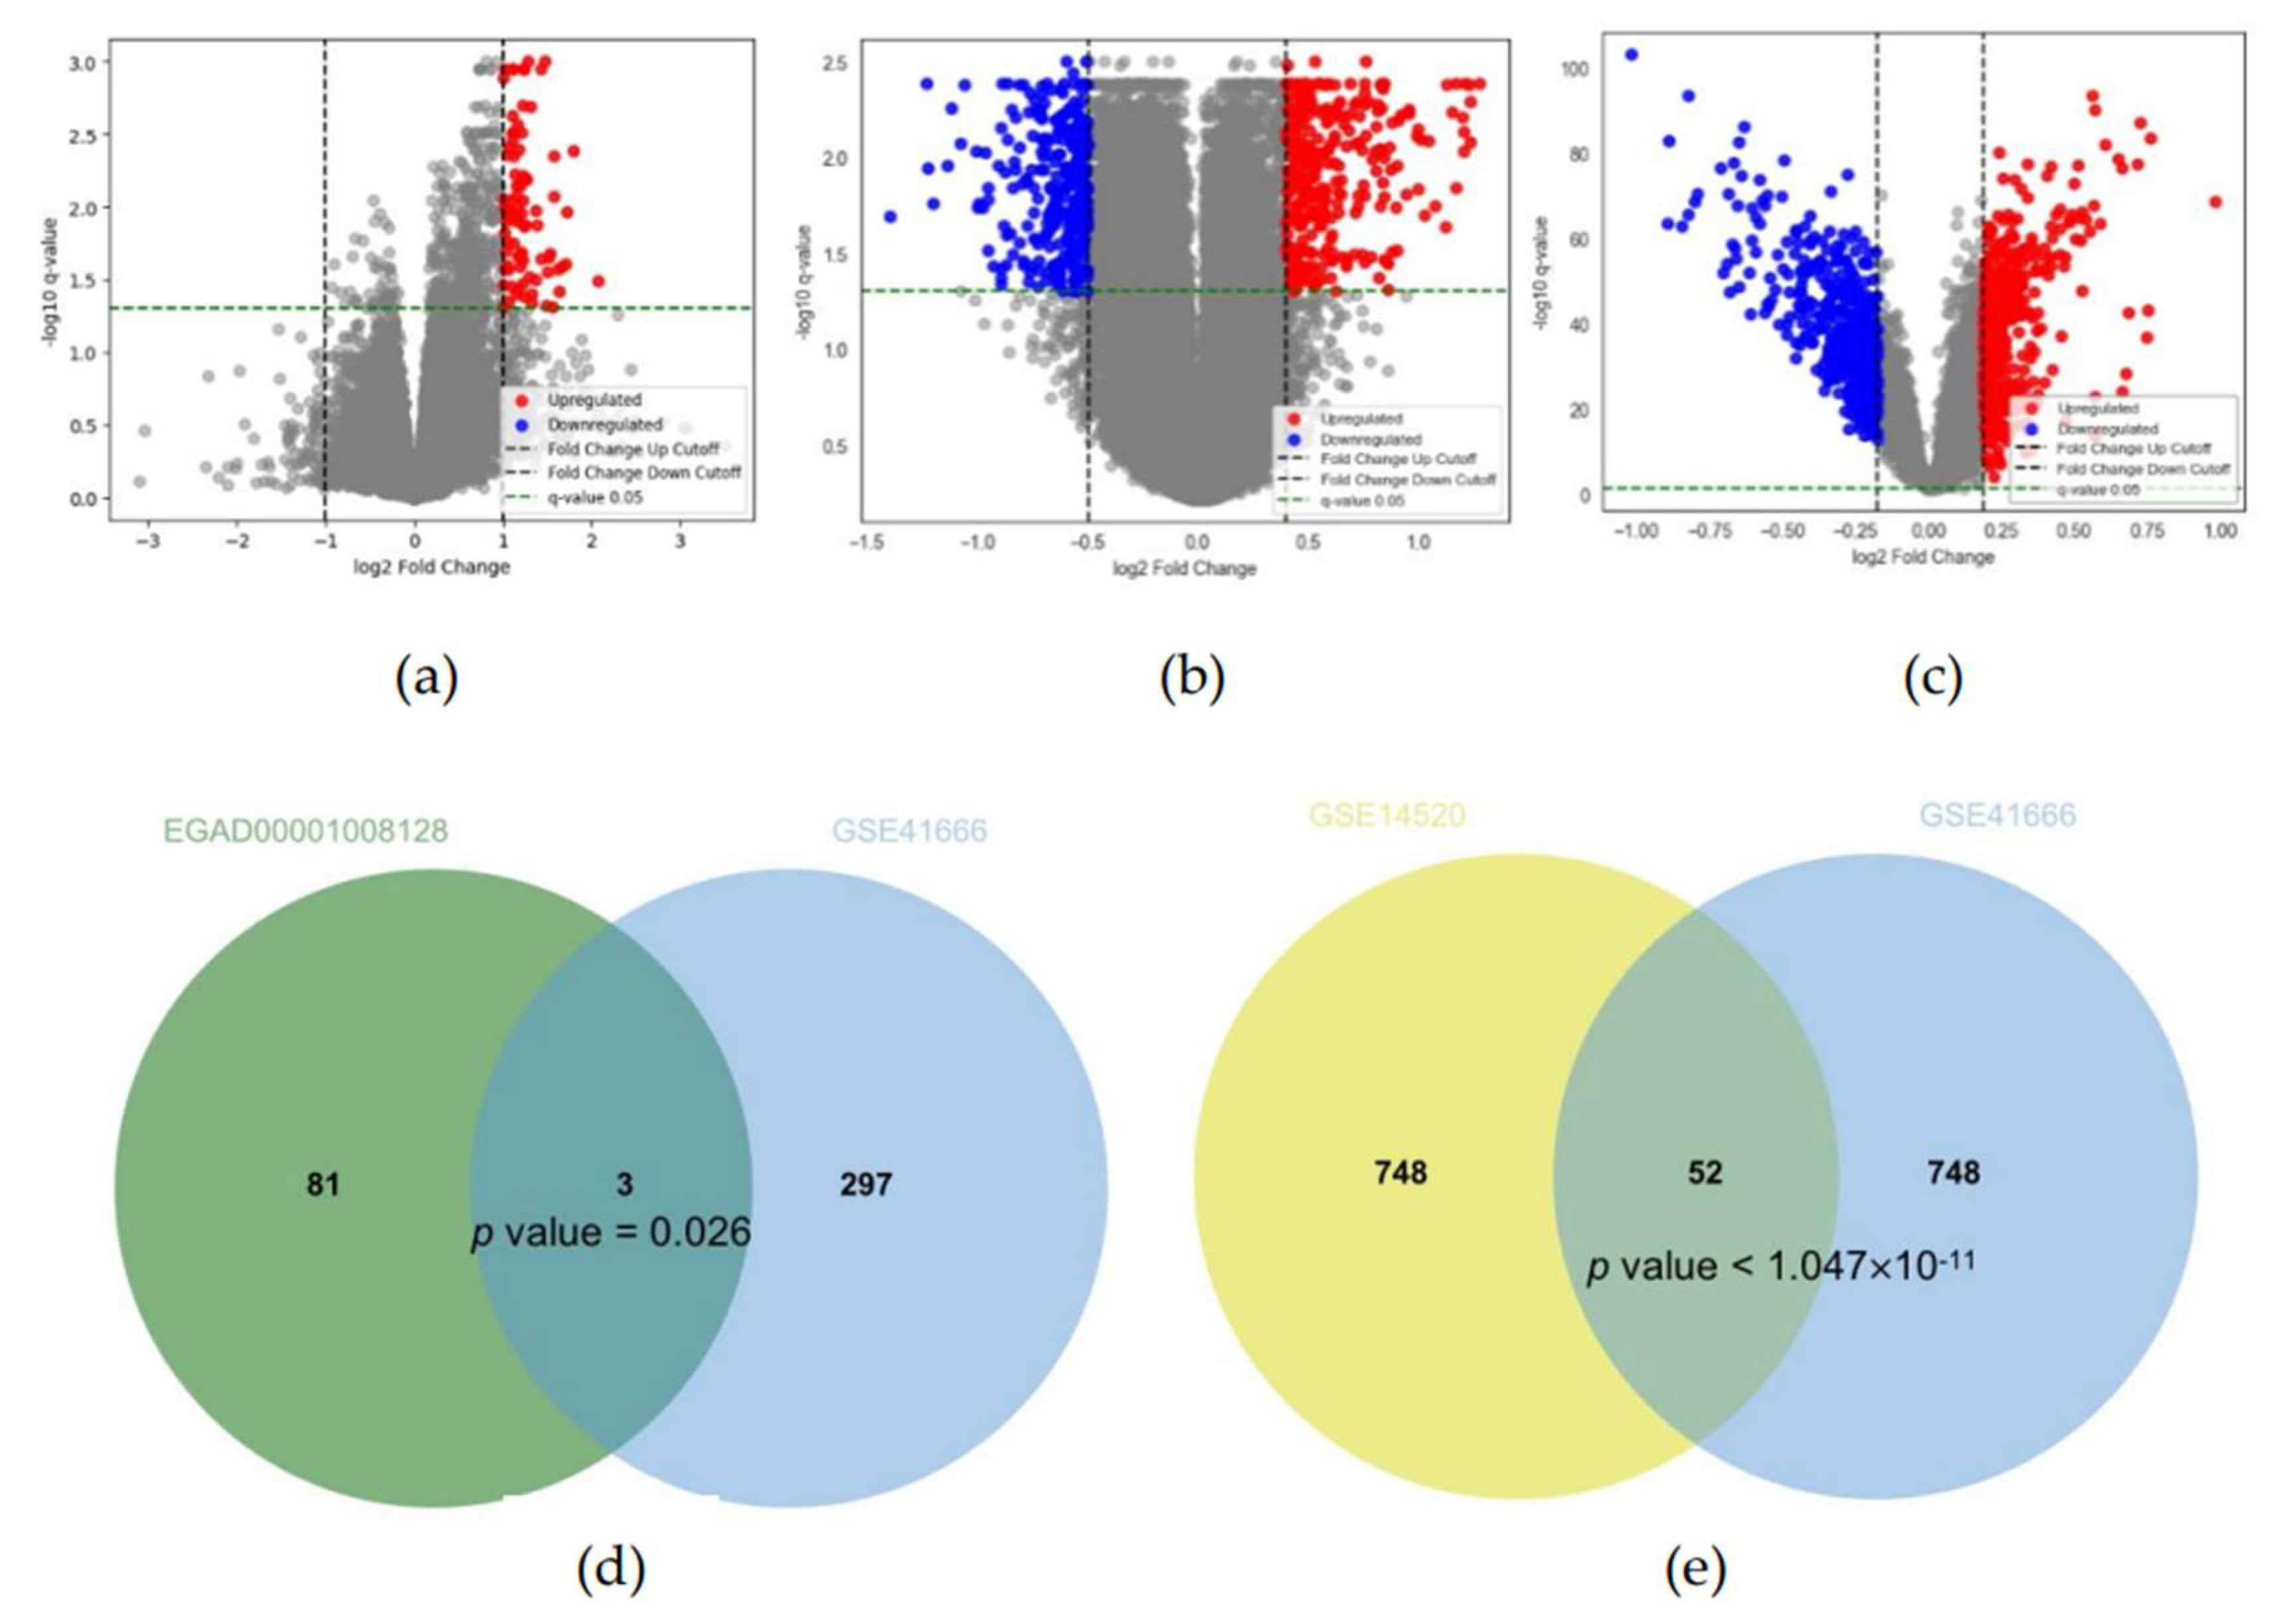
Figure 3.
Cox regression and LASSO analysis of 21 candidate genes on HHOs, resulted in a final model of 9 genes.
Figure 3.
Cox regression and LASSO analysis of 21 candidate genes on HHOs, resulted in a final model of 9 genes.
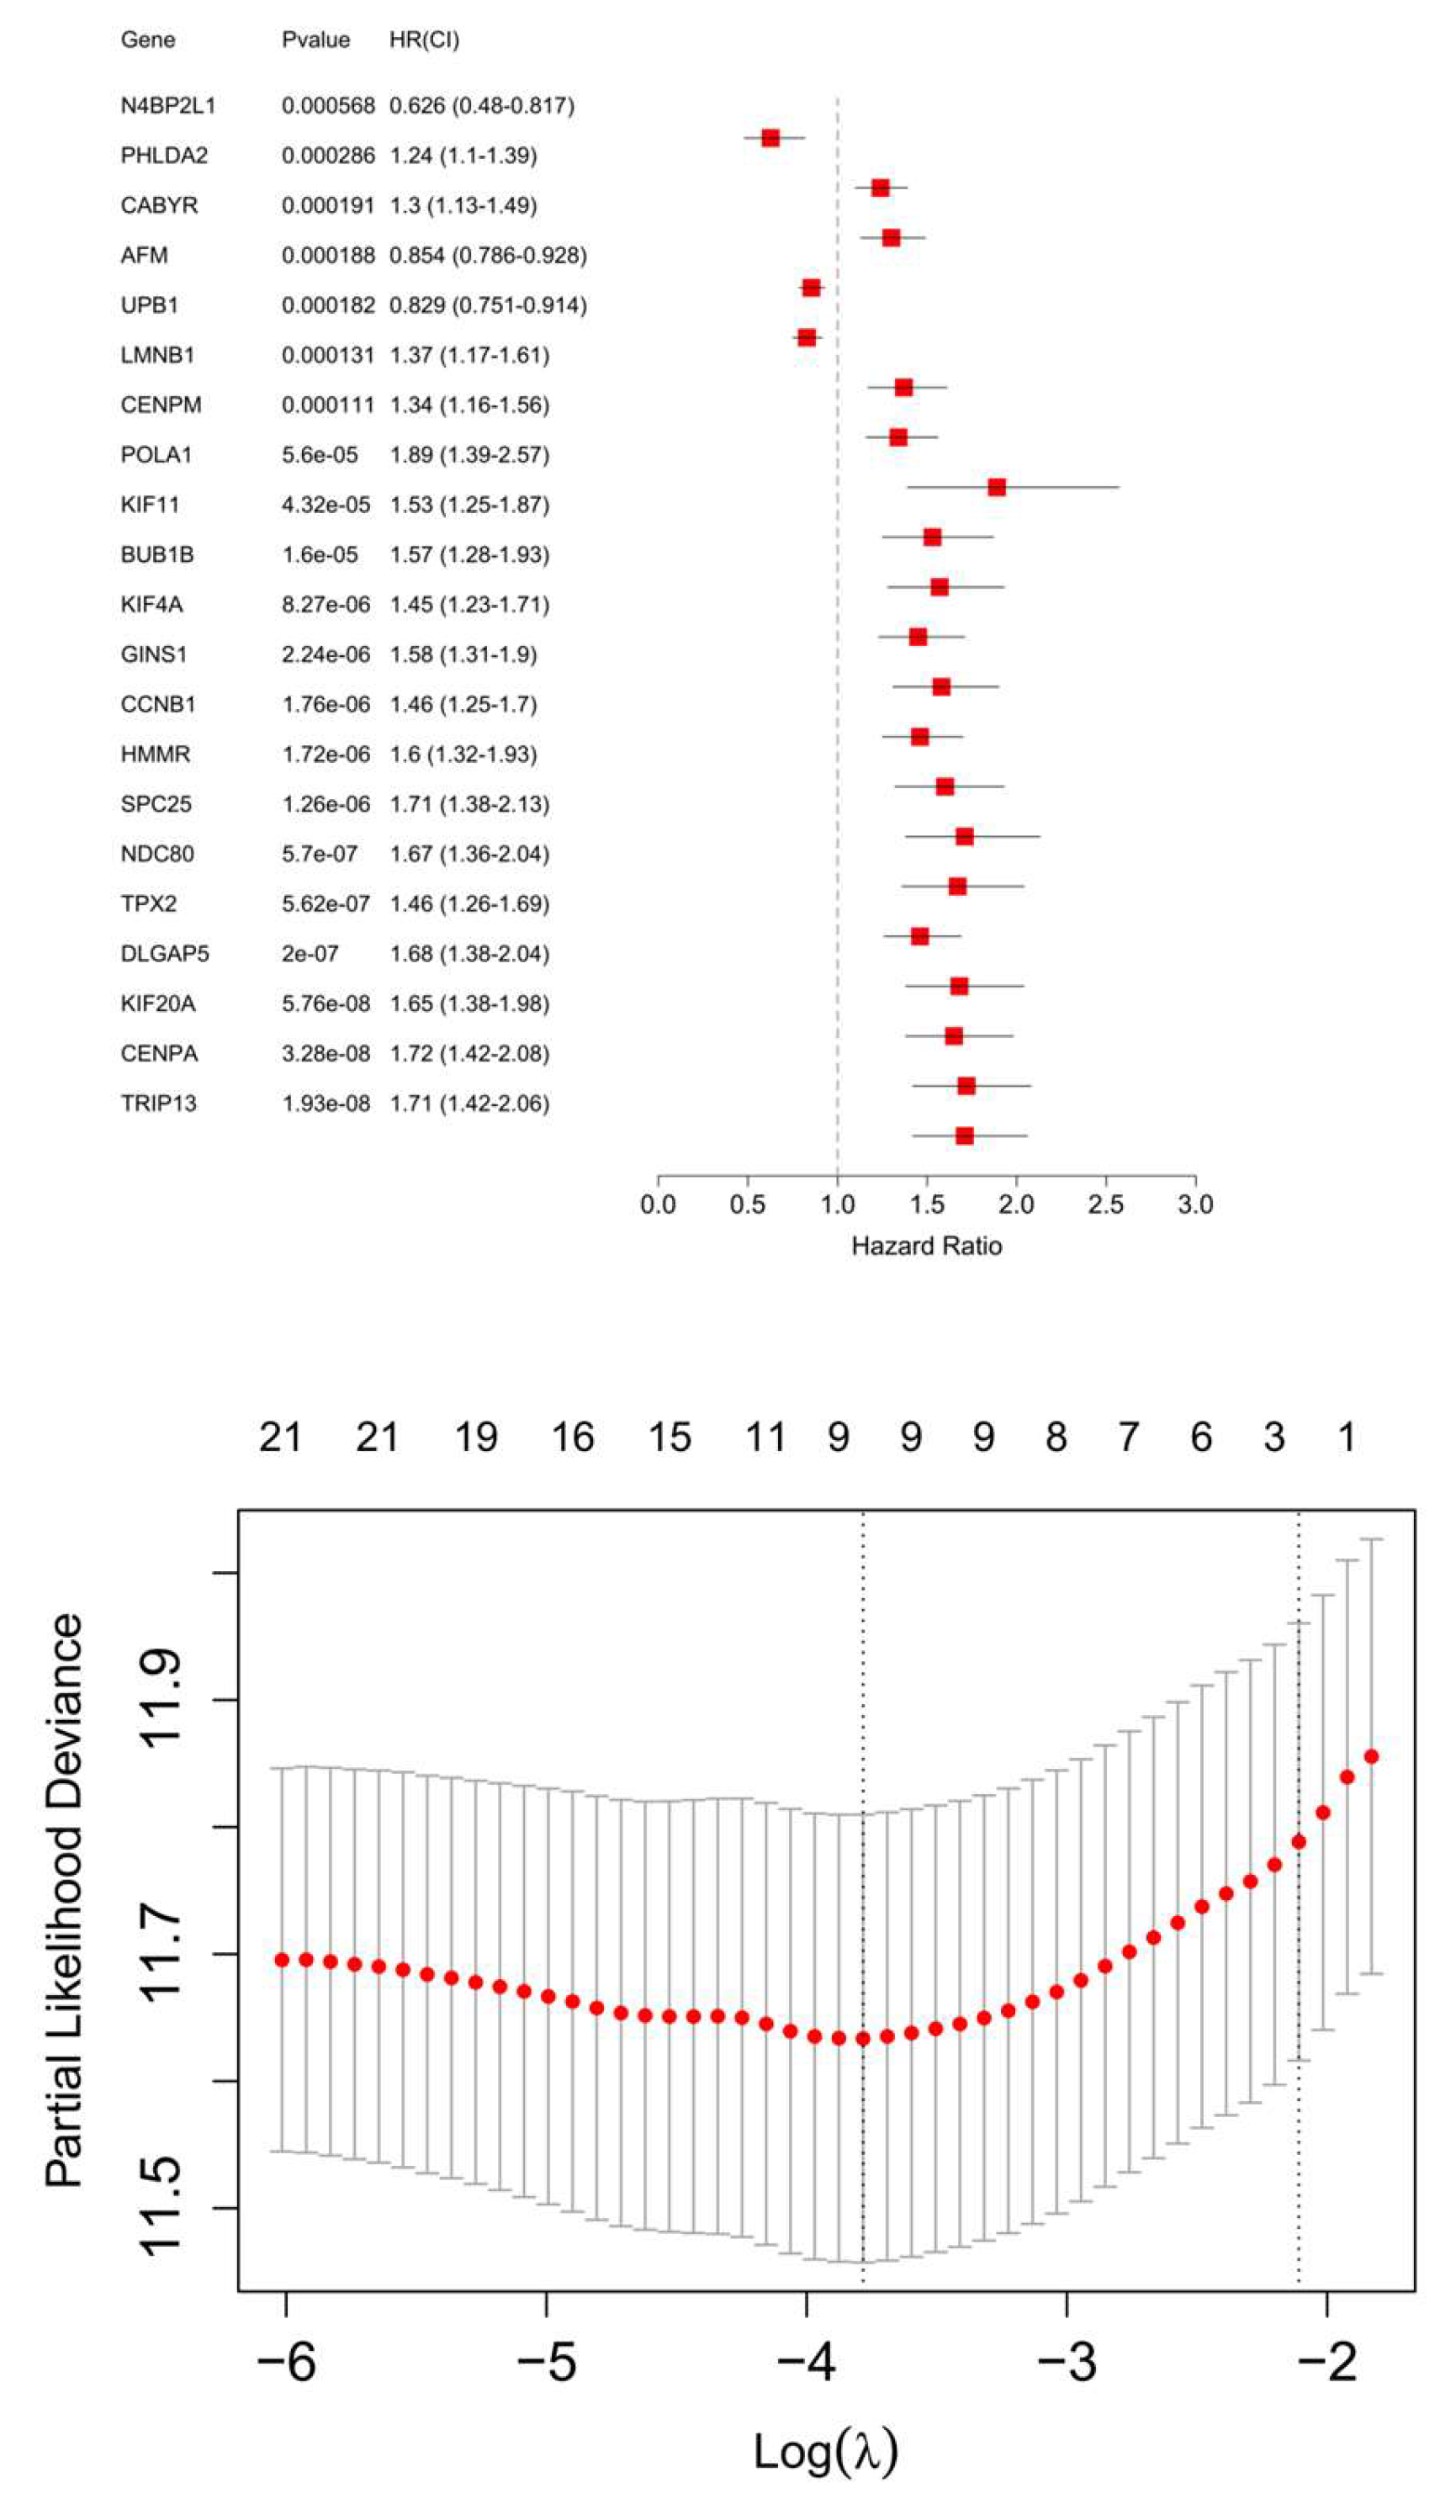
Figure 4.
Accuracy comparison of the KAN model.
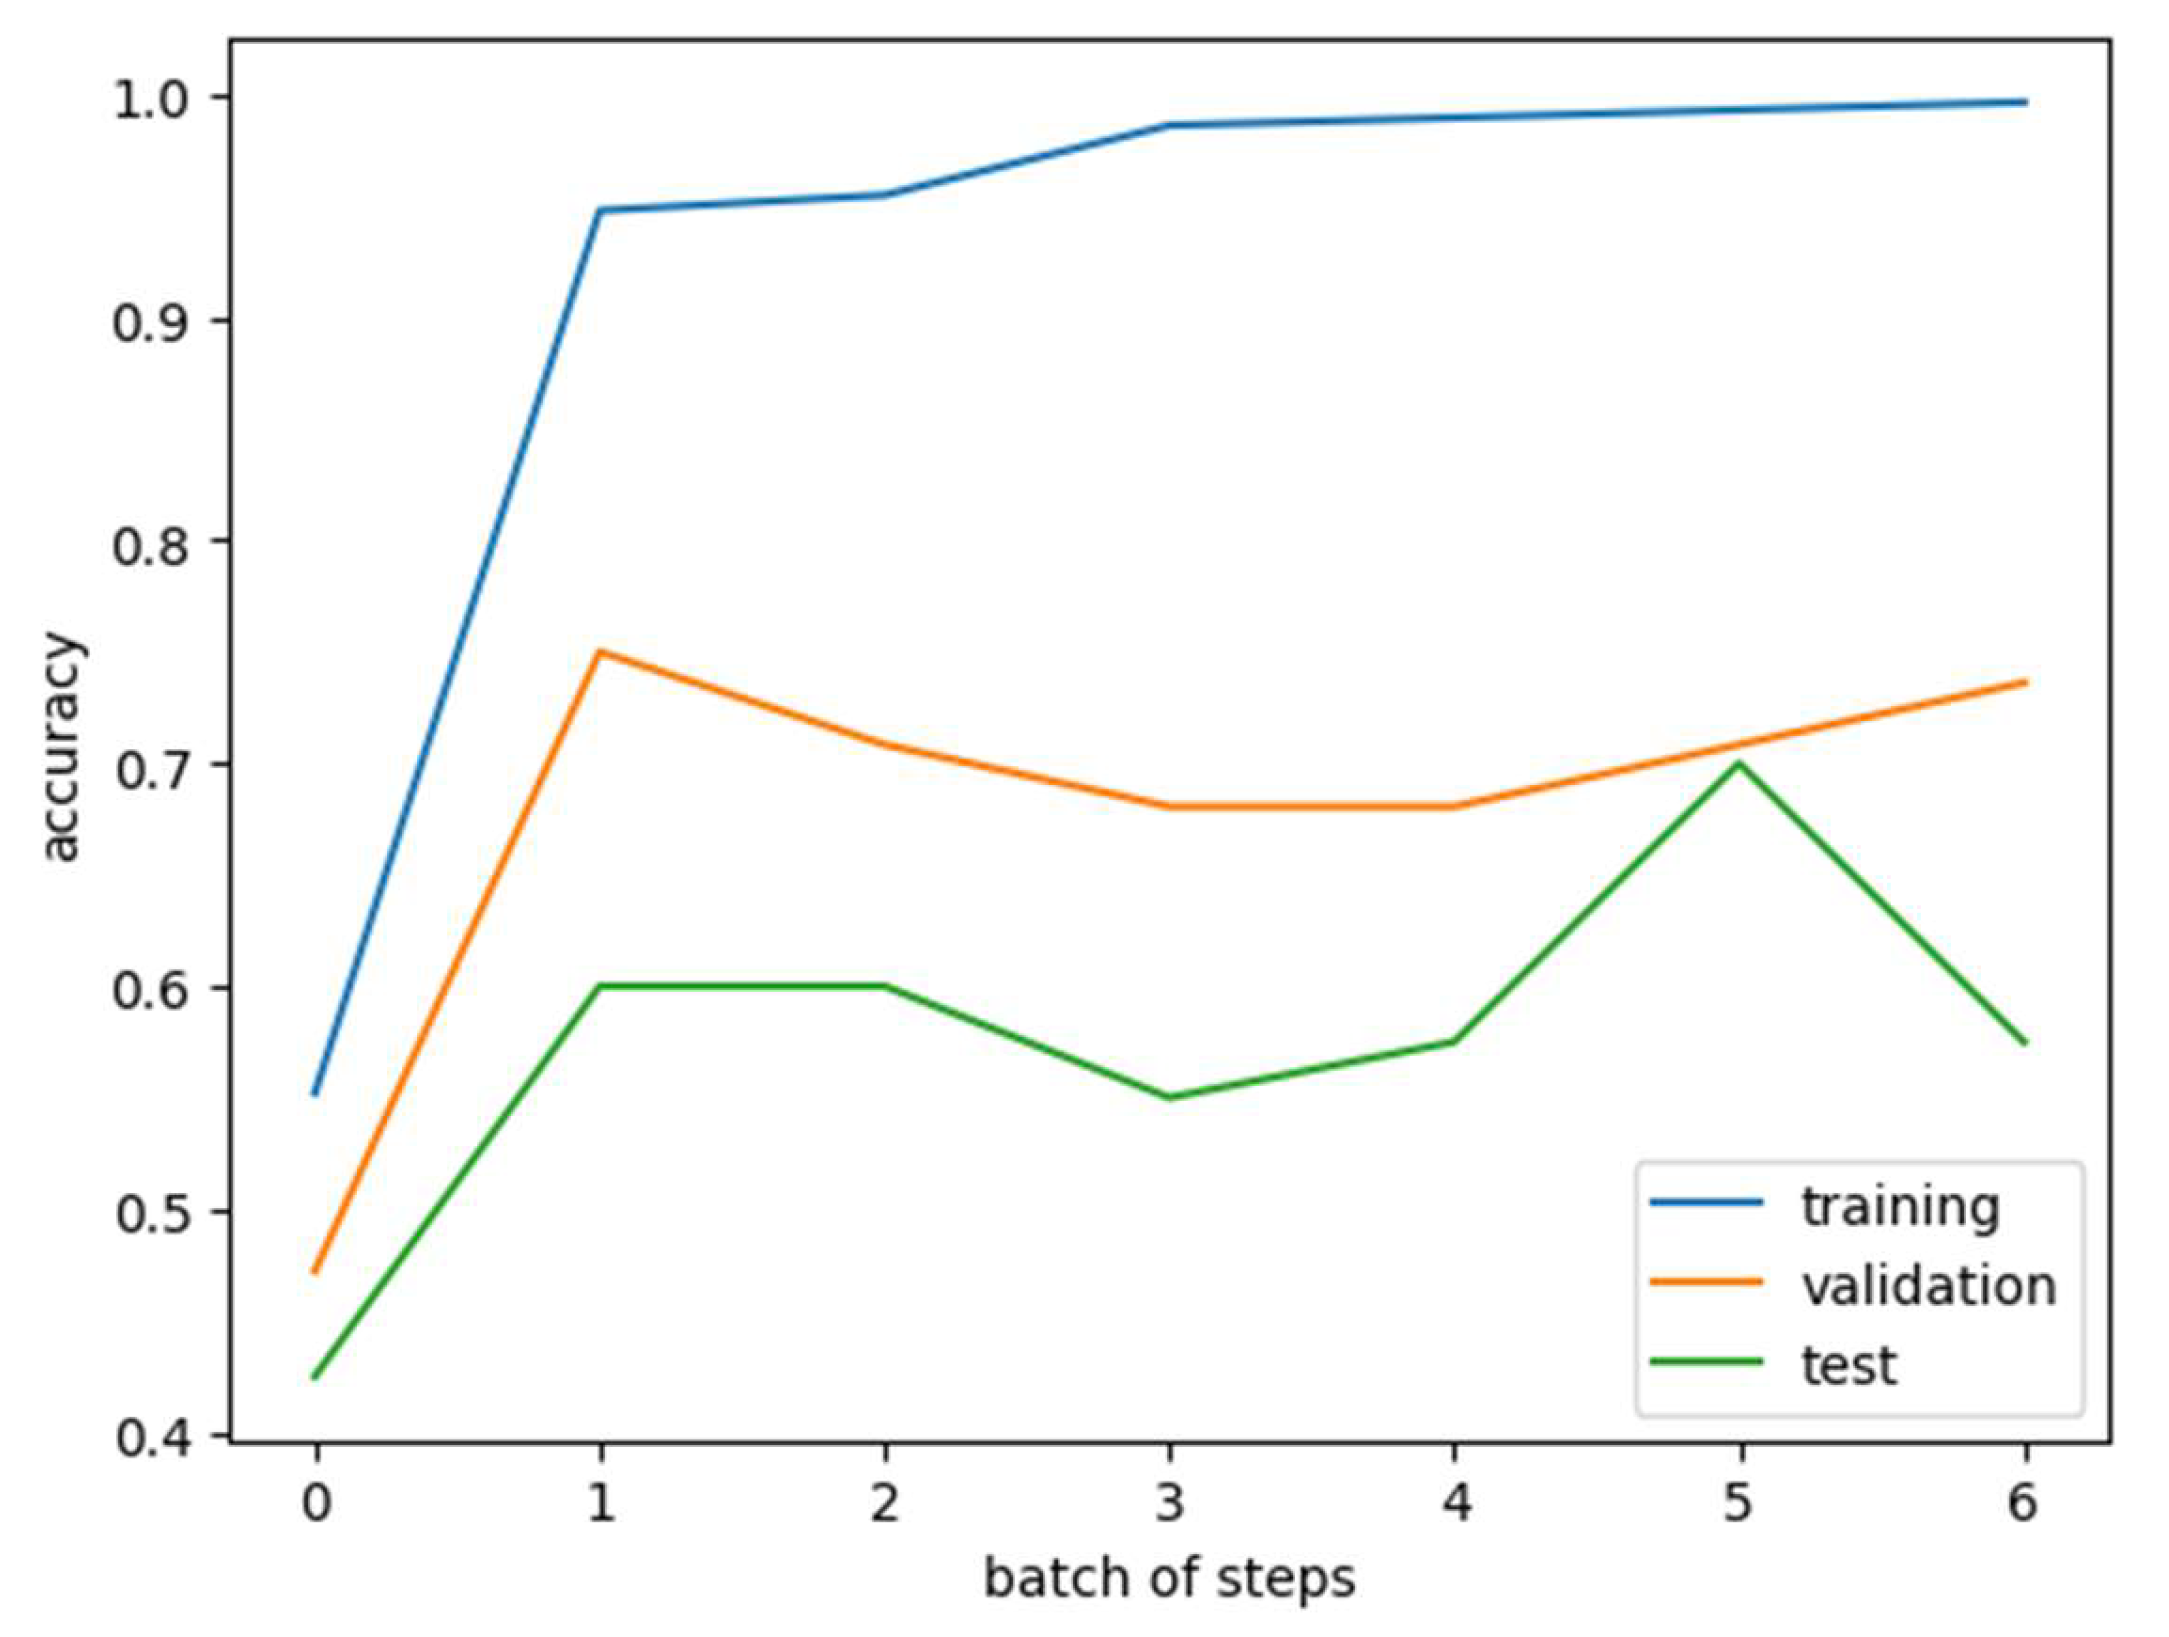
Figure 5.
Training and test accuracy for the combined SVM model.
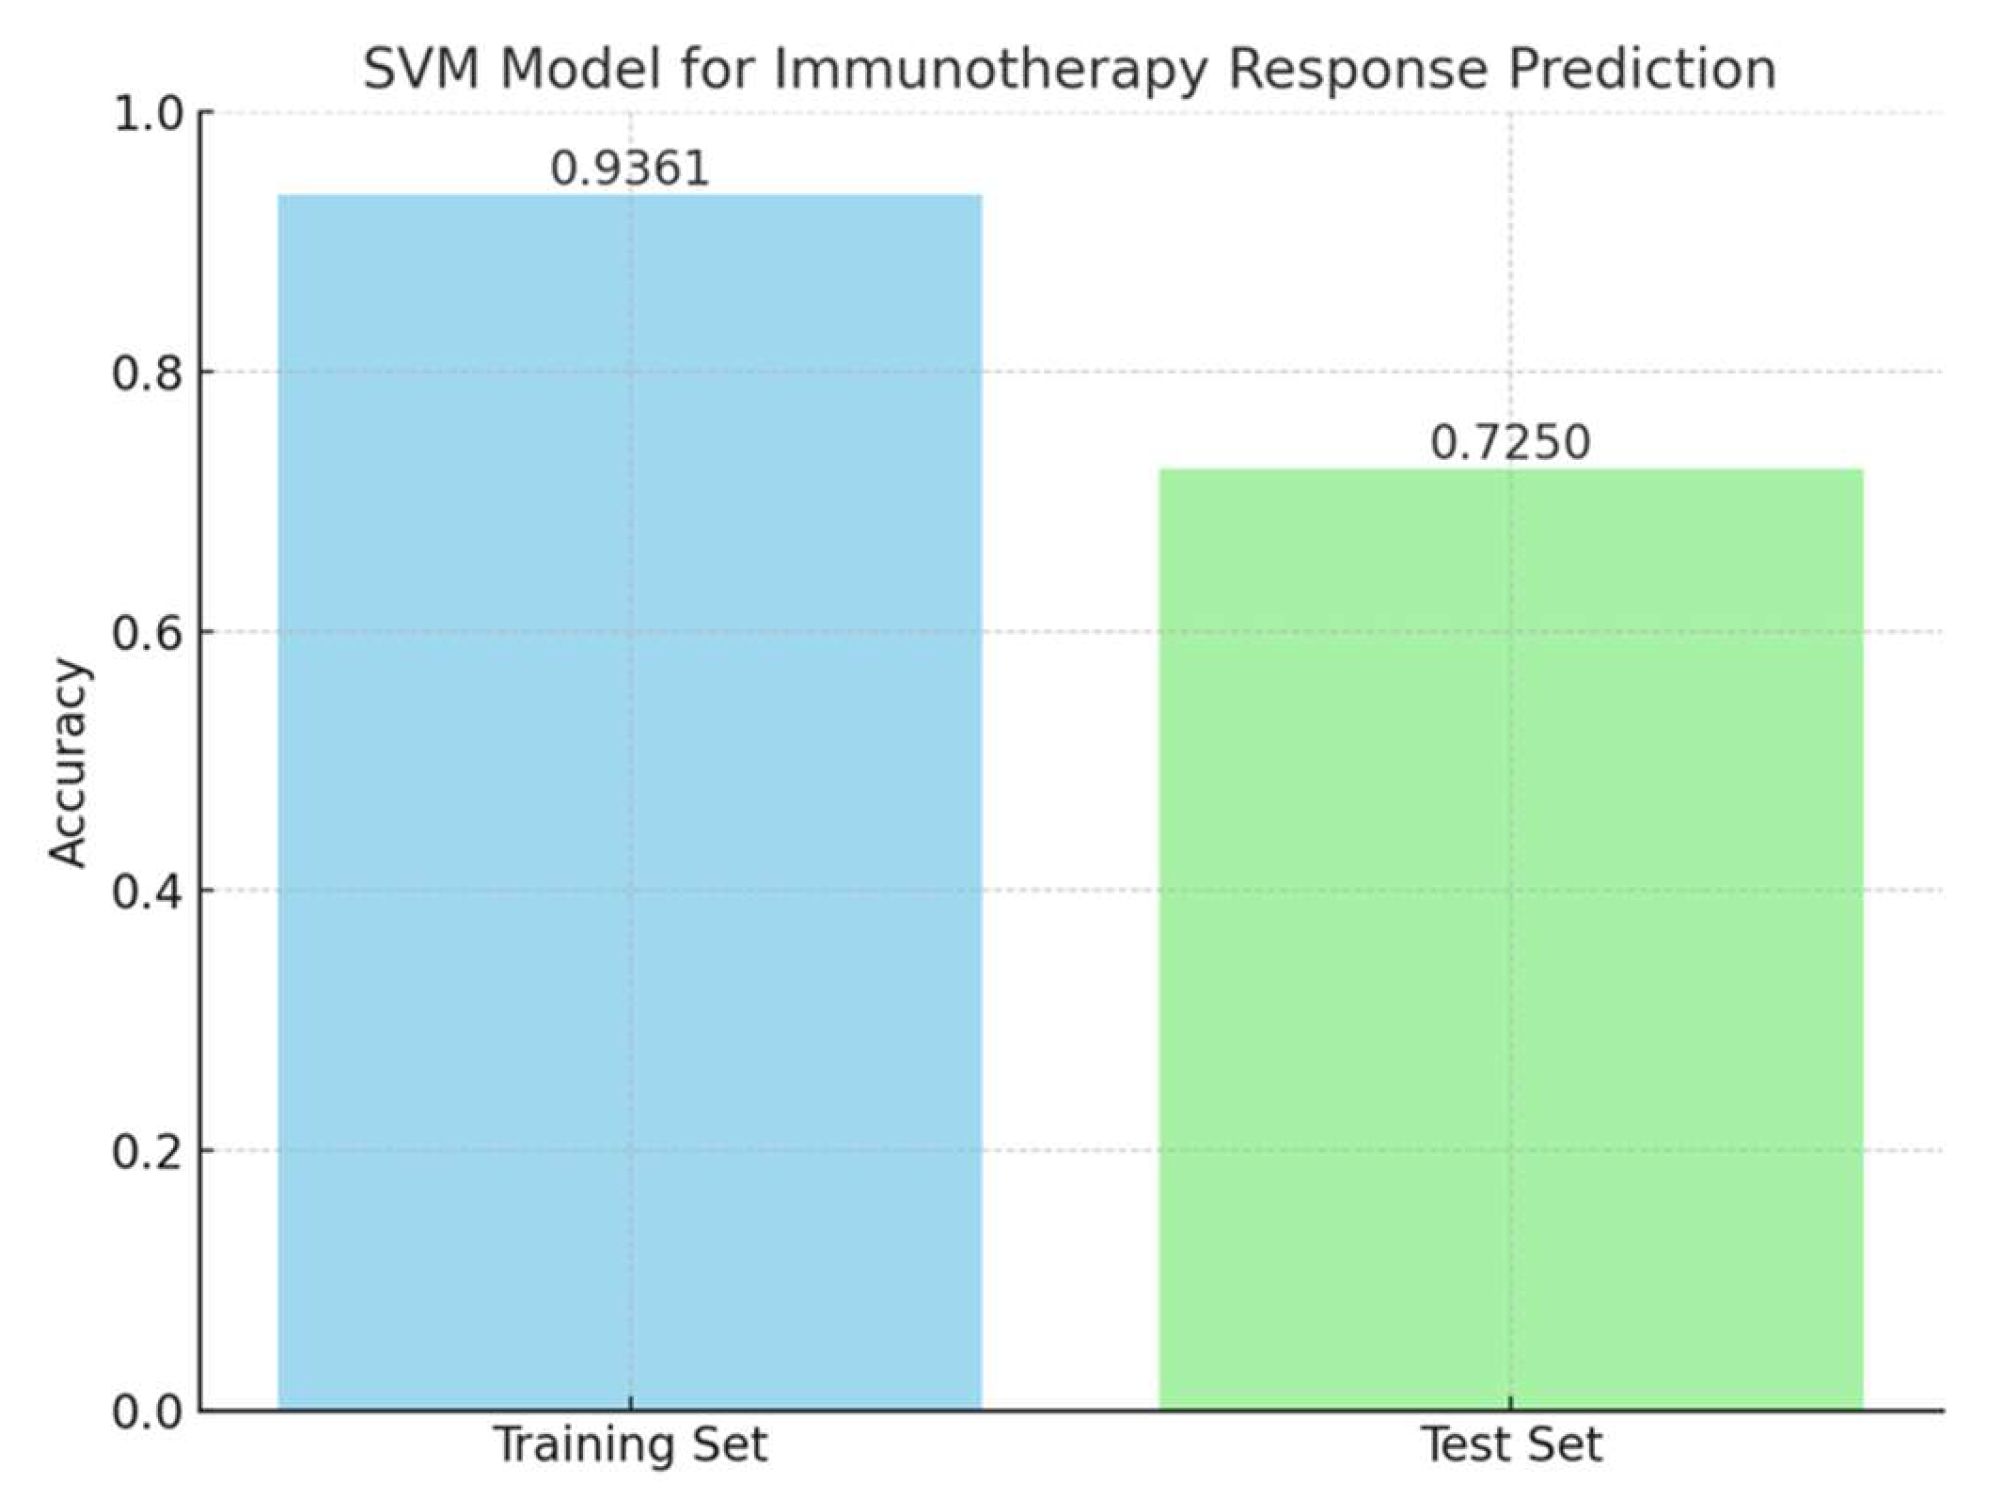
Figure 6.
The architecture of the SVM model combines hypoxia and KAN models and the models were implemented using a test case.
Figure 6.
The architecture of the SVM model combines hypoxia and KAN models and the models were implemented using a test case.
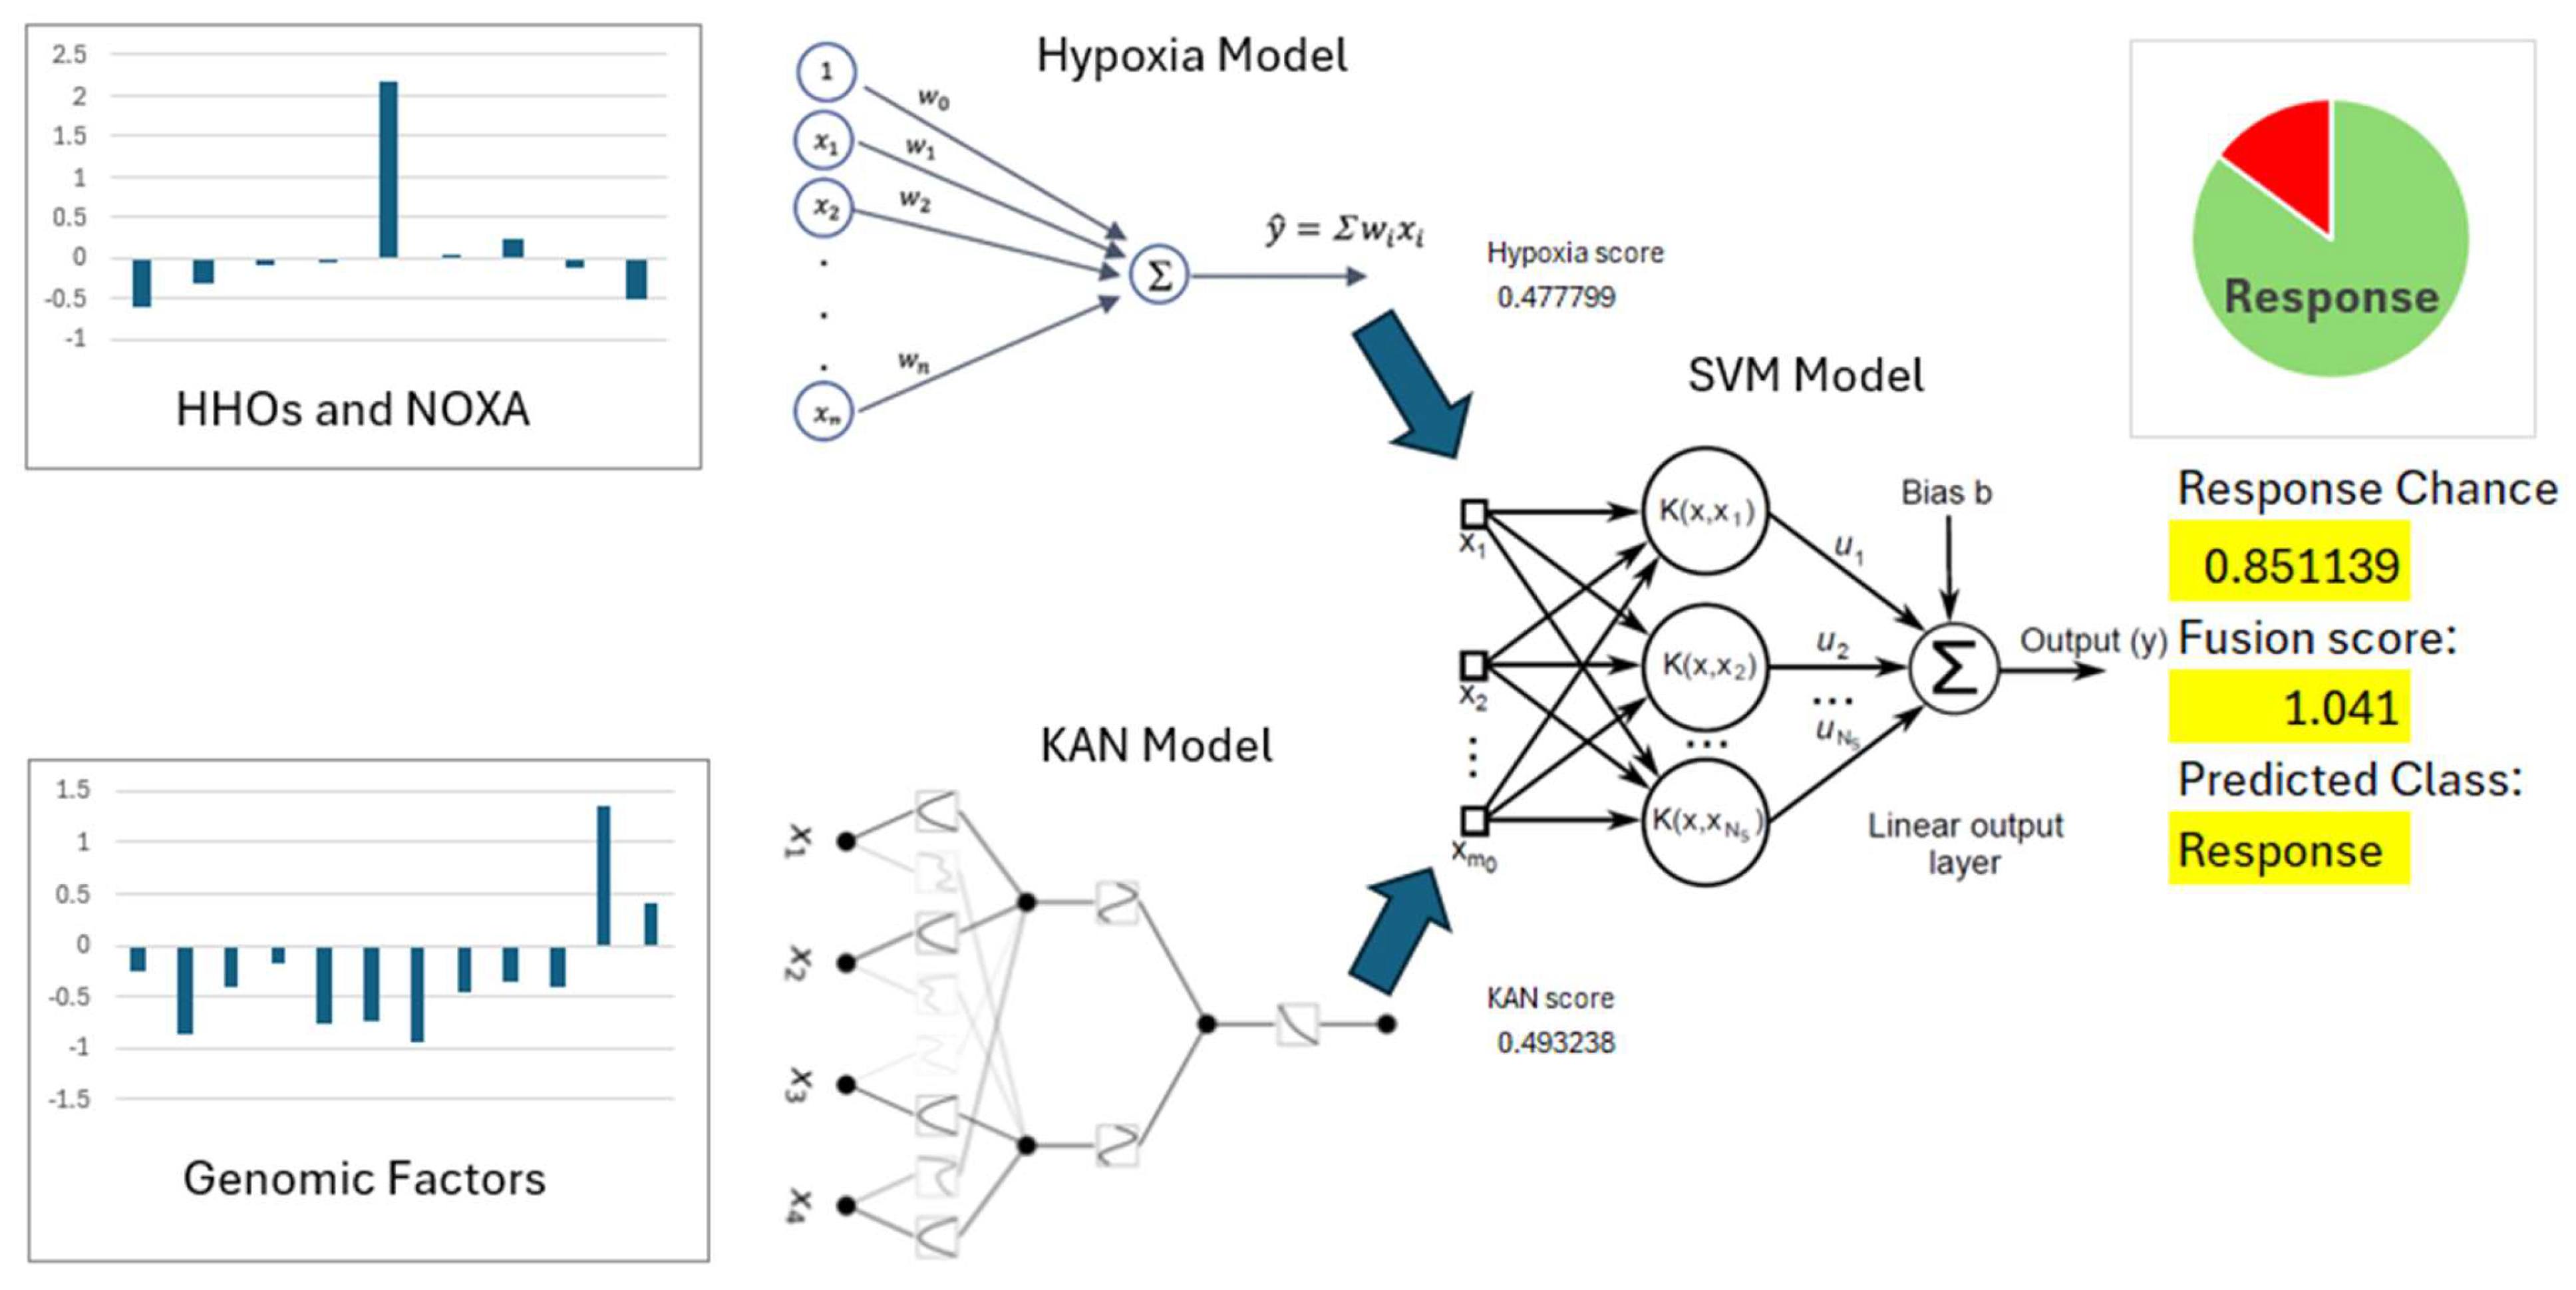

Table 1.
Cox Regression Analysis for the Hypoxia Risk Scoring Model related to Drug Response Prediction.
Table 1.
Cox Regression Analysis for the Hypoxia Risk Scoring Model related to Drug Response Prediction.
| Gene | log HR | log HR SE | HR | t | p | 95% CI Lower | 95%CI Upper |
|---|---|---|---|---|---|---|---|
| PHLDA2 | 0.1497 | 0.0753 | 1.1615 | 1.9887 | 0.0467 | 1.0022 | 1.3462 |
| DLGAP5 | 0.0757 | 0.2695 | 1.0787 | 0.281 | 0.7787 | 0.636 | 1.8293 |
| N4BP2L1 | -0.2318 | 0.1636 | 0.7931 | -1.4163 | 0.1567 | 0.5755 | 1.093 |
| CENPA | 0.099 | 0.227 | 1.104 | 0.4361 | 0.6628 | 0.7076 | 1.7226 |
| UPB1 | -0.0584 | 0.0725 | 0.9433 | -0.8061 | 0.4202 | 0.8184 | 1.0872 |
| CABYR | 0.1509 | 0.0752 | 1.1629 | 2.0063 | 0.0448 | 1.0035 | 1.3476 |
| AFM | -0.0022 | 0.0609 | 0.9978 | -0.0368 | 0.9707 | 0.8856 | 1.1242 |
| HMMR | 0.3139 | 0.1889 | 1.3687 | 1.6618 | 0.0965 | 0.9452 | 1.982 |
| KIF20A | 0.0587 | 0.2379 | 1.0604 | 0.2465 | 0.8053 | 0.6652 | 1.6904 |
| PMAIP1 | -0.1203 | 0.1857 | 0.8866 | -0.648 | 0.517 | 0.6162 | 1.2758 |
Disclaimer/Publisher’s Note: The statements, opinions and data contained in all publications are solely those of the individual author(s) and contributor(s) and not of MDPI and/or the editor(s). MDPI and/or the editor(s) disclaim responsibility for any injury to people or property resulting from any ideas, methods, instructions or products referred to in the content. |
© 2025 by the authors. Licensee MDPI, Basel, Switzerland. This article is an open access article distributed under the terms and conditions of the Creative Commons Attribution (CC BY) license (http://creativecommons.org/licenses/by/4.0/).
Copyright: This open access article is published under a Creative Commons CC BY 4.0 license, which permit the free download, distribution, and reuse, provided that the author and preprint are cited in any reuse.


