
Submitted:
23 March 2025
Posted:
24 March 2025
You are already at the latest version
Abstract
The peak particle velocity (PPV) of blasting vibration is a primary indicator to evaluate the explosion effect in an open pit mine. In the blasting scenario of an open pit mine, existing methods for predicting the peak velocity of blasting vibration are difficult to achieve ideal outcomes, leading to inappropriate designs of blasting parameters and detonation network. As a result, the peak velocity of blasting vibration cannot be accurately forecasted. Aiming at improving the prediction accuracy of blasting vibration peak velocity, based on the monitoring data of blasting vibrations at Yuanbaoshan open-pit mine with different coal storage conditions, distance from the explosive center, maximum charge per delay, elevation difference and longitudinal wave speed are chosen as the input parameters. The key parameters C and g of the support vector machine (SVM) algorithm are optimized through the global optimization of the particle swarm optimization (PSO) algorithm, so that the prediction performance of SVM is at the optimal state, and then the PSO-SVM model for predicting the peak velocity of blasting vibration is constructed. By analyzing the relationship among the input parameters and the blasting vibration peak velocity, it is concluded that the longitudinal wave speed, which represents the site conditions, is also a significant factor influencing the propagation of blasting vibration velocity. Comparing to the test results of the RS-dept and the improved Sadovsky formula, it is found that the maximum error of blasting vibration prediction by the PSO-SVM model is reduced by 48.19% and 53.6% compared with that by the RS-dept model and the improved Sadovsky formula, respectively. Also, the average error of blasting vibration prediction by the combined PSO-SVM algorithm is 3.37%, which is 29.94% and 17.86% lower than that by the improved Sadovsky formula and the RS-dept model, respectively. The predicted values of the improved PSO-SVM model match best with the measured values and the predicted results are most reliable. The proposed research method can provide theoretical guidance and practical reference for the blast design of an open pit mine.
Keywords:
Open pit mine
; Blasting vibration peak velocity
; Improved support vector machine
; RS-dept
; PSO-SVM model
1. Introduction
In recent years, the sales volume of industrial explosives has been continuously increasing with the development of the Chinese economy(Industry Research Institute., 2023). Theoretically, about half of the energy generated by the explosion can be availed. However, less than 30% of the explosive energy is utilized in actual engineering. The remaining energy is converted into blast-inducted vibration waves, air blast waves, noises, toxic and harmful gases, dust and other forms of energy, among which blasting vibration has the most significant effect on the community and environment(Leng Zhendong, Gao Qidong, Lu Wenbo, et al., 2023). Blasting vibrations pose damage to surface structures, induce slope instabilities, as well as impact the living of neighboring residents. To minimize the harmful consequences caused by blasting vibrations, it is important to precisely predict the vibration intensity before a detonation and take appropriate measures to control blasting vibrations.
The peak particle velocity (PPV) of vibration induced by blasting is a critical index to evaluate whether the blast damages nearby structures. At present, a series of empirical formulas have been proposed for the calculation of PPV, and the most popular ones are applied by means of explosive charge quantity (Q) and distance from the explosive center (R). However, it is difficult to obtain desirable prediction results in complex scenarios. Some researchers began to revise and improve the Sadovsky formula(Fan Yong, Hu Mingdong, Yang Guangdong et al., 2024). A variety of new variables including geomorphic factors were introduced, which effectively improved the prediction effect of blasting vibration(Fei Honglu,Zuo Zhuangzhuang,Jiang Anjun et al., 2023)(Wang Xinyu,Cao Pengfei,Xiao Yiqing et al., 2023). Zhang et al.(Zhang Pengfei, Yuan Yong, He Yunhua et al., 2024)used the GRA-EPSO-SVM model to predict the blasting vibration velocity in open pit mines and achieved certain results. In practice, unpredictable factors are often encountered, directly restricting the practical effect of the improved formula. Some researchers introduced artificial intelligence methods to forecast blasting vibration. By considering the P-wave velocity representing site conditions, Fan et al.(Fan Yong, Pei Yong, Yang Guangdong et al., 2022)selected the distance from the explosive center (R), the maximum charge per delay (Q), the elevation difference (H) and the P-wave velocity (Cp) as the input parameters of the prediction model and established an improved PSO-BP neural network model to predict blasting vibration. Although the accuracy of this model was significantly enhanced, the introduction of deep neural network caused the model to run for a longer time(Zhang Yong,Li Xuan,Yin Yanliang et al., 2023)(Li Shenglin, Han Haoxuan, Li Chen et al., 2024)(Li Zhenyang, Zhang Baogang, Xiong Xin et al.)(Cai Yuanqiang, Xie Fangqin, Yuan Zonghao et al., 2024), further leading to prominent problems such as slower convergence velocity. Therefore, based on the existing algorithms, a combined algorithm is put forward to predict the PPV of blasting vibration for enhancing the accuracy and efficiency of model prediction.
In this study, the PSO algorithm is utilized to optimize the penalty parameter C and the parameter g of the radial basis function (RBF) so as to achieve a desirable prediction performance of the support vector machine. Finally, the PSO-SVM model is constructed to assess the PPV of blasting vibration at Yuanbaoshan open-pit coal mine.
2. Improved the Support Vector Machine Based on the Integrated Particle Algorithm
2.1. Integrated Particle Swarm Optimization (PSO)
In the initial state, a random velocity is assigned to a particle. The velocity will gradually reach its optimal state according to its own path. Superposition and iteration operations are constantly carried out. This is to obtain the optimal solutions(Li Yongna., 2023)(Zhang Xiliang, Jiao Haokai, LI Erbao., 2023), i.e., Equations (1) and (2) The specific process of the algorithm is illustrated in Figure 1.
where and are the velocity and the position of the particle i, respectively; d is the number of iterations; c1 and c2 are the learning factors, rand1 and rand2 are random numbers that are independent of each other; is the coordinate of the best individual position of the i-th particle in the current iteration; and is coordinate of the best global position of the i-th particle in the current iteration.
2.2. Improved Support Vector Machine (PSO-SVM)
Given a set of training data , where , , i=1,2,... N, xi is the input sample and yi is the output data, the objective is to find a hyperplane that can effectively identify all training samples(Hu XueMin,Zeng Sheng,Song Liang-Ling., 2024)(Wei Haixia, Zhu Jie, Yang Xiaolin et al., 2023).
Equation (3) can be used to solve the hyperplane in the sample space,
where w is the weight and b is the bias.
The distances of different samples in the training set (S) to the hyperplane can be written as
Margin refers to the minimum distance between the training data and the hyperplane,
According to w and b, the maximum margin γ is
In order to satisfy the unique hyperplane with the maximum margin, several sample points close to the hyperplane are taken as the support vectors, as shown in Figure 2.
The kernel function K(x, xi) and the penalty coefficient C are selected to construct and solve the optimization problems and finally obtain the decision function,
where K(x, xi) is the positive definite kernel function. When and i=0, 1... N, the optimal solution is .
From the perspective of the kernel function K(x, xi) , the selection of the kernel function can produce different screening algorithms, further leading to the difference in the complexity of conversion in high-dimensional space. The penalty coefficient C and the parameter g of the radial basis function are two essential parameters of the blasting vibration prediction based on SVM. The determination of these two parameters is an iterative optimization process. Hence, the radial basis function is selected as
PSO-SVM utilizes the PSO algorithm to optimize the penalty coefficient C and the parameter g of RBF. The flow path is illustrated in Figure 3.
2.3. Model Evaluation
To verify the accuracy and feasibility of the combined algorithm, the coefficient of determination (r2), the mean absolute error (MAE), the root mean square error (RMSE), and the mean absolute percentage error (MAPE) are used for evaluation(Gong RJ, Yuan Teng, Ye Hui Shi et al., 2024)(Li Xuzhe, Li Wenjie, Bi Zhigang et al., 2024)(Zhou Hongmin, Zhao Shicheng, Zhao Wenqing et al., 2023)(Yu Jianxin, Meng Pengzhan, Zhang Xin, et al., 2024)(Liu Wei, Guo Zhiqing, Wang Dong et al., 2023). The calculation formulas are expressed below:
Here, y is the measured value, is the predicted value, is the average value, and N is the sample data.
3. Prediction of Blasting Vibration Peak Velocity
3.1. Data Collection
3.1.1. Project Overview
One hundred sets of data collected from the blasting events of the steps 356, 368 and 380 at the north slope of Yuanbaoshan open-pit mine. Currently, the excavation is located at the second mining district south from the Yingjin River. The mining coal seams are 5# and 6#. The lowest mining elevation is +332 m. The average strike length of the open-pit mine is 4.68 km, the average dip width is 2.56 km and the area is 12 km2. As the mining goes deeper, new geological conditions are encountered. For the quality of rock blasting, acoustic wave detection and blasting vibration monitoring are conducted before and after blasting so as to assess the blasting effect in real time and provide reliable parameters for subsequent blasting operations at the open pit mine.
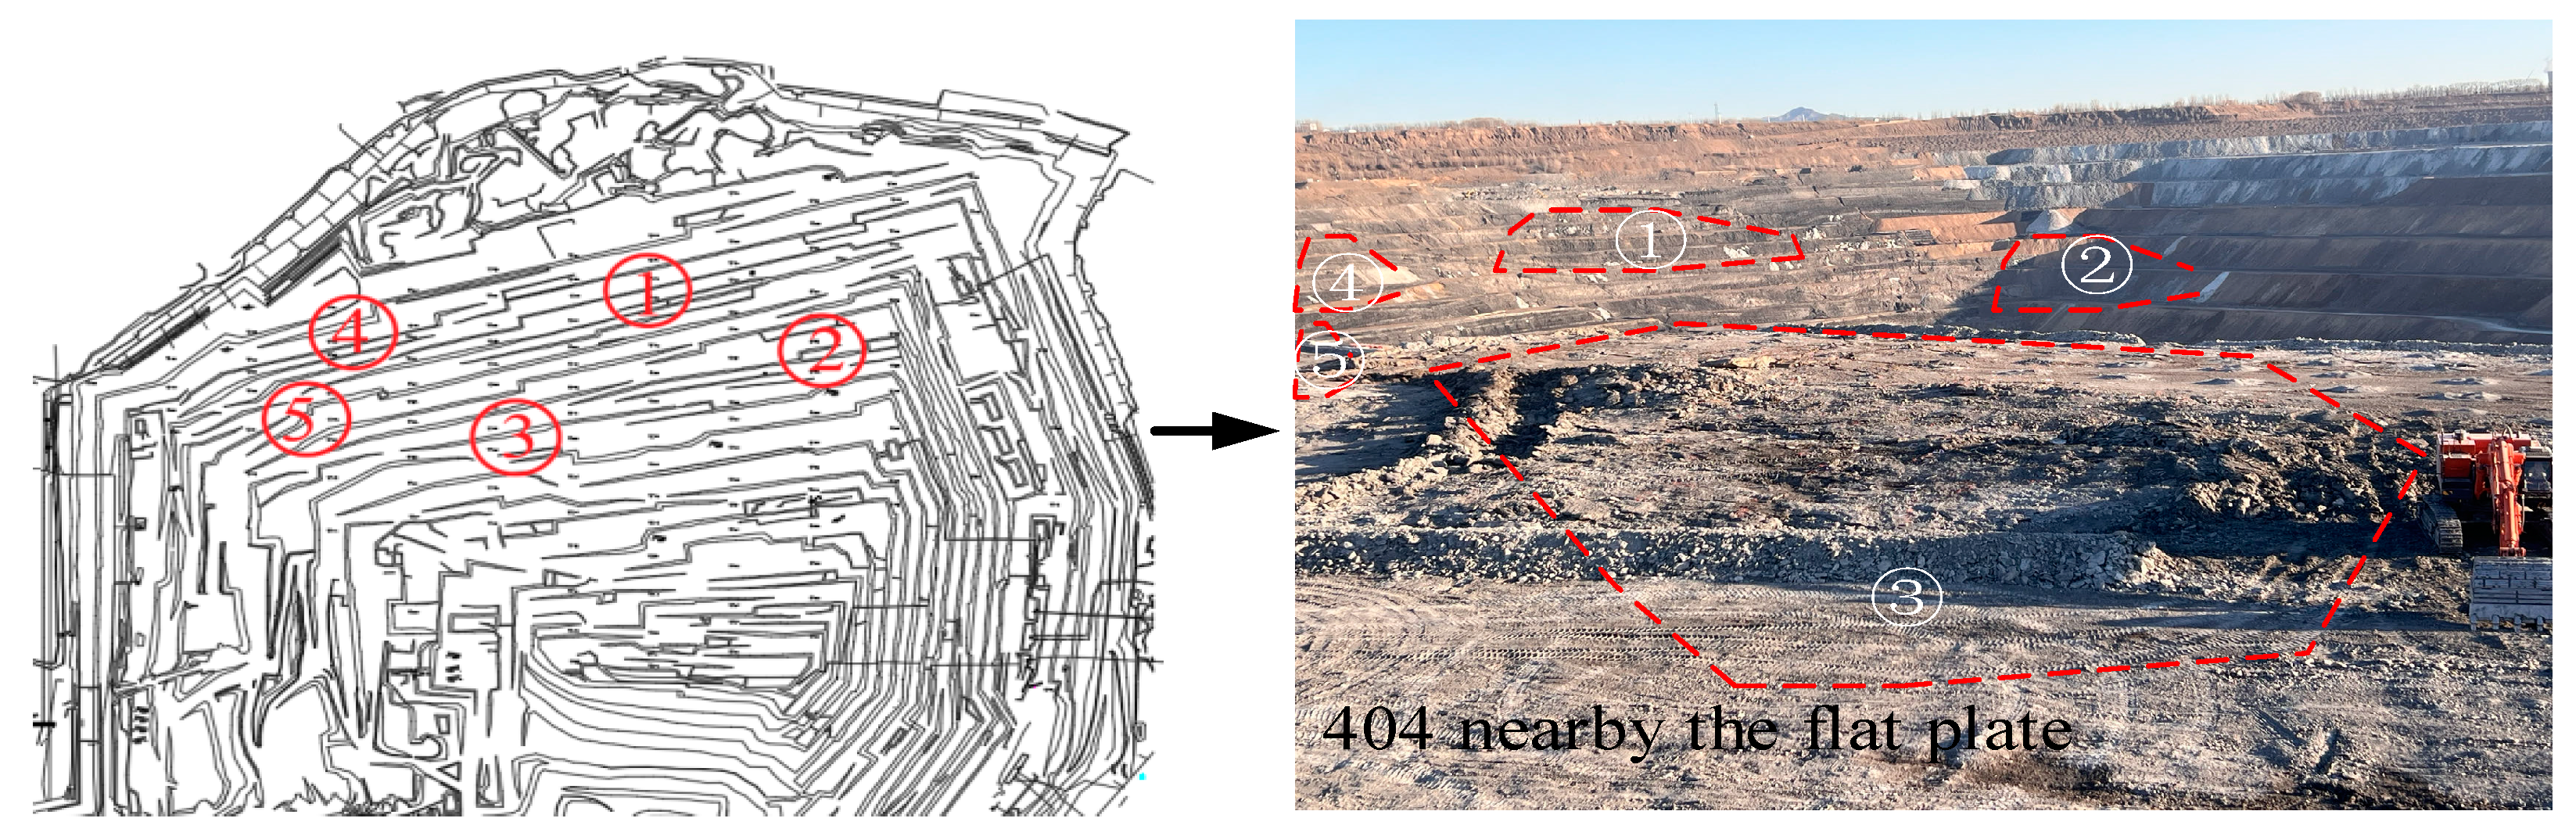
Figure 4.
Project overview. Note: ①Steps 356, 368, 380, and 392 are at the west of the horizontal coordinate 2200, and fractures develop; ② Steps 332, 344, 356, 368, 380, and 392 are at the east of the horizontal coordinate 2200, mining the coal seams 4# and 5#; ③ Steps 260, 272, 284, 296, 308, and 320 are at the south of the Y coordinate 5800 of the north slope, mining the coal seams 6# and 7#; ④ Steps 308, 320, 332, and 344 are at the west of the horizontal coordinate 1950 of the west slope, where the lithology is obviously different from that at the north slope. More rock blocks occur and become much harder. ⑤ Steps 356, 368, and 380 are at the east of the horizontal coordinate 3000 of the east slope.
3.1.2. Blasting Vibration Monitoring
Complicated joints and cracks develop in the rock steps. Fractures exist in the rock strata and collect through the adjacent blast-holes. To reduce the blasting vibration intensity and ensure the mining safety, blasting vibrations under the pre-specified parameters are monitored in real time. The geological conditions at the explosion zone are rock strata. Water flows in the fractures of the blast-holes in the working area. The length of the explosion zone is 140 m and the width is 28 m. The presplit hole is firstly blasted for generating fractures, through which the vibrations resulted by detonating the blast hole and the buffer hole are weakened. The main blast-hole is detonated secondly and the buffer hole is the last. In terms of the explosive charge amount, the buffer hole carries less charge than the blast-hole. Hence, only the blasting vibration velocities of the presplit hole and the blast-hole are taken into consideration. Relevant blasting parameters are presented in Table 1, and the blasting design is shown in Figure 5.
TC-4850 is employed for blasting vibration monitoring at Yuanbaoshan open-pit mine. Owing to hard rock lithology and good coal quality, the north slope of Yuanbaoshan open-pit mine is taken as an instance. Monitoring points are arranged behind the explosion zone according to the site terrain conditions, as shown in Figure 6. Numbers in this figure represent the monitoring points and the distances from the explosive centers. Since the PPV of blasting vibration (the horizontal radial PPV used in this article) needs to be measured several times during this test, the layout of the monitoring points should avoid the influence of the blast-induced flyrocks. A three-way speed sensor is set at the monitoring point. The sensor is installed at the place to be monitored and is connected with the vibration meter. The recorded waveforms are drawn in Figure 7.
3.1.3. Acoustic Wave Detection of Rock Mass
The acoustic wave sensor is a NM-4 ultrasonic measurement instrument with two channels, CH1 and CH2. The channel spacing is 3 m and the sampling interval is 1000 ms. Acoustic wave detection is mainly performed at the step 380 and on all acoustic boreholes before and after blasting. The locations of the acoustic boreholes and the monitoring points before and after blasting are displayed in Figure 8. The specific procedures are described below: adjusting the equipment; injecting water into the borehole until the water flows out; placing the receiver and the transmitter at the bottom of the borehole; testing, reading and recording the data; gradually moving the receiver and the transmitter from the bottom of the borehole toward the mouth of the borehole. The probe is lifted up 1 m each time and the maximum lifted height is 13.5 m. Through repeated acoustic wave detection, the relationship between the acoustic wave and the depth is concluded, as shown in Figure 9.
3.2. Selection of Model Parameters
The vibration signals in the surrounding area of the explosion zone are collected for several times. One hundred sets of data are collected as the sample data for subsequent model construction. The first 10 sets of the data are used as the test set while the last 90 sets of the data are selected as the training set. The obtained data are tabulated in Table 2.
The last 90 sets of the data in Table 3.2 gathered from the blasting activities at Yuanbaoshan open pit mine and the blasting data at the steps 368-380 are fitted by the Sadovsky formula and the improved Sadovsky formula. Attenuation formulae v and are obtained,
where v and refer to the peak velocity of blasting vibration; R and represent the distance from the explosive center, ; Q is the maximum charge per delay; H is the elevation difference between the explosion zone and the monitoring point or the building or the protected target.
It can be seen from the fitting results that it is feasible to apply the Sadovsky formula to predict the PPV when the monitoring point and the explosion zone are at the same horizontal plane. When there is a height difference between the explosion zone and the monitoring point, the Sadovsky formula is no longer suitable for predicting the PPV.
Therefore, the elevation difference (H) is taken as an influence factor. Equation (15) is used to predict the PPV of the first ten sets of data in Table 3.2, and the prediction results are given in Table 3.
The errors of the improved Sadovsky formula in predicting the radial vibration velocity are over than 20%, and the prediction accuracy is unfavorable. The results show that the vibration velocity is closely related with the site conditions during the transmission. Since the P-wave velocity can well manifest the influence of fractures and the tectonic development of the rock mass, it is chosen as an influence factor of predicting PPV.
To identify the relative influence of each input parameter on PPV, PCA dimensionality reduction is adopted to obtain the contribution degree of each component.
As can be seen from Figure 10, the distribution of R, H, Q, and Cp accounts for 14%, 24%, 16% and 39% of the information, respectively, and their sum almost contains 93% (> 90%) of the feature information.
3.3. Training of Prediction Methods
After determining the model parameters, r2, MAE, RMSE and MAPE are utilized to evaluate the RS-dept model, the PSO-SVM model and the improved Sadovsky model. The results are presented in Table 4.
The results show that the MAPE of the PSO-SVM model and the improved Sadovsky model is 4.25% and 27.86%, respectively.
The prediction effect of the PSO-SVM model is compared with that of the RS-dept model based on the measured data of acoustic wave velocity. Individual coded values are assigned into the deep neural network as weights and thresholds for training and the trained neural network is used to test the sample data. After training the neural network through deep neural network, the test set is introduced into the deep neural network for simulation. The results of the output layer are obtained. It can be seen from Figure 10 that relative errors are decreased by using the PSO-SVM model and the RS-dept model compared with traditional single model. This further proves that the indexes obtained from the combined model can be used for prediction one more time, thus improving the efficiency of rock blasting vibration prediction. The prediction results of the PSO-SVM model are obviously consistent with the training values, so the PSO-SVM model is chosen as the prediction model of open-pit blasting vibration.
Figure 11.
Error trend.

3.4. Verification of Prediction Methods
Ten sets of data are randomly selected, and the prediction results of the RS-dept model, the PSO-SVM model and the improved Sadovsky model are listed in Figure 12. It can be found that the prediction results of the PSO-SVM model are mostly approaching the measured values, so the prediction effect is the best.
4. Result Analysis
The comparison results of the first 10 sets of data examined by the PSO-SVM model, the RS-dept model and the improved Sadovsky model are summarized in Figure 13.
As can be seen from Figure 13, the maximum error of the PSO-SVM model is 8.70%, while the maximum error of the improved Sadovsky formula and the RS-dept model is 62.30% and 56.89%, respectively. The average error of the peak velocity of blasting vibration predicted by the PSO-SVM combined algorithm is 3.37%, which is 29.94% and 17.86% lower than that by the improved Sadovsky formula and the RS-dept model, respectively. The PSO-SVM combined algorithm exhibits the highest prediction accuracy, matching best with the actual conditions. The results show that the PSO-SVM model has the best performance in predicting blasting vibrations at an open pit mine. It is able to provide significant guidance to the blasting engineering of an open pit mine. The proposed model is available to optimize the blasting parameters without solving the complicated relationship among the parameters. Since the optimization process is simple and reliable, the model helps to achieve the expected purpose of engineering design, accordingly, promoting the progress and efficiency of engineering design and construction.
5. Conclusions
Many parameters affect the PPV. Complex nonlinear relations exist among these parameters. As a result, the prediction accuracy of PPV is unfavorable through empirical formulas. The PSO algorithm is used to optimize the key parameter C and the parameter g of the radial basis function so that the prediction performance of SVM can reach the optimal state. The PSO-SVM model is built to assess the peak particle velocity of blasting vibration. The results show that the maximum error of the PSO-SVM model is 8.7%. The average error of blasting vibration peak velocity predicted by the PSO-SVM combined algorithm is 3.37%, which is 29.94% and 17.86% lower than that by the improved Sadovsky model and the RS-dept model, respectively. The predicted values of the improved PSO-SVM model match best with the actual values and the predicted results are most reliable.
Acknowledgements
This work was supported by the Scientific Research Startup Fund for introduction of high-level talent research initiation fund at Heilongjiang University of Science and Technology (Project No.: HKDQDJ202403); and the Fundamental Research Funds for the Provincial Universities of Heilongjiang Province (Project No.: Hkdqg201903).
Conflict of Interest
The authors declared that they have no conflicts of interest to this work.
References
- Industry Research Institute., 2023. China Industrial Explosives Industry Market Development Monitoring and Investment Strategy Consulting Report. Huajing.
- Leng Zhendong, Gao Qidong, Lu Wenbo, et al., 2023. Progress in the theory and application of rock drilling and blasting energy regulation. Metal Mining 05, 64-76.
- Fan Yong, Hu Mingdong, Yang Guangdong et al., 2024. PCA-GWO-SVR machine learning for peak velocity prediction of blast vibration on slopes. Journal of Vibration Engineering 37(08),1431-1441.
- Fei Honglu,Zuo Zhuangzhuang,Jiang Anjun et al., 2023. Peak blast vibration velocity prediction based on KS-GS-SVR. Engineering Blasting 29(02), 120-128.
- Wang Xinyu,Cao Pengfei,Xiao Yiqing et al., 2023. Research on blasting vibration prediction based on WOA-SVM model. Mining and Metallurgical Engineering 43(04), 48-51.
- Zhang Pengfei, Yuan Yong, He Yunhua et al., 2024. Research on blasting vibration velocity prediction of open pit mines based on GRA-EPSO-SVM model. Coal Science and Technology 1-17.
- Fan Yong, Pei Yong, Yang Guangdong et al., 2022. Peak velocity prediction of blast vibration based on improved PSO-BP neural network. Vibration and Shock 41(16), 194-203+302.
- Zhang Yong,Li Xuan,Yin Yanliang et al., 2023. Optimisation of BP neural network based on firefly algorithm for blasting vibration velocity prediction. People’s Yangtze River 54(05), 231-236.
- Li Shenglin, Han Haoxuan, Li Chen et al., 2024. A Vibration Prediction Model of Open Step Single Hole Blasting. Transactions of Beijing Institute of Technology 44(10), 1027-1039.
- Li Zhenyang, Zhang Baogang, Xiong Xin et al., 2024. Research on PPV Prediction Model of Open-pit Mine Based on PSO-XGBoost. Gold Science and Technology 32(04), 620-630.
- Cai Yuanqiang, Xie Fangqin, Yuan Zonghao et al., 2024. Vibration prediction and control technology of the White Pagoda, a national protected unit, caused by shield tunneling in hard rock layer[J/OL]. Journal of Geotechnical Engineering 1-9.
- Li Yongna., 2023. Application of RS-SVM Model in Coal Spontaneous Combustion Monitoring and Early Warning System. Coal Technology 42(06), 189-191.
- Zhang Xiliang, Jiao Haokai, LI Erbao., 2023. Vibration velocity prediction of deep blasting based on migration learning algorithm. Chinese Journal of Safety Science 33(06), 64-72.
- Hu XueMin,Zeng Sheng,Song Liang-Ling., 2024. Research on blasting vibration velocity prediction based on grey wolf algorithm improved random forest algorithm. Gold 45(01), 12-16.
- Wei Haixia, Zhu Jie, Yang Xiaolin et al., 2023. Prediction method of surface vibration effect of layered rock mass under high pressure gas blasting. Vibration and Shock 42(20), 1-11.
- Gong RJ, Yuan Teng, Ye Hui Shi et al., 2024. Prediction of blasting vibration in open pit mines based on the least-squares method. Journal of North China University of Science and Technology(Natural Science Edition) 46(02), 41-49.
- Li Xuzhe, Li Wenjie, Bi Zhigang et al., 2024. Study on the effect of blasting excavation on the stability of surrounding rock of backward tunnel with small clear distance. Vibration and Shock 43(07), 42-49+83.
- Zhou Hongmin, Zhao Shicheng, Zhao Wenqing et al., 2023. Vibration signal denoising optimization analysis in tunnel excavation based on improved MEEMD. Journal of Vibration and Shock 42(10), 74–81.
- Yu Jianxin, Meng Pengzhan, Zhang Xin, et al., 2024. Breaking law of rock blasting in layered rock body under the influence of different resistance lines. Coal Science and Technology 52(12), 60-70.
- Liu Wei, Guo Zhiqing, Wang Dong et al., 2023. Improved whale optimization algorithm and its weights and thresholds optimization in shallow neural architecture search. Control and Decision 38(04), 1144-1152.
Figure 1.
Integrated particle swarm optimization process.
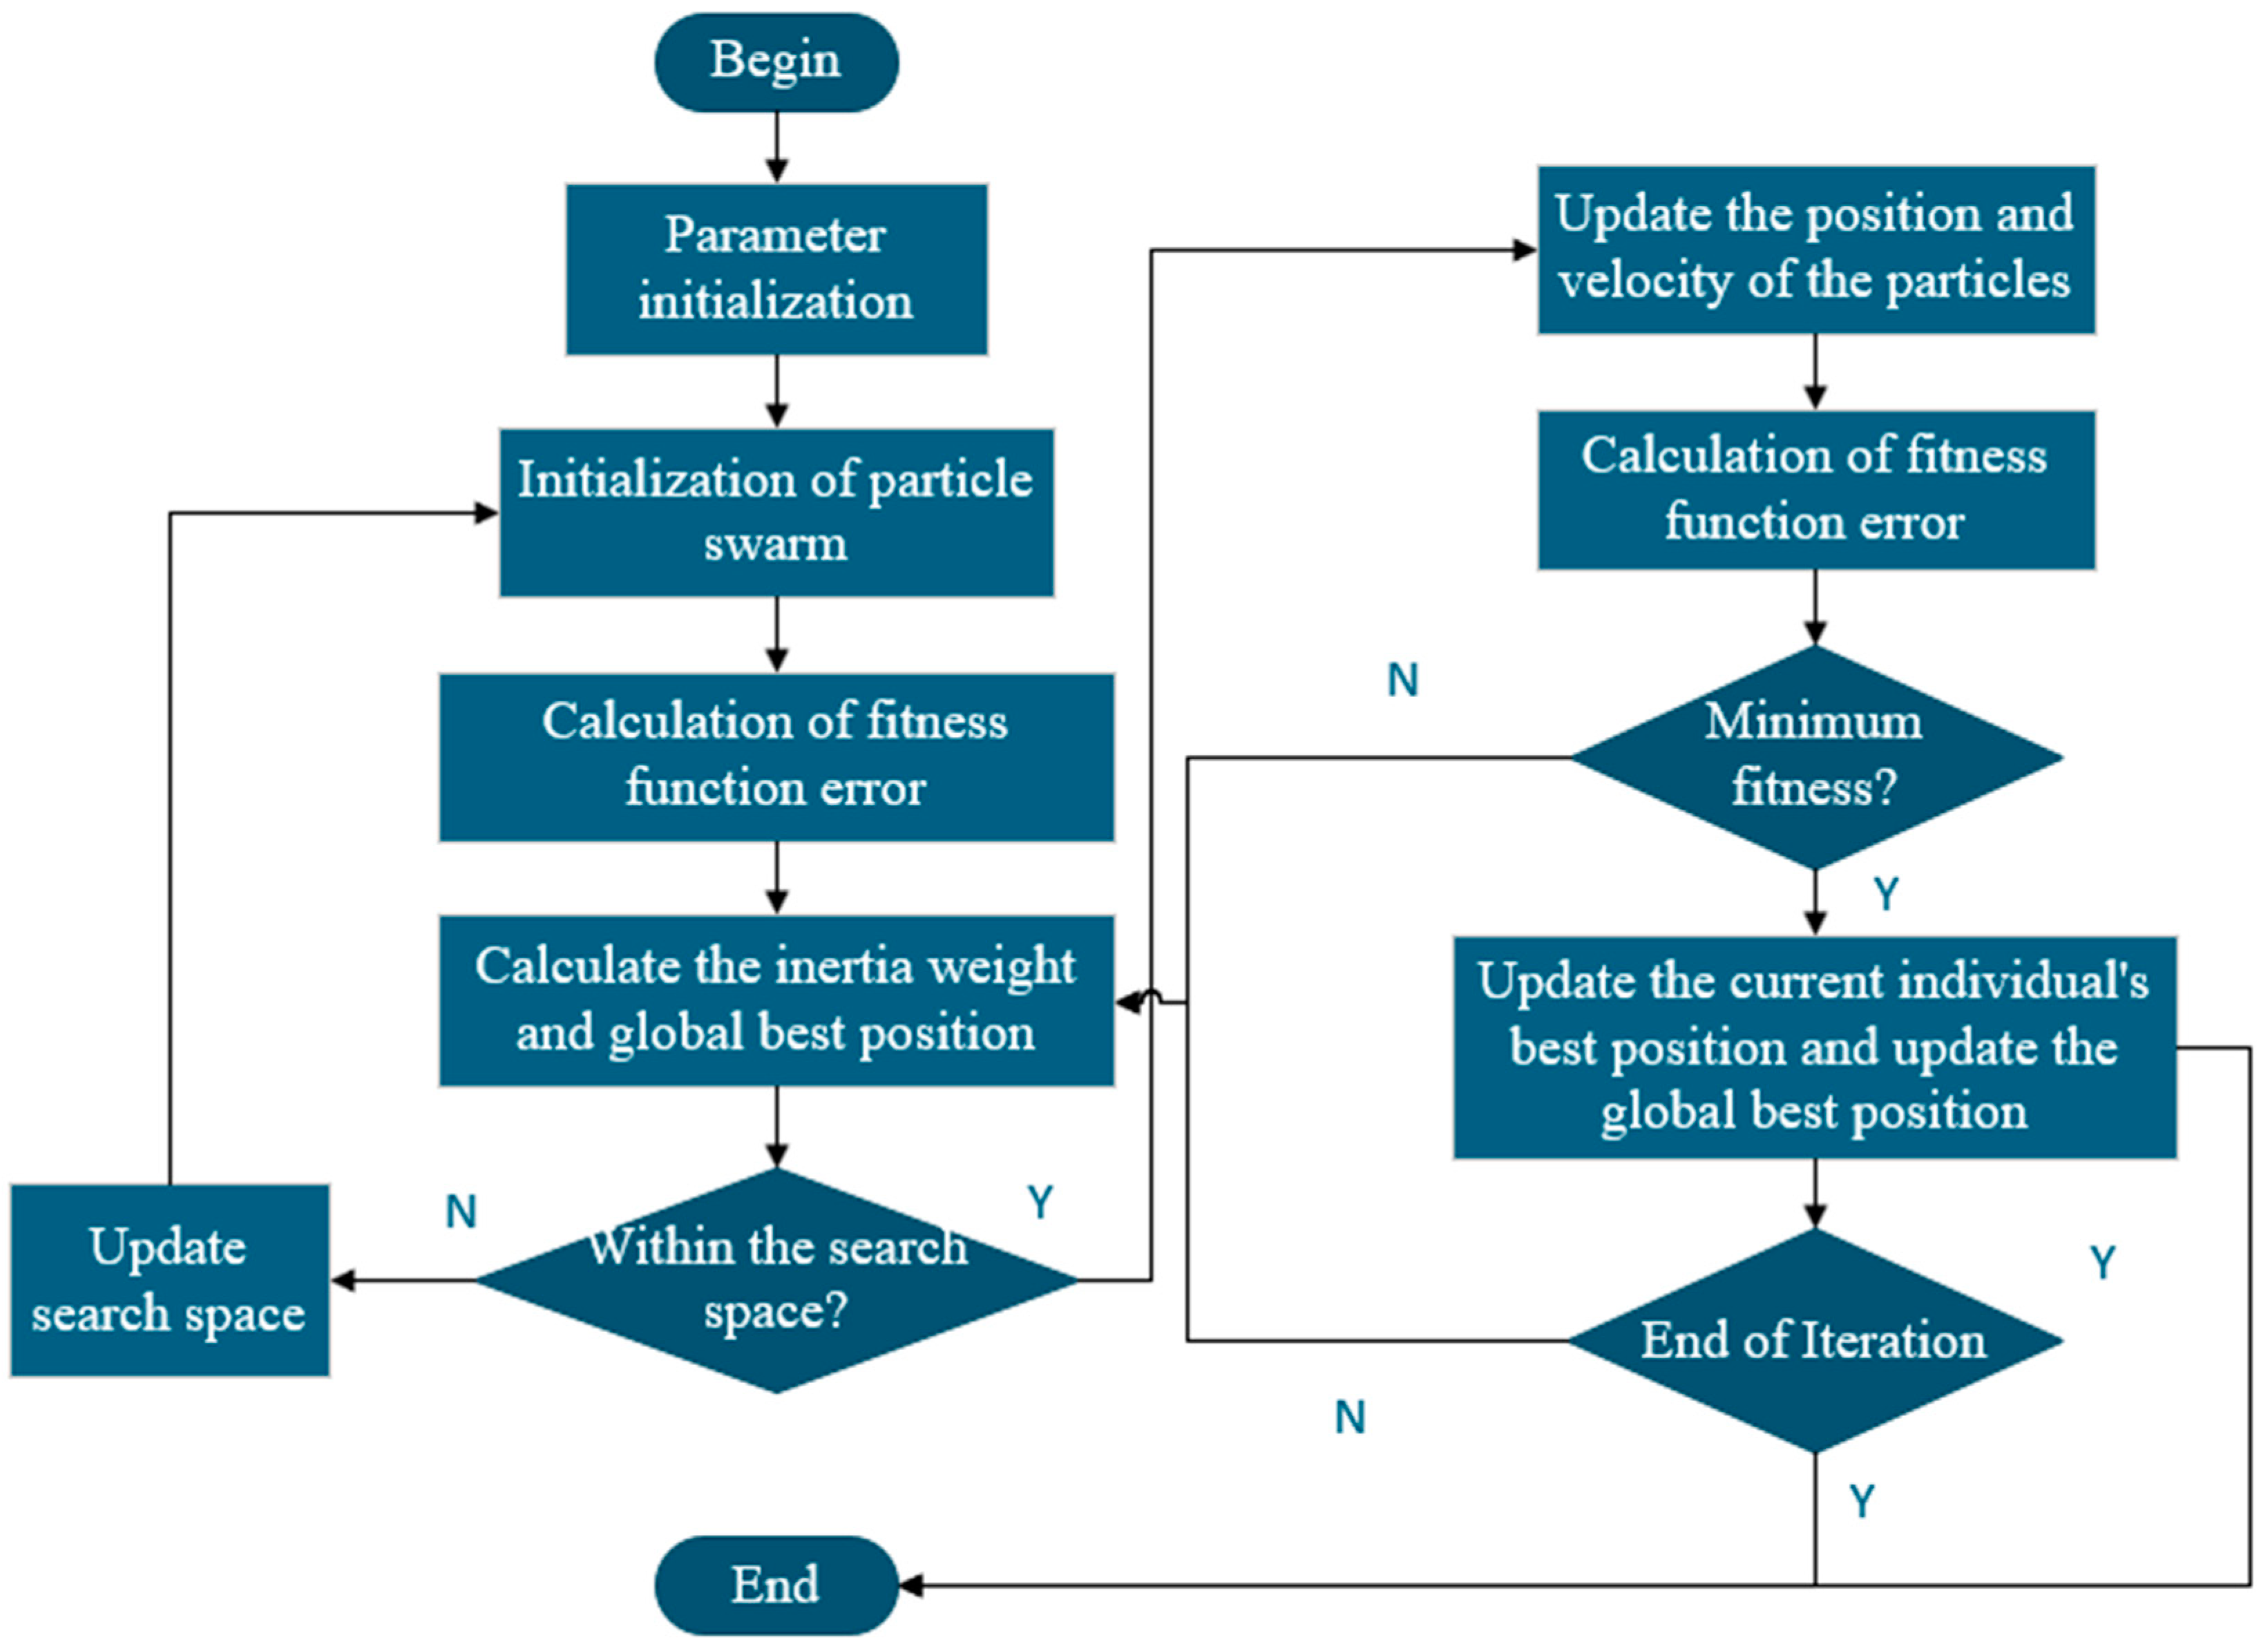
Figure 2.
Support vector and margin.
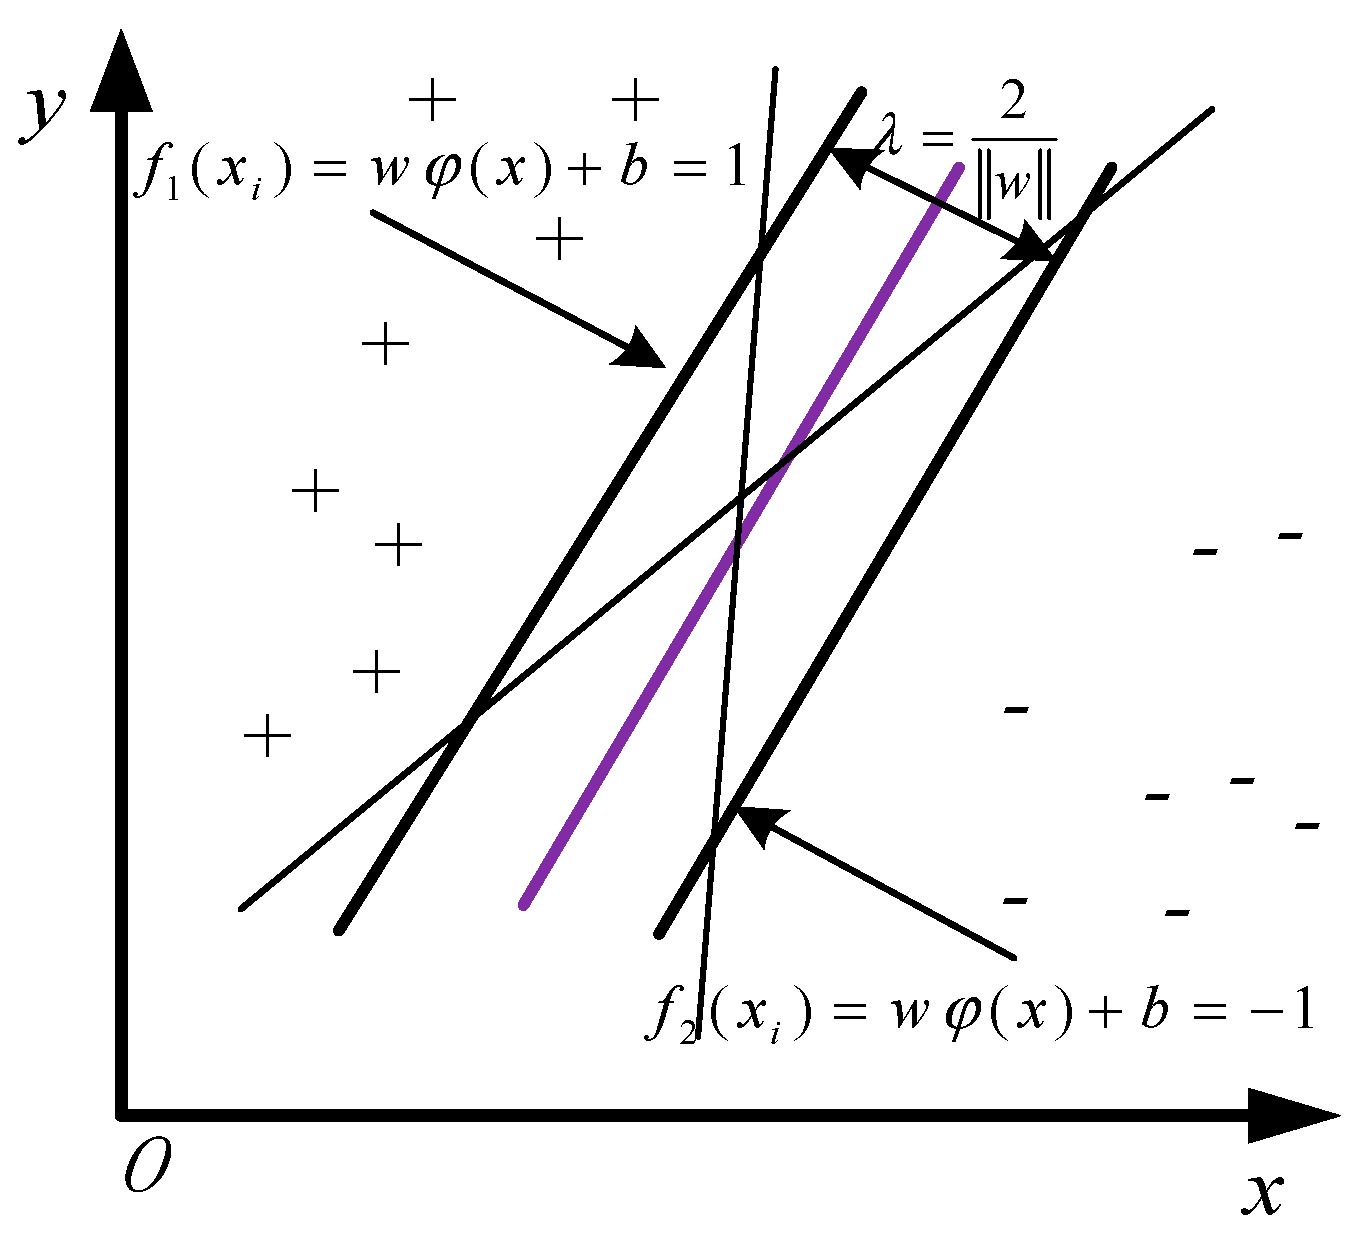
Figure 3.
PSO-SVM prediction model implementation process.
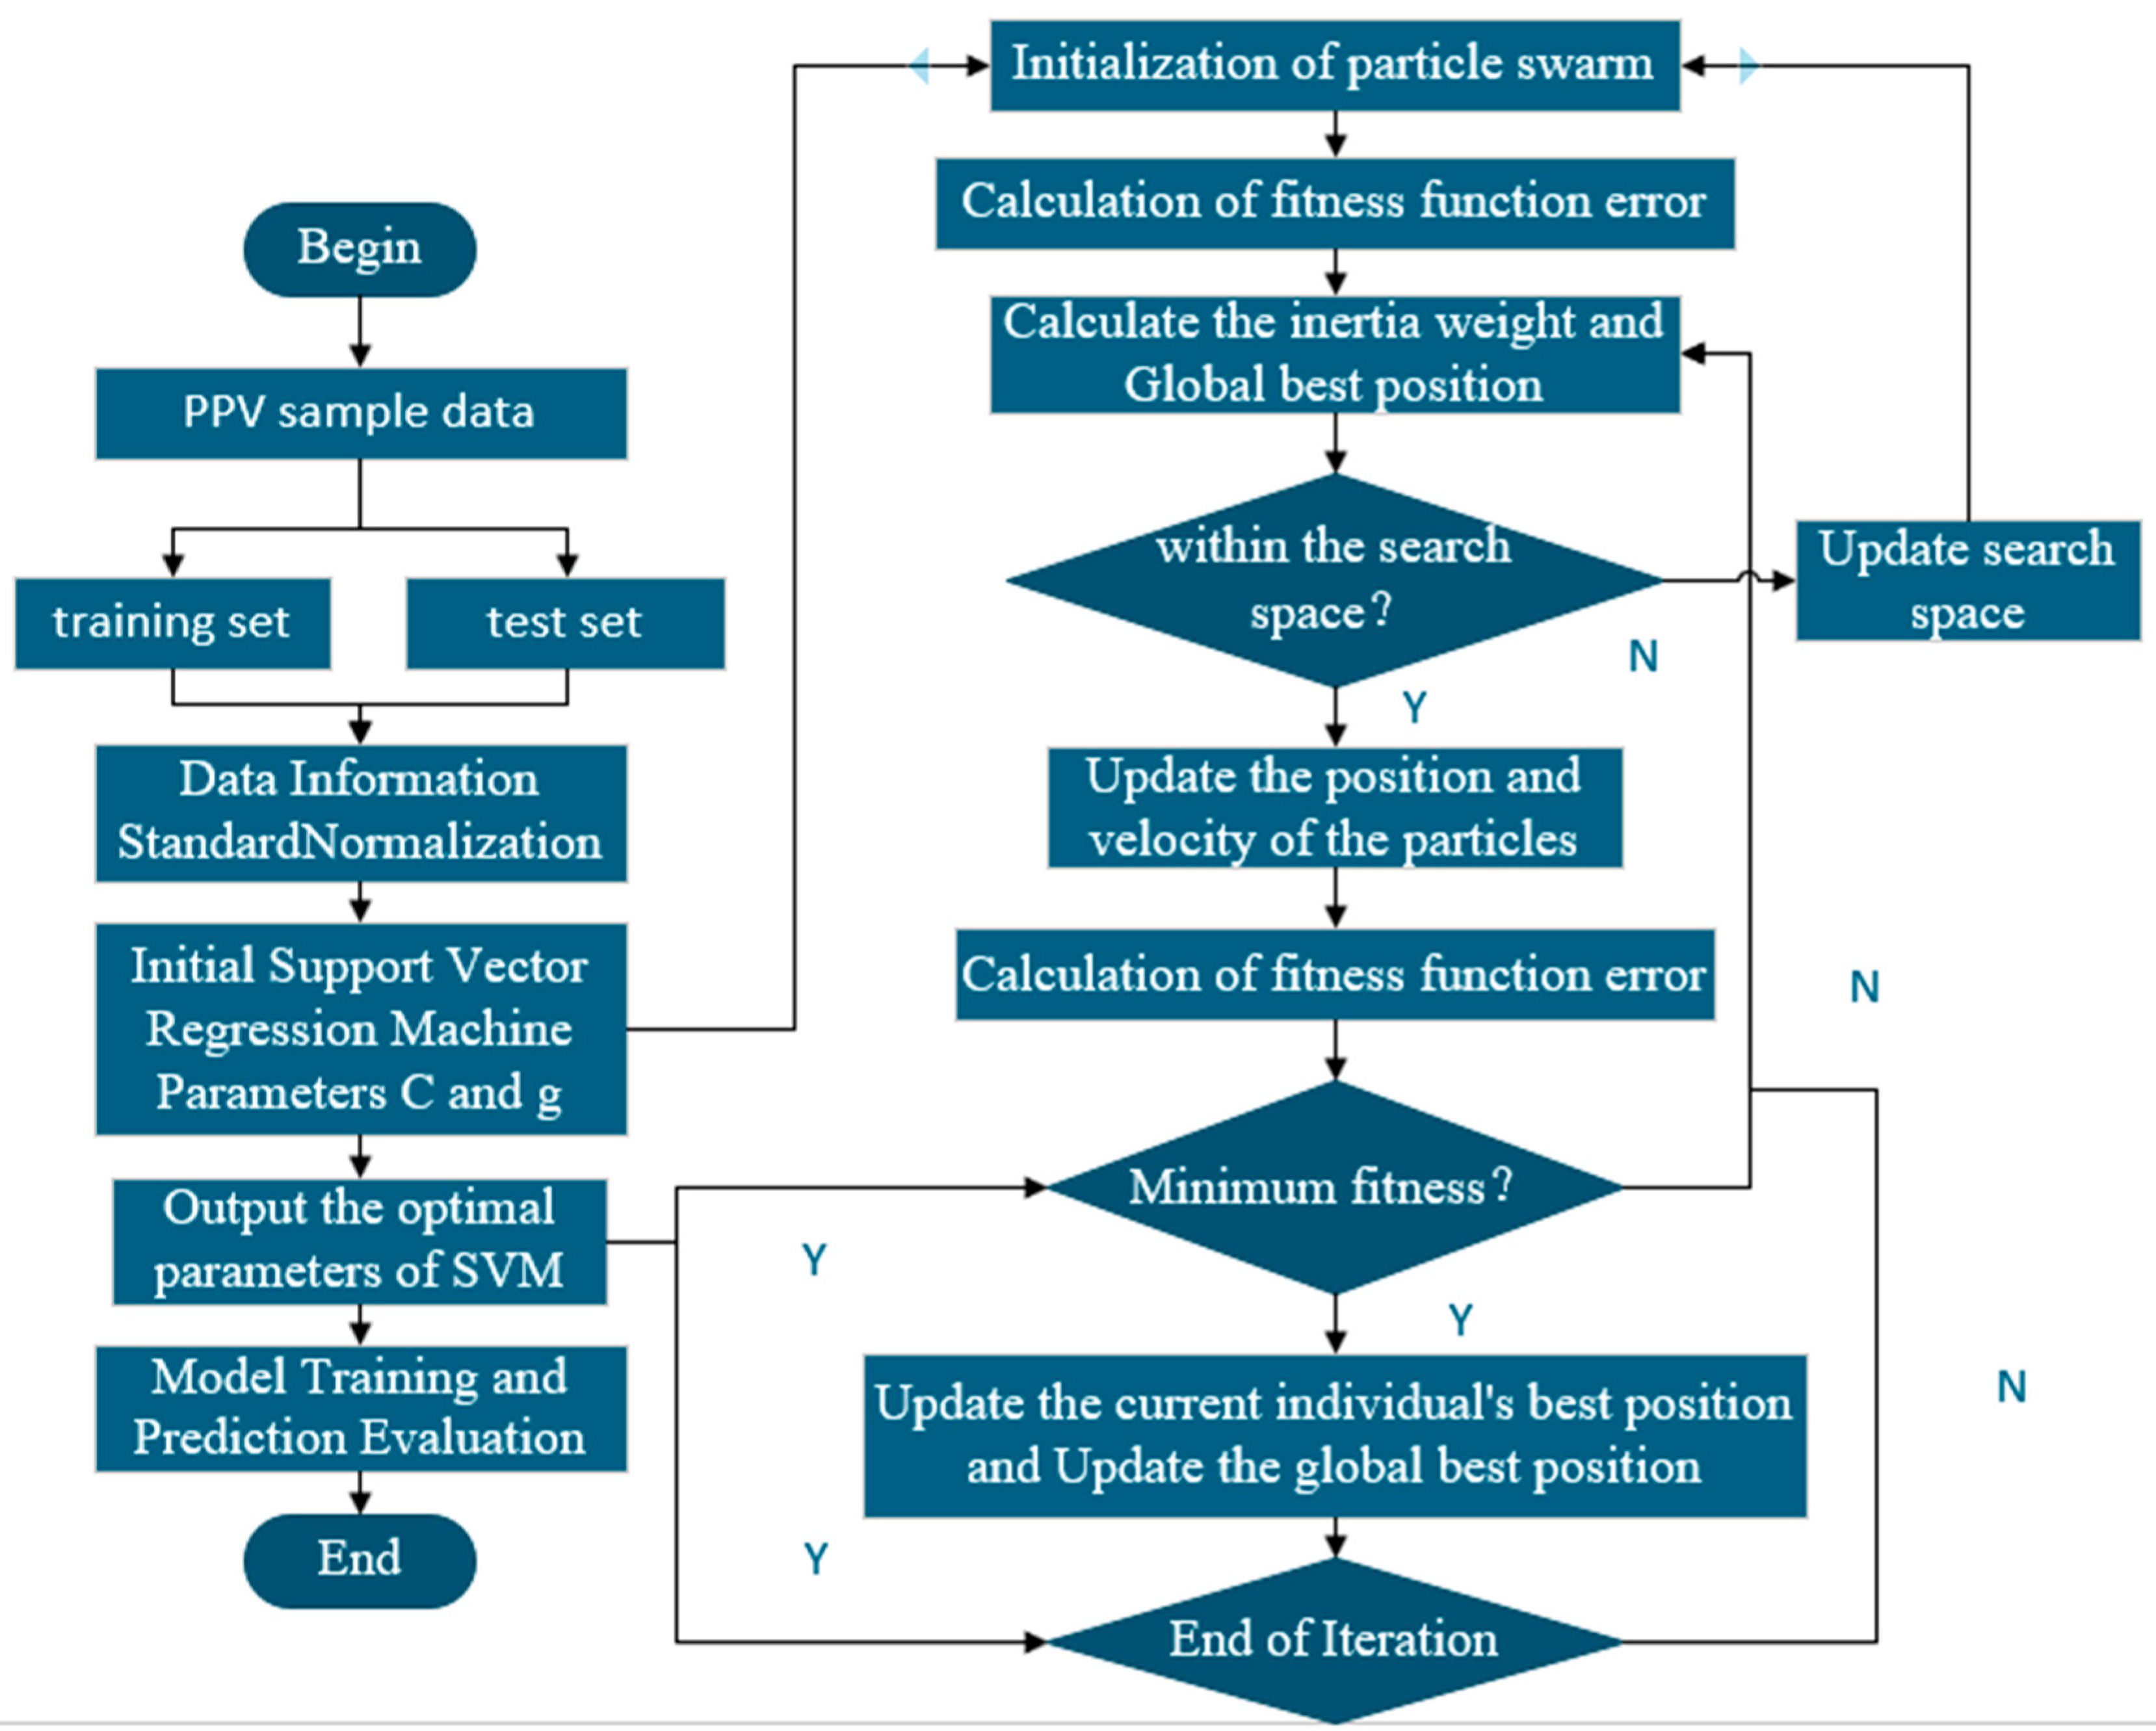
Figure 5.
Blasting design.
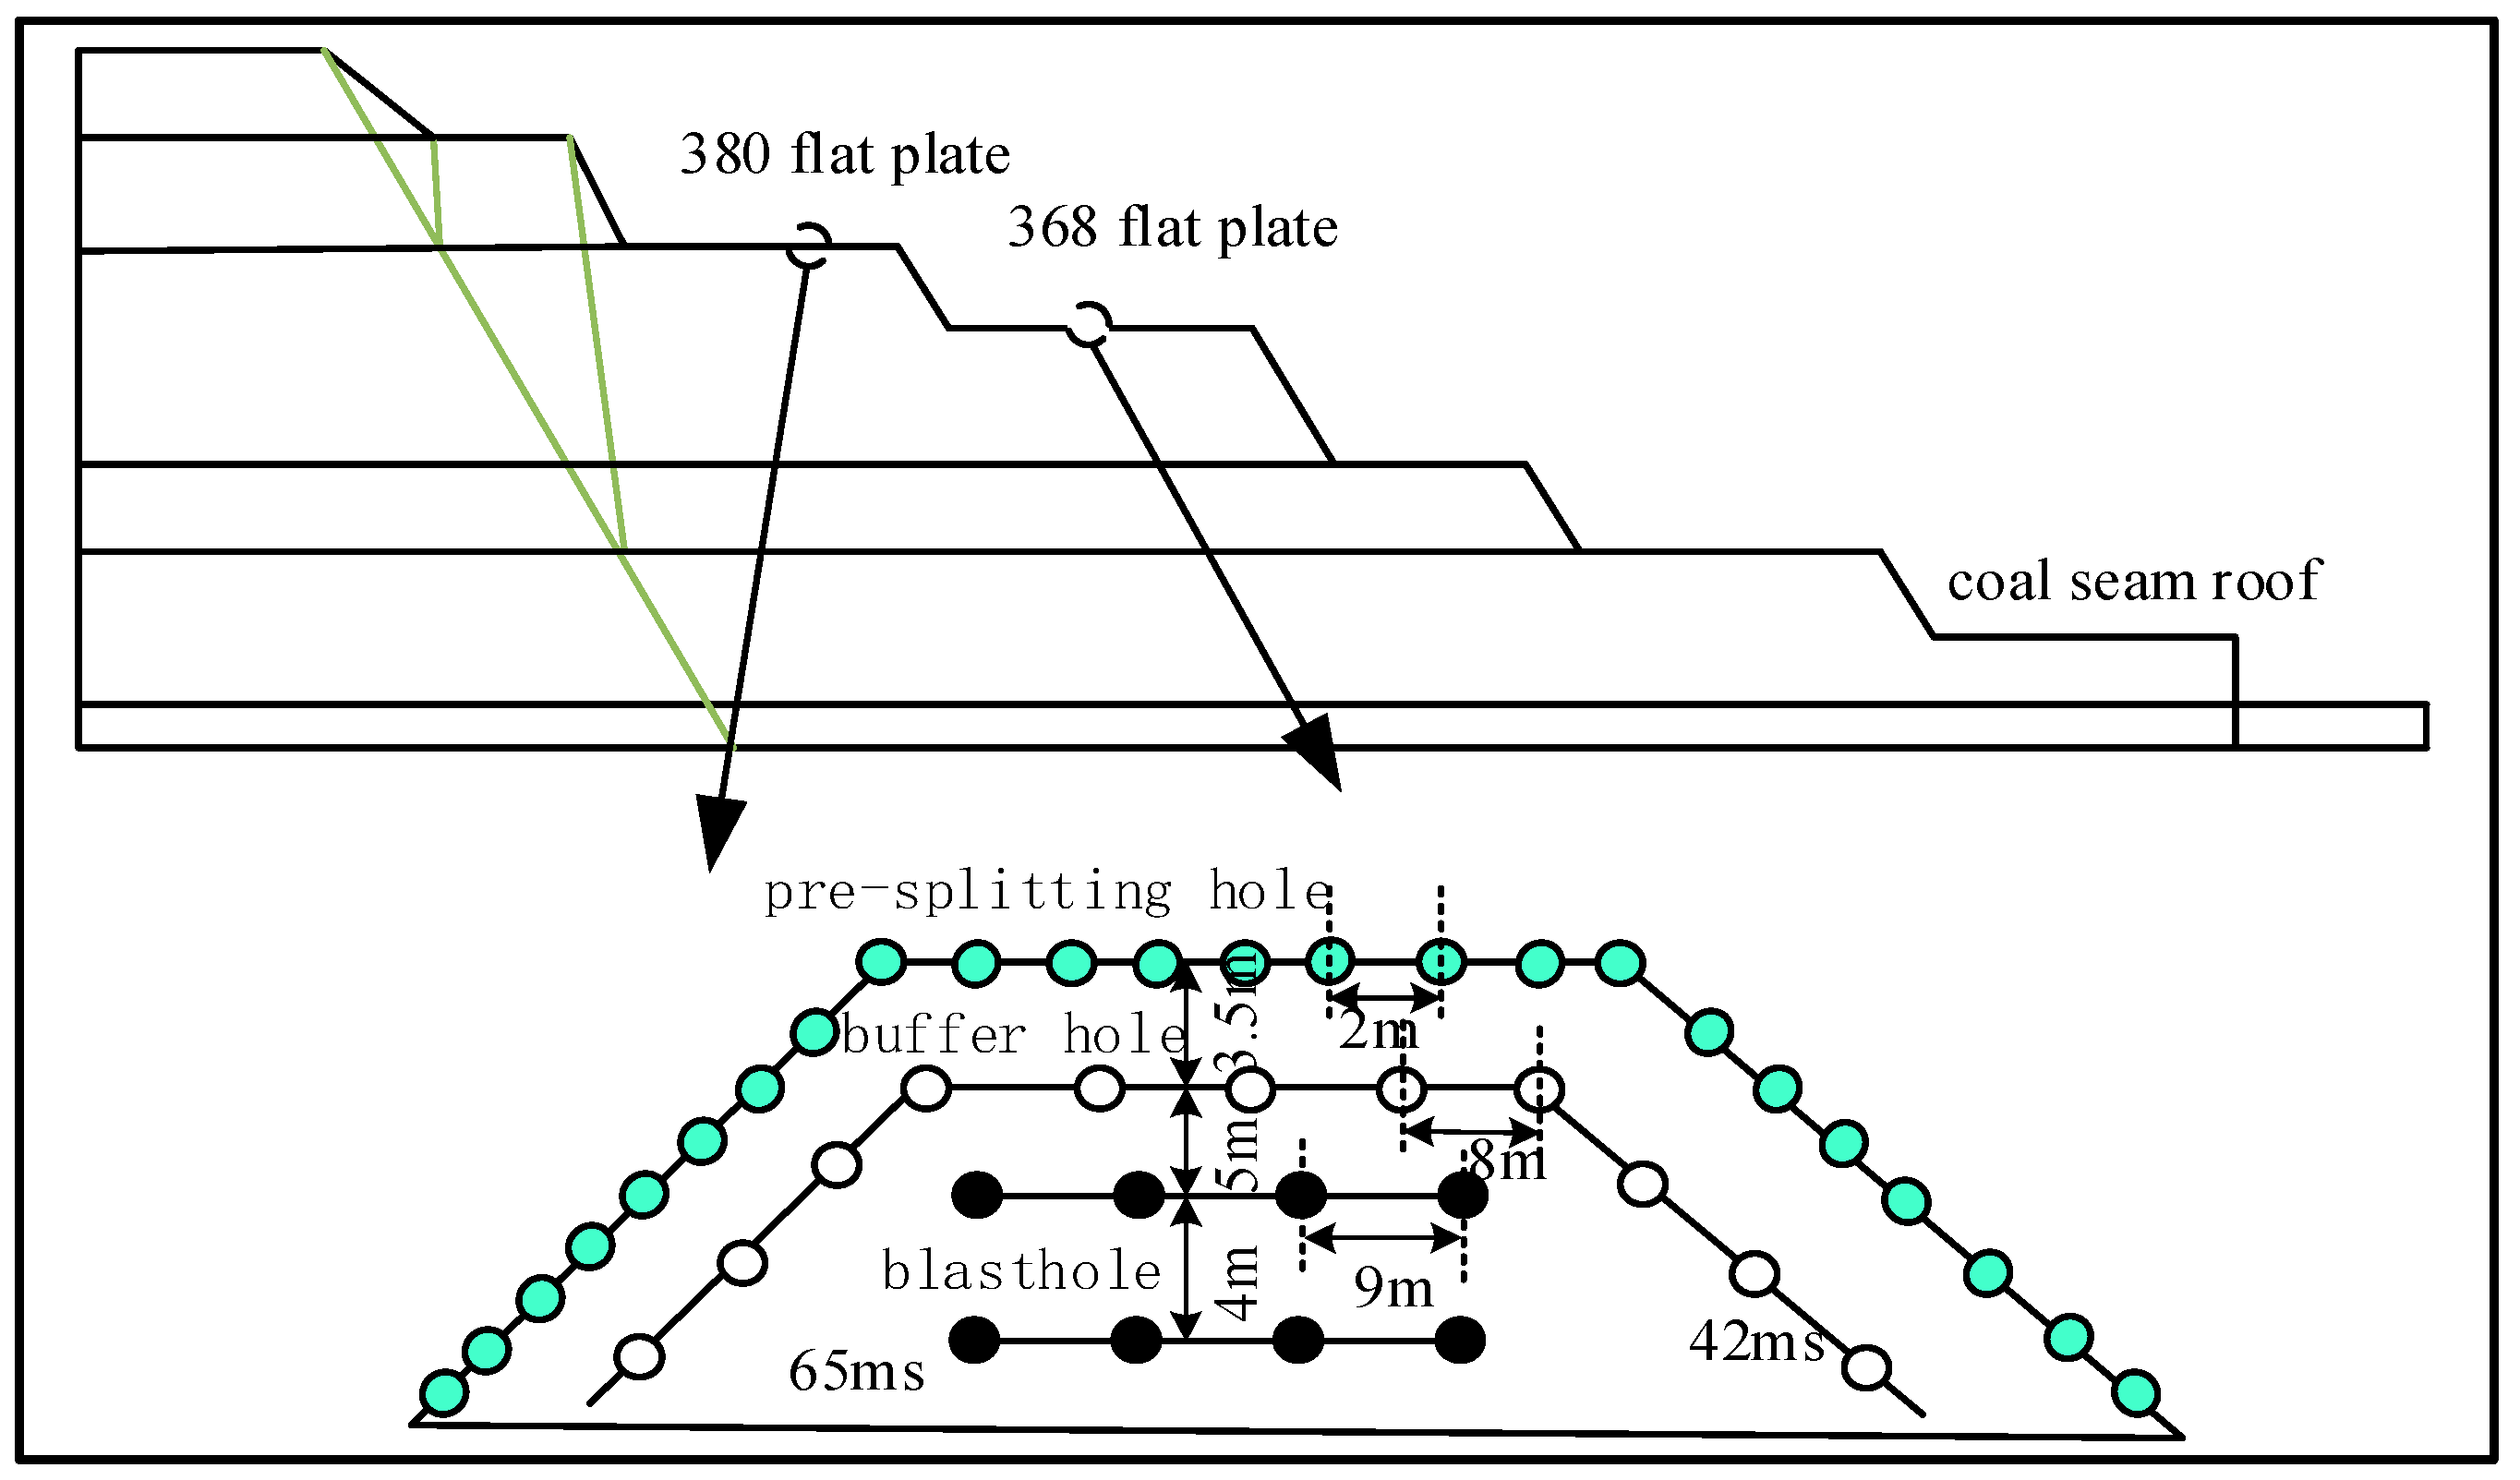
Figure 6.
Position of the measuring point to the blast zone.
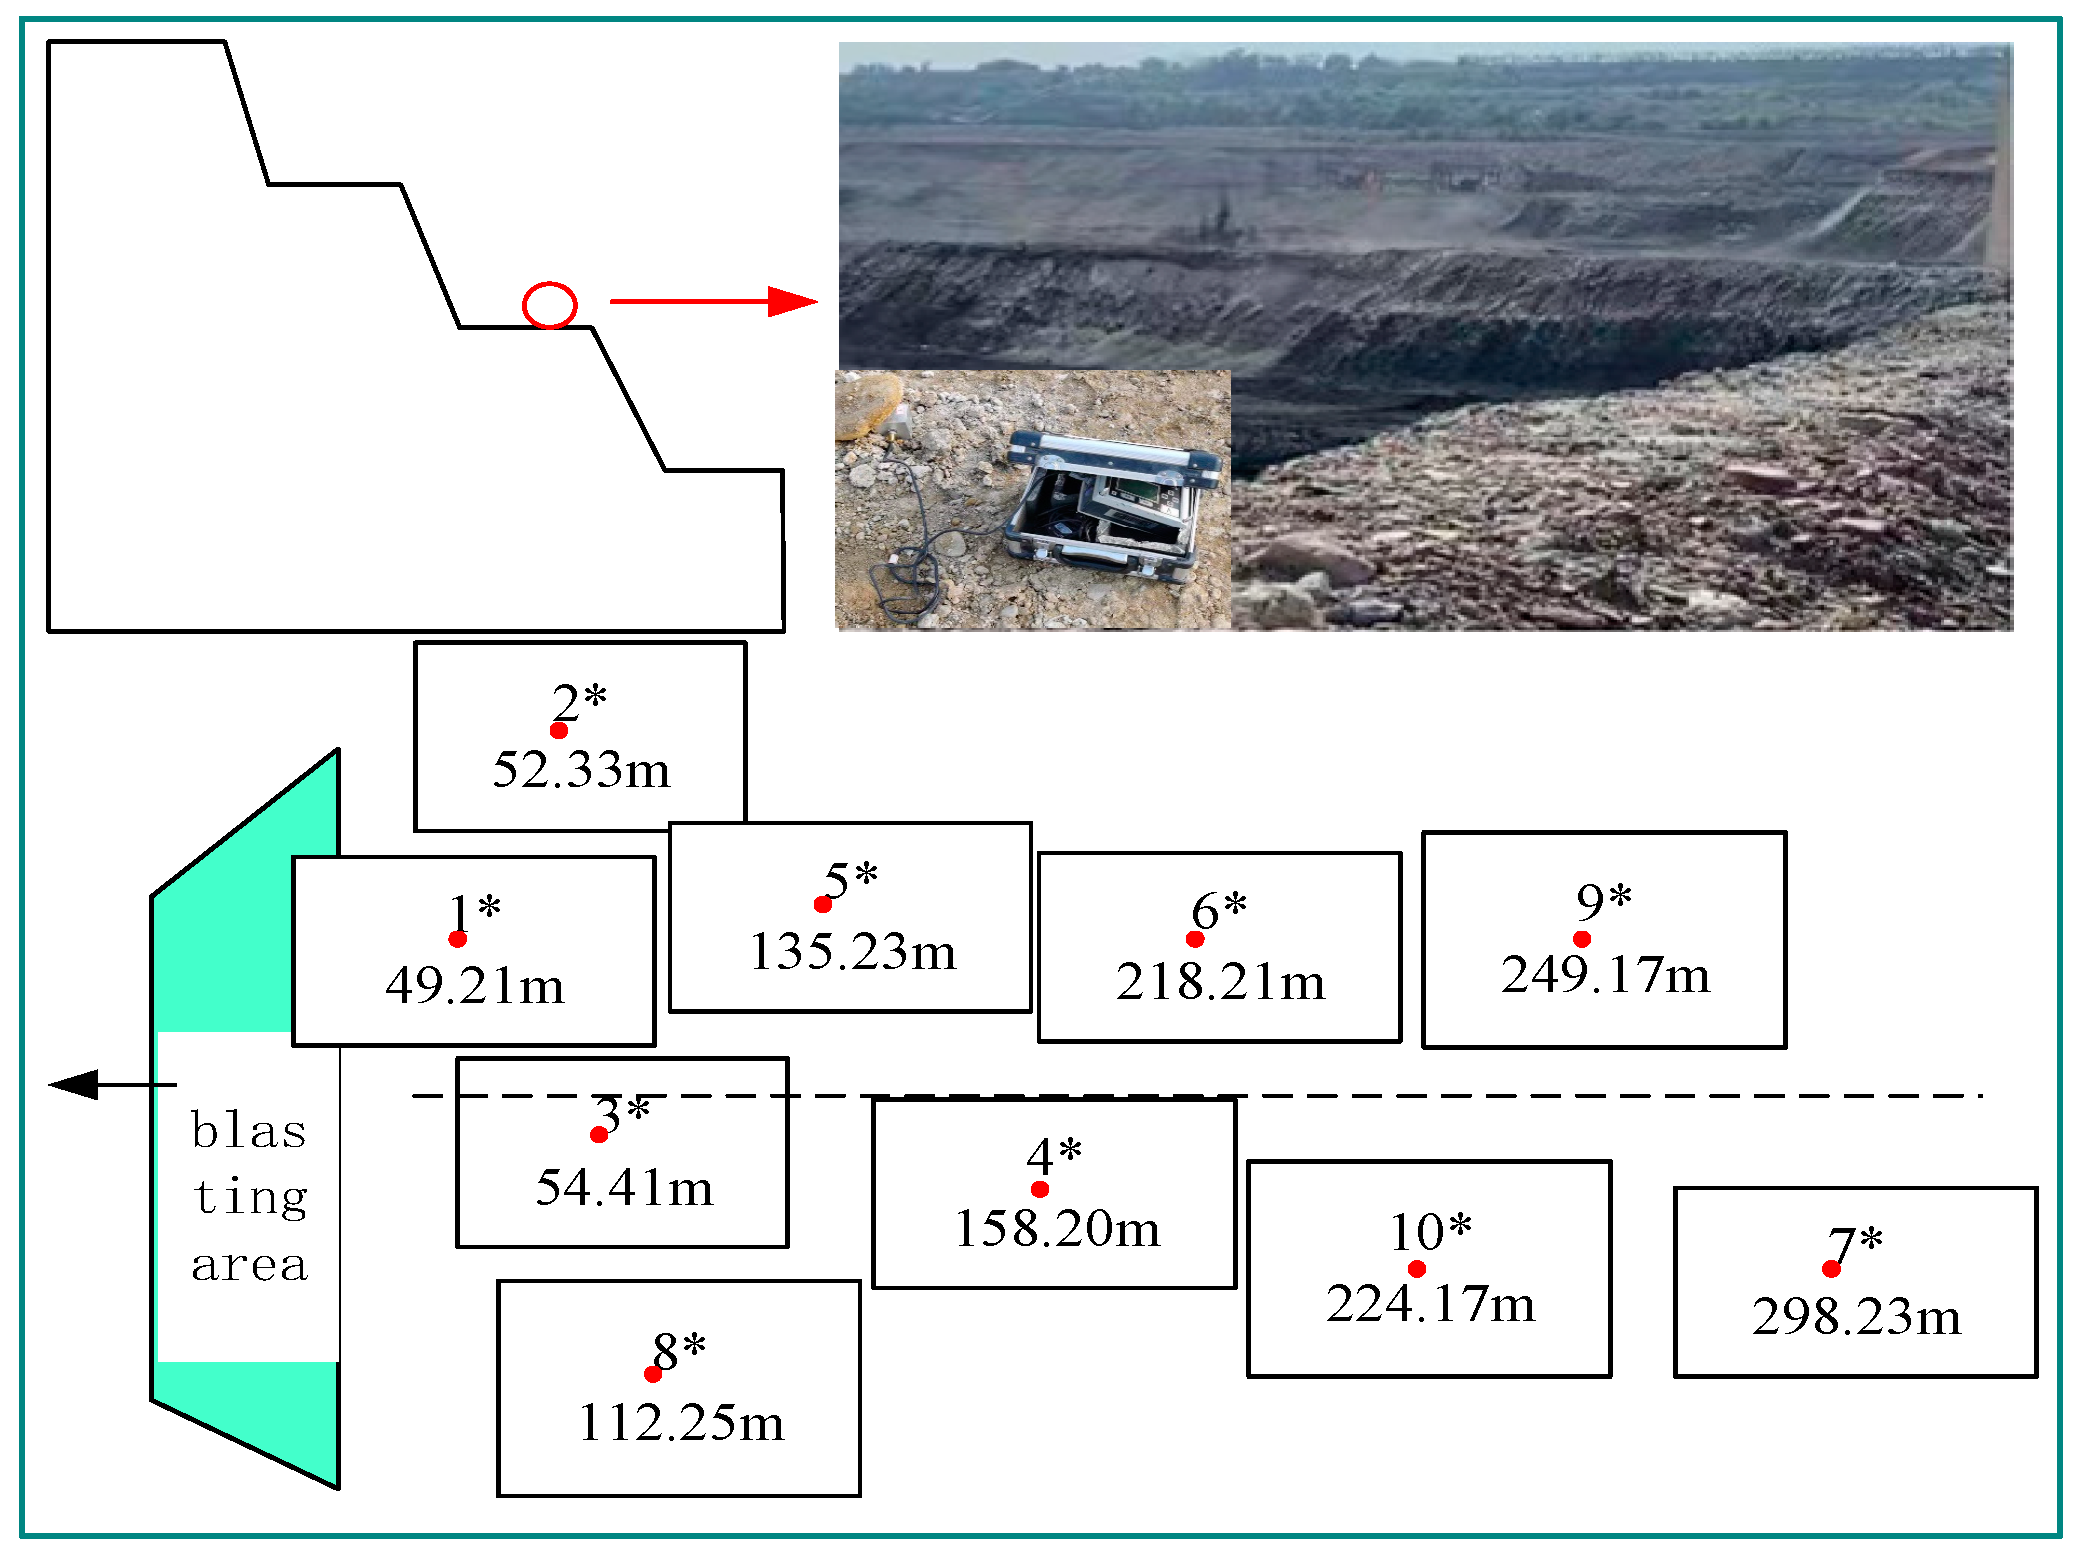
Figure 7.
Horizontal radial vibration waveforms: a); b).
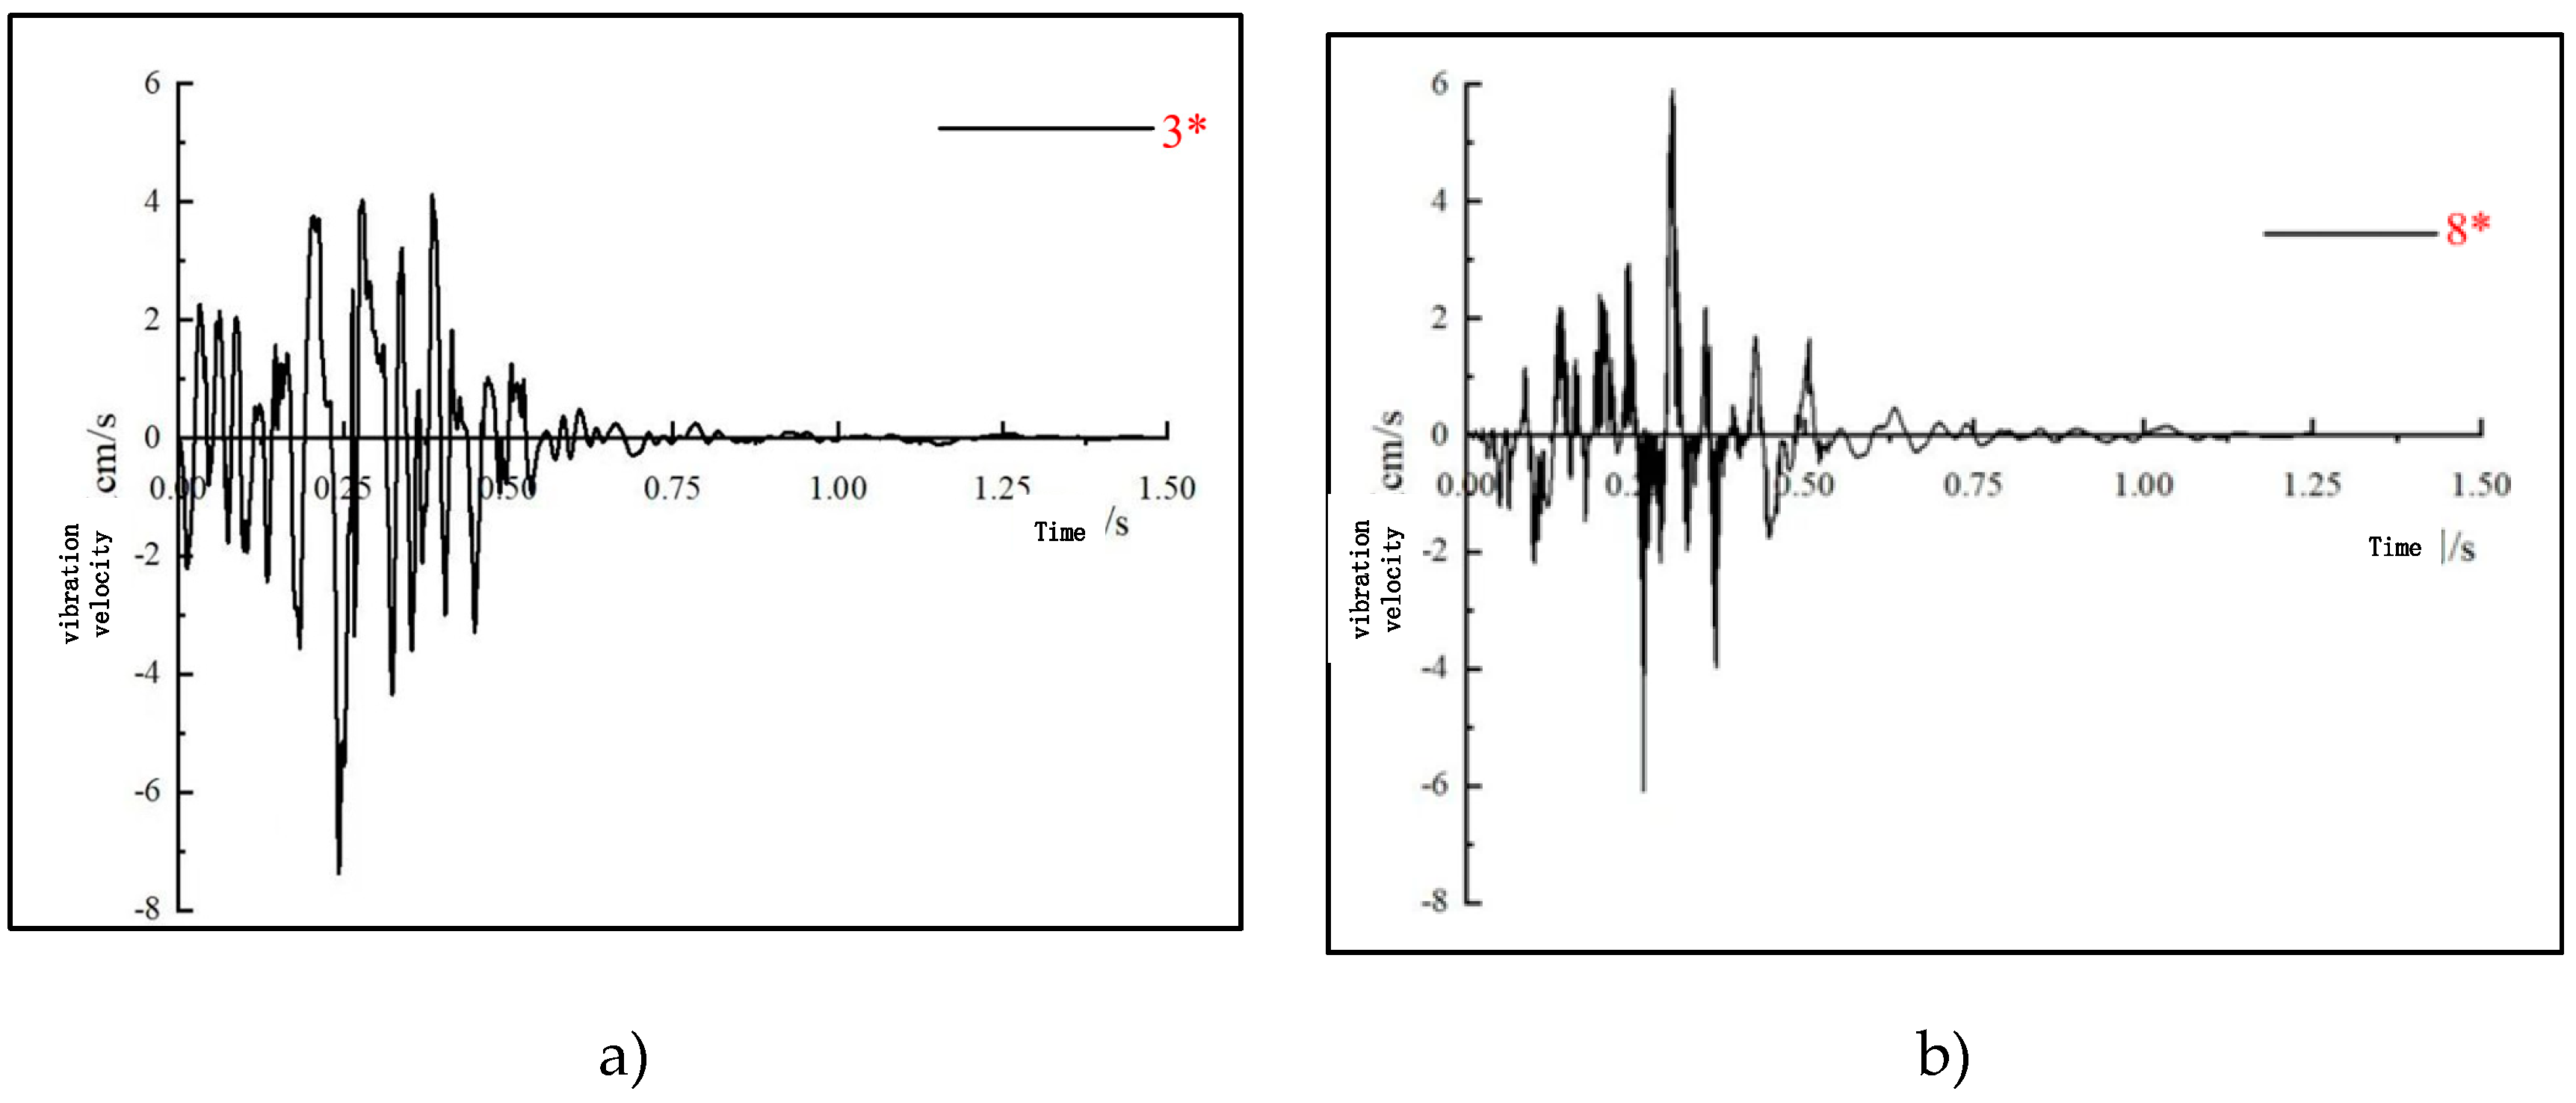
Figure 8.
Sonic Hole Arrangement and Sonic Detection: a) Acoustic Wave Hole Field Layout Diagram; b) Acoustic wave detection.
Figure 8.
Sonic Hole Arrangement and Sonic Detection: a) Acoustic Wave Hole Field Layout Diagram; b) Acoustic wave detection.
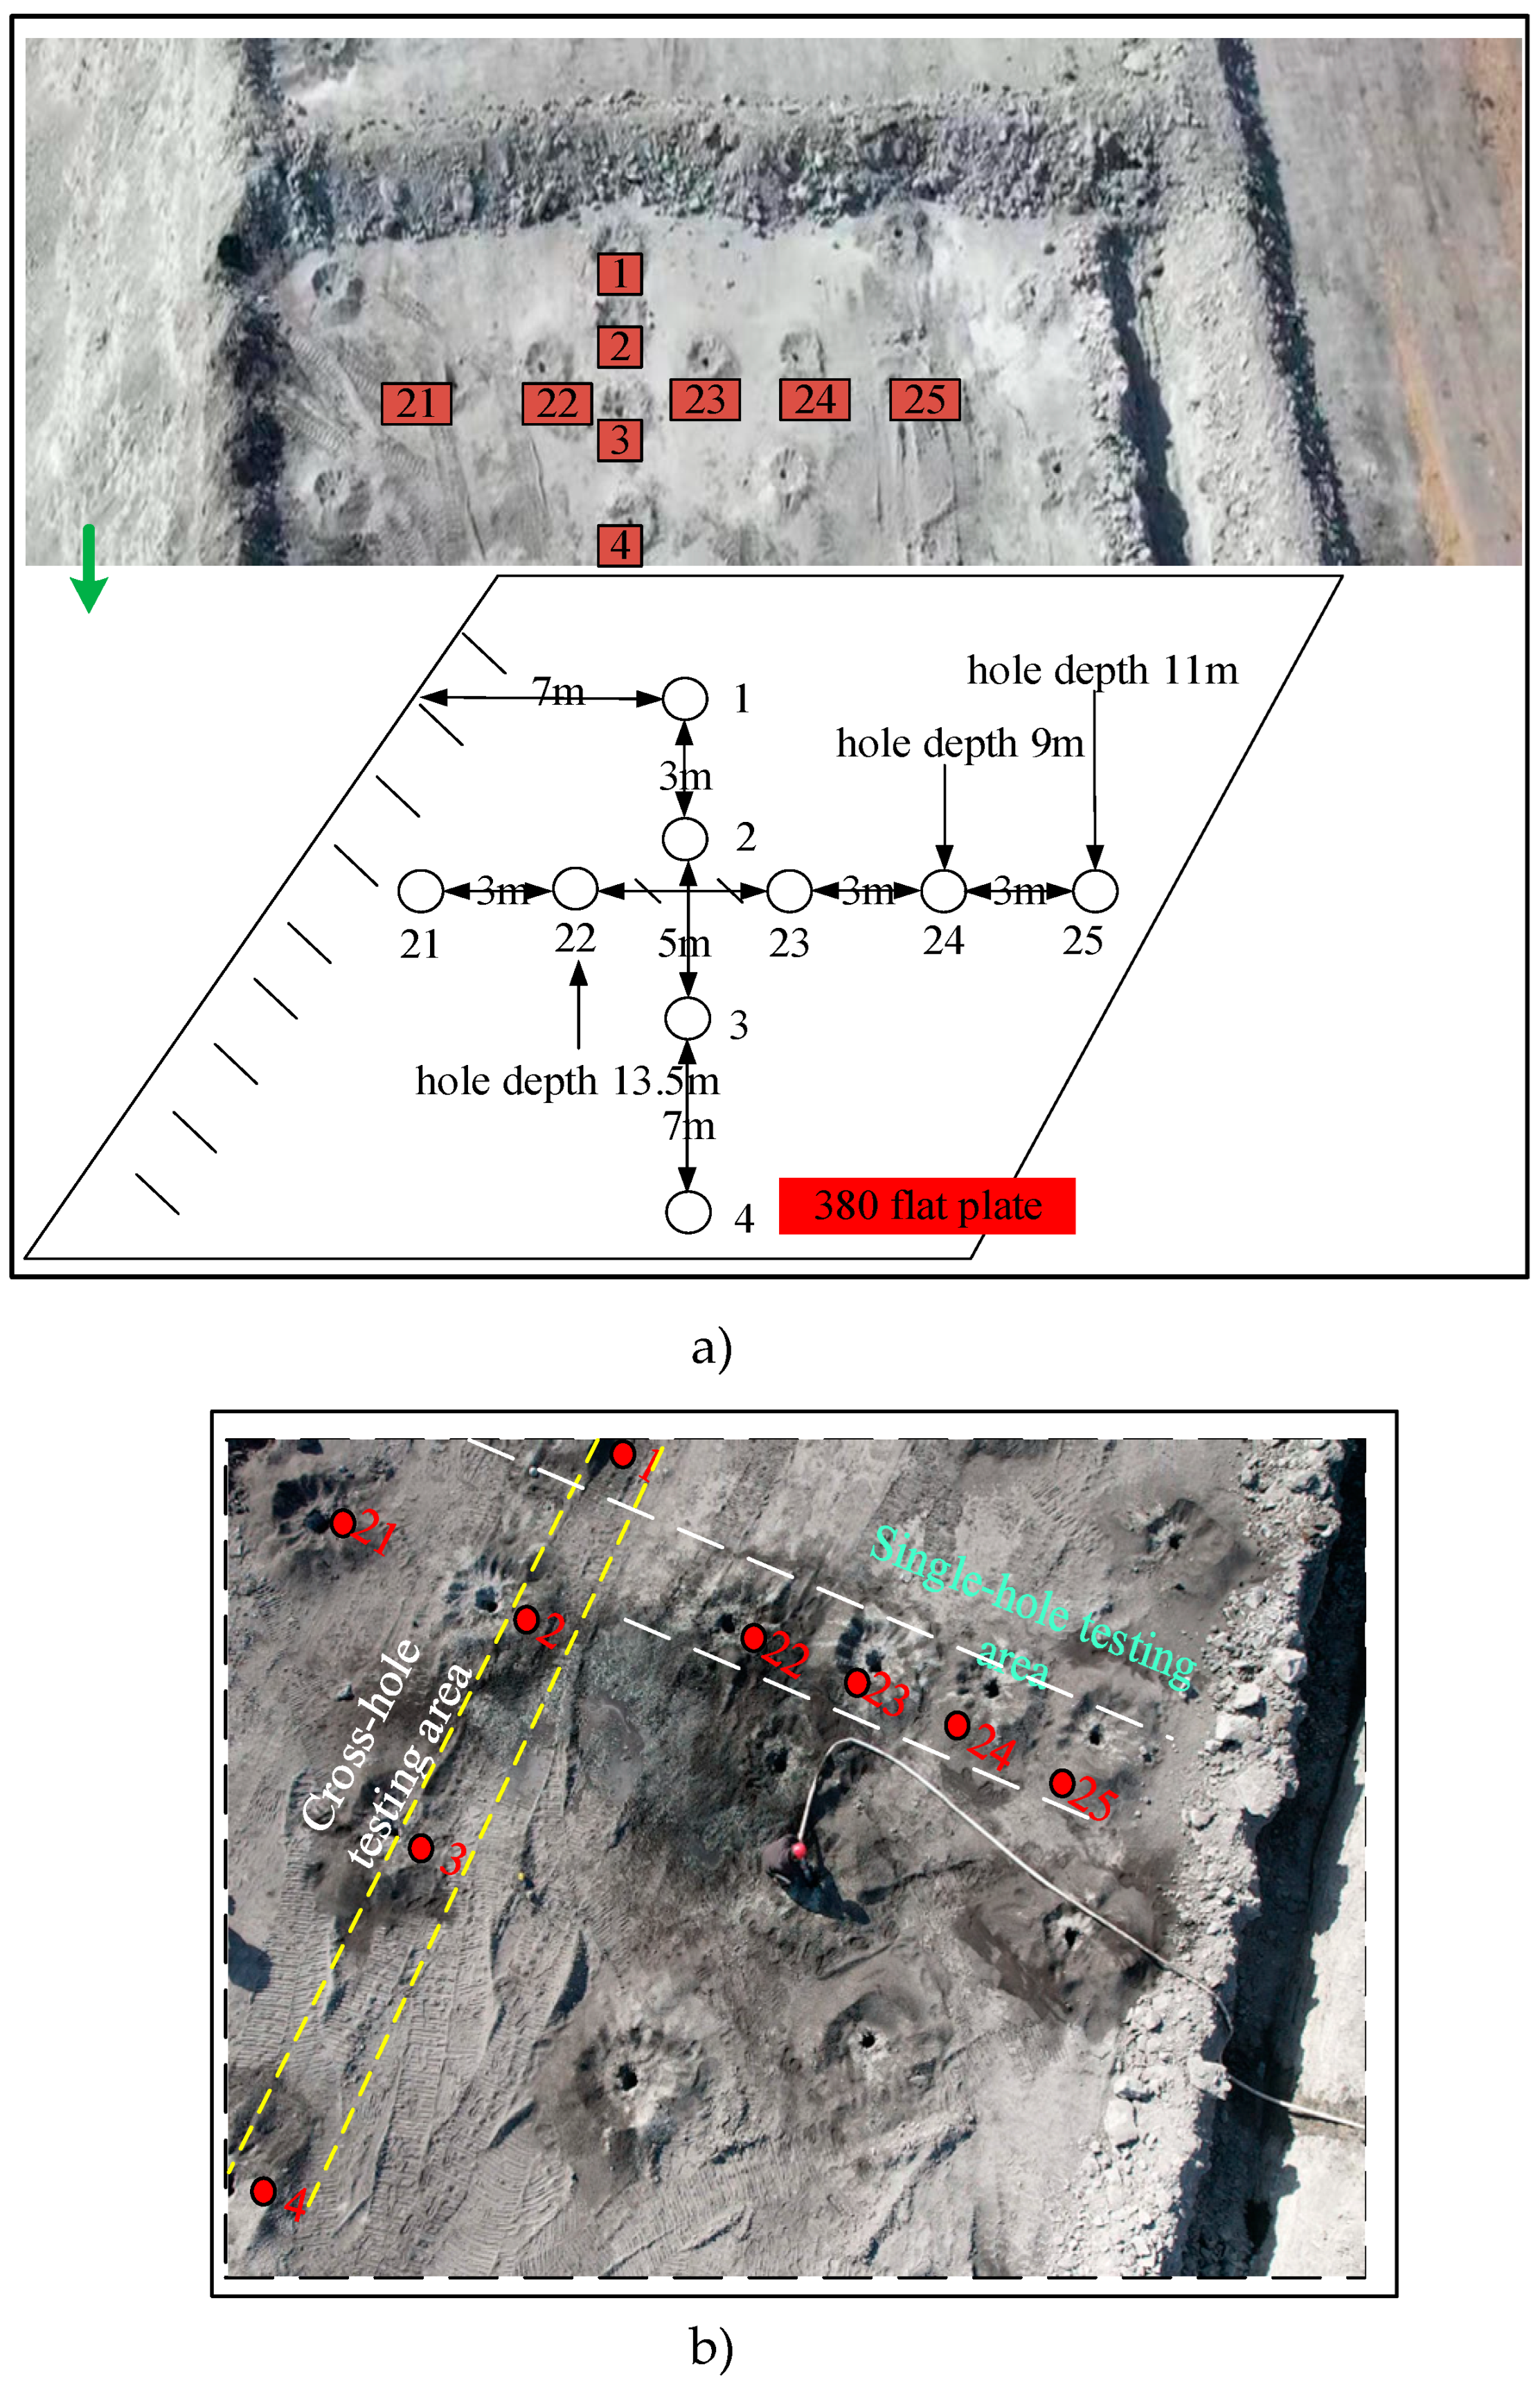
Figure 9.
Acoustic wave velocity: a) Pore 1 acoustic wave velocity; b) Kong 22-23 acoustic wave velocity.
Figure 9.
Acoustic wave velocity: a) Pore 1 acoustic wave velocity; b) Kong 22-23 acoustic wave velocity.
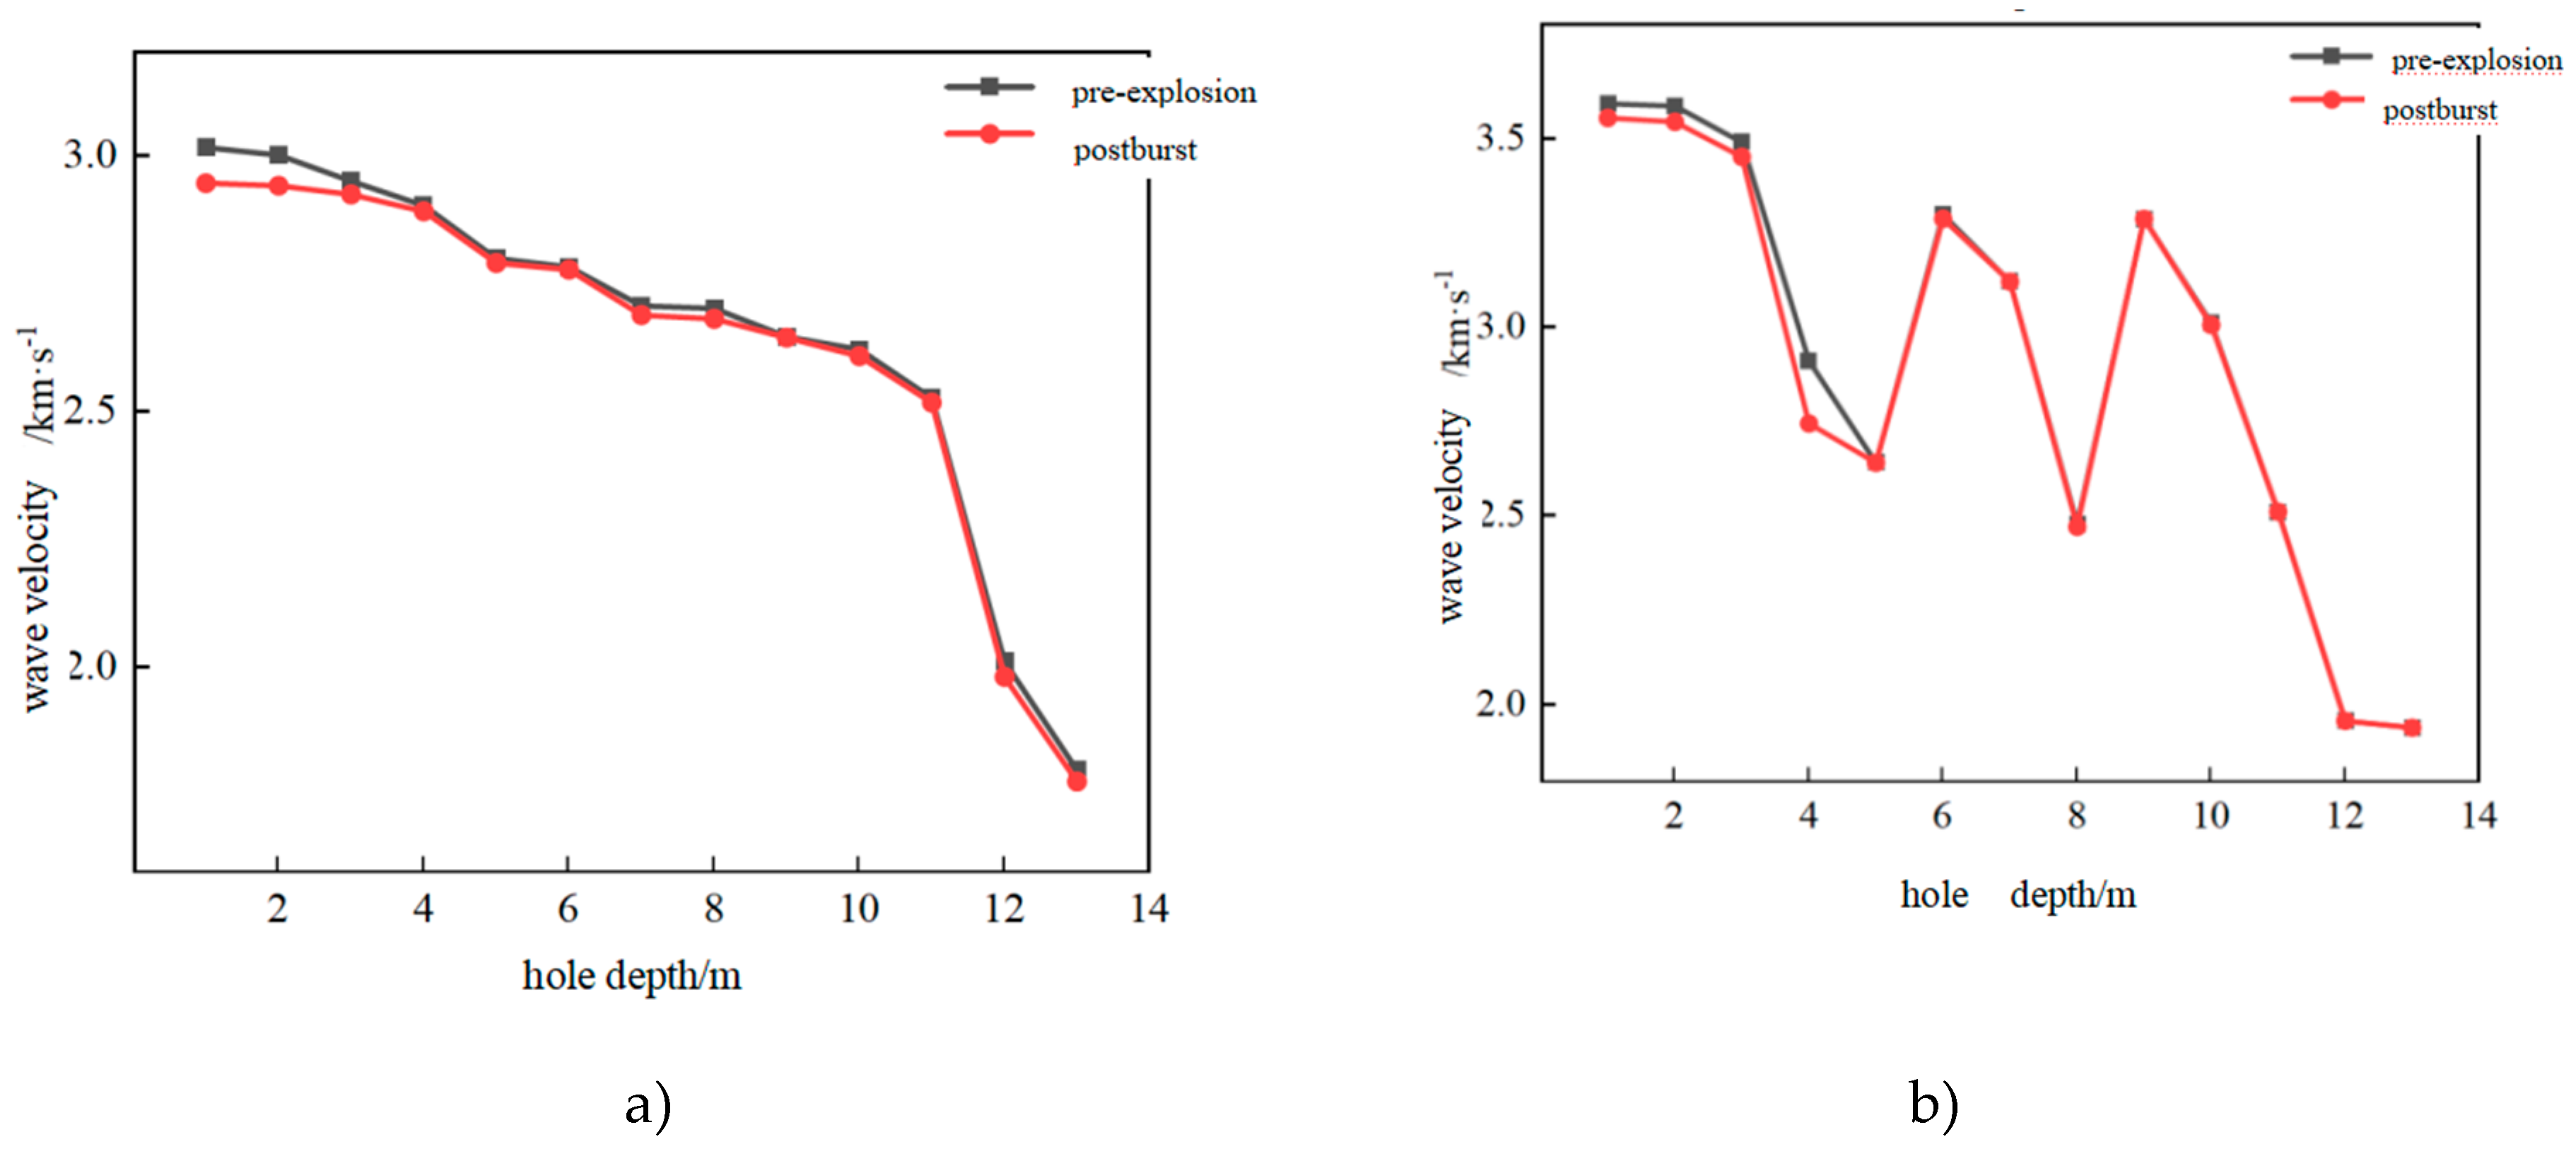
Figure 10.
PCA downscaling input parameter contributions.
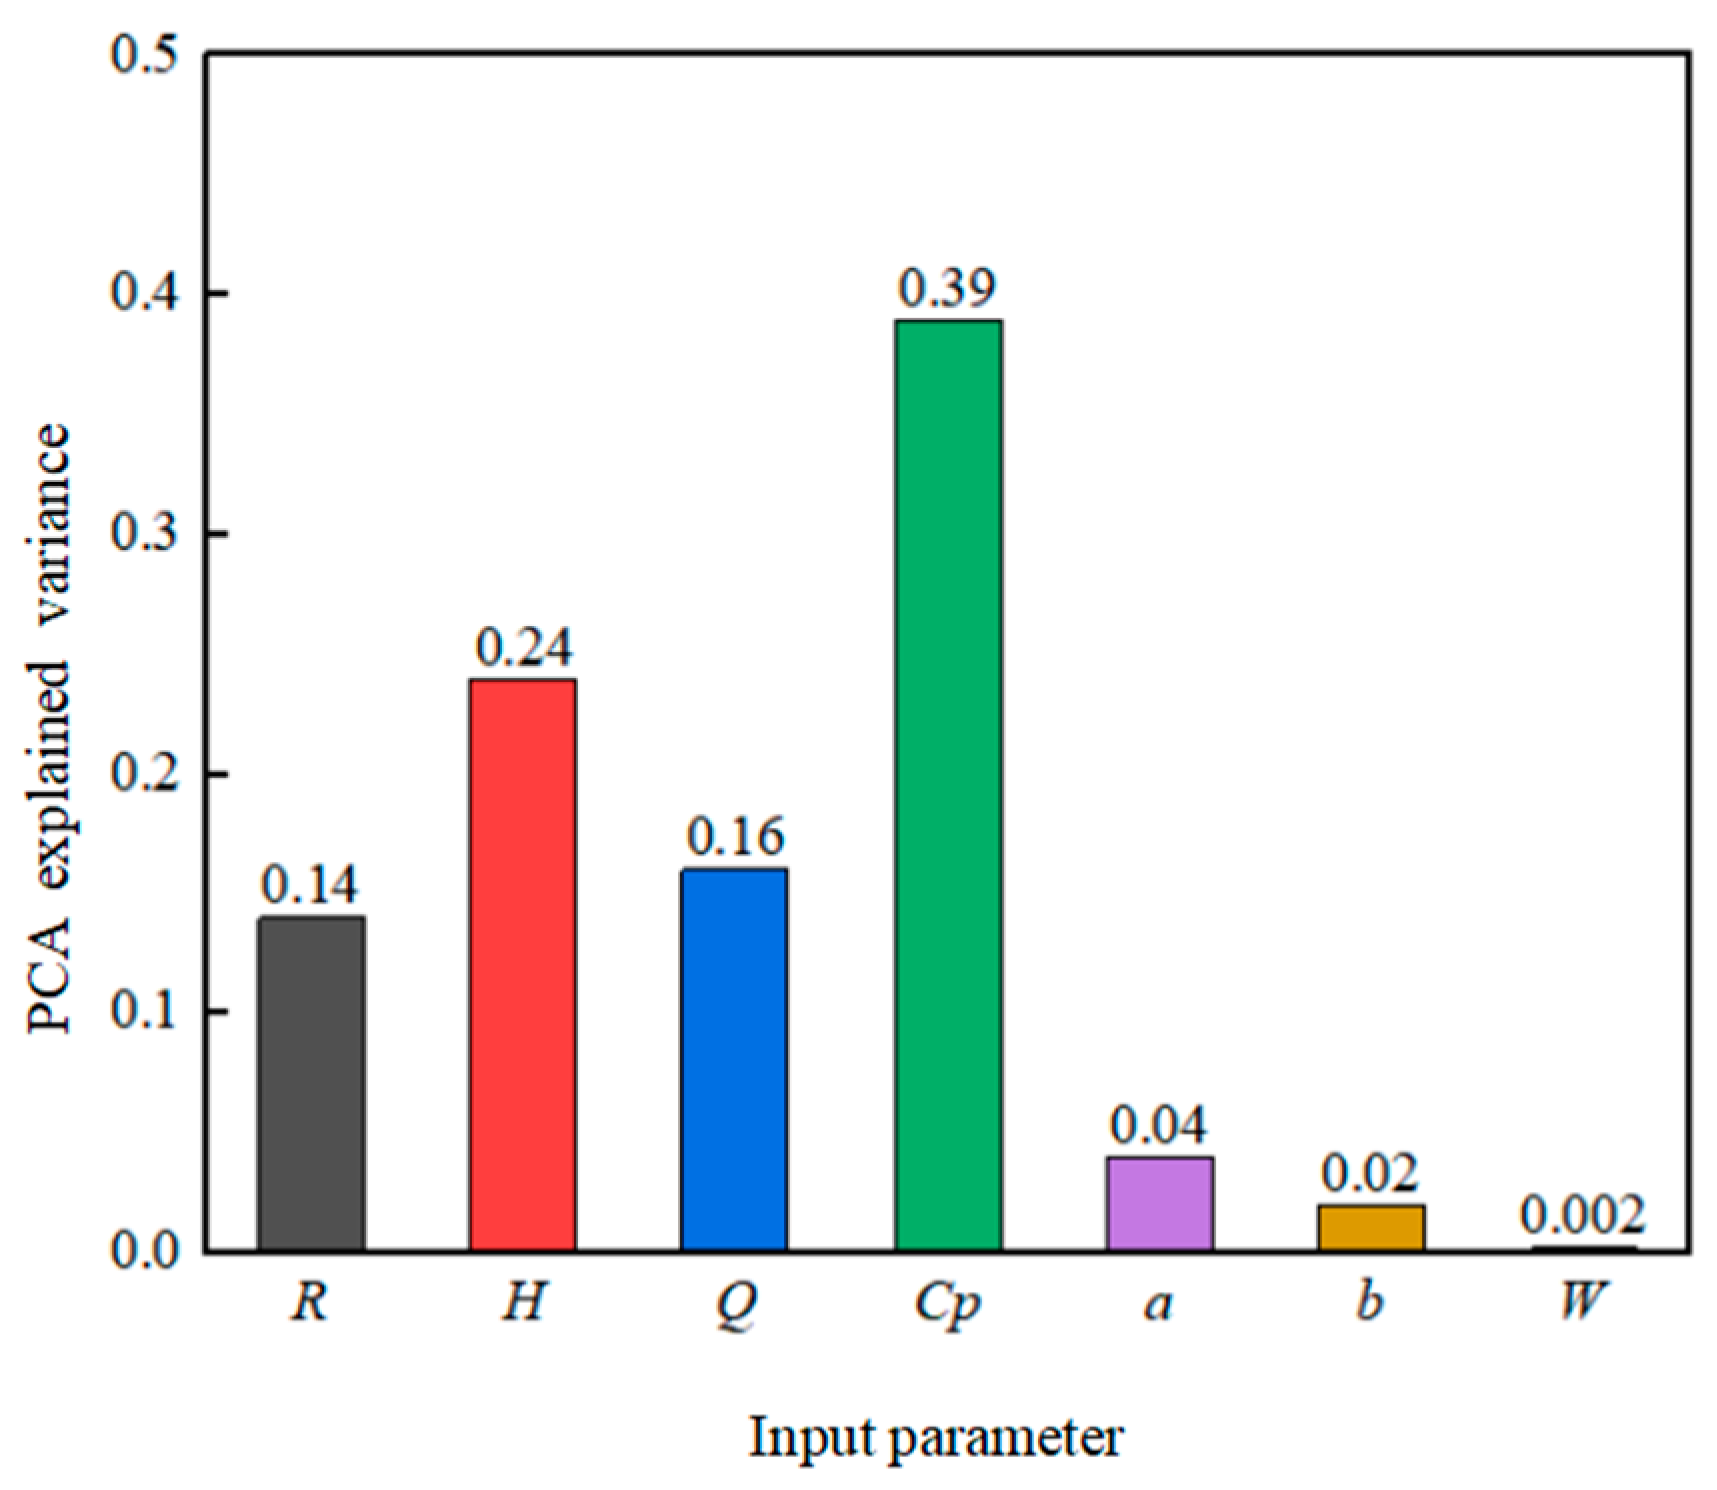
Figure 12.
Comparison of measured values with predicted results: a) PSO-SVM comparison chart; b) Improve the Sadoff comparison chart; c) RS-department comparison chart.
Figure 12.
Comparison of measured values with predicted results: a) PSO-SVM comparison chart; b) Improve the Sadoff comparison chart; c) RS-department comparison chart.
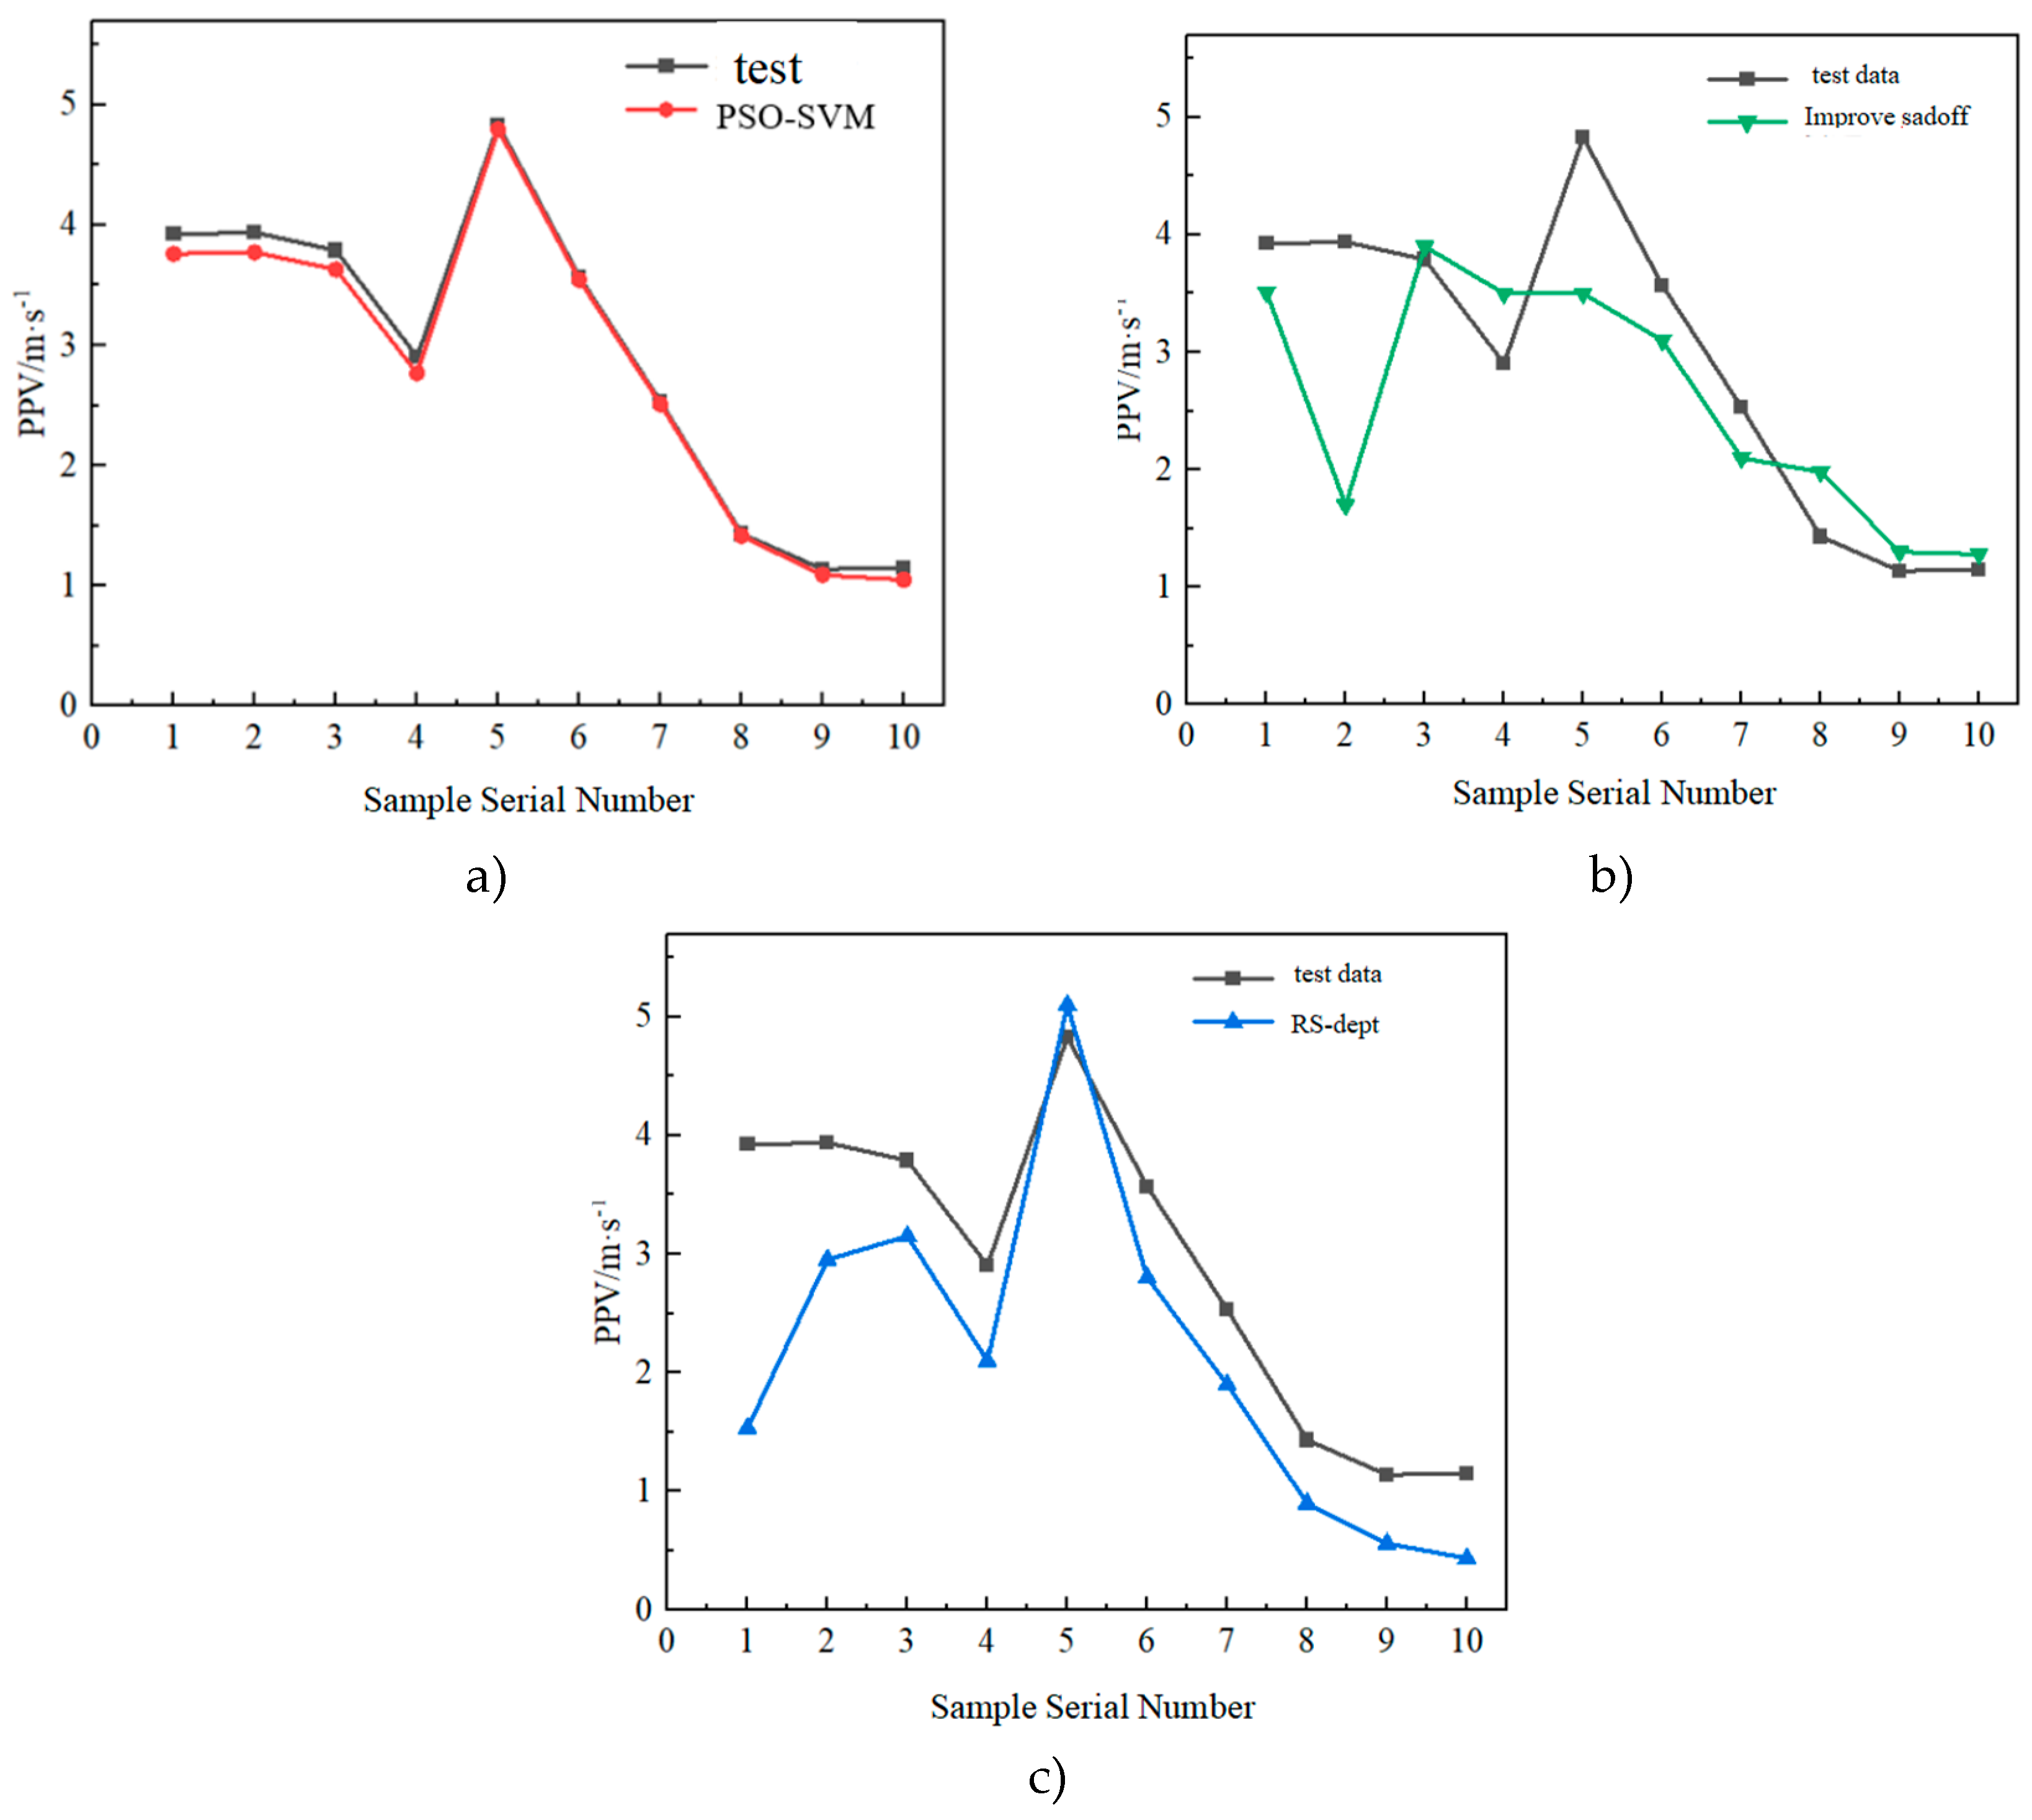
Figure 13.
Model error analysis.
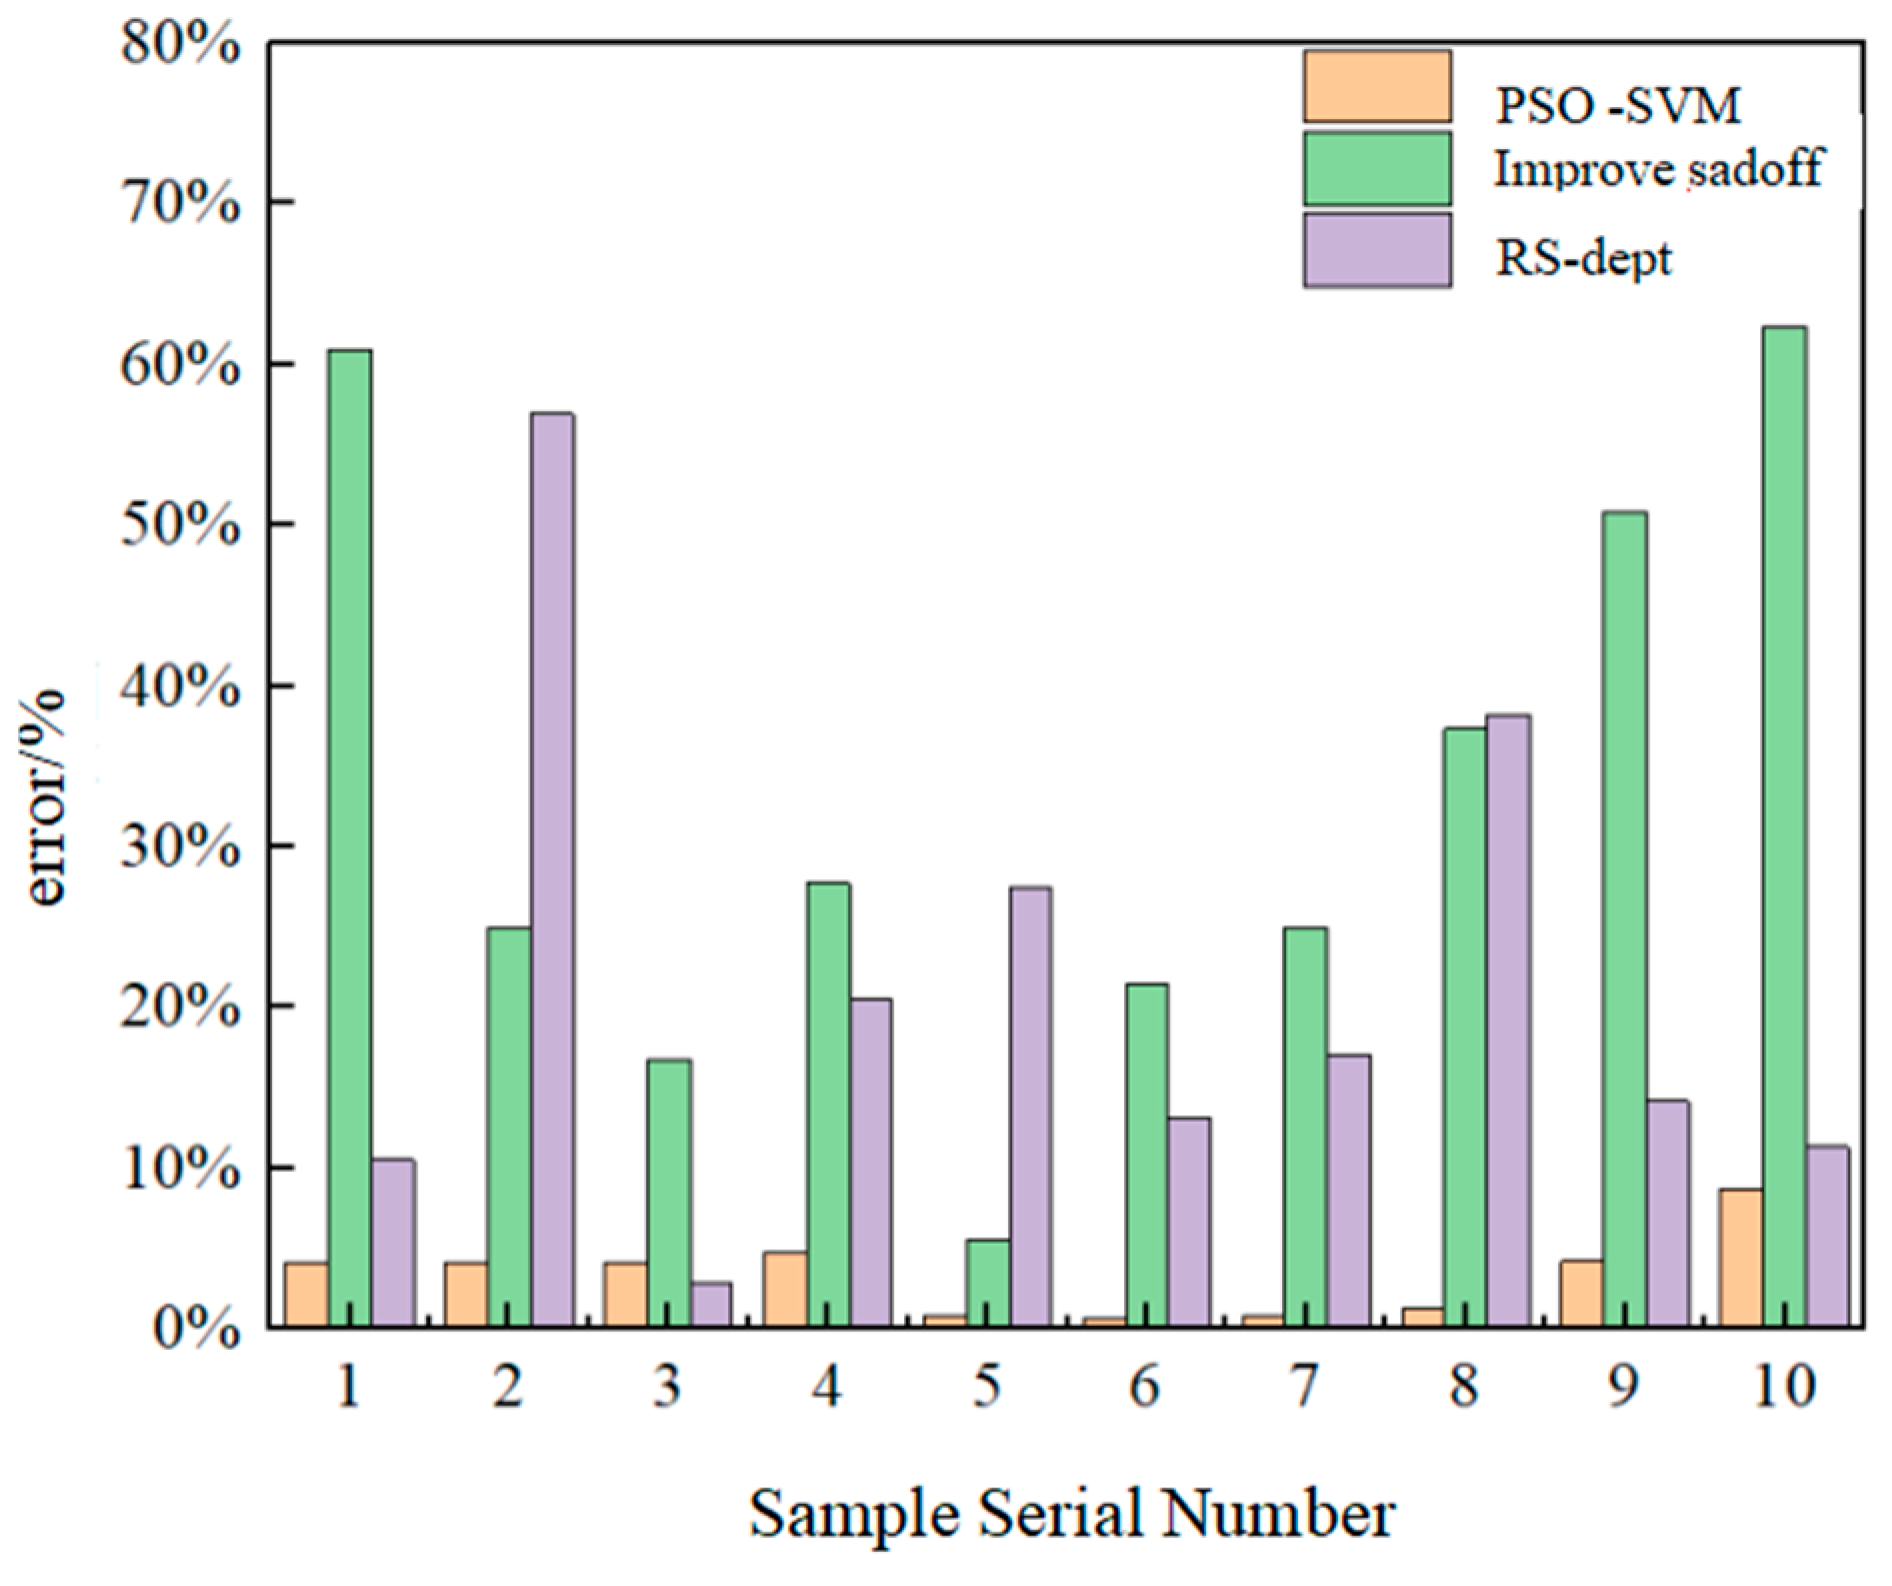

Table 1.
Blasting parameters of the explosion zones at the steps 368~380.
| Numner | Hole name | Borehole parameters | Explosive charge parameters | |||||
| Borehole distance/m | Borehole depth/m | Borehole diameter/mm | Charge length/m | Charge amount per hole /kg | Maximum charge per delay /kg | Total charge amount/kg | ||
| 1 | Presplit hole | 2 | 13.5 | 200 | 2.0 | 5 | 10 | 960 |
| 2 | Buffer hole | 8 | 13.5 | 150 | 3.5 | 48 | 48 | |
| 3 | Main blast-hole | 9 | 13.5 | 150 | 3.5 | 72~84 | 84 | |
Table 2.
Monitoring results of blasting vibrations.
| Number | Distance from the explosive center R/(m) | Elevation differenceH/m | Borehole distancea/m | spacingb/m | P-wave velocity Cp/km.s-1 | Maximum charge per delayQ/kg | Line of least resistance W/m | PPV/m·s-1 |
| 1 | 49.21 | 13 | 7.5 | 5 | 2.4 | 84 | 8 | 3.925 |
| 2 | 52.33 | 12 | 7 | 5.5 | 2.6 | 84 | 8 | 3.939 |
| 3 | 54.41 | 0 | 6.5 | 5 | 3.1 | 84 | 8 | 3.789 |
| 4 | 158.20 | 24 | 6.5 | 5.5 | 2.7 | 84 | 8 | 1.139 |
| 5 | 135.23 | 24 | 9 | 4 | 2.4 | 84 | 8 | 1.150 |
| 6 | 218.21 | 36 | 8 | 4 | 2.9 | 84 | 8 | 0.905 |
| 7 | 298.23 | 12 | 8 | 5.5 | 2.2 | 84 | 8 | 0.829 |
| 8 | 112.25 | 36 | 8.5 | 5 | 3.5 | 84 | 8 | 0.569 |
| 9 | 249.81 | 36 | 6.5 | 5.1 | 3.2 | 84 | 8 | 0.533 |
| 10 | 224.17 | 36 | 7 | 5.3 | 3.3 | 84 | 8 | 0.433 |
| … | … | … | … | … | … | … | … | … |
| 100 | 176.94 | 13 | 9 | 4 | 3.0 | 84 | 8 | 1.487 |
Table 3.
Comparison of prediction errors of the improved Sadovsky formula.
| Sample Number | 1 | 2 | 3 | 4 | 5 | 6 | 7 | 8 | 9 | 10 |
| Measured value | 3.925 | 3.939 | 3.789 | 1.139 | 1.150 | 0.905 | 0.829 | 0.569 | 0.533 | 0.433 |
| Predicted value | 6.749 | 5.467 | 2.695 | 0.436 | 1.421 | 0.559 | 0.347 | 0.837 | 1.065 | 0.532 |
| Error (%) | 71.95 | 38.79 | 28.87 | 61.73 | 23.57 | 38.23 | 58.14 | 47.10 | 99.81 | 22.86 |
Table 4.
Comparison of evaluation indexes of three models after prediction.
| Training model | Evaluation indexes | |||
| r2 | MAE | RMSE | MAPE/% | |
| RS-dept | 0.713 | 3.578 | 1.375 | 33.55% |
| Improved Sadovasky | 0.824 | 3.252 | 1.586 | 27.86% |
| PSO-SVM | 0.767 | 1.113 | 0.383 | 4.25% |
Disclaimer/Publisher’s Note: The statements, opinions and data contained in all publications are solely those of the individual author(s) and contributor(s) and not of MDPI and/or the editor(s). MDPI and/or the editor(s) disclaim responsibility for any injury to people or property resulting from any ideas, methods, instructions or products referred to in the content. |
© 2025 by the authors. Licensee MDPI, Basel, Switzerland. This article is an open access article distributed under the terms and conditions of the Creative Commons Attribution (CC BY) license (http://creativecommons.org/licenses/by/4.0/).
Copyright: This open access article is published under a Creative Commons CC BY 4.0 license, which permit the free download, distribution, and reuse, provided that the author and preprint are cited in any reuse.


