Submitted:
20 March 2025
Posted:
21 March 2025
You are already at the latest version
Abstract
Unraveling the evolutionary history of Brassica L. crops and their wild relatives remains a key challenge in plant evolutionary biology. Brassica cretica is considered the closest living relative of the cultivated B. oleracea. It is mainly distributed in the Aegean Islands and the neighboring mainland regions of Greece and Anatolia, and exhibits extensive phenotypic variability, obscuring its infraspecific classification. In this study, we analyzed five Greek populations of B. cretica and one B. oleracea botanical variety using SSR markers to assess genetic diversity and differentiation. High genetic diversity was detected within natural populations, with a mean of 21.9 alleles per locus and an expected heterozygosity of 0.647. Significant genetic differentiation (Fst = 0.812) revealed the presence of four distinct gene pools, partly supporting the current infraspecific classification of B. cretica. The cultivated plants cluster closely with B. cretica subsp. cretica, supporting the hypothesis of an Eastern Mediterranean origin. Our findings suggest that B. cretica subsp. cretica may have been introduced to suitable habitats or that cultivated plants may have reverted to a feral state in the Peloponnese, given the genetic similarity between populations from Crete and northern Peloponnese. The identified genetic diversity underscores the importance of B. cretica as a genetic resource for breeding programs and highlights the need for conservation, particularly for populations exhibited unique genetic traits.
Keywords:
Brassica cretica
; crop wild relative (CWR)
; natural populations
; genetic variability
; SSR markers
1. Introduction
Resolving the evolution of the Brassica L. (Brassicaceae) crops and their wild relatives probably represents one of the most fascinating tasks in plant evolutionary biology [1,2,3,4]. Darwin [5] already highlighted the parallels between his theory of natural selection and the cultivation practices that shaped the diverse forms of Brassica oleracea L. crops. The domesticated forms of B. oleracea include six major botanical varietes [broccoli (var. italica), Brussels sprouts (var. gemmifera), cabbage (var. capitata), cauliflower (var. botrytis), kale (var. acephala), and kohlrabi (var. gongylodes)], and 12 additional cultivated crop types [6], representing a unique example of diversification through domestication in the plant kingdom. Global production of B. oleracea crops exceeded 100 million metric tons in 2023, indicating its agricultural and economic significance [7].
The generic delimitation of Brassica remains unresolved. Brassica oleracea crops and their wild relatives, however, constitute the monophyletic B. sect. Brassica within the polyphyletic genus Brassica [1]. The section includes about 13 species and several infraspecific taxa distributed across the Mediterranean Basin and the Atlantic coasts of Europe [8]. Several hypotheses on the progenitors of Brassica oleracea crops have been proposed. Brassica montana Pourr., B. rupestris Raf., B. cretica Lam., B. incana Ten., and wild B. oleracea have been nominated as single or multiple progenitor species [9,10,11]. Mabry et al. [6], using RNA-seq data of 224 accessions representing 14 B. oleracea crop types and nine potential wild progenitor species concluded that the Aegean endemic B. cretica is the closest living relative of cultivated B. oleracea, supporting an Eastern Mediterranean origin of cultivation. They also suggested that cultivated plants of this species can revert to a wild-like (feral) state with relative ease. A combination of those results with the evolutionary history of B. oleracea may contribute to a growing body of knowledge on B. oleracea crop domestication that will facilitate continued breeding efforts including adaptation to changing environmental conditions.
Brassica cretica is distributed in the Eastern Mediterranean (Albania, Greece, Türkiye, Lebanon, and Israel), with most of its populations concentrated in the Aegean Islands and the coastal regions of mainland Greece and Anatolia. The extensive phenotypic variability of B. cretica has led to the classification of multiple subspecies and varieties; however, there is no consensus regarding their taxonomic status. Gustafsson et al. [12] identify two subspecies: Brassica cretica subsp. cretica and subsp. nivea. In contrast, Snogerup et al. [11] recognize three subspecies: B. cretica subsp. aegaea subsp. cretica, and subsp. laconica. The disjunct distribution of Brassica cretica in the Middle East has been attributed either to early East Mediterranean trade [13] or to introductions into suitable natural habitats without cultivation [11]. Some populations within the natural range of the species in the Aegean may have also resulted from human-mediated dispersal. According to Mabry et al. [6], early forms of B. cretica may have played underappreciated roles in the domestication of B. oleracea crops. Therefore, resolving the domestication story of B. cretica is fundamental for fully understanding the evolutionary history of B. oleracea.
Brassica cretica is an extremely diverse wild relative of cultivated cabbage (B. oleracea), with genetic distances between its populations often exceeding those found between distinct species in the B. villosa/ B. rupestris/ B. macrocarpa group [14]. This diversity likely results from ‘isolation by distance’ processes, which have shaped significant morphological differences among local populations [11,15]. As it is a diploid (2n = 18) species, partially self-incompatible, hermaphroditic, and insect-pollinated, the geographical isolation of its populations, along with potential pollinator-driven selection based on flower color differences [16], may contribute to its high genetic diversity. Understanding this diversity is crucial for assessing the species’ adaptability and its potential use in breeding programs aiming at enhancing crop resilience [17].
Βreeders of cole crops (B. oleracea L.) have an interest in utilizing current and emerging PCR-based marker systems to differentiate elite germplasm. Among various systems available for genetic analysis in plants, molecular markers are more efficient, precise and reliable in discriminating closely related species or cultivars [18,19,20]. SSRs are co-dominant, highly polymorphic PCR-based markers and thus expected to be a very powerful tool in cultivar discrimination. Polymorphic SSR markers have been recognized as a reliable tool for assessing genetic diversity and population structure in Brassica species in many cases [21,22,23] as well as identifying salinity tolerant genotypes [24]. Furthermore, SSR markers identified in cabbage can be applied to ten other wild and cultivated species within the Brassicaceae family. This highlights their potential value in advancing Brassica oleracea research, including genetic mapping, marker-assisted selection (MAS), and comparative genome analyses [20].
In this study, 10 SSR molecular markers were used to analyze the genetic diversity and population structure of five natural populations of Brassica cretica and one B. oleracea botanical variety to reveal genetic diversity at B. cretica population levels, reveal the distribution of genetic variation within and between the five natural populations, and identify the closest relative among the five B. cretica populations to cultivated species. The genetic information obtained will help to exploit the most promising population in terms of genetic diversity and similarity to cultivated species and thus to explore its future implication in breeding programs.
2. Materials and Methods
2.1. Plant Material & DNA Extraction
This study includes five natural B. cretica populations (two B. cretica subsp. aegaea populations originated from Evia and Ymittos, two B. cretica subsp. cretica populations originated from Akrokorinthos and Crete, and one B. cretica subsp. laconica population from Leonidio) from different regions of Greece and one commercial botanical variety of B. oleracea (population F) (Table 1; Figure 1). Ripe seeds from each population were collected on their natural habitats (Table 1; Figure 1) during physiological ripening period. Seedling preparation was conducted at the greenhouse facilities of the Laboratory of Vegetable Production at Agricultural University of Athens. Specifically, 20 ripe seeds per population were sown on rockwool sheets (AO Plug, Grodan, Roermond, the Netherlands), covered with a thin layer of vermiculite. During germination, seedlings were exposed to ambient light conditions and temperatures ranging from 25 °C to 27 °C during the day, and 17 °C to 19 °C during the night. Additionally, the seedlings were irrigated regularly with a nutrient solution containing 16.4 mM N, 6.6 mM K+, 4.4 mM Ca2+, 2.8 mM Mg2+, 2.75 mM SO42-, 1.3 mM H2PO4-, 20 μΜ Fe (EDDHA), 10 μΜ Mn2+, 6 μΜ Zn2+, 0.8 μΜ Cu2+, 30 μΜ B, 0.7 μΜ Μο, resulting in an electrical conduc-tivity and pH of 2.4 dS/m and 5.6, respectively. One hundred and twenty (120) newly developed seedlings (20 per population) were analyzed in total.
Total genomic DNA was extracted from fresh plant tissue which was stored in deep freeze (–80°C) before DNA isolation. DNA was extracted according to classical CTAB protocol [25] with minor technical modifications. DNA concentrations and purity ratios were measured with Nanodrop ND-1000 Spectrophotometer (NanoDrop Technologies, Inc., Wilmington, DE, USA). Then, all individual DNA samples were diluted at final concentration 50 ng/µl with molecular grade water and stored at freeze −20 °C for PCR analysis.
2.2. Molecular Analysis; PCR Amplification & SSR Markers
The present study used ten SSR markers (Table 2) to analyze genetic variation namely, Ol10B11, Ol10B01, Ol09A01, Ol10F11, Ni4-B10, sORA26, BN12A, Na10-F06, nga111, MB4. Seven SSR primers were studied by [26]; Ol10F11, Ni4-B10, sORA26, BN12A, Na10-F06, nga111, MB4 and five markers described by [23]: Ol10B11, Ol10B01, Ol09A01, Ol10F11, sORA26.
PCR parameters were identical to previous studies with some technical modifications. Selection of those primers was based after an initial screening of a larger number of 14 primers during preparative experiments standardizing PCR conditions according to previously used protocols [23,26].
PCR reactions were performed in 96-well plates Nippon Genetics thermal cycler (FastGene Ultra Cycler Gradient) where different PCRs could be performed at the same time in the same gradient machine using different SSR loci with different Tm (Table 2). The conditions applied for PCRs agreed with corresponding literature [23,26]. The annealing temperature (Ta) was kept 2–3 °C below the melting temperature (Tm) of that primer sequence.
For SSR genetic analysis, PCR amplifications were performed in a total volume of 20 µL for each molecular marker (Eurofins Genomics Custom DNA oligos) separately containing 50 ng/µl of DNA template, 1X reaction buffer (5X KAPA Taq reaction buffer with no magnesium), 2 mM of MgCl2 (Kapa Biosystems) in the case of Ol10B11, Ol10B01and Na10-F06, 2,5 mM of MgCl2 and 0,25 μM of each dNTP (Enzyquest dNTP mix, 10 mM each), 0.4 μM each of the reverse and forward primer, except Na10-F06 and nga111 where we added 0.6 μM of each (Eurofins Genomics Custom DNA oligos) and 0.5 unit KAPA Taq DNA polymerase (Kapa Biosystems, 5u/μl). The first amplification step consisted of initial denaturation at 95 °C for 5 min followed by 35 cycles of denaturation at 94 °C for 35 s, primer annealing at 50 °C - 59 °C (varying with SSR primer pair) for 35 s, primer extension at 72 °C for 35 s and a final extension step at 72 °C for 7 min.
Three technical independent PCR reactions were performed for each SSR marker. The amplified fragments were resolved on 2.2% agarose gel running in 0.5X TBE electrophoresis buffer on device Mupid One Electrophoresis System using 50 bp DNA step ladder (Sigma Aldrich) as size standard reference. DNA bands were visualized under UV light using the gel illumination system Mini Bis Pro (DNRBio-Imaging Systems) connected with software Gel capture.
2.3. Data statistical Analysis
Utilizing binary data generated by SSR primers, the software GenAlex vs. 6.5 was used for the analysis of the results [27].
2.3.1. Variation Within Population
The effective numbers of alleles (Ne), observed heterozygosity (Ho), expected heterozygosity (He), total Expected Heterozygosity (Ht), and Shannon’s Information Index (I) were determined using GenAlex software.
2.3.2. Variation Among Populations
To estimate among-populations genetic variation, Fst (Fixation Index) was calculated to measure the genetic differentiation between the populations based on allele frequencies. For allelic richness (AR) and private allelic richness (pAR) calculations software HP-RARE was used [28].Means and significant values over the loci and populations were obtained by bootstrapping to assess the variability and accuracy of the estimates. The hierarchical distribution of genetic variation (AMOVA) among and within the populations for the ten markers was assessed with GenAlEx software [27], allowing for a partition of the total genetic variation into among-group and within-group components. The effective size of each population (Ne) can be used in the calculation of the Shannon Indices (Shannon’s diversity index) (I) to quantify the richness and evenness of genetic diversity, as well as in the estimation of the effective number of migrants (Nm), which provides insights into gene flow between populations. Nei’s unbiased genetic distance and significance among populations were also estimated, providing a measure of genetic divergence based on allele frequencies. Moreover, genetic distance for each pair of populations was calculated to investigate the relatedness between populations. FreeNA software [29] was used to estimate Nei’s unbiased genetic distance and significance among populations [30], incorporating methods for correcting null alleles. Cavalli-Sforza and Edward’s chord genetic distances (DC) [31], were also estimated for each pair of populations, utilizing the computed methods ENA (DCENA) and INA (DCINA) [29].
The dendrogram among populations was designed with UPGMA (Unweighted Pair Group Method with Arithmetic Mean) based on Nei’s genetic distance using R software. The most likely number of clusters (K) was defined using DELTA Evanno’s method 9 [32] which evaluates the most likely number of genetic clusters based on a model of population structure, using.
3. Results
3.1. Genetic Variation Within Populations
A total of 219 alleles were obtained from the ten SSR loci analysed (Table 3). SSRs, Ol10B11, Ol10B01and Ol09A01 detected >25 alleles. The (total) number of alleles per locus (Na) varied from 16 (minimum Na10-F06) to 32 (maximum; Ol09A01). Respectively, effective number of alleles (Ne) ranged from minimum 2.413 (Na10-F06) to maximum 4,107 (Ol09A01), with a mean value of 3.050 per locus. The number of individuals per population was twenty (20), and the effective number of alleles was 21.9. Expected heterozygosity (He) within population for all SSR loci studied was 0.65.
3.2. Genetic Variation Between and Within Populations
The average number of alleles (Na) per population ranged from 3.200 (population C) to 4.400 (population A), with a mean of 3.650 alleles per individual population. The effective number of alleles (Ne) ranged between 2.747 in population E and 3.519 in the population A, with a mean of effective 3.050 alleles per individual population. Population A, obviously, indicates a higher genetic stability. The expected heterozygosity (He) varied between 0.617 (minimum) (population F) and 0.678 (maximum) (population B). Observed heterozygosity (Ho) was generally noticed in low levels, ranging from 0.060 (population C) to 0.220 (population F). The overall average allelic richness (AR) was 3.26; the highest (3.69) was noticed in population A, whereas the lowest (3.05) was in populations C & E. Private allelic richness (pAR) varied between 0.09 (population D) and 0.86 (population B) with a mean value 0.62 (Table 4).
The genetic differentiation between populations was high (F=0.812; p>0.05). AMOVA test proved that differentiation within-population was 80% and among populations was 20% (Figure 2).
The DELTA method of Evanno [32] was employed to determine the optimal number of clusters (K) (Figure 2), which revealed the presence of four distinct gene pools (K=4) (Figure 3) in the Structure analysis performed using Clumpak software [33].
The STRUCTURE analysis results revealed (optimum) four gene pools in Greece (Figure 3). Group I included B. cretica subsp. aegaea populations from Evia and Ymittos. At group II, populations of B. cretica subsp. cretica from Crete and northern Peloponnese were included. Groups III and IV were formed by B. cretica subsp. laconica and B. oleracea, respectively (Figure 4).
To further examine relationships among populations the INA and ENA methods were used to calculate Pairwise populations Fst Values. (Table 5). The greatest genetic distance was observed between populations C and F (Fst= 0.236) indicating a high genetic divergence, while the smallest genetic distance between populations C and D (Fst= 0.106), indicating their close genetic relatedness.
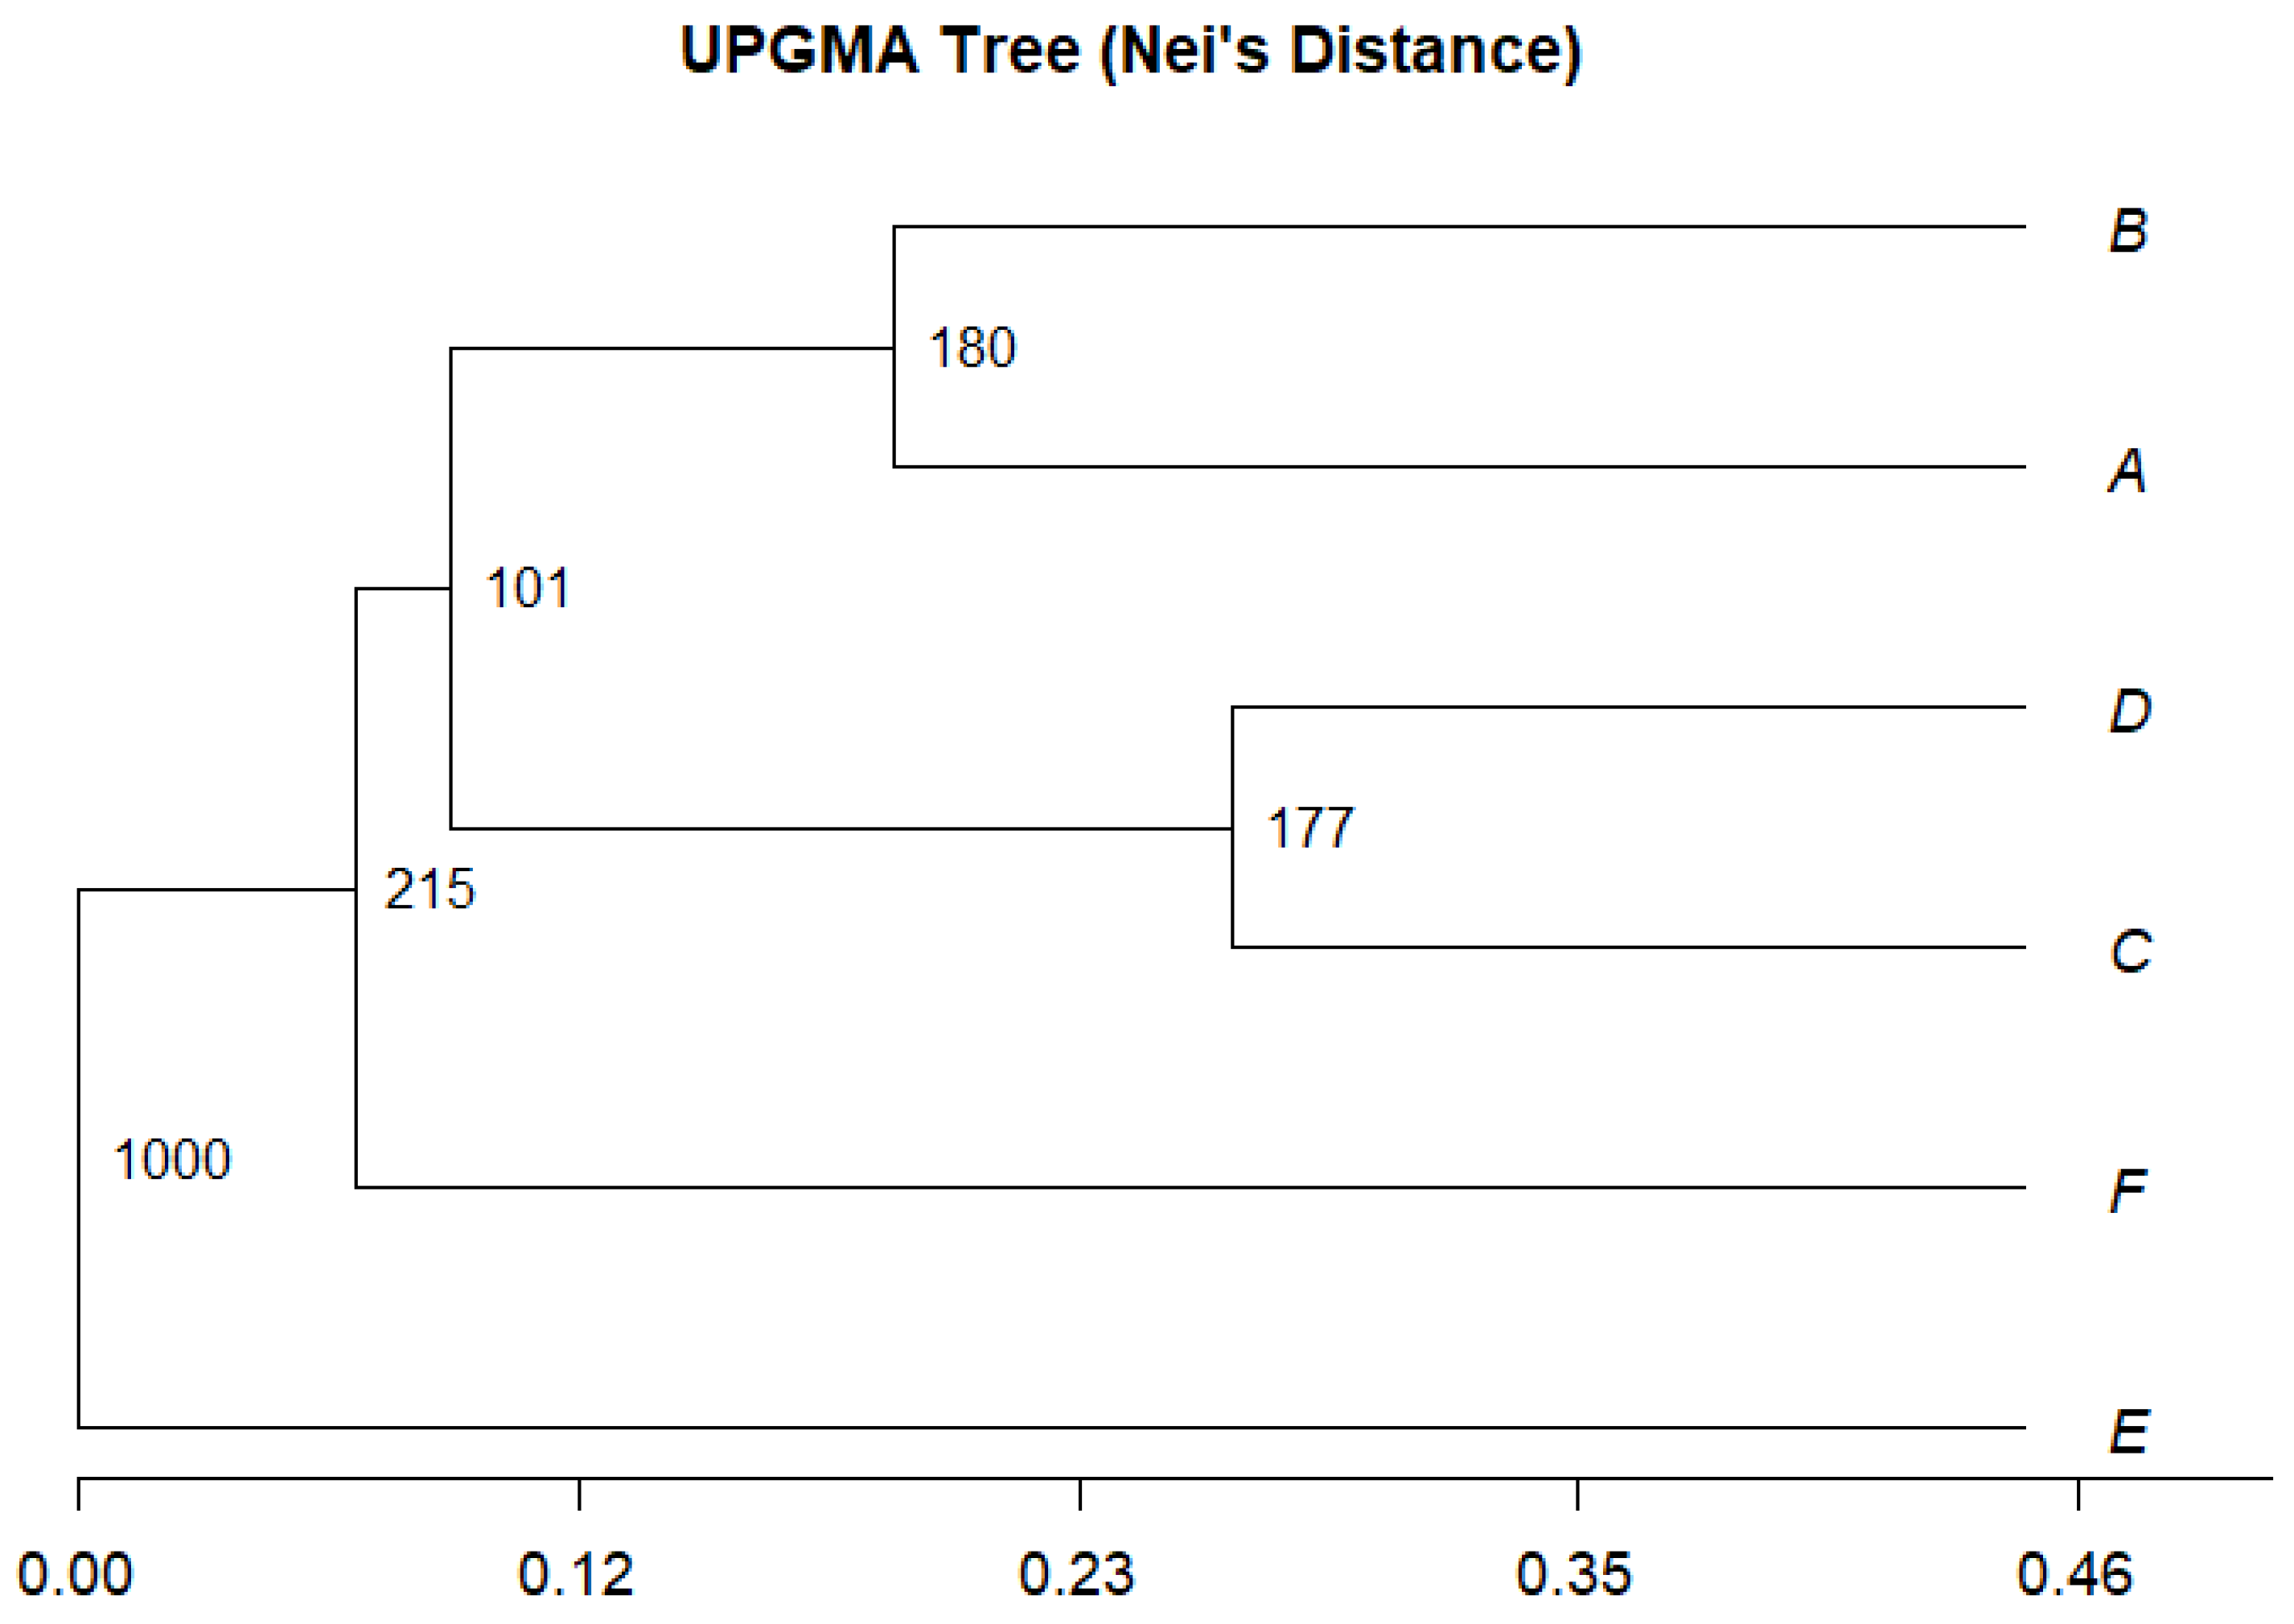
A UPGMA dendrogram (Figure 4), based on Nei’s (unbiased) genetic distance matrix [30], was constructed using R software and the Ape and Phangorn packages [34,35], to illustrate the genetic relationships among the six studied populations. Populations of B. cretica subsp. aegaea and B. cretica subsp. cretica form two distinct clades. The B. oleracea cultivar forms a clade that is sister to the clade comprising these two subspecies. Notably, B. cretica subsp. laconica appears genetically distinct from the other B. cretica subspecies, forming an entirely separate clade. These findings are largely consistent with the results of the STRUCTURE analysis.
Figure 4.
UPGMA tree using Nei’s genetic distance. Bootstrap values are presented at the branch intersections.
Figure 4.
UPGMA tree using Nei’s genetic distance. Bootstrap values are presented at the branch intersections.
4. Discussion
Ιn the Mediterranean basin, the fragmentation of species into genetically isolated populations has significant implications for diversification, adaptation, and speciation. The rich Aegean flora is a product of the region’s complex geological history, which has shaped a fragmented insular landscape. Many plant species exist in small, isolated populations with limited migration [36,37,38], contributing to the characteristic mosaic variation of Aegean plant taxa [11,39,40]. Herein, ten SSR markers were used to assess the genetic diversity and population structure of five Brassica cretica populations and one B. oleracea botanical variety. This study aimed to evaluate genetic diversity within and genetic differentiation among B. cretica populations, examine the distribution of genetic variation, and identify the closest relative to the cultivated plants. We found high genetic diversity, with the number of alleles per locus (Na) ranging from 18 (sORA26 and BN12A) to 32 (Ol09A01), with a mean value of 20. Notably, the observed Na was higher than that reported by [26] (Na=5.4) for several shared loci (Ol10-F11, Ni4-B10, sORA26, BN12A, Na10-F06, nga111 and MB4). Furthermore, our study recorded a mean number of private alleles of 0.62, significantly higher than the 0.141 reported in the previous study, indicating a unique gene pool to our study populations.
The average number of alleles per population (Na) in our study was 3.65, which is higher than the 1.9 reported for seven B. cretica populations from Crete [26] and greater than the values found in 25 B. oleracea accessions from Ireland using similar molecular markers [41]. This higher allele number may be attributed to the isolation by distance among our populations compared to the cultivated species studied by El-Esawi et al. [41]. Additionally, the wider geographical distribution of our sampled populations across long-established biogeographical barriers, compared to the more geographically restricted Cretan populations examined by [26], may further account for the observed increase in genetic diversity.
The populations of all B. cretica subspecies showed similar heterozygosity (He) values. The average expected heterozygosity (He) across the studied populations was 0.647, significantly higher than the values reported in previous studies. Edh et al. [26] and Maggioni et al. [42] found a He of 0.211, while Watson-Jones et al. [43] reported a He of 0.26 in their analyses of nine wild Brassica populations, respectively. Allelic richness was 3.26 and private allelic richness was pAR (0.62) higher than the value (0.141) reported by Edh et al. [26]. This higher number of heterozygosity and private allelic richness can be partly attributed to outcrossing breeding systems or the methodology used.
The mean Fst value for our studied populations was 0.81, indicating a high level of differentiation among them. Similar results were reported by Edh et al. [26] using nuclear and chloroplast markers, which revealed exceptionally high levels of population diversity (overall FST = 0.628 and 1.000, respectively). In addition, although Watson-Jones [43] reported lower Fst values (0.2257), they also detected considerable differentiation among populations. These results suggest that Brassica species, particularly B. cretica populations, are fragmented across various habitats and have adapted to varying environmental conditions, including soil type, temperature, and moisture levels. Such environmental differences may drive local adaptation and contribute to genetic divergence between populations [26].
Genetic distance analysis and UPGMA dendrograms consistently reveal genetic divergence among Brassica samples, classifying them into four major genetic groups. This grouping is further supported by population structure analysis. Three key conclusions emerge from these findings. Brassica cretica subsp. cretica and subsp. aegaea are genetically distinct but monophyletic, partly supporting the intraspecific classification proposed by Snogerup et al. [11]. While this classification is widely accepted by sources like POWO [44], Euro+Med [45], and the Flora of Greece web (2025), https://portal.cybertaxonomy.org/flora-greece/intro, among others, the classification into two subspecies (i.e., B. cretica subsp. cretica and subsp. nivea) proposed by Gustafsson et al. [12]) is still followed in some studies, e.g., [46,47]. Our results indicate that the population from southern Peloponnese (Leonidio), classified as B. cretica subsp. laconica, significantly deviates from the other two subspecies of B. cretica. The flavonoid composition of B. cretica subsp. laconica also contrasts to that of the other two subspecies [48], suggesting a distinct differentiation in southern Peloponnesian populations. Their taxonomic re-evaluation could provide insights into the evolutionary history of B. oleracea/B. cretica complex, advancing our understanding on the domestication of B. oleracea crops.
The STRUCTURE analysis reveals a high degree of genetic similarity between the populations from northern Peloponnese (Akrokorinthos Castle) and eastern Crete. According to Snogerup et al. [11], populations from both regions belong to Brassica cretica subsp. cretica. Notably, the Akrokorinthos Castle population, located at the acropolis of ancient Corinth with a continuous human presence for millennia, was designated as the type locality for this subspecies [11]. These authors also suggested that the disjunct distribution of B. cretica subsp. cretica in Crete and northern Peloponnese likely reflects remnants of a once more continuous range rather than human introduction. This conclusion was supported by observed chromosomal rearrangements and reduced interfertility between populations. However, our analyses indicate high genetic similarity between the Akrokorinthos and the Cretan populations and reduced genetic variability in the Akrokorinthos population (Ho=0.060), suggesting that an early human introduction to northern Peloponnese cannot be ruled out. Chromosomal rearrangements and reduced interfertility among populations may have resulted from a founder effect, leading to reduced genetic diversity and the fixation of chromosomal mutations, as well as genetic drift, selection, or local adaptation. Interestingly, the Akrokorinthos population has rather low genetic similarity to B. oleracea cultivar, possibly indicating an introduction to suitable habitats without cultivation as suggested by Snogerup et al. [11].
The Brassica oleracea cultivar clusters closely with B. cretica subsp. cretica, particularly with the Cretan populations, which exhibit the highest genetic similarity. This observation agrees with previous findings by Mabry et al. [6], who identified B. cretica as the closest extant relative of domesticated B. oleracea, lending further support to the hypothesis of an eastern Mediterranean origin for cultivated cabbages and kales. Historical evidence also suggests an eastern Mediterranean origin for B. oleracea. Descriptions of kales, a form of B. oleracea, first appear in the works of the Greek scholar Theophrastus (370–285 BC), whereas earlier texts from 800–600 BC make no mention of such plants. This temporal context implies that domestication likely took place in this region during that period [49].
Using SSR markers we were able to detect the genetic diversity in five B. cretica populations. Our findings indicate the need for additional molecular and phenotypic studies to clarify the taxonomic classification of B. cretica in the Aegean region. These investigations should include a broader range of populations from different regions of Greece and the eastern Mediterranean. Our results also revealed high genetic diversity and allelic richness in B. cretica populations, making them a valuable genetic resource for breeding with Brassica crops.
Climate change threatens both the survival of native Brassica populations and the sustainability of Brassica crop production. Rising temperatures disrupt flowering times, pollination, and seed viability, while extreme heat stress reduces germination and biomass production [49]. Drought and water stress further hinder seed germination, early development, and overall yield, with wild populations facing habitat loss due to desertification [50]. Extreme weather events further damage plants, displace seeds, and accelerate soil erosion, while habitat fragmentation and genetic erosion reduce adaptive potential. Climate-induced pollinator declines and shifts in flowering periods disrupt reproduction [51]. To mitigate these threats, conservation efforts must focus on preserving genetic diversity, protecting natural habitats, and implementing sustainable agricultural practices. To our knowledge, very few accessions of B. cretica currently exist in genetic banks in Greece. Therefore, establishing ex situ conservation measures for Greek populations, including seed collection and vegetative propagation, should be a high priority.
Author Contributions
The following statements should be used: Conceptualization, E.T., P.T and E.V.A.; methodology, E.S, G.N., T.N, I.K.; software, A.K.; validation, A.K., E.V.A., and P.T.; formal analysis, A.K and E.V.A.; investigation, E.S.; resources, E.T and P.B.; data curation, E.S.; writing—original draft preparation, E.S, E.T, E.V.A, A.K, P.T, P.B.; writing—review and editing, E.S, E.T, E.V.A, A.K, P.T, P.B.; visualization. E.S.; supervision, E.T.; project administration, E.T.; funding acquisition, P.B. All authors have read and agreed to the published version of the manusc.ript.
Funding
We thank Emmanouil Avramakis (Natural History Museum of Crete) for providing seeds and specimens from Crete. This research was supported by the Hellenic Foundation for Research and Innovation (HFRI) under the 3rd Call for HFRI PhD Fellowships (Fellowship Number: 5666).
Data Availability Statement
All data is available upon request.
Acknowledgments
The research work was supported by the Hellenic Foundation for Research and Innovation (HFRI) under the 3rd Call for HFRI PhD Fellowships (Fellowship Number: 5666).

Conflicts of Interest
The authors declare no conflicts of interest.
References
- Arias, T.; Pires, J.C. A fully resolved chloroplast phylogeny of the brassica crops and wild relatives (Brassicaceae: Brassiceae): Novel clades and potential taxonomic implications. Taxon 2012, 61, 980–988. [Google Scholar] [CrossRef]
- Lysak, M.A.; Koch, M.A.; Pecinka, A.; Schubert, I. Chromosome triplication found across the tribe Brassiceae. Genome research 2005, 15, 516–525. [Google Scholar] [CrossRef] [PubMed]
- Schranz, M.E.; Lysak, M.A.; Mitchell-Olds, T. The ABC’s of comparative genomics in the Brassicaceae: building blocks of crucifer genomes. Trends in plant science 2006, 11, 535–542. [Google Scholar] [CrossRef] [PubMed]
- Tatout, C.; Warwick, S.; Lenoir, A.; Deragon, J.-M. SINE insertions as clade markers for wild crucifer species. Molecular Biology and Evolution 1999, 16, 1614–1614. [Google Scholar] [CrossRef]
- Eiseley, L.C.; Grote, A. Charles Darwin, Edward Blyth, and the Theory of Natural Selection. Proceedings of the American Philosophical Society 1959, 103, 94–158. [Google Scholar]
- Mabry, M.E.; Turner-Hissong, S.D.; Gallagher, E.Y.; McAlvay, A.C.; An, H.; Edger, P.P.; Moore, J.D.; Pink, D.A.; Teakle, G.R.; Stevens, C.J. The evolutionary history of wild, domesticated, and feral Brassica oleracea (Brassicaceae). Molecular Biology and Evolution 2021, 38, 4419–4434. [Google Scholar] [CrossRef]
- Ndondo, J.T.K. Review of the Food and Agriculture Organisation (FAO) Strategic Priorities on Food Safety 2023. In Food Safety-New Insights; IntechOpen: 2023.
- Sciandrello, S.; Brullo, C.; Brullo, S.; Giusso Del Galdo, G.; Minissale, P.; Salmeri, C. A new species of Brassica sect. Brassica (Brassicaceae) from Sicily. Plant Biosystems-An International Journal Dealing with all Aspects of Plant Biology 2013, 147, 812–820. [Google Scholar] [CrossRef]
- Hodgkin, T. Cabbages, kales, etc. 76-82. In. J. Smartt andN. Simmonds (ed.). Evolution of crop plants. 1995.
- Maggioni, L.; von Bothmer, R.; Poulsen, G.; Lipman, E. Domestication, diversity and use of Brassica oleracea L., based on ancient Greek and Latin texts. Genetic Resources and Crop Evolution 2018, 65, 137–159. [Google Scholar] [CrossRef]
- Snogerup, S.; Gustafsson, M.; Von Bothmer, R. Brassica sect. Brassica (Brassicaceae) I. taxonomy and variation. Willdenowia 1990, 271–365. [Google Scholar]
- Gustafsson, M.; Bentzer, B.; Bothmer, R.v.; Snogerup, S. Meiosis in Greek Brassica of the oleracea group. 1976.
- Dixon, G. Origins and diversity of Brassica and its relatives. In Vegetable brassicas and related crucifers; CABI Wallingford UK: 2006; pp. 1–33.
- Lázaro, A.; Aguinagalde, I. Genetic Diversity in Brassica oleracea L. (Cruciferae) and Wild Relatives (2n= 18) using RAPD Markers. Annals of Botany 1998, 82, 829–833. [Google Scholar] [CrossRef]
- Widén, B.; Andersson, S.; Rao, G.Y.; Widén, M. Population divergence of genetic (co) variance matrices in a subdivided plant species, Brassica cretica. Journal of Evolutionary Biology 2002, 15, 961–970. [Google Scholar] [CrossRef]
- Grant, V. Modes and origins of mechanical and ethological isolation in angiosperms. Proceedings of the National Academy of Sciences 1994, 91, 3–10. [Google Scholar] [CrossRef] [PubMed]
- Frankham, R. Inbreeding and extinction: a threshold effect. Conservation Biology 1995, 9, 792–799. [Google Scholar] [CrossRef]
- Hu, S.; Yu, C.; Zhao, H.; Sun, G.; Zhao, S.; Vyvadilova, M.; Kucera, V. Genetic diversity of Brassica napus L. Germplasm from China and Europe assessed by some agronomically important characters. Euphytica 2007, 154, 9–16. [Google Scholar]
- Mishra, P.; Singh, N. Allelic diversity among short duration maize (Zea mays L.) genotypes using SSR markers. Madras Agricultural Journal 2012, 99, 1. [Google Scholar] [CrossRef]
- Xu, Y.; Xing, M.; Song, L.; Yan, J.; Lu, W.; Zeng, A. Genome-wide analysis of simple sequence repeats in cabbage (Brassica oleracea L.). Frontiers in Plant Science 2021, 12, 726084. [Google Scholar] [CrossRef]
- Allender, C.; Allainguillaume, J.; Lynn, J.; King, G.J. Simple sequence repeats reveal uneven distribution of genetic diversity in chloroplast genomes of Brassica oleracea L. and (n= 9) wild relatives. Theoretical and Applied Genetics 2007, 114, 609–618. [Google Scholar] [CrossRef]
- Shi, J.; Huang, S.; Zhan, J.; Yu, J.; Wang, X.; Hua, W.; Liu, S.; Liu, G.; Wang, H. Genome-wide microsatellite characterization and marker development in the sequenced Brassica crop species. DNA research 2014, 21, 53–68. [Google Scholar] [CrossRef]
- Thakur, A.K.; Singh, K.H.; Singh, L.; Nanjundan, J.; Khan, Y.J.; Singh, D. SSR marker variations in Brassica species provide insight into the origin and evolution of Brassica amphidiploids. Hereditas 2018, 155, 1–11. [Google Scholar] [CrossRef]
- Kumar, M.; Choi, J.-Y.; Kumari, N.; Pareek, A.; Kim, S.-R. Molecular breeding in Brassica for salt tolerance: importance of microsatellite (SSR) markers for molecular breeding in Brassica. Frontiers in Plant Science 2015, 6, 688. [Google Scholar] [CrossRef]
- Doyle, J.J.; Doyle, J.L. A rapid DNA isolation procedure for small quantities of fresh leaf tissue. Phytochemical bulletin 1987.
- Edh, K.; Widén, B.; Ceplitis, A. Nuclear and chloroplast microsatellites reveal extreme population differentiation and limited gene flow in the Aegean endemic Brassica cretica (Brassicaceae). Molecular Ecology 2007, 16, 4972–4983. [Google Scholar] [CrossRef] [PubMed]
- Peakall, R.; Smouse, P.E. GENALEX 6: genetic analysis in Excel. Population genetic software for teaching and research. Molecular Ecology Notes 2006, 6, 288–295. [Google Scholar] [CrossRef]
- Kalinowski, S.T. hp-rare 1.0: a computer program for performing rarefaction on measures of allelic richness. Molecular eEcology Notes 2005, 5, 187–189. [Google Scholar] [CrossRef]
- Chapuis, M.-P.; Estoup, A. Microsatellite null alleles and estimation of population differentiation. Molecular Biology and Evolution 2007, 24, 621–631. [Google Scholar] [CrossRef]
- Nei, M. Analysis of gene diversity in subdivided populations. Proceedings of the national academy of sciences 1973, 70, 3321–3323. [Google Scholar] [CrossRef]
- Cavalli-Sforza, L.L.; Edwards, A.W. Phylogenetic analysis. Models and estimation procedures. American Journal of Human Genetics 1967, 19, 233. [Google Scholar]
- Evanno, G.; Regnaut, S.; Goudet, J. Detecting the number of clusters of individuals using the software STRUCTURE: a simulation study. Molecular Ecology 2005, 14, 2611–2620. [Google Scholar] [CrossRef]
- Kopelman, N.M.; Mayzel, J.; Jakobsson, M.; Rosenberg, N.A.; Mayrose, I. Clumpak: a program for identifying clustering modes and packaging population structure inferences across K. Molecular ecology resources 2015, 15, 1179–1191. [Google Scholar] [CrossRef]
- Schliep, K.; Potts, A.A.; Morrison, D.A.; Grimm, G.W. Intertwining phylogenetic trees and networks; 2167-9843; PeerJ Preprints: 2016.
- Paradis, E.; Schliep, K. ape 5.0: an environment for modern phylogenetics and evolutionary analyses in R. Bioinformatics 2019, 35, 526–528. [Google Scholar] [CrossRef]
- Higgins, S.I.; Lavorel, S.; Revilla, E. Estimating plant migration rates under habitat loss and fragmentation. Oikos 2003, 101, 354–366. [Google Scholar] [CrossRef]
- Neilson, R.P.; Pitelka, L.F.; Solomon, A.M.; Nathan, R.; Midgley, G.F.; Fragoso, J.M.; Lischke, H.; Thompson, K. Forecasting regional to global plant migration in response to climate change. Bioscience 2005, 55, 749–759. [Google Scholar] [CrossRef]
- Snogerup, S. The Mediterranean islands. Plant Conservation in the Mediterranean area 1985, 159–173. [Google Scholar]
- Bittkau, C.; Comes, H.P. Molecular inference of a Late Pleistocene diversification shift in Nigella s. lat. (Ranunculaceae) resulting from increased speciation in the Aegean archipelago. Journal of Biogeography 2009, 36, 1346–1360. [Google Scholar] [CrossRef]
- Runemark, H. Reproductive drift, a neglected principle in reproductive biology. 1969.
- El-Esawi, M.A.; Germaine, K.; Bourke, P.; Malone, R. Genetic diversity and population structure of Brassica oleracea germplasm in Ireland using SSR markers. Comptes rendus biologies 2016, 339, 133–140. [Google Scholar] [CrossRef]
- Maggioni, L.; von Bothmer, R.; Poulsen, G.; Härnström Aloisi, K. Survey and genetic diversity of wild Brassica oleracea L. germplasm on the Atlantic coast of France. Genetic Resources and Crop Evolution 2020, 67, 1853–1866. [Google Scholar] [CrossRef]
- Watson-Jones, S.; Maxted, N.; Ford-Lloyd, B. Population baseline data for monitoring genetic diversity loss for 2010: a case study for Brassica species in the UK. Biological Conservation 2006, 132, 490–499. [Google Scholar] [CrossRef]
- POWO. Plants of the world online. Facilitated by the Royal Botanic Gardens, Kew. Published on the Internet. 2023.
- Euro+ Med, E. Euro+ Med PlantBase–the information resource for Euro-Mediterranean plant diversity. Available online at: 2006.
- Rakow, G. Species origin and economic importance of Brassica. In Brassica; Springer: 2004; pp. 3–11.
- Kioukis, A.; Michalopoulou, V.A.; Briers, L.; Pirintsos, S.; Studholme, D.J.; Pavlidis, P.; Sarris, P.F. Intraspecific diversification of the crop wild relative Brassica cretica Lam. using demographic model selection. BMC genomics 2020, 21, 1–14. [Google Scholar] [CrossRef]
- Aguinagalde, I., Gómez-Campo, C., & Sanchez-Yelamo, M. D. A chemosystematic survey on wild relatives of Brassica oleracea L. Botanical journal of the Linnean Society 1992, 109, 57–67.
- Maggioni, L.; von Bothmer, R.; Poulsen, G.; Branca, F. Origin and Domestication of Cole Crops (Brassica oleracea L.): Linguistic and Literary Considerations1. Economic Botany 2010, 64, 109–123. [Google Scholar] [CrossRef]
- Palmgren, M.; Shabala, S. Adapting crops for climate change: regaining lost abiotic stress tolerance in crops. Frontiers in Plant Science 2024, 2, 1416023. [Google Scholar] [CrossRef]
- Batool, M.; El-Badri, A.M.; Hassan, M.U.; Haiyun, Y.; Chunyun, W.; Zhenkun, Y.; Jie, K.; Wang, B.; Zhou, G. Drought stress in Brassica napus: effects, tolerance mechanisms, and management strategies. Journal of Plant Growth Regulation 2022, 1–25. [Google Scholar] [CrossRef]
- Trunschke, J.; Junker, R.R.; Kudo, G.; Alexander, J.M.; Richman, S.K.; Till-Bottraud, I. Effects of climate change on plant-pollinator interactions and its multitrophic consequences. Alpine Botany 2024, 134, 115–121. [Google Scholar] [CrossRef]
Figure 1.
Geographical locations of the five natural populations of Brassica cretica included in this study.
Figure 1.
Geographical locations of the five natural populations of Brassica cretica included in this study.
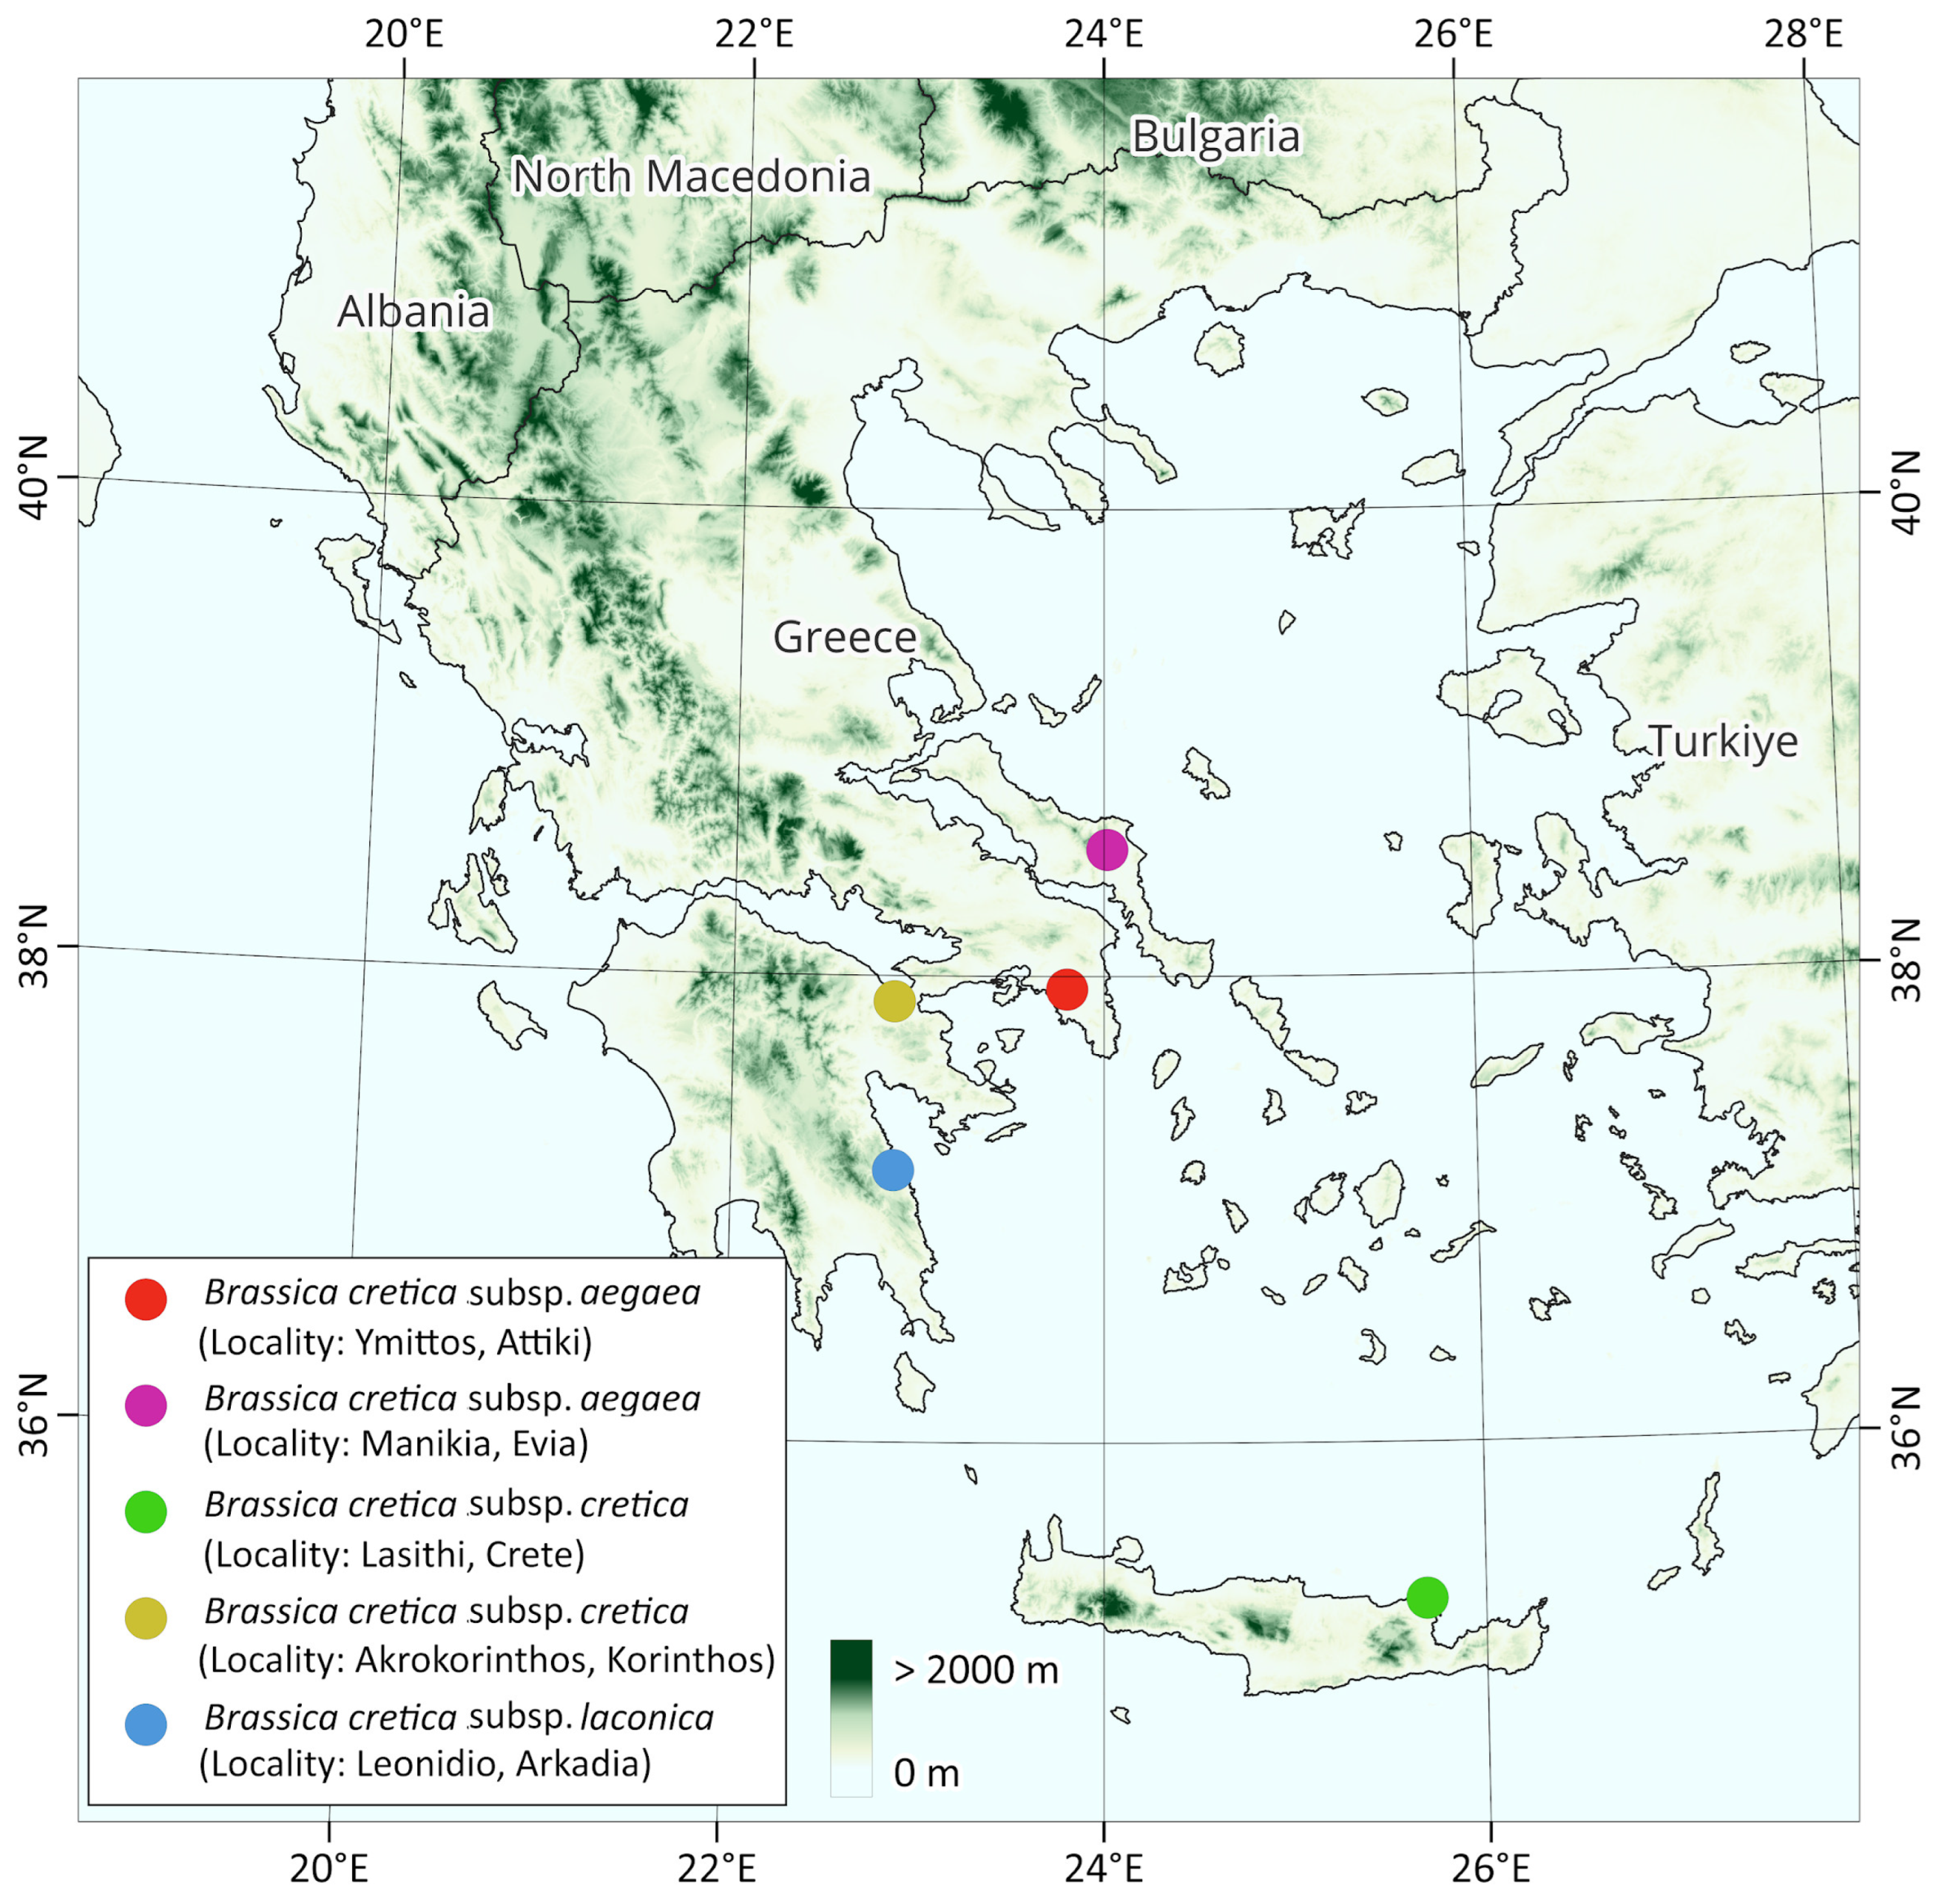
Figure 2.
Analysis of molecular variance (AMOVA) among and within five Brassica cretica populations.
Figure 2.
Analysis of molecular variance (AMOVA) among and within five Brassica cretica populations.
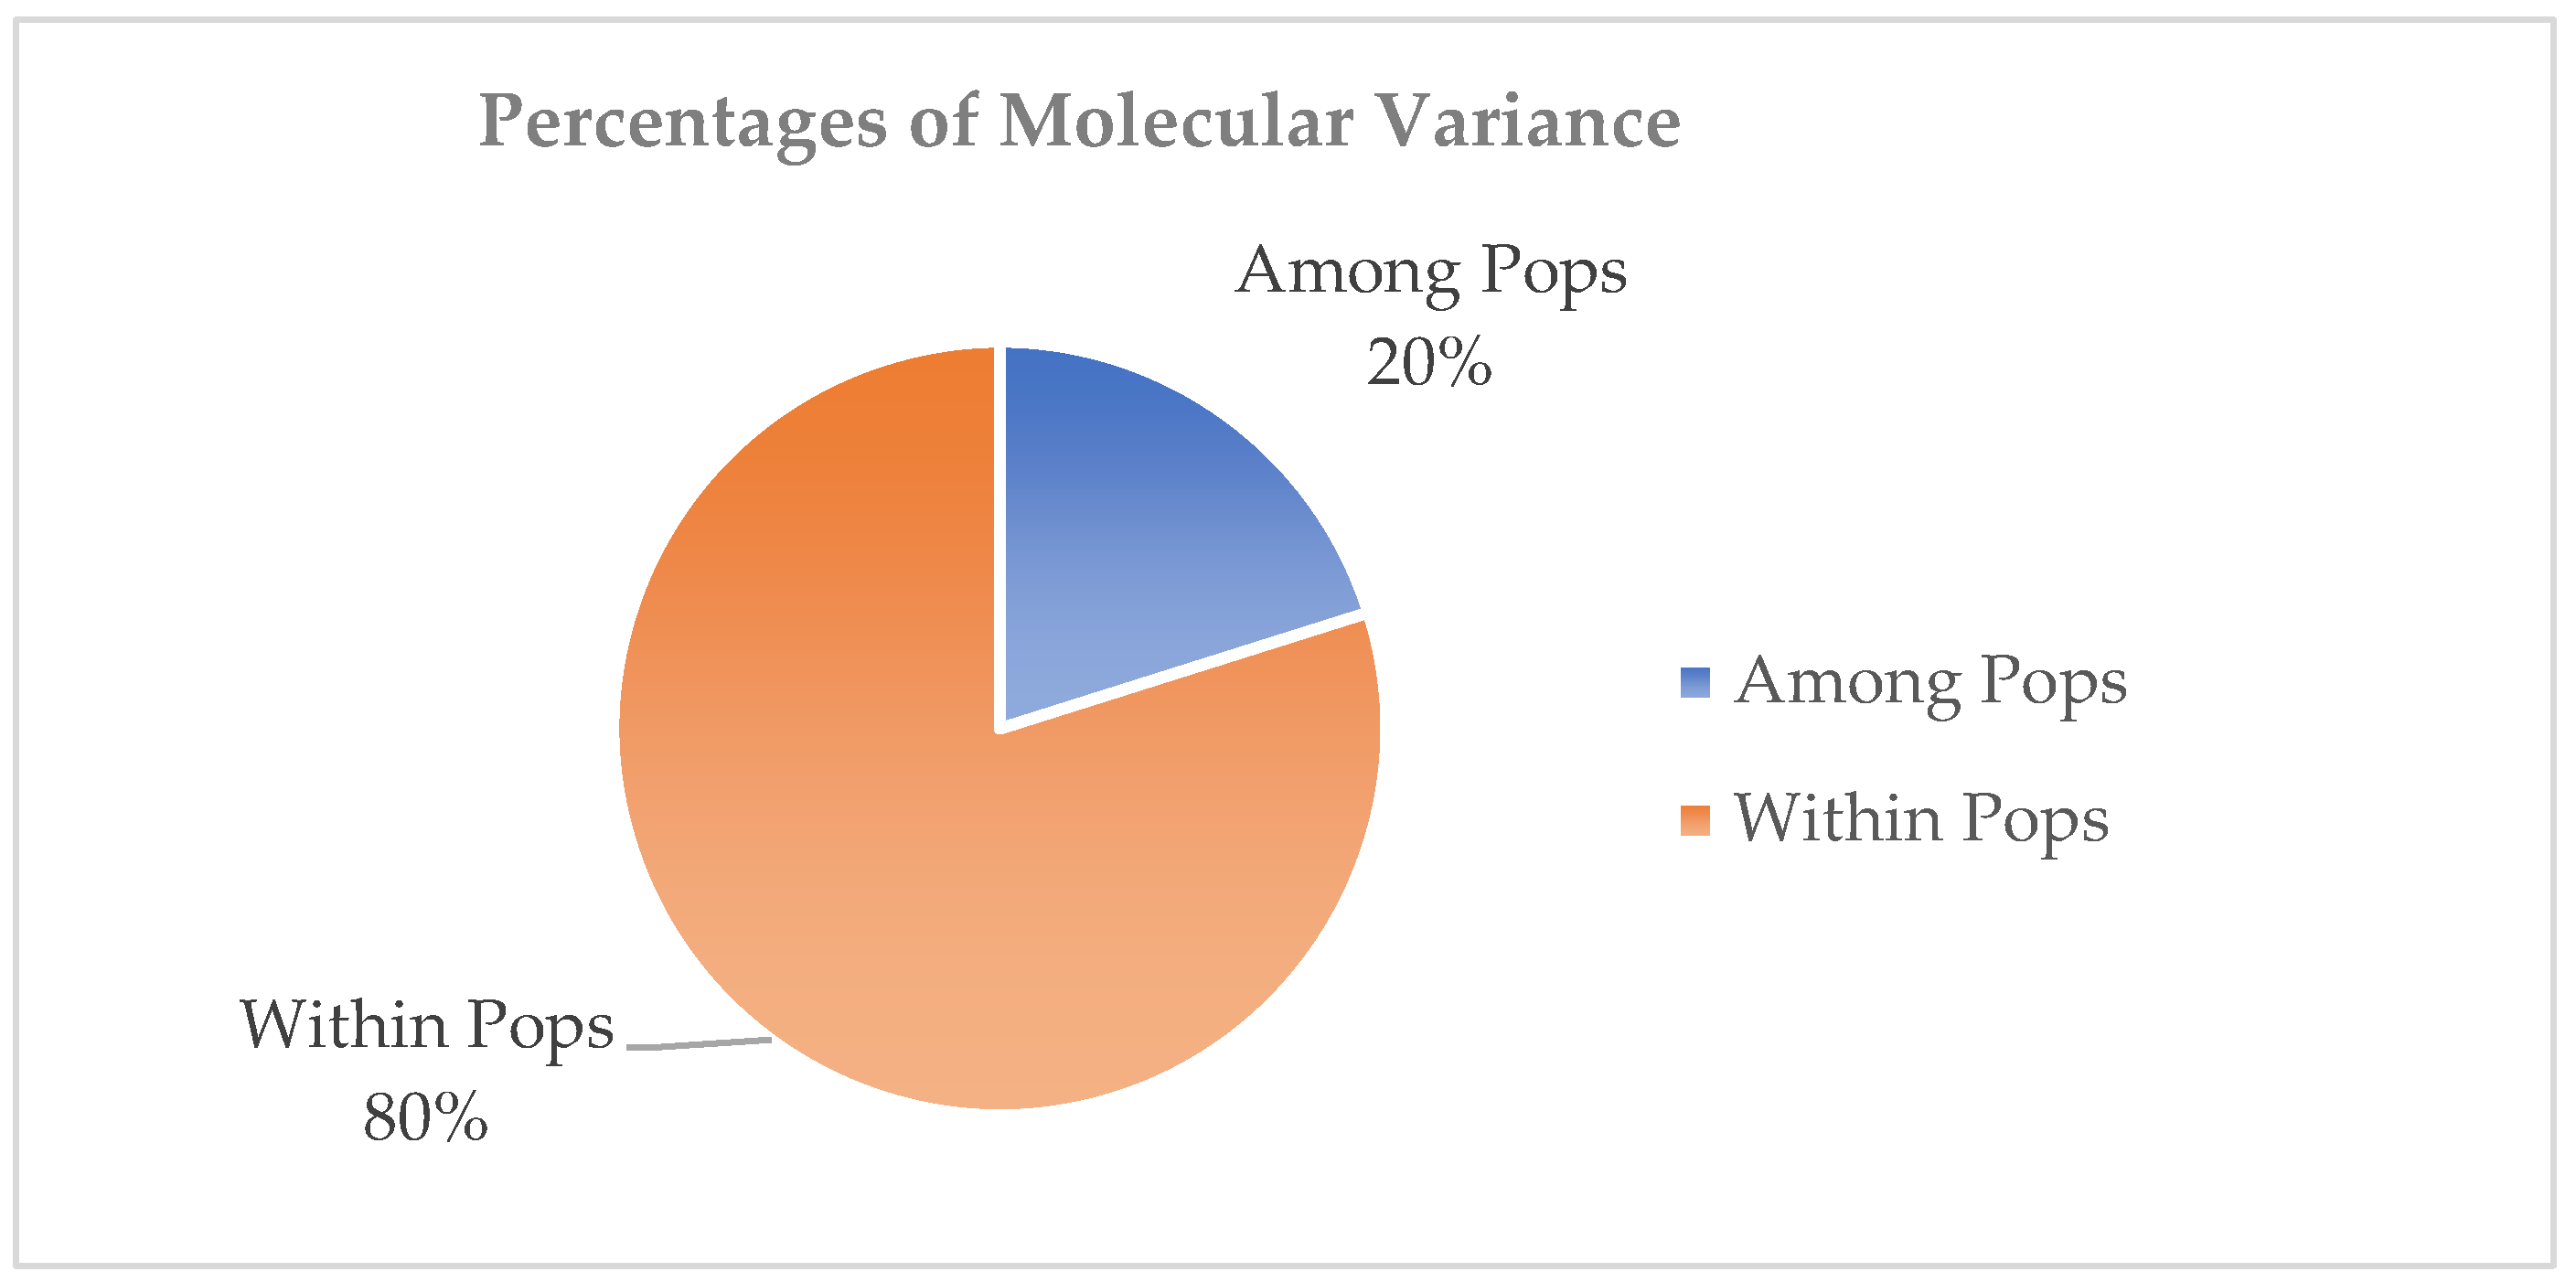
Figure 3.
Structure analysis results of studied populations when K=4.
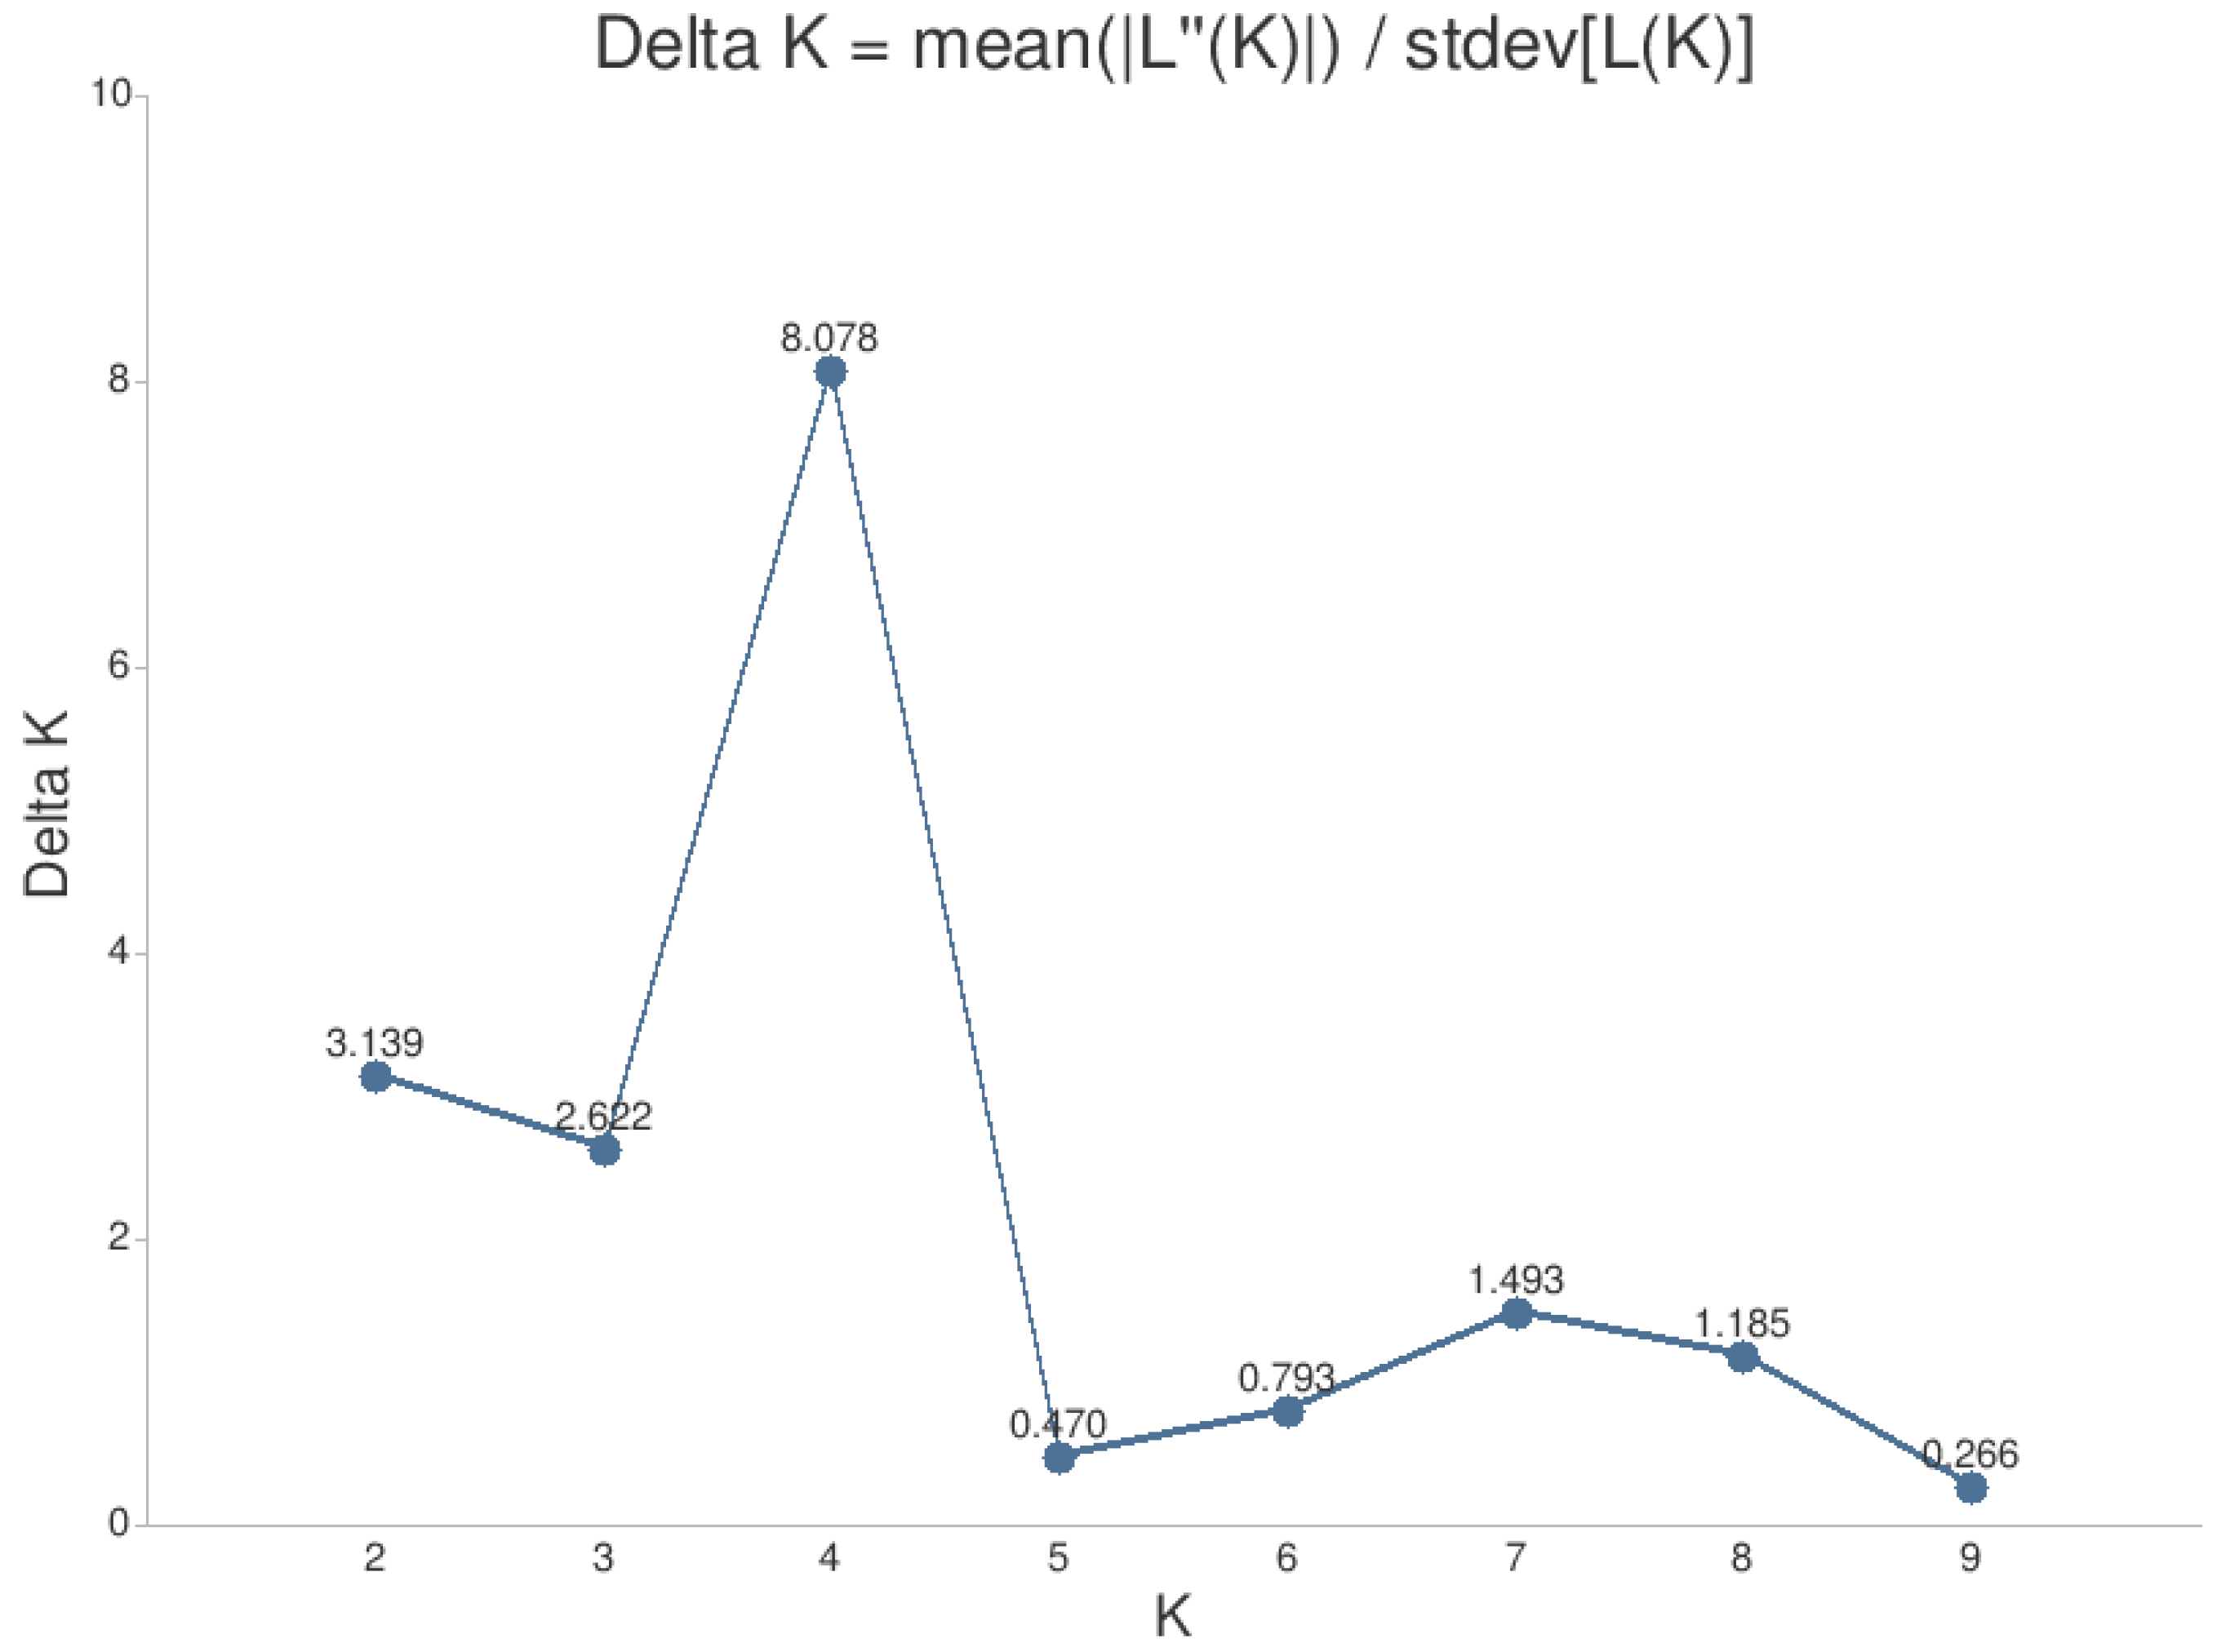
Figure 4.
Results from Structure analysis of studied populations (K=4) using Clumpak software. Population codes according to Table 1.
Figure 4.
Results from Structure analysis of studied populations (K=4) using Clumpak software. Population codes according to Table 1.
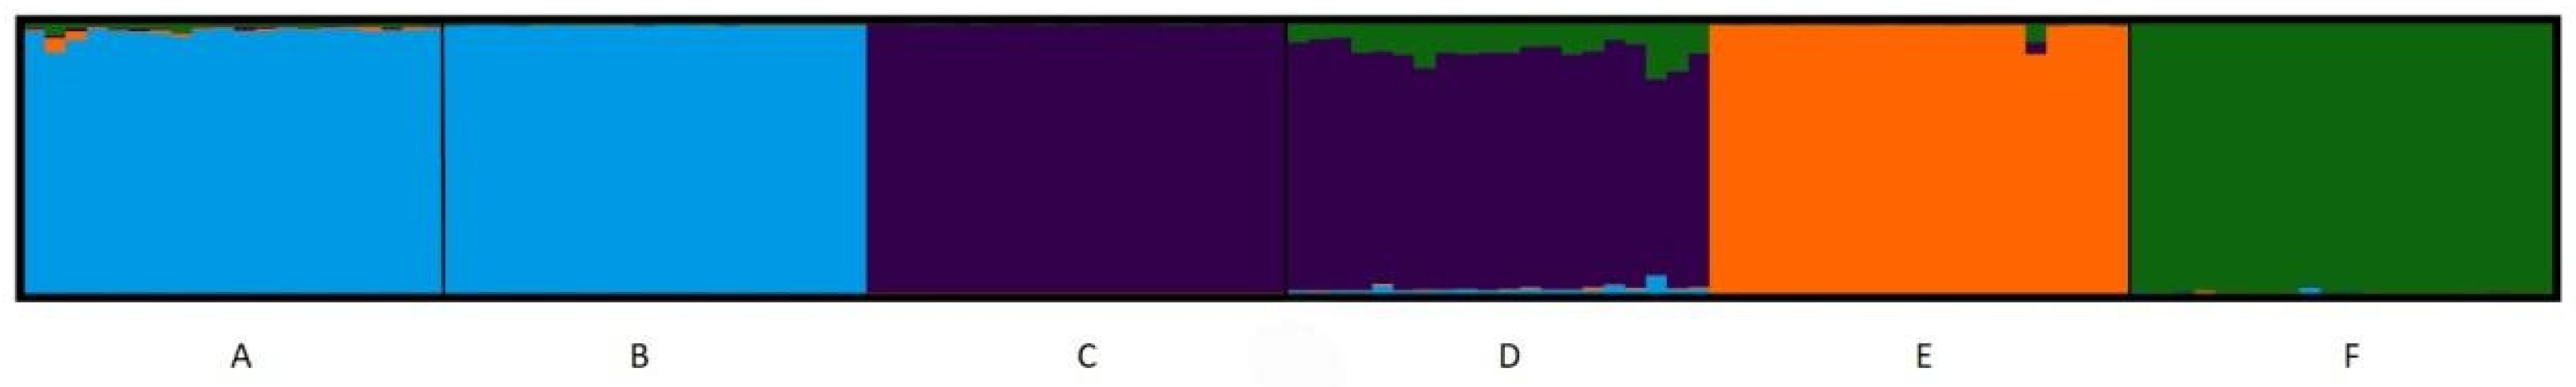

Table 1.
Collection localities of the studied populations, coordinates, and seed collection dates.
| CODE | Taxon | Locality | Country | Seed collection date | Latitude | Longitude |
|---|---|---|---|---|---|---|
| A | Brassica cretica subsp. aegaea | Manikia, Evia | Greece | June 2022 | 38ο 32.582′ | 24ο 1.052′ |
| B | Brassica cretica subsp. aegaea | Ymittos, Attiki | Greece | June 2022 | 37° 56.671′ | 23° 48.030′ |
| C | Brassica cretica subsp. cretica or nivea | Akrokorinthos, Korinthos | Greece | May 2022 | 37ο 53.363′ | 22ο 52.138′ |
| D | Brassica cretica subsp. cretica | Lasithi, Crete | Greece | May 2021 | 35ο 19.772′ | 25ο 41.458′ |
| E | Brassica cretica subsp. laconica | Leonidio, Arkadia | Greece | June 2022 | 37ο 9.940′ | 22ο 52.255′ |
| F | Brassica oleracea var Rubra | commercial variety of cabbage as outgroup |
Table 2.
Loci of populations studied, sequences of SSR primers, repeat motifs, PCR products (expected) size range (bp), and annealing temperatures (Ta) for each primer pair.
Table 2.
Loci of populations studied, sequences of SSR primers, repeat motifs, PCR products (expected) size range (bp), and annealing temperatures (Ta) for each primer pair.
| Locus | Forward & reverse primer sequences (5′→3′) | Repeat Motif | Size range (bp) | Ta (°C) |
|---|---|---|---|---|
| Ol10B11 | AAAATGTGAGGCTGTTTGGG TTTCGCAGCAGTAAACATGG |
(GA)25 | 76–180 | 52,5 |
| Ol10B01 | CCTCTTCAGTCGAGGTCTGG AATTTGGAAACAGAGTCGCC |
(GA)20 | 160–280 | 56 |
| Ol09A01 | TTCGAAGCTCATTATCGCAG CCGGGCTCTCTCTCTCTCTC |
(GA)75 | 120–340 | 56,5 |
| Ol10F11 | TTTGGAACGTCCGTAGAAGG CAGCTGACTTCGAAAGGTCC |
(GGC)7 | 139–184 | 56 |
| Ni4-B10 | GTCCTTGAGAAACTCCACCG CCGATCCCATTTCTAATCCC |
(CT)20 | 170–200 | 56 |
| sORA26 | TGTTTACCTGTTGGAGAT AACCCTAAGCATCTGCGA |
(GA)5 | 62–76 | 49 |
| BN12A | GCCGTTCTAGGGTTTGTGGGA GCCGTTCTAGGGTTTGTGGGA |
(GA)11(AAG)4 | 250–330 | 59 |
| Na10-F06 | CTCTTCGGTTCGATCCTCG TTTTTAACAGGAACGGTGGC |
(CCG)6 | 84–126 | 54,5 |
| nga111 | TGTTTTTTAGGACAAATGGCG CTCCAGTTGGAAGCTAAAGGG |
(GA)16 | 120–150 | 54,5 |
| MB4 | TGTTTTGATGTTTCCTACTG GAACCTGTGGCTTTTATTAC |
(TG)10 | 57–69 | 50 |
Table 3.
Measured parameters of ten SSR loci across populations.
| Locus | Ol10B11 | Ol10B01 | Ol09A01 | Ol10F11 | Ni4-B10 | sORA26 | BN12A | Na10-F06 | nga111 | MB4 | MEAN |
|---|---|---|---|---|---|---|---|---|---|---|---|
| Na | 27 | 30 | 32 | 19 | 19 | 18 | 18 | 16 | 20 | 20 | 21,9 |
| Ne | 3,606 | 3,985 | 4,107 | 2,489 | 2,844 | 2,759 | 2,629 | 2,413 | 2,805 | 2,859 | 3,049 |
| I | 1,374 | 1,438 | 1,418 | 0,977 | 1,081 | 1,052 | 1,005 | 0,907 | 1,082 | 1,114 | 1,145 |
| Ho | 0,075 | 0,35 | 0,308 | 0,308 | 0,175 | 0 | 0 | 0,05 | 0,017 | 0 | 0,128 |
| He | 0,720 | 0,734 | 0,705 | 0,583 | 0,638 | 0,634 | 0,61 | 0,568 | 0,631 | 0,645 | 0,647 |
Na = (total) number of alleles, Ne = number of effective alleles, I = Shannon’s information index, Ho = observed heterozygosity, He = Nei’s expected heterozygosity, Mean F-Statistics represent arithmetic averages. p<0,05.
Table 4.
Genetic diversity parameters at population level based on ten SSR loci: Na = (mean) number of alleles, Ne = (mean) number of effective alleles, I = Shannon’s information index, He = expected heterozygosity, Ho =observed heterozygosity, AR= allelic richness, pAR =private allelic richness, F =Wright’s fixation index. Mean F-Statistics represent arithmetic averages.
| Population | Na | Ne | I | He | Ho | AR | pAR | FST |
|---|---|---|---|---|---|---|---|---|
| A | 4.400 | 3.519 | 1.279 | 0.677 | 0140 | 3.69 | 0.82 | 0.808 |
| B | 3800 | 3.191 | 1.218 | 0678 | 0.095 | 3.44 | 0.86 | 0.862 |
| C | 3200 | 2.917 | 1.091 | 0645 | 0.060 | 3.05 | 0.62 | 0.886 |
| D | 3700 | 3.043 | 1.131 | 0.636 | 0.125 | 3.25 | 0.09 | 0.840 |
| E | 3.300 | 2.747 | 1.075 | 0.629 | 0.130 | 3.05 | 0.60 | 0.792 |
| F | 3500 | 2.879 | 1.075 | 0.617 | 0.220 | 3.09 | 0.72 | 0.682 |
| Mean | 3.650 | 3.050 | 1.145 | 0.647 | 0.128 | 3.26 | 0.62 | 0.812 |
Table 5.
Corrected coefficient of genetic differentiation (Fst) between populations, with INA method (above the diagonal; 0.000) and ENA method (below the diagonal) [29].
Table 5.
Corrected coefficient of genetic differentiation (Fst) between populations, with INA method (above the diagonal; 0.000) and ENA method (below the diagonal) [29].
| A | B | C | D | E | F | |
|---|---|---|---|---|---|---|
| 0.000 | 0.081 | 0.147 | 0.094 | 0.145 | 0.125 | A |
| 0.122 | 0.000 | 0.128 | 0.123 | 0.156 | 0.148 | B |
| 0.203 | 0.172 | 0.000 | 0.074 | 0. 179 | 0,177 | C |
| 0.131 | 0.175 | 0.106 | 0.000 | 0.151 | 0.129 | D |
| 0.200 | 0.212 | 0.234 | 0.212 | 0.000 | 0.154 | E |
| 0.172 | 0.199 | 0.236 | 0.179 | 0.215 | 0.000 | F |
Disclaimer/Publisher’s Note: The statements, opinions and data contained in all publications are solely those of the individual author(s) and contributor(s) and not of MDPI and/or the editor(s). MDPI and/or the editor(s) disclaim responsibility for any injury to people or property resulting from any ideas, methods, instructions or products referred to in the content. |
© 2025 by the authors. Licensee MDPI, Basel, Switzerland. This article is an open access article distributed under the terms and conditions of the Creative Commons Attribution (CC BY) license (http://creativecommons.org/licenses/by/4.0/).
Copyright: This open access article is published under a Creative Commons CC BY 4.0 license, which permit the free download, distribution, and reuse, provided that the author and preprint are cited in any reuse.


