
Submitted:
18 March 2025
Posted:
19 March 2025
You are already at the latest version
Abstract
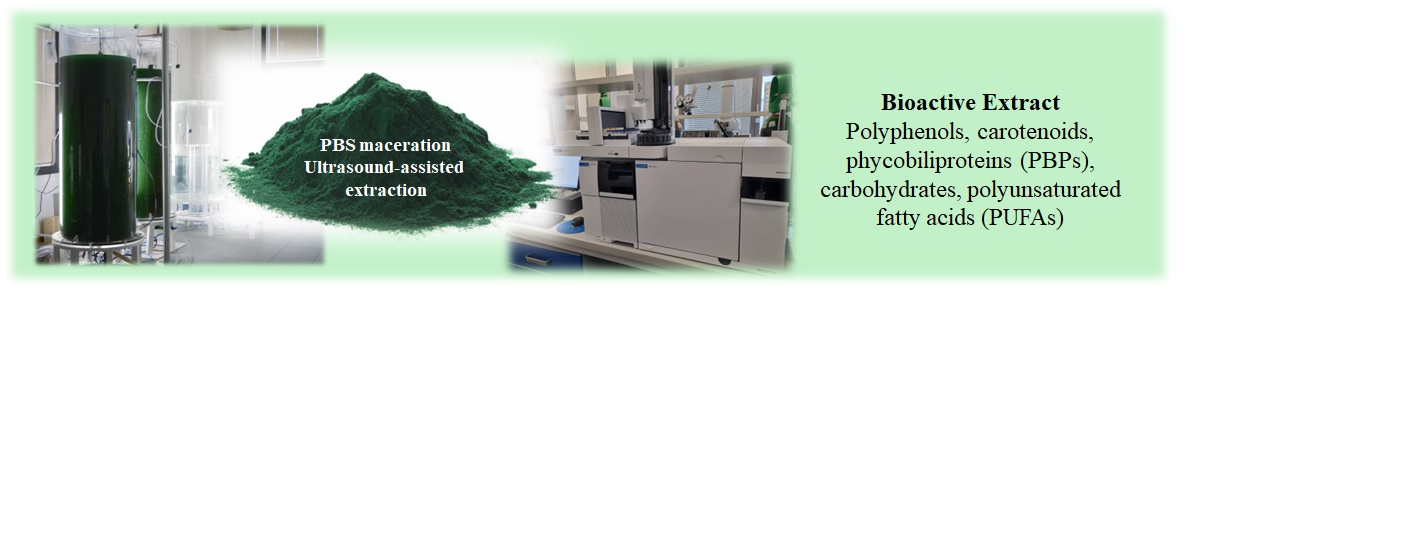
The microalgae Spirulina (Arthrospira platensis) is cultivated on a large scale, with a global production of approximately 18,000 tons year-1. Its high nutritional content and health-promoting properties have led to its establishment as a key ingredient in dietary supplements. However, the efficient extraction of its bioactive compounds remains challenging. The present study aims to develop an eco-innovative method to enhance spirulina’s antioxidant and nutritional values. The extraction protocol involved a maceration step in phosphate-buffered saline (PBS, pH 7.4) at 5 °C for 48 hours, followed by ultrasound-assisted extraction (UAE) at 400 W, 30 kHz, 30 cycles/min (with cycles of 1 sec. on/ off, for a total of six extraction cycles). This method substantially improved APC (+41.41%) and PE (+81.42%) yield. The lipid fraction exhibited an increase of 20.29%, including carotenoids (+30.84%), total fatty acids (60.48%), and polyphenols (+65.99%), allowing an increased antioxidant activity (+42.95%). On the contrary, proteins (–16.65%), carbohydrates (-18.84%), and PC (-0.77%) showed decreased recovery rates. This study provides a promising approach for extracting high-value compounds from spirulina, supporting its potential applications in the dietary supplement sector.
Keywords:
Arthrospira platensis
; biochemical compounds
; UAE
1. Introduction
Spirulina (Cyanophyceae; Arthrospira spp.) represents the most widely cultivated cyanobacteria, with over 18,000 tons of biomass produced annually, dominating the current microalgae market. The global spirulina market size reached US$ 577.0 million in 2023. The International Market Analysis Research and Consulting Group (IMARC) expects the market to reach US$ 1,287.8 million by 2032, exhibiting a growth rate (CAGR) of 9.33% during the period 2024-2032 [1,2]. Spirulina is a fast-growing, adaptable, safe, and protein-rich superfood [3] containing around 60-70% protein on a dry weight [4,5,6]. In addition, it has bioactive components with high therapeutic potential, such as polyphenols, carotenoids, phycobiliproteins (PBPs), carbohydrates, vitamins, sterols, polyunsaturated fatty acids (PUFAs), and minerals [7,8]. Accordingly, most of the world's spirulina production is intended for dietary supplements, especially in sports nutritional products, to maintain, restore, or enhance energy levels and immune function, reducing oxidative stress and improving general well-being [9,10,11]. Dietary supplements containing spirulina or its extracts are marketed in many forms, such as pills, tablets, capsules, liquids, and powders [12]. Spirulina-based products are characterized by a protective effect against exercise-induced muscle damage, reducing blood lactate dehydrogenase levels and lowering serum glucose, cholesterol, and triglyceride levels [13].
The amino acid composition of spirulina fulfills FAO nutrition requirements [14]; however, the direct use of microalgal biomass as single-cell protein (SCP) is limited in humans and animals by protein digestibility, which may be a key limiting factor in the provision of indispensable amino acids (IAAs) [3,15,16,17]. Devi et al. (2018) implemented the dual isotope method in a human study to evaluate spirulina amino acid digestibility. The authors found values ranging from 77.5% for lysine to 95.3% for phenylalanine, with a mean indispensable amino acid digestibility of 85.2% [18]. Relatively low algae amino acid digestibility could be explained by the presence of cell walls and other factors, such as the macronutrient composition, enzyme specificity, anti-nutritional factors, fiber, and varying absorptive capacities at distinct stages within the gastrointestinal tract [19,20,21,22].
Thus, the hydrolysis of covalent bonds in the cell wall matrix is recommended to facilitate the extraction of proteins and other biochemical compounds and their use in food and supplements applications, enhancing protein digestibility and solubility [23,24,25,26,27], extracting phenolics [28,29] chlorophyll a (Chl a) [30], PBPs [31,32,33], lipids and carotenoids [34,35,36]. The recoveries of the target compounds are highly dependent on the extraction conditions applied; conventional extraction relies on mechanical and chemical processes, which generally involve high production costs, long extraction times, and elevated temperatures, leading to the potential degradation of bioactive compounds, thus reducing the extracts' overall bioactivity [37,38,39,40]. These approaches often result in the co-extraction of unwanted materials, loss of selectivity, and residual solvents hazardous to human health and the environment [41,42]. These limitations highlight the need for more efficient and environmentally friendly extraction technologies that can save time and energy, using green solvents in line with ecologically sustainable strategies [43,44]. In recent years, microwave-assisted extraction (MAE) and ultrasound-assisted extraction (UAE) have shown promising potential in terms of both extraction efficiency and eco-sustainability [45,46,47,48]. UAE, thanks to the cavitation movement imparted to the solution, leads to the breaking of hydrophobic and hydrogen bonds, creating a series of microscopic channels with a sponge effect in the tissue, improving the solubility of proteins and allowing the compounds of interest to be released more efficiently [25,26,27] maintaining integrity and reducing the interference of impurities [46,49]. UAE has shown high efficiency, reduced solvent consumption, moderate extraction times and costs, and ease of management. Furthermore, it allows faster and more scalable production from the laboratory to the industry [50].
UAE technique, coupled with maceration as pre-treatment, showed increased extraction of bioactive compounds with high antioxidant activity [51,52,53,54,55,56].
The extraction yield was influenced by the target compounds’ polarity, chemical stability, solvent, temperature, and time [51,57]. Among the “green solvent,” phosphate-buffered saline (PBS, pH 7.4) is economical, non-toxic, and poses no risk of harmful residues or environmental contamination. PBS, maintaining a stable pH in the extraction environment, could prevent protein denaturation and lipid peroxidation and allow obtaining a high yield of polyphenols, phycobiliprotein, and photosynthetic pigments [13,51,58].
In this work, we investigate the biochemical composition and antioxidant activity of spirulina and extract samples to evaluate the feasibility and efficacy of the UAE technique coupled with low-temperature PBS maceration in extracting biomolecules.
2. Materials and Methods
Standards and reagents.
Methanol (MeOH), hydrochloric acid (HCl), sodium hydroxide (NaOH), and chloroform (CHCl3) were ultra-residue solvents of analytical grade purchased from Merck (Darmstadt, Germany). Sulfuric acid (at 96% and 0.5N), sodium hydroxide (NaOH) (32%, 0.5 N and 1N), phenol, KCl, CaCl2, Na2CO3, CuSO4, Na and K tartrate, Na2SO4 anhydrous, Na2HPO4, NaH2PO4, NaCl, D-glucose, α-amylase and 2, 2 diphenyl-1-picrylhydrazyl were reagent grade purchased from Sigma Aldrich (Chemie, Munich, Germany). 2-amino-2-hydroxymethyl-propane-1,3-diol (Tris) was analytic grade, purchased from BDH, UK (Copens Scientific Malaysia). The PBS solution was prepared in the laboratory by weighing 1.09 g of Na2HPO4, 0.32 g of NaH2PO4, and 9 g of NaCl, dissolving in MilliQ water till a 1 L final volume was achieved, and adjusting the pH to 7.4 with HCl (0.1M).
Double-deionized water with a conductivity of less than 18.2 MΩ was obtained with a Milli-Q system (Millipore, Bedford, MA, USA). 37 Component FAME Mix standard for GC-FID analysis was purchased from SUPLECO (595 North Harrison Road, Bellefonte, PA (16823-0048 USA), and the internal standard (IS) tritridecanoin (TAF C13:0) was purchased from Sigma Aldrich (Chemie, Munich, Germany). Thiamine Hydrochloride (B1) >98.0%, Nicotinamide (B3) >99.0%, Pyridoxine Hydrochloride (B6) >98.0% were purchased from TCI Europe N.V. (Tokyo Chemical Industry), Riboflavin (B2) 99.43% was purchased from TargetMol Chemicals Inc. (Boston, Massachusetts), Vitamin B12 ≥ 98% and L-Ascorbic acid 99% were purchased from Indagoochem (Barcelona, Spain), Folic acid (B9) 97.0 - 102.0 % was purchased from Glentham, Life Sciences Ltd (UK).
Raw material and processing.
Spirulina microalgae grown in raceway ponds were concentrated and dried in the factory following the commercial protocol (LiveGreen, Società Agricola SRL, Arborea, Oristano, Sardinia, Italy).
Dried spirulina was powdered with a porcelain mortar, and an exact amount was mixed with 300 mL of PBS (pH 7.4) with a ratio of 1:14 (w/v), according to Benedetti et al. (2006) [59] and Tavanandi et al. (2018) [60]. The suspension was mixed with a magnetic stirrer for 1 hour, macerated for 48 hours in the dark at 5 °C, and subjected to an ultrasound-assisted extraction (UAE) using an ultra-sonic GM extractor 1 (GM Solution. Cagliari. Italy). The UAE operational conditions were 30 cycles/min at 100% power (400 W, 30kHz; 1 sec. on and 1 sec. off) for 6 extractions. Every 30 cycles, the solution was allowed to stand for 1 minute. The entire process was carried out in an ice bath to avoid degradation of the target thermosensitive compounds. After centrifugation, the supernatant was collected, freeze-dried (LIO5P DIGITAL Cinquepascal srl, Trezzano sul Naviglio Milano, Italy), and weighed. The freeze-dried biomass was subjected to biochemical analysis.
Biochemical analysis.
Ashes.
0.5 grams of the sample were carbonized at 525 °C in a porcelain crucible for 8 h. Ashes were expressed as g 100 g-1 DW.
Total Proteins.
Protein content was evaluated following the Kjeldahl method [61]. 500 mg of the powdered sample was placed in a Kjeldahl flask, plus 0.5 g of Na2SO4, 10 mg of copper sulfate (CuSO4), and 20 mL of H2SO4 96%. The samples were placed in a Speed-Digester K-436 BÜCHI (Labortechnik GmbH, Essen, Deutschland) and submitted to a digestion process at 400 °C until the solution became colorless. The Kjeldahl flasks were then removed, cooled, and introduced into a distillation system VAPODEST 300 (C. Gerhardt GmbH & Co. KG, Königswinter, Germany). The apparatus automatically added 100 mL of MilliQ water and 80 mL of NaOH 32% (w/v) to the Kjeldahl flask. In the 250 mL receiving flask, 10 mL of H2SO4 0.5 N and 10 drops of methyl red indicator were manually added. After 4 minutes of distillation, the receiving flask was removed and titrated with NaOH 0.5 N. The reaction was complete when the solution changed from red to light yellow. The total protein content was calculated with the following formula and expressed as g 100 g-1 DW:
% protein = ((a − b) * c * 100 * K)/g
a: mL of H2SO4 0.5 N added to the collection flask (10 mL)
b: mL of titrant used (NaOH 0.5 N)
c: conversion factor mL of H2SO4 0.5 N in g of nitrogen (0.007)
K: general nitrogen–protein conversion factor (6.25)
g: grams of sample
Total Carbohydrates.
Carbohydrate analysis was conducted according to Dubois et al. (1956) [62]. 15 mg of the powered sample were placed in a glass tube with 5 mL of 1M HCl, subjected to sonication in a water bath for 15 minutes, and subsequently extracted in a boiling water bath at 100 °C for 1 hour. A hundred microliters of the resulting extract were combined in a glass tube with 1 mL of a 5% (w/v) phenol solution in deionized water and 5 mL of H2SO4 (95%). The mixture was gently stirred, allowed to stand at room temperature for 30 minutes, and finally measured at 488 nm using a UV–Vis spectrometer Cary 50 (Varian Inc., Palo Alto, CA, USA).
For quantification, a 5-point calibration curve of D-glucose (20 - 100 mg L−1) was prepared and considered acceptable for r2 value ≥ 0.997. This analysis was carried out in triplicate, and total carbohydrates were expressed as g D-glucose equivalents 100 g-1 DW.
Total Lipids.
Total lipids quantification was carried out according to Chen et al. (2012) [63]. 20 mg of the powered sample were suspended in 40 μL of PBS 0.05 M (pH 7.4) plus 460 μL of a NaOH 1 N/MeOH solution (75/25) and processed in the vortex for 10 min in the presence of glass beads. The obtained suspension was diluted with 1 mL of NaOH 1 N/MeOH (75/25), vortexed for 5 min, and heated (100 °C for 30 min) for saponification. The suspension was cooled to room temperature and centrifuged at 3154 × g and 10 °C for 5 min to precipitate cell debris. One mL of the supernatant was transferred to a 15 mL falcon tube, mixed with 3 mL of CHCl3/MeOH (2/1) plus 0.5 mL of a KCl solution 0.88% (w/v), vortexed, and centrifuged at 3154 × g for 10 min. 1 mL of the organic phase was transferred to a 2 mL HPLC vial and evaporated under a gentle nitrogen stream. Finally, the remaining fat residue was weighed. The analysis was done in triplicate, and total lipids were expressed as g 100 g-1 DW.
Neutral detergent fiber (NDF).
The determination of Neutral detergent fiber (NDF) was performed according to Van Soest et al. (1991) [64] by using a FIWE Advance Automatic Fiber Analyzer, VELP Scientifica, (Usmate Velate (MB), Italy). 500 mg of samples plus 0.5 g of Na2SO3 were placed in a P2 glass crucible and subjected to a 1.5-hour digestion process in the fiber analyzer using a neutral surfactant mixture (6.81 g Na2B4O7 x 10H2O + 18.61 g EDTA + 30 g C12H25NaO4S + 10 mL triethylene glycol + 4.56 g Na2HPO4 in 1000 mL of double-deionized water) plus α-amylase. The samples were dried in an oven for 4 hours (100 °C) and mineralized for 5 hours at 525 °C. This analysis was carried out in triplicate, and the concentration of NDF was calculated with the following formula expressed as g 100 g-1 DW:
% NDF = (W1 – W0) * 100 / sample (g)
W1 = Crucible weight (g) + sample weight after drying
W0 = Crucible weight (g) + sample weight after mineralization
Sample (g) = grams of sample weighted
Chl a and carotenoids.
The concentration of Chl a and total carotenoids was determined according to Singh et al. (2016) [65]. 20 mg of the sample (spirulina and extract) were weighed in a 15 mL falcon tube plus 4 mL of MeOH, vortexed for 2 min, and left in a thermostatic bath at 70 °C for 3 min. After cooling, the tubes were centrifuged at 3154× g, 10 °C for 5 min (Centrifuge 5810 R, Eppendorf AG 22,331 Hamburg) to precipitate the undissolved cell debris. The bright green supernatant was analyzed in a UV–Vis spectrometer Cary 50, Varian Inc. (Palo Alto, CA, USA) at 470, 666, and 750 nm, respectively. Chl a, and total carotenoid concentration were calculated according to Chamizo et al. (2020) [66].
Chl a mg L−1= 12.9447 (A665 − A750)
Carot mg L−1 = (4.08 × (A470 − A750) − 0.0117 × ChlA mg L−1)
Chla a mg g−1= (Chl a mg L−1x Vol Solv(L)/g Sample) × Dil
Carot mg g−1= (Carot mg L−1x Vol Solv(L)/g Sample) × Dil
Analyses were carried out in triplicate, and the final concentration of Chl a, and total carotenoids were expressed as mg 100 mg-1 DW.
Phycocyanin (Pc), Allophycocyanin (Apc), and Phycoeritrin (Pe).
10 mg of the sample (spirulina and extract) were dissolved in 4 mL of CaCl2 (1%, w v−1), according to Dianursanti et al. (2021) [67]. The solution was subjected to 3 freezing cycles at −80 °C for 1 h and subsequent thawing with warm water. The thermal shock and addition of CaCl2 promoted cell lysis and allowed the water-soluble cellular components to pass into the solution. Finally, the tubes were centrifuged at 3154 × g, 10 °C (Centrifuge 5810 R, Eppendorf AG 22,331 Hamburg) for 10 min to precipitate unwanted cellular components. The bright blue supernatant was analysed by UV–Vis spectrometer at 565, 620, 652, and 750 nm (Cary 50, Varian Inc.). Pc, Apc, and Pe concentrations were calculated according to Zavřel et al. (2018) [68].
Pc mg mL−1 = (((ABS620 − ABS750) − 0.474 × (ABS652 − ABS750))/5.34
Pc% = (Pc mg mL−1 x Vol Solv(L) mg S-1) × 100 × DF
Apc mg mL−1 = ((ABS652 − ABS750) − 0.208 × (ABS620 − ABS750))/5.09
Apc% = (Apc mg L−1 x Vol Solv(L) mg S-1) × 100 × DF
Pe mg L−1 = ((ABS565 − ABS750)– 2.41 × (PC mg mL−1) – 0.849 × (APC mg mL−1))/9.62
Pe% = (Pe mg L−1 x Vol Solv(L) mg S-1) × 100 × DF
S= sample; DF= dilution factor.
Analyses were carried out in triplicate, and the final concentration of Pc, Apc, and Pe were expressed as mg 100 mg-1 DW.
Total polyphenols
The total polyphenolic content was determined using the Folin–Ciocalteu reagent method, according to Manconi et al. (2016) [69]. 10 mg of samples were placed in a 15 mL falcon tube with 10 mL of methanol. The tubes were shaken for 1 minute and were subjected to an ultrasound-assisted extraction (UAE) at 100% power (400 W, 30 kHz; 1 sec. ON and 1 sec. OFF) for a total extraction time of 3 min. Finally, the samples were centrifuged at 3154 × g at 10 °C for 15 minutes (Centrifuge 5810 R, Eppendorf AG 22,331 Hamburg). 100 µL of the extract solution were transferred into a 15 mL falcon tube containing 100 µL of the Folin-Ciocalteu reagent. The falcon was vortexed for one minute, and 400 µL of a sodium carbonate solution (20% w/v) were added. The mixture was then agitated and incubated for 60 min at room temperature in the dark. Quantitative analyses were carried out with a UV–Vis spectrometer set at 765 nm (Cary 50, Varian Inc., Palo Alto, CA, USA). A 7-point calibration curve of Gallic acid (2.5-200 µg mL−1) was prepared and considered acceptable with r2 ≥ 0.997 for the quantification. Analyses were carried out in triplicate, and total polyphenols were expressed as mg gallic ac. Eq. g-1 DW.
Fatty acid extraction and GC-MS analysis
Fatty acids were extracted according to Breuer et al. (2013) [70]. Briefly, 50 mg of the powdered sample were dissolved in 4 ml of a CHCl3/MeOH solution (4:5, v/v) containing tritridecanoin acid (50 mg L-1) as the IS in a 15 ml falcon (F1). 2.5 mL of MilliQ water containing 50 mM of 2-amino-2-hydroxymethyl-propane-1,3-diol (Tris) and 1 M NaCl solution were added, with a pH adjusted to 7.0 using an HCl solution. The sample was vortexed for 5 min in the presence of glass beads, immersed in an ultrasonic bath with ice for 10 min., and centrifuged at 3154 × g at 15°C for 5 min. Once the phases were separated, the CHCl3 in the bottom phase was transferred to a 12 mL glass tube. The residual sample was re-extracted with 1 mL of CHCl3, vortexed for 5 min, and centrifuged at 3154 × g at 15°C for 5 min. The CHCl3 phase was collected and added to the glass tube. Finally, all CHCl3 phases were combined and brought to dryness under a nitrogen flow. The transesterification of fatty acids was conducted by adding 3 mL of a methanol solution containing 5% (v/v) sulfuric acid. The solution was placed on a thermostatic plate at 70 °C for 3 h, with a 30 s vortex every 30 min. After cooling the sample, 3 mL of MilliQ water and 3 mL of hexane were added and vortexed for 1 min, then centrifuged at 3154 × g at 15°C for 5 min. 1 mL of hexane containing the fatty acid methyl esters was transferred in a 2 mL amber vial and analysed with an Agilent 8860 Gas Chromatograph (GC) (Agilent Technologies, Santa Clara, CA, USA) coupled with a 5977C GC/MSD Detector. The column was an HP-5ms Ultra Inert (Agilent GC Column, 30 m x 0.25 mm, and 0.25µm thickness). The injector was set at 250°C. He was the carrier at a flow rate of 1.5 mL min-1, and the injection volume was 1 μL, with a split ratio 1:2.
The oven temperature gradient was T=0 50°C (4 min), T=26 160°C (5°C/min), T=76 210°C (1°C/min), and T=93,5 280°C (4°C/min). The transfer line was set at 280°C. Ions were generated at 70 eV with positive EI and recorded at 1.5 scans s−1 over 50 to 550 m z−1. The electromultiplier was set at 1162 volts. The analysis was conducted in triplicate.
The content of each fatty acid (mg fatty acid g-1 DW) was determined using the following formula [70]:
FA mg/g = (IS mg sample-1)*{(Area of individual FAME)/[(Area of C13:0 FAME(IS)*Rel.Resp.Factor individual FAME)]}/(biomass (g))
The concentration of the IS mg sample-1 was calculated with the following formula:
IS mg sample-1 = 0.004 L*[IS]*(3*MW FA C13:0)/(MW TAF C13:0)
[IS]: 50 mg L-1; MW FA C13:0: 214. 34; MW TAF C13:0: 684,08.
The relative response factor of individual FAME was calculated with the following formula:
Rel. Resp. Factor individual FAME = (conc. C13:0 FAME in calibration sol./conc. individual FAME in calibration sol.)*(Area of individual FAME in calibration sol./Area of C13:0 FAME in calibration sol.)
DPPH method
2, 2 diphenyl-1-picrylhydrazyl (DPPH) test was carried out as described by Manca et al. (2015) [71]. Total polyphenol samples were mixed with a DPPH methanolic solution (25 μM) at a ratio of 1:50. After 30 min of incubation in the dark at room temperature, the absorbance was measured at 517 nm in a UV–Vis spectrophotometer (Cary 50, Varian Inc.). A 5-point calibration curve Trolox (0.025 – 1 mM) was prepared and considered acceptable for r2 value ≥ 0.997 for quantification.
The test was carried out in triplicate, and the antioxidant activity was expressed as mg Trolox equivalents g-1 DW.
Water-soluble vitamins
The water-soluble vitamin extraction and analysis were carried out according to Rakuša (2021) with minor changes [72]. Samples were prepared at a concentration of 20 mg mL-1 in 0.5% glacial acetic acid. The mixture was homogenized by vortex for 1 min, sonicated in an ice bath for 10 min, kept for 10 min at 5 °C in the dark, and centrifuged at 3154 × g at 15 °C for 10 min. The solution was filtered with a 0.45 µm nylon filter just before injection.
The separation was carried out in ultra-high performance liquid chromatograph UHPLC Infinity II (Agilent Technologies, Santa Clara, CA, USA), equipped with a diode array detector (DAD), on reversed-phase Infinity Lab Porspshell 120 EC-C18, 3.0 x 150 mm, 2.7 μm, 1000 bar Agilent settled at 20 °C. The mobile phase consisted of A: 25 mM NaH2PO4·H2O, and B: methanol, with the following gradient T= 0 97% A, T= 9 85% A, T = 10 80% A, T = 20 75% A, T = 30 45% A, post-run 10 min. The flow rate was 0.3 mL min−1, and the injection volume was 10 μL. UV-vis detection was made at 246 nm (B1), 290 nm (B2), 260 nm (B3), 210 nm (B6), 268 nm (B9), 362 nm (B12), and 244 nm (C). Vitamins were identified by comparing retention time and UV-vis spectra. Stock standard solutions of the single vitamins were prepared in dark volumetric flasks with concentrations around 1000 mg L-1 in 0.1 M EDTA (chelating agent, stabilizer) and stored at 5 °C. Vitamin B9 was prepared in NaOH 1 mM due to its low water solubility. Calibration curves were prepared by diluting the intermediate working standards solution at 100 mg L-1 in 0.5% (v/v) glacial acetic acid before use. A 5-point calibration curve (0.25 - 5 mg L−1) was prepared and considered acceptable with an r2 value ≥ 0.997. Glacial acetic acid was used to improve the solubility of vitamins, facilitate their separation from other components, and prevent the degradation of sensitive vitamins (B1 and B2).
Statistical analysis
One-way analysis of variance (ANOVA) was performed using a set of data of carbohydrate, lipid, fatty acid, protein, NDF, ash, chlorophyll, carotenoids, phycocyanin, allophycocyanin, phycoerythrin, total polyphenols, B3 vitamin, and DPPH assay considering matrices (spirulina vs extract) as a source of variation. Before performing the ANOVA test, the homogeneity of variance was confirmed with Cochran’s test. The statistical analyses were conducted using STATGRAPHICS PLUS 5.1 professional edition (Statistical Graphics Corp., Rockville, MD, USA).
3. Results
The biochemical analysis of spirulina and extracts showed statistical differences in the macronutrients (Table 1). After the extraction step, total carbohydrates accounted for 12.63 ± 6.06, protein for 52.23 ± 0.50, lipids for 6.21 ± 5.61, fiber for 0.35 ±8.70, and ash for 18.55 ± 0.64 g 100 g-1 (mean ± RSD% DW) with yields for proteins and carbohydrates around 80%. The lipid and ash fractions were enriched (120% and 220%), whereas fiber was only 10% (Table 1). During extraction, carbohydrates and proteins were only partially recovered (81.16% and 83.35%, respectively). On the other hand, lipids increased by 20.29%, whereas NDF showed a decrease of almost 90% (Table 1).
Total carotenoid and Chl a showed a higher value in the extracts (Table 2). APC (4.58 ± 5.16 mg 100 mg-1 ± RSD% DW) and PE (1.20 ± 4.33 mg 100 mg-1 ± RSD% DW) were higher in the extract, whereas PC concentration showed no significant differences (P >0.05) between spirulina and extract (Table 2).
Total polyphenols concentration was 5.94 ± 2.05 and 9.86 ± 5.64 (mg gallic ac. eq. g-1 ± RSD%) (p < 0,001), in spirulina and extract, respectively (Table 2) DPPH assay showed a higher value in the extract concerning spirulina (21.10 ± 4.58 vs 14.76 ± 6.40, mg Trolox eq g-1 ± RSD%) (Table 2).
The vitamin B group (B1, B3, B2, B6, B9, and B12) and vitamin C were investigated in spirulina and extracts; however, only B3 was detected with values almost half in the extract (1.54 ± 3.10 mg 100 g-1± RSD %) compared to spirulina (3.49 ± 5.04 mg 100 g-1 ± RSD %) (Table 2).
Total fatty acid showed an increase of almost 60% in the extract. The fatty acid profile was characterized by palmitic acid which was the most abundant in both extract and spirulina, accounting for 16.05 ± 8.90 and 10.45 ±10.75 (mg g-1 ± RSD % DW) (p<0.05), followed by LA (C18:2 n-6), which accounted for 11.51± 8.29, and 6.90 ± 6.63 (mg g-1 ± RSD % DW), in the extract and the spirulina (p<0.01), respectively (Table 3). Among saturated fatty acids (SFA), myristic acid and stearic acid showed lower values. The most abundant monounsaturated fatty acid (MUFA) was oleic acid (C18:1 n-9), followed by palmitoleic acid (C16:1). Among polyunsaturated (PUFA), γ-Linolenic acid (GLA, C18:3 n-6) showed interesting values.
Statistical data demonstrated significant differences in the concentration (mg g-1) between the extract and spirulina (P < 0.05 to < 0.01), except for stearic acid (P > 0.05). Palmitoleic acid, γ-linolenic acid (GLA), and cis-linoleic acid (LA) increased by almost 47%, 42%, and 40%, respectively.
The total SFA, PUFA, and MUFA were statistically higher in the extracts. The PUFA/SFA rate showed a statistical difference between groups, while MUFA/SFA and PUFA/MUFA rates did not change (Table 3).
4. Discussion
The biochemical composition of Arthrospira platensis obtained in this paper (Table 1) agreed with the literature data, which reported high levels of protein accounting for 55-70% DW, lower levels of carbohydrates (15 to 25% DW), and lipids (3 to 9% of DW) [73,74]. After the extraction step, total carbohydrate recovery showed lower values (81.16%) in comparison to the values reported by Liu et al. (2019) [75], who employed an ultrasound-assisted extraction (UAE) pre-treatment (500 W for 10 minutes) followed by hot water extraction (80 °C) improving polysaccharide solubilization and achieving a recovery rate of 84.09%. Our approach involves using milder heat conditions and UAE time, minimizing the risk of thermal degradation, and preserving the nutritional integrity of the extract [76]. On the contrary, our findings showed higher values than Lupatini et al. (2017) [77], who reported carbohydrate and protein recoveries ranging from 41.52%-75.56%, using more challenging extracting conditions, 35 min sonication at 37 kHz (100% power) followed by 50 min agitation under alkaline conditions (pH 9) at 30 °C. The incomplete carbohydrate recovery observed in our study can be attributed to several factors, such as the cell wall being predominantly composed of insoluble carbohydrates (glucan and peptidoglycan polymers), which form a multilayered structure stabilized by amino acid residues by bridging the carbohydrate chains and making extraction difficult [78]. In addition, the presence of uronic acids and extracellular polymeric substances (EPS) tends to result in the formation of gels or aggregates that are more resistant to solubilization than intracellular polysaccharides. Finally, glycogen's solubility is influenced by the type of solvent, extraction temperature, pH, and extraction time [79].
Purdi et al. (2023) [20] reported high protein recoveries of 76.83% working with UAE; our data (83.35%) confirmed UAE's ability to extract proteins from the matrix effectively. According to studies on pecan and lupin proteins, higher recoveries could be assigned to the capacity of the extraction process in effectively broken hydrophobic and hydrogen bonds, releasing water-soluble protein [25,26,27].
The unusually high ash values can be explained by considering the salt added when extracting with the PBS solution.
The lipid content (5.16 g 100 g−1 DW) agrees with the literature data, which reported values ranging from 4.10 to 7.45% [80]. The complete breaking of the cell wall determined significantly higher lipid concentration in the extract, which increased by 20.29% [34,35,36]. This phenomenon is due to the UAE cavitation, which causes modifications in the structure and morphology of the cell wall, making it porous and breaking the NDF microstructure (hemicellulose, cellulose, and lignin), allowing a higher extraction efficiency of the process together with a decreased recovery of NDF (10.48%) [75].
The fatty acid profile of spirulina is mainly characterized by palmitic (45%), linoleic, and γ-linolenic acid (GLA) (20%), which is the precursor of prostaglandins [81,82,83,84]. Our data confirmed this composition, even if the absolute amounts were not comparable due to the different quantification methods.
The higher lipid amount in the extracts could explain the higher values of fatty acids, which showed an increase of almost 60%, with values consistent with literature data. The extraction process has been demonstrated to impact the PUFA/SFA ratio selectively, resulting in a safer fatty acid composition.
Cyanobacteria synthesizes chlorophyll a (Chl a) similarly to higher plants [85]. Chl a content is modulated by several environmental parameters, light intensity, and nutrient availability, with nitrogen playing a critical role [86]. Reported Chl a concentration ranged from 0.5 to 1.1 mg 100 mg-1 dry weight (DW) [87,88], representing approximately 9-12% of the lipid fraction [89].
Literature data confirmed the adaptability of spirulina in different environmental conditions, such as temperature, irradiance, and nutrient availability, enabling optimized composition based on environmental conditions. [34,35,36].
In the present study, the Chl a concentration in the spirulina samples (0.49 mg 100 mg-1 DW) was like the results of Orthesin et al. (2024), which extracted Chl a using a 90% methanol-based microwave-assisted extraction (MAE) protocol (40 W irradiation for 5 min), obtaining a maximum yield of 0.50 mg 100 mg-1 DW [87]; however, in our extracts obtained with UAE the value was higher 0.64 mg 100 mg-1 DW. Conversely, Park et al. (2018) reported lower values for spirulina (0.26 and 0.47 mg 100 mg-1 DW) after acetone extraction with three consecutive 10-min sonication cycles, according to the results of Orthesin, who reported lower extraction efficiency of acetone vs methanol [90].
Choi et al. (2017) reported values almost three times higher for Arthrospira maxima extracted with ethanol solution (70%) at 80 °C for 24 hours (1.38 mg 100mg-1 DW) and ethanol solution (70%) at 40 °C for 4 hours by UAE at 40 kHz (1.80 mg 100 mg-1 DW) [91]. The UAE method allowed an increase in Chl a of 31%, comparable to levels obtained in our experiment (30.61%).
Phycobiliprotein extraction values agreed with literature data, which reported that phosphate-buffered saline (PBS) preserves the native structure and stability of phycobiliproteins, and ultrasound-assisted extraction (UAE) has proven effective in extracting these compounds while avoiding their degradation [31,32,33,92]. Chia et al. (2020) [93], reported PC and APC recoveries of –4.9% and -38%, respectively, from spirulina using UAE (30% amplitude, 5 s ON-5s OFF, 10 min sonication) assisted with liquid biphasic flotation (LBF)(100 cc/min air flowrate, 7 min flotation time). Similarly, Obeid et al. 2025 reported values of –5% PC recoveries by UAE (12 kHz and 200W) and membrane filtration (10 kDa-cutoff membranes) [94]. Our data showed higher recoveries, accounting for -0.77 % and +41.41% for PC and APC, respectively. Rodrigues et al. (2018), using UAE at 25 kHz, 25 °C for 30 min with ionic liquids at pH 6.5, reported an extraction order of APC > PC > PE; our experiments showed a different yield series PE > APC > PC, this fact could be attributed to the differences in the extraction conditions [95].
da Silva et al. (2017) [96] reported concentrations of total polyphenols in the methanol extract, obtained through UAE technology, of 2.07 ± 0.01 mg gallic acid eq. g-1 DW, whereas El-Baky et al. (2009) [97] reported values between 4.51 and 16,96 mg gallic acid eq. g⁻¹ DW, when spirulina is grown in different salinity mediums after extraction by sonication with ethanol at 4 °C. Our experiment found important values of total polyphenols, which increased by almost 70% in the extracts.
The DPPH result (21.10 ± 4.58 mg Trolox eq. g-1 DW) agreed with that of Seghiri et al. (2019) [98], who found that the antioxidant activity of the spirulina methanolic extracts was 23 mg Trolox eq. g-1 DW. The increase in antioxidant activity is usually linked to a synergistic effect of the components of the antiradical pool [99,100,101]. The enhancement in antioxidant activity in our samples can be attributed to the increased concentrations of polyphenols, phycobiliproteins, and carotenoids in the extract.
Literature data reported high levels of vitamin B12 analogs and substitutes, vitamin B complex, and fat-soluble pro-vitamins A, K, and E for Arthrospira spp [6,10]; however, in our study, we detected only vitamin B3. Strain, cultivation system, environmental conditions, and processing techniques can affect the preservation and concentration of vitamins in Spirulina [87]. The lower values found in the extracts can be attributed to the UAE, which, creating localized heat and free radicals, can affect the concentration of heat or shear-sensitive compounds, such as vitamins [88].
5. Conclusions
The combined use of ultrasonic extraction (UAE) and maceration in PBS proved to be effective in extracting bioactive compounds, including phenols, pigments (Chl a, carotenoids, and phycobiliproteins), and essential fatty acids, which greatly enhance the antioxidant properties of the extract. The process showed acceptable performance in extracting total proteins and carbohydrates, confirming UAE’s feasibility in being effective in biochemical compound extraction. The obtained extracts showed an interesting composition for use as a food supplement for athletes and bodybuilders, where the high protein content could be beneficial for muscle recovery or in low-carbohydrate or ketogenic diets. The potential benefits of the extract include support for muscle mass maintenance and improvement in glycemic management in individuals with insulin resistance or type 2 diabetes, attributable to its favorable PUFA/SFA ratio. Natural antioxidants are considered one of the more valuable therapeutic agents for reducing illnesses triggered by oxidative stress. The antioxidant effects of the extract could positively impact inflammation, performing a preventive role in protecting against the generation of free radicals.
Author Contributions
Conceptualization: Massimo Milia, Piero Addis; Methodology: Massimo Milia; Software: Viviana Pasquini; Validation: Massimo Milia, Viviana Pasquini; Formal analysis: Massimo Milia; Investigation: Massimo Milia, Alberto Angioni; Resources: Alberto Angioni; Data curation: Alberto Angioni, Massimo Milia; Writing—original draft preparation: Alberto Angioni, Massimo Milia; Writing—review and editing: Alberto Angioni; Supervision: Piero Addis; All authors have read and agreed to the published version of the manuscript.”
Funding
The research received no external funding.
Data Availability Statement
The raw data supporting the conclusions of this article will be made available by the authors upon request.
Acknowledgments
This work has been developed within the framework of the project National Operational Program Research and Innovation 2014-2020 (CCI 2014IT16M2OP005), ESF REACT-EU resources, Action IV.4 "PhDs and research contracts on innovation topics" and Action IV.5 "PhDs on Green topics" (cod. DOT1404000-2), Cod. CUP F21B21005120007 is also acknowledged.
Conflicts of Interest
The authors declare no conflicts of interest.
References
- Spirulina Market Report by Species (Arthrospira Platensis, Arthrospira Maxima), Form (Powder, Tablet and Capsule, Liquid, Granule and Gelling Agent), Distribution Channel (Business to Business, Business to Consumer), Application (Nutraceuticals, Food and Beverages, Cosmetics, Animal Feed, and Others), and Region 2024-2032. Report ID: SR112025A3535. www.imarcgroup.com/spirulina-market, (accessed on 11 March 2025).
- Lafarga, T.; Sánchez-Zurano, A.; Villaró, S.; Morillas-España, A.; Acién, G. (2021). Industrial production of spirulina as a protein source for bioactive peptide generation. Trends Food Sci Technol, 2021, 116, 176-185. https://doi.org/10.1016/j.tifs.2021.07.018.
- Rehman Shah, M.A.; Zhu, F.; Cui, Y.; Hu, X.; Chen, H.; Kayani, S.I.; Huo, S. Mechanistic insights into the nutritional and therapeutic potential of Spirulina (Arthrospira) spp.: Challenges and opportunities. Trends Food Sci Technol 2024, 151, 104648. [Google Scholar] [CrossRef]
- Saraswathi, K.; Kavitha, C.N. Spirulina: Pharmacological Activities and Health Benefits. J Young Pharma 2023, 15, 441–447. [Google Scholar] [CrossRef]
- Seyidoglu, N., Inan, S., Aydin, C. A prominent superfood: Spirulina platensis. In Superfood and functional food - The development of superfoods and their roles as medicine. Shiomi, N., Waisundara, V., Eds. IntechOpen, 2017, 12, pp. 1-27. doi:10.5772/66118.
- Gutierrez-Salmeán, G.; Fabila-Castillo, L.; Chamorro-Cevallos, G. Nutritional and toxicological aspects of Spirulina (Arthrospira). Nutr. Hosp. 2015, 32, 34–40. [Google Scholar] [CrossRef]
- Wu, J.Y.; Tso, R.; Teo, H.S.; Haldar, S. The utility of algae as sources of high-value nutritional ingredients, particularly for alternative/complementary proteins to improve human health. Front. Nutr. 2023, 10, 1277343. [Google Scholar] [CrossRef]
- Sorrenti, V.; Castagna, D.A.; Fortinguerra, S.; Buriani, A.; Scapagnini, G.; Willcox, D.C. Spirulina microalgae and brain Health: A scoping review of experimental and clinical evidence. Mar. Drugs 2021, 19, 293. [Google Scholar] [CrossRef]
- Goncalves Bortolini, D.; Maciel, G.M.; de Andrade Arruda Fernandes, I.; Pedro, A.C.; Vieira Rubio, F.T.; Guiherme Branco, I.; Haminiuk, C.W.I. Functional properties of bioactive compounds from Spirulina spp.: Current status and future trends. Food Chem: Mol Sci 2022, 5, 100134. [Google Scholar] [CrossRef]
- Frenandes de Carvalho, L.; Botelho Moreira, J.; Souza Oliveira, M.; Vieira Costa, J.A. Novel food supplements formulated with Spirulina to meet athletes’ needs. Braz. Arch. Biol. Technol. 2018, 61, e17160656. [Google Scholar] [CrossRef]
- Bastos de Freitas, B.C.; Duarte Santos, T.; Botelho Moreira, J.; Zanfonato, K.; Greque de Morais, M.; Vieira Costa, J.A. Novel foods: A meal replacement shake and a high-calorie food supplemented with Spirulina biomass. Int. Food Res. J. 2019, 26, 59–65. [Google Scholar]
- Lafarga, T.; Fernández-Sevilla, J.M.; González-López, C.; Acién-Fernández, F.G. Spirulina for the food and functional food industries. Food Res. Int. 2020, 137, 109356. [Google Scholar] [CrossRef]
- Nikolova, K.; Petkova, N.; Mihaylova, D.; Gentscheva, G.; Gavrailov, G.; Pehlivanov, I.; Andonova, V. Extraction of Phycocyanin and Chlorophyll from Spirulina by “Green Methods”. Separations 2024, 11. [Google Scholar] [CrossRef]
- Lupatini, A.L.; Colla, L.M.; Canan, C.; Colla, E. Potential application of microalga Spirulina platensis as a protein source. J. Sci. Food Agric. 2017, 97, 724–732. [Google Scholar] [CrossRef] [PubMed]
- Becker, E.W. Micro-algae as a source of protein. Biotechnol. Adv. 2007, 25, 207–210. [Google Scholar] [CrossRef] [PubMed]
- Wild, K.J.; Steingaß, H.; Rodehutscord, M. Variability of in vitro ruminal fermentation and nutritional value of cell-disrupted and nondisrupted microalgae for ruminants. Glob. Change Biol. Bioenergy 2019, 11, 345–359. [Google Scholar] [CrossRef]
- Tessier, R.; Calvez, J.; Khodorova, N.; Gaudichon, C. Protein and amino acid digestibility of 15 N Spirulina in rats. Eur. J. Nutr. 2021, 60, 2263–2269. [Google Scholar] [CrossRef]
- Devi, S.; Varkey, A.; Sheshshayee, M.S.; Preston, T.; Kurpad, A.V. Measurement of protein digestibility in humans by a dual-tracer method. Am. J. Clin. Nutr. 2018, 107, 984–991. [Google Scholar] [CrossRef]
- Janczyk, P.; Franke, H.; Souffrant, W.B. Nutritional value of Chlorella vulgaris: effects of ultrasonication and electroporation on digestibility in rats. Anim. Feed Sci. Technol. 2007, 132, 163–169. [Google Scholar] [CrossRef]
- Purdi, T.S.; Setiowati, A.D. , Ningrum, A. Ultrasound-assisted extraction of Spirulina platensis protein: physicochemical characteristic and techno-functional properties. Journal of Food Measurement and Characterization 2023, 17, 5474–5486. [Google Scholar] [CrossRef]
- Schwenzfeier, A.; Lech, F.; Wierenga, P.A.; Eppink, M.H. , Gruppen, H. Foam properties of algae soluble protein isolate: Effect of pH and ionic strength. Food Hydrocoll. 2013, 33, 111–117. [Google Scholar] [CrossRef]
- Boisen, S. , Eggum, B.O. Critical evaluation of in vitro methods for estimating digestibility in simple-stomach animals. Nutr. Res. Rev. 1991, 4, 141–162. [Google Scholar] [CrossRef]
- Bleakley, S. , Hayes, M. Algal proteins: extraction, application, and challenges concerning production. Foods 2017, 6. [Google Scholar] [CrossRef]
- Dai, L.; Hinrichs, J.; Weiss, J. Emulsifying properties of acid-hydrolyzed insoluble protein fraction from Chlorella protothecoides: Formation and storage stability of emulsions. Food Hydrocoll. 2020, 108, 105954. [Google Scholar] [CrossRef]
- Jain, S.; Anal, A.K. Optimization of extraction of functional protein hydrolysates from chicken egg shell membrane (ESM) by ultrasonic assisted extraction (UAE) and enzymatic hydrolysis. LWT-Food Sci. Technol. 2016, 69, 295–302. [Google Scholar] [CrossRef]
- Wang, Q.; Wang, Y.; Huang, M.; Hayat, K.; Kurtz, N.C.; Wu, X.; Zheng, F. (2021). Ultrasound-assisted alkaline proteinase extraction enhances the yield of pecan protein and modifies its functional properties. Ultrason. Sonochem. 2021, 80, 105789. [Google Scholar] [CrossRef]
- Lo, B.; Kasapis, S.; Farahnaky, A. Effect of low frequency ultrasound on the functional characteristics of isolated lupin protein. Food Hydrocoll. 2022, 124, 107345. [Google Scholar] [CrossRef]
- Arranz, S.; Silván, J.M.; Saura-Calixto, F. Nonextractable polyphenols, usually ignored, are the major part of dietary polyphenols: A study on the Spanish diet. Mol. Nutr. Food Res. 2010, 54, 1646–1658. [Google Scholar] [CrossRef]
- Shahidi, F.; Yeo, J. Insoluble-bound phenolics in food. Molecules 2016, 21. [Google Scholar] [CrossRef]
- Minchev, I. , Petkova, N.; Milkova-Tomova, I. Ultrasound-assisted extraction of chlorophylls and phycocyanin from Spirulina platensis. Biointerface Res. Appl. Chem. 2020, 11, 9296–9304. [Google Scholar] [CrossRef]
- Tavanandi, H.A.; Mittal, R. , Chandrasekhar, J., Raghavarao, K.S.M.S. Simple and efficient method for extraction of C-Phycocyanin from dry biomass of Arthospira platensis. Algal Res. 2018, 31, 239–251. [Google Scholar] [CrossRef]
- Rodrigues, R.D.P.; de Castro, F.C.; de Santiago-Aguiar, R.S.; Rocha, M.V.P. Ultrasound-assisted extraction of phycobiliproteins from Spirulina (Arthrospira) platensis using protic ionic liquids as solvent. Algal Res. 2018, 31, 454–462. [Google Scholar] [CrossRef]
- Setyoningrum, T.M.; Nur, M.A. Optimization of C-phycocyanin production from S. platensis cultivated on mixotrophic condition by using response surface methodology. Biocatal. Agric. Biotechnol. 2015, 4, 603–60729. [Google Scholar] [CrossRef]
- Castejón, N.; Señoráns, F.J. Simultaneous extraction and fractionation of omega-3 acylglycerols and glycolipids from wet microalgal biomass of Nannochloropsis gaditana using pressurized liquids. Algal Res. 2019, 37, 74–82. [Google Scholar] [CrossRef]
- Tang, D.Y.Y.; Khoo, K.S.; Chew, K.W.; Tao, Y.; Ho, S.H.; Show, P.L. Potential utilization of bioproducts from microalgae for the quality enhancement of natural products. Bioresour. Technol. 2020, 304, 122997. [Google Scholar] [CrossRef]
- Blanco-Llamero, C.; Señoráns, F.J. Biobased solvents for pressurized liquid extraction of Nannochloropsis gaditana Omega-3 lipids. Mar. Drugs 2021, 19. [Google Scholar] [CrossRef]
- Jha, A.K.; Sit, N. Extraction of bioactive compounds from plant materials using combination of various novel methods: A review. Trends Food Sci Technol 2022, 119, 579–591. [Google Scholar] [CrossRef]
- Pohndorf, R.S.; Camara, Á.S.; Larrosa, A.P.; Pinheiro, C.P.; Strieder, M.M.; Pinto, L.A. Production of lipids from microalgae Spirulina sp.: Influence of drying, cell disruption and extraction methods. Biomass Bioenergy 2016, 93, 25–32. [Google Scholar] [CrossRef]
- Getachew, A.T.; Jacobsen, C.; Holdt, S.L. Emerging technologies for the extraction of marine phenolics: Opportunities and challenges. Mar. Drugs 2020, 18. [Google Scholar] [CrossRef]
- Jaeschke, D.P.; Teixeira, I.R.; Marczak, L.D.F.; Mercali, G.D. Phycocyanin from Spirulina: A review of extraction methods and stability. Food Res. Int. 2021, 143, 110314. [Google Scholar] [CrossRef]
- Kaur, N.; Khunger, A.; Wallen, S.L.; Kaushik, A.; Chaudhary, G.R.; Varma, R.S. Advanced green analytical chemistry for environmental pesticide detection. Curr. Opin. Green Sustain. 2021, 30, 100488. [Google Scholar] [CrossRef]
- Bognár, S.; Putnik, P.; Šojić Merkulov, D. Sustainable green nanotechnologies for innovative purifications of water: Synthesis of the nanoparticles from renewable sources. Nanomaterials 2022, 12. [Google Scholar] [CrossRef]
- Marjanović, B.; Benković, M.; Jurina, T.; Sokač Cvetnić, T.; Valinger, D.; Gajdoš Kljusurić, J.; Jurinjak Tušek, A. Bioactive Compounds from Spirulina spp.—Nutritional Value, Extraction, and Application in Food Industry. Separations 2024, 11. [Google Scholar] [CrossRef]
- Alotaiby, S.; Zhao, X.; Boesch, C.; Sergeeva, N.N. Sustainable approach towards isolation of photosynthetic pigments from Spirulina and the assessment of their prooxidant and antioxidant properties. Food Chem. 2024, 436, 137653. [Google Scholar] [CrossRef]
- Awad, A.M.; Kumar, P.; Ismail-Fitry, M.R.; Jusoh, S.; Ab Aziz, M.F.; Sazili, A.Q. Green extraction of bioactive compounds from plant biomass and their application in meat as natural antioxidant. Antioxidants 2021, 10. [Google Scholar] [CrossRef]
- Janicka, P.; Płotka-Wasylka, J.; Jatkowska, N.; Chabowska, A.; Fares, M.Y.; Andruch, V.; Kaykhaii, M.; Gębicki, J. Trends in the new generation of green solvents in extraction processes. Curr. Opin. Green Sustain., 2022, 37, 100670. https://doi.org/10.1016/j.cogsc.2022.100670.
- García-Oms, S.; Sánchez-Bonet, D.; Belda-Antolí, M.; Padrón-Sanz, C.; Lloris-Carsi, J.M.; Cejalvo-Lapeña, D. Optimisation of a green ultrasound-assisted extraction (UAE) methodology for obtaining maximum antioxidant activity from red algae and determination of the co-extracted compounds. J. Appl. Phycol. 2024, 36, 1433–1444. [Google Scholar] [CrossRef]
- Al Fuhaid, L.; Wellman, G.B.; Kharbatia, N.; Farinha, A.S.; Vrouwenvelder, J.S.; Verpoorte, R.; Choi, Y.H.; Witkamp, G.J.; Fortunato, L. Green extraction of pigment from astaxanthin-producing algae using natural deep eutectic solvents. Algal Res. 2024, 82, 103668. [Google Scholar] [CrossRef]
- Ruiz-Domínguez, M.C.; Medina, E.; Salinas, F.; Bugueño, W.; Fuentes, J.L.; Vílchez, C.; Garbayo, I.; Cerezal-Mezquita, P. Methodological optimization of supercritical fluid extraction of valuable bioactive compounds from the acidophilic microalga Coccomyxa onubensis. Antioxidants 2022, 11. [Google Scholar] [CrossRef]
- Martins, R.; Mouro, C.; Pontes, R.; Nunes, J.; Gouveia, I. Ultrasound-assisted extraction of bioactive pigments from Spirulina platensis in natural deep eutectic solvents. Bioresour. Bioprocess. 2023, 10. [Google Scholar] [CrossRef]
- Baghizadeh, K.B.; Goli, M.; Shahi, S. The survey of bioactive compounds extraction from Spirulina platensis algae by ultrasound-assisted ethanolic maceration. J. Food Sci. Technol. (Iran) 2023, 20, 45–57. [Google Scholar] [CrossRef]
- Andrianto, D.; Safithri, M.; Tarman, K. Total phenolic content and proliferation activity of Spirulina extract in lymphocyte cell. In BIO Web Conf., The 4th International Conference on Integrated Coastal Management & Marine Biotechnology (ICMMBT 2023), 2024, 92, 02009. [CrossRef]
- Beraich, A.; El Farissi, H.; Cacciola, F.; El-Shazly, M.; Yahyaoui, M.I.; Yousra, B.; Talhaoui, A. Exploring the healing power of Pistacia lentiscus stems: insights into extraction methods, polyphenolic composition, and health-promoting activities. Int. J. Environ. Health Res. 2024, 35, 439–452. [Google Scholar] [CrossRef]
- Gu, X.; Liu, Y.; Suo, R.; Yu, Q.; Xue, C.; Wang, J.; Wang, W.; Wang, H.; Qiao, Y. Effects of different low-temperature maceration times on the chemical and sensory characteristics of Syrah wine. Food Chem., 2024, 463(2), 141230. https://doi.org/10.1016/j.foodchem.2024.141230.
- Lemos, M.C.; Drumm, T.D.S.; dos Santos, B.A.; Correa, L.P.; Wagner, R.; Cichoski, A.J.; Campagnol, P.C.B. Maceration of soybean oil with jabuticaba peel and rosemary leaves: An affordable and effective approach to enhance frying oil's stability. Int. J. Gastron. Food Sci. 2024, 35, 100867. [Google Scholar] [CrossRef]
- Elferjane, M.R.; Milutinović, V.; Jovanović Krivokuća, M.; Taherzadeh;, M.J.; Pietrzak, W.; Marinković, A.; Jovanović, A.A. Vaccinium myrtillus L. leaf waste as a source of biologically potent compounds: optimization of polyphenol extractions, chemical profile, and biological properties of the extracts. Pharmaceutics 2024, 16, 740. [Google Scholar] [CrossRef]
- Pogorzelska-Nowicka, E.; Hanula, M.; Pogorzelski, G. Extraction of polyphenols and essential oils from herbs with green extraction methods – An insightful review. Food Chem. 2024, 460. [Google Scholar] [CrossRef]
- Parshina, E.Y.; Liu, W.; Yusipovich, A.I.; Gvozdev, D.A.; He, Y.; Pirutin, S.K.; Klimanova, E.A.; Maksimov, E.G.; Maksimov, G.V. Spectral and conformational characteristics of phycocyanin associated with changes of medium pH. Photosynth. Res. 2024, 161, 93–103. [Google Scholar] [CrossRef]
- Benedetti, S.; Rinalducci, S.; Benvenuti, F.; Francogli, S.; Pagliarani, S.; Giorgi, L.; Canestrari, F. Purification and characterization of phycocyanin from the blue-green alga Aphanizomenon flos-aquae. J. Chromatogr. B 2006, 833, 12–18. [Google Scholar] [CrossRef]
- Tavanandi, H.A.; Mittal, R.; Chandrasekhar, J.; Raghavarao, K.S.M.S. Simple and efficient method for extraction of C-Phycocyanin from dry biomass of Arthrospira platensis. Algal Res. 2018, 31, 239–251. [Google Scholar] [CrossRef]
- Kirk, P.L. Kjeldahl method for total nitrogen. Anal. Chem. 1950, 22, 354–358. [Google Scholar] [CrossRef]
- DuBois, M.; Gilles, K.A.; Hamilton, J.K.; Rebers, P.T.; Smith, F. Colorimetric method for determination of sugars and related substances. Anal. Chem. 1956, 28, 350–356. [Google Scholar] [CrossRef]
- Chen, Y.; Vaidyanathan, S. A simple, reproducible and sensitive spectrophotometric method to estimate microalgal lipids. Anal. Chim. Acta 2012, 724, 67–72. [Google Scholar] [CrossRef]
- Van Soest, P.V.; Robertson, J.B.; Lewis, B.A. Methods for dietary fiber, neutral detergent fiber, and nonstarch polysaccharides in relation to animal nutrition. J. Dairy Sci. 1991, 74, 3583–3597. [Google Scholar] [CrossRef]
- Singh, M.; Singh, M.P. Chlorophyll content and its relation to productivity of crops and weeds in a tropical agroecosystem at Gujar Lake Margin, India. Ecoprint 2016, 23, 39–44. [Google Scholar] [CrossRef]
- Chamizo, S.; Adessi, A.; Torzillo, G.; De Philippis, R. Exopolysaccharide features influence growth success in biocrust-forming cyanobacteria, moving from liquid culture to sand microcosms. Front. Microbiol. 2020, 11, 2719. [Google Scholar] [CrossRef] [PubMed]
- Dianursanti, D.; Hafidzah, M.A. The enhancement of phycocyanin yield and purity from Spirulina platensis using freeze-thawing method on various solvents. In AIP Conference Proceedings (Vol. 2344, No. 1), 5th International Symposium of Biomedical Engineering, ISBE 2020 - Depok, Virtual, Indonesia, 28/07/2020-29/07/2020. https://doi.org/10.1063/5.0047581.
- Zavřel, T.; Chmelík, D.; Sinetova, M.A.; Červený, J. Spectrophotometric determination of phycobiliprotein content in cyanobacterium Synechocystis. J. Vis. Exp. 2018, 139, e58076. [Google Scholar] [CrossRef] [PubMed]
- Manconi, M.; Marongiu, F.; Castangia, I.; Manca, M.L.; Caddeo, C.; Tuberoso, C.I.G.; D’Hallewin, G.; Bacchetta, G.; Fadda, A.M. Polymer-associated liposomes for the oral delivery of grape pomace extract. Colloids Surf. B Biointerfaces 2016, 146, 910–917. [Google Scholar] [CrossRef]
- Breuer, G.; Evers, W.A.; de Vree, J.H.; Kleinegris, D.M.; Martens, D.E.; Wijffels, R.H.; Lamers, P.P. Analysis of fatty acid content and composition in microalgae. J. Vis. Exp., 2013, (80). [CrossRef]
- Manca, M.L.; Castangia, I.; Zaru, M.; Nácher, A.; Valenti, D.; Fernàndez-Busquets, X.; Fadda, A.M.; Manconi, M. Development of curcumin loaded sodium hyaluronate immobilized vesicles (hyalurosomes) and their potential on skin inflammation and wound restoring. Biomaterials 2015, 71, 100–109. [Google Scholar] [CrossRef]
- Rakuša, Ž.T.; Grobin, A.; Roškar, R. A comprehensive approach for the simultaneous analysis of all main water-soluble vitamins in multivitamin preparations by a stability-indicating HPLC-DAD method. Food Chem. 2021, 337, 127768. [Google Scholar] [CrossRef] [PubMed]
- Saharan, V.; Jood, S. Nutritional composition of Spirulina platensis powder and its acceptability in food products. Int. J. Adv. Res. 2017, 5, 2295–2300. [Google Scholar] [CrossRef]
- Anvar, A.A.; Nowruzi, B. Bioactive Properties of Spirulina: A Review. Microb. Bioact. 2021, 4, 134–142. [Google Scholar] [CrossRef]
- Liu, Q.; Yao, C.; Sun, Y.; Chen, W.; Tan, H.; Cao, X.; Xue, S.; Yin, H. Production and structural characterization of a new type of polysaccharide from nitrogen-limited Arthrospira platensis cultivated in outdoor industrial-scale open raceway ponds. Biotechnol Biofuels 2019, 12, 131. [Google Scholar] [CrossRef]
- Shen, L.; Pang, S.; Zhong, M.; Sun, Y.; Qayum, A.; Liu, Y.; Rashid, A.; Xu, B.; Liang, Q.; Ma, H.; Ren, X. A comprehensive review of ultrasonic assisted extraction (UAE) for bioactive components: Principles, advantages, equipment, and combined technologies. Ultrason. Sonochem. 2023, 101, 106646. [Google Scholar] [CrossRef]
- Lupatini, A.L.; de Oliveira Bispo, L.; Colla, L.M.; Costa, J.A.V.; Canan, C.; Colla, E. Protein and carbohydrate extraction from S. platensis biomass by ultrasound and mechanical agitation. Food Res. Int. 2017, 99, 1028–1035. [Google Scholar] [CrossRef]
- Wan, D.; Wu, Q.; Kuča, K. Spirulina. - In Nutraceuticals - Efficacy, Safety and Toxicity, 1st ed.; Gupta, R.C., Ed.; Academic Press/Elsevier, USA, 2016; Chapter 42, pp. 569-583. https://doi.org/10.1016/B978-0-12-802147-7.00042-5.
- Bai, L.; Zhu, P.; Wang, W.; Wang, M. The influence of extraction pH on the chemical compositions, macromolecular characteristics, and rheological properties of polysaccharide: The case of okra polysaccharide. Food Hydrocoll. 2020, 102, 105586. [Google Scholar] [CrossRef]
- Diraman, H.; Koru, E.; Dibeklioglu, H. Fatty acid profile of Spirulina platensis used as a food supplement. Isr. J. Aquac. - Bamidgeh 2009, 61, 134–142. [Google Scholar] [CrossRef]
- Matos, J.; Cardoso, C.L.; Bandarra, N.M.; Afonso, C.M. Microalgae as a healthy ingredient for functional food: A review. Food Funct. 2017, 8, 2672–2685. [Google Scholar] [PubMed]
- Mata, T.; Martins, A.; Oliveira, O.; Oliveira, S.; Mendes, A.; Caetano, N. Lipid content and productivity of Arthrospira platensis and Chlorella vulgaris under mixotrophic conditions and salinity stress. Chem. Eng. Trans. 2016, 49, 187–192. [Google Scholar] [CrossRef]
- Sotiroudis, T.G.; Sotiroudis, G.T. Health aspects of Spirulina (Arthrospira) microalga food supplement. J. Serb. Chem. Soc. 2016, 78, 395–405. [Google Scholar] [CrossRef]
- Muhling, M.; Belay, A.; Whitton, B.A. Variation in fatty acid composition of Arthrospira (Spirulina) strains. J. Appl. Phychol. 2005, 17, 137–146. [Google Scholar] [CrossRef]
- Soni, R.A.; Sudhakar, K.; Rana, R.S. Spirulina–From growth to nutritional product: A review. Trends Food Sci. Technol. 2017, 69, 157–171. [Google Scholar] [CrossRef]
- Ragaza, J.A.; Hossain, M.S.; Meiler, K.A.; Velasquez, S.F.; Kumar, V. A review on Spirulina: alternative media for cultivation and nutritive value as an aquafeed. Rev. Aquac. 2020, 12, 2371–2395. [Google Scholar] [CrossRef]
- Orthesin, N.; Hidayat, I.T.; Wahyuni, W.T.; Syafitri, U.D.; Herbani, Y.; Sari, Y.W. Optimization of Chlorophyll Extraction from dried Spirulina platensis using low power microwave assisted extraction method. IOP Conf. Ser. Earth Environ. Sci. 2024, 1359, 012021. [Google Scholar] [CrossRef]
- Minchev, I.; Petkova, N.; Milkova-Tomova, I. Ultrasound-assisted extraction of chlorophylls and phycocyanin from Spirulina platensis. Biointerface Res. Appl. Chem. 2020, 11, 9296–9304. [Google Scholar] [CrossRef]
- Fais, G.; Manca, A.; Bolognesi, F.; Borselli, M.; Concas, A.; Busutti, M.; Broggi, G.; Sanna, P.; Castillo-Aleman, Y.M.; Rivero-Jemenez, R.A.; Bencomo-Hernandez, A.A.; Ventura-Carmenate, Y.; Altea, M.; Pantaleo, A.; Gabrielli, G.; Bigliosi, F.; Cao, G.; Giannaccare, G. Wide range applications of spirulina: from earth to space missions. Mar. Drugs 2022, 20. [Google Scholar] [CrossRef]
- Park, W.S.; Kim, H.J.; Li, M.; Lim, D.H.; Kim, J.; Kwak, S.S.; Chang, C.M.; Ferruzzi, M.G.; Ahn, M.J. Two classes of pigments, carotenoids and C-phycocyanin, in Spirulina powder and their antioxidant activities. Molecules 2018, 23. [Google Scholar] [CrossRef] [PubMed]
- Choi, W.Y.; Lee, H.Y. Enhancement of Chlorophyll a production from marine Spirulina maxima by an optimized ultrasonic extraction process. Appl. Sci. 2018, 8. [Google Scholar] [CrossRef]
- Sadewo, B.R.; Dewayanto, N.; Rochmadi, R.; Juniawan, A.S.; Budiman, A. Optimization study of phycocyanin ultrasound-assisted extraction process from Spirulina (Arthrospira platensis) using different solvent. Egypt. J. Chem. 2024, 67, 589–608. [Google Scholar] [CrossRef]
- Chia, S.R.; Chew, K.W.; Leong, H.Y.; Manickam, S.; Show, P.L.; Nguyen, T.H.P. Sonoprocessing-assisted solvent extraction for the recovery of pigment-protein complex from Spirulina platensis. Chem. Eng. J. 2020, 398, 125613. [Google Scholar] [CrossRef]
- Obeid, S.; Rida, H.; Peydecastaing, J.; Takache, H.; Ismail, A.; Pontalier, P.Y. Coupling ultrasound and membrane filtration for the fractionation of Spirulina platensis sp. and the recovery of phycocyanin and pigment-free proteins. Biotechnol. Lett. 2025, 47. [Google Scholar] [CrossRef]
- Rodrigues, R.D.P.; de Castro, F.C.; de Santiago-Aguiar, R.S.; Rocha, M.V.P. Ultrasound-assisted extraction of phycobiliproteins from Spirulina (Arthrospira) platensis using protic ionic liquids as solvent. Algal Res. 2018, 31, 454–462. [Google Scholar] [CrossRef]
- da Silva, M.F.; Casazza, A.A.; Ferrari, P.F.; Aliakbarian, B.; Converti, A.; Pedros Bezerra, R.; Figueiredo Porto, A.L.; Perego, P. Recovery of phenolic compounds of food concern from Arthrospira platensis by green extraction techniques. Algal Res. 2017, 25, 391–401. [Google Scholar] [CrossRef]
- El-Baky, H.H.A.; El Baz, F.K.; El-Baroty, G.S. Production of phenolic compounds from Spirulina maxima microalgae and its protective effects. Afric. J. Biotechnol. 2009, 8, 7059–7067. [Google Scholar]
- Seghiri, R.; Kharbach, M.; Essamri, A. Functional composition, nutritional properties, and biological activities of Moroccan Spirulina microalga. J. Food Qual., 2019, art ID 3707219, 1-11. doi: 10.1155/2019/3707219.
- Stajčić, S.; Ćetković, G.; Tumbas Šaponjac, V.; Travičić, V.; Ilić, P.; Brunet, S.; Tomić, A. Bioactive compounds and the antioxidant activity of selected vegetable microgreens: A correlation study. Processes 2024, 12. [Google Scholar] [CrossRef]
- Yamauchi, M.; Kitamura, Y.; Nagano, H.; Kawatsu, J.; Gotoh, H. DPPH measurements and structure—activity relationship studies on the antioxidant capacity of phenols. Antioxidants 2024, 13. [Google Scholar] [CrossRef]
- Saroyo, H.; Arifah, I.A.N. Antioxidant activity using DPPH & FRAP method and their correlation with the levels of phenolic and flavonoid compounds from Nemba plants (Azadirachta Indica A. Juss). J. Nutrac. Herb. Med. 2021, 3, 10–20. [Google Scholar] [CrossRef]

Table 1.
Biochemical composition (mean g 100 g−1 DW) and yield % of spirulina and extract.
| macro-nutrient | spirulina | extract | yield% Spirulina vs extract |
| g 100 g−1 DW | |||
| carbohydrate | 15.57ay | 12.63b | -18.84 |
| lipid | 5.16ax | 6.21b | +20.29 |
| protein | 62.66az | 52.23b | -16.65 |
| fibre | 3.38az | 0.35b | -89.52 |
| ash | 8.41az | 18.55b | +120.66 |
Means differences (a, b) between columns were tested using one-way ANOVA with Cochran's Correction for multiple comparisons. x=P< 0.05, y=P < 0.01, z=P < 0.001.
Table 2.
Photosynthetic pigments (mg 100 mg-1), phycobiliproteins, total polyphenols (mg gallic acid eq g-1), and antioxidant activity (mg Trolox eq g-1) obtained in spirulina and extract analysis.
Table 2.
Photosynthetic pigments (mg 100 mg-1), phycobiliproteins, total polyphenols (mg gallic acid eq g-1), and antioxidant activity (mg Trolox eq g-1) obtained in spirulina and extract analysis.
| spirulina | extract | yield% Spirulina vs extract |
|
| Chl a | 0.49ay | 0.64b | +32.33 |
| Total carotenoids | 0.09ay | 0.12b | +30.84 |
| Pc | 10.46a | 10,38a | -0.77 |
| Apc | 3.24az | 4,58b | +41,41 |
| Pe | 0.66az | 1,20b | +81,42 |
| Total polyphenols | 5.94az | 9.86b | +65.99 |
| DPPH assay | 14.76ay | 21.10b | +42.95 |
Means differences (a, b) between columns were tested using one-way ANOVA with Cochran's Correction for multiple comparisons. x=P<0.05, y=P < 0.01, z=P < 0.001.
Table 3.
Average total fatty acid (FAME) composition content (mg g-1 ± RSD DW) and yield % of extract vs spirulina.
Table 3.
Average total fatty acid (FAME) composition content (mg g-1 ± RSD DW) and yield % of extract vs spirulina.
| FAME | N° C | spirulina | extract | yield% Spirulina vs extract |
| Palmitoleic acid | C 16:1 | 0.54ay | 1.01b | +88.62 |
| Palmitic acid | C 16:0 | 10.4ax | 16.05b | +54.18 |
| γ-Linolenic acid (GLA) | C 18:3 (n-6) | 1.63ay | 2.77b | +71.15 |
| cis-Linoleic acid (LA) | C 18:2 (n-6) | 6.90ay | 11.51b | +66.71 |
| cis-Oleic acid | C 18:1 (n-9) | 1.23ax | 1.94b | +58.85 |
| Stearic acid | C 18:0 | 0.40a | 0.56a | +40.40 |
| Total FAME mg g-1 | 21.18ay | 33.98b | +60.48 | |
| Total PUFA | 1,75ay | 2,95b | +67.55 | |
| Total MUFA | 8,52az | 14,28b | +67.91 | |
| Total SFA | 10.81ay | 16.61b | +53.67 | |
| PUFA/SFA | 0,79ax | 0,86b | ||
| MUFA/SFA | 0,16a | 0,18a | ||
| PUFA/MUFA | 4,86a | 4,85a |
Means differences (a, b) between columns were tested using one-way ANOVA with Cochran's Correction for multiple comparisons. x=P< 0.05, y=P < 0.01, z=P < 0.001.
Disclaimer/Publisher’s Note: The statements, opinions and data contained in all publications are solely those of the individual author(s) and contributor(s) and not of MDPI and/or the editor(s). MDPI and/or the editor(s) disclaim responsibility for any injury to people or property resulting from any ideas, methods, instructions or products referred to in the content. |
© 2025 by the authors. Licensee MDPI, Basel, Switzerland. This article is an open access article distributed under the terms and conditions of the Creative Commons Attribution (CC BY) license (http://creativecommons.org/licenses/by/4.0/).
Copyright: This open access article is published under a Creative Commons CC BY 4.0 license, which permit the free download, distribution, and reuse, provided that the author and preprint are cited in any reuse.


