
Submitted:
17 March 2025
Posted:
18 March 2025
You are already at the latest version
Abstract
The reuse of recycled carbon fibers (rCF) is a response to growing environmental concerns associated with the composites industry. Recycling and reusing carbon fibers represents a more sustainable alternative by reducing waste at the end of the life cycle of composite materials and decreasing dependency on virgin raw materials. This study investigates the influence of process parameters on two different non-woven mats made by carding rCF and blending with thermoplastic filaments: Carbiso TM-PA6/60 and Carbiso TM-MAPP/60. Two processing methods have been examined: one-shot process (Method 1) and lamination (Method 2) to fabricate multilayer coupons. Results indicate that the two-layer panels produced using Method 2 exhibited lower porosity (9.9% for PA6/60 and 4.1 for MAPP/60) and superior mechanical performance, with a storage modulus of 15.2 GPa for PA6/60, respect to 10.0 GPa for 2LM1, and 16.7 GPa for MAPP/60 2LM2 compared to 10.8 GPa for 2LM1. However, the differences in performance between the two methods diminished as the number of layers increased. Concerning matrix-fibre compatibility, MAPP/60 has shown the best results, due to the fibre's roughness, the presence of matrix particles on the fibres, and the incorporation of maleic anhydride in polypropylene (PP), which significantly enhanced adhesion.
Keywords:
recycled carbon fibre
; thermoplastic composites
; porosity
; mechanical properties
1. Introduction
The development of carbon fiber-reinforced composites (CFRC) has attracted significant attention in recent decades primarily because of their lightweight and superior mechanical properties like high specific strength and stiffness, corrosion and fatigue resistance [1,2]. Due to their excellent properties, they are widely used in many fields, such as in construction [3], the aeronautic sector [4], and automotive sector [5], with both thermoset and thermoplastic matrices [6,7]. The growth of production and use of CFs inevitably leads to high amounts of CFs composites waste. Indeed, the global CFRP waste is foreseen to reach up to 20 ktons annually by 2025 [8]. The difficulty with the thermoset matrix is that it cannot be melted and reused, and this represents a problem for recycling. In fact, the majority of this waste is currently either incinerated or landfilled, even though landfilling has been stated to be the least option for CF composite disposal by the European Waste Framework Directive [9]. As a solution, thermoplastic composites appear to be the most viable option because they can be melted and reshaped multiple times without undergoing significant alteration in their chemical structure [10]. Several methods are used to reclaim CFs from thermoplastic composites waste, ranging from electromagnetic to thermal and thermochemical methods [11,12].
Recycled carbon fibers are typically in a discontinuous and random form due to the cutting process during the composite manufacturing and the size reduction during the recycling process. From the recycling processes of carbon fibers, rCFs are obtained with mechanical properties not too far from to the virgin fibers.
Sun et al. [13] proposed an electrochemical method for the recycling of carbon fiber from carbon fiber reinforced polymer (CFRP). The test on rCF shows that the maximum tensile strength of the reclaimed carbon fiber is 80% of the virgin carbon fibers (VCF). Ye et al. [14] recover carbon fiber from epoxy with the steam thermolysis method. The results show that reclaimed resin (or residue) free carbon fibers retain more or less over 90% of its original tensile strength. Approximately, the tensile strength of rCF could reach approximately 80–95% of virgin carbon fibers (VCF) [15].
Among the manufacturing technologies appliable to the rCF it is worth considering the infusion moulding, extrusion/compression and 3D printing [16,17,18].
It is possible to develop recycled carbon fiber reinforced composites (rCFRCs) utilize nonwoven fibrous mats infused with resin. These mats can be produced using different techniques such as wet-laid, air-laid and carding process. Air-laid is a dry laying technique in which individual fibers are evenly dispersed in an airstream and then directed toward a permeable screen or conveyor, where the fibers are deposited randomly in the form of a web. The resulting nonwoven mat is essentially isotropic in nature with a three-dimensional structure where the areal weight ranges from 150 to 200 g/m2 [19]. The process of wet-laid nonwovens is similar to papermaking. The fibers are mixed with water or a suitable solvent in this technique to form a fiber/water mixture. The mixture is then transferred to a head box where a continuous isotropic nonwoven web is formed. At this stage the water is drained from the web and is moved forward via a forming belt. Finally, the web is dried using the heaters and rolled up using a take-up system [20]. When fibers are randomly oriented, in-plane material isotropy can be expected. Carding is a mechanical process in which the cut carbon fibers are a series of rotating cylinders covered with wire or pins that work to align and separate the fibers. During this phase, resin can be added to infuse the fibers. The resin-impregnated fibers are then laid in layers, forming mats with a specific fiber orientation [21]. Unlike the two previous processes, carding allow to produce anisotropic nonwoven composites.
Subsequently, these mats can be thermoformed with traditional manufacturing techniques such as compression molding for the production of composites with relatively high fiber volume fractions and hence good mechanical properties. Pimenta et al. [22] produced nonwoven mats based on rCFs with paper-making process and then compression molding them with epoxy resin layer to manufacture rCFRCs. The nominal volume fraction of the samples was found to be around 30%, which resulted in the same stiffness and strength as the aerospace grade 2024-T4 Aluminium alloy. Quan et al. [23] produced rCF/PPS composites starting from nonwoven mats consisting of commingled rCFs and Polyphenylene-sulfide (PPS) fibers through the compression molding. The experimental results had demonstrated that interlaminar fracture energies and mechanical properties significantly increased. However, it also negatively affected the interlaminar fracture resistance. Therefore, studies of the processing, post-processing, and mechanical behavior of these mats are of great interest. Coupling Nonwoven mats made by rCF with polyamide (PA6) enables high abrasion resistance, heat resistance and excellent mechanical properties [24]. On the other hand, the use of MAPP, polypropylene modified with maleic anhydride (MA), allows the polymer to retain all the advantages of PP, including excellent chemical and mechanical properties, thermal stability, and low density [25]. Additionally, the presence of maleic anhydride enhances compatibility between the matrix phase and recycled carbon fibers (rCFs) [26].
The paper aims to investigate the optimal process condition of compression moulding for repurposing recycled carbon fibers nonwoven mats, two type of preform have been considered Carbiso TM-PA6/60 and Carbiso TM-MAPP/60, namely rCF/MAPP and rCF/PA6-60 respectively. Two different process approach have been considered: direct compression moulding by oneshot fabrication (Method 1-M1) and lamination and step consolidation (Method 2-M2). Differential scanning calorimetry (DSC) tests were performed on the samples to evaluate how the selected process affected the crystallinity of the material. Additionally, the impact of porosity on elastic modulus, induced by the compression molding process, for both the systems have been studied by dynamic mechanical analysis (DMA). Finally, capability of rCF to strengthen the matrix phase has been assessed by discussing the effective reinforcement modulus in both polymers. Results shows that up to 2 layers coupons M2 guarantees better performances in terms of porosity and storage modulus, while increasing the number of layers the differences in performance for coupons made by the two approach vanish.
The viscoelastic performances of the samples highlights also the different interphase created by the two polymer matrices considered, in fact PA6 based composites have an effective reinforcement of 60GPa, while MAPP/rCF have a reinforcement of 90GPa. The efficiency in reinforcing of rCF is higher in the case of MAPP based composites, a rationale is the formation of a stronger interphase due to the presence of maleic anhydride, an evidence of the quality of the interaction between fibre and hosting matrix is the tanδ: similar condition strong interphases have lower dissipative capacity.
2. Materials and Methods
2.1. Sample Preparation
Carpet of Carbiso TM-PA6/60 and Carbiso TM-MAPP/60 (kindly supplied by AEROSOFT, Capua, CE, Italy) are made with 40% carbon fiber and a phase consisting of polycaprolactam (PA6) and maleic anhydride modified polypropylene (MAPP) at 60%, respectively. In particular, MAPP is polypropylene modified with maleic anhydride (MA). The effect of MA in improving interfacial adhesion is primarily attributed to chemical interactions, such as formation of covalent and hydrogen bonds, between the functional groups on the CF surface and the MA groups in the MAPP [26]. Fiber recovery is achieved through a modified pyrolysis process, where the resin is burned off in a furnace. According to ELG Carbon Fibre, the pyrolysis process provides a recycled material that maintains 90% of the carbon fiber’s tensile strength. In order to convert the recycled carbon fiber, ELG Carbon Fibre use a carding line capable of providing up to 250 tonnes per year of carbon fiber or carbon fiber/thermoplastic nonwoven mats [27]. Initially, the recycled carbon fibers are mixed with thermoplastic fibers, polyamide PA6 and maleic anhydride-modified polypropylene (MAPP), to ensure homogeneous distribution. Subsequently, rCFs mixed with thermoplastic fibers are fed into the carding machine, which is equipped with toothed cylinders that align and distribute the fibers into a thin and uniform web. This fibrous web is then layered to achieve the desired basis weight. The resulting mats can be subjected to thermoforming processes [28]. In this case, the PA6/60 and MAPP/60 carpets were subjected to two different compression molding processes to produce multilayer panels. The carpets were cut to obtain different layers measuring 50 x 50 mm. The first technique adopted was a one-shot process in which the different layers are stacked and pressed simultaneously (Figure 1a). Conversely, the second method chosen was a lamination process. The different layers are first pressed separately and then, in a second phase, stacked and pressed again to obtain the desired panel (Figure 1b). The two pressing processes will be referred to as Method 1 and Method 2, respectively. In Figure 2a, the PA6/60 panel produced using the first method is shown, while Figure 2b depicts the panel made with the second method. Similarly, in Figure 2c, the MAPP/60 panel produced using the one-shot technique is shown, whereas Figure 2d presents the panel obtained through lamination.
In the compression molding processes used, the parameters that were adjusted for the two different materials were the process settings (temperature and time). For the PA6/60 carpets, the oneshot process, showed in Figure 3a, was carried out with a preheating phase from room temperature to 210 °C, close to the melting temperature, by closing the press plates. Subsequently, pressing was performed first at 210 °C for 10 minutes and then at 220 °C for 20 minutes, applying a pressure of 100 bar in both cases.
Figure 3b shows the lamination process: the layers were preheated separately with the plates closed, from room temperature to 210 °C. Subsequently, the layers were pressed at 210 °C for 10 minutes and at 220 °C for another 10 minutes. After this phase, the press was opened, the layers were stacked, and a final pressing at 220 °C for 10 minutes was carried out. In all phases, the selected pressure was 100 bar.
For the MAPP/60 fibers, the one-shot process, shown in Figure 4a, was carried out as follows: the layers were preheated, with the plates closed, from room temperature to a temperature of 170°C, close to the melting point. Once the desired temperature was reached, the compression phase was performed for 20 minutes at 100 bar. On the other hand, for the lamination process, after the preheating process, the layers were first pressed separately at 170°C. Then, the press was opened, the layers were stacked and pressed for another 10 minutes at the same temperature. Compression molding phases were carried out at 100 bar (Figure 4b).
2.2. Experimental Characterization
Thermogravimetric analysis (TGA) was performed using a TA Instruments Q5000 instrument (New Castle, DE, USA) to assess the thermal stability range of the polymer according to the ASTM E1131 standard [29]. The measurements were conducted under an inert atmosphere of nitrogen gas, with a temperature ramp of 10 °C/min from room temperature to 900 °C. The weight loss was quantified at 600 °C. To calculate the real fiber content (), the residue obtained from thermogravimetric () tests was reduced by dry residue of the only polymer , in accord with Eq. (1):
All the residues have been measured at 600°C.
The thermal characteristics of the polymer were examined through differential scanning calorimetry (DSC) utilizing a TA Instruments DSC Q2000 instrument. Each test specimen of PA6/60 underwent two heating and cooling cycles from -50 to 280 °C at a rate of 10 °C/min in a nitrogen atmosphere. Instead, all MAPP/60 specimens were subjected to two heating and cooling cycles from -50 to 220 °C at a rate of 10 °C/min in a nitrogen atmosphere. Before measurements, approximately 10 mg of the samples were enclosed in aluminum pans. The glass transition temperature (Tg) and the enthalpy of the reaction were derived from the DSC curves in accordance with ASTM D3418 standards [30].
Dynamic mechanical analysis (DMA) was performed with a Dynamic Mechanical Analyzer Q850 from TA Instruments in the Single Cantilever mode (SC). Samples of a rectangular shape 35 mm in length, 6.0 ± 0.10 mm in width, and about 0.5, 1.0 and 1.5 mm in thickness were tested. The behavior of the PA6/60 and MAPP/60 samples was investigated with temperatures between -70 to 180 °C and -70 to 120 °C, respectively. The tests are performed considering a heating rate of 3 °C/min, a strain amplitude varying between 25 and 50 μm, depending on the sample thickness and a frequency of 1 Hz. Data were elaborated according to the ASTM D790 standard [31] for the flexural behavior of unreinforced and reinforced plastics.
3. Thermomechanical Characterization PA6/60 and MAPP/60
3.1. Thermal Characterization
The thermogravimetric analysis (TGA) of the PA6/60 and MAPP/60 samples, show in Figure 5a and Figure 5b, highlights the thermal behavior of the two materials as a function of temperature. Both materials exhibit significant weight loss between 350°C and 500°C, indicating the thermal decomposition of the main polymer. However, the degradation profile differs between the two samples. PA6/60 shows the main decomposition phase with a peak in the derivative thermogravimetry curve around 460°C, which is characteristic of polyamide 6 (PA6). On the other hand, MAPP/60 displays a main decomposition occurring at slightly lower temperatures, with a DTG peak around 430°C. This is likely due to the presence of maleic anhydride-grafted polypropylene (MAPP), which degrades at lower temperatures than PA6. Additionally, the solid residue at high temperatures (600°C) is around 40% for both materials, a value consistent with the reference. Table 1 reports the weight loss of the examined materials from room temperature up to 250°C and the maximum degradation temperature observed. PA6/60 shows a higher weight loss at 250°C, which could indicate a presence of components that volatilize or degrade at this temperature.
The differential scanning calorimetry (DSC) analysis of the PA6/60 and MAPP/60 samples, shown in Figure 6a,b, allows for the identification of key thermal transition, including the glass transition temperature (Tg) and melting point (Tm). For PA6/60, the first heating cycle shows a glass transition temperature around 50-60°C, indicated by a slight shift in the baseline of the heat flow. The main melting peak is observed at approximately 220-225°C, with a well-defined area characteristic of the crystalline phase of polyamide 6 (PA6). Additionally, in the second heating cycle, a similar glass transition is observed, confirming the stability of Tg after the first thermal treatment. The crystallization temperature during cooling (Tc) is identified around 180-190°C, indicating the material’s ability to recrystallize after melting.
Instead, MAPP exhibits two transitions in the -50°C to 100°C. The first transition around 0°C is the β-relaxation and it is associated with the glass-rubber transition of the fully amorphous phase. The temperature transition between 40 and 60°C is the α-relaxation [32]. The Tg associated with the α-relaxation was selected for inclusion in the Table 2. The melting peak (Tm) appears between 160-170°C, characteristic of polypropylene. The second heating cycle confirm these values, indicating good reproducibility of the material’s thermal structure. The crystallization temperature (Tc) is found around 120°C, reflecting the material's recrystallization behavior. In the first heating cycle, all the analyzed samples show two melting peaks (Figure 6b). The peak on the left is associated with the melting of the β-phase, while the one on the right corresponds to the α-phase [33]. After a further heating the rCF/MAPP60 at 10°C/min exhibits a single peak corresponding to the crystallization of the β-phase at 160°C.
The geometric density has been calculated by eq.(2):
ρ = m/V
Where ρ is the density (g/cm3), m is the sample’s weight (g) and V is the measured volume (cm3). The obtained density values are reported in Table 2. By the calculated density is possible to obtain the average porosity of each sample. The average porosity, P, has been obtained by applying the eq. (3):
P = 1- ρ/ρth
Where ρth is the theoretical density obtained by considering the rule of mixture [34]. The value of ρth for PA6/60 and MAPP/60, considering a fiber volume (vf) of 29.4% and 25.1%, are equal to 1.33 g/cm3 and 1.13 g/ cm3 respectively.
Table 2 summarizes the results obtained from differential scanning calorimetry (DSC), as well as density and porosity analyses.
3.2. Viscoelastic Characterization
The viscoelastic behavior of the sample with temperature up from -70 to 180 °C is reported in Figure 7. DMA experiments were performed in the linear viscoelastic deformation range to investigate how the storage modulus, loss modulus and tanδ of the manufactured panels are influenced by the molding process, the number of overlapping layers and the porosity. Table 3, instead, shows the results of DMA at 50 °C for the PA6/60 panels. The selected temperature was chosen close to the glass transition temperature of the hosting matrices for allowing to compare both materials in same mobility conditions.
The viscoelastic behavior of the sample with temperature up from -70 to 120 °C is reported in Figure 8. DMA experiments were performed in the linear viscoelastic deformation range to investigate how the storage modulus, loss modulus and tanδ of the manufactured panels are influenced by the molding process, the number of overlapping layers and the porosity. Table 4, instead, shows the results of DMA at 20 °C for the MAPP/60 panels. The selected temperature was chosen because it is near to the glass transition temperature of the maleic anhydride-grafted polypropylene (MAPP).
4. Discussion
4.1. Effect of Molding Process on Crystallinity
Since the properties of composites based on semicrystalline polymers are partly determined by the crystalline structure and the degree of crystallinity of the thermoplastic matrix, it was necessary to study the effect of recovery process, in particular the molding, on the degree of crystallinity. Measuring the melting enthalpy of a polymer allows to estimate its degree of crystallinity. In fact, the amorphous or semi-crystalline nature affects the melting enthalpy value and consequently, the degree of crystallinity (Xc). In particular the Xc can be estimated using the following eq. [35]:
Where is the enthalpy of neat resin obtained by normalizing the weight of the tested sample on the percentage of fiber content; is the enthalpy associated with cold crystallization phenomenon and is the melting enthalpy of a perfect crystal.
The melting enthalpy of 100% crystallized PA6 is 230 J/g [36,37]. Table 5 reports the enthalpy values of the two heating cycles of DSC and the respective crystallinities calculated using eq. (4) for the manufactured PA6/60 panels. Additionally, the difference between the two crystallinity values was determined by subtracting the crystallinity of the second cycle from that of the first cycle. From the data analysis, it can be observed that for Carbiso TM-PA6/60, molding method 1 leads to a greater reduction in crystallinity compared to method 2, resulting in more amorphous material.
The melting enthalpy of 100% crystallized PP is 209 J/g [38,39]. In Table 6 are reported the results of DSC analysis of MAPP/60 panels and the respective crystallinity. The results obtained highlight that the lamination process for Carbiso TM-MAPP/60 leads to lower crystallinity with respect to one shot method. This result is opposite to that of PA6/60.
4.2. Effect of Porosity on the Storage Modulus
A critical factor in assessing the performance of composite materials is the intricate relationship between porosity and their mechanical properties. The presence of pores within the polymer matrix can drastically impact both stiffness and viscoelastic behavior, making it essential to understand this dynamic.
Generally, increased porosity leads to a reduction in storage modulus and an elevated damping factor. This underlines the importance of selecting optimal hot-pressing methodology and processing parameters to effectively control porosity, thereby influencing the material's properties and its potential for advanced structural applications. Figure 9 illustrates the correlation between the Elastic modulus and porosity in PA6/60 panels. As porosity rises, the value of storage modulus (E’) declines. Notably, for samples obtained by two layers and compression-molded with method 2 emerged as the better choice, overcoming method 1. The 2LM1 sample achieved an average E’ value of 10 GPa, while the 2LM2 sample excelled with a remarkable 15.2 GPa.
This striking contrast in modulus values is directly linked to the higher porosity of the one-shot process (13.2%) compared to the lamination process (9.9%), highlighting the significance of compression molding process parameters. However, as the number of layers increases, the differences in compaction methodologies decrease. In the case of three-layer panels, the storage modulus for the 3LM1 sample reaches 14.4 GPa, while the 3LM2 sample holds at 11.6 GPa. Additionally, porosity values begin to converge, at approximately 14% for the first sample and 16.7% for the second, emphasizing the complex interplay between processing conditions and material performance.
Figure 10 shows the microscopic analysis on a PA6/60 2LM1 sample in proximity of a porosity, while Figure 11 is the same analysis for a PA6/60 2LM2 sample. The defect in the sample made with Method 1 has an average thickness of 44.7 µm, while the defect in the sample produced with Method 2 has an average thickness of 39.2 µm. Micrographs confirm that the samples prepared according to method 1 (M1) reproduce samples with higher degree of porosity and therefore weak materials.
Figure 12 illustrates the variation of Elastic modulus as a function of porosity for the MAPP/60 panels. Consistent with previous findings, Method 2 yielded better results for the two-layer panels. Specifically, the Elastic modulus for the 2LM2 sample is 16.7 GPa, compared to 10.8 GPa for the 2LM1 sample. This difference is linked to the variation in porosity between the two methods, which is 4.1% for the lamination process and 8.0% for the one-shot method. Also, in case of MAPP/60, an increase in the number of layers tends to minimize the quality difference between the two different compression molding methods. For instance, the 3LM1 sample recorded an Elastic modulus (E') of 15.5 GPa with a porosity of 4.8%, while the 3LM2 sample exhibited an E' of 14.7 GPa with a porosity of 5.0%.
4.3. Effect of Compatibility Between Polymer Matrix and rCF
In composite materials, the compatibility between the matrix and the fiber plays a crucial role in determining the mechanical properties of the final material. Strong adhesion between these two components ensures effective stress transfer, enhancing the strength, durability, and overall performance of the composite. Conversely, poor compatibility can lead to reduced mechanical resistance. Among the numerous models present in the literature, the Cox-Krenchel model is suitable for the evaluation of the elastic modulus for carbon fiber-reinforced composites (CFRC) and is found to yield good agreement with experimental modulus for a range of carbon fiber lengths and volume fraction [40,41,42]. When stress is applied parallel to the fibers, the mechanical Elastic modulus of the composite (Ec) is given by [43]:
where is the effective elastic modulus of the recycled fibers (rCF), is the elastic modulus of PA6 and MAPP matrices, is the volume of the fibers expressed as a percentage and is the volume of the matrix as a percentage. Making the necessary substitutions, the final eq. becomes:
where η is the reinforcement efficiency factor which depends on several factors including the fiber aspect ratio (length to diameter ratio), the packing and orientation of the fibers, the compatibility between fibers and matrix and the shear strength [44].
For PA6/60 and MAPP/60, Ec values of 19.3 GPa and 23.8 GPa were obtained, respectively. It was found that the significant difference recorded among the two materials is mainly related to the compatibility between matrix and fibers. In particular, the effective Elastic modulus () is 60 GPa for PA6/60 and 90 GPa for MAPP/60.
The actual reinforcement of the rCF is mitigated by the parameter η. By comparing the two systems we can notice that the fibers are the same, with same average aspect ratio and similar random distribution. Main difference is the interaction between fibers and hosting matrix due to the surface roughness and chemical compatibility. Rough surfaces increase frictional force and interfacial adhesion between the reinforcement and the polymer, allowing to obtain good interfacial shear strength values [45] for both the systems.
Furthermore, in MAPP/60 the hydrophilic anhydride groups of the sizing reacted with the hydroxyl groups on the CF surface. This resulted in a stronger interfacial interaction and thus stronger adhesion with the matrix [46].
An evidence of the strength at the interphase between fibres and reinforcement is the damping capacity (proportional to tanδ), the rCF/PA6-60 has a tanδ of 0.3, while the rCF/MAPP60 shows a value of 0.2, it means a dissipation capacity less than -30% when compared in similar condition (polymer chain mobility). This means that the PA6-60 based composite dissipates more energy, which implies a weak bonding with the reinforcement, conversely, the MAPP/60 composite acts as a stiffer system with a good adhesion between matrix and reinforcement thank to the grafting of fibers promoted by maleic anhydride grafting .
5. Conclusions
The paper aims to investigate the optima process condition for repurposing recycled carbon fiber based materials. Two different nonwoven mats made by rCF have been selected based on two different polymers (MAPP, PA6) suitable for automotive and industrial sector. First of all, the process layout is discussed according to different manufacturing protocols, oneshot fabrication (namely M1) and lamination consolidation (namely M2). The temperature were selected according to polymer melting point for both the system. A reduction in degree of crystallinity is reported for PA6-60 by M1, while for the MAPP60 system was displayed by lamination consolidation (M2). A critical parameter to be managed during process is the porosity of the final materials, by increasing the number of layer we found there is no impact on the processing procedure with ana averaged porosity of 15% for PA6 and 5% for MAPP, with an elastic modulus of 11 and 15 GPa respectively. Finally, the impact of porosity on elastic modulus for both the systema have been studied discovering that, thank to different polymer moieties could explicate a different effective reinforcement. In fact, this was evidenced by an effective fiber modulus () of 90 GPa for MAPP/60 compared to 60 GPa for PA6/60, attributed to the presence of maleic anhydride in the matrix, which introduces polar groups along PP chain, further increasing adhesion with the rCFs. Furthermore, the average tanδ values of the two materials were analyzed. The PA6/60 has a tanδ value of 0.3, while the MAPP/60 shows a value of approximately 0.2. This means that the PA6/60 dissipates more energy, which can lead to greater viscoelastic deformation and reduced effectiveness in transferring forces from the matrix to the fiber. In contrast, the MAPP/60, with lower energy dissipation, will be more stable with less viscoelastic deformation.
Author Contributions
Conceptualization, A.C. and A.M..; methodology, A.C. and B.P..; investigation, A.C, B.P. and F.C..; data curation, A.C. and M.G.; writing—original draft preparation, A.C., B.P., F.C. and A.M..; writing—review and editing, M.G. and A.M..; supervision, A.M.; funding acquisition, A.M.. All authors have read and agreed to the published version of the manuscript.
Funding
This research was funded by Ministry of Industry and Made in Italy, in the framework of the project MARIS grant number F/310328/01-05/X56.
Acknowledgments
The authors would like to thank Mr. Mario De Angioletti and Mr. Fabio Docimo for their support on experimental characterization.
Conflicts of Interest
The authors declare no conflicts of interest.
References
- S, P.; KM, S.; K, N.; S, S. Fiber Reinforced Composites - A Review. Journal of Material Science & Engineering 2017, 06. [Google Scholar] [CrossRef]
- van de Werken, N.; Tekinalp, H.; Khanbolouki, P.; Ozcan, S.; Williams, A.; Tehrani, M. Additively Manufactured Carbon Fiber-Reinforced Composites: State of the Art and Perspective. Addit Manuf 2020, 31, 100962. [Google Scholar] [CrossRef]
- Mechtcherine, V.; Michel, A.; Liebscher, M.; Schneider, K.; Großmann, C. Mineral-Impregnated Carbon Fiber Composites as Novel Reinforcement for Concrete Construction: Material and Automation Perspectives. Autom Constr 2020, 110, 103002. [Google Scholar] [CrossRef]
- Hazell, P.J.; Stennett, C.; Cooper, G. The Effect of Specimen Thickness on the Shock Propagation along the In-Fibre Direction of an Aerospace-Grade CFRP Laminate. Compos Part A Appl Sci Manuf 2009, 40, 204–209. [Google Scholar] [CrossRef]
- Friedrich, K. Carbon Fiber Reinforced Thermoplastic Composites for Future Automotive Applications.; 2016; p. 020001.
- Yao, S.-S.; Jin, F.-L.; Rhee, K.Y.; Hui, D.; Park, S.-J. Recent Advances in Carbon-Fiber-Reinforced Thermoplastic Composites: A Review. Compos B Eng 2018, 142, 241–250. [Google Scholar] [CrossRef]
- Stieven Montagna, L.; Ferreira de Melo Morgado, G.; Lemes, A.P.; Roberto Passador, F.; Cerqueira Rezende, M. Recycling of Carbon Fiber-Reinforced Thermoplastic and Thermoset Composites: A Review. Journal of Thermoplastic Composite Materials 2023, 36, 3455–3480. [Google Scholar] [CrossRef]
- Zhang, J.; Chevali, V.S.; Wang, H.; Wang, C.-H. Current Status of Carbon Fibre and Carbon Fibre Composites Recycling. Compos B Eng 2020, 193, 108053. [Google Scholar] [CrossRef]
- DIRECTIVE 2008/98/EC OF THE EUROPEAN PARLIAMENT AND OF THE COUNCIL of 19 November 2008 on Waste and Repealing Certain Directives (Text with EEA Relevance).
- Bernatas, R.; Dagreou, S.; Despax-Ferreres, A.; Barasinski, A. Recycling of Fiber Reinforced Composites with a Focus on Thermoplastic Composites. Clean Eng Technol 2021, 5, 100272. [Google Scholar] [CrossRef]
- Türker, Y.S.; Öztürk, F.; Öz, Y. Review of Recycling Methods of Thermoplastic Composite Materials. Polymer-Plastics Technology and Materials 2024, 63, 1693–1713. [Google Scholar] [CrossRef]
- Grigore, M. Methods of Recycling, Properties and Applications of Recycled Thermoplastic Polymers. Recycling 2017, 2, 24. [Google Scholar] [CrossRef]
- Sun, H.; Guo, G.; Memon, S.A.; Xu, W.; Zhang, Q.; Zhu, J.-H.; Xing, F. Recycling of Carbon Fibers from Carbon Fiber Reinforced Polymer Using Electrochemical Method. Compos Part A Appl Sci Manuf 2015, 78, 10–17. [Google Scholar] [CrossRef]
- Ye, S.Y.; Bounaceur, A.; Soudais, Y.; Barna, R. Parameter Optimization of the Steam Thermolysis: A Process to Recover Carbon Fibers from Polymer-Matrix Composites. Waste Biomass Valorization 2013, 4, 73–86. [Google Scholar] [CrossRef]
- Deng, J.; Xu, L.; Liu, J.; Peng, J.; Han, Z.; Shen, Z.; Guo, S. Efficient Method of Recycling Carbon Fiber from the Waste of Carbon Fiber Reinforced Polymer Composites. Polym Degrad Stab 2020, 182, 109419. [Google Scholar] [CrossRef]
- Palmieri, B.; Borriello, C.; Rametta, G.; Iovane, P.; Portofino, S.; Tammaro, L.; Galvagno, S.; Giordano, M.; Ambrosio, L.; Martone, A. Investigation on Stress Relaxation of Discontinuous Recycled Carbon Fiber Composites. J Mater Eng Perform 2023, 32, 3938–3945. [Google Scholar] [CrossRef]
- Tammaro, L.; Martone, A.; Palmieri, B.; Borriello, C.; Portofino, S.; Iovane, P.; Cilento, F.; Giordano, M.; Galvagno, S. Reinforcing Efficiency of Recycled Carbon Fiber PLA Filament Suitable for Additive Manufacturing. Polymers (Basel) 2024, 16, 2100. [Google Scholar] [CrossRef]
- Demski, S.; Misiak, M.; Majchrowicz, K.; Komorowska, G.; Lipkowski, A.; Stankiewicz, K.; Dydek, K.; Waśniewski, B.; Boczkowska, A.; Ehrlich, H. Mechanical Recycling of CFRPs Based on Thermoplastic Acrylic Resin with the Addition of Carbon Nanotubes. Sci Rep 2024, 14, 11550. [Google Scholar] [CrossRef] [PubMed]
- Barnett, P.R.; Ghossein, H.K. A Review of Recent Developments in Composites Made of Recycled Carbon Fiber Textiles. Textiles 2021, 1, 433–465. [Google Scholar] [CrossRef]
- Kessel, F.; Klopsch, L.; Jehle, V.; Biller, N.-J.; Frieß, M.; Shi, Y.; Cepli, D.; Keck, M.; Jemmali, R. Wet-Laid Nonwoven Based Ceramic Matrix Composites: An Innovative and Highly Adaptable Short Fiber Reinforcement for Ceramic Hybrid and Gradient Materials. J Eur Ceram Soc 2021, 41, 4048–4057. [Google Scholar] [CrossRef]
- KM, R.; L, S. Fabrication Techniques of Micro/Nano Fibres Based Nonwoven Composites: A Review. Modern Chemistry & Applications 2017, 05. [Google Scholar] [CrossRef]
- Pimenta, S.; Pinho, S.T.; Robinson, P.; Wong, K.H.; Pickering, S.J. Mechanical Analysis and Toughening Mechanisms of a Multiphase Recycled CFRP. Compos Sci Technol 2010, 70, 1713–1725. [Google Scholar] [CrossRef]
- Quan, D.; Liu, J.; Yao, L.; Dransfeld, C.; Alderliesten, R.; Zhao, G. Interlaminar and Intralaminar Fracture Resistance of Recycled Carbon Fibre/PPS Composites with Tailored Fibre/Matrix Adhesion. Compos Sci Technol 2023, 239, 110051. [Google Scholar] [CrossRef]
- Ma, Y.; Yan, C.; Xu, H.; Liu, D.; Shi, P.; Zhu, Y.; Liu, J. Enhanced Interfacial Properties of Carbon Fiber Reinforced Polyamide 6 Composites by Grafting Graphene Oxide onto Fiber Surface. Appl Surf Sci 2018, 452, 286–298. [Google Scholar] [CrossRef]
- Hossain, Md.T.; Shahid, Md.A.; Mahmud, N.; Habib, A.; Rana, Md.M.; Khan, S.A.; Hossain, Md.D. Research and Application of Polypropylene: A Review. Discover Nano 2024, 19, 2. [Google Scholar] [CrossRef] [PubMed]
- Yamaguchi, A.; Urushisaki, M.; Uematsu, H.; Sakaguchi, T.; Hashimoto, T. Effects of Different Types of Maleic Anhydride-Modified Polypropylene on the Interfacial Shear Strengths of Carbon Fiber-Reinforced Polypropylene Composites. Polym J 2023, 55, 153–161. [Google Scholar] [CrossRef]
- Holmes, M. Recycled Carbon Fiber Composites Become a Reality. Reinforced Plastics 2018, 62, 148–153. [Google Scholar] [CrossRef]
- Ivars, J.; Labanieh, A.R.; Soulat, D. Influence of the Thermoplastic Fiber Ratio on the Mechanical Properties of Recycled Carbon Fibers During the Carding Process. Materials 2025, 18, 302. [Google Scholar] [CrossRef]
- Test Method for Compositional Analysis by Thermogravimetry 2020.
- Test Method for Transition Temperatures and Enthalpies of Fusion and Crystallization of Polymers by Differential Scanning Calorimetry 2021.
- Test Methods for Flexural Properties of Unreinforced and Reinforced Plastics and Electrical Insulating Materials 2017.
- Harper, D.P.; Laborie, M.P.G.; Wolcott, M.P. The Impact of Polypropylene-Graft-Maleic Anhydride on the Crystallization and Dynamic Mechanical Properties of Isotactic Polypropylene. J Appl Polym Sci 2009, 111, 753–758. [Google Scholar] [CrossRef]
- Song, B.; Wang, Y.; Bai, H.; Liu, L.; Li, Y.; Zhang, J.; Zhou, Z. Crystallization and Melting Behaviors of Maleic Anhydride Grafted Poly(Propylene) Nucleated by an Aryl Amide Derivative. J Therm Anal Calorim 2010, 99, 563–570. [Google Scholar] [CrossRef]
- Cilento, F.; Martone, A.; Pastore Carbone, M.G.; Galiotis, C.; Giordano, M. Nacre-like GNP/Epoxy Composites: Reinforcement Efficiency Vis-à-Vis Graphene Content. Compos Sci Technol 2021, 211, 108873. [Google Scholar] [CrossRef]
- Lee, T.H.; Boey, F.Y.C. ON THE DETERMINATION OF POLYMER CRYSTALLINITY FOR A THERMOPLASTIC PPS COMPOSITE BY THERMAL ANALYSIS; 1995; Vol. 53.
- Chen, J.; Zhu, J.; Wu, H.; Guo, S.; Qiu, J. Constructing Highly Aligned Crystalline Structure to Enhance Sliding Wear Performance of Bulk Polyamide 6. Polymer (Guildf) 2021, 237. [Google Scholar] [CrossRef]
- Simaafrookhteh, S.; Van Thillo, T.; Lomov, S. V.; Ivens, J. Crystallinity of Neat and Carbon Fiber-Reinforced Polyamide-6 Processed at Different Cooling Rates. Compos Part A Appl Sci Manuf 2025, 188. [Google Scholar] [CrossRef]
- Zheng, Y.; Gu, F.; Wang, B.; Wang, Z.; Gao, C.; Zhou, Y.; Hall, P. Thermal and Mechanical Behaviour of Recycled Short Milled Carbon Fibre Reinforced Polypropylene and Recycled Polypropylene Composites: A Comparative Study. Journal of Materials Research and Technology 2024, 32, 4221–4233. [Google Scholar] [CrossRef]
- Canopoli, L.; Coulon, F.; Wagland, S.T. Degradation of Excavated Polyethylene and Polypropylene Waste from Landfill. Science of the Total Environment 2020, 698. [Google Scholar] [CrossRef] [PubMed]
- Andersons, J.; Spārniņš, E.; Joffe, R. Stiffness and Strength of Flax Fiber/Polymer Matrix Composites. Polym Compos 2006, 27, 221–229. [Google Scholar] [CrossRef]
- Jannerfeldt, G.; Törnqvist, R.; Rambert, N.; Boogh, L.; Månson, J.-A.E. Matrix Modification for Improved Reinforcement Effectiveness in Polypropylene/Glass Fibre Composites. Applied Composite Materials 2001, 8, 327–341. [Google Scholar] [CrossRef]
- Szpieg, M.; Wysocki, M.; Asp, L. Mechanical Performance and Modelling of a Fully Recycled Modified CF/PP Composite. J Compos Mater 2012, 46, 1503–1517. [Google Scholar] [CrossRef]
- Tam, D.K.Y.; Ruan, S.; Gao, P.; Yu, T. High-Performance Ballistic Protection Using Polymer Nanocomposites. In Advances in Military Textiles and Personal Equipment; Elsevier, 2012; pp. 213–237.
- Yan, J.; Demirci, E.; Gleadall, A. Are Classical Fibre Composite Models Appropriate for Material Extrusion Additive Manufacturing? A Thorough Evaluation of Analytical Models. Addit Manuf 2023, 62, 103371. [Google Scholar] [CrossRef]
- Palola, S.; Laurikainen, P.; García-Arrieta, S.; Astorkia, E.G.; Sarlin, E. Towards Sustainable Composite Manufacturing with Recycled Carbon Fiber Reinforced Thermoplastic Composites. Polymers (Basel) 2022, 14. [Google Scholar] [CrossRef]
- Nevare, M.R.; Tatiya, P.D.; Mahulikar, P.P.; Gite, V. V. Effect of Maleated Polypropylene as a Compatibilizer and Hyperbranched Polyester as a Processing Aid on Polypropylene-wood Flour Biocomposites. Journal of Vinyl and Additive Technology 2018, 24, 179–184. [Google Scholar] [CrossRef]
Figure 1.
Schematic diagram of two compression molding process: a) oneshot and b) lamination.
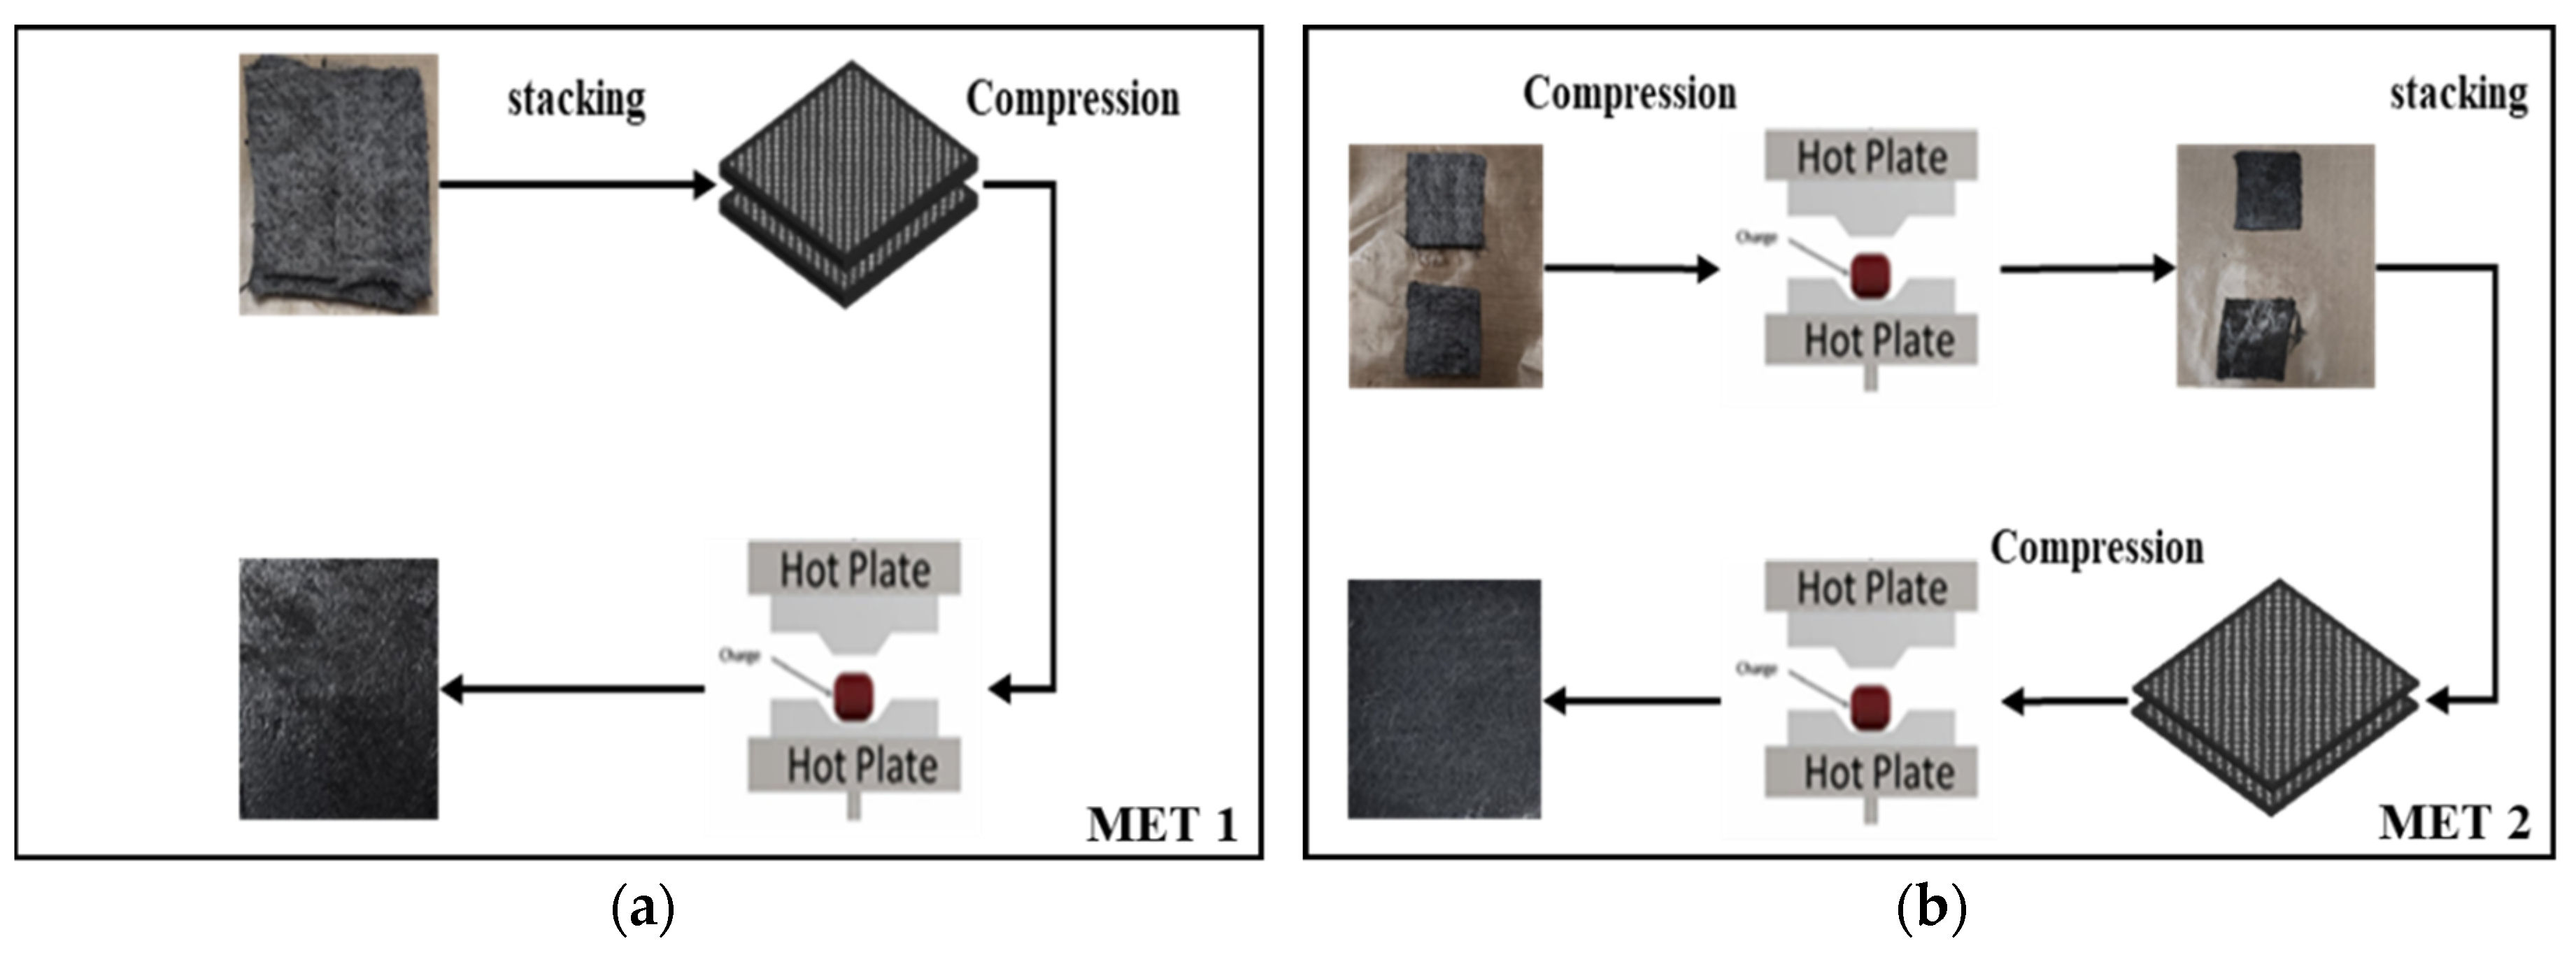
Figure 2.
Panels of: (a) PA6/60 oneshot b) PA6/60 laminated c) MAPP/60 oneshot d) MAPP/60 laminated.
Figure 2.
Panels of: (a) PA6/60 oneshot b) PA6/60 laminated c) MAPP/60 oneshot d) MAPP/60 laminated.
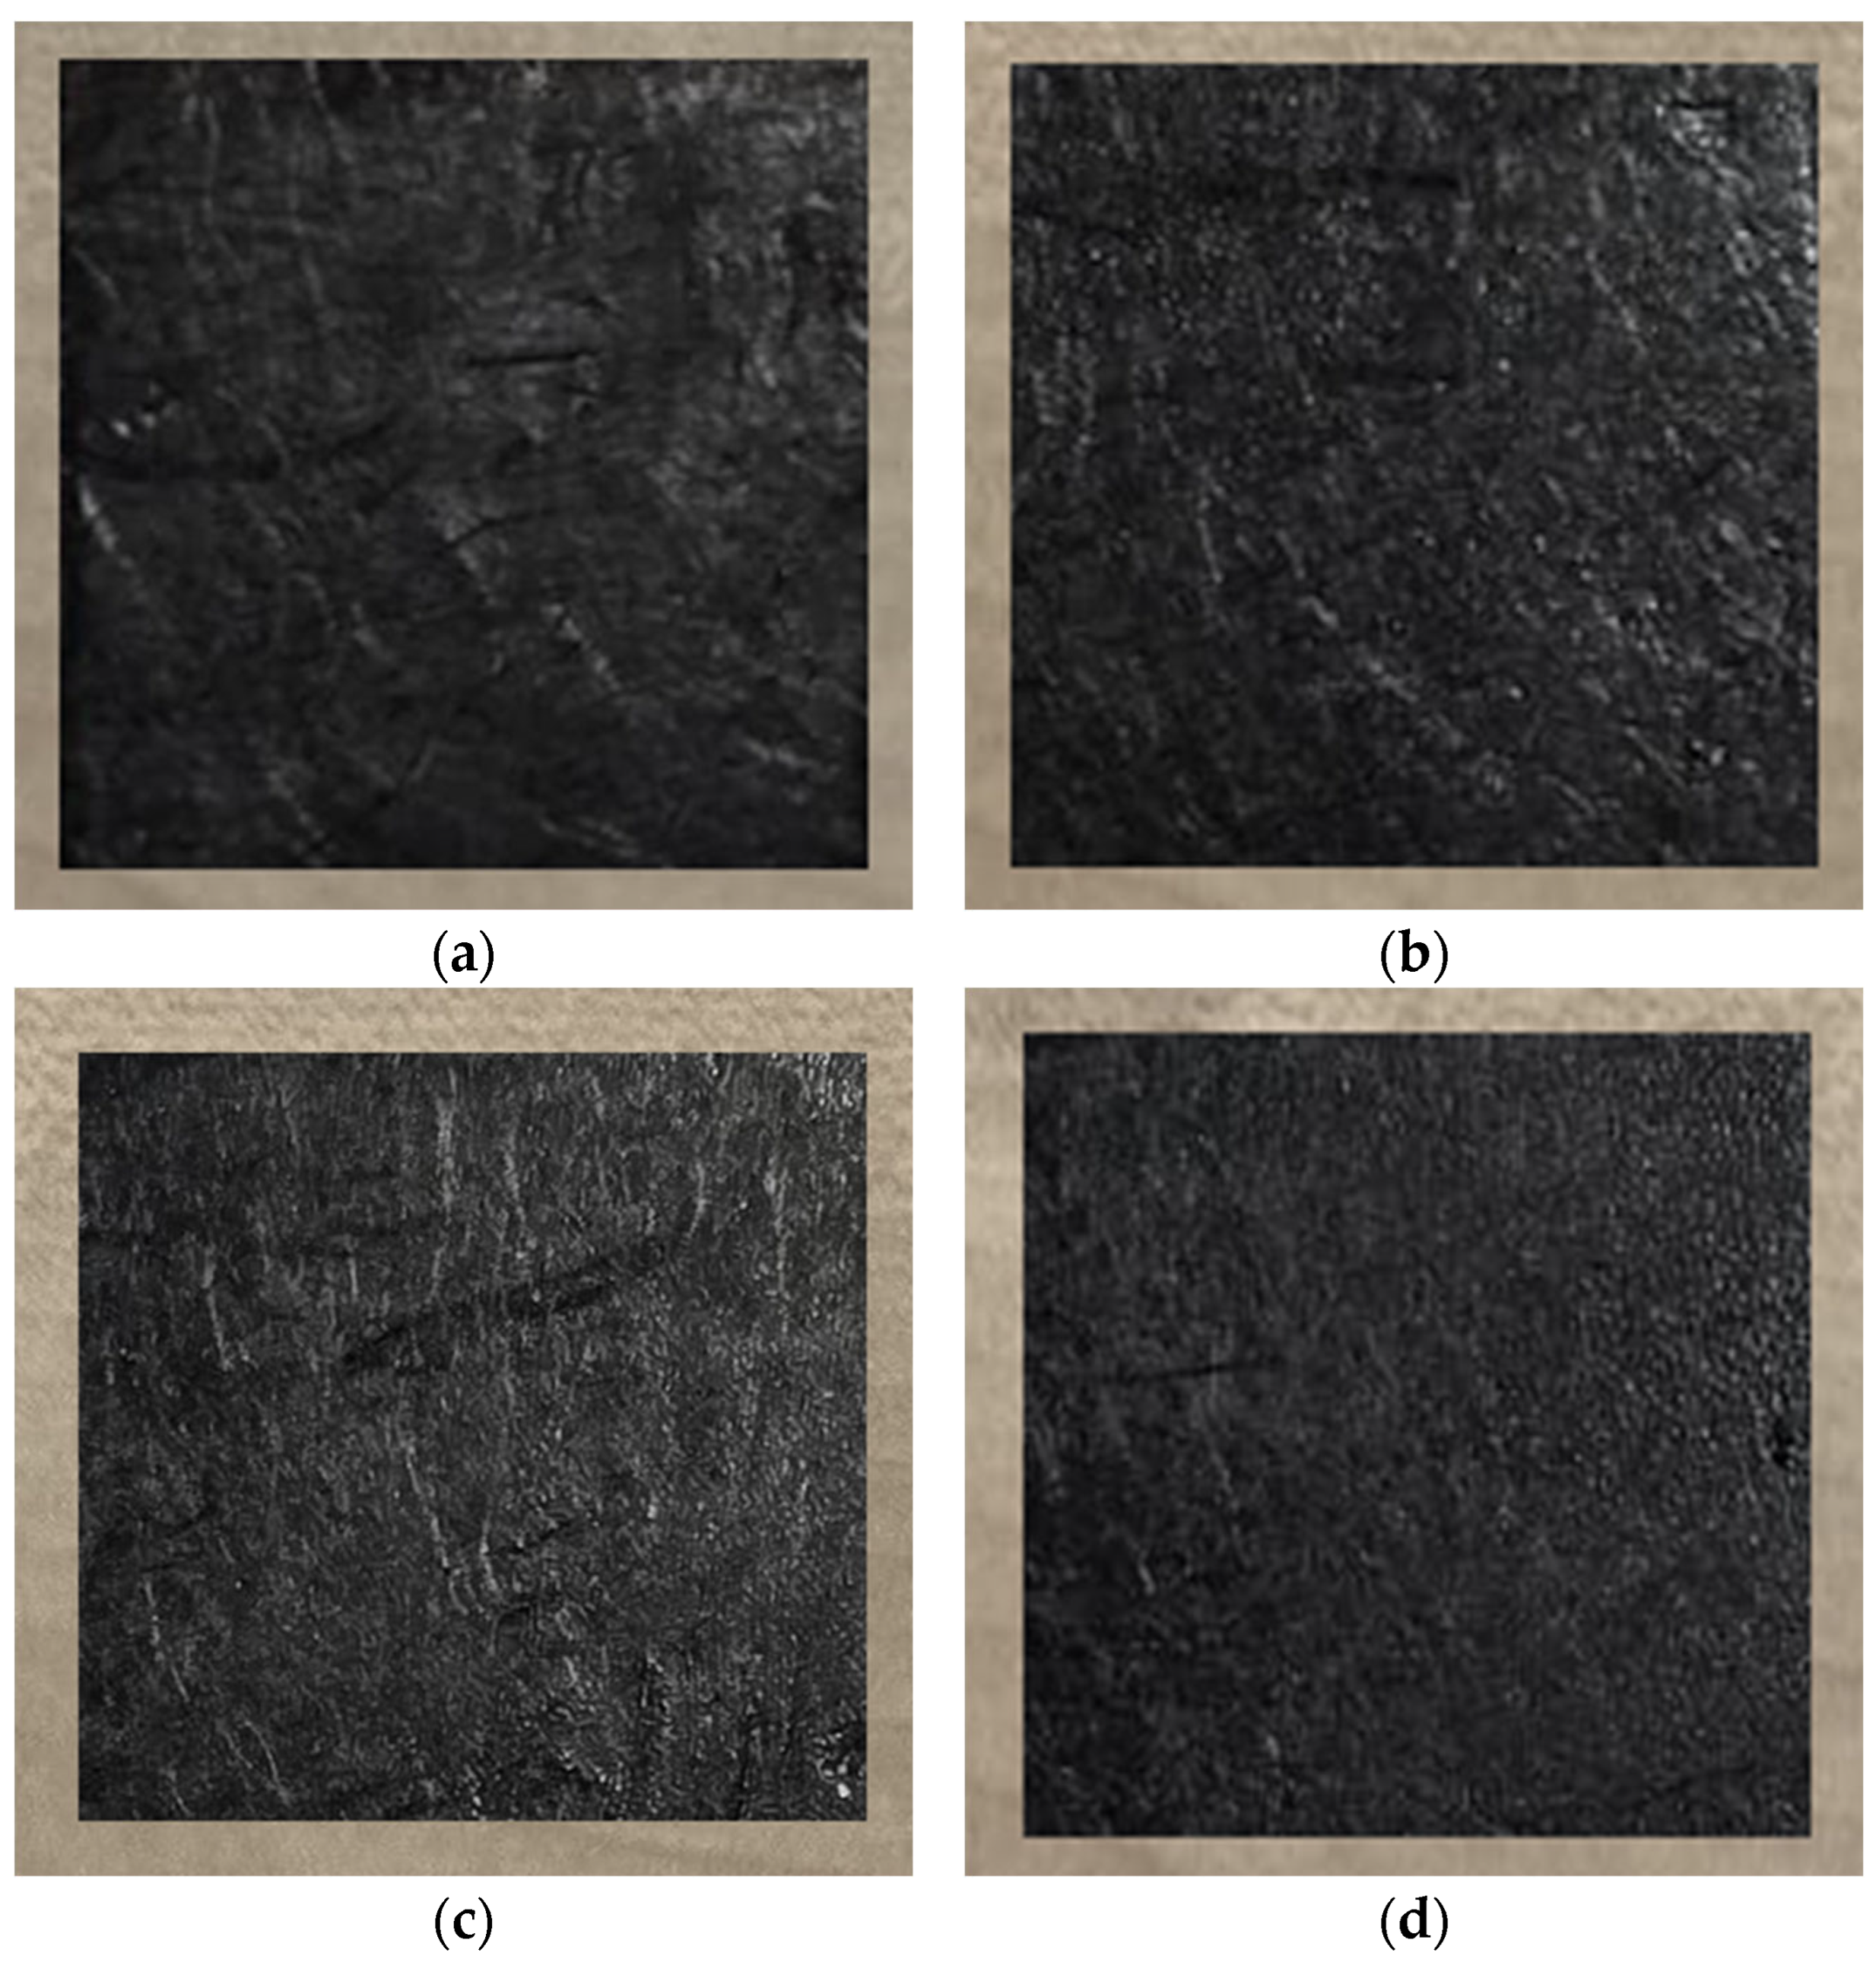
Figure 3.
Process parameters for PA6/60 of: (a) oneshot process and (b) lamination process.
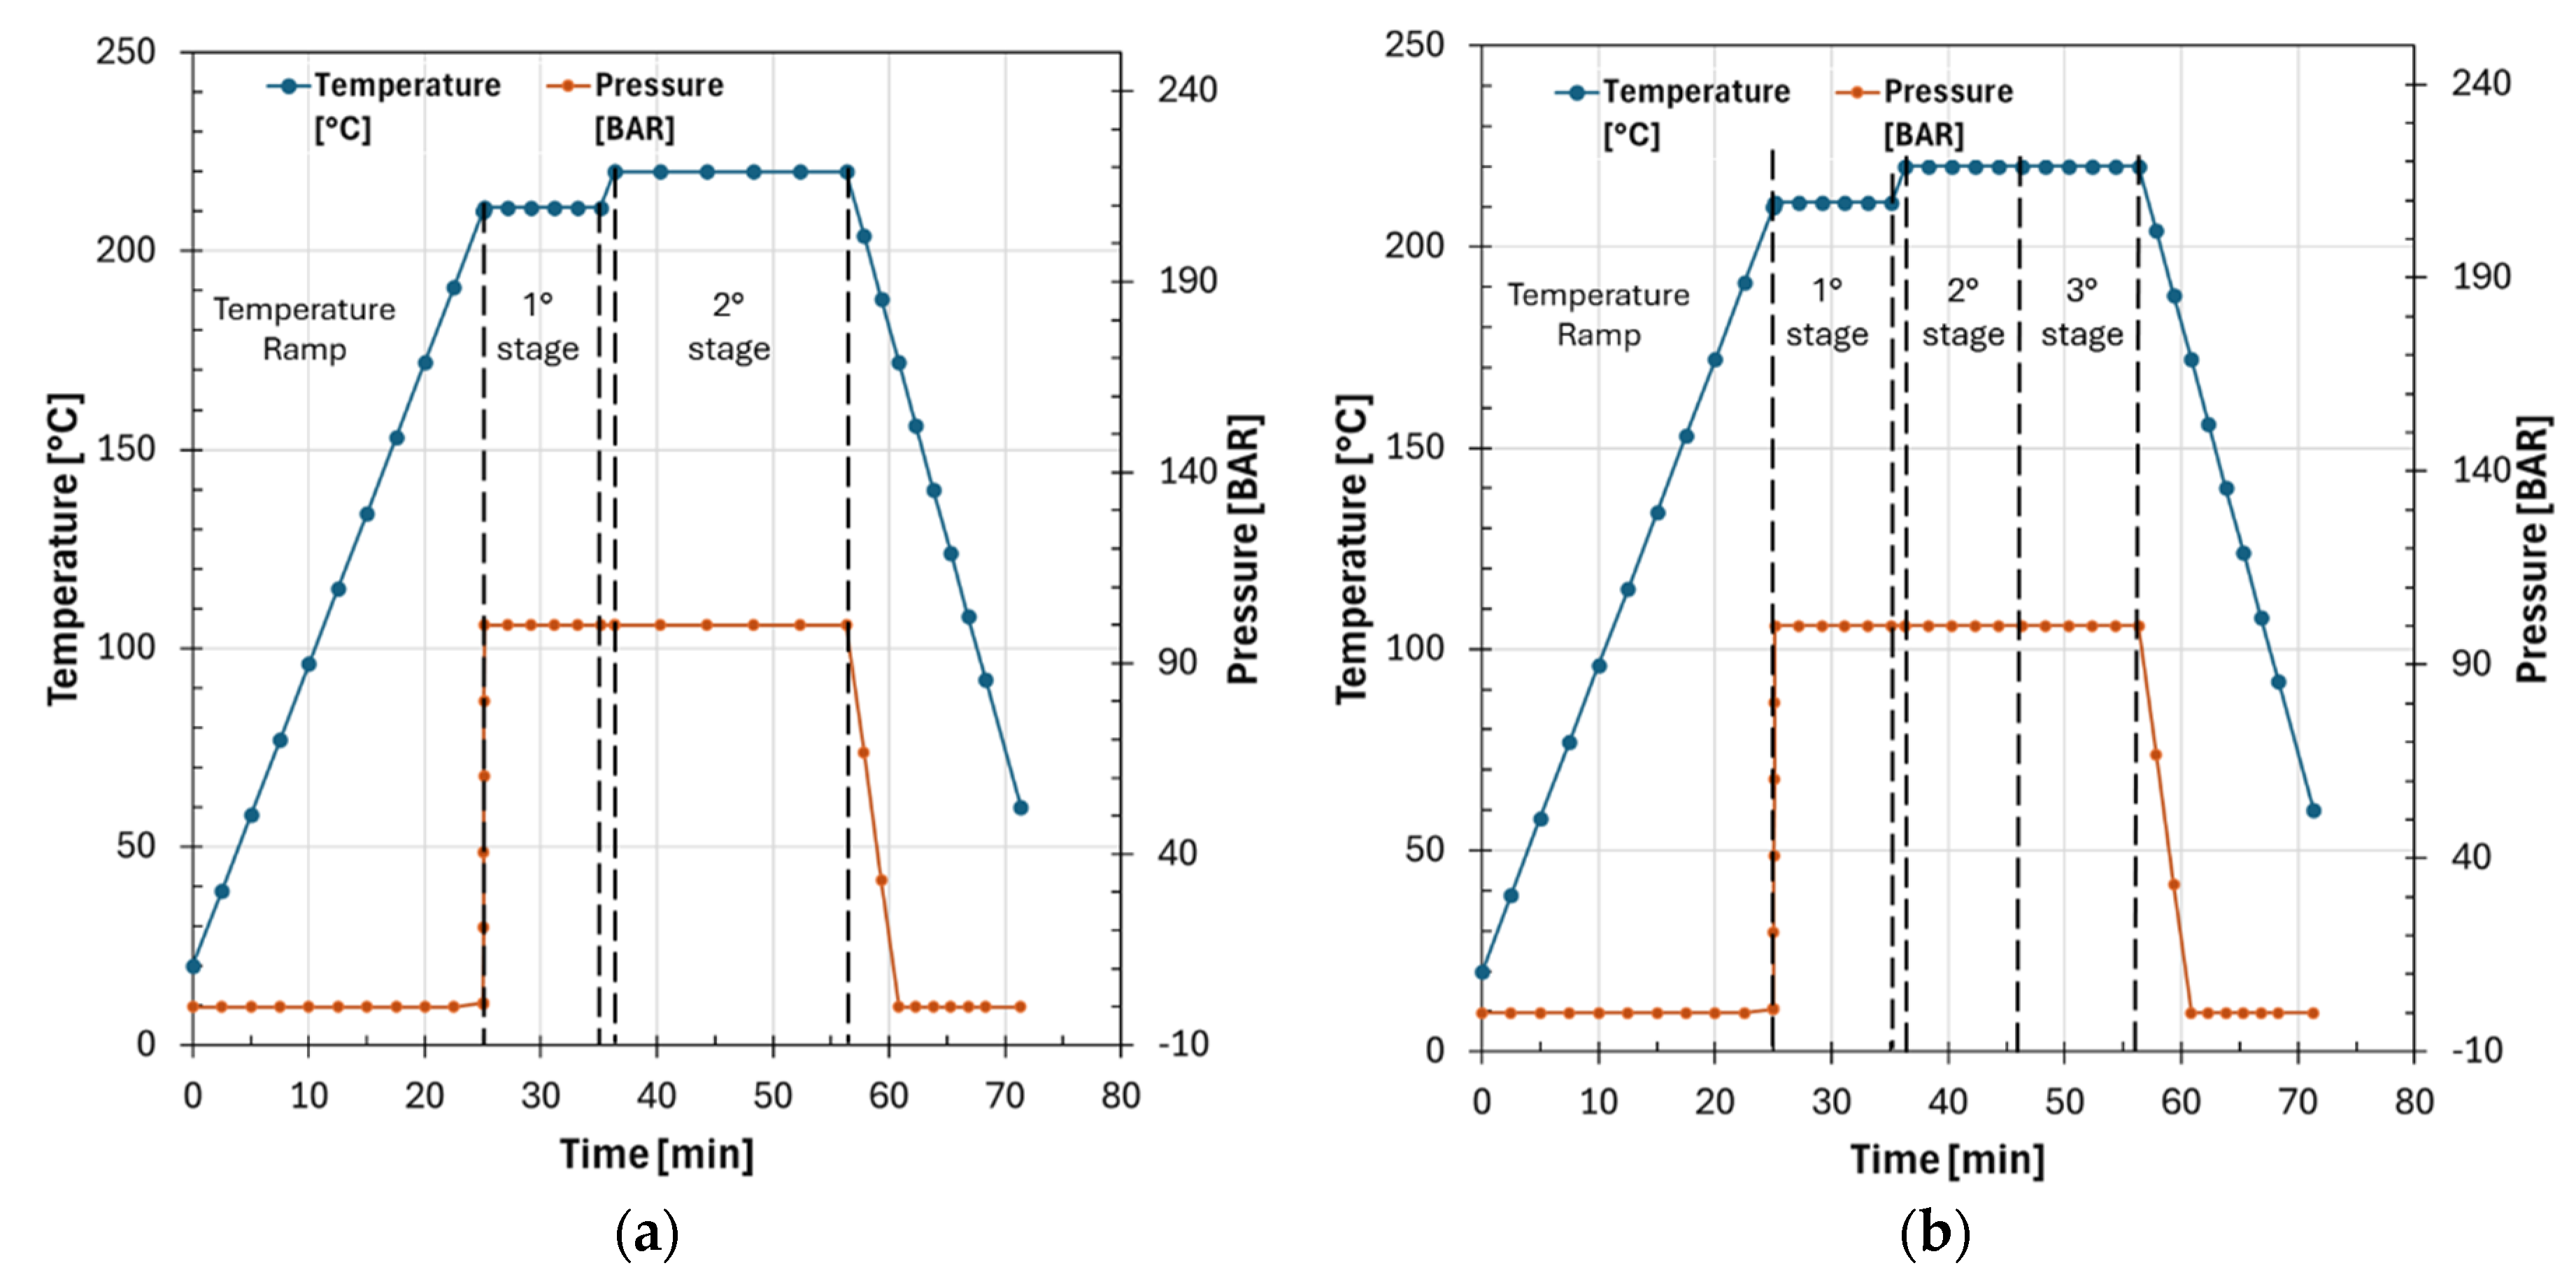
Figure 4.
Process parameters for MAPP/60 of: (a) oneshot process and (b) lamination process.
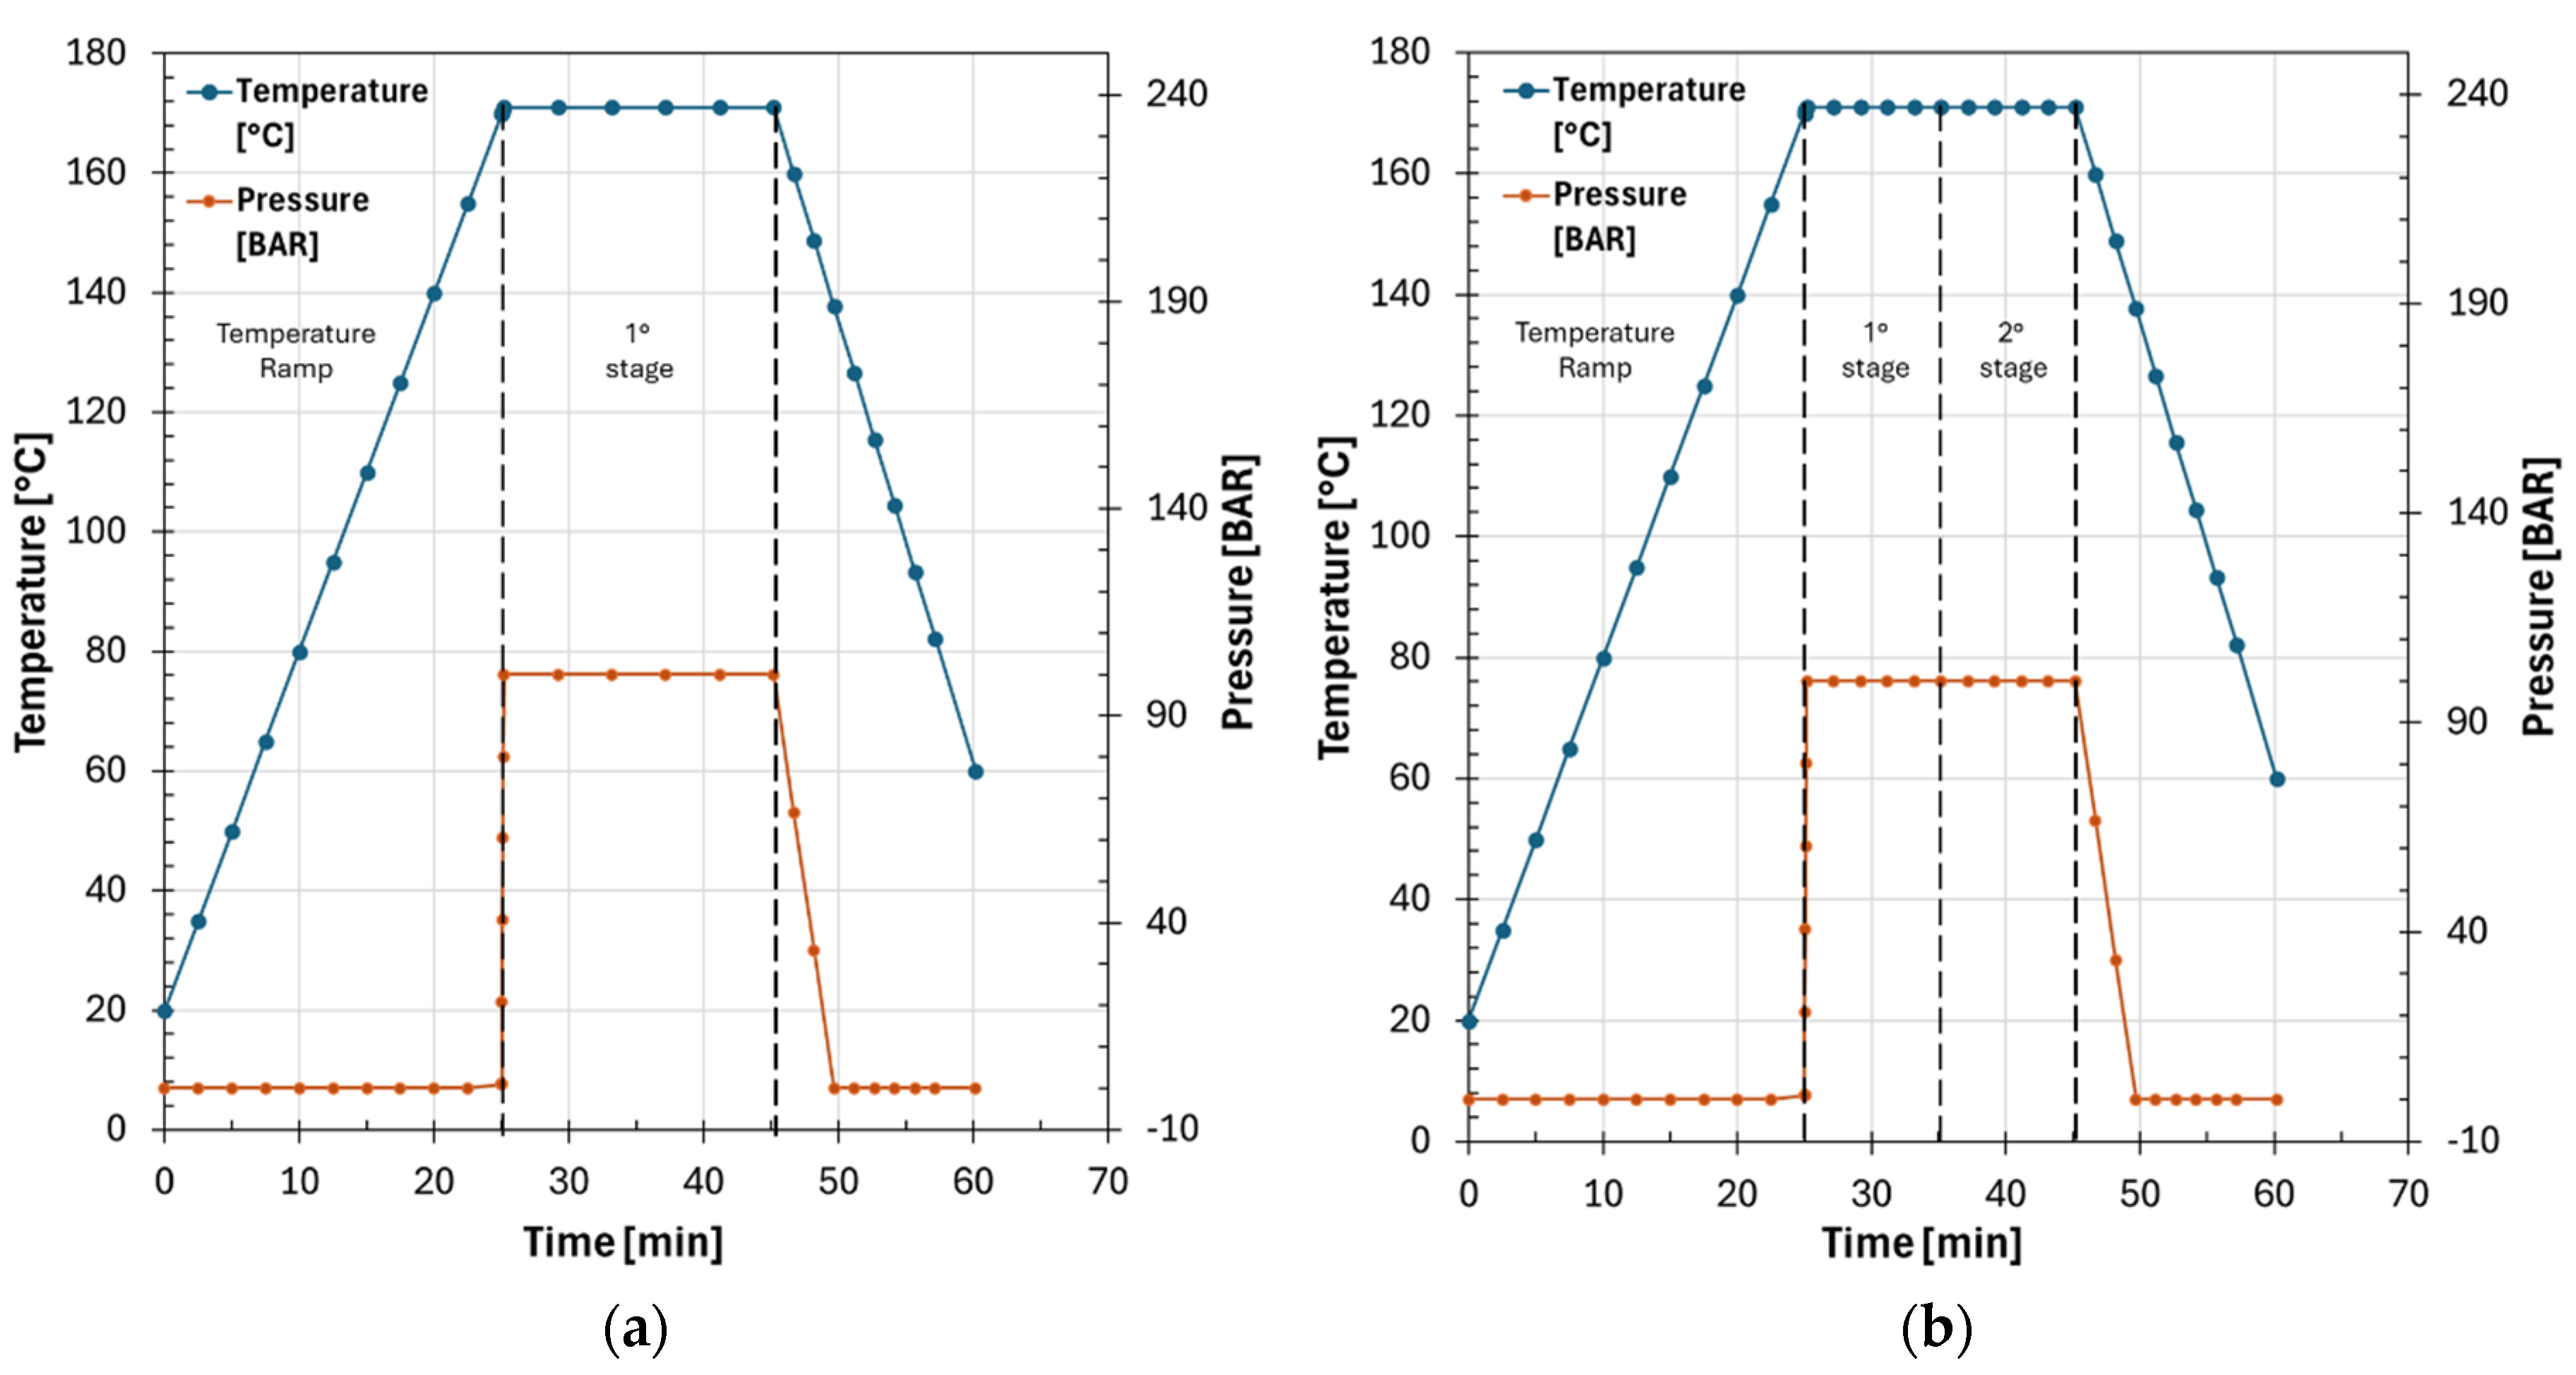
Figure 5.
TGA thermograms, weight (%) in solid line and derivative weight(%/°C) in dotted one, for: (a) PA6/60 and (b) MAPP/60.
Figure 5.
TGA thermograms, weight (%) in solid line and derivative weight(%/°C) in dotted one, for: (a) PA6/60 and (b) MAPP/60.
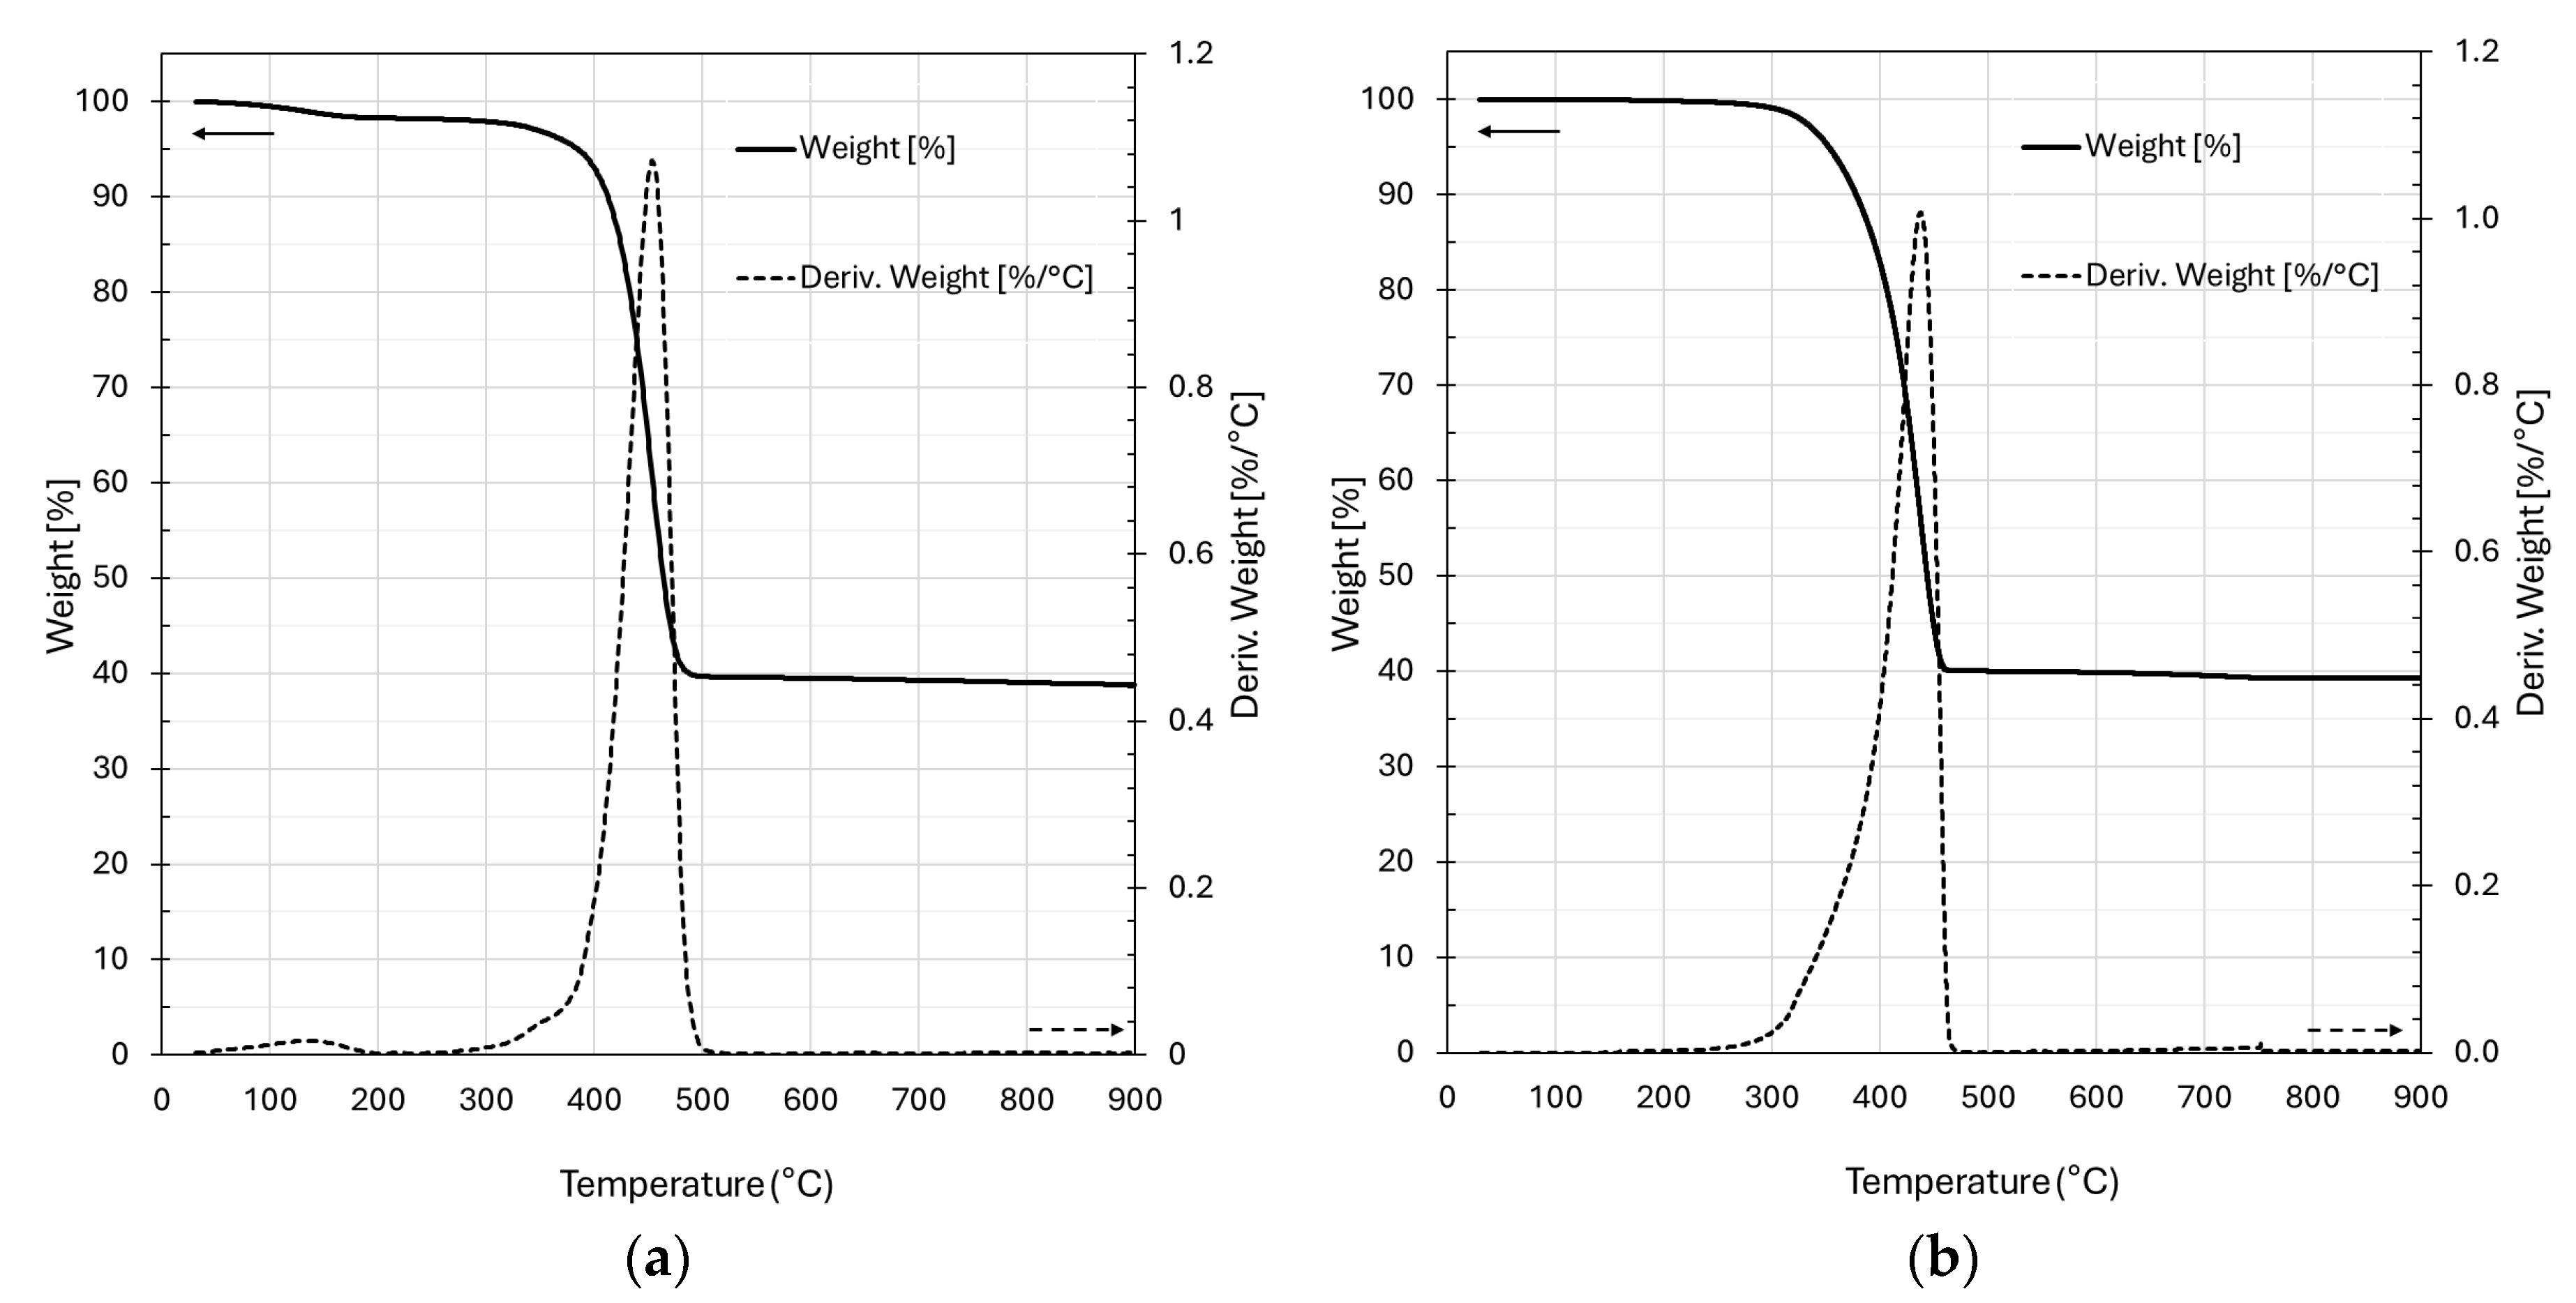
Figure 6.
DSC curves of the sample (a) I and II scan of PA6/60 and (b) I and II scan of MAPP/60.
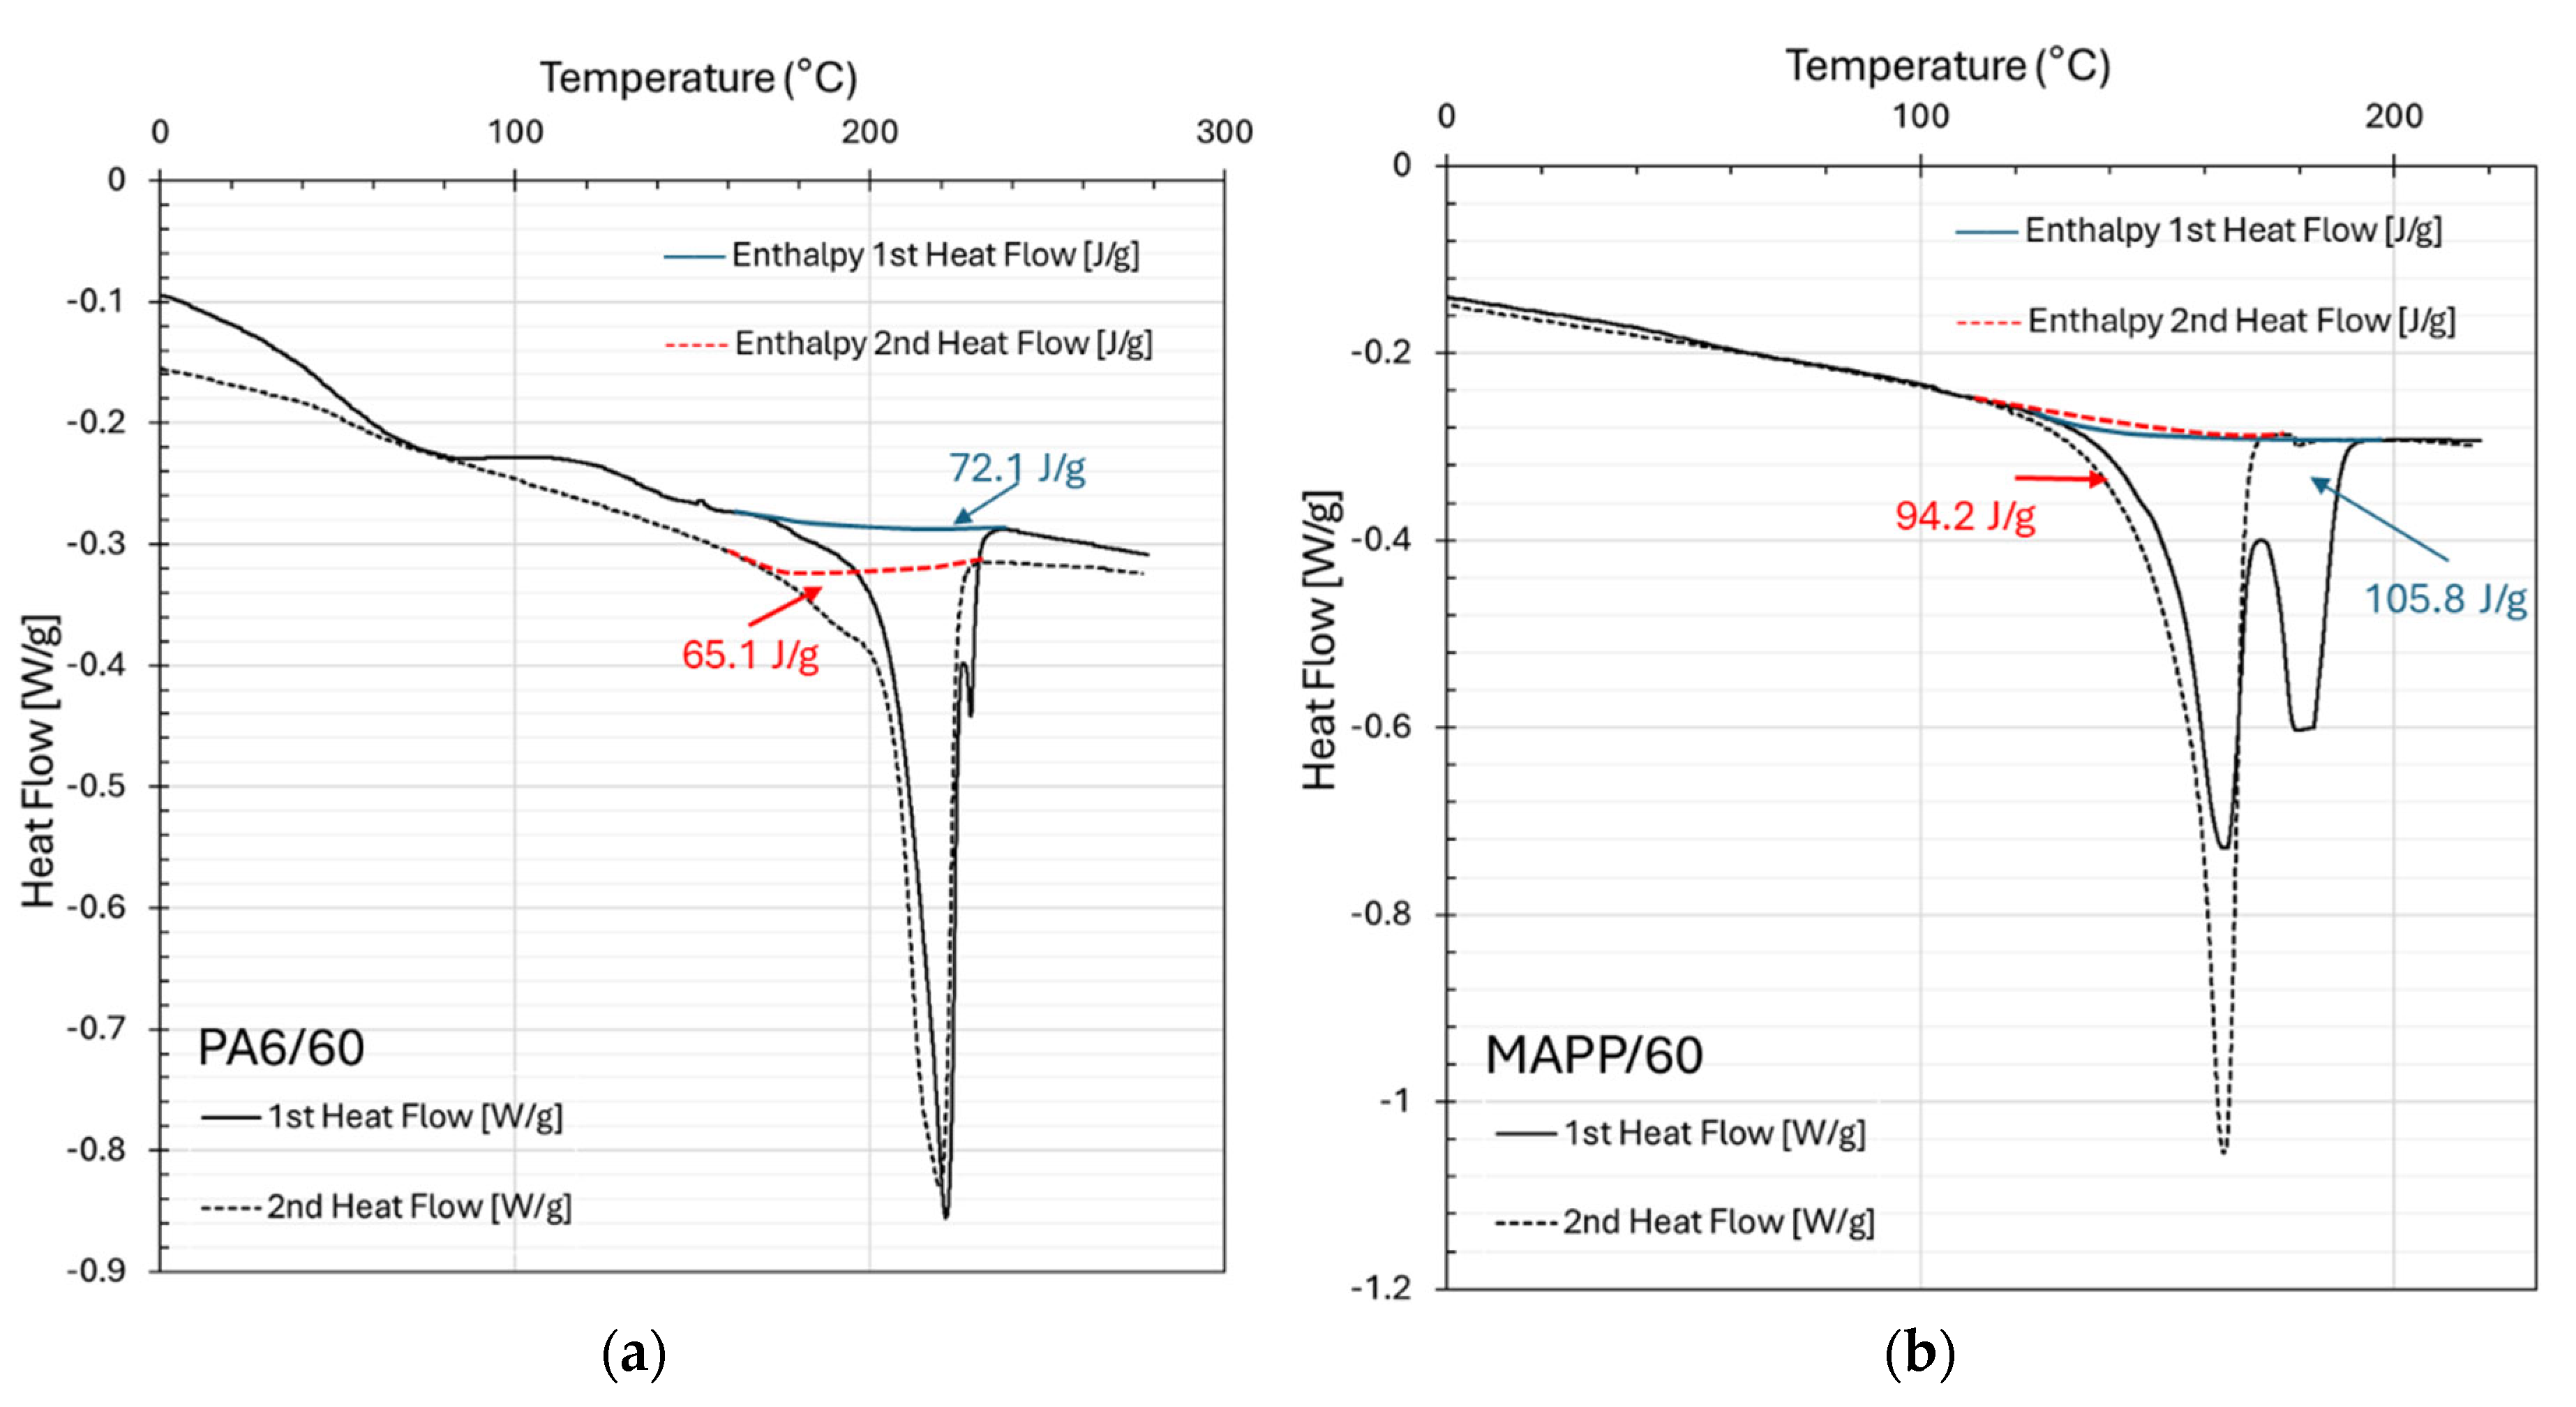
Figure 7.
The first row shows the DMA curves of the panels manufactured using the first method, specifically: (a) PA6/60 single layer; (b) PA6/60 2LM1; (c) PA6/60 3LM1. The second row presents (d) a micrograph of a PA6/60 three-layer panel near a porosity and the DMA curves of the panels manufactured using the second method: (e) PA6/60 2LM2; (f) PA6/60 3LM2.
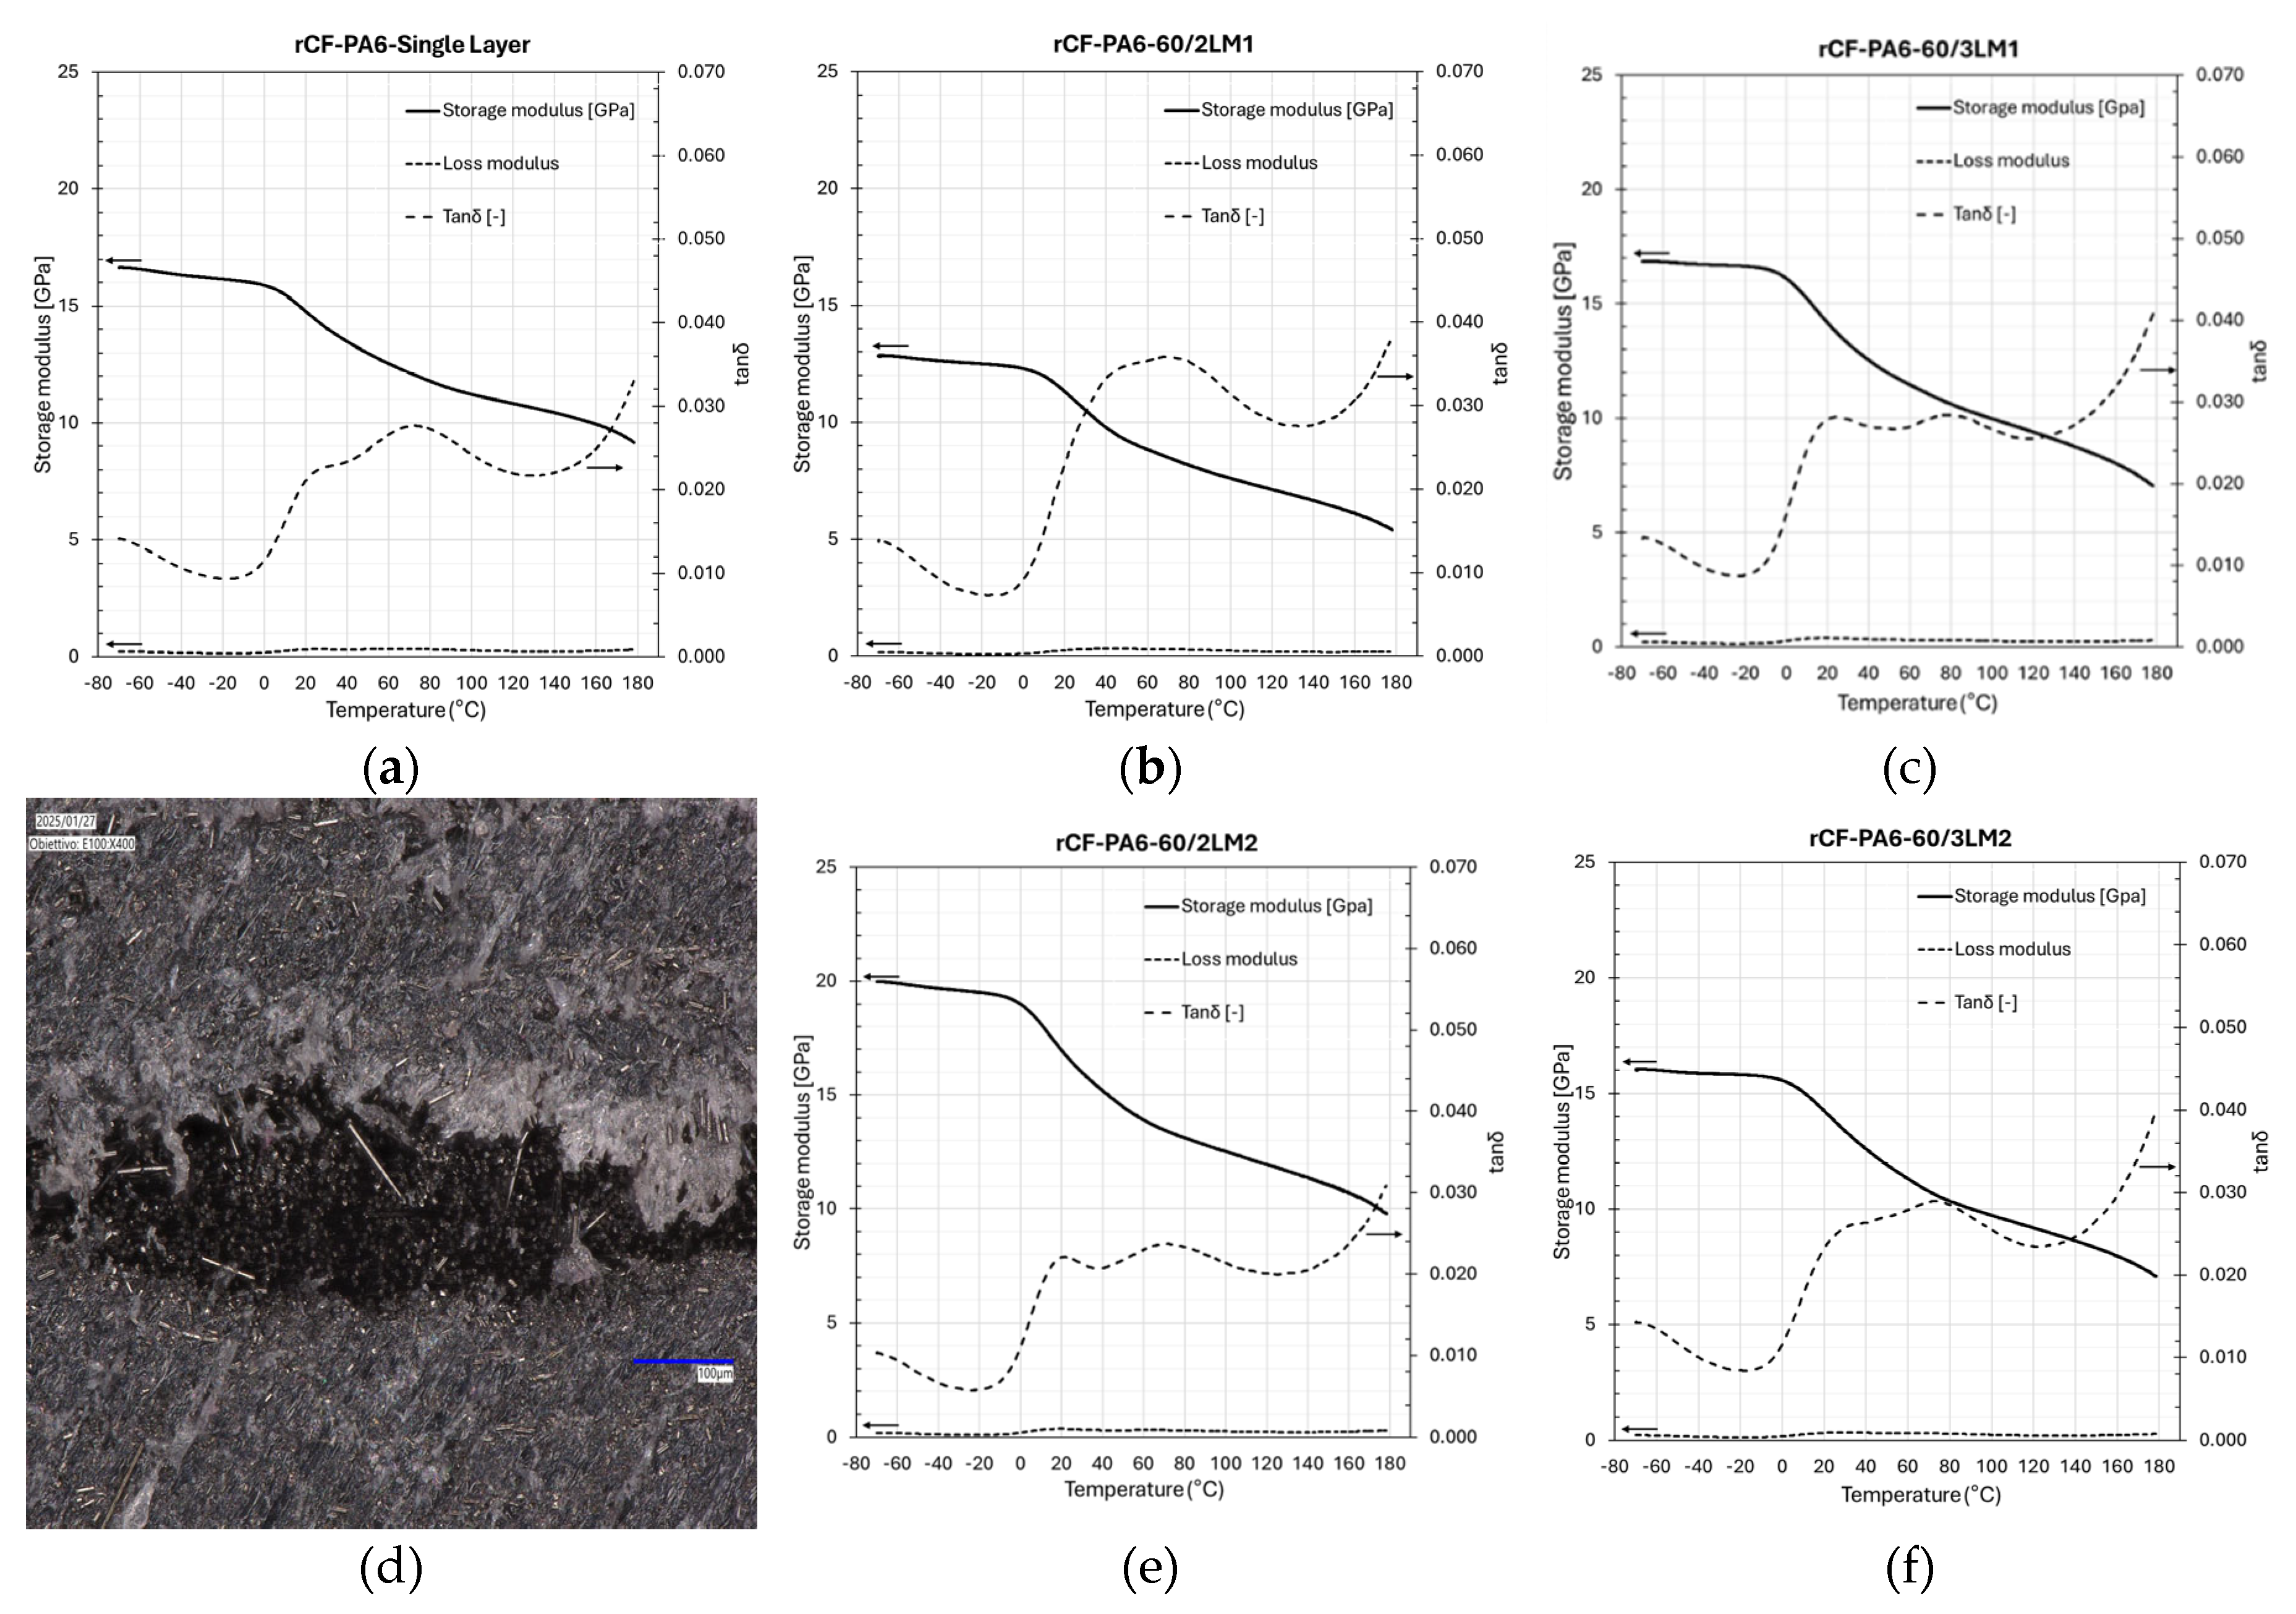
Figure 8.
The first row shows the DMA curves of the panels manufactured using the first method, specifically: (a) MAPP/60 single layer; (b) MAPP/60 2LM1; (c) MAPP/60 3LM1. The second row presents (d) a micrograph of a MAPP/60 three-layer panel, and the DMA curves of the panels manufactured using the second method: (e) MAPP/60 2LM2; (f) MAPP/60 3LM2.
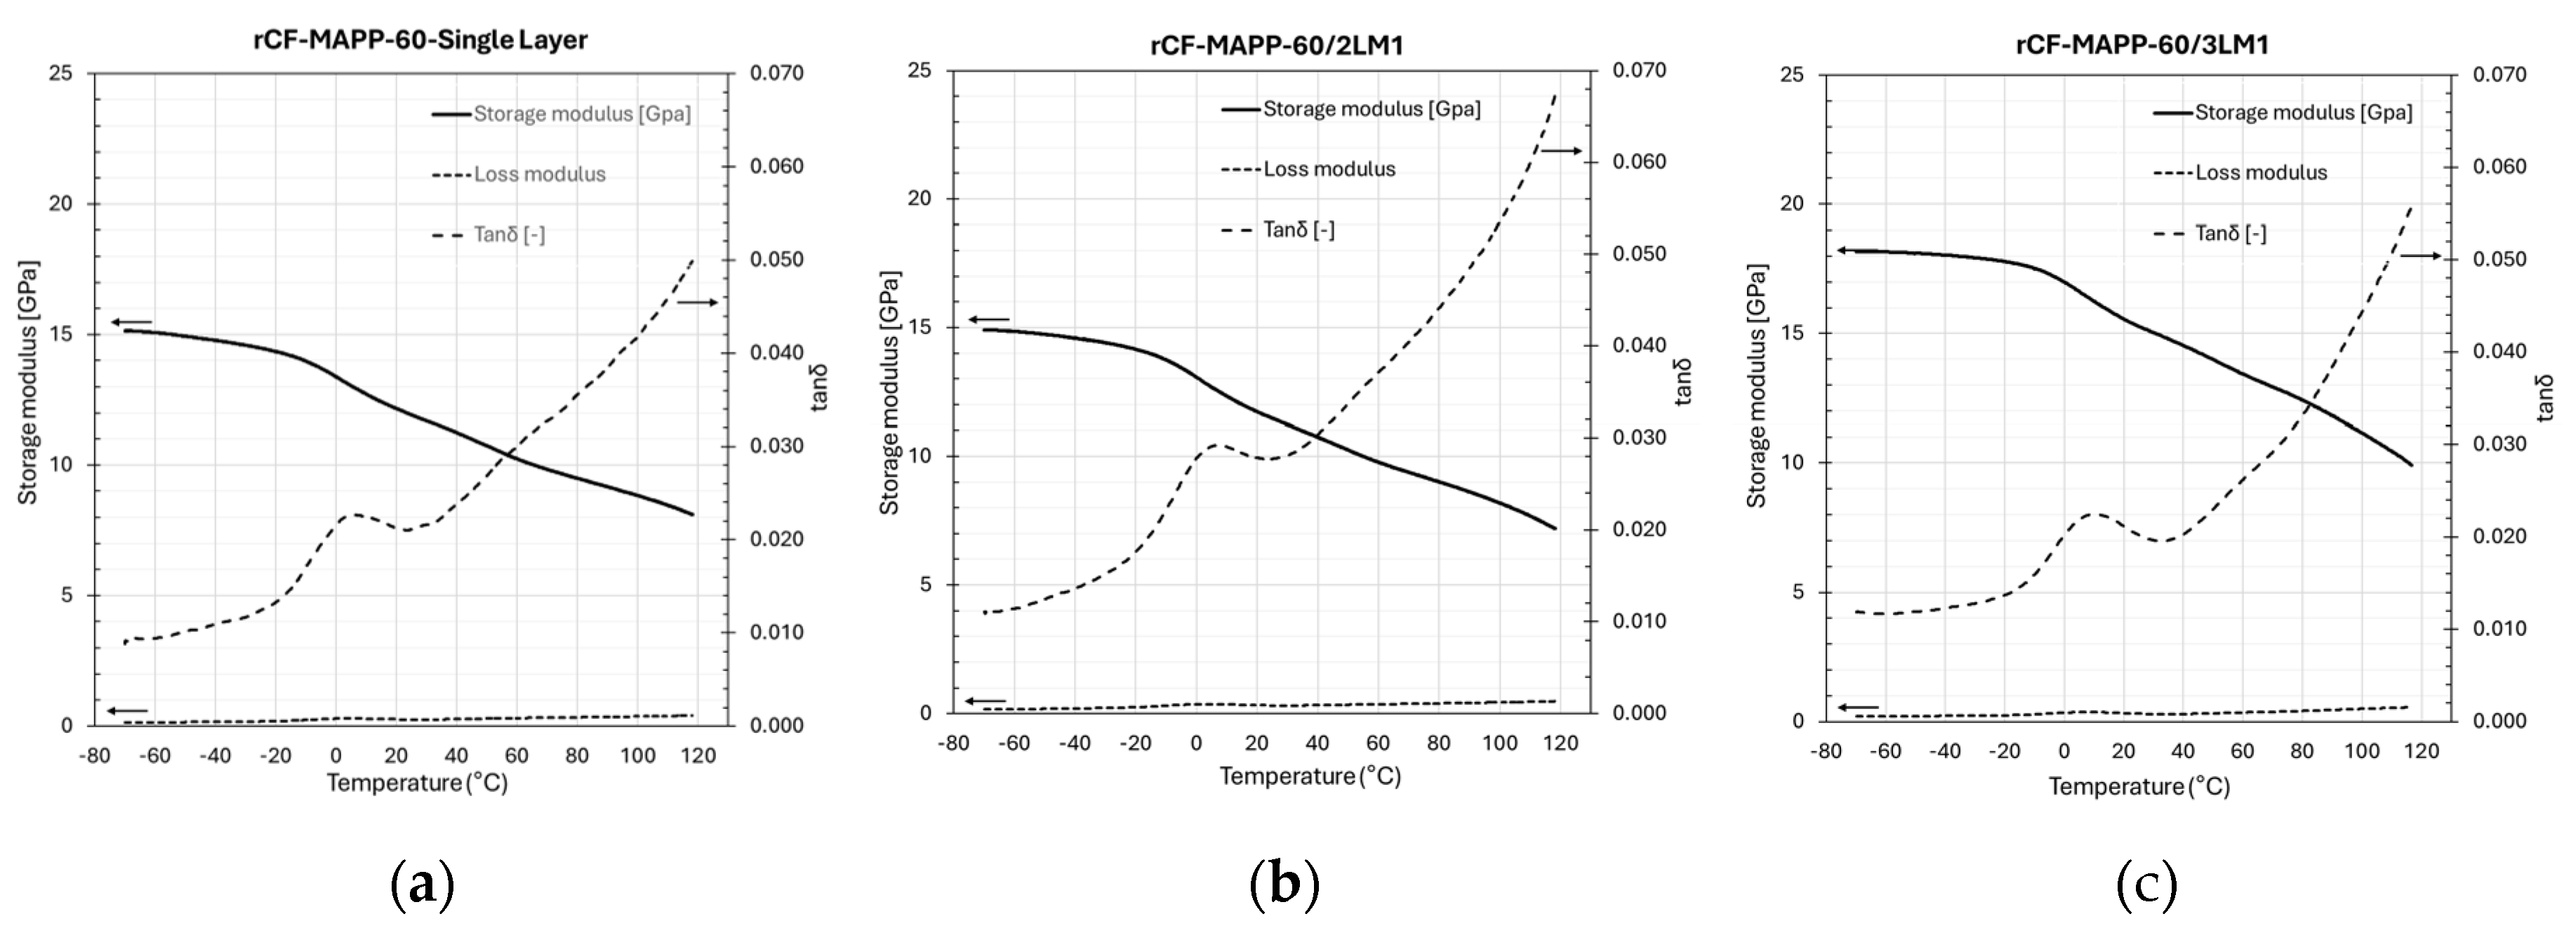
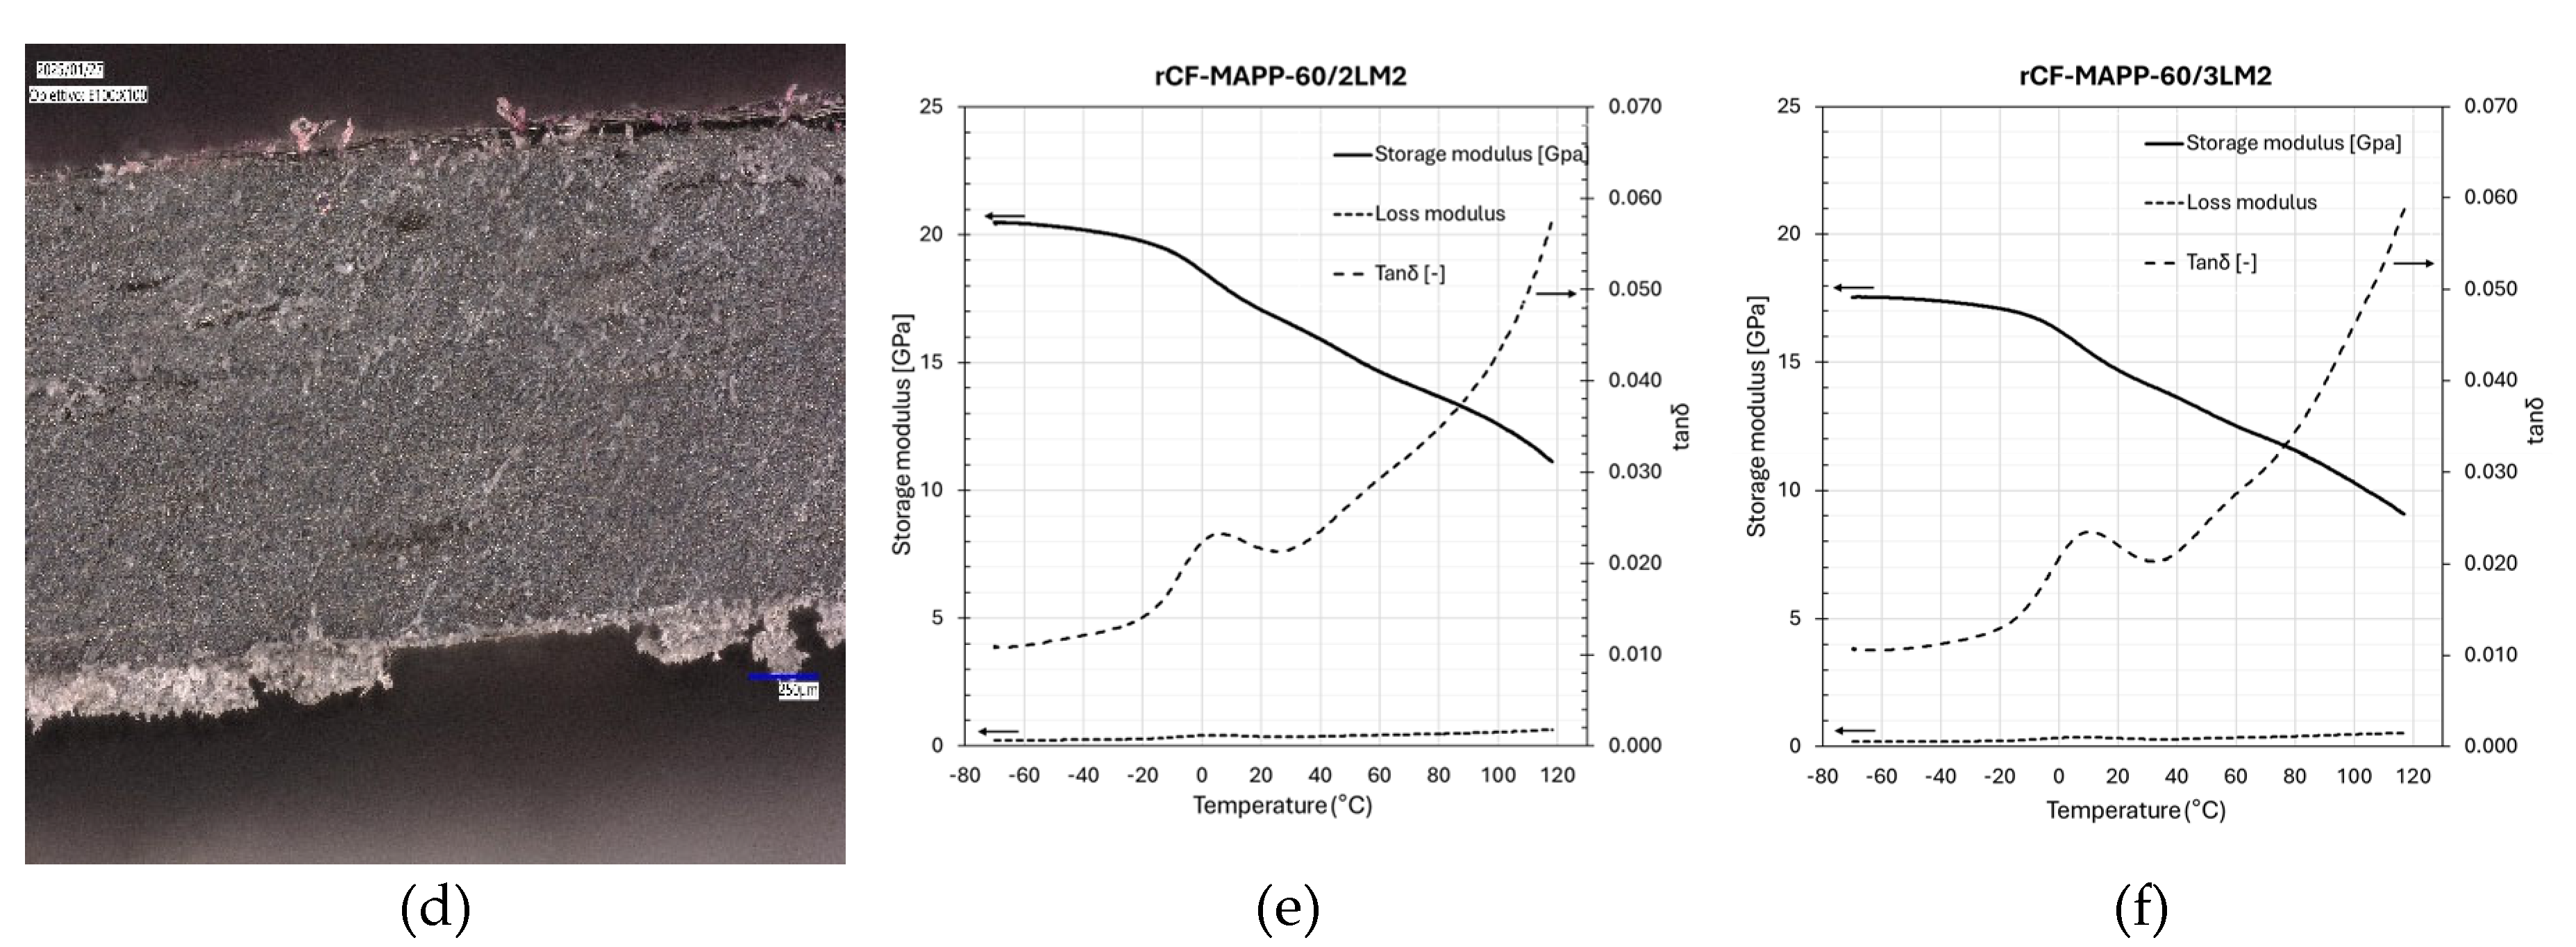
Figure 9.
Relationship between Young's Modulus and Porosity for various PA6/60 composite configurations. The graph shows a strong negative correlation (R² = 0.979), with a linear regression equation of y = -45.89x + 19.29. Error bars represent the measurement uncertainties for each data point.
Figure 9.
Relationship between Young's Modulus and Porosity for various PA6/60 composite configurations. The graph shows a strong negative correlation (R² = 0.979), with a linear regression equation of y = -45.89x + 19.29. Error bars represent the measurement uncertainties for each data point.
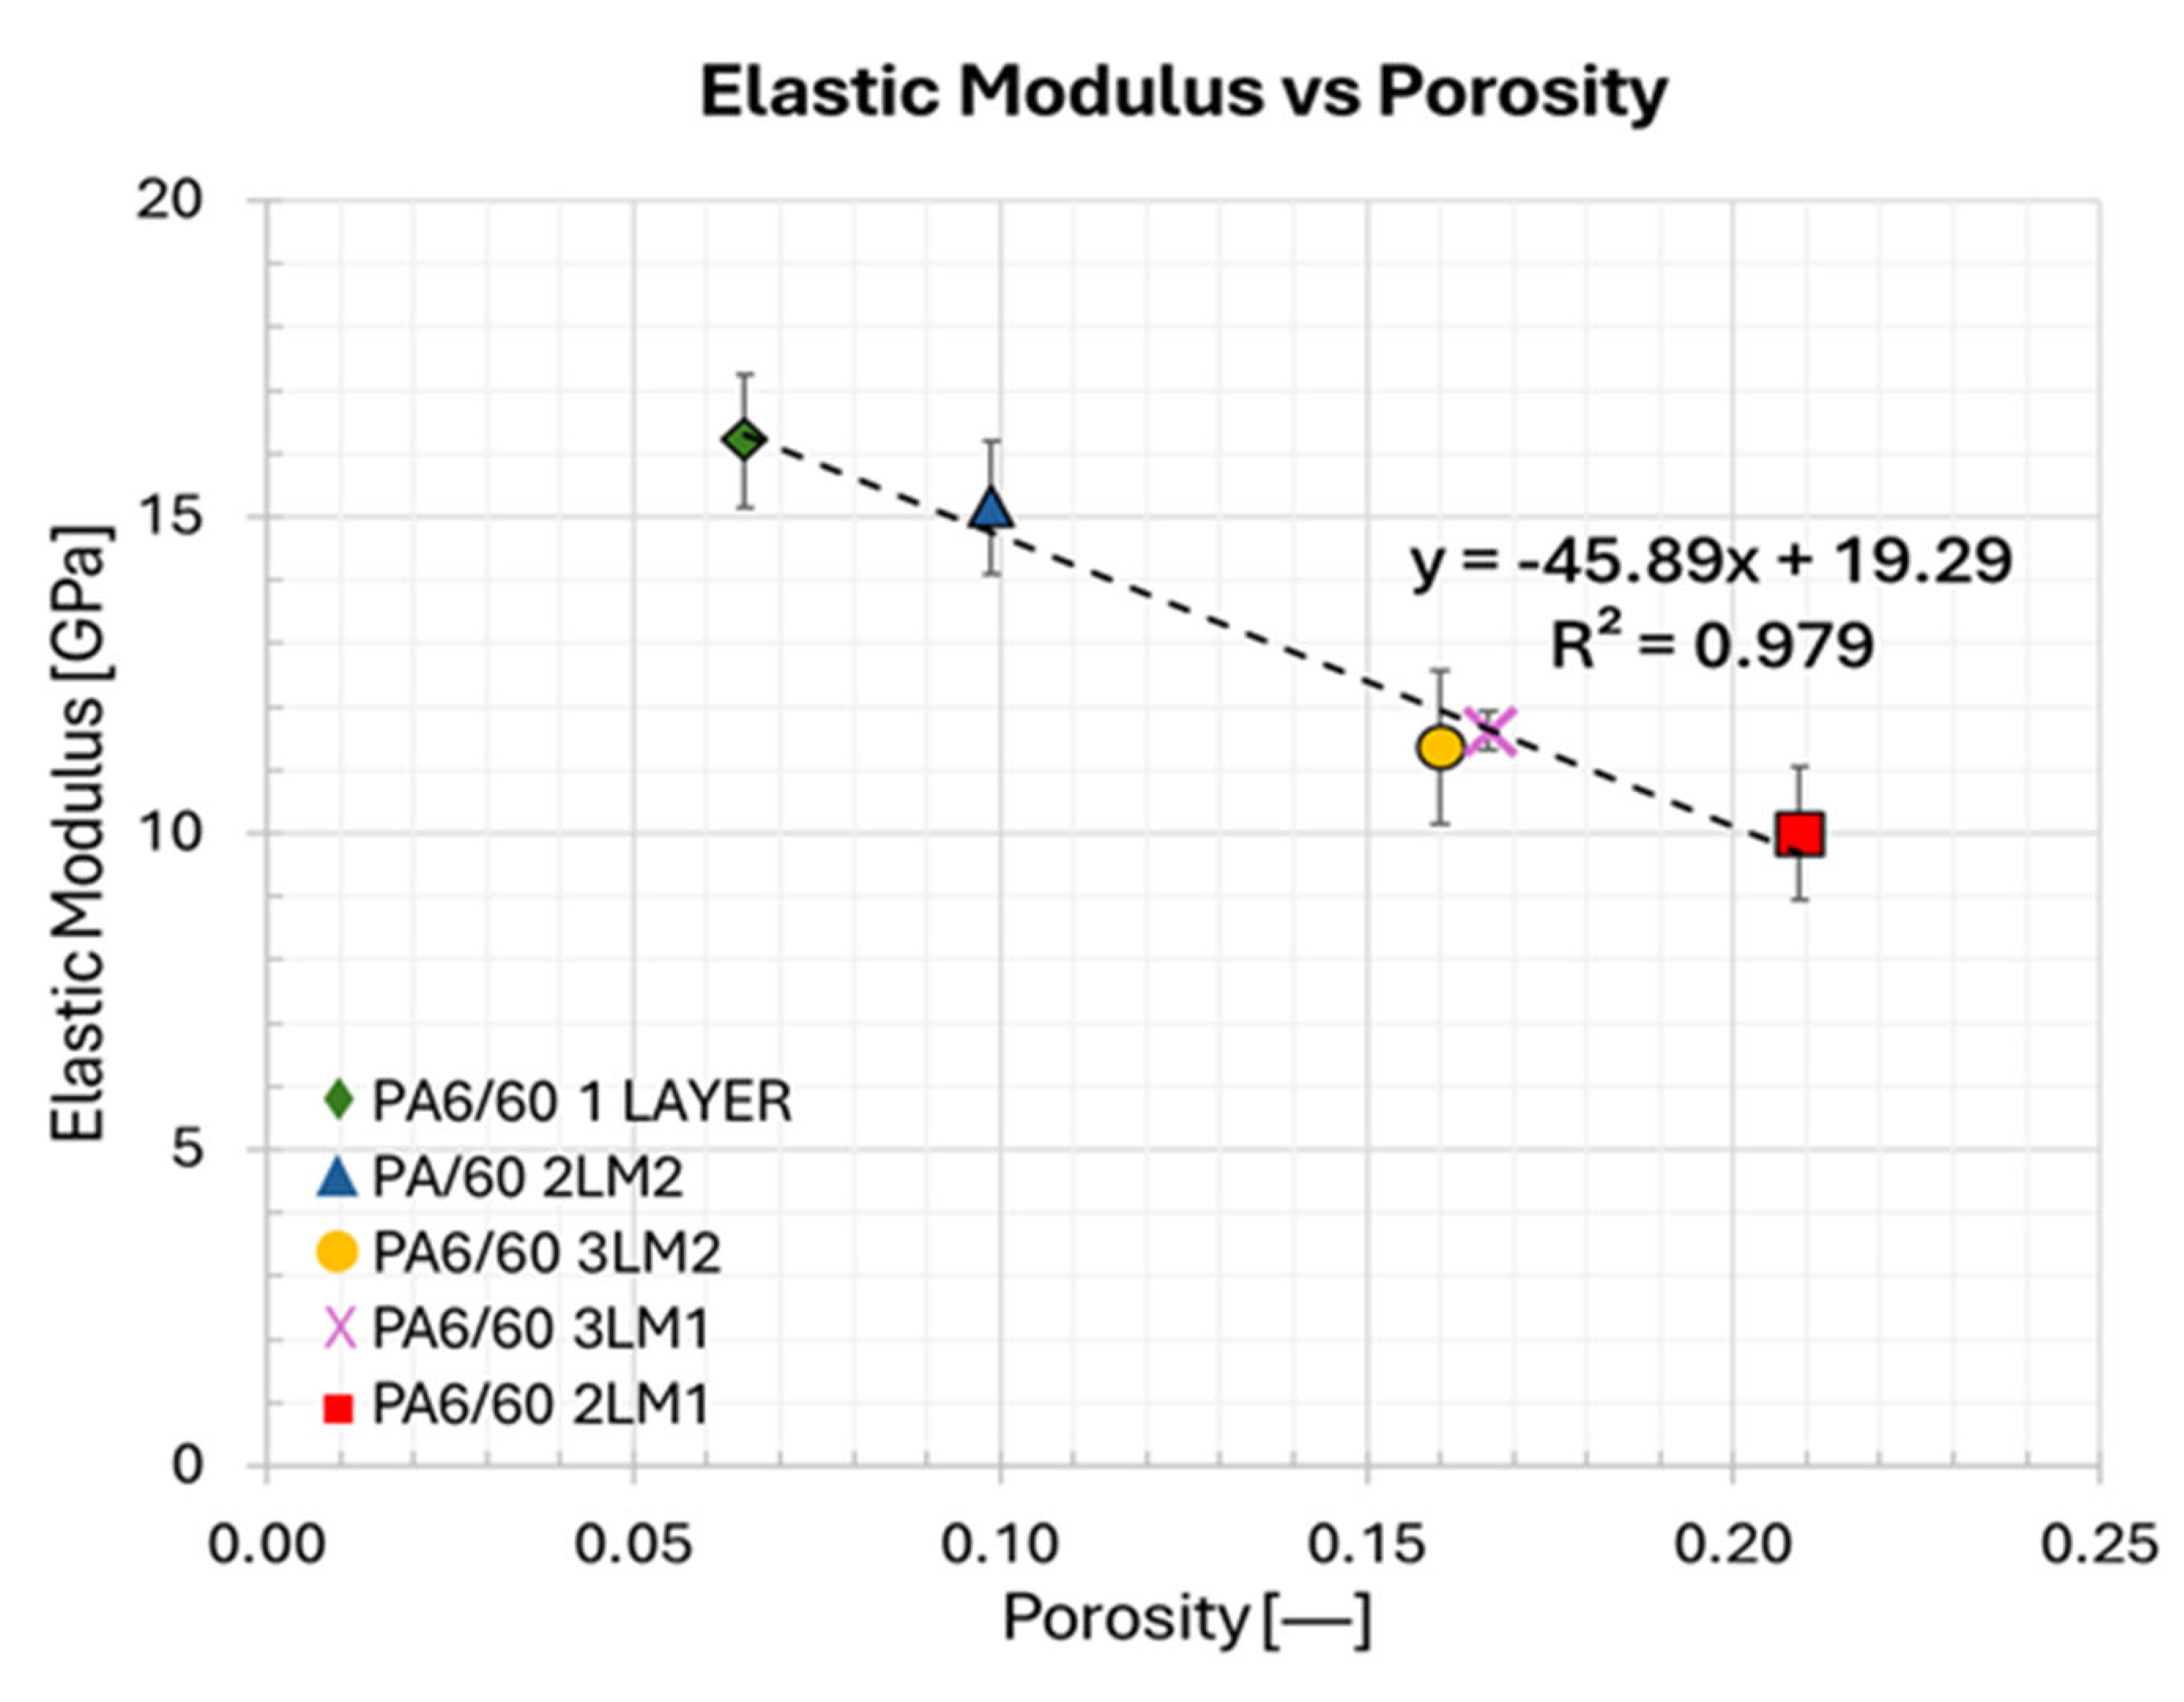
Figure 10.
Defect Analysis by Image Analysis, sample rCF-PA6/2LM1.
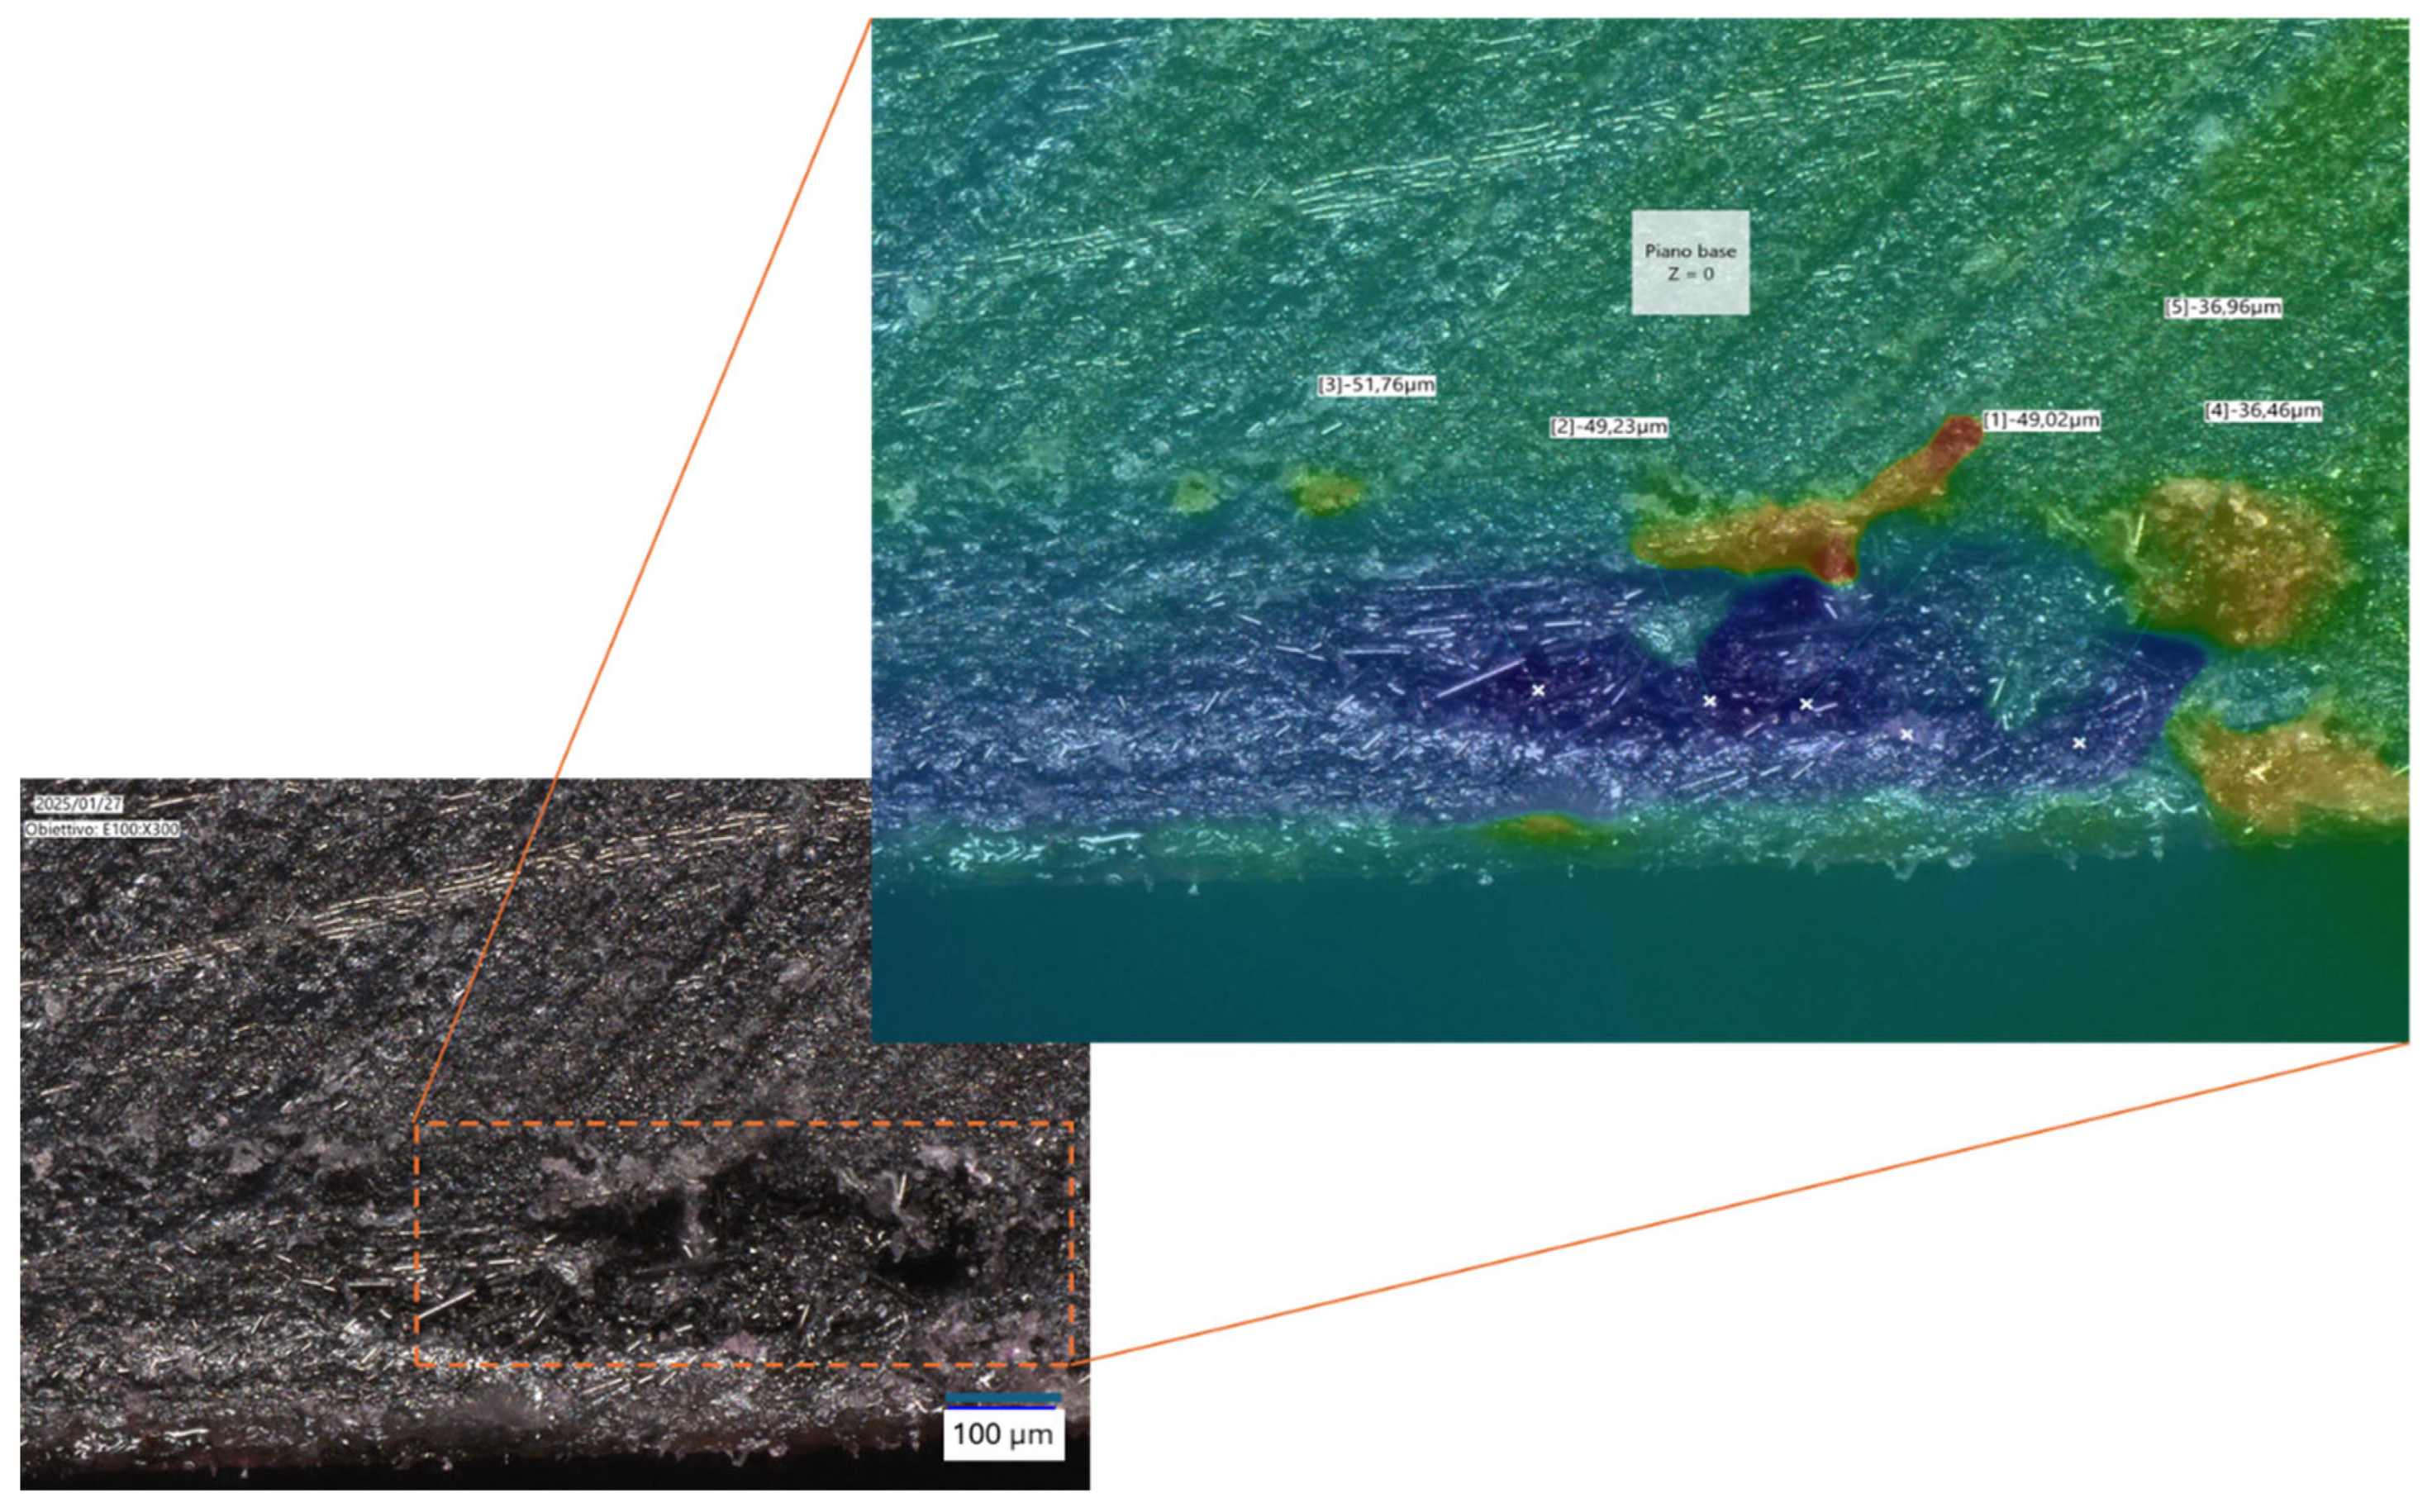
Figure 11.
Defect Analysis by Image Analysis, sample rCF-PA6/2LM2.
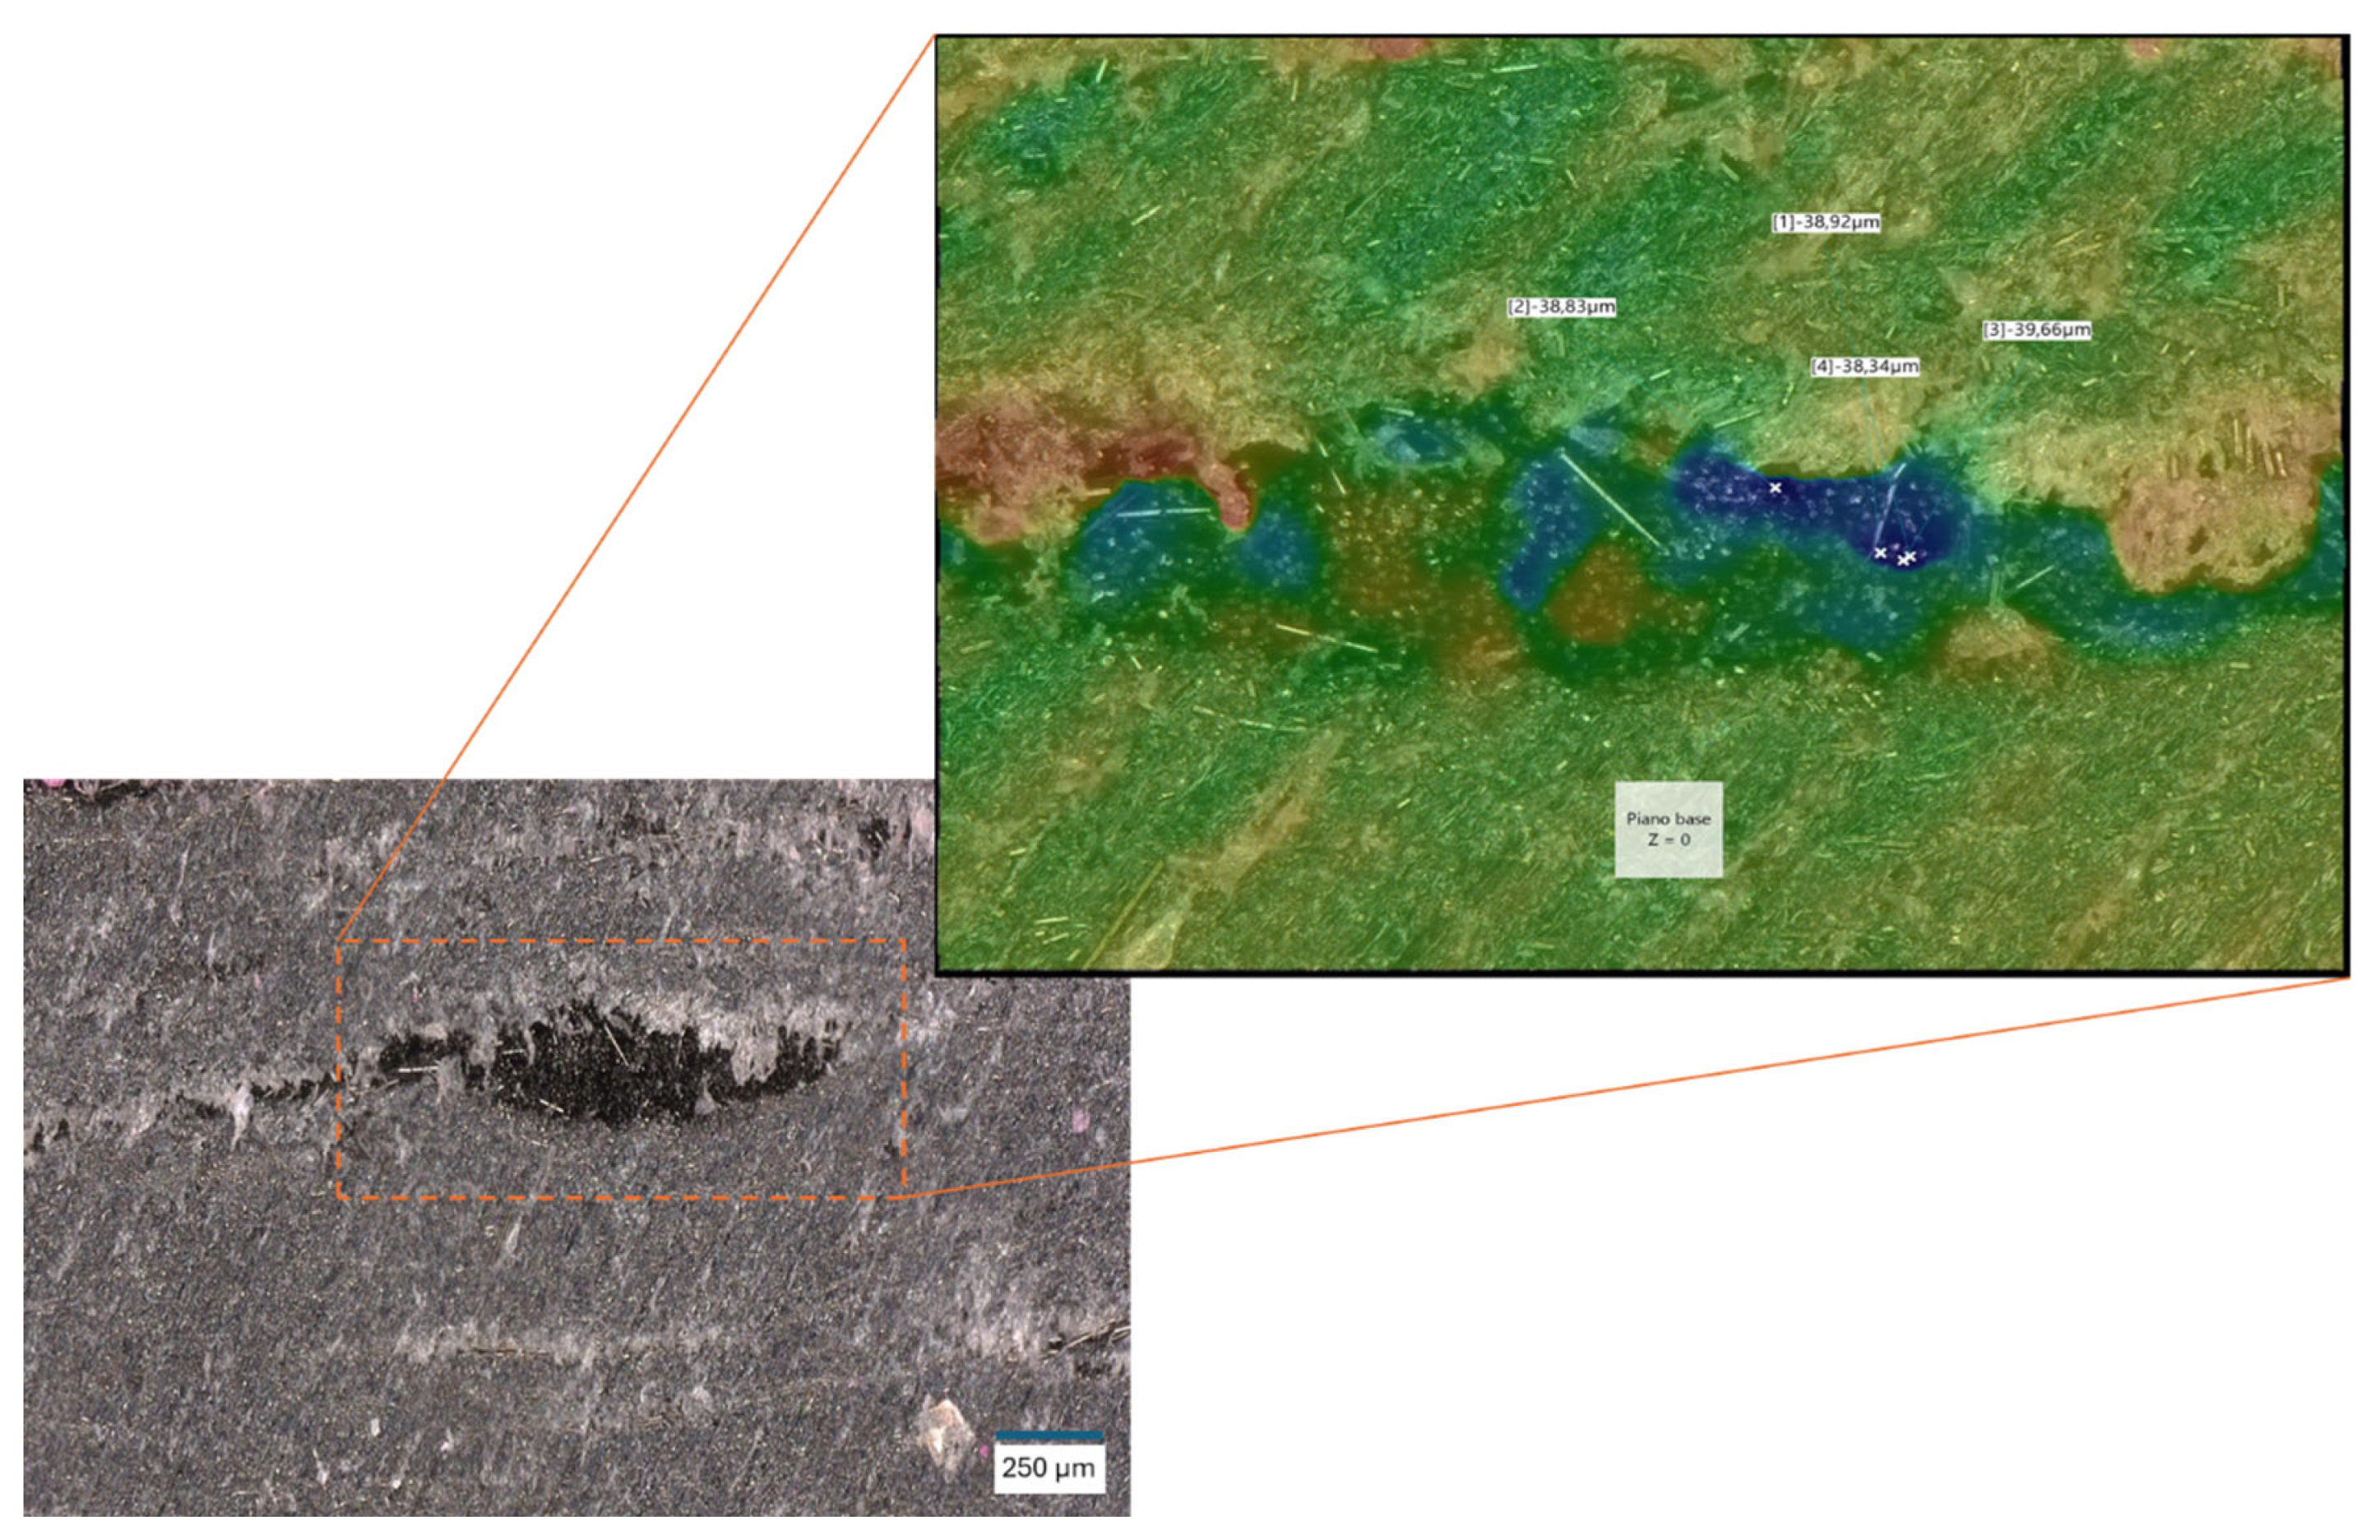
Figure 12.
Relationship between Young's Modulus and Porosity for various MAPP/60 composite configurations. The graph shows a strong negative correlation (R² = 0.9929), with a linear regression equation of y = -173.01x + 23.659. Error bars represent the measurement uncertainties for each data point.
Figure 12.
Relationship between Young's Modulus and Porosity for various MAPP/60 composite configurations. The graph shows a strong negative correlation (R² = 0.9929), with a linear regression equation of y = -173.01x + 23.659. Error bars represent the measurement uncertainties for each data point.
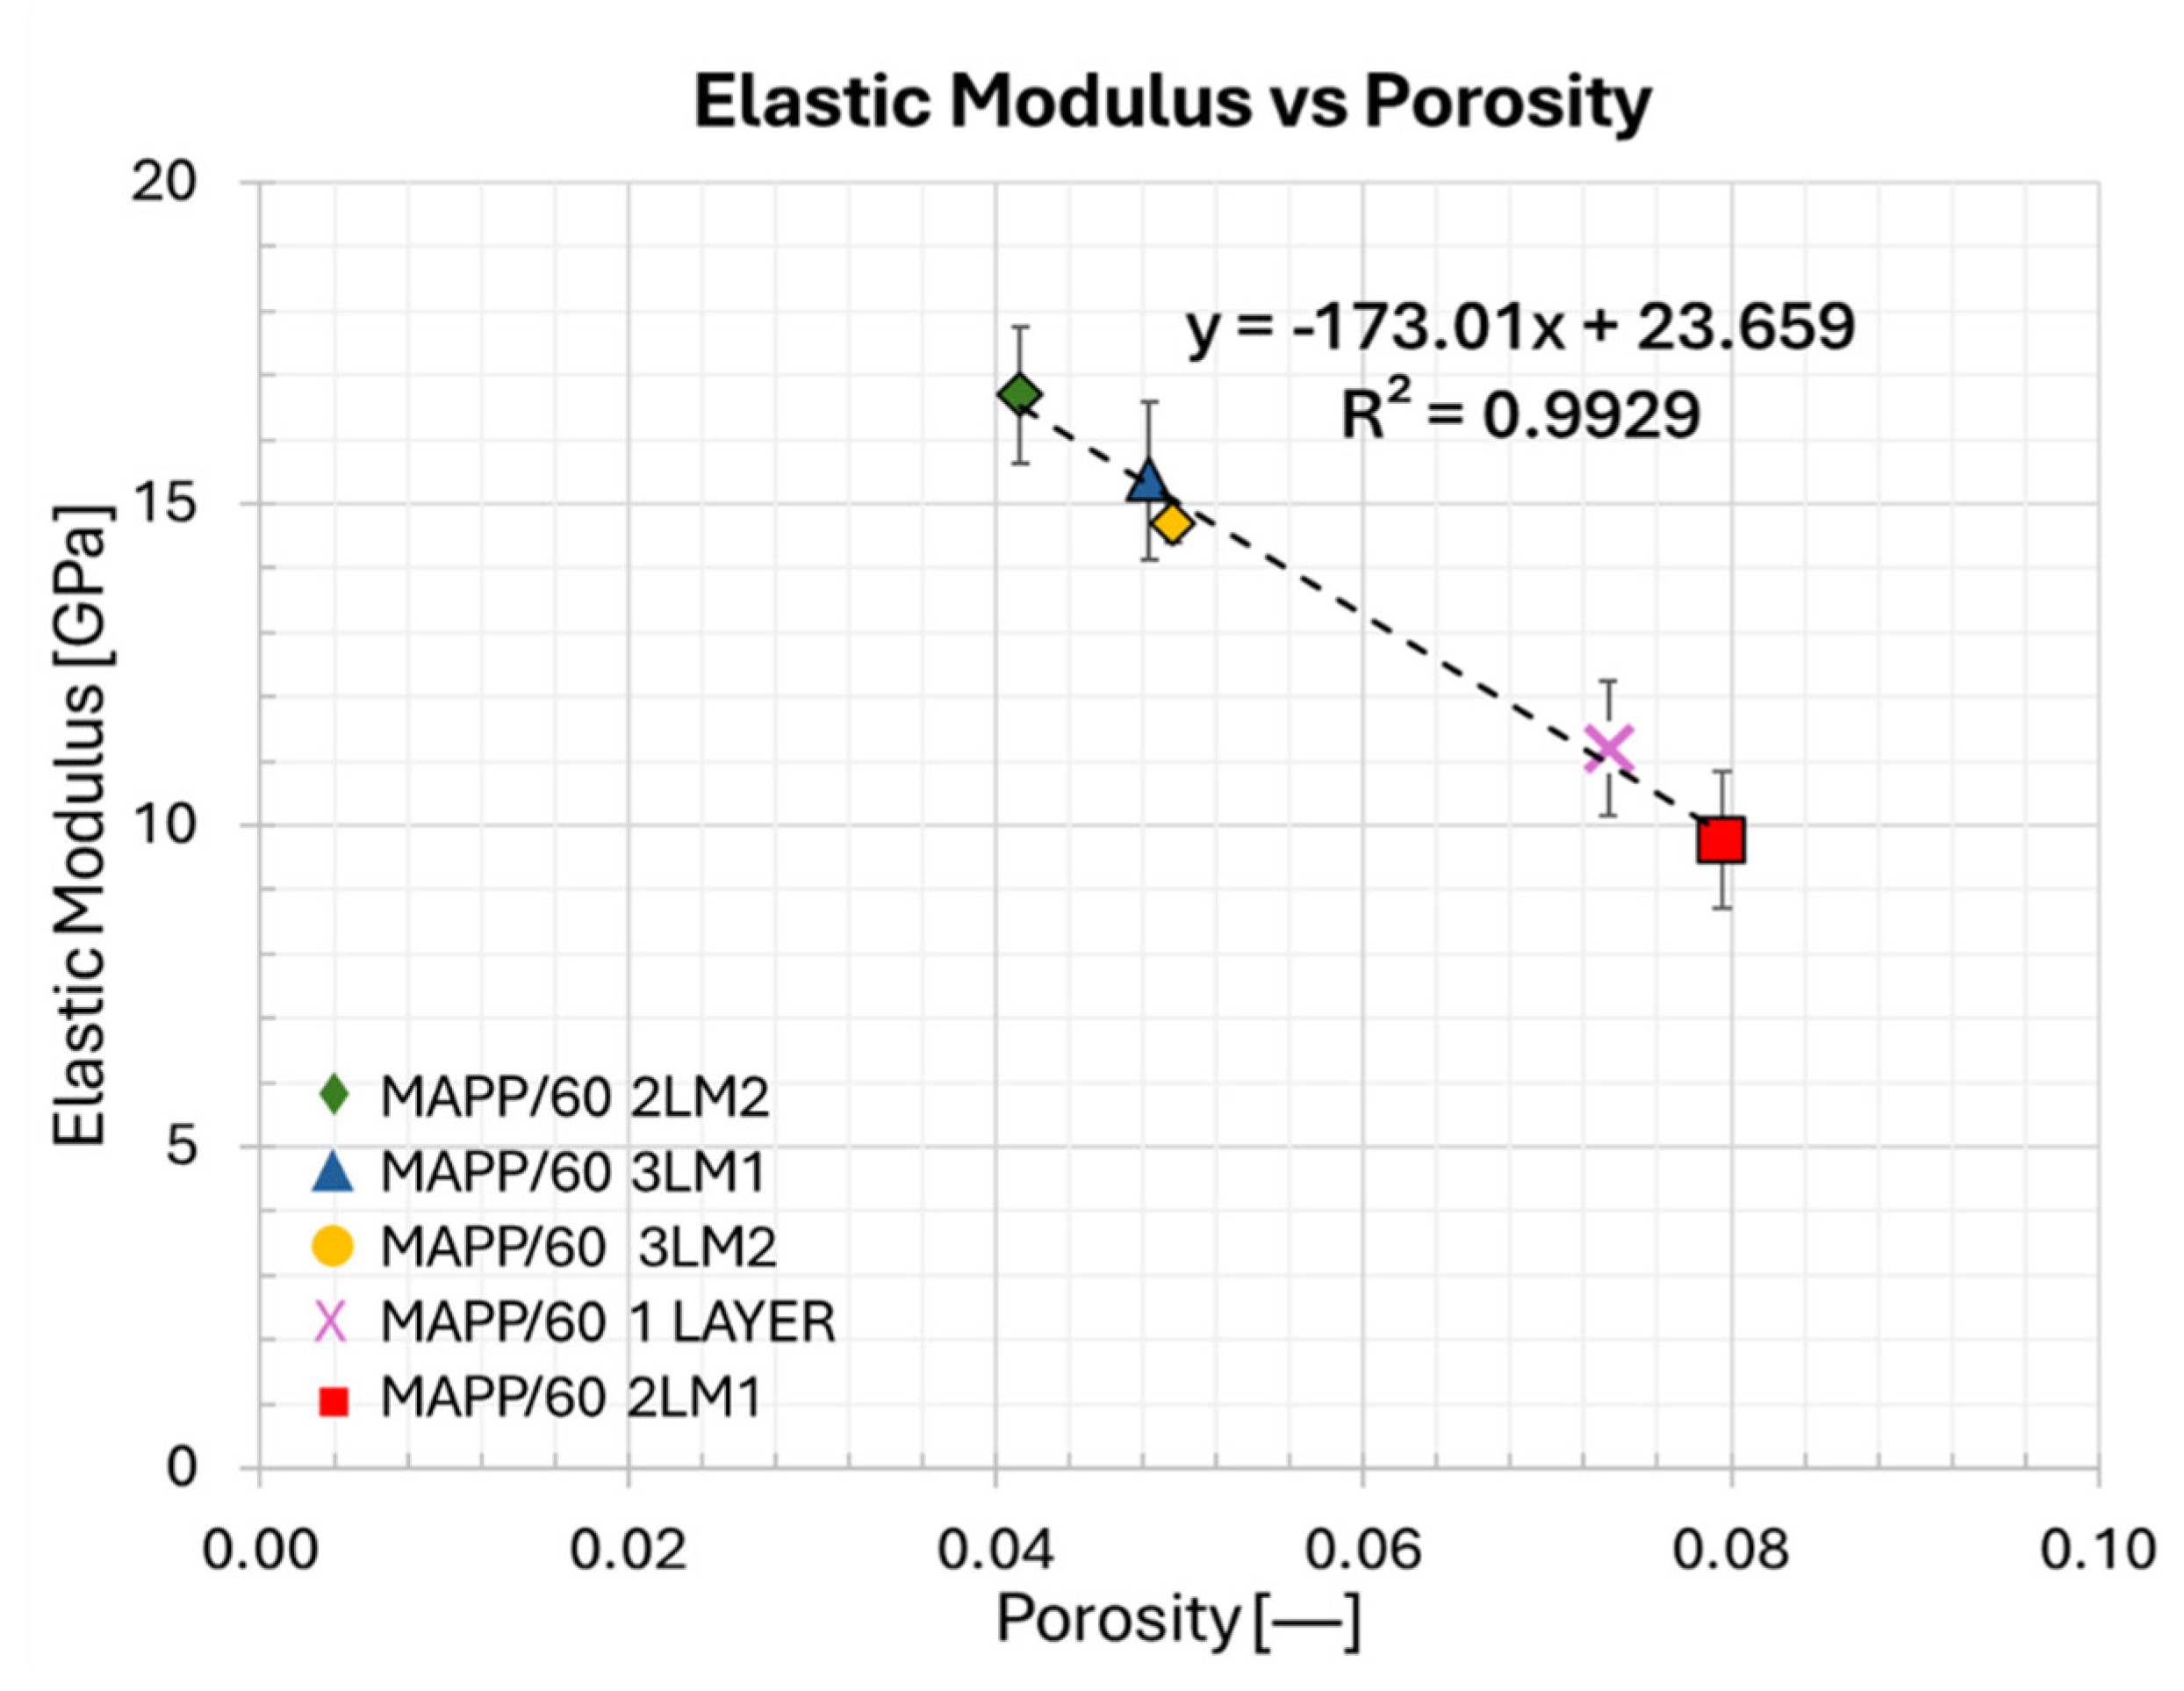

Table 1.
Results of TGA analyses.
| Description | Weight Loss @ 250°C [%] |
T@ Maximum Decomposition [°C] |
|---|---|---|
| PA6/60 | 1.7 ± 0.5 | 440.9 ± 0.5 |
| MAPP/60 | 0.5 ± 0.2 | 425.4 ± 0.5 |
Table 2.
Results of DSC, Density and Porosity Analysis.
| Description | Tg, DSC [°C] |
Tm, DSC [°C] |
Density [g/cm3] |
Porosity [%] |
|---|---|---|---|---|
| PA6/60 1L | 50.2 ± 0.3 | 216.0 ± 0.5 | 1.2 ± 0.08 | 6.5 ± 0.02 |
| PA6/60 2LM1 | 54.4 ± 0.3 | 220.4 ± 0.6 | 1.1 ± 0.15 | 13.2 ± 0.07 |
| PA6/60 2LM2 | 54.3 ± 0.4 | 220.4 ± 0.5 | 1.2 ± 0.02 | 9.9 ± 0.02 |
| PA6/60 3LM1 | 50.5 ± 0.5 | 221.5 ± 0.6 | 1.1 ± 0.11 | 14.0 ± 0.05 |
| PA6/60 3LM2 | 48.8 ± 0.4 | 220.5 ± 0.7 | 1.1 ± 0.01 | 16.7 ± 0.01 |
| MAPP/60 1L | 46.4 ± 0.3 | 163.9 ± 0.4 | 0.9 ± 0.03 | 7.3 ± 0.01 |
| MAPP/60 2LM1 | 51.4 ± 0.6 | 165.8 ± 0.3 | 0.9 ± 0.2 | 8.0 ± 0.03 |
| MAPP/602LM2 | 53.1 ± 0.4 | 163.9 ± 0.5 | 1.0 ± 0.02 | 4.1 ± 0.02 |
| MAPP/60 3LM1 | 46.5 ± 0.6 | 164.4 ± 0.7 | 0.9 ± 0.02 | 4.8 ± 0.02 |
| MAPP/60 3LM2 | 45.3 ± 0.5 | 164.9 ± 0.4 | 1.0 ± 0.01 | 5.0 ± 0.01 |
Table 3.
Results of DMA analysis at 50 °C.
| Description | E’ @ 50°C [GPa] |
E’’ @ 50°C [GPa] |
Tanδ @ 50 °C [-] |
|---|---|---|---|
| PA6/60 1L | 16.2 ± 1.10 | 0.40 ± 0.03 | 0.025 ± 0.0029 |
| PA6/60 2LM1 | 10.0 ± 1.06 | 0.36 ± 0.04 | 0.036 ± 0.0029 |
| PA6/60 2LM2 | 15.2 ± 1.06 | 0.34 ± 0.05 | 0.023 ± 0.0014 |
| PA6/60 3LM1 | 11.4 ± 1.22 | 0.32 ± 0.05 | 0.028 ± 0.0020 |
| PA6/60 3LM2 | 11.6 ± 0.31 | 0.32 ± 0.01 | 0.028 ± 0.0005 |
Table 4.
Results of DMA analysis at 20 °C.
| Description | E’ @ 20 °C [GPa] |
E’’ @ 20 °C [GPa] |
Tanδ @ 20 °C [-] |
|---|---|---|---|
| MAPP/60 1L | 11.2 ± 1.41 | 0.2 ± 0.03 | 0.021 ± 0.0003 |
| MAPP/60 2LM1 | 10.8 ± 1.36 | 0.3 ± 0.05 | 0.027 ± 0.0014 |
| MAPP/602LM2 | 16.7 ± 0.57 | 0.4 ± 0.02 | 0.021 ± 0.0007 |
| MAPP/60 3LM1 | 15.4 ± 0.40 | 0.3 ± 0.01 | 0.022 ± 0.0009 |
| MAPP/60 3LM2 | 14.7 ± 1.31 | 0.3 ± 0.03 | 0.023 ± 0.0011 |
Table 5.
Result of DSC and crystallinity analysis of PA6/60 panels.
| Description | 1st Reaction Enthalpy [J/g] |
2nd Reaction Enthalpy [J/g] |
1st DOC [%] |
2nd DOC [%] |
Δ DOC [%] |
|---|---|---|---|---|---|
| PA6/60 1L | 74.5 ±1.0 | 63.4 ± 1.2 | 32.4 | 27.6 | 4.8 |
| PA6/60 2LM1 | 73.1 ± 1.4 | 58.2 ± 1.6 | 31.8 | 25.3 | 6.5 |
| PA6/60 2LM2 | 71.0 ± 1.3 | 64.2 ± 1.8 | 30.9 | 27.9 | 3.0 |
| PA6/60 3LM1 | 72.1 ± 1.2 | 65.1 ± 1.2 | 31.3 | 28.3 | 3.0 |
| PA6/60 3LM2 | 70.0 ± 1.1 | 66.4 ± 1.0 | 30.4 | 28.9 | 1.6 |
Table 6.
Result of DSC and crystallinity analysis of MAPP/60 panels.
| Description | 1st Reaction Enthalpy [J/g] |
2nd Reaction Enthalpy [J/g] |
1st DOC [%] |
2nd DOC [%] |
Δ DOC [%] |
|---|---|---|---|---|---|
| MAPP/60 1L | 108.0 ± 1.6 | 92.2 ± 1.1 | 51.7 | 44.1 | 7.6 |
| MAPP/60 2LM1 | 109.6 ± 1.0 | 97.6 ± 1.2 | 52.4 | 46.7 | 5.7 |
| MAPP/602LM2 | 104.1 ± 1.2 | 93.2 ± 1.5 | 49.8 | 44.6 | 5.2 |
| MAPP/60 3LM1 | 105.8 ± 1.3 | 94.2 ± 1.7 | 50.6 | 45.1 | 5.6 |
| MAPP/60 3LM2 | 103.1 ± 1.1 | 92.9 ± 1.3 | 49.3 | 44.5 | 4.9 |
Disclaimer/Publisher’s Note: The statements, opinions and data contained in all publications are solely those of the individual author(s) and contributor(s) and not of MDPI and/or the editor(s). MDPI and/or the editor(s) disclaim responsibility for any injury to people or property resulting from any ideas, methods, instructions or products referred to in the content. |
© 2025 by the authors. Licensee MDPI, Basel, Switzerland. This article is an open access article distributed under the terms and conditions of the Creative Commons Attribution (CC BY) license (http://creativecommons.org/licenses/by/4.0/).
Copyright: This open access article is published under a Creative Commons CC BY 4.0 license, which permit the free download, distribution, and reuse, provided that the author and preprint are cited in any reuse.


