Submitted:
17 March 2025
Posted:
17 March 2025
You are already at the latest version
Abstract
In low-temperature environments, both the electrochemical and thermodynamic performance of lithium-ion batteries are significantly affected, leading to a substantial decline in overall performance. This deterioration is primarily manifested in the inability of the battery to release its actual capacity effectively, a marked reduction in charge-discharge efficiency, and accelerated capacity degradation, which directly undermines its power output capability under low-temperature conditions. Such performance degradation severely restricts the application of lithium-ion batteries in scenarios requiring high power and extended range, such as EVs. This paper proposes an intelligent low-temperature DC discharge heating optimization strategy based on the PSO algorithm. The strategy aims to simultaneously optimize heating time and minimize capacity loss by employing the PSO algorithm to dynamically optimize discharge currents under varying ambient temperatures. This approach achieves simultaneous optimization of battery heating efficiency and capacity loss. The proposed strategy effectively overcomes the limitation of traditional constant-current discharge methods, which struggle to dynamically adjust current intensity based on real operating conditions. By balancing heating efficiency and capacity degradation, the strategy significantly enhances energy utilization. The performance improvements achieved include a reduction in heating time by 48.71 seconds and an increase in heating rate by more than twofold. During 1,000 cycles of heating, the capacity loss was reduced by 0.10 Ah, effectively extending the battery's service life. This strategy addresses the limitations of traditional heating methods, providing a novel solution for the efficient application of lithium-ion batteries in low-temperature environments.
Keywords:
Low Temperature
; PSO
; Lithium-ion Battery
; Direct Current Discharge Heating
1. Introduction
Lithium-ion batteries are widely used in consumer electronics and electric vehicles due to their advantages, including high output voltage, long cycle life, high energy density, low self-discharge rate, and wide operating temperature range [1]. However, the performance of battery systems in electric vehicles is highly susceptible to environmental temperature, with significant performance degradation observed under low-temperature conditions [2,3]. The working principle of lithium-ion batteries is fundamentally based on redox reactions between the cathode, anode, and electrolyte. At low temperatures, the lithium-ion intercalation reaction rate at the electrode surface decreases, and the lithium-ion concentration within active materials is reduced. This leads to a reduction in equilibrium potential, an increase in internal resistance, and a decline in discharge capacity. Under extreme low-temperature conditions, phenomena such as electrolyte freezing and the inability to discharge may occur, severely impacting the low-temperature performance of the battery system. This degradation results in reduced power output and diminished driving range for electric vehicles [4,5,6,7,8,9,10]. The adverse effects of low temperatures on lithium-ion battery performance have become a critical bottleneck, particularly hindering their application and adoption in colder regions. Battery preheating technology has emerged as an effective strategy to mitigate performance degradation, reduce safety risks, and ensure reliable operation in cold environments [11].
Currently, lithium-ion battery preheating technologies can be broadly categorized into two types: external heating and internal heating [12]. In external heating strategies, heating power is transferred from an external heat source to the lithium-ion battery. This typically involves the use of resistance wires to heat the battery via mediums such as air or liquid [13]. Alternatively, heating components like heating plates or thin films are directly connected to the surface of the lithium-ion battery for localized heating. In internal heating strategies, the high internal resistance of lithium-ion batteries at low temperatures is exploited to generate Joule heat, either through an external power source or by the battery itself. This approach eliminates the need for long heat conduction paths, reducing heat dissipation during transmission and conduction. Additionally, it avoids the formation of localized overheating near the heating devices, resulting in higher energy conversion efficiency [14].
One approach to implementing this internal heating strategy is through DC discharge heating, which utilizes the heat generated during the discharge process of lithium-ion batteries to raise their temperature. This method is less likely to cause lithium plating on the anode and is characterized by its simplicity and high heat generation efficiency. Ruan et al. [15] proposed an optimized low-temperature internal heating strategy based on an equivalent circuit model. This strategy consumes battery capacity during heating, necessitating a balance between heating rate and capacity loss. Qu et al. [16] preheated batteries by intermittently applying DC current, achieving a temperature rise from -10°C to 10°C in 175 seconds, with a heating rate of approximately 6.9°C/min. Wu et al. [17] introduced an approach where a layer of thermally insulating nano-porous aerogel material was wrapped around 18650 cylindrical lithium-ion batteries. This method retained the heat generated by constant-current discharge, effectively improving the operating environment of the battery under low temperatures. Chen Zeyu et al. [18] simulated the DC preheating process and developed a test platform for heating prototypes. This method achieved an average heating rate of 0.46°C/s, shortening the preheating time by 51.6% compared to AC preheating. However, the study considered only heating time as the sole control variable without adjusting the current. Ruan et al. [19] proposed a CSH strategy combining DC heating with external heating of the battery. This approach raised the battery temperature from -30°C to 2°C within 62.1 seconds, improving the heating rate by 60.8%, reducing energy consumption by 54.8%, and decreasing battery degradation by 45.2% compared to DC heating alone. Wang et al. [20] presented a coordinated strategy for self-heating and charging. Their approach enabled lithium-ion batteries to charge to 80% SOC within 1.55 hours at -10°C, which is 6.65 times faster than traditional low-current charging methods.
DC discharge heating still faces several challenges. First, using currents within the manufacturer-specified maximum limits often results in a slow heating rate, negating the inherent advantages of DC heating. However, excessively high currents can damage the electrode structure and lead to the loss of active materials, making it necessary to determine an appropriate heating current. Second, in low-temperature environments, a battery's internal resistance and SOC dynamically change with temperature. Most constant-current discharge heating strategies cannot adjust current intensity dynamically in response to these changes, making traditional approaches inadequate for the demands of intelligent thermal management. This limitation results in reduced heating efficiency, compromised safety, and difficulty balancing efficient heating with low energy consumption. Furthermore, there has been limited research on how to comprehensively balance heating time, capacity degradation, and temperature gradients when selecting DC heating parameters.
This study focuses on lithium-ion batteries and investigates optimized heating methods under low-temperature conditions. The research establishes two optimization objectives for DC discharge heating: minimizing heating time and reducing capacity loss. By analyzing the relationship between the heating current and both temperatures rise rate and capacity degradation, the study applies a PSO algorithm to determine the optimal heating current. An optimized low-temperature DC heating strategy is proposed, achieving a dynamic balance between heating time and capacity loss. Simulation analysis and comparisons with constant-current discharge heating results validate the superiority of the proposed optimized heating strategy.
2. Materials and Methods
2.1. Battery Model Development
2.1.1. Development of the Battery Equivalent Circuit Model
Considering the trade-off between model accuracy and the complexity of parameter identification, the DP equivalent circuit model was ultimately selected. This model comprises a voltage source, a direct current resistance (R0), and two RC parallel circuits. The battery's output voltage is determined by the OCV across the battery terminals, the ohmic resistance (R0), and the polarization impedance (represented by the RC parallel circuits), as shown in Figure 1. The output voltage is expressed by the following equation:
This study differs from the traditional DP model by employing an improved DP model in which the parameters dynamically adjust with changes in ambient temperature, thereby more accurately reflecting the impact of temperature on battery performance.
R0(Tamb) represents the ohmic resistance, CL(Tamb) CP(Tamb) and RL(Tamb) RP(Tamb) denote the polarization capacitance and polarization resistance, respectively.UL and UP are the polarization voltages. Rtotal is the internal resistance of the battery, and UOCV represents the OCV. U0 is the terminal voltage, and I is the discharge current. The mathematical model of the circuit can be described by Equations (2) and (3).
To obtain model parameters for the battery under different temperature and SOC conditions, this study referenced the HPPC test process and conducted charge-discharge experiments. Using the RC structure of a second-order RC equivalent circuit model, the parameters of the equivalent circuit were determined by analyzing the response of the double-layer hysteresis effect on pulse discharge transients.
For validation testing of the electrical model, the HPPC dynamic profile within a 90%-10% SOC range was applied as the input current to the battery. The voltage output was observed and compared with the model's calculated results. The validation results are shown in Figure 2 and Figure 3. The figures demonstrate that the model's estimated voltage closely matches the experimentally measured voltage, with errors remaining within 2% for the majority of the test. A sudden error exceeding 2% occurs in the final pulse due to incomplete pulse excitation, leading to a slight decline in parameter identification accuracy. However, the maximum error between the model and the experiment is still controlled within 3%. This confirms the accuracy of the model and its parameters. In conclusion, the model effectively fits the characteristics of both constant-current discharge and dynamic conditions.
2.1.2. Development of the Battery Heat Generation Model
During the charge and discharge processes of lithium-ion batteries, phenomena such as material diffusion, chemical reactions, and ion migration are accompanied by substantial heat generation. The primary sources of this heat include: Irreversible Joule heat (Qr) caused by ohmic internal resistance, Irreversible polarization heat (Qp) resulting from polarization phenomena, Reversible reaction heat (Qf) generated by electrochemical reactions, and Side reaction heat (Qs) from phenomena like material mixing. The total heat generation can be expressed using Equation (4):
In the equation: Qq represents the total heat generation, Qr represents the Joule heat from ohmic resistance, Qp represents the heat from polarization resistance, Qf represents the heat from chemical reactions, and Qs represents the heat from side reactions.
2.1.3. Development of a Thermoelectric Coupling Temperature Rise Simulation Model
Figure 4 illustrates the thermoelectric coupling temperature rise simulation model, which simplifies the battery into a single particle (representing the heat generation source) using an equivalent circuit approach. The model incorporates physical parameters such as the specific heat capacity, thermal conductivity, and heat transfer coefficient of the battery to simulate its behavior. It captures the internal temperature rise of the battery and the dynamic process of heat transfer from the battery to the surrounding environment. The model assumes a uniform and consistent surface temperature across the battery. The average surface temperature, measured using multiple thermocouples, represents the actual temperature of the battery. In this study, the model integrates the effects of Joule heating and reaction heat to more accurately reflect the thermal behavior of the battery.
The temperature rise process of the battery can be described by the following equation:
The process of heat transfer from the battery surface to the environment can be described by the following equation:
where Ti is the core temperature of the battery, TS is the surface temperature, h1 and h2 are the thermal conductivity and heat transfer coefficients, respectively. m represents the mass of the battery. The heat generation power of the battery is denoted as q.
where Rtotal represents the internal resistance.
In practical applications, embedding thermocouples inside the battery to measure internal temperature may impact the battery's safety. To address this, the internal temperature of the battery can be estimated using the following approach. By transforming the equation as follows:
Substituting
into the equation, the equation can be rewritten as:
where TS, Tamb, and q are known quantities, while C′ and h are unknown variables that require reasonable estimation.
At thermal equilibrium:
The parameter h2 can be calculated from the thermal equilibrium state of the cell, while C′can be determined from the transient process.
The parameters C and h1 are intrinsic characteristics of the battery and are independent of the convective heat transfer rate with the environment. Therefore, under the same ambient temperature, two different convective heat transfer conditions can be applied, and the battery temperature can be measured. This yields two independent equations with two unknowns, as detailed below:
The battery was heated from -30°C to 0°C. Figure 5 illustrates the relationship between the battery's temperature rise and time under a 3C discharge rate (12A). The deviation between the simulation results and the experimentally measured temperatures is shown in Figure 6, with a maximum temperature rise deviation of no more than 5°C.
2.2. Low-Temperature Preheating Optimization Strategy for Batteries Based on the PSO Optimization Algorithm
2.2.1. Determining the Optimization Objective Function for Battery Low-Temperature Preheating
Low-temperature preheating is a nonlinear, multi-factor coupled dynamic process. Heating time is a critical metric for evaluating battery performance recovery, with the goal of rapid heating aimed at minimizing heating time. At the same time, reducing battery life degradation is another essential objective, as excessive polarization voltage during the heating process can result in significant capacity loss. Thus, the two core objectives for optimizing low-temperature heating methods are to shorten heating time and minimize capacity degradation.
Typically, higher heating currents can significantly reduce heating time but at the cost of markedly decreasing battery life. Conversely, lower heating currents cause less damage to the battery life but greatly extend the heating time. Therefore, by using the established battery thermal and life degradation models to determine an appropriate heating current, an optimized low-temperature heating method can be developed. This approach achieves rapid heating while minimizing its impact on battery life.
Considering 1,000 repeated heating cycles, the battery's capacity loss and its associated constraints are described as follows:
where Imin and Imax represent the minimum and maximum heating currents, respectively.
In this study, the battery is heated from -30°C to 0°C, with each 5°C temperature rise defined as a separate heating stage, resulting in a total of six heating stages. The discharge current remains constant during each heating stage. Therefore, the time required for each heating stage and the corresponding constraints are defined as follows:
Given that the heating time and capacity degradation have different magnitudes and units, normalization of these two metrics was performed to incorporate them into a unified optimization objective function with two variables. The normalization method is expressed as follows:
Clearly, each normalized heating time and capacity loss value is constrained within the range of [0,1]. A normalized value of 0 indicates that the parameter has reached its optimal state, while a value of 1 indicates that the parameter is in its worst state. During the low-temperature heating process, the goal is typically to achieve the shortest heating time while minimizing the impact on battery life. However, there is an inherent trade-off between heating time and capacity loss: shorter heating times result in greater capacity loss, whereas smaller capacity loss often corresponds to longer heating times.
To balance these conflicting objectives, a weighting coefficient is introduced, and the unified optimization objective function for DC heating is defined as follows:
Here, λ represents the weighting coefficient, with a value range of [0,1]. When λ>0.5, the weight of capacity loss in the objective function is higher, indicating a greater emphasis on the impact on battery life. Conversely, when λ<0.5, the weight of heating time in the objective function is higher, placing more importance on reducing the battery heating time. Once the weighting coefficient is determined, the PSO algorithm is used to solve the objective function, thereby obtaining the optimal heating current.
2.2.2. Setting Boundary Conditions for Discharge Current
In the study of low-temperature discharge heating, it is first necessary to define the boundary limits of the battery discharge current. During the heating process, the minimum discharge current must satisfy the requirements of Equation (20):
I: current; Rr: ohmic resistance; Rp: polarization resistance;: the relationship between battery voltage and temperature, referred to as the Entropic Heat Coefficient (V/K), which is primarily influenced by the SOC;:reversible reaction heat of the positive and negative electrodes; h: equivalent heat transfer coefficient; A: specific surface area of the battery; T:battery temperature; T∞ : ambient temperature.
To achieve rapid preheating of lithium-ion batteries in low-temperature environments, the constraint for the minimum discharge current is based on the minimum discharge current value determined during preheating experiments.
Figure 9.
Minimum Discharge Current for Preheating.
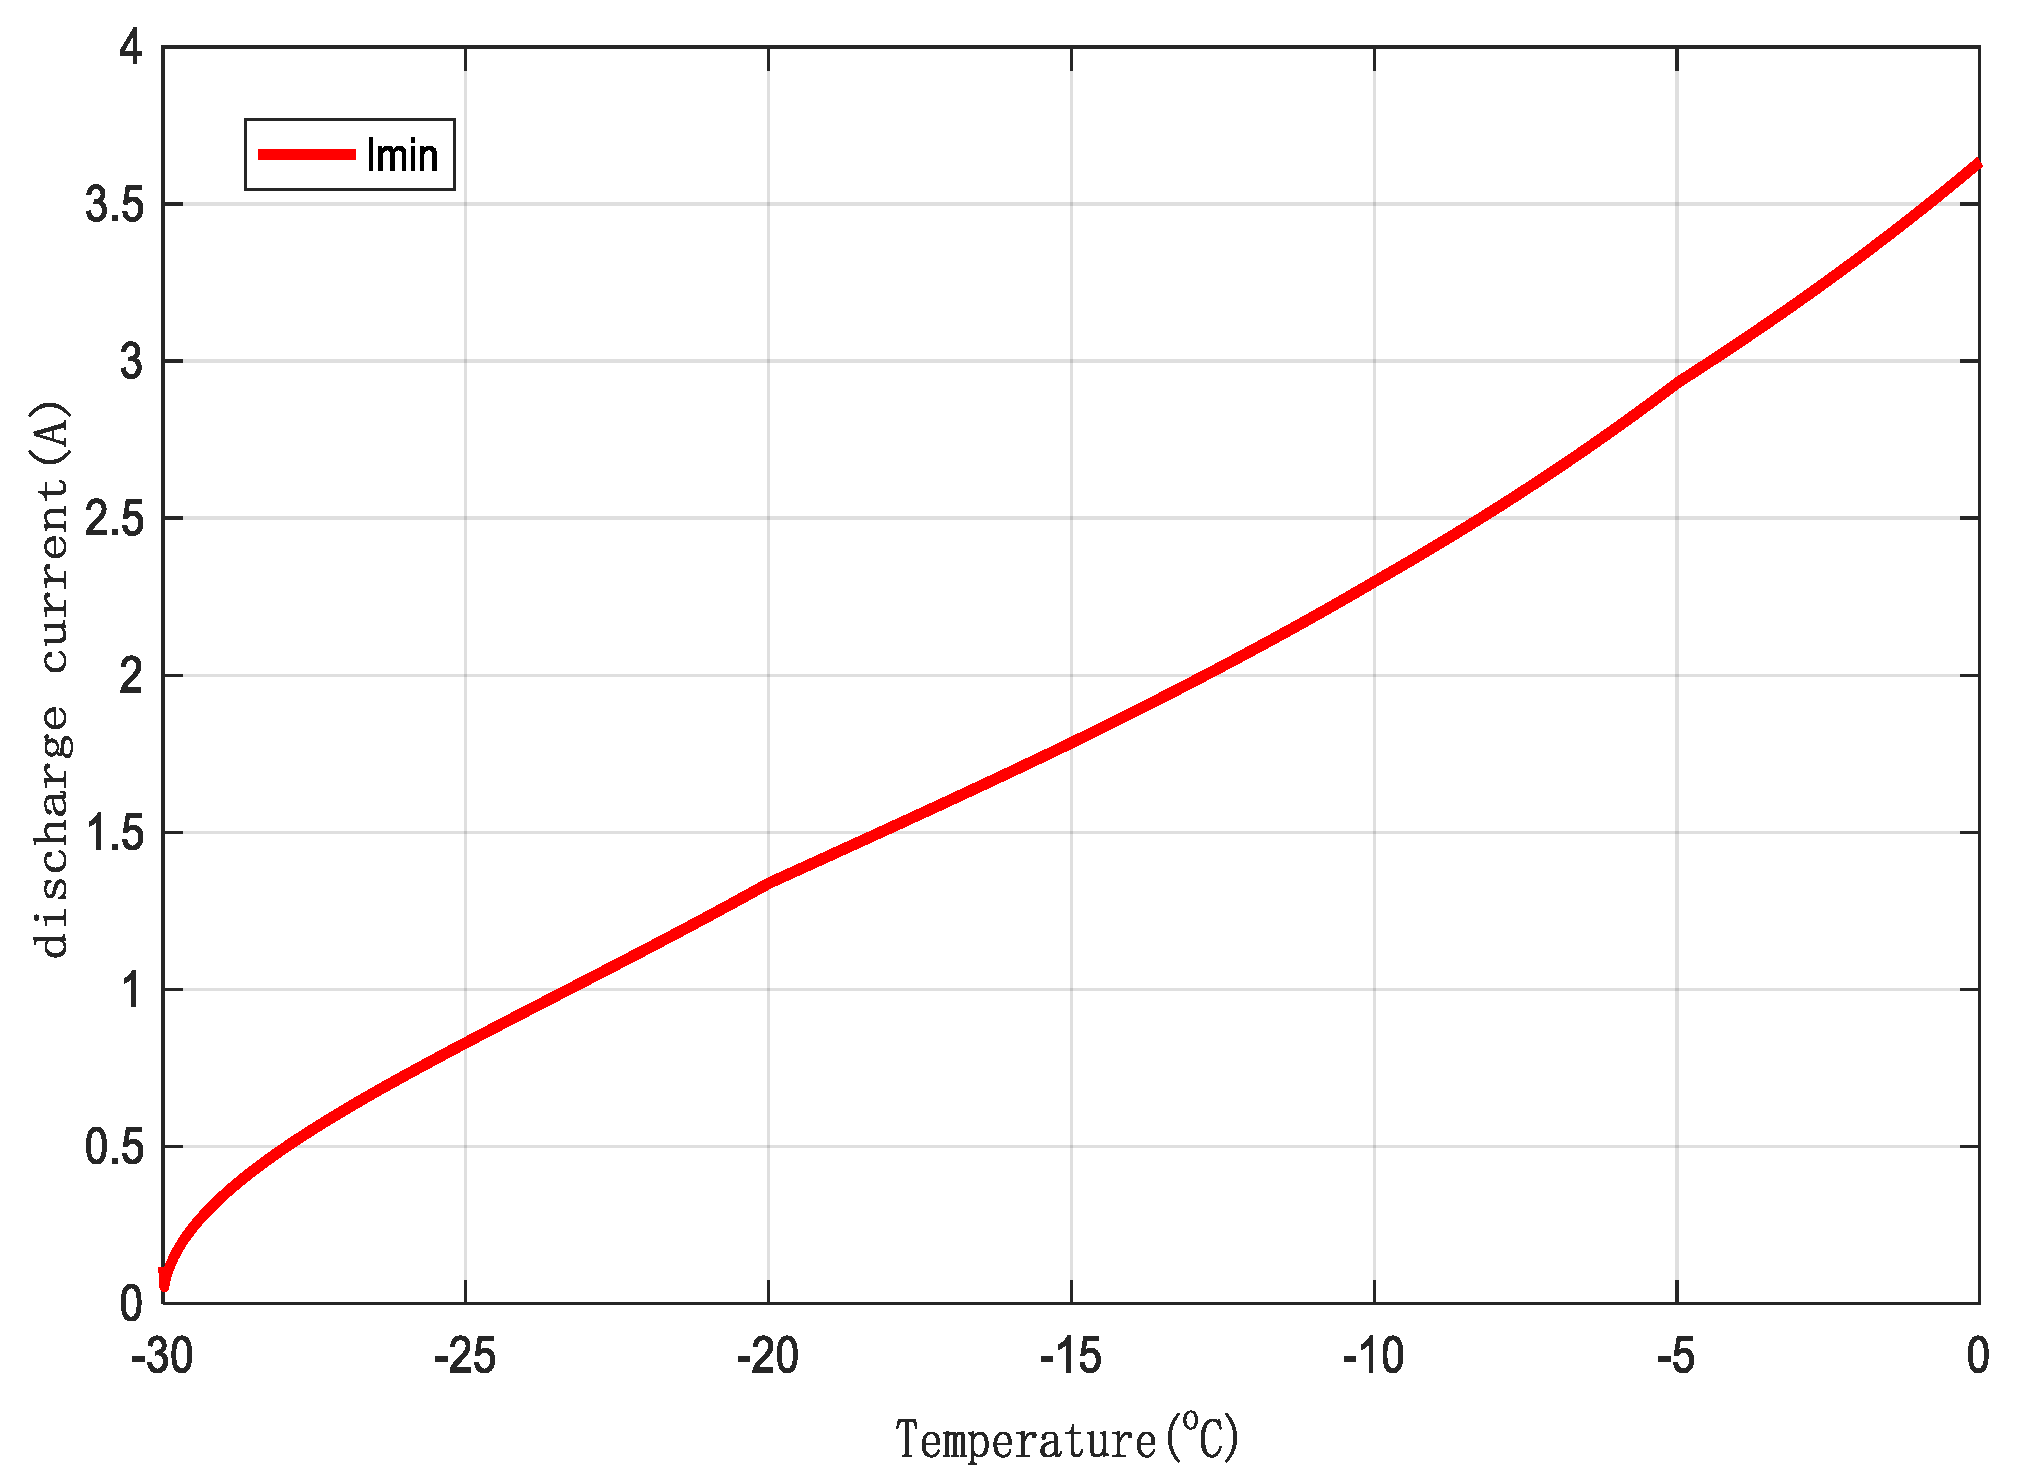
Figure 10.
Minimum Discharge Current Threshold.

Equations (21) and (22) define the optimization objectives and constraint conditions for heating a lithium-ion battery from -30°C to 0°C. These equations are used to calculate the optimal discharge current for the corresponding temperature range. Through iterative calculations, the boundary conditions for the maximum preheating discharge current were further determined.
The optimized maximum discharge current thresholds, ensuring that the battery retains 80% of its usable capacity after 1,000 heating cycles at a 1C discharge rate, are shown in Figure 11 for different temperature ranges. As the temperature range increases, the maximum discharge current threshold of the battery gradually rises.
2.2.3. Discharge Current Solution Based on the PSO Optimization Algorithm
The PSO algorithm seeks the global optimum through the initialization of random solutions and an iterative optimization process. By continuously tracking the best solution found during the search, the algorithm gradually approaches the global optimal solution. PSO is known for its simplicity, high precision, and fast convergence speed, demonstrating excellent performance and application potential in solving practical problems.
The core of the algorithm lies in updating the velocity and position of particles, with the update equations given as follows (Equation 23):
where W represents the inertia weight, c1 and c2 are the learning factors, r1 and r2 are random numbers within the range [0,1], Pid denotes the individual best position, Pgd represents the global best position, and Xid is the current position of the particle.
The traditional PSO algorithm employs a fixed inertia weight (W). However, by introducing a dynamic inertia weight optimization algorithm, the convergence speed can be further accelerated. The calculation method for the inertia weight (W) is shown in Equation (24):
Here, wmin and wmax are the preset minimum and maximum inertia coefficients, typically set to 0.4 and 0.9, respectively.represents the average fitness of all particles during the dd-th iteration, whiledenotes the maximum fitness of all particles during the dd-th iteration.
The larger the fitness value, the closer the solution is to the global optimum, requiring an intensified local search. Conversely, the smaller the fitness value, the farther the solution is from the global optimum, necessitating an enhanced global search. Compared to the traditional PSO algorithm, the inertia weight in the current optimization algorithm is not only related to the number of iterations but also closely tied to the fitness value of each particle.
The detailed process of the algorithm is shown in Figure 12.
3. Results
3.1. Research Results of Discharge Heating Optimization Method
Table 1 presents the discharge current results calculated using the PSO optimization algorithm. As shown, the optimized discharge current values vary across different weight factors and heating temperature ranges. Under the same weight condition, the optimized preheating current gradually increases with rising temperature. This is because, at higher temperatures, the battery's performance improves, allowing higher discharge current values while maintaining the same level of capacity degradation after 1,000 heating cycles. By solving the equations in reverse, the results for capacity degradation and heating time across different heating ranges and weight factors are summarized in Table 2.
3.2. Results of the Constant Current Discharge Method
To analyze the impact of different strategies on the entire heating process, a comprehensive summation of the key parameters was performed, with results presented in Table 3. Under varying discharge rates, significant differences were observed in capacity degradation, heating time, and energy consumption during the heating process.
When the weight factor λ=0, corresponding to the maximum current boundary, the battery can be heated from -30°C to 0°C in just 22.17 seconds. However, in this case, the capacity degradation reaches 0.1038 Ah, significantly higher than that under other weight conditions, as shown in Figure 13(a).
When λ=1, corresponding to the minimum current boundary, the same target temperature is achieved in 88.34 seconds. As seen in Figure 13(b), the heating time is notably longer than under other weight conditions. The advantage, however, is that the capacity degradation is minimized, reducing to 0.00 Ah.
These two heating strategies represent two extreme scenarios. One prioritizes short heating time, while the other minimizes capacity degradation. However, neither can simultaneously satisfy the optimization requirements for both objectives.
3.3. Power Consumption Comparative Analysis
To further evaluate the proposed optimization method, the changes in the SOC during the heating process were recorded from the perspective of power consumption. SOC represents the ratio of the remaining capacity to the total available capacity of a battery after use or idle periods. In this study, an internal discharge self-heating method was employed, making power consumption directly related to whether the battery can continue to function normally after preheating. Thus, assessing the remaining charge after heating is particularly important.
Table 4 summarizes the energy consumption results for battery preheating under different weighted optimization current conditions. According to Figure 14, as the current increases, energy consumption rises correspondingly. The rate of energy consumption growth exhibits a phased trend: it grows rapidly in the initial phase, enters a relatively stable region, and then accelerates again. This trend highlights the critical role of optimizing the heating current to balance energy utilization efficiency and battery performance effectively.
4. Discussion
This study, based on the relationship between the battery temperature rise model, capacity degradation model, and heating current, establishes heating time and capacity degradation as dual optimization objectives for DC heating. By determining an appropriate heating current, a temperature-adaptive low-temperature DC heating method for batteries based on an optimization algorithm is proposed.
Compared to preheating methods that directly use the minimum optimized current boundary, the optimized heating strategy shortens heating time by 48.71 seconds and increases the heating rate by more than twofold. In contrast to preheating methods that use the maximum optimized current boundary, the optimized strategy reduces capacity degradation by 0.10 Ah after 1,000 heating cycles.
From the perspective of energy consumption, the optimized strategy decreases energy loss by 2.08% compared to preheating with the minimum optimized current boundary but increases energy consumption by 3.712 Ah compared to preheating with the maximum optimized current boundary.
Looking ahead, further research is required to address current control under varying weighting conditions, particularly on efficiently integrating optimization algorithms into BMS. Additionally, exploring how dynamic adjustments to preheating currents can achieve functional goals will provide more effective solutions to enhance battery performance in low-temperature environments.
Author Contributions
Conceptualization, Shaojian Han; Data curation, Shaojian Han; Methodology, Chengwei Li and Xinhua Gao; Software, Jifeng Ding and Zhiwen Zhang; Validation, Chengwei Li and Xinhua Gao; Writing – original draft, Shaojian Han; Writing – review & editing, Xiaojie Li.
Funding
This research received no external funding.
Data Availability Statement
The original contributions presented in the study are included in the article; further inquiries can be directed to the corresponding author.
Conflicts of Interest
The authors declare no conflicts of interest.
Abbreviations
The following abbreviations are used in this manuscript:
| EVs | electric vehicles |
| DC | direct current |
| PSO | Particle Swarm Optimization |
| AC | alternating current |
| CSH | composite self-heating |
| SOC | state of charge |
| DP | Dual Polarization |
| OCV | open-circuit voltage |
| HPPC | Hybrid Pulse Power Characterization |
| BMS | battery management systems |
References
- Liu D T, Zhou J B, Guo L M, et al. Review of health evaluation and lifetime prediction of lithium-ion batteries [J]. Chinese Journal of Scientific Instrument, 2015, 36(01): 1-16.
- Park H. A Design of Air Flow Configuration for Cooling Lithium ion Battery in Hybrid Electric Vehicles[J]. Journal of Power Sources. 2013, 239: 30-36.
- Bandhauer T M, Garimella S, Fuller T F. A Critical Review of Thermal Issues in Lithium-Ion Batteries[J]. Journal of the Electrochemical Society. 2011,158(3): 1-25.
- Zhang J, Ge H, Li Z, et al. Internal Heating of Lithium-ion Batteries using Alternating Current based on the Heat Generation Model in Frequency Domain[J]. Journal of Power Sources. 2015, 273: 1030-1037.
- Bae S, Song H D, Nam I, et al. Quantitative Performance Analysis of Graphite-LiFePO4 Battery Working at Low Temperature[J]. Chemical Engineering Science. 2014, 118: 74-82.
- Cho H, Choi W, Go J, et al. A Study on Time-Dependent Low Temperature Power Performance of a Lithium-ion Battery[J]. Journal of Power Sources.2012, 198: 273-280.
- Zhao X W, Zhang G Y, Yang L, et al. A New Charging Mode of Li-ion Batteries with LiFePO4/C Composites under Low Temperature[J]. Journal of Thermal Analysis and Calorimetry. 2011, 104(2): 561-567.
- Tippmann S, Walper D, Balboa L, et al. Low-temperature Charging of Lithium-ion Cells Part I: Electrochemical Modeling and Experimental Investigation of Degradation Behavior[J]. Journal of Power Sources. 2014,252: 305-316.
- Chang W, Kim S, Park I, et al. Low Temperature Performance of LiFePO4 Cathode Material for Li-ion Batteries[J]. Journal of Alloys and Compounds.2013, 563: 249-253.
- Ji Y, Wang C Y. Heating Strategies for Li-ion Batteries Operated from Subzero Temperatures[J]. Electrochimica Acta. 2013, 107: 664-674.
- Zeng S H, Wu W X, Liu J Z, et al. Review of immersion cooling technology for lithium-ion batteries [J]. Energy Storage Science and Technology, 2023, 12(09): 2888-2903.
- Zhu J W, Huang L S, Chen X J, et al. Capacitor-based self-heating method for low-temperature discharge of lithium batteries [J]. Power Electronics Technology, 2023, 57(10): 77-79+84.
- PESARAN A A. Energy efficient battery heating in cold climates[J].SAE Transactions,2002,111:377-382.
- Ji Y, Wang C Y. Heating strategies for Li-ion batteries operated from subzero temperatures[J]. Electrochimica Acta,2013,107:664-674.
- Ruan H, Jiang J, Sun B, et al. An optimal internal-heating strategy for lithium-ion batteries at low temperature considering both heating time and lifetime reduction[J]. Applied energy, 2019, 256: 113797.
- Qu, Z G, Jiang, Z Y, Wang, Q. Experimental study on pulse self–heating of lithium–ion battery at low temperature[J]. International Journal of Heat and Mass Transfer, 2019,135, 696–705.
- Wu H, Zhang X, Wang C, et al. Experimental study on aerogel passive thermal control method for cylindrical lithium-ion batteries at low temperature[J]. Applied thermal engineering, 2020, 169: 114946.
- Chen Z Y, Xiong R, Li S J, et al. Study on rapid low-temperature heating methods for lithium-ion batteries in electric vehicles [J]. Journal of Mechanical Engineering, 2021, 57(4): 113-120.
- Ruan H, Sun B, Zhu T, et al. Compound self-heating strategies and multi-objective optimization for lithium-ion batteries at low temperature[J]. Applied Thermal Engineering, 2021, 186: 116158.
- Wang N, Wang W, Li C, et al. A Self-heating and Charging Coordinated Strategy for Low-temperature Lithium-ion Batteries based on a Novel DAB-LC Converter[J]. IEEE Transactions on Transportation Electrification, 2024.
Figure 1.
Thevenin Equivalent Circuit Model.
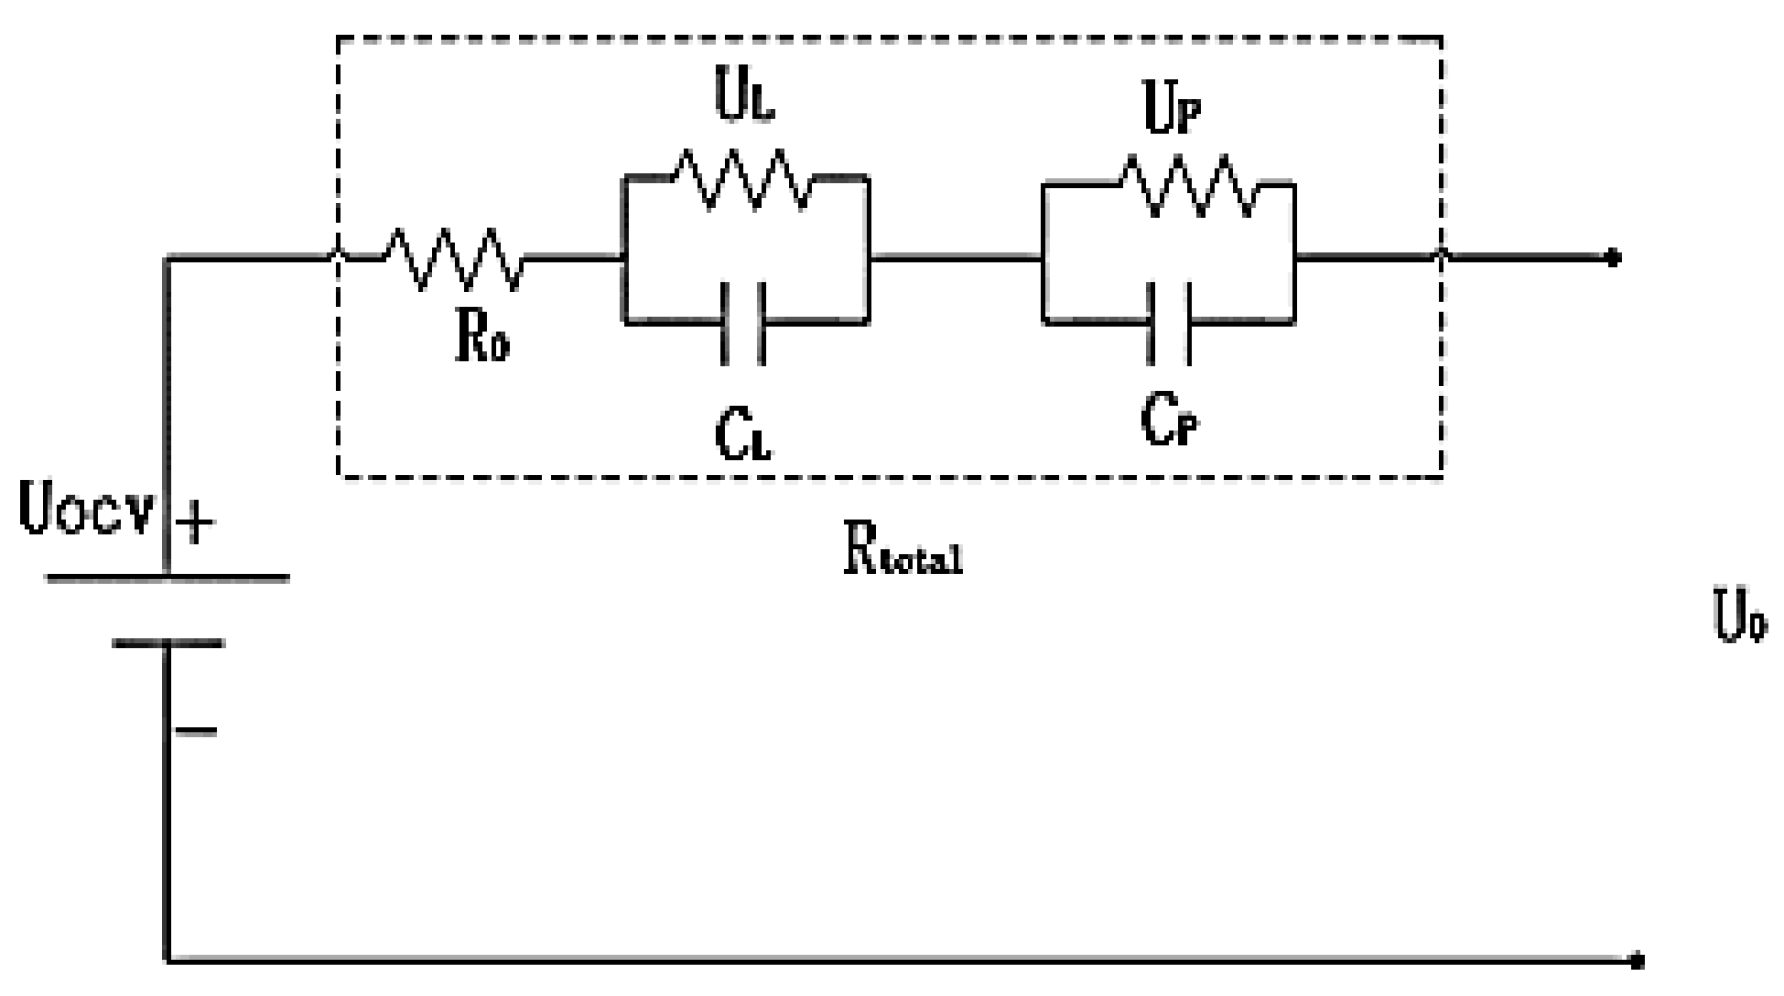
Figure 2.
Dynamic Condition Validation.
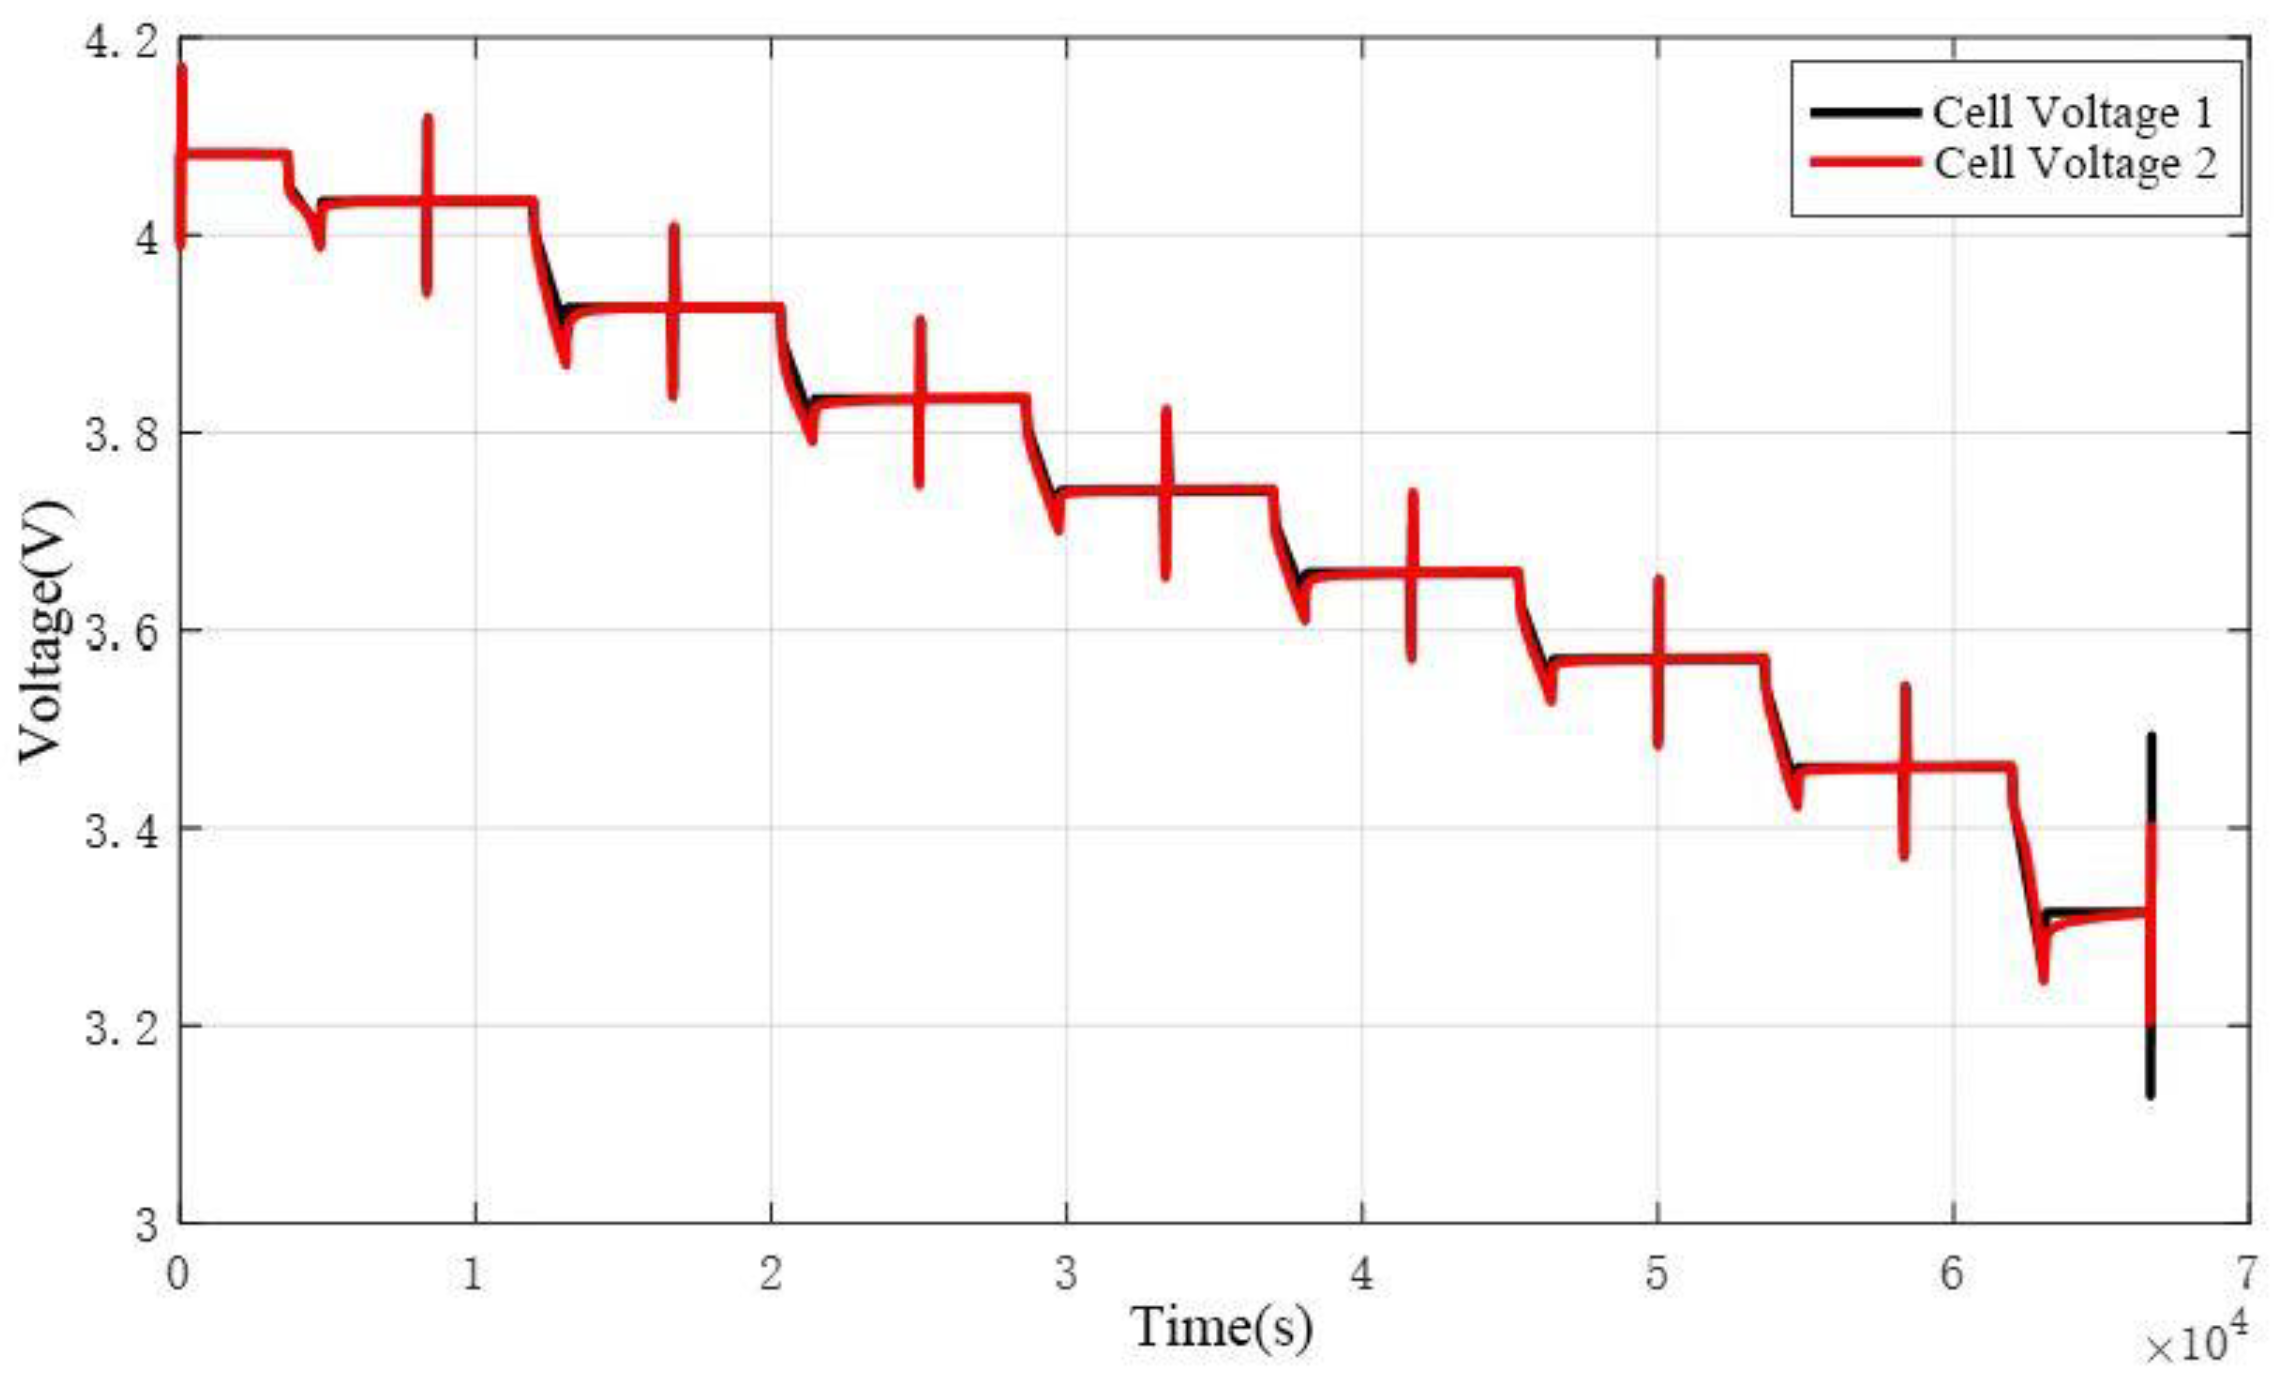
Figure 3.
Deviation Between Model and Simulation.
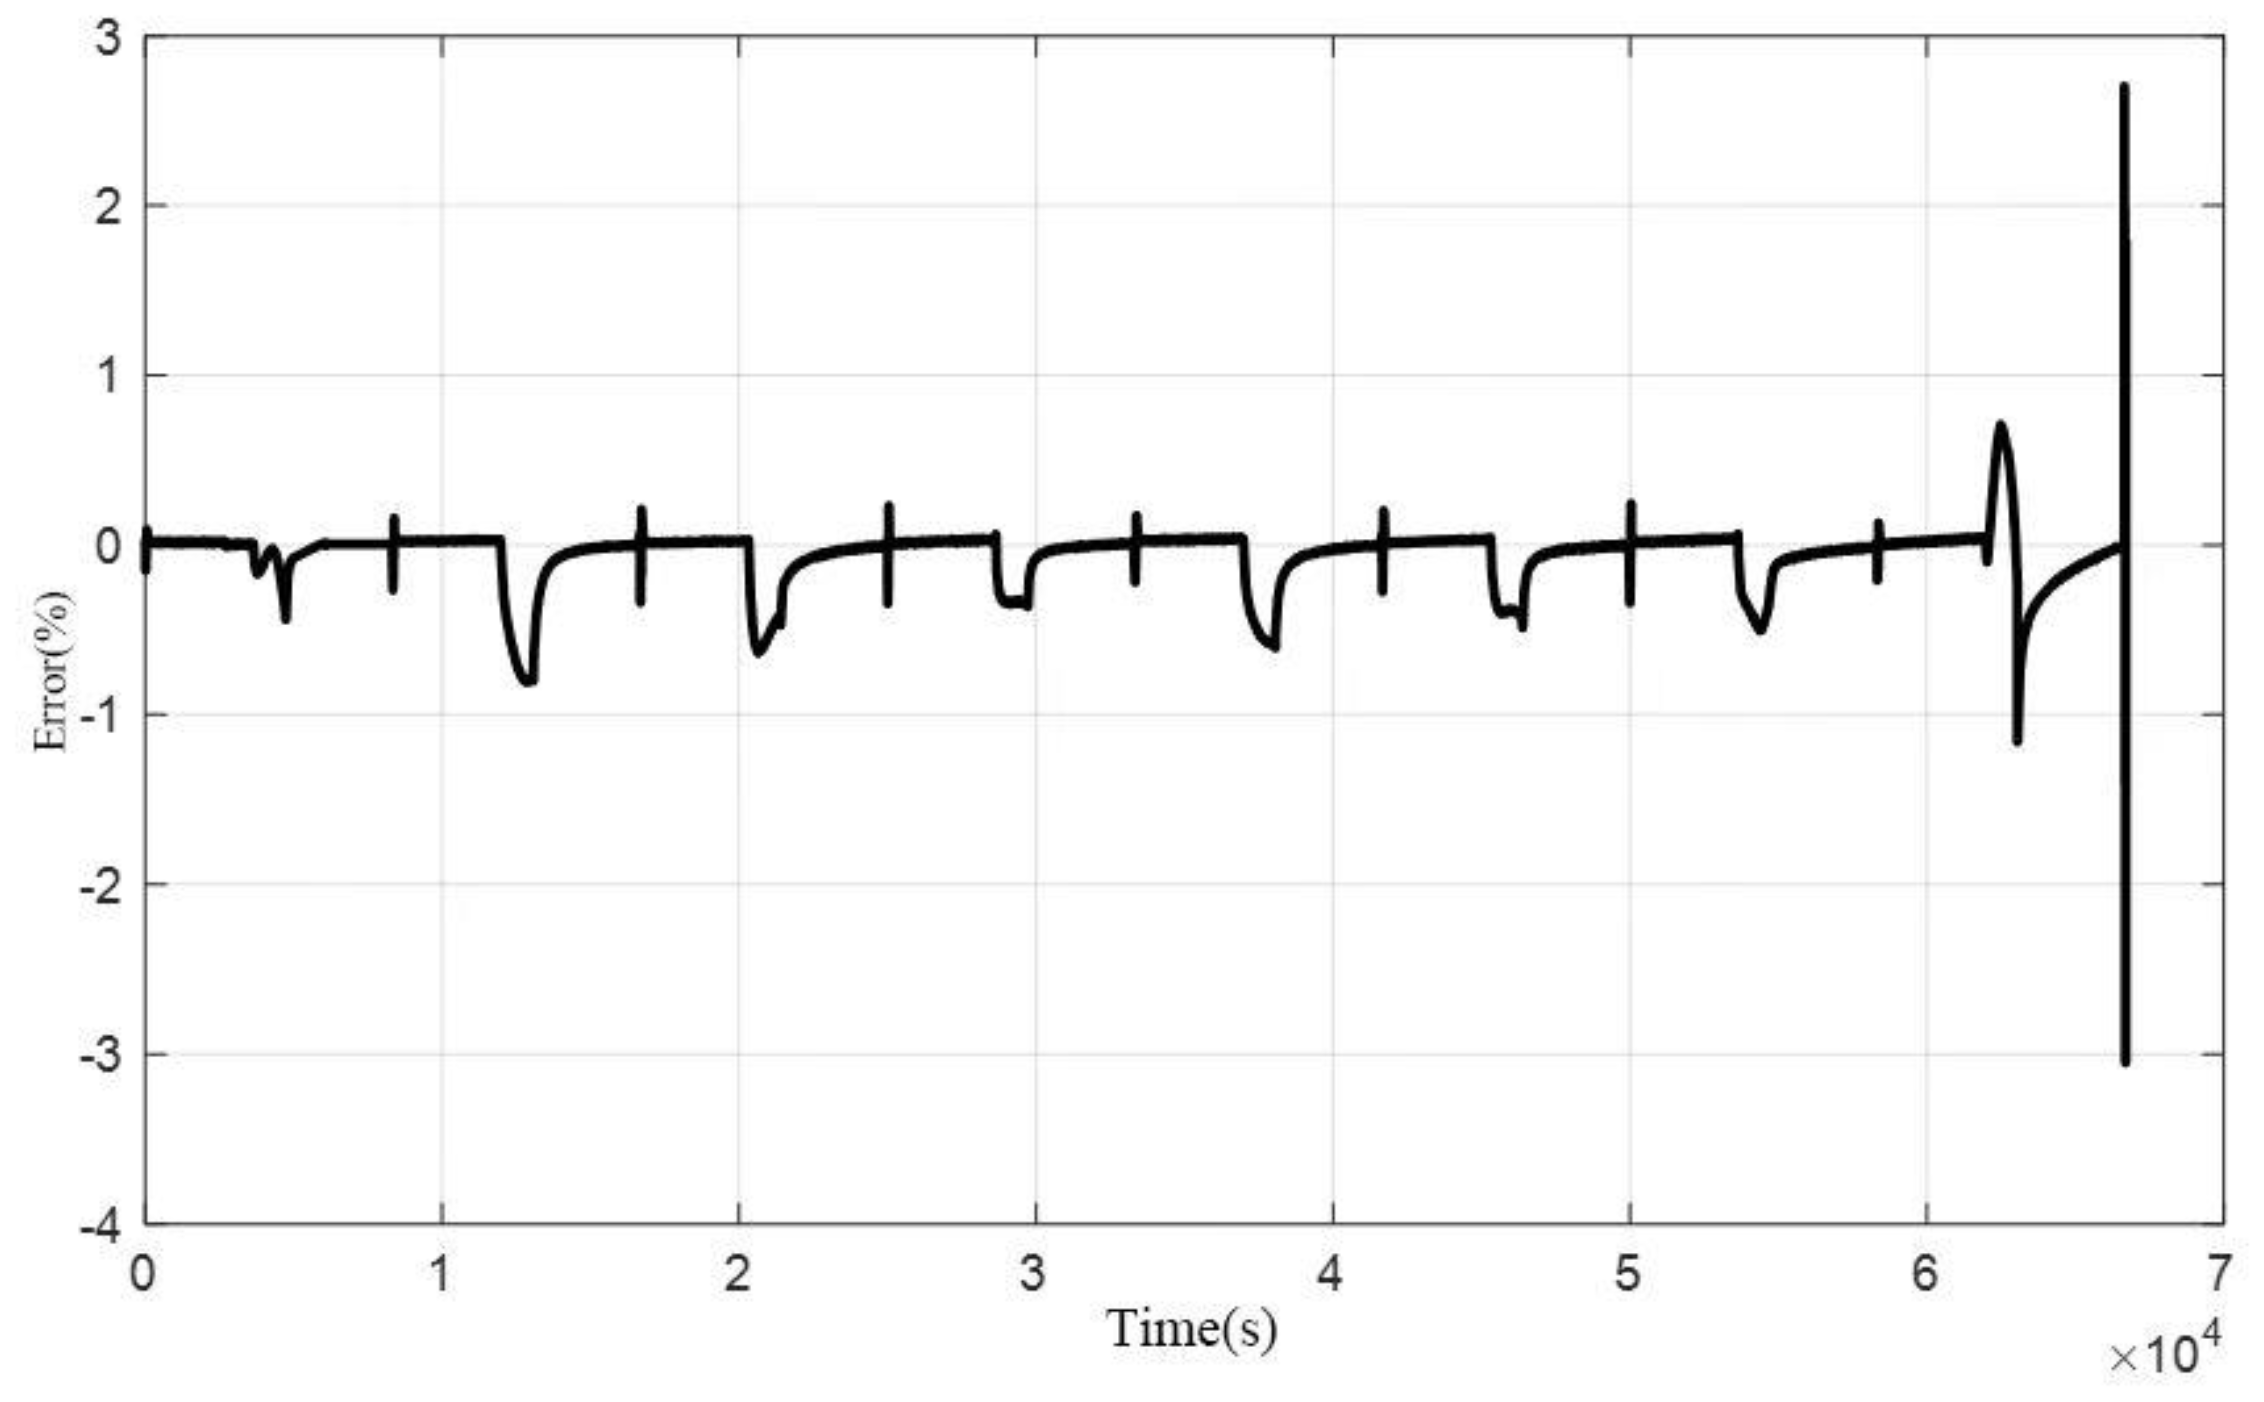
Figure 4.
Schematic Diagram of the Thermoelectric Coupling Temperature Rise Model.
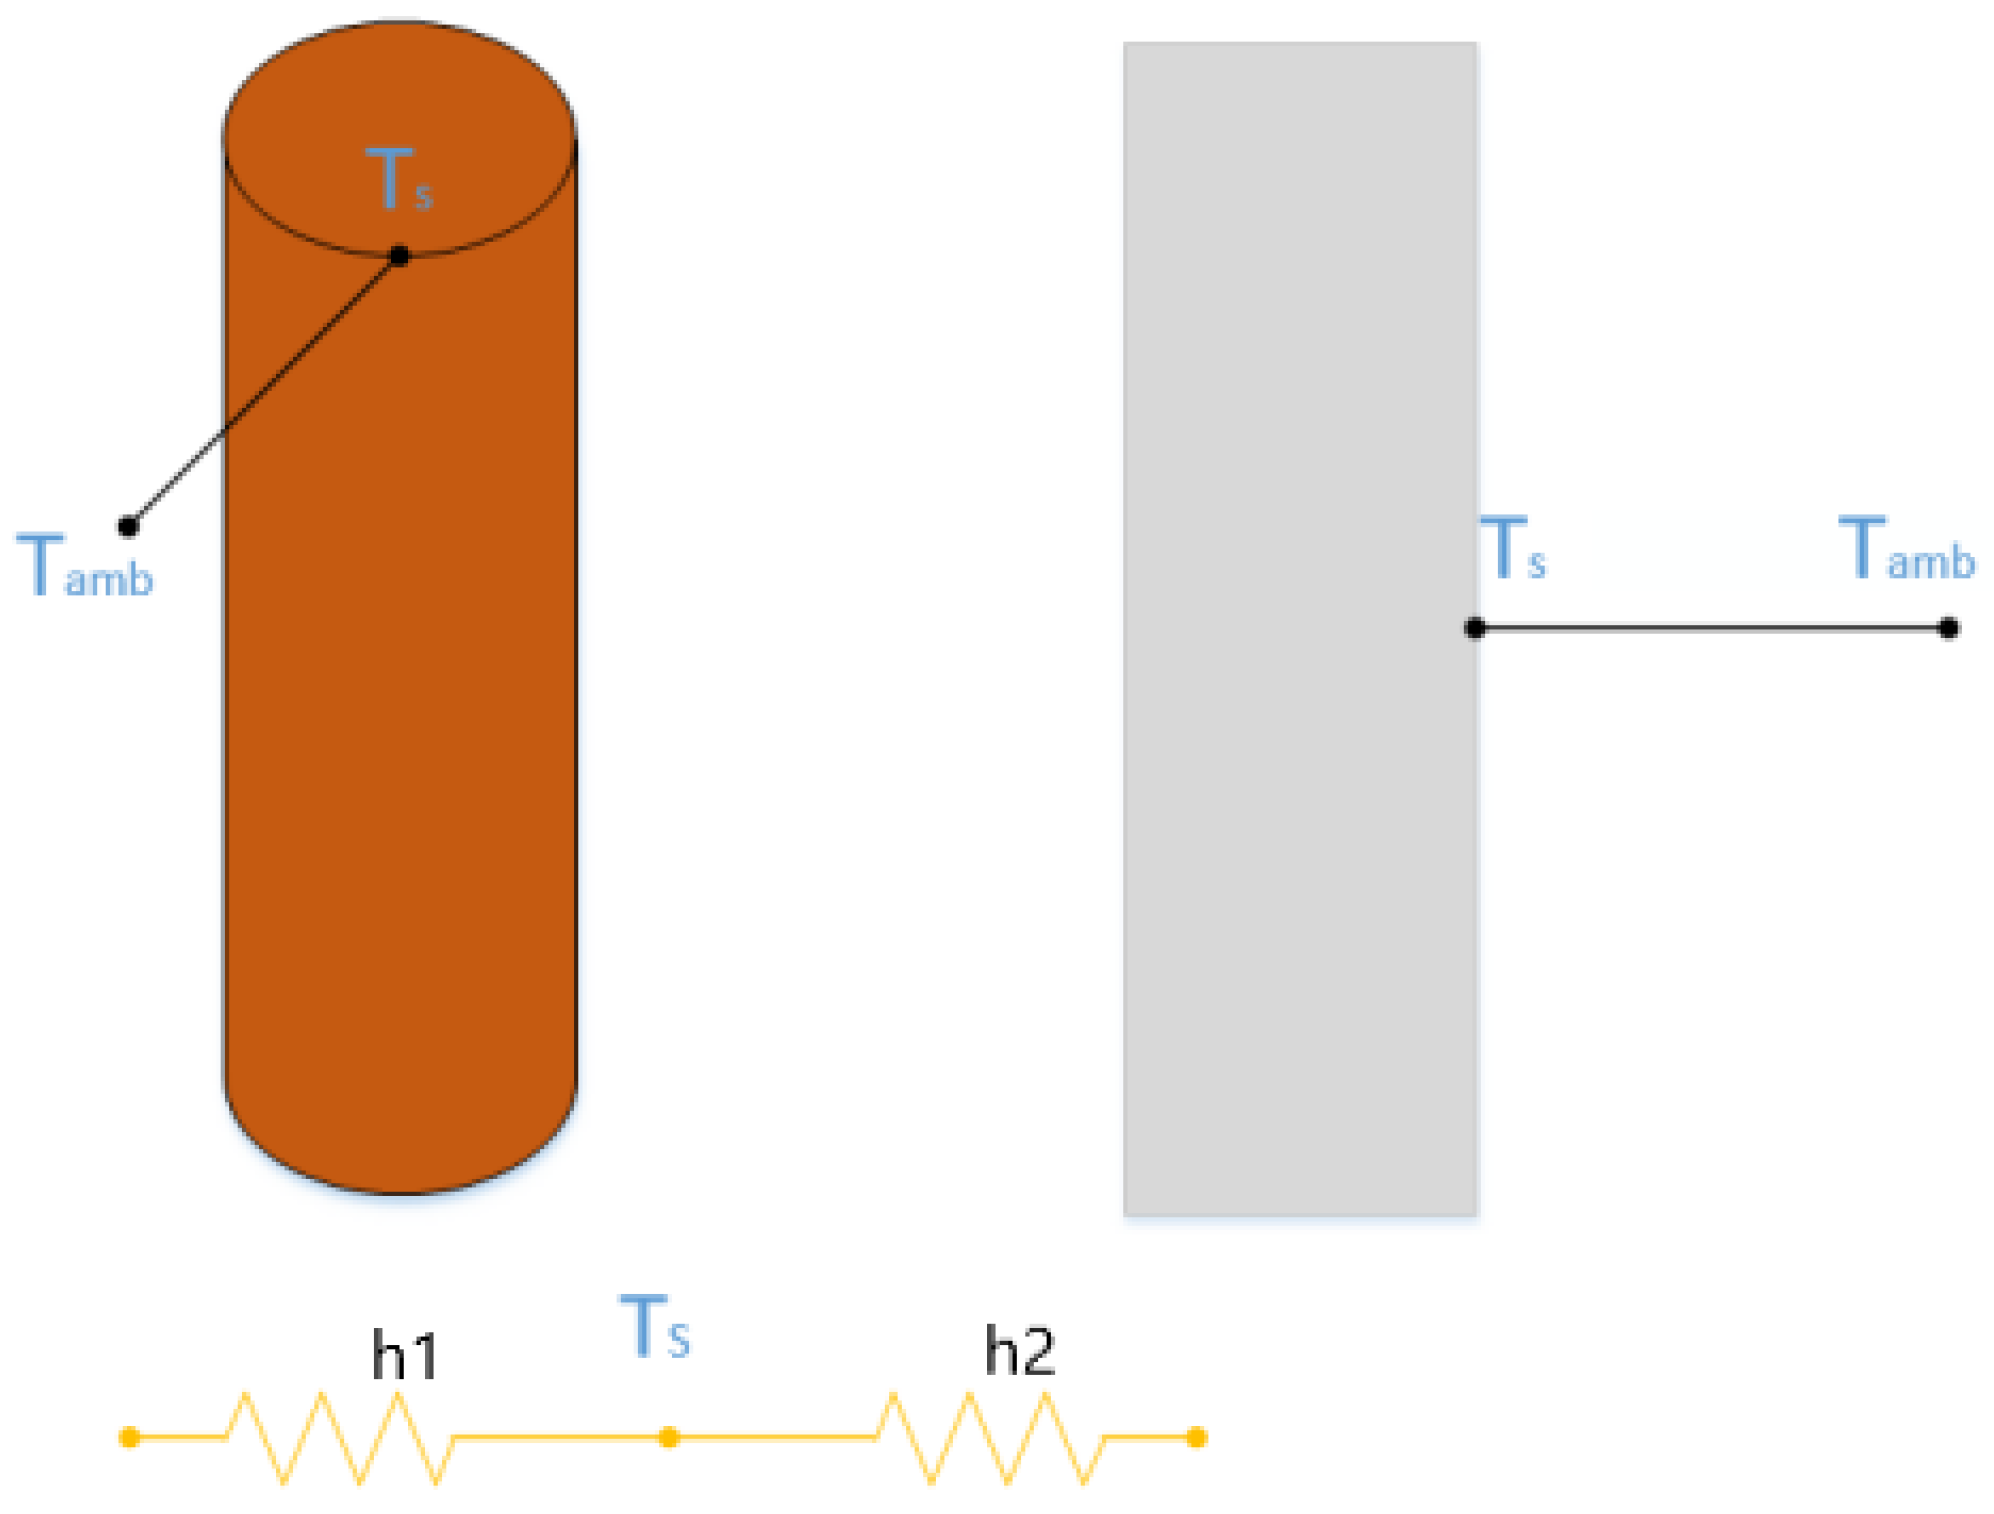
Figure 5.
Comparison of Model-Estimated Temperature and Measured Temperature During 12A Constant Current Discharge Heating at -30°C.
Figure 5.
Comparison of Model-Estimated Temperature and Measured Temperature During 12A Constant Current Discharge Heating at -30°C.
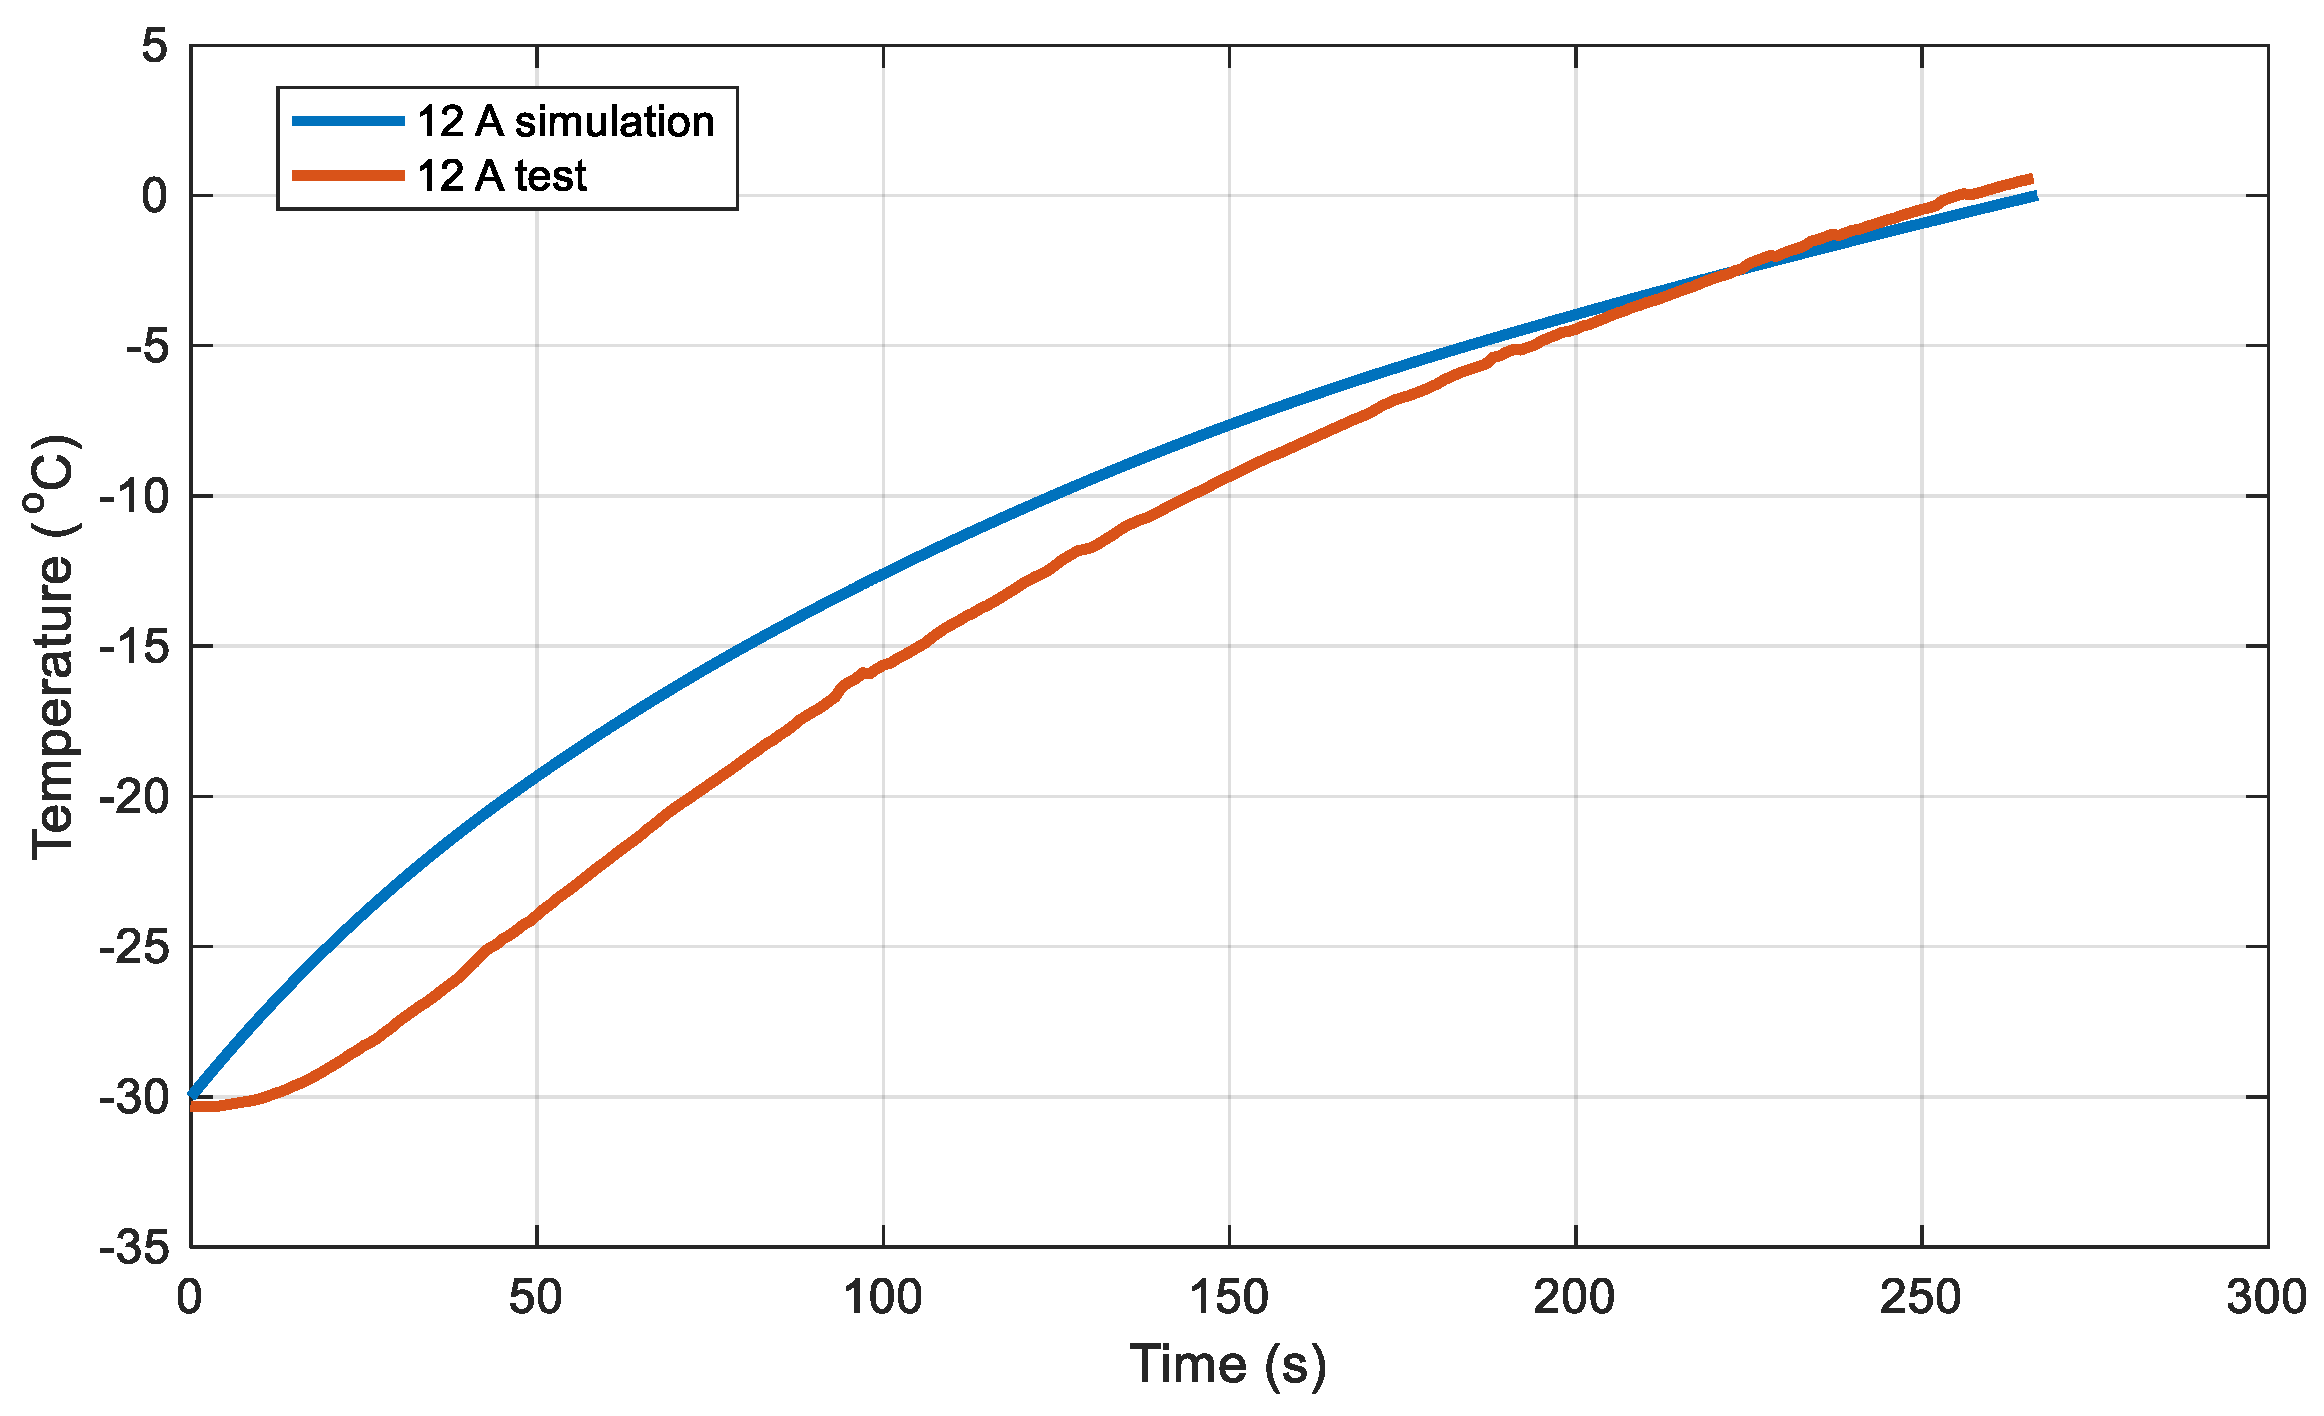
Figure 6.
Error Between Model-Estimated Temperature and Measured Temperature During 12A Constant Current Discharge Heating at -30°C.
Figure 6.
Error Between Model-Estimated Temperature and Measured Temperature During 12A Constant Current Discharge Heating at -30°C.
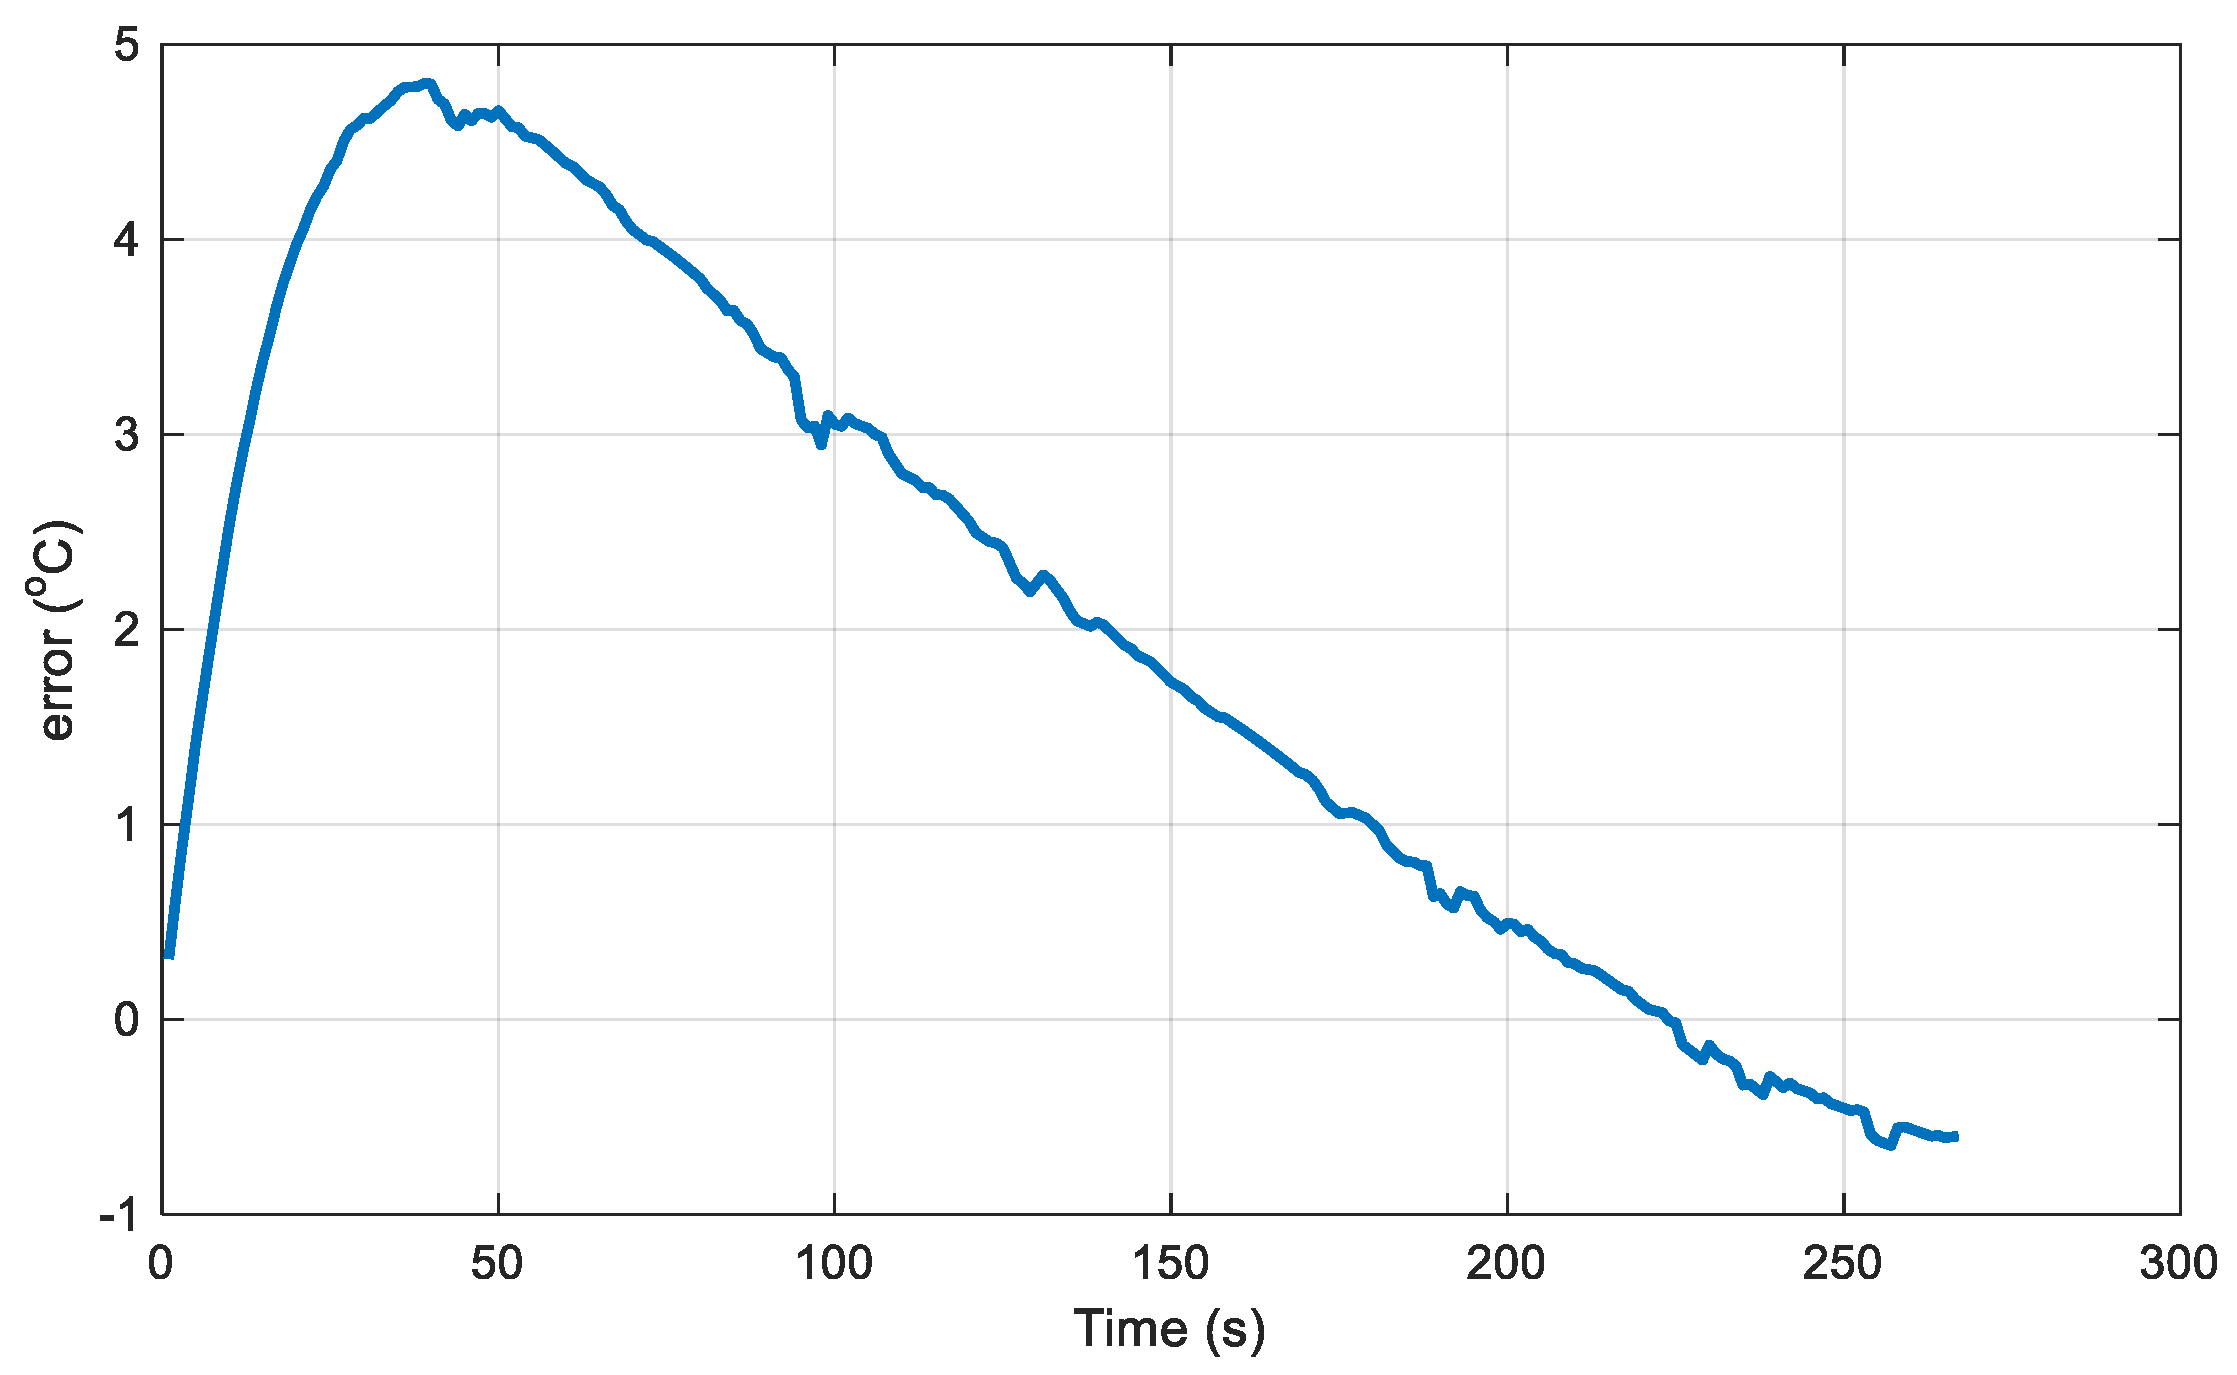
Figure 7.
Comparison of Model-Estimated Temperature and Measured Temperature During 8A Constant Current Discharge Heating at -30°C.
Figure 7.
Comparison of Model-Estimated Temperature and Measured Temperature During 8A Constant Current Discharge Heating at -30°C.

Figure 8.
Error Between Model-Estimated Temperature and Measured Temperature During 8A Constant Current Discharge Heating at -30°C.
Figure 8.
Error Between Model-Estimated Temperature and Measured Temperature During 8A Constant Current Discharge Heating at -30°C.
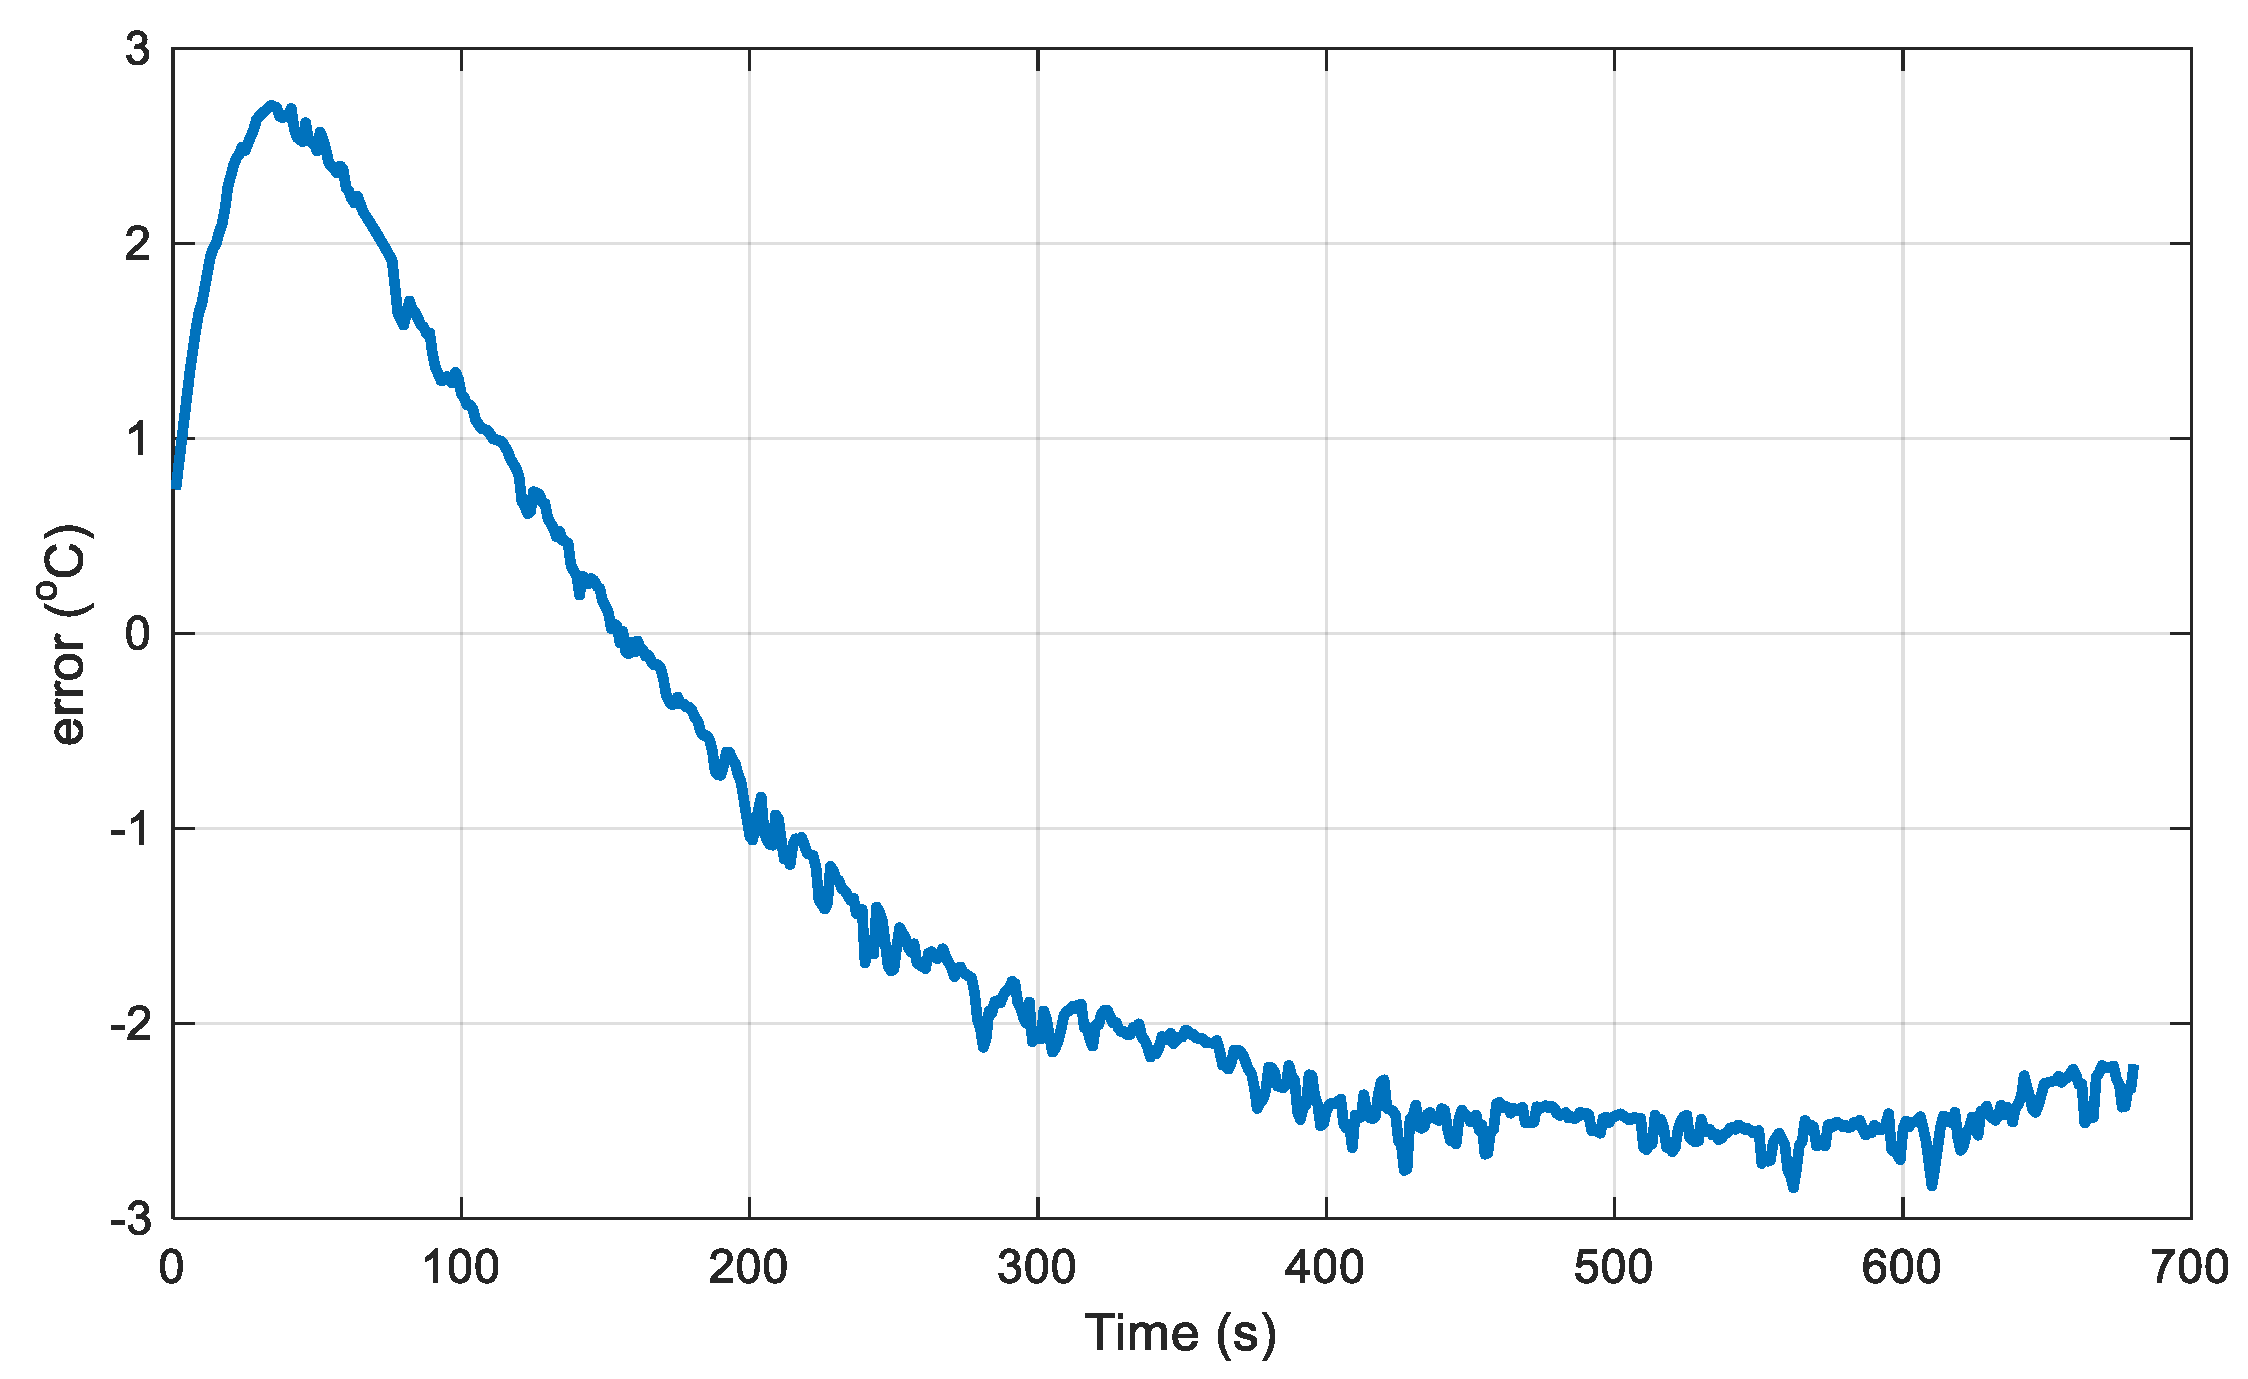
Figure 11.
Maximum Discharge Current Threshold.
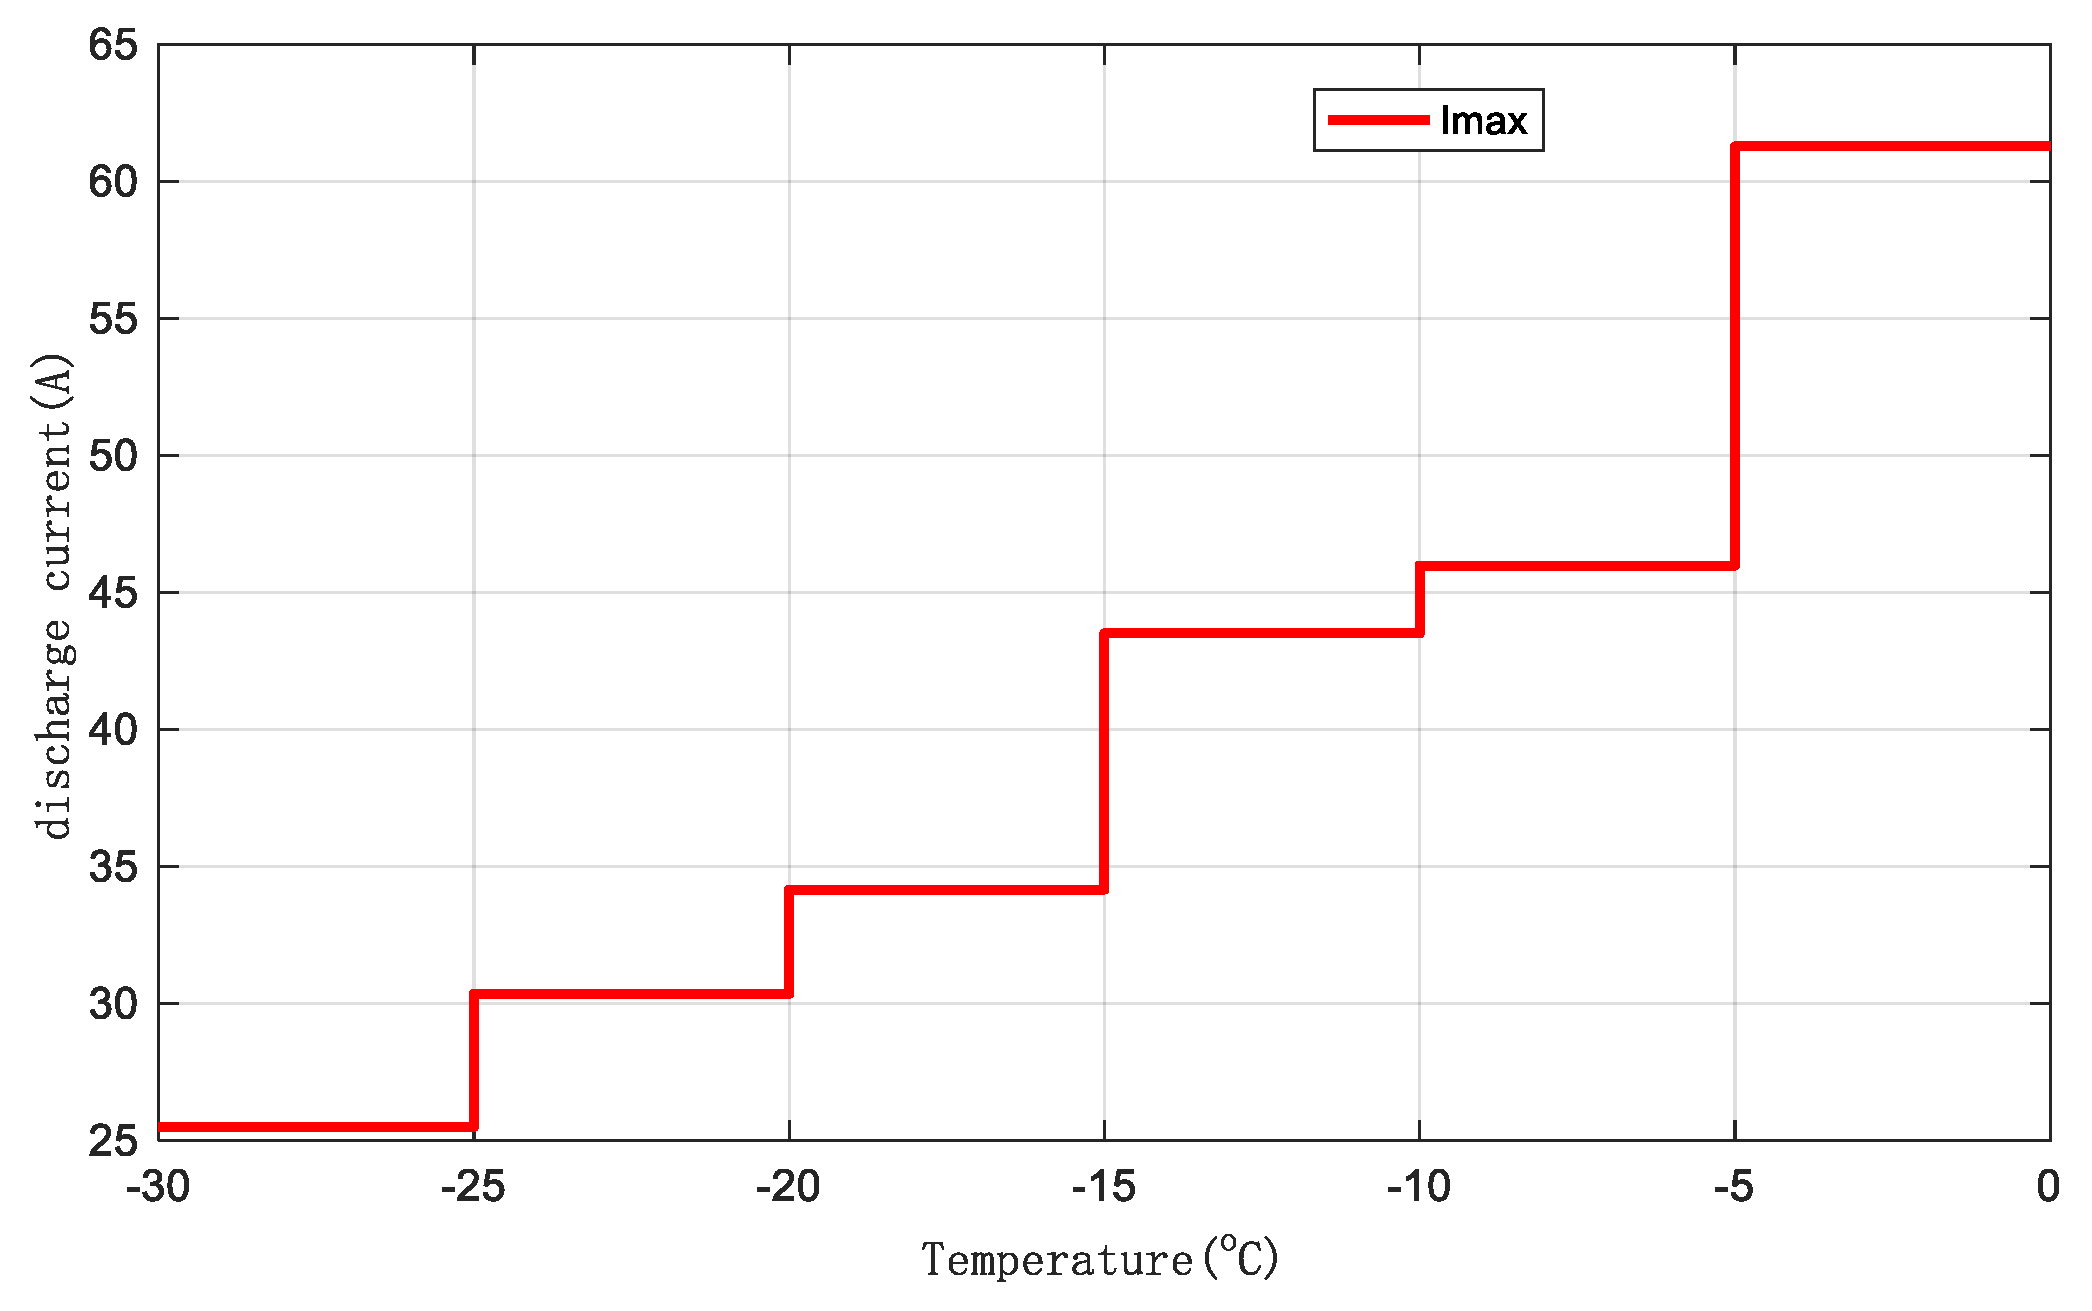
Figure 12.
PSO Optimization Algorithm.
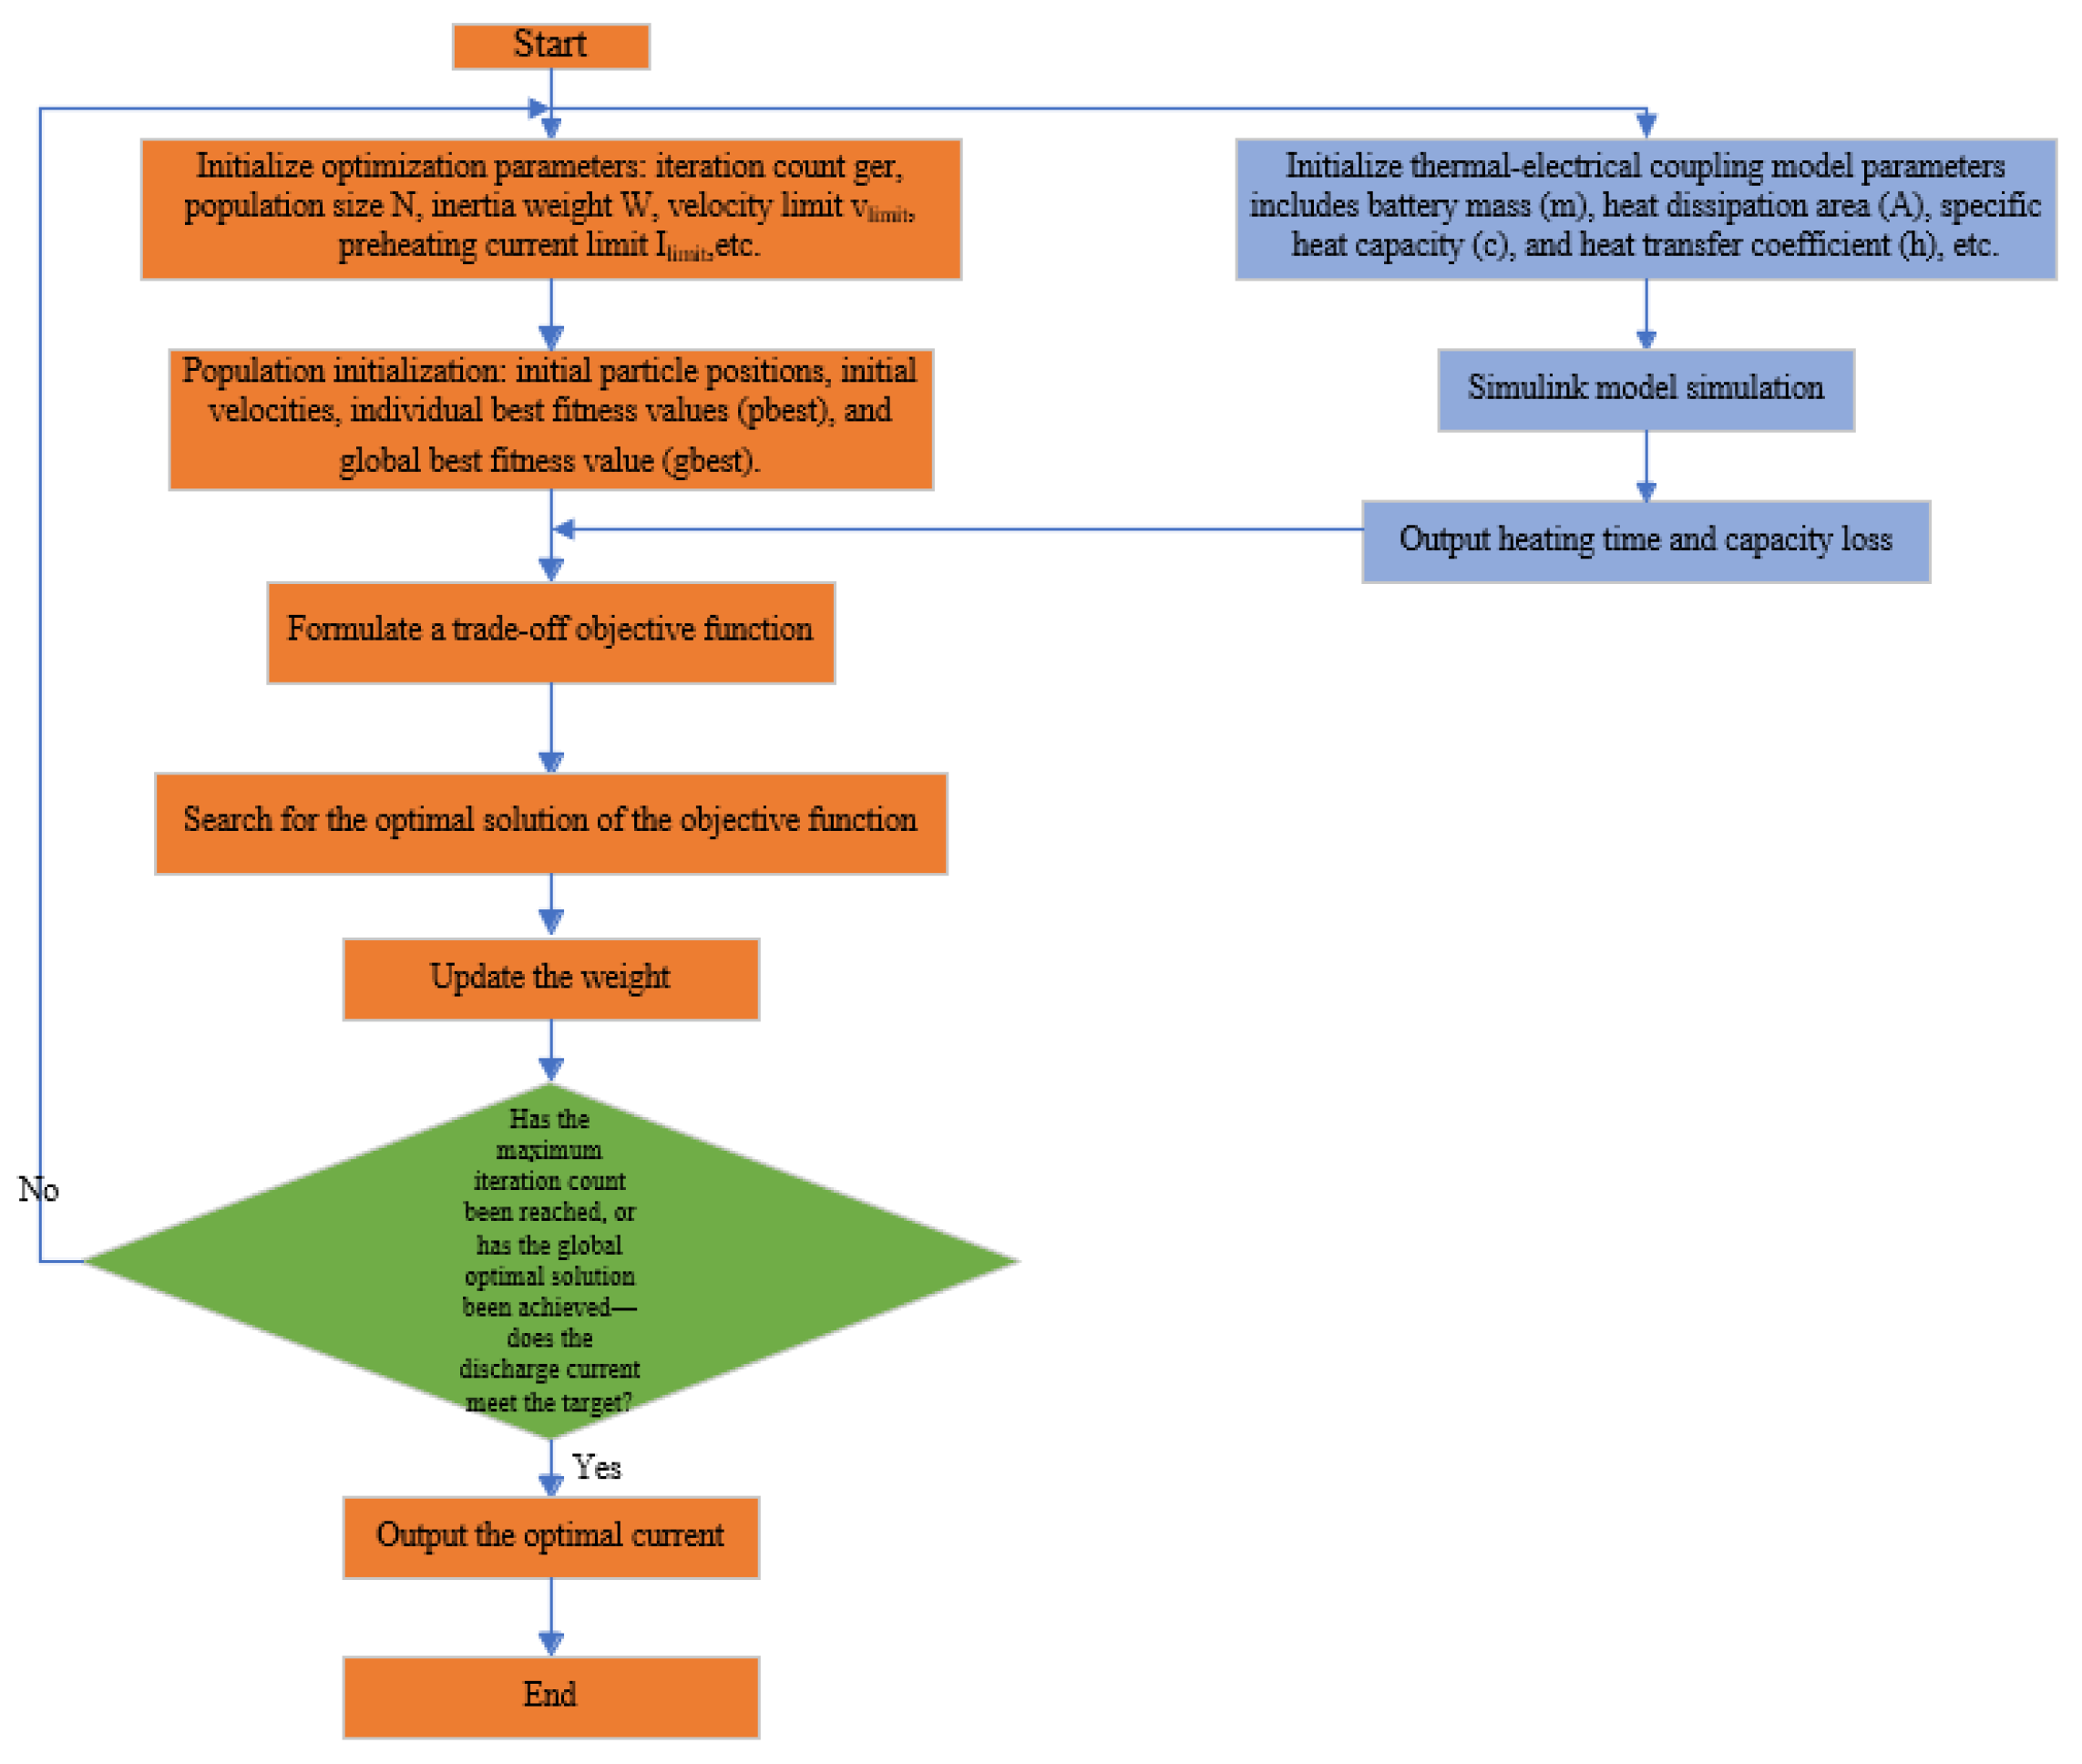
Figure 13.
Optimization Results, (a) Capacity Degradation and Weight (b) Heating Time and Weight.
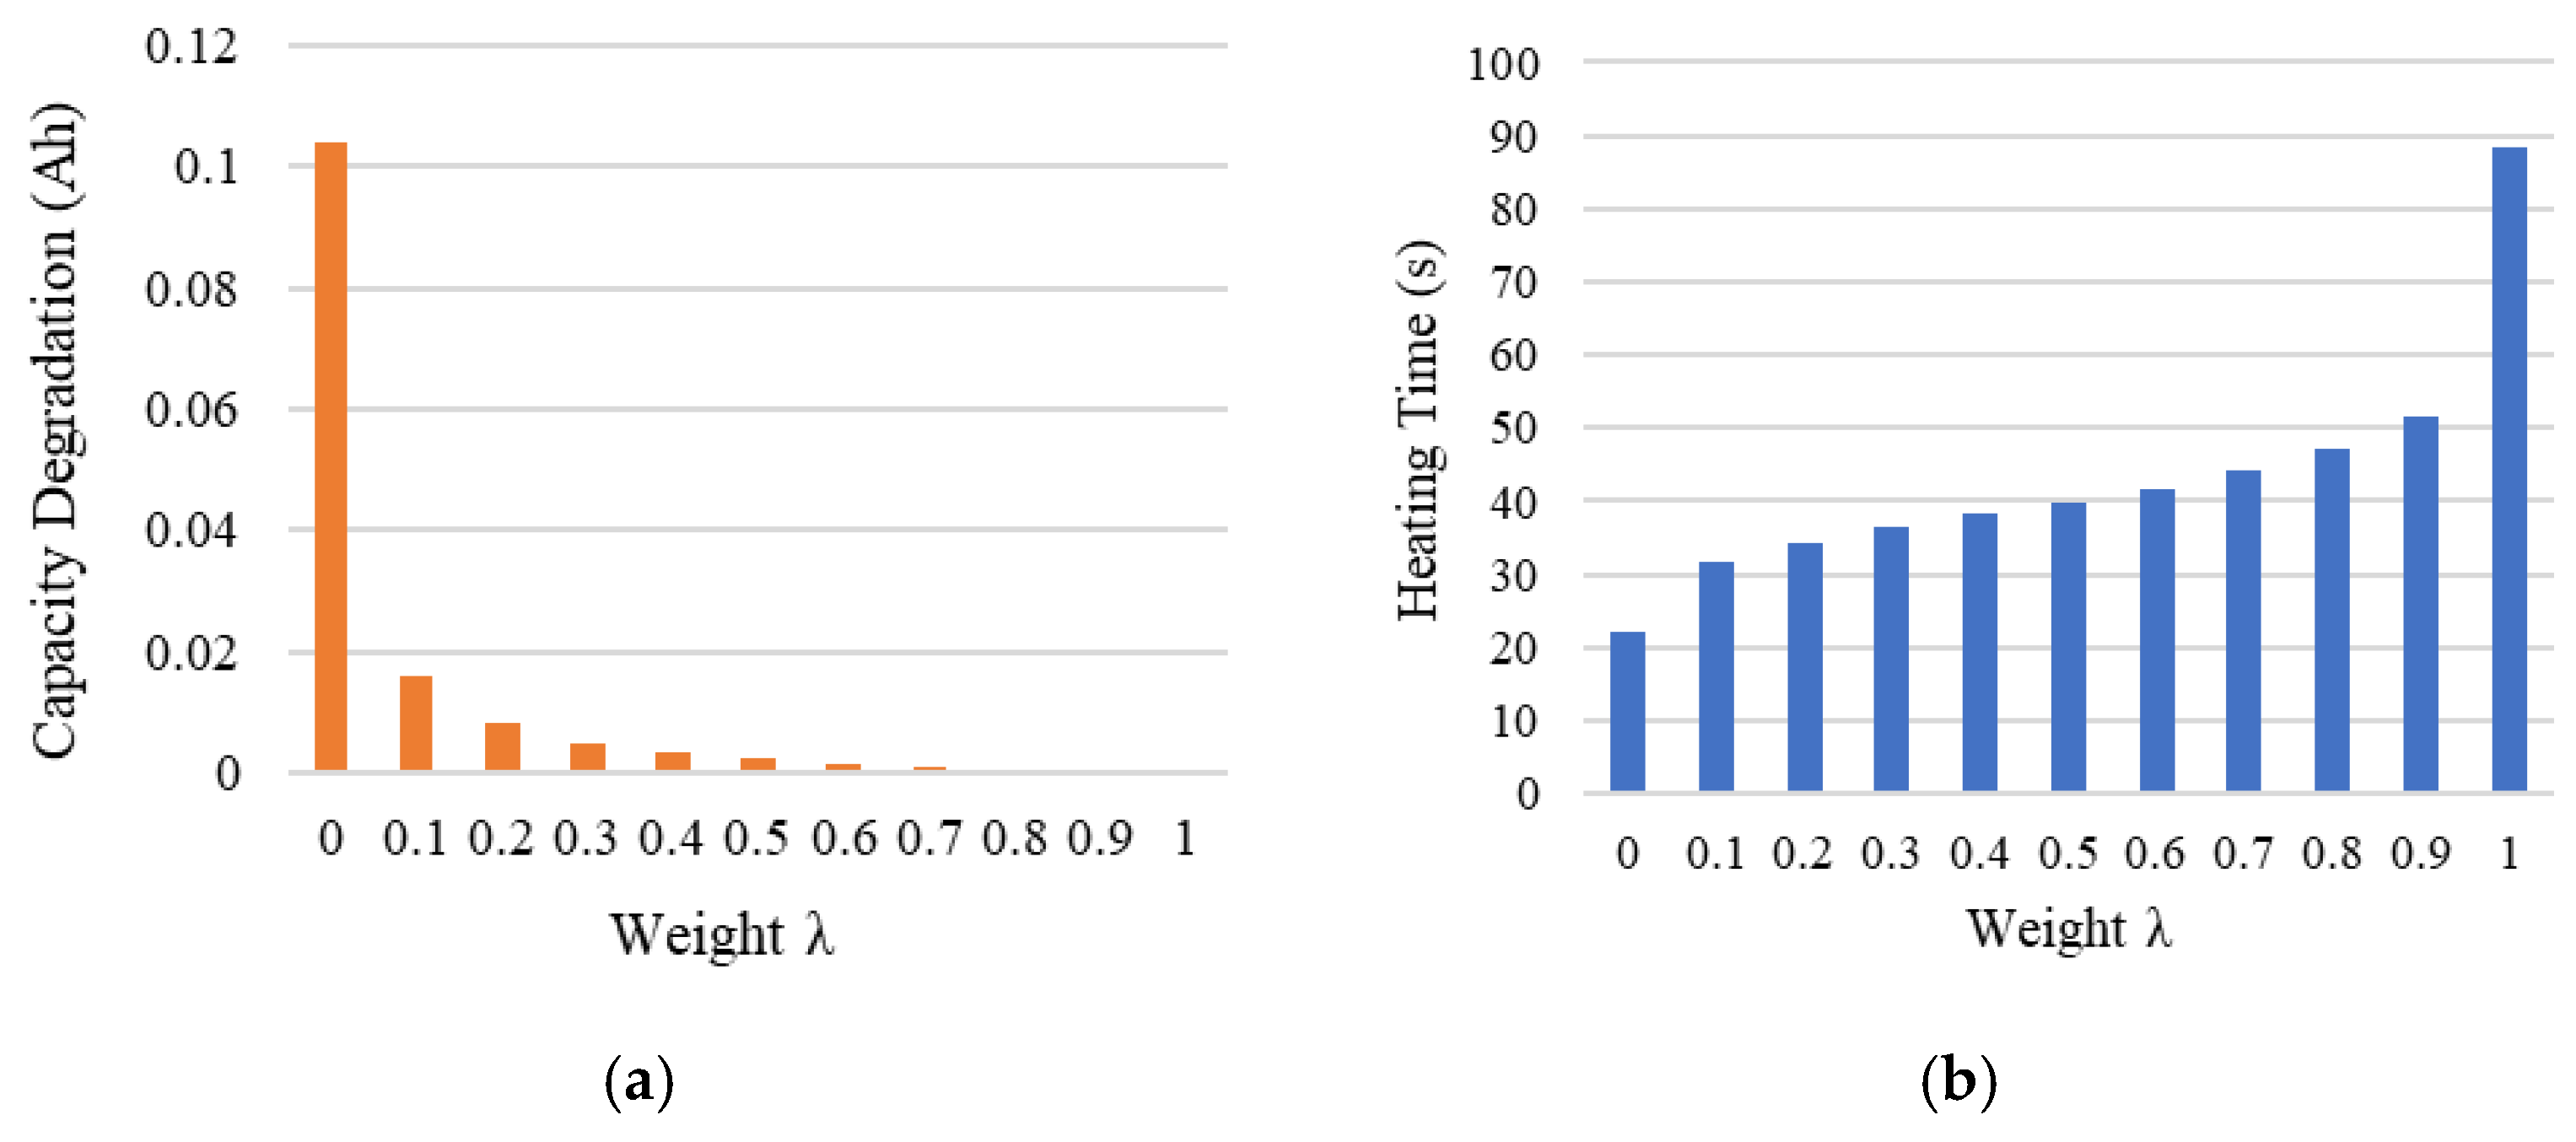
Figure 14.
Power Consumption and Weight.
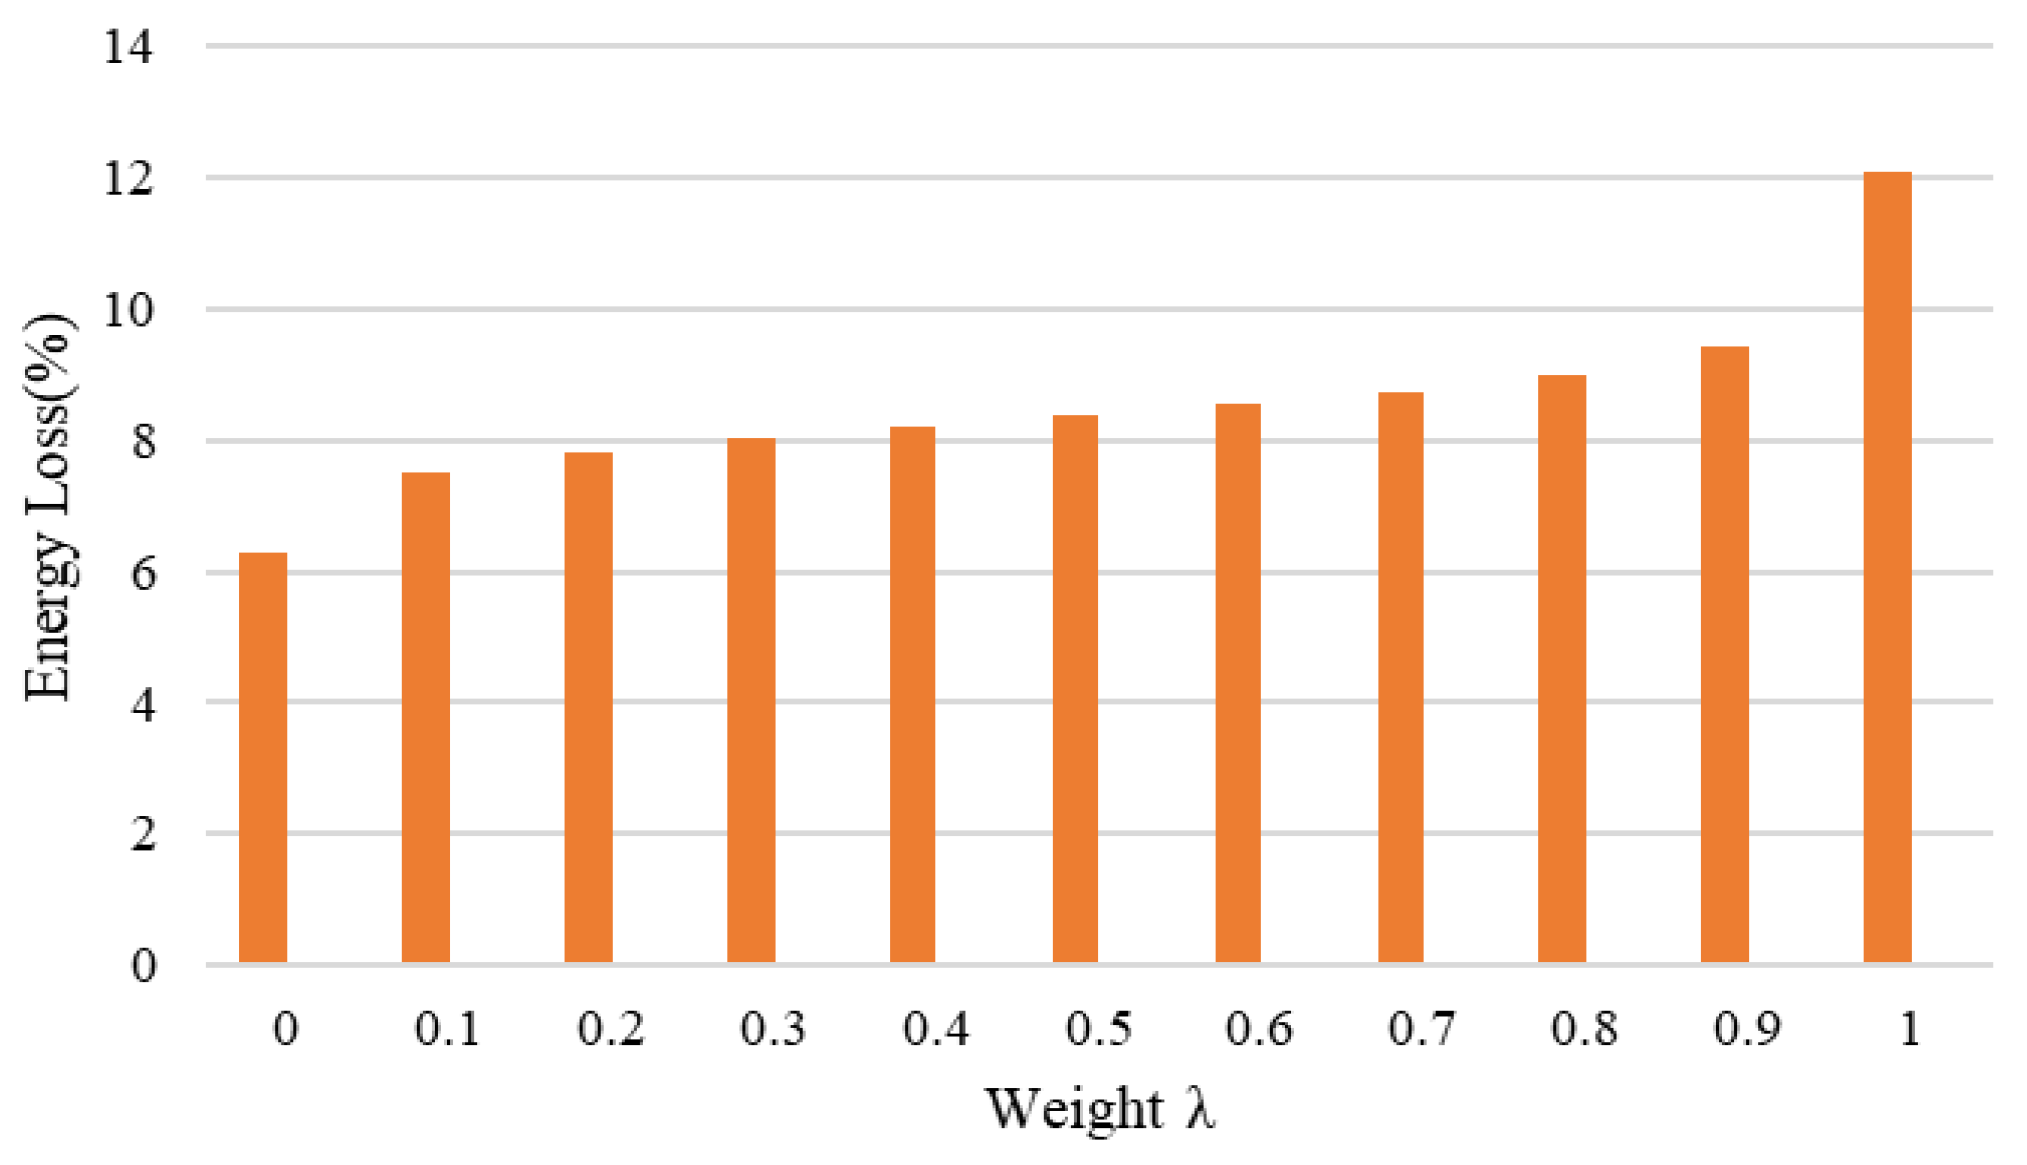

Table 1.
Optimized Current Results.
| Optimization Results | ||||||
|
Weight |
Imax | |||||
| 25.5107A | 30.36A | 34.1668A | 43.5132A | 45.9874A | 61.2796A | |
| -30°C--25°C | -25°C--20°C | -20°C--15°C | -15°C--10°C | -10°C--5°C | -5°C-0°C | |
| 0 | 25.1777 | 30.36 | 33.691 | 43.5044 | 45.945 | 61.2236 |
| 0.1 | 20.092 | 26.2776 | 29.4918 | 32.7368 | 42.1821 | 51.727 |
| 0.2 | 19.008 | 25.1531 | 28.3996 | 31.6242 | 41.1079 | 50.5568 |
| 0.3 | 18.3232 | 24.439 | 27.6511 | 30.8283 | 40.2954 | 49.7927 |
| 0.4 | 17.7611 | 23.876 | 27.0448 | 30.2895 | 39.7506 | 49.1941 |
| 0.5 | 17.2274 | 23.3157 | 26.4773 | 29.6826 | 39.228 | 48.6808 |
| 0.6 | 16.6827 | 22.7279 | 25.9253 | 29.2011 | 38.6437 | 48.122 |
| 0.7 | 16.1404 | 22.1386 | 25.3889 | 28.5517 | 38.0842 | 47.5236 |
| 0.8 | 15.4742 | 21.4418 | 24.6521 | 27.8483 | 37.2904 | 46.7779 |
| 0.9 | 14.4202 | 20.3645 | 23.5654 | 26.7538 | 36.1374 | 45.6458 |
| 1 | 10 | 15 | 20 | 25 | 30 | 35.0299 |
Table 2.
Calculation Results of Capacity Degradation and Heating Time.
| Weight | Capacity Degradation | Heating Time | ||||||||||
|
Temperature Range |
-30°C ~ -25°C |
-25°C ~ -20°C |
-20°C ~ -15°C |
-15°C ~ -10°C |
-10°C ~ -5°C |
-5°C ~ 0°C |
-30°C ~ -25°C |
-25°C ~ -20°C |
-20°C ~ -15°C |
-15°C ~ -10°C |
-10°C ~ -5°C |
-5°C ~ 0°C |
| 0 | 2.89 e-10 |
7.37 e-09 |
7.09 e-08 |
4.54 e-05 |
3.03 e-04 |
10.38 | 5.71 | 3.90 | 3.97 | 2.89 | 3.3 | 2.40 |
| 0.1 | 1.36 e-11 |
5.86 e-10 |
5.51 e-09 |
4.78 e-08 |
2.68 e-05 |
1.60 e-02 |
8.94 | 5.22 | 5.14 | 5.1 | 3.91 | 3.40 |
| 0.2 | 6.87 e-12 |
3.19 e-10 |
2.68 e-09 |
2.45 e-08 |
1.23 e-05 |
8.22 e-03 |
10.05 | 5.63 | 5.56 | 5.45 | 4.14 | 3.54 |
| 0.3 | 4.81 e-12 |
1.90 e-10 |
1.41 e-09 |
1.38 e-08 |
7.41 e-06 |
5.05 e-03 |
10.71 | 6.01 | 6 | 5.77 | 4.31 | 3.64 |
| 0.4 | 3.37 e-12 |
1.22 e-10 |
1.11 e-09 |
9.33 e-09 |
5.16 e-06 |
3.25 e-3 |
11.45 | 6.41 | 6.17 | 6.01 | 4.43 | 3.74 |
| 0.5 | 2.63 e-12 |
8.87 e-11 |
8.34 e-10 |
7.23 e-09 |
3.61 e-06 |
2.479 e-03 |
12.01 | 6.70 | 6.38 | 6.18 | 4.55 | 3.81 |
| 0.6 | 1.69 e-12 |
6.71 e-11 |
5.57 e-10 |
6.38 e-09 |
2.53 e-06 |
1.69 e-03 |
13.13 | 6.97 | 6.71 | 6.26 | 4.69 | 3.90 |
| 0.7 | 1.26 e-12 |
4.39 e-11 |
3.50 e-10 |
3.11 e-09 |
1.88 e-06 |
1.02 e-03 |
13.95 | 7.43 | 7.12 | 6.78 | 4.80 | 4.03 |
| 0.8 | 8.01 e-13 |
3.16 e-11 |
2.39 e-10 |
2.06 e-09 |
5.46 e-07 |
6.44 e-04 |
15.42 | 7.81 | 7.48 | 7.10 | 5.33 | 4.15 |
| 0.9 | 4.85 e-13 |
1.55 e-11 |
1.24 e-10 |
1.02 e-09 |
4.92 e-07 |
3.38 e-04 |
17.33 | 8.74 | 8.17 | 7.71 | 5.37 | 4.33 |
| 1 | 3.86 e-14 |
6.51 e-13 |
1.42 e-11 |
3.43 e-10 |
9.65 e-09 |
3.84 e-07 |
36.87 | 16.16 | 11.37 | 8.84 | 7.82 | 7.28 |
Table 3.
Total Capacity Degradation and Total Heating Time Results.
| Weight | Total Capacity Degradation (Ah) | Total Heating Time (s) |
| 0 | 0.10382248997655331 | 22.17 |
| 0.1 | 0.015977581179648 | 31.71 |
| 0.2 | 0.008228069218434 | 34.37 |
| 0.3 | 0.005059519498740 | 36.44 |
| 0.4 | 0.003253444981261 | 38.21 |
| 0.5 | 0.002482205828299 | 39.63 |
| 0.6 | 0.001690907963803 | 41.66 |
| 0.7 | 0.001018971640568 | 44.11 |
| 0.8 | 6.450307976452842e-04 | 47.29 |
| 0.9 | 3.382935945904038e-04 | 51.65 |
| 1 | 3.936906849750717e-07 | 88.34 |
Table 4.
Power Consumption Calculation Results.
| Weight | 0 | 0.1 | 0.2 | 0.3 | 0.4 | 0.5 | 0.6 | 0.7 | 0.8 | 0.9 | 1 |
| Energy Loss (%) |
6.28 | 7.52 | 7.81 | 8.02 | 8.19 | 8.36 | 8.54 | 8.73 | 8.99 | 9.43 | 12.072 |
Disclaimer/Publisher’s Note: The statements, opinions and data contained in all publications are solely those of the individual author(s) and contributor(s) and not of MDPI and/or the editor(s). MDPI and/or the editor(s) disclaim responsibility for any injury to people or property resulting from any ideas, methods, instructions or products referred to in the content. |
© 2025 by the authors. Licensee MDPI, Basel, Switzerland. This article is an open access article distributed under the terms and conditions of the Creative Commons Attribution (CC BY) license (http://creativecommons.org/licenses/by/4.0/).
Copyright: This open access article is published under a Creative Commons CC BY 4.0 license, which permit the free download, distribution, and reuse, provided that the author and preprint are cited in any reuse.


